three-dimensional localization of nanoscale battery...
TRANSCRIPT
ARTICLE
Three-dimensional localization of nanoscalebattery reactions using soft X-ray tomographyYoung-Sang Yu1,2, Maryam Farmand1, Chunjoong Kim2,3, Yijin Liu 4, Clare P. Grey5,6, Fiona C. Strobridge5,
Tolek Tyliszczak1, Rich Celestre 1, Peter Denes1, John Joseph7, Harinarayan Krishnan 8, Filipe R.N.C. Maia9,
A.L.David Kilcoyne 1, Stefano Marchesini1, Talita Perciano Costa Leite 8, Tony Warwick1, Howard Padmore1,
Jordi Cabana 2 & David A. Shapiro 1
Battery function is determined by the efficiency and reversibility of the electrochemical phase
transformations at solid electrodes. The microscopic tools available to study the chemical
states of matter with the required spatial resolution and chemical specificity are intrinsically
limited when studying complex architectures by their reliance on two-dimensional projec-
tions of thick material. Here, we report the development of soft X-ray ptychographic tomo-
graphy, which resolves chemical states in three dimensions at 11 nm spatial resolution. We
study an ensemble of nano-plates of lithium iron phosphate extracted from a battery elec-
trode at 50% state of charge. Using a set of nanoscale tomograms, we quantify the elec-
trochemical state and resolve phase boundaries throughout the volume of individual
nanoparticles. These observations reveal multiple reaction points, intra-particle hetero-
geneity, and size effects that highlight the importance of multi-dimensional analytical tools in
providing novel insight to the design of the next generation of high-performance devices.
DOI: 10.1038/s41467-018-03401-x OPEN
1 Advanced Light Source, Lawrence Berkeley National Laboratory, Berkeley, CA 94720, USA. 2Department of Chemistry, University of Illinois at Chicago,Chicago, IL 60607, USA. 3 Department of Materials Science and Engineering, Chungnam National University, Daejeon, Chungnam 305-764, South Korea.4 Stanford Synchrotron Radiation Lightsource, SLAC National Accelerator Laboratory, Menlo Park, CA 94025, USA. 5 Department of Chemistry, University ofCambridge, Lensfield Road, Cambridge CB2 1EW, UK. 6Department of Chemistry, Stony Brook University, Stony Brook, NY 11794, USA. 7 EngineeringDivision, Lawrence Berkeley National Laboratory, Berkeley, CA 94720, USA. 8 Computational Research Division, Lawrence Berkeley National Laboratory,Berkeley, CA 94720, USA. 9Department of Cell and Molecular Biology, Uppsala University, Husargatan 3, 75124 Uppsala, Sweden. Correspondence andrequests for materials should be addressed to J.C. (email: [email protected]) or to D.A.S. (email: [email protected])
NATURE COMMUNICATIONS | (2018) 9:921 | DOI: 10.1038/s41467-018-03401-x | www.nature.com/naturecommunications 1
1234
5678
90():,;
Techniques capable of analyzing chemical states at highspatial resolution are essential for elucidating the complexphenomena at the nanoscale that underpin materials’
properties. For example, battery function is determined by theefficiency and reversibility of the electrochemical phase trans-formations at solid electrodes, creating the need to accuratelydefine relationships between chemistry, mechanics, andmorphology1, 2. Conventional X-ray imaging methods are wellsuited to probe chemical states in bulk matter, but they are alsolimited in spatial resolution to a few tens of nanometers by the X-ray optics3–5. Furthermore, bulk X-ray diffraction can unam-biguously differentiate between two-phase and metastable single-phase delithiation pathways, but it cannot map heterogeneities inthe spatial distribution of such states6. In turn, electron-basedtechniques achieve very-high spatial resolution7–9 and can pro-vide three-dimensional (3D) quantification of the chemicalstate10, but they also suffer from diffraction contrast effects andnon-linearities for material thicknesses greater than the mean-free-path of inelastic scattering. Soft X-ray ptychography hasrecently narrowed the gap in spatial resolution while retaininghigh sensitivity to chemical states and penetration throughfunctional volumes of matter11, 12. If data are only collected alongone two-dimensional (2D) projection, the analysis of complexsystems becomes problematic because of the likelihood of over-lapping material with differing chemical components3, 4. Thisproblem is readily solved by the use of X-ray based computedtomography, but the quantification of chemical states in threedimensions by conventional methods comes with limited spatialresolution, which is currently, at best, 30 nm3, 13–15.
Here, we have combined soft X-ray ptychographic imaging andcomputed spectro-tomography to determine the 3D morphologyand oxidation states of transition-metal cations in agglomeratedcathode nanoparticles of lithium iron phosphate (LiFePO4) at 11nm 3D spatial resolution. The measured absorption at each voxeland X-ray photon energy is converted to optical density (OD) andused for computing quantitative 3D chemical composition. Weinvestigate the complex correlation between chemical phase dis-tribution and morphology in single nano-plates of LiFePO4, amaterial that epitomizes the fundamental nature of intercalationchemistry that enables electrodes for high energy density Li-ionbatteries16, 17. The mechanism of transformation of LiFePO4 isone of the most intensely studied reactions in battery chemistry.While the reaction proceeds through a first-order transition inequilibrium16, 18–20, under certain kinetic conditions, metastablepathways based on solid solutions have been observed21–24. Thesepathways bypass penalties in coherency strain due to the co-existence of phases in one particle, both enabling completion ofthe reaction and faster kinetics. The exact conditions that deter-mine these pathways and, more generally, how electrochemicaltransformations can occur within single particles of batteryelectrodes are still widely debated topics. Our approach enabledboth direct observation of the static internal chemical structurewithin crystals as small as 20 nm in their smallest dimension andthe evaluation of correlations of the state of charge with particlesize among a statistically significant number of particles.
ResultsSample synthesis and 3D chemical mapping. LiFePO4 nano-plates (100 × 80 × 20 nm3) were electrochemically delithiated in aLi metal half-cell until 50% of the total amount of lithium wasextracted, based on coulometric analysis of the cell response (seeMethods and Supplementary Figs. 1–2). The delithiation wasconducted at a slow rate to maximize reaction homogeneity25
across the electrode and minimize the formation of metastablestates that could relax during the harvesting of the particles22.
Coulometry is an adequate method to control the average com-position of the electrode due to the absence of side reactions atthe potentials of operation26. Indeed, bulk X-ray diffraction of thepartly delithiated sample confirmed the co-existence of twophases (Supplementary Fig. 3). The position of the diffractionpeaks of one phase were in agreement with LiαFePO4, where αwas slightly smaller than 1, consistent with small domains of Lisolubility observed in previous studies16, 27, 28. In contrast, thesecond phase showed peak positions comparable to FePO4,consistent with reports that the solubility of Li on the Li-poor endof the phase diagram, β in LiβFePO4, is very small27. Analysis ofthe relative intensities using methodologies of analysis in theliterature29 confirmed the presence of these two phases at ~50%ratio. The large facets of the plates correspond to the ac crystal-lographic plane with the long axis parallel to c12, 30.
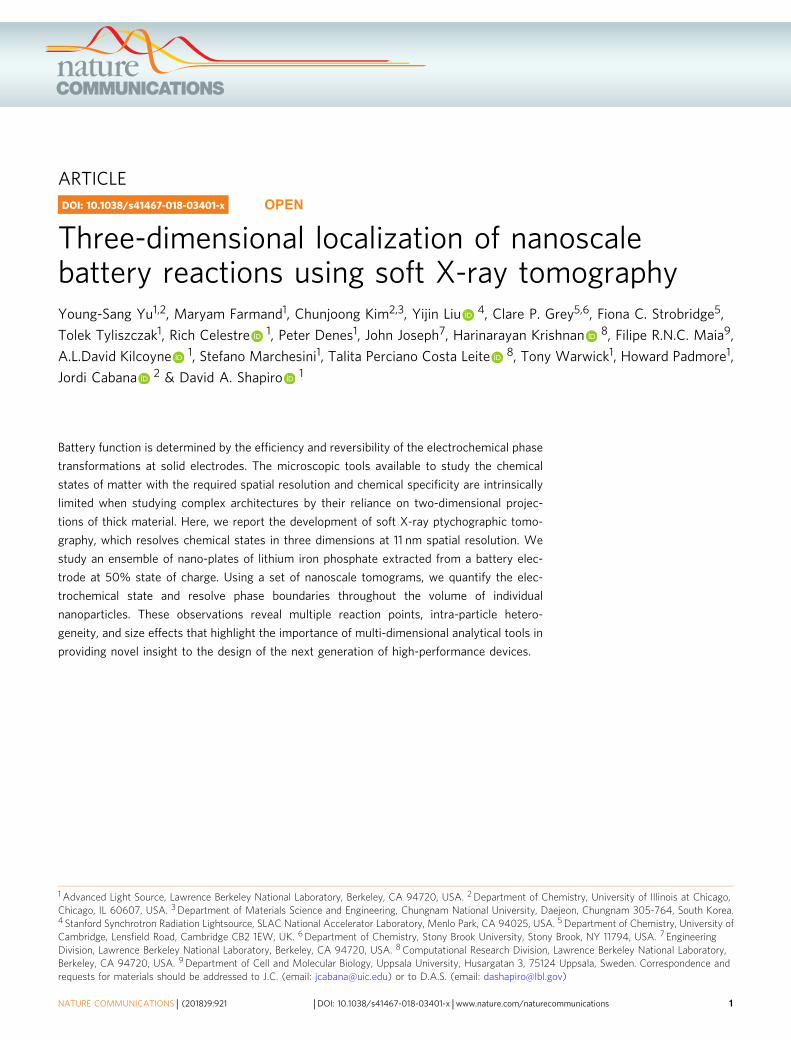
Tomographic data from over 100 harvested particles werecollected near the Fe L3 edge at 708.2 and 710.2 eV (Fig. 1a andSupplementary Movie 1), which correspond to the maxima of theabsorption resonances for LiFePO4 (Fe2+) and FePO4 (Fe3+),respectively, as shown in Supplementary Fig. 5 and in theliterature31–33. The 3D resolution of 11 nm was confirmed byFourier shell correlation (FSC) and line-profiles (Fig. 1b–d andSupplementary Figs. 7–8). Note that the actual resolution shouldbe somewhat higher as the FSC reduces the signal-to-noise ratioof the data by a factor of two at all spatial frequencies. Theoxidation states of the individual nano-plates were quantifiedfrom measurements of the OD at only two energies13, 34–36
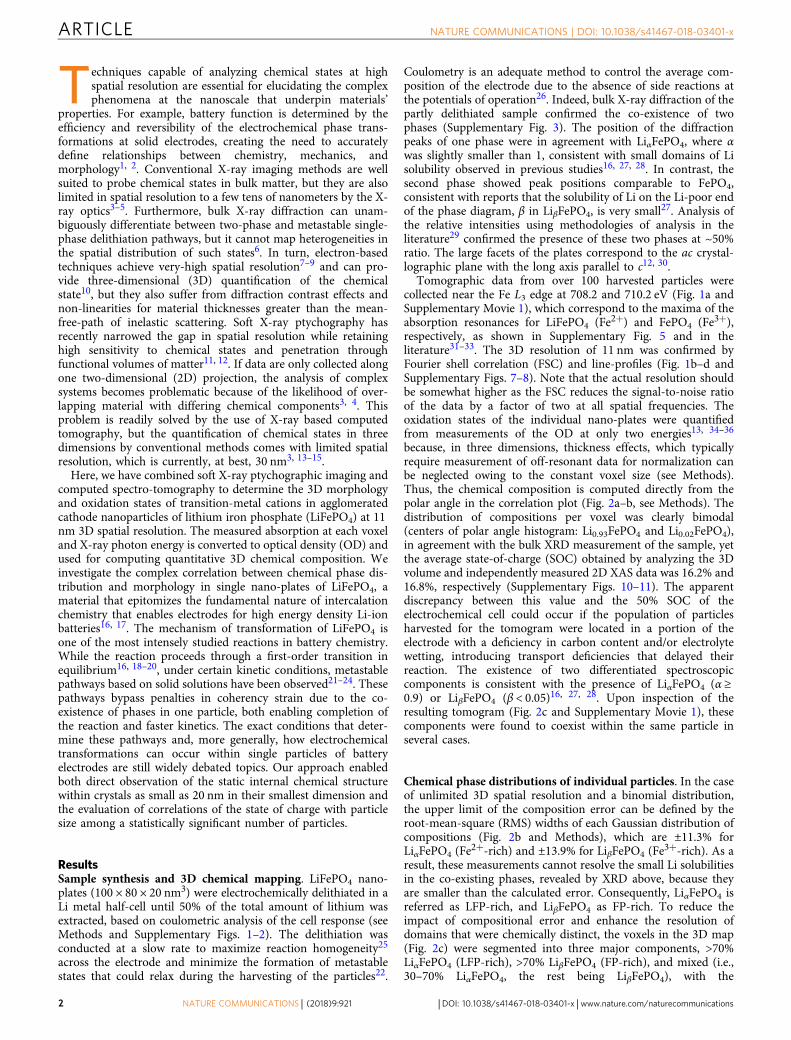
because, in three dimensions, thickness effects, which typicallyrequire measurement of off-resonant data for normalization canbe neglected owing to the constant voxel size (see Methods).Thus, the chemical composition is computed directly from thepolar angle in the correlation plot (Fig. 2a–b, see Methods). Thedistribution of compositions per voxel was clearly bimodal(centers of polar angle histogram: Li0.93FePO4 and Li0.02FePO4),in agreement with the bulk XRD measurement of the sample, yetthe average state-of-charge (SOC) obtained by analyzing the 3Dvolume and independently measured 2D XAS data was 16.2% and16.8%, respectively (Supplementary Figs. 10–11). The apparentdiscrepancy between this value and the 50% SOC of theelectrochemical cell could occur if the population of particlesharvested for the tomogram were located in a portion of theelectrode with a deficiency in carbon content and/or electrolytewetting, introducing transport deficiencies that delayed theirreaction. The existence of two differentiated spectroscopiccomponents is consistent with the presence of LiαFePO4 (α ≥0.9) or LiβFePO4 (β < 0.05)16, 27, 28. Upon inspection of theresulting tomogram (Fig. 2c and Supplementary Movie 1), thesecomponents were found to coexist within the same particle inseveral cases.
Chemical phase distributions of individual particles. In the caseof unlimited 3D spatial resolution and a binomial distribution,the upper limit of the composition error can be defined by theroot-mean-square (RMS) widths of each Gaussian distribution ofcompositions (Fig. 2b and Methods), which are ±11.3% forLiαFePO4 (Fe2+-rich) and ±13.9% for LiβFePO4 (Fe3+-rich). As aresult, these measurements cannot resolve the small Li solubilitiesin the co-existing phases, revealed by XRD above, because theyare smaller than the calculated error. Consequently, LiαFePO4 isreferred as LFP-rich, and LiβFePO4 as FP-rich. To reduce theimpact of compositional error and enhance the resolution ofdomains that were chemically distinct, the voxels in the 3D map(Fig. 2c) were segmented into three major components, >70%LiαFePO4 (LFP-rich), >70% LiβFePO4 (FP-rich), and mixed (i.e.,30–70% LiαFePO4, the rest being LiβFePO4), with the
ARTICLE NATURE COMMUNICATIONS | DOI: 10.1038/s41467-018-03401-x
2 NATURE COMMUNICATIONS | (2018) 9:921 | DOI: 10.1038/s41467-018-03401-x | www.nature.com/naturecommunications

segmentation threshold at 30% (Supplementary Methods). It isimportant to emphasize that this segmentation purely reflects aconservative limit of detection of a given phase, and not itsspecific composition (e.g., α in LiαFePO4). It gives a clear view ofthe most reliable information and is in agreement with a similarlysegmented 2D XAS map with a total error of 7.4% (Supple-mentary Fig. 12). A total of 83 individual particles were seg-mented as shown in Fig. 3a. The fraction of particles with smallerdimensions in the tomogram was found to be higher in com-parison with a larger, and, thus, more representative populationof pristine particles imaged by transmission electron microscopy
(TEM, Supplementary Fig. 13). Though similarly shaped, theparticles presented a variety of delithiation patterns, volumes, andtotal composition. A histogram of particle volumes and the cor-responding fraction of activated particles is shown in Fig. 3b. Theaverage composition of all voxels in each of the morphologicallysegmented particles was considered to determine particle activity.Active particles showed a statistically significant level of deli-thiation, defined as 15–100% LiβFePO4 based on a compositionalerror threshold (~13%). This activity threshold should bothencompass our composition error and avoid misinterpretation ofparticles as active due to the solubility limit of LiβFePO4. While,
1.2 FP richa
b
cMixed Chemical map
y
xz
Segmented chemical map
LFP rich Mixed FP richLFP FP
LFP rich
LFP
ric
h
FP
ric
h
Mix
ed
0.8
0.4
104
103
102
100 30 60
Angle (degree)90
00 0.4
OD (708.2 eV)
OD
(71
0.2
eV)
# O
f vox
el (
Log
scal
e)
0.8 1.2
Fig. 2 Three-dimensional (3D) chemical state mapping. a Correlative distribution plots between the optical densities (ODs) of each voxel at 708.2 and710.2 eV. b Histogram plot of the polar angles of the data points in a. The y-axis is expressed as a logarithmic scale for better visibility. The plot can befitted with summation (black solid line) of two Gaussian distributions which are centered on low (magenta solid line, 27.48o) and high (cyan solid line,65.0o) polar angles correspond to Li0.93FePO4 and Li0.02FePO4, respectively. c 3D chemical map (left) and its segmentation into three chemical phasegroups (right). The presence of the LiαFePO4 (majority Fe2+, LFP) and charged LiβFePO4 (majority Fe3+, FP) were assigned colors red and blue,respectively (left). The voxels were separated into three distinct groups, indicating chemical phase group of each voxel, according to the polar angle. Thered, green, and blue areas indicate LFP-rich (>70% LiαFePO4), FP-rich (>70% LiβFePO4), and Mixed (30–70% LiαFePO4, the rest being LiβFePO4) domains,respectively. The shading colors in a, b indicate the criteria for chemical segmentation. Scale bar, 500 nm
1.0b ca
d
710.2 eV708.2 eV
y
xz
0.5
00 0.50 0 30 60
OD
y
x
Distance (nm)
90Spatial frequency
13.07 nm
FSC1/2 bit threshold0.5 threshold
10.93 nm
11.30 nm
FS
C
1
OD
(arb
.uni
t)
Fig. 1 Results of tomographic reconstruction. a Reconstructed three-dimensional (3D) optical density volumes at 708.2 (left) and 710.2 eV (right). The sizeof reconstructed voxels is 6.7 × 6.7 × 6.7 nm3. b Resolution estimation of the 3D volume at 708.2 eV in a by Fourier shell correlation (FSC, blue solid linewith scatter) with 1/2-bit (red solid line) and 0.5 (magenta dashed-line) threshold criteria. c Representative cross-section of the tomogram at 708.2 eValong the highest resolution plane (xy). The slice of the same position at 710.2 eV is shown in Supplementary Fig. 7. The positions of the slices are markedas red (cutting along xy plane) and blue (cutting along xz plane) arrows in a. The resultant cross-sections onto the lower resolution plane (xz plane) at both708.2 and 710.2 eV are shown in Supplementary Fig. 8. d Line profile indicated by the red arrow in c. Black-dashed lines are guides for 10–90% resolutioncriteria. Scale bars in a and c indicate 500 and 100 nm, respectvely
NATURE COMMUNICATIONS | DOI: 10.1038/s41467-018-03401-x ARTICLE
NATURE COMMUNICATIONS | (2018) 9:921 | DOI: 10.1038/s41467-018-03401-x | www.nature.com/naturecommunications 3
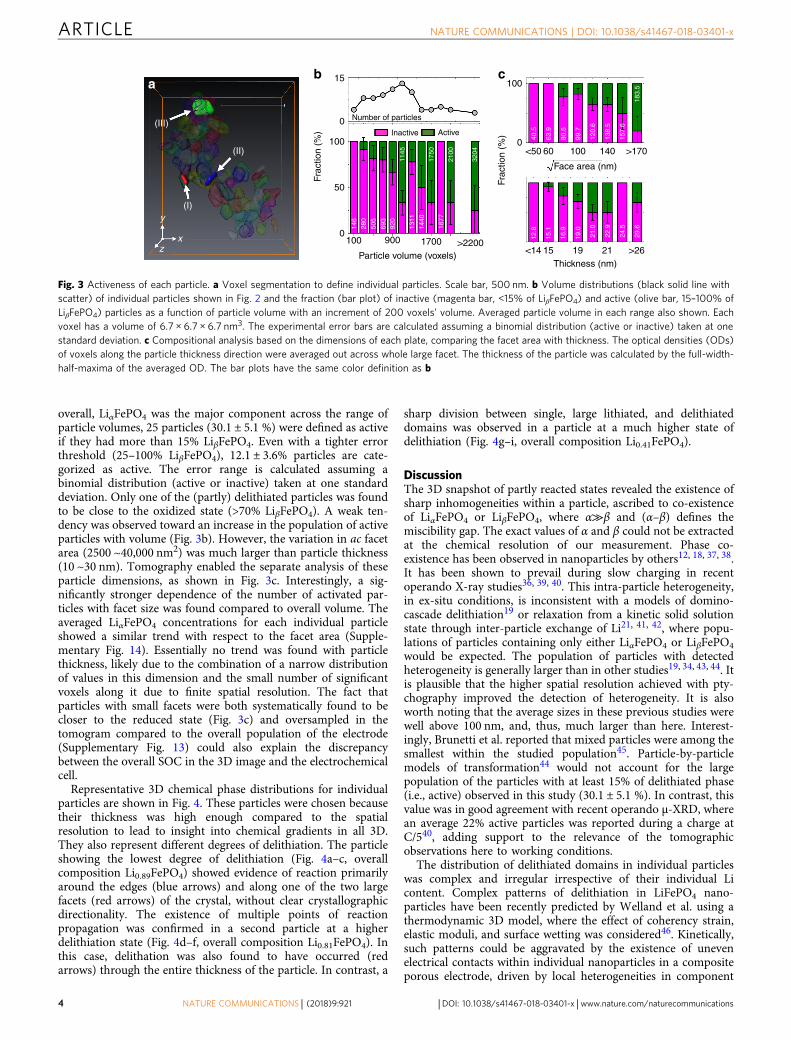
overall, LiαFePO4 was the major component across the range ofparticle volumes, 25 particles (30.1 ± 5.1 %) were defined as activeif they had more than 15% LiβFePO4. Even with a tighter errorthreshold (25–100% LiβFePO4), 12.1 ± 3.6% particles are cate-gorized as active. The error range is calculated assuming abinomial distribution (active or inactive) taken at one standarddeviation. Only one of the (partly) delithiated particles was foundto be close to the oxidized state (>70% LiβFePO4). A weak ten-dency was observed toward an increase in the population of activeparticles with volume (Fig. 3b). However, the variation in ac facetarea (2500 ~40,000 nm2) was much larger than particle thickness(10 ~30 nm). Tomography enabled the separate analysis of theseparticle dimensions, as shown in Fig. 3c. Interestingly, a sig-nificantly stronger dependence of the number of activated par-ticles with facet size was found compared to overall volume. Theaveraged LiαFePO4 concentrations for each individual particleshowed a similar trend with respect to the facet area (Supple-mentary Fig. 14). Essentially no trend was found with particlethickness, likely due to the combination of a narrow distributionof values in this dimension and the small number of significantvoxels along it due to finite spatial resolution. The fact thatparticles with small facets were both systematically found to becloser to the reduced state (Fig. 3c) and oversampled in thetomogram compared to the overall population of the electrode(Supplementary Fig. 13) could also explain the discrepancybetween the overall SOC in the 3D image and the electrochemicalcell.
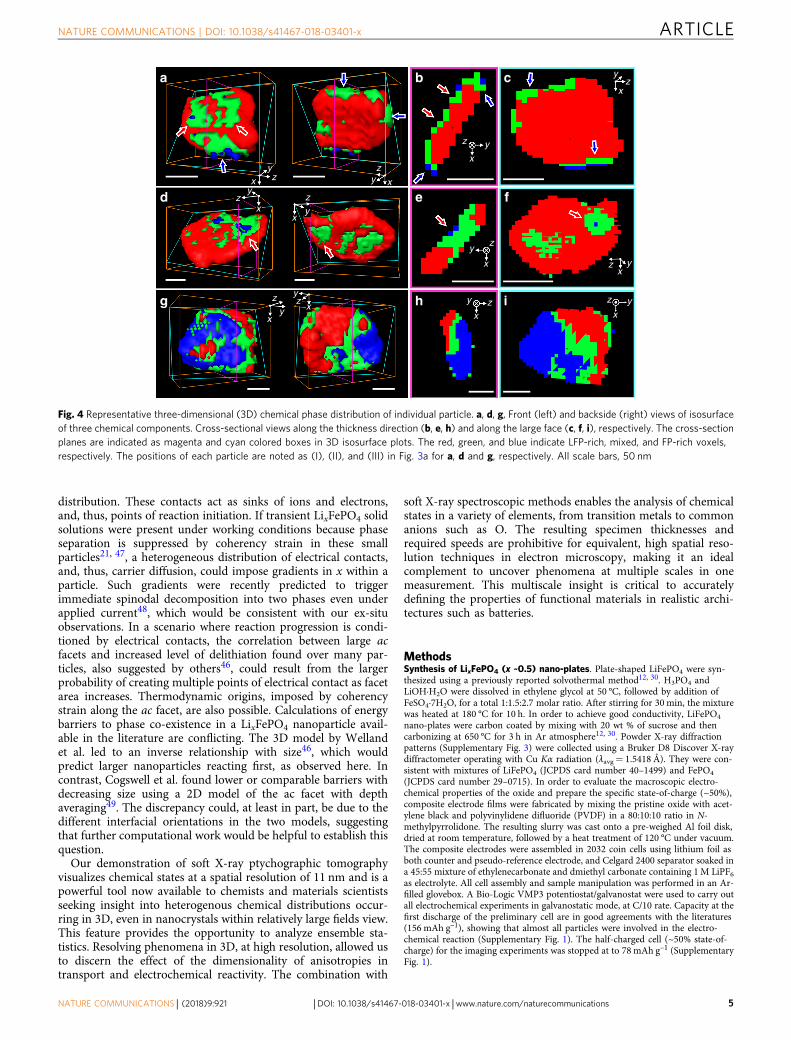
Representative 3D chemical phase distributions for individualparticles are shown in Fig. 4. These particles were chosen becausetheir thickness was high enough compared to the spatialresolution to lead to insight into chemical gradients in all 3D.They also represent different degrees of delithiation. The particleshowing the lowest degree of delithiation (Fig. 4a–c, overallcomposition Li0.89FePO4) showed evidence of reaction primarilyaround the edges (blue arrows) and along one of the two largefacets (red arrows) of the crystal, without clear crystallographicdirectionality. The existence of multiple points of reactionpropagation was confirmed in a second particle at a higherdelithiation state (Fig. 4d–f, overall composition Li0.81FePO4). Inthis case, delithation was also found to have occurred (redarrows) through the entire thickness of the particle. In contrast, a
sharp division between single, large lithiated, and delithiateddomains was observed in a particle at a much higher state ofdelithiation (Fig. 4g–i, overall composition Li0.41FePO4).
DiscussionThe 3D snapshot of partly reacted states revealed the existence ofsharp inhomogeneities within a particle, ascribed to co-existenceof LiαFePO4 or LiβFePO4, where α≫β and (α–β) defines themiscibility gap. The exact values of α and β could not be extractedat the chemical resolution of our measurement. Phase co-existence has been observed in nanoparticles by others12, 18, 37, 38.It has been shown to prevail during slow charging in recentoperando X-ray studies36, 39, 40. This intra-particle heterogeneity,in ex-situ conditions, is inconsistent with a models of domino-cascade delithiation19 or relaxation from a kinetic solid solutionstate through inter-particle exchange of Li21, 41, 42, where popu-lations of particles containing only either LiαFePO4 or LiβFePO4
would be expected. The population of particles with detectedheterogeneity is generally larger than in other studies19, 34, 43, 44. Itis plausible that the higher spatial resolution achieved with pty-chography improved the detection of heterogeneity. It is alsoworth noting that the average sizes in these previous studies werewell above 100 nm, and, thus, much larger than here. Interest-ingly, Brunetti et al. reported that mixed particles were among thesmallest within the studied population45. Particle-by-particlemodels of transformation44 would not account for the largepopulation of the particles with at least 15% of delithiated phase(i.e., active) observed in this study (30.1 ± 5.1 %). In contrast, thisvalue was in good agreement with recent operando μ-XRD, wherean average 22% active particles was reported during a charge atC/540, adding support to the relevance of the tomographicobservations here to working conditions.
The distribution of delithiated domains in individual particleswas complex and irregular irrespective of their individual Licontent. Complex patterns of delithiation in LiFePO4 nano-particles have been recently predicted by Welland et al. using athermodynamic 3D model, where the effect of coherency strain,elastic moduli, and surface wetting was considered46. Kinetically,such patterns could be aggravated by the existence of unevenelectrical contacts within individual nanoparticles in a compositeporous electrode, driven by local heterogeneities in component
15ab c
0
(II)
(III)
(I)y
xz
100
100
0
50
0100 900
Number of particles
Inactive
1145
1750
2100
3204
40.5
63.9
80.5
99.7
120.
6
12.8
15.1
16.9
19.0
21.0
22.9
24.5
29.6
138.
5
157.
6
183.
5
1877
1440
1311
920
693
505
280
146
Active
1700 >2200<14
<50 60 100
Face area (nm)
140 >170
15 19 21 >26Particle volume (voxels)
Frac
tion
(%)
Frac
tion
(%)
Thickness (nm)
Fig. 3 Activeness of each particle. a Voxel segmentation to define individual particles. Scale bar, 500 nm. b Volume distributions (black solid line withscatter) of individual particles shown in Fig. 2 and the fraction (bar plot) of inactive (magenta bar, <15% of LiβFePO4) and active (olive bar, 15–100% ofLiβFePO4) particles as a function of particle volume with an increment of 200 voxels’ volume. Averaged particle volume in each range also shown. Eachvoxel has a volume of 6.7 × 6.7 × 6.7 nm3. The experimental error bars are calculated assuming a binomial distribution (active or inactive) taken at onestandard deviation. c Compositional analysis based on the dimensions of each plate, comparing the facet area with thickness. The optical densities (ODs)of voxels along the particle thickness direction were averaged out across whole large facet. The thickness of the particle was calculated by the full-width-half-maxima of the averaged OD. The bar plots have the same color definition as b
ARTICLE NATURE COMMUNICATIONS | DOI: 10.1038/s41467-018-03401-x
4 NATURE COMMUNICATIONS | (2018) 9:921 | DOI: 10.1038/s41467-018-03401-x | www.nature.com/naturecommunications
distribution. These contacts act as sinks of ions and electrons,and, thus, points of reaction initiation. If transient LixFePO4 solidsolutions were present under working conditions because phaseseparation is suppressed by coherency strain in these smallparticles21, 47, a heterogeneous distribution of electrical contacts,and, thus, carrier diffusion, could impose gradients in x within aparticle. Such gradients were recently predicted to triggerimmediate spinodal decomposition into two phases even underapplied current48, which would be consistent with our ex-situobservations. In a scenario where reaction progression is condi-tioned by electrical contacts, the correlation between large acfacets and increased level of delithiation found over many par-ticles, also suggested by others46, could result from the largerprobability of creating multiple points of electrical contact as facetarea increases. Thermodynamic origins, imposed by coherencystrain along the ac facet, are also possible. Calculations of energybarriers to phase co-existence in a LixFePO4 nanoparticle avail-able in the literature are conflicting. The 3D model by Wellandet al. led to an inverse relationship with size46, which wouldpredict larger nanoparticles reacting first, as observed here. Incontrast, Cogswell et al. found lower or comparable barriers withdecreasing size using a 2D model of the ac facet with depthaveraging49. The discrepancy could, at least in part, be due to thedifferent interfacial orientations in the two models, suggestingthat further computational work would be helpful to establish thisquestion.
Our demonstration of soft X-ray ptychographic tomographyvisualizes chemical states at a spatial resolution of 11 nm and is apowerful tool now available to chemists and materials scientistsseeking insight into heterogenous chemical distributions occur-ring in 3D, even in nanocrystals within relatively large fields view.This feature provides the opportunity to analyze ensemble sta-tistics. Resolving phenomena in 3D, at high resolution, allowed usto discern the effect of the dimensionality of anisotropies intransport and electrochemical reactivity. The combination with
soft X-ray spectroscopic methods enables the analysis of chemicalstates in a variety of elements, from transition metals to commonanions such as O. The resulting specimen thicknesses andrequired speeds are prohibitive for equivalent, high spatial reso-lution techniques in electron microscopy, making it an idealcomplement to uncover phenomena at multiple scales in onemeasurement. This multiscale insight is critical to accuratelydefining the properties of functional materials in realistic archi-tectures such as batteries.
MethodsSynthesis of LixFePO4 (x ~0.5) nano-plates. Plate-shaped LiFePO4 were syn-thesized using a previously reported solvothermal method12, 30. H3PO4 andLiOH·H2O were dissolved in ethylene glycol at 50 °C, followed by addition ofFeSO4·7H2O, for a total 1:1.5:2.7 molar ratio. After stirring for 30 min, the mixturewas heated at 180 °C for 10 h. In order to achieve good conductivity, LiFePO4
nano-plates were carbon coated by mixing with 20 wt % of sucrose and thencarbonizing at 650 °C for 3 h in Ar atmosphere12, 30. Powder X-ray diffractionpatterns (Supplementary Fig. 3) were collected using a Bruker D8 Discover X-raydiffractometer operating with Cu Kα radiation (λavg= 1.5418 Å). They were con-sistent with mixtures of LiFePO4 (JCPDS card number 40–1499) and FePO4
(JCPDS card number 29–0715). In order to evaluate the macroscopic electro-chemical properties of the oxide and prepare the specific state-of-charge (~50%),composite electrode films were fabricated by mixing the pristine oxide with acet-ylene black and polyvinylidene difluoride (PVDF) in a 80:10:10 ratio in N-methylpyrrolidone. The resulting slurry was cast onto a pre-weighed Al foil disk,dried at room temperature, followed by a heat treatment of 120 °C under vacuum.The composite electrodes were assembled in 2032 coin cells using lithium foil asboth counter and pseudo-reference electrode, and Celgard 2400 separator soaked ina 45:55 mixture of ethylenecarbonate and dmiethyl carbonate containing 1M LiPF6as electrolyte. All cell assembly and sample manipulation was performed in an Ar-filled glovebox. A Bio-Logic VMP3 potentiostat/galvanostat were used to carry outall electrochemical experiments in galvanostatic mode, at C/10 rate. Capacity at thefirst discharge of the preliminary cell are in good agreements with the literatures(156 mAh g–1), showing that almost all particles were involved in the electro-chemical reaction (Supplementary Fig. 1). The half-charged cell (~50% state-of-charge) for the imaging experiments was stopped at to 78 mAh g–1 (SupplementaryFig. 1).
yzx
y
y
y
xx
x
z
y
y
xx
z z y
xz y
y
x
x
z
z
y
x
z
y
x
z
y
xz
z
a
d
g h
e
b c
f
i
z
Fig. 4 Representative three-dimensional (3D) chemical phase distribution of individual particle. a, d, g, Front (left) and backside (right) views of isosurfaceof three chemical components. Cross-sectional views along the thickness direction (b, e, h) and along the large face (c, f, i), respectively. The cross-sectionplanes are indicated as magenta and cyan colored boxes in 3D isosurface plots. The red, green, and blue indicate LFP-rich, mixed, and FP-rich voxels,respectively. The positions of each particle are noted as (I), (II), and (III) in Fig. 3a for a, d and g, respectively. All scale bars, 50 nm
NATURE COMMUNICATIONS | DOI: 10.1038/s41467-018-03401-x ARTICLE
NATURE COMMUNICATIONS | (2018) 9:921 | DOI: 10.1038/s41467-018-03401-x | www.nature.com/naturecommunications 5

Soft X-ray ptychographic microscope. Soft X-ray ptychographic microscopymeasurements were performed at the bending magnet beamline (5.3.2.1) at theAdvanced Light Source (ALS), Lawrence Berkeley National Laboratory11, 12. Pty-chographic measurements utilized a 100 nm outer zone width Fresnel zone platefor illumination and proceeded with a square scan grid of 70 nm steps. Diffractionpatterns from 200 ms exposure were directly recorded on a custom fast readoutCCD with the 5-µm-think Si3N4 attenuator to expand the dynamic range (Sup-plementary Fig. 4). The diffraction data were reconstructed by 500 iterations of animplementation of the RAAR algorithm50. Incoherent background noise waseliminated through the implementation of a background retrieval algorithm11. Alldata processing, including pthychographic reconstruction, and backgroundretrieval were performed using standard methods available in the SHARP-CAMERA software package with parallel computation (http://camera.lbl.gov). Theresolution of the individual 2D projection is calculated by Fourier ring correlation(FRC) to be 10 nm (½ bit threshold) at 708.2 eV (Supplementary Fig. 6).
Registration of the rotation axis. Aligning the 2D projections of a tomographictilt series to a common rotation axis (not necessarily the real rotation axis) withsub-pixel resolution is essential to achieve a good quality 3D reconstruction. Inorder to achieve sub-pixel-precision, we have developed an iterative registrationmethod with intensity-base automatic image alignments. To set the commonrotation axis, the projections were first roughly aligned using an alignment featureonly with translations of pixel size. The alignment features in all roughly alignedprojections were close to the common rotation axis, but there still exist hugemisalignments owing to inaccuracy of human interactions and tilting of eachprojection. We then reconstructed the 3D volume from the first aligned tomo-graphic tilt series and computed 2D projections of the 3D volume according to thetomographic tilt angles. These computed 2D projections were used as referenceimages for second alignments. The second alignment was performed withintensity-based automatic image registration, which is an iterative process bringsthe misaligned image (2D projections of the tomographic tilt series) into alignmentwith the reference image (computed 2D projections). The process was performedfollowing non-reflective similarity transformations (consisting of translation,rotation, and scale) to determine the specific-image transformation matrix that isapplied to the moving image with bilinear interpolation. The same procedures wererepeated until the aligned projections were self-consistent.
Tomographic reconstruction. Tomographic imaging proceeded from a series of158 2D projections of the sample ODs recorded over a wide angular range from–80o to +77o. After the image registration, the OD volumes at 708.2 and 710.2 eV(Fig. 1a), with voxel size of 6.7 × 6.7 × 6.7 nm3, were reconstructed using thealgebraic reconstruction technique (ART) with 20 iterations51. The 3D resolution isconfirmed by FSC of the OD volume at 708.2 eV and indicates a 3D spatialresolution around 11 nm (see Fig. 1b and Supplementary Methods). A smallimprovement in the 3D resolution were observed by adopting different recon-struction algorithm with a large number of iterations, but the discrepancy did notaffect the conclusions of the analysis (Supplementary Fig. 15). This value is con-firmed by line-cuts through the volume, shown in Fig. 1c–d.
Chemical phase quantification. The OD volumes at 708.2 and 710.2 eV were usedfor estimating quantitative chemical information (e.g., the oxidation state of iron inLixFePO4) at each voxel. From the standard spectra of the discharged LiαFePO4
(majority Fe2+) and charged LiβFePO4 (majority Fe3+), the relative absorptionintensity (IE1,LFP, IE1,FP, IE2,LFP, and IE2,FP) at specific energy (E1 and E2) wereacquired (Supplementary Fig. 5). Since, the amount of the absorption at a certainenergy is linearly proportional to the relative amount of species with different ironoxidation states, the chemical concentration of LiαFePO4 (CLFP) and LiβFePO4
(CFP) at each voxel can be calculated by the relation:
ODE1 � ODpre�edge
ODE2 � ODpre�edge
� �¼ IE1;LFP IE1;FP
IE2;LFP IE2;FP
� �CLFP
CFP
� �ð1Þ
where ODE1, ODE2, and ODpre-edge indicate the single voxel OD at E1, E2, and pre-edge region, respectively. While normalization of all ODs with ODpre-edge canmaximize the chemical contrast, because ODpre-edge is proportional to pure massthickness without chemical contrast, the OD at pre-edge region was not clearenough to reconstruct 3D volume and negligible compared with ODs at 708.2 and710.2 eV (Supplementary Fig. 9). Since the concentration of each chemical phase,LiFePO4 (Fe2+) and charged FePO4 (Fe3+), can be expressed as linear equationscorresponding to the OD volumes at 708.2 and 710.2 eV, the polar angle in thecorrelation plot is a function of the relative compositions of two major elements forthe corresponding voxel (Fig. 2b). As a result, the 3D distribution of Fe oxidationstate can be retrieved quantitatively (Fig. 2c). The fidelity of the 3D chemical mapobtained in this way is verified by projecting the calculated volume along the z-axisand comparing with a map obtained by a linear combination fit of the referencespectra to independently measured 2D XAS data across the full spectrum of thesame sample (Supplementary Figs. 11–12). The accuracy of the chemical map from2D XAS data is represented by R-factor, which is less than 0.15 in 94.64% of pixels(Supplementary Fig. 10).
Data availability. The data that support the findings of this study are availablefrom the corresponding author (D.A.S. or J.C.) on request.
Received: 12 February 2017 Accepted: 11 February 2018
References1. Whittingham, M. S. Ultimate limits to intercalation reactions for lithium
batteries. Chem. Rev. 114, 11414–11443 (2014).2. Whittingham, M. S. Lithium batteries and cathode materials. Chem. Rev. 104,
4271–4302 (2004).3. Miao, J., Ishikawa, T., Robinson, I. K. & Murnane, M. M. Beyond
crystallography: diffractive imaging using coherent x-ray light sources. Science348, 530–535 (2015).
4. Sakdinawat, A. & Attwood, D. Nanoscale X-ray imaging. Nat. Photonics 4,840–848 (2010).
5. Chao, W., Harteneck, B. D., Liddle, J. A., Anderson, E. H. & Attwood, D. T.Soft X-ray microscopy at a spatial resolution better than 15nm. Nature 435,1210–1213 (2005).
6. Delacourt, C., Poizot, P., Tarascon, J.-M. & Masquelier, C. The existence of atemperature-driven solid solution in LixFePO4 for 0 ≤ x≤ 1. Nat. Mater. 4,254–260 (2005).
7. Pennycook, S. J. & Boatner, L. A. Chemically sensitive structure-imagingwith a scanning transmission electron microscope. Nature 336, 565–567(1988).
8. Browning, N. D., Chisholm, M. F. & Pennycook, S. J. Atomic-resolutionchemical analysis using a scanning transmission electron microscope. Nature366, 143–146 (1993).
9. Batson, P. E., Dellby, N. & Krivanek, O. L. Sub-angstrom resolution usingaberration corrected electron optics. Nature 418, 617–620 (2002).
10. Weyland, M. & Midgley, P. A. 3D electron microscopy in the physicalsciences: the development of Z-contrast and EFTEM tomography.Ultramicroscopy 96, 413–431 (2003).
11. Shapiro, D. A. et al. Chemical composition mapping with nanometreresolution by soft X-ray microscopy. Nat. Photonics 8, 765–769 (2014).
12. Yu, Y.-S. et al. Dependence on crystal size of the nanoscale chemicalphase distribution and fracture in LixFePO4. Nano. Lett. 15, 4282–4288(2015).
13. Johansson, G. A., Tyliszczak, T., Mitchell, G. E., Keefe, M. H. & Hitchcock, A.P. Three-dimensional chemical mapping by scanning transmission X-rayspectromicroscopy. J. Synchrotron Radiat. 14, 395–402 (2007).
14. Meirer, F. et al. Three-dimensional imaging of chemical phasetransformations at the nanoscale with full-field transmission X-raymicroscopy. J. Synchrotron Radiat. 18, 773–781 (2011).
15. Yang, F. et al. Nanoscale morphological and chemical changes of high voltagelithium–manganese rich NMC composite cathodes with cycling. Nano. Lett.14, 4334–4341 (2014).
16. Padhi, A. K., Nanjundaswamy, K. S. & Goodenough, J. B. Phospho‐olivines aspositive‐electrode materials for rechargeable lithium batteries. J. Electrochem.Soc. 144, 1188–1194 (1997).
17. Zaghib, K., Mauger, A. & Julien, C. M. Overview of olivines in lithiumbatteries for green transportation and energy storage. J. Solid StateElectrochem. 16, 835–845 (2012).
18. Laffont, L. et al. Study of the LiFePO4/FePO4 two-phase system by high-resolution electron energy loss spectroscopy. Chem. Mater. 18, 5520–5529 (2006).
19. Delmas, C., Maccario, M., Croguennec, L., Le Cras, F. & Weill, F. Lithiumdeintercalation in LiFePO4 nanoparticles via a domino-cascade model. Nat.Mater. 7, 665–671 (2008).
20. Andersson, A. S. & Thomas, J. O. The source of first-cycle capacity loss inLiFePO4. J. Power Sources 97–98, 498–502 (2001).
21. Malik, R., Zhou, F. & Ceder, G. Kinetics of non-equilibrium lithiumincorporation in LiFePO4. Nat. Mater. 10, 587–590 (2011).
22. Liu, H. et al. Capturing metastable structures during high-rate cycling ofLiFePO4 nanoparticle electrodes. Science 344, 1252817 (2014).
23. Orikasa, Y. et al. Direct observation of a metastable crystal phase of LixFePO4
under electrochemical phase transition. J. Am. Chem. Soc. 135, 5497–5500 (2013).24. Zhang, X. et al. Rate-induced solubility and suppression of the first-order
phase transition in olivine LiFePO4. Nano. Lett. 14, 2279–2285 (2014).25. Liu, J., Kunz, M., Chen, K., Tamura, N. & Richardson, T. J. Visualization of
charge distribution in a lithium battery electrode. J. Phys. Chem. Lett. 1,2120–2123 (2010).
26. Castro, L. et al. Aging mechanisms of LiFePO4//graphite cells studied by XPS:redox reaction and electrode/electrolyte interfaces. J. Electrochem. Soc. 159,A357–A363 (2012).
ARTICLE NATURE COMMUNICATIONS | DOI: 10.1038/s41467-018-03401-x
6 NATURE COMMUNICATIONS | (2018) 9:921 | DOI: 10.1038/s41467-018-03401-x | www.nature.com/naturecommunications

27. Yamada, A. et al. Room-temperature miscibility gap in LixFePO4. Nat. Mater.5, 357–360 (2006).
28. Wagemaker, M. et al. Dynamic solubility limits in nanosized olivine LiFePO4.J. Am. Chem. Soc. 133, 10222–10228 (2011).
29. Hess, M., Sasaki, T., Villevieille, C. & Novák, P. Combined operando X-raydiffraction–electrochemical impedance spectroscopy detecting solid solutionreactions of LiFePO4 in batteries. Nat. Commun. 6, 8169 (2015).
30. Wang, L. et al. Crystal orientation tuning of LiFePO4 nanoplates for high ratelithium battery cathode materials. Nano. Lett. 12, 5632–5636 (2012).
31. Miao, S. et al. Local electronic structure of olivine phases of LixFePO4. J. Phys.Chem. A. 111, 4242–4247 (2007).
32. Augustsson, A. et al. Electronic structure of phospho-olivines LixFePO4 (x=0,1) from soft-x-ray-absorption and -emission spectroscopies. J. Chem. Phys.123, 184717 (2005).
33. Liu, X. et al. Phase transformation and lithiation effect on electronic structureof LixFePO4: an in-depth study by soft x-ray and simulations. J. Am. Chem.Soc. 134, 13708–13715 (2012).
34. Li, Y. et al. Dichotomy in the lithiation pathway of ellipsoidal and plateletLiFePO4 particles revealed through nanoscale operando state-of-chargeimaging. Adv. Funct. Mater. 25, 3677–3687 (2015).
35. Kao, T. L. et al. Nanoscale elemental sensitivity study of Nd2Fe14B usingabsorption correlation tomography. Microsc. Res. Tech. 76, 1112–1117 (2013).
36. Lim, J. et al. Origin and hysteresis of lithium compositional spatiodynamicswithin battery primary particles. Science 353, 566–571 (2016).
37. Ramana, C. V., Mauger, A., Gendron, F., Julien, C. M. & Zaghib, K. Study ofthe Li-insertion/extraction process in LiFePO4/FePO4. J. Power Sources 187,555–564 (2009).
38. Suo, L. et al. Highly ordered staging structural interface between LiFePO4 andFePO4. Phys. Chem. Chem. Phys. 14, 5363–5367 (2012).
39. Zhou, F., Maxisch, T. & Ceder, G. Configurational electronic entropy and thephase diagram of mixed-valence oxides: the case of LixFePO4. Phys. Rev. Lett.97, 155704 (2006).
40. Zhang, X. et al. Direct view on the phase evolution in individual LiFePO4
nanoparticles during Li-ion battery cycling. Nat. Commun. 6, 8333 (2015).41. Wagemaker, M., Borghols, W. J. H. & Mulder, F. M. Large impact of particle
size on insertion reactions. a case for anatase LixTiO2. J. Am. Chem. Soc. 129,4323–4327 (2007).
42. Dreyer, W. et al. The thermodynamic origin of hysteresis in insertionbatteries. Nat. Mater. 9, 448–453 (2010).
43. Chueh, W. C. et al. Intercalation pathway in many-particle LiFePO4 electroderevealed by nanoscale state-of-charge mapping. Nano. Lett. 13, 866–872(2013).
44. Li, Y. et al. Current-induced transition from particle-by-particle to concurrentintercalation in phase-separating battery electrodes. Nat. Mater. 13,1149–1156 (2014).
45. Brunetti, G. et al. Confirmation of the domino-cascade model by LiFePO4/FePO4 precession electron diffraction. Chem. Mater. 23, 4515–4524 (2011).
46. Welland, M. J., Karpeyev, D., O’Connor, D. T. & Heinonen, O. Miscibility gapclosure, interface morphology, and phase microstructure of 3D LixFePO4
nanoparticles from surface wetting and coherency strain. ACS Nano 9,9757–9771 (2015).
47. Cogswell, D. A. & Bazant, M. Z. Coherency strain and the kinetics of phaseseparation in LiFePO4 nanoparticles. ACS Nano 6, 2215–2225 (2012).
48. Abdellahi, A., Akyildiz, O., Malik, R., Thorntonc, K. & Ceder, G. Thethermodynamic stability of intermediate solid solutions in LiFePO4
nanoparticles. J. Mater. Chem. A 4, 5436–5447 (2016).49. Cogswell, D. A. & Bazant, M. Z. Theory of coherent nucleation in phase-
separating nanoparticles. Nano. Lett. 13, 3036–3041 (2013).50. Luke, D. R. Relaxed averaged alternating reflections for diffraction imaging.
Inverse Probl. 21, 37 (2005).
51. Gordon, R., Bender, R. & Herman, G. T. Algebraic Reconstruction Techniques(ART) for three-dimensional electron microscopy and X-ray photography. J.Theor. Biol. 29, 471–481 (1970).
AcknowledgementsSoft X-ray ptychographic microscopy was carried out at beamline 5.3.2.1 at the AdvancedLight Source. The Advanced Light Source is supported by the Director, Office of Science,Office of Basic Energy Sciences, of the U.S. Department of Energy under Contract No.DE-AC02-05CH11231. This work was supported as part of the NorthEast Center forChemical Energy Storage, an Energy Frontier Research Center funded by the U.S.Department of Energy, Office of Science, Office of Basic Energy Sciences under AwardNumber DE-SC0012583. C.K. acknowledges additional support by the National ResearchLab (NRF-2015R1A2A1A01006192) program of the National Research Foundation ofKorea. This work is partially supported by the Center for Applied Mathematics forEnergy Research Applications (CAMERA), which is a partnership between Basic EnergySciences (BES) and Advanced Scientific Computing Research (ASRC) at the U.SDepartment of Energy.
Author contributionsY.-S.Y., C.K., J.C., and D.A.S. conceived of and planned the experiment. D.A.S., T.T.,R.C., P.D., J.J., H.K., F.R.N.C.M., A.L.D.K., T.P.C.L., T.W., Y.-S.Y., and H.P. developedexperimental techniques, software, and equipment. D.A.S. and S.M. developed ptycho-graphic reconstruction codes. Y.-S.Y., C.K., F.C.S., and C.P.G. prepared the samples.Y.-S.Y., M.F., and D.A.S. carried out the ptychographic microscopy measurements.Y.-S.Y., Y.L., and D.A.S. performed post-experiment data analysis, and Y.-S.Y., Y.L., C.K.,D.A.S., and J.C. established the interpretation of the chemical maps. Y.-S.Y., C.K., J.C.,and D.A.S. prepared the manuscript, which incorporates critical input from all authors.
Additional informationSupplementary Information accompanies this paper at https://doi.org/10.1038/s41467-018-03401-x.
Competing interests: The authors declare no competing interests.
Reprints and permission information is available online at http://npg.nature.com/reprintsandpermissions/
Publisher's note: Springer Nature remains neutral with regard to jurisdictional claims inpublished maps and institutional affiliations.
Open Access This article is licensed under a Creative CommonsAttribution 4.0 International License, which permits use, sharing,
adaptation, distribution and reproduction in any medium or format, as long as you giveappropriate credit to the original author(s) and the source, provide a link to the CreativeCommons license, and indicate if changes were made. The images or other third partymaterial in this article are included in the article’s Creative Commons license, unlessindicated otherwise in a credit line to the material. If material is not included in thearticle’s Creative Commons license and your intended use is not permitted by statutoryregulation or exceeds the permitted use, you will need to obtain permission directly fromthe copyright holder. To view a copy of this license, visit http://creativecommons.org/licenses/by/4.0/.
© The Author(s) 2018
NATURE COMMUNICATIONS | DOI: 10.1038/s41467-018-03401-x ARTICLE
NATURE COMMUNICATIONS | (2018) 9:921 | DOI: 10.1038/s41467-018-03401-x | www.nature.com/naturecommunications 7