three-dimensional atlas system for mouse and rat brain ... · three-dimensional atlas system for...
TRANSCRIPT

Three-dimensional atlas system for mouse and rat brainimaging data
Trine Hjornevik1, Trygve B. Leergaard1, Dmitri Darine1, Olve Moldestad1, Anders M. Dale2,3,Frode Willoch1,4 and Jan G. Bjaalie1,∗
1. Centre for Molecular Biology and Neuroscience & Institute of Basic Medical Sciences, University of Oslo, Norway2. Departments of Neurosciences and Radiology, University of California, San Diego, USA3. Martinos Center for Biomedical Imaging, Massachusetts General Hospital, Harvard Medical School, USA4. Department of Radiology, Aker University Hospital, Norway
Edited by: Maryann Martone, University of California, San Diego, USA
Reviewed by: Richard A. Baldock, Medical Research Council Human Genetics Unit, Edinburgh, United KingdomJames F. Brinkley, University of Washington, Seattle, United States of America
Tomographic neuroimaging techniques allow visualization of functionally and structurally specific signals in the mouse and rat brain.The interpretation of the image data relies on accurate determination of anatomical location, which is frequently obstructed by the lackof structural information in the data sets. Positron emission tomography (PET) generally yields images with low spatial resolution andlittle structural contrast, and many experimental magnetic resonance imaging (MRI) paradigms give specific signal enhancements butoften limited anatomical information. Side-by-side comparison of image data with conventional atlas diagram is hampered by the 2-Dformat of the atlases, and by the lack of an analytical environment for accumulation of data and integrative analyses. We here presenta method for reconstructing 3-D atlases from digital 2-D atlas diagrams, and exemplify 3-D atlas-based analysis of PET and MRI data.The reconstruction procedure is based on two seminal mouse and brain atlases, but is applicable to any stereotaxic atlas. Currently,30 mouse brain structures and 60 rat brain structures have been reconstructed. To exploit the 3-D atlas models, we have developeda multi-platform atlas tool (available via The Rodent Workbench, http://rbwb.org) which allows combined visualization of experimentalimage data within the 3-D atlas space together with 3-D viewing and user-defined slicing of selected atlas structures. The tool presentedfacilitates assignment of location and comparative analysis of signal location in tomographic images with low structural contrast.
Keywords: 3-D reconstruction, atlas, brain, imaging, magnetic resonance imaging, positron emission tomography, stereotaxic, visual-ization
INTRODUCTIONPositron emission tomography (PET) and magnetic resonance imaging(MRI) techniques are increasingly used for investigations of the mouseand rat brain, in the context of numerous types of general brain mappingor disease model investigations. PET imaging reflects function and notprimarily structure, and therefore, reveals few landmarks in the brain orskull. MRI imaging shows a variable degree of structural detail, depend-ing on the specifications of the instrument and the imaging protocols. Acommon challenge is therefore to assign locations to the data collectedwith use of available brain atlases.
PET and MRI techniques produce three-dimensional (3-D) volume(tomographic) data, whereas standard brain atlases have until recentlybeen available only in a two-dimensional (2-D) format. The establishedand most commonly used atlases of the mouse and rat brain (Paxinos andFranklin, 2001; Paxinos and Watson, 1998, 2005; Swanson, 2004) provideseries of sections, cut at specified angles, with external surfaces andinternal boundaries of areas and nuclei indicated, and names assigned to
∗ Correspondence: Jan G. Bjaalie, Centre for Molecular Biology and Neuro-science & Institute of Basic Medical Sciences, University of Oslo, Norway. e-mail:[email protected]
Received: 5 Sep. 2007; paper pending published: 24 Sep. 2007; accepted: 9 Oct. 2007;published online: 02 Nov. 2007
Full citation: Frontiers in Neuroinformatics (2007) 1:4 doi: 10.3389/neuro.11/004.2007Copyright: ©2007 Hjornevik, Leergaard, Darine, Moldestad, Dale, Willoch, Bjaalie. Thisis an open-access article subject to an exclusive license agreement between the authorsand the Frontiers Research Foundation, which permits unrestricted use, distribution, andreproduction in any medium, provided the original authors and source are credited.
the delineated structures. Use of such atlases for neuroimaging studiesare hampered by the 2-D format as well as a lack of an analyticalenvironment for comparison and integration of atlas and image data.Recently, atlases with 3-D representations of major brain structureshave been developed for the mouse (Boline et al., 2006; Chan et al.,2007; Gustafson et al., 2004; Lein et al., 2007; MacKenzie-Graham et al.,2004). Both the 3-D mouse brain atlas of the Biomedical InformaticsResearch Network, BIRN (Boline et al., 2006), and the 3-D surgical mouseatlas developed at the University of Toronto (Chan et al., 2007) supportimport of experimental data (e.g., TIFF and Analyze Image format), whichcan either be visualized as orthogonal slices in a separate window or inthe 3-D viewer. Furthermore, the BIRN atlas facilitates alignment of theexperimental data with the atlas, with a set of predefined transformationparameters (i.e., 180 degrees rotation, swapping, and mirroring). Asconcerns 3-D rat brain atlases, several efforts are under development(see e.g., Gustafson et al., 2004, 2007), and a recently deployedneuroanatomical affiliation visualization-interface system demonstratesparts of the rat brain stem in 3-D (Palombi et al., 2006), but there is toour knowledge currently no comprehensive rat brain atlas available.
To further facilitate the task of establishing a spatial mapping betweenneuroimaging data and atlas space for the mouse and rat brain, we haveestablished a pipeline for 3-D reconstruction of structures from two ofthe seminal high-resolution standard atlases (Paxinos and Franklin, 2001;Paxinos and Watson, 2005) including the stereotaxic space provided bythe atlases. These particular rodent atlases are widely used and share acommon nomenclature for both mouse and rat. The present versions of the3-D reconstructed atlases include 30 structures for the mouse brain and
1Frontiers in Neuroinformatics | November 2007 | Volume 1 | Article 4
H j o r n e v i k e t a l .
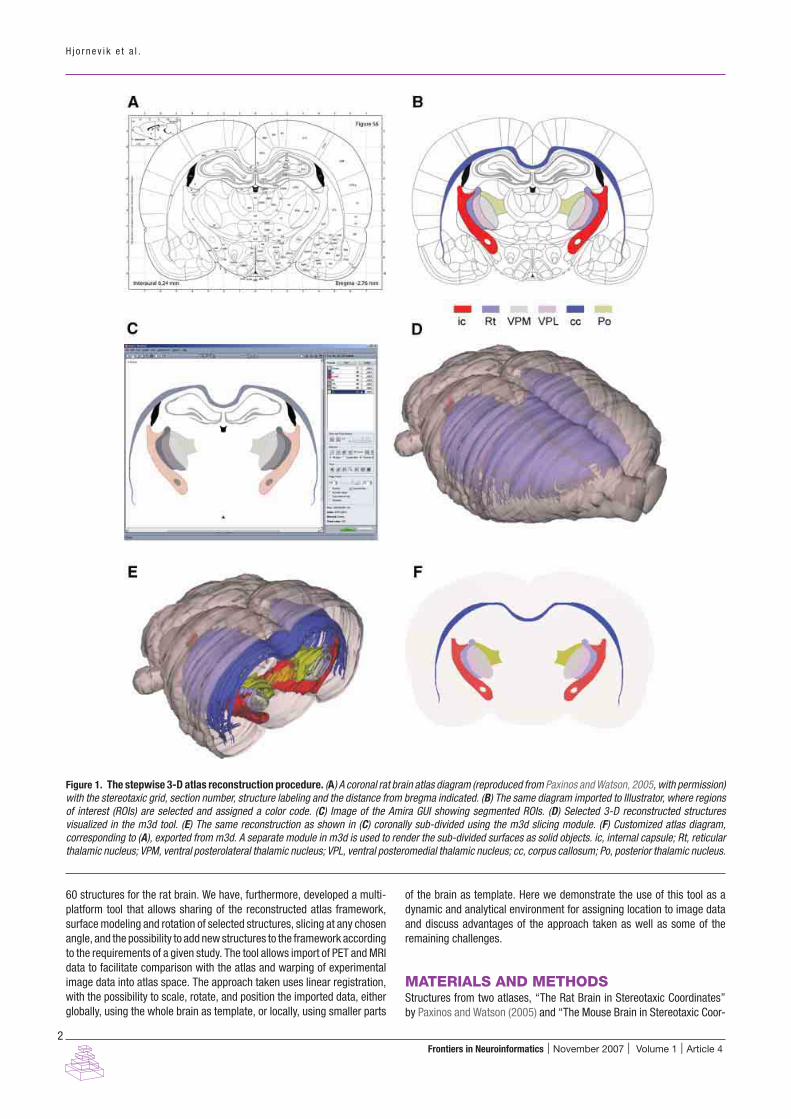
Figure 1. The stepwise 3-D atlas reconstruction procedure. (A) A coronal rat brain atlas diagram (reproduced from Paxinos and Watson, 2005, with permission)with the stereotaxic grid, section number, structure labeling and the distance from bregma indicated. (B) The same diagram imported to Illustrator, where regionsof interest (ROIs) are selected and assigned a color code. (C) Image of the Amira GUI showing segmented ROIs. (D) Selected 3-D reconstructed structuresvisualized in the m3d tool. (E) The same reconstruction as shown in (C) coronally sub-divided using the m3d slicing module. (F) Customized atlas diagram,corresponding to (A), exported from m3d. A separate module in m3d is used to render the sub-divided surfaces as solid objects. ic, internal capsule; Rt, reticularthalamic nucleus; VPM, ventral posterolateral thalamic nucleus; VPL, ventral posteromedial thalamic nucleus; cc, corpus callosum; Po, posterior thalamic nucleus.
60 structures for the rat brain. We have, furthermore, developed a multi-platform tool that allows sharing of the reconstructed atlas framework,surface modeling and rotation of selected structures, slicing at any chosenangle, and the possibility to add new structures to the framework accordingto the requirements of a given study. The tool allows import of PET and MRIdata to facilitate comparison with the atlas and warping of experimentalimage data into atlas space. The approach taken uses linear registration,with the possibility to scale, rotate, and position the imported data, eitherglobally, using the whole brain as template, or locally, using smaller parts
of the brain as template. Here we demonstrate the use of this tool as adynamic and analytical environment for assigning location to image dataand discuss advantages of the approach taken as well as some of theremaining challenges.
MATERIALS AND METHODSStructures from two atlases, “The Rat Brain in Stereotaxic Coordinates”by Paxinos and Watson (2005) and “The Mouse Brain in Stereotaxic Coor-
2Frontiers in Neuroinformatics | November 2007 | Volume 1 | Article 4
3-D atlas for rodent brain imaging data
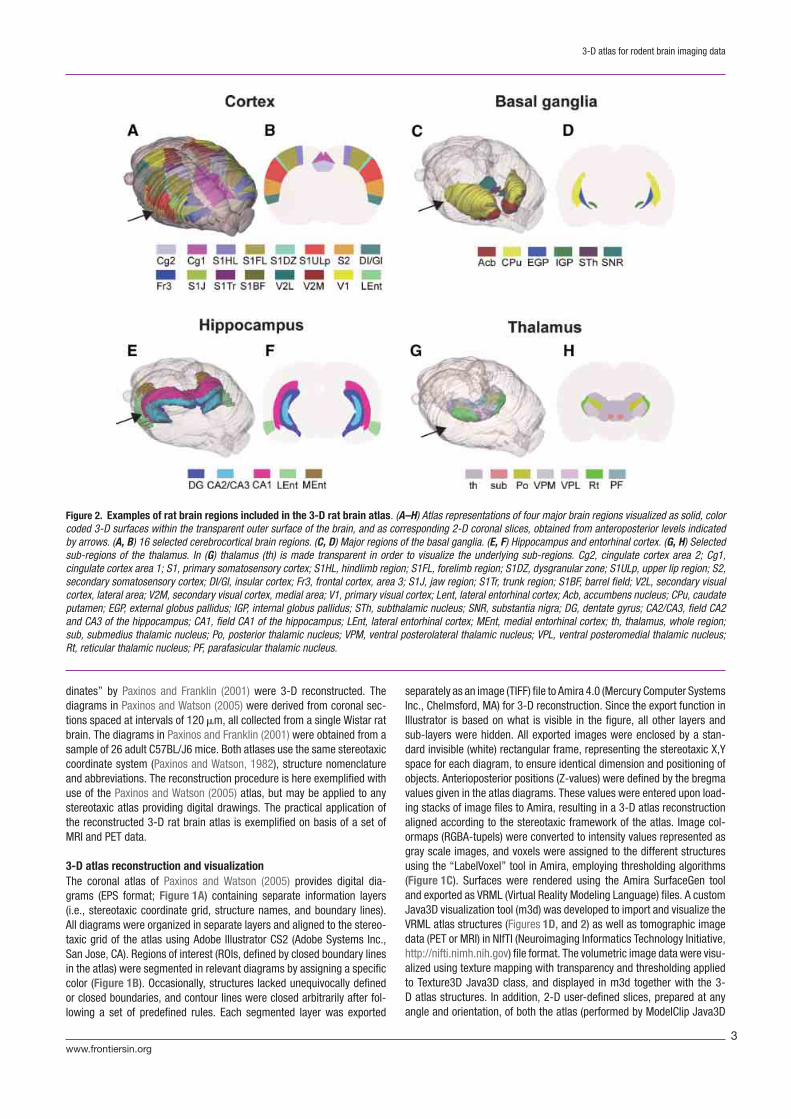
Figure 2. Examples of rat brain regions included in the 3-D rat brain atlas. (A–H) Atlas representations of four major brain regions visualized as solid, colorcoded 3-D surfaces within the transparent outer surface of the brain, and as corresponding 2-D coronal slices, obtained from anteroposterior levels indicatedby arrows. (A, B) 16 selected cerebrocortical brain regions. (C, D) Major regions of the basal ganglia. (E, F) Hippocampus and entorhinal cortex. (G, H) Selectedsub-regions of the thalamus. In (G) thalamus (th) is made transparent in order to visualize the underlying sub-regions. Cg2, cingulate cortex area 2; Cg1,cingulate cortex area 1; S1, primary somatosensory cortex; S1HL, hindlimb region; S1FL, forelimb region; S1DZ, dysgranular zone; S1ULp, upper lip region; S2,secondary somatosensory cortex; DI/GI, insular cortex; Fr3, frontal cortex, area 3; S1J, jaw region; S1Tr, trunk region; S1BF, barrel field; V2L, secondary visualcortex, lateral area; V2M, secondary visual cortex, medial area; V1, primary visual cortex; Lent, lateral entorhinal cortex; Acb, accumbens nucleus; CPu, caudateputamen; EGP, external globus pallidus; IGP, internal globus pallidus; STh, subthalamic nucleus; SNR, substantia nigra; DG, dentate gyrus; CA2/CA3, field CA2and CA3 of the hippocampus; CA1, field CA1 of the hippocampus; LEnt, lateral entorhinal cortex; MEnt, medial entorhinal cortex; th, thalamus, whole region;sub, submedius thalamic nucleus; Po, posterior thalamic nucleus; VPM, ventral posterolateral thalamic nucleus; VPL, ventral posteromedial thalamic nucleus;Rt, reticular thalamic nucleus; PF, parafasicular thalamic nucleus.
dinates” by Paxinos and Franklin (2001) were 3-D reconstructed. Thediagrams in Paxinos and Watson (2005) were derived from coronal sec-tions spaced at intervals of 120 �m, all collected from a single Wistar ratbrain. The diagrams in Paxinos and Franklin (2001) were obtained from asample of 26 adult C57BL/J6 mice. Both atlases use the same stereotaxiccoordinate system (Paxinos and Watson, 1982), structure nomenclatureand abbreviations. The reconstruction procedure is here exemplified withuse of the Paxinos and Watson (2005) atlas, but may be applied to anystereotaxic atlas providing digital drawings. The practical application ofthe reconstructed 3-D rat brain atlas is exemplified on basis of a set ofMRI and PET data.
3-D atlas reconstruction and visualizationThe coronal atlas of Paxinos and Watson (2005) provides digital dia-grams (EPS format; Figure 1A) containing separate information layers(i.e., stereotaxic coordinate grid, structure names, and boundary lines).All diagrams were organized in separate layers and aligned to the stereo-taxic grid of the atlas using Adobe Illustrator CS2 (Adobe Systems Inc.,San Jose, CA). Regions of interest (ROIs, defined by closed boundary linesin the atlas) were segmented in relevant diagrams by assigning a specificcolor (Figure 1B). Occasionally, structures lacked unequivocally definedor closed boundaries, and contour lines were closed arbitrarily after fol-lowing a set of predefined rules. Each segmented layer was exported
separately as an image (TIFF) file to Amira 4.0 (Mercury Computer SystemsInc., Chelmsford, MA) for 3-D reconstruction. Since the export function inIllustrator is based on what is visible in the figure, all other layers andsub-layers were hidden. All exported images were enclosed by a stan-dard invisible (white) rectangular frame, representing the stereotaxic X,Yspace for each diagram, to ensure identical dimension and positioning ofobjects. Anterioposterior positions (Z-values) were defined by the bregmavalues given in the atlas diagrams. These values were entered upon load-ing stacks of image files to Amira, resulting in a 3-D atlas reconstructionaligned according to the stereotaxic framework of the atlas. Image col-ormaps (RGBA-tupels) were converted to intensity values represented asgray scale images, and voxels were assigned to the different structuresusing the “LabelVoxel” tool in Amira, employing thresholding algorithms(Figure 1C). Surfaces were rendered using the Amira SurfaceGen tooland exported as VRML (Virtual Reality Modeling Language) files. A customJava3D visualization tool (m3d) was developed to import and visualize theVRML atlas structures (Figures 1D, and 2) as well as tomographic imagedata (PET or MRI) in NIfTI (Neuroimaging Informatics Technology Initiative,http://nifti.nimh.nih.gov) file format. The volumetric image data were visu-alized using texture mapping with transparency and thresholding appliedto Texture3D Java3D class, and displayed in m3d together with the 3-D atlas structures. In addition, 2-D user-defined slices, prepared at anyangle and orientation, of both the atlas (performed by ModelClip Java3D
3www.frontiersin.org
H j o r n e v i k e t a l .
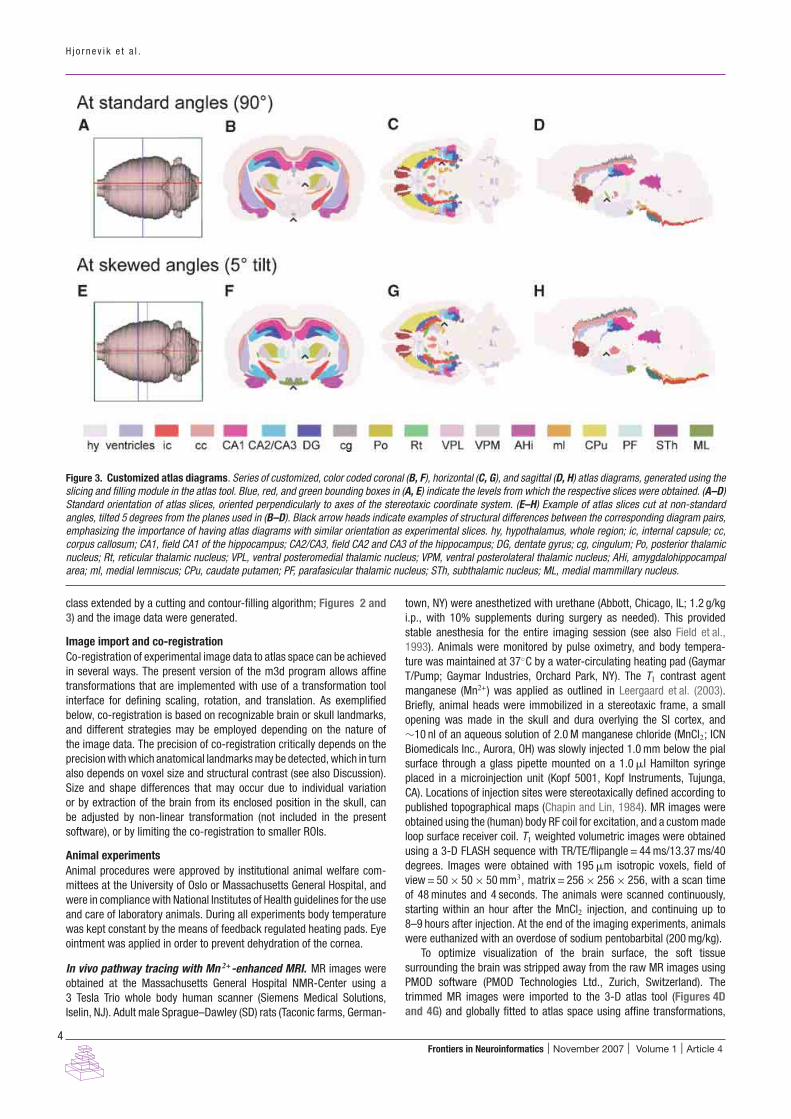
Figure 3. Customized atlas diagrams. Series of customized, color coded coronal (B, F), horizontal (C, G), and sagittal (D, H) atlas diagrams, generated using theslicing and filling module in the atlas tool. Blue, red, and green bounding boxes in (A, E) indicate the levels from which the respective slices were obtained. (A–D)Standard orientation of atlas slices, oriented perpendicularly to axes of the stereotaxic coordinate system. (E–H) Example of atlas slices cut at non-standardangles, tilted 5 degrees from the planes used in (B–D). Black arrow heads indicate examples of structural differences between the corresponding diagram pairs,emphasizing the importance of having atlas diagrams with similar orientation as experimental slices. hy, hypothalamus, whole region; ic, internal capsule; cc,corpus callosum; CA1, field CA1 of the hippocampus; CA2/CA3, field CA2 and CA3 of the hippocampus; DG, dentate gyrus; cg, cingulum; Po, posterior thalamicnucleus; Rt, reticular thalamic nucleus; VPL, ventral posteromedial thalamic nucleus; VPM, ventral posterolateral thalamic nucleus; AHi, amygdalohippocampalarea; ml, medial lemniscus; CPu, caudate putamen; PF, parafasicular thalamic nucleus; STh, subthalamic nucleus; ML, medial mammillary nucleus.
class extended by a cutting and contour-filling algorithm; Figures 2 and3) and the image data were generated.
Image import and co-registrationCo-registration of experimental image data to atlas space can be achievedin several ways. The present version of the m3d program allows affinetransformations that are implemented with use of a transformation toolinterface for defining scaling, rotation, and translation. As exemplifiedbelow, co-registration is based on recognizable brain or skull landmarks,and different strategies may be employed depending on the nature ofthe image data. The precision of co-registration critically depends on theprecision with which anatomical landmarks may be detected, which in turnalso depends on voxel size and structural contrast (see also Discussion).Size and shape differences that may occur due to individual variationor by extraction of the brain from its enclosed position in the skull, canbe adjusted by non-linear transformation (not included in the presentsoftware), or by limiting the co-registration to smaller ROIs.
Animal experimentsAnimal procedures were approved by institutional animal welfare com-mittees at the University of Oslo or Massachusetts General Hospital, andwere in compliance with National Institutes of Health guidelines for the useand care of laboratory animals. During all experiments body temperaturewas kept constant by the means of feedback regulated heating pads. Eyeointment was applied in order to prevent dehydration of the cornea.
In vivo pathway tracing with Mn 2+-enhanced MRI. MR images wereobtained at the Massachusetts General Hospital NMR-Center using a3 Tesla Trio whole body human scanner (Siemens Medical Solutions,Iselin, NJ). Adult male Sprague–Dawley (SD) rats (Taconic farms, German-
town, NY) were anesthetized with urethane (Abbott, Chicago, IL; 1.2 g/kgi.p., with 10% supplements during surgery as needed). This providedstable anesthesia for the entire imaging session (see also Field et al.,1993). Animals were monitored by pulse oximetry, and body tempera-ture was maintained at 37◦C by a water-circulating heating pad (GaymarT/Pump; Gaymar Industries, Orchard Park, NY). The T1 contrast agentmanganese (Mn2+) was applied as outlined in Leergaard et al. (2003).Briefly, animal heads were immobilized in a stereotaxic frame, a smallopening was made in the skull and dura overlying the SI cortex, and∼10 nl of an aqueous solution of 2.0 M manganese chloride (MnCl2; ICNBiomedicals Inc., Aurora, OH) was slowly injected 1.0 mm below the pialsurface through a glass pipette mounted on a 1.0 �l Hamilton syringeplaced in a microinjection unit (Kopf 5001, Kopf Instruments, Tujunga,CA). Locations of injection sites were stereotaxically defined according topublished topographical maps (Chapin and Lin, 1984). MR images wereobtained using the (human) body RF coil for excitation, and a custom madeloop surface receiver coil. T1 weighted volumetric images were obtainedusing a 3-D FLASH sequence with TR/TE/flipangle = 44 ms/13.37 ms/40degrees. Images were obtained with 195 �m isotropic voxels, field ofview = 50 × 50 × 50 mm3, matrix = 256 × 256 × 256, with a scan timeof 48 minutes and 4 seconds. The animals were scanned continuously,starting within an hour after the MnCl2 injection, and continuing up to8–9 hours after injection. At the end of the imaging experiments, animalswere euthanized with an overdose of sodium pentobarbital (200 mg/kg).
To optimize visualization of the brain surface, the soft tissuesurrounding the brain was stripped away from the raw MR images usingPMOD software (PMOD Technologies Ltd., Zurich, Switzerland). Thetrimmed MR images were imported to the 3-D atlas tool (Figures 4Dand 4G) and globally fitted to atlas space using affine transformations,
4Frontiers in Neuroinformatics | November 2007 | Volume 1 | Article 4
3-D atlas for rodent brain imaging data
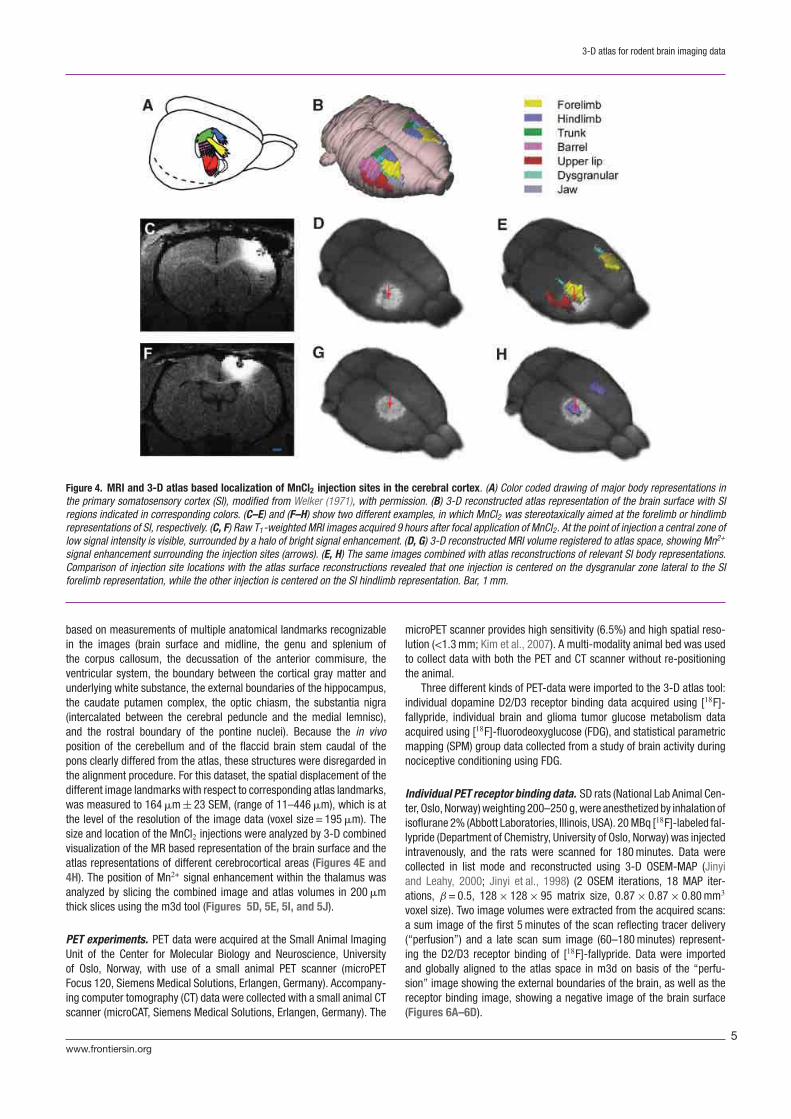
Figure 4. MRI and 3-D atlas based localization of MnCl2 injection sites in the cerebral cortex. (A) Color coded drawing of major body representations inthe primary somatosensory cortex (SI), modified from Welker (1971), with permission. (B) 3-D reconstructed atlas representation of the brain surface with SIregions indicated in corresponding colors. (C–E) and (F–H) show two different examples, in which MnCl2 was stereotaxically aimed at the forelimb or hindlimbrepresentations of SI, respectively. (C, F) Raw T1-weighted MRI images acquired 9 hours after focal application of MnCl2. At the point of injection a central zone oflow signal intensity is visible, surrounded by a halo of bright signal enhancement. (D, G) 3-D reconstructed MRI volume registered to atlas space, showing Mn2+
signal enhancement surrounding the injection sites (arrows). (E, H) The same images combined with atlas reconstructions of relevant SI body representations.Comparison of injection site locations with the atlas surface reconstructions revealed that one injection is centered on the dysgranular zone lateral to the SIforelimb representation, while the other injection is centered on the SI hindlimb representation. Bar, 1 mm.
based on measurements of multiple anatomical landmarks recognizablein the images (brain surface and midline, the genu and splenium ofthe corpus callosum, the decussation of the anterior commisure, theventricular system, the boundary between the cortical gray matter andunderlying white substance, the external boundaries of the hippocampus,the caudate putamen complex, the optic chiasm, the substantia nigra(intercalated between the cerebral peduncle and the medial lemnisc),and the rostral boundary of the pontine nuclei). Because the in vivoposition of the cerebellum and of the flaccid brain stem caudal of thepons clearly differed from the atlas, these structures were disregarded inthe alignment procedure. For this dataset, the spatial displacement of thedifferent image landmarks with respect to corresponding atlas landmarks,was measured to 164 �m ± 23 SEM, (range of 11–446 �m), which is atthe level of the resolution of the image data (voxel size = 195 �m). Thesize and location of the MnCl2 injections were analyzed by 3-D combinedvisualization of the MR based representation of the brain surface and theatlas representations of different cerebrocortical areas (Figures 4E and4H). The position of Mn2+ signal enhancement within the thalamus wasanalyzed by slicing the combined image and atlas volumes in 200 �mthick slices using the m3d tool (Figures 5D, 5E, 5I, and 5J).
PET experiments. PET data were acquired at the Small Animal ImagingUnit of the Center for Molecular Biology and Neuroscience, Universityof Oslo, Norway, with use of a small animal PET scanner (microPETFocus 120, Siemens Medical Solutions, Erlangen, Germany). Accompany-ing computer tomography (CT) data were collected with a small animal CTscanner (microCAT, Siemens Medical Solutions, Erlangen, Germany). The
microPET scanner provides high sensitivity (6.5%) and high spatial reso-lution (<1.3 mm; Kim et al., 2007). A multi-modality animal bed was usedto collect data with both the PET and CT scanner without re-positioningthe animal.
Three different kinds of PET-data were imported to the 3-D atlas tool:individual dopamine D2/D3 receptor binding data acquired using [18F]-fallypride, individual brain and glioma tumor glucose metabolism dataacquired using [18F]-fluorodeoxyglucose (FDG), and statistical parametricmapping (SPM) group data collected from a study of brain activity duringnociceptive conditioning using FDG.
Individual PET receptor binding data. SD rats (National Lab Animal Cen-ter, Oslo, Norway) weighting 200–250 g, were anesthetized by inhalation ofisoflurane 2% (Abbott Laboratories, Illinois, USA). 20 MBq [18F]-labeled fal-lypride (Department of Chemistry, University of Oslo, Norway) was injectedintravenously, and the rats were scanned for 180 minutes. Data werecollected in list mode and reconstructed using 3-D OSEM-MAP (Jinyiand Leahy, 2000; Jinyi et al., 1998) (2 OSEM iterations, 18 MAP iter-ations, β = 0.5, 128 × 128 × 95 matrix size, 0.87 × 0.87 × 0.80 mm3
voxel size). Two image volumes were extracted from the acquired scans:a sum image of the first 5 minutes of the scan reflecting tracer delivery(“perfusion”) and a late scan sum image (60–180 minutes) represent-ing the D2/D3 receptor binding of [18F]-fallypride. Data were importedand globally aligned to the atlas space in m3d on basis of the “perfu-sion” image showing the external boundaries of the brain, as well as thereceptor binding image, showing a negative image of the brain surface(Figures 6A–6D).
5www.frontiersin.org
H j o r n e v i k e t a l .
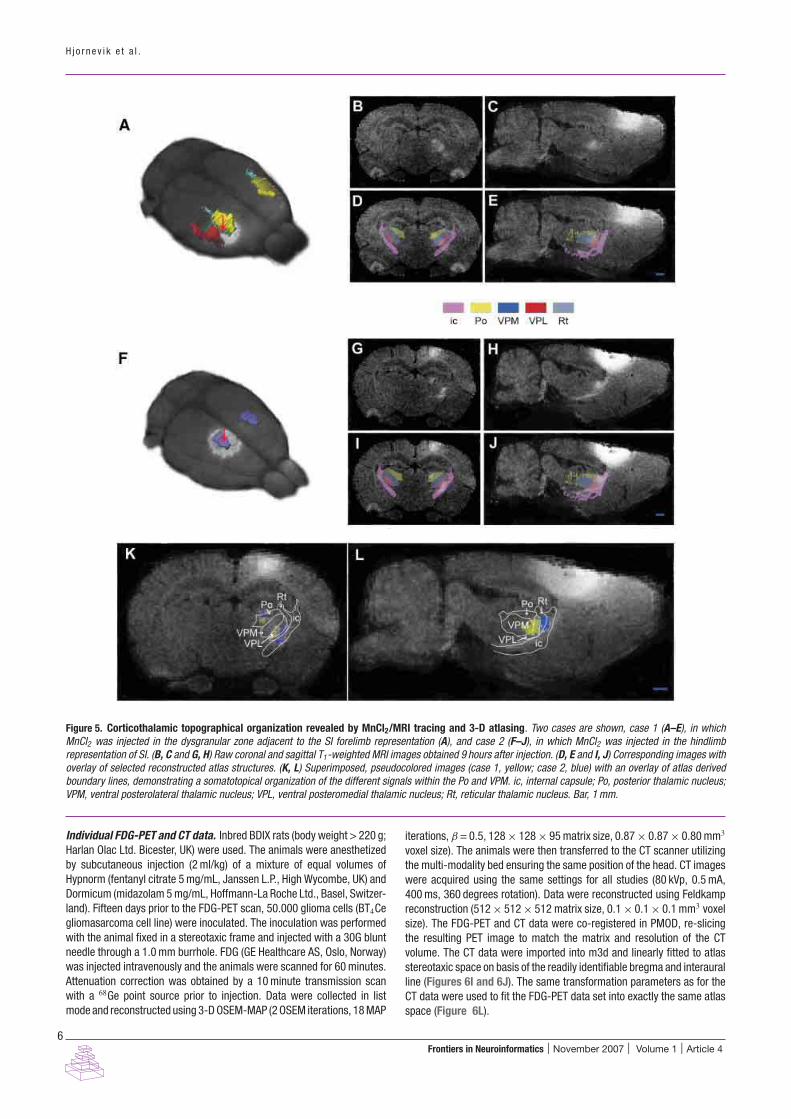
Figure 5. Corticothalamic topographical organization revealed by MnCl2/MRI tracing and 3-D atlasing. Two cases are shown, case 1 (A–E), in whichMnCl2 was injected in the dysgranular zone adjacent to the SI forelimb representation (A), and case 2 (F–J), in which MnCl2 was injected in the hindlimbrepresentation of SI. (B, C and G, H) Raw coronal and sagittal T1-weighted MRI images obtained 9 hours after injection. (D, E and I, J) Corresponding images withoverlay of selected reconstructed atlas structures. (K, L) Superimposed, pseudocolored images (case 1, yellow; case 2, blue) with an overlay of atlas derivedboundary lines, demonstrating a somatotopical organization of the different signals within the Po and VPM. ic, internal capsule; Po, posterior thalamic nucleus;VPM, ventral posterolateral thalamic nucleus; VPL, ventral posteromedial thalamic nucleus; Rt, reticular thalamic nucleus. Bar, 1 mm.
Individual FDG-PET and CT data. Inbred BDIX rats (body weight > 220 g;Harlan Olac Ltd. Bicester, UK) were used. The animals were anesthetizedby subcutaneous injection (2 ml/kg) of a mixture of equal volumes ofHypnorm (fentanyl citrate 5 mg/mL, Janssen L.P., High Wycombe, UK) andDormicum (midazolam 5 mg/mL, Hoffmann-La Roche Ltd., Basel, Switzer-land). Fifteen days prior to the FDG-PET scan, 50.000 glioma cells (BT4Cegliomasarcoma cell line) were inoculated. The inoculation was performedwith the animal fixed in a stereotaxic frame and injected with a 30G bluntneedle through a 1.0 mm burrhole. FDG (GE Healthcare AS, Oslo, Norway)was injected intravenously and the animals were scanned for 60 minutes.Attenuation correction was obtained by a 10 minute transmission scanwith a 68Ge point source prior to injection. Data were collected in listmode and reconstructed using 3-D OSEM-MAP (2 OSEM iterations, 18 MAP
iterations, β = 0.5, 128 × 128 × 95 matrix size, 0.87 × 0.87 × 0.80 mm3
voxel size). The animals were then transferred to the CT scanner utilizingthe multi-modality bed ensuring the same position of the head. CT imageswere acquired using the same settings for all studies (80 kVp, 0.5 mA,400 ms, 360 degrees rotation). Data were reconstructed using Feldkampreconstruction (512 × 512 × 512 matrix size, 0.1 × 0.1 × 0.1 mm3 voxelsize). The FDG-PET and CT data were co-registered in PMOD, re-slicingthe resulting PET image to match the matrix and resolution of the CTvolume. The CT data were imported into m3d and linearly fitted to atlasstereotaxic space on basis of the readily identifiable bregma and interauralline (Figures 6I and 6J). The same transformation parameters as for theCT data were used to fit the FDG-PET data set into exactly the same atlasspace (Figure 6L).
6Frontiers in Neuroinformatics | November 2007 | Volume 1 | Article 4
3-D atlas for rodent brain imaging data
Figure 6. (Continued ).
7www.frontiersin.org

H j o r n e v i k e t a l .
SPM group results. Twenty female SD (National Lab Animal Center, Oslo,Norway) rats weighing 200–250 g, were adapted for minimum 10 days tothe environment and given food and water ad libitum. For the experiments,the animals were anesthetized by inhalation of 2% isoflurane (Abbott Labo-ratories, Illinois, USA) and divided into two groups; nociceptive stimulationcondition (n =10) and sham (n =10). In addition, all animals were scannedat baseline. FDG (20–25 MBq; GE Healthcare AS, Oslo, Norway) wasinjected through the tail vein and all animals were scanned for 60 minutes.Attenuation correction was obtained by a 10 minutes transmission scanwith a 68Ge point source prior to FDG injection. Data were collectedin list mode and dynamically reconstructed using 3-D OSEM-MAP (2OSEM iterations, 18 MAP iterations, β= 0.1, 128 × 128 × 95 matrix size,0.87 × 0.87 × 0.80 mm3 voxel size). Statistical comparisons (paired t-teststimulation-baseline) between the two groups were performed with SPM5(Statistical Parametric Mapping, http://fil.ion.ucl.ac.uk/spm) after intra-subject co-registration and spatial normalization to a MRI template fittedto Paxinos and Watson atlas space (Schweinhardt et al., 2003; Figure6Q). Significance was accepted at the 5% level. Localization of statisticalsignificant activity was defined by the use of the 3-D atlas model. The MRItemplate was aligned with the atlas model in m3d (Figures 6R and 6S)by the means of identifiable anatomical landmarks (outer boundaries ofthe brain surface, gray and white matter contrast, genu and splenium ofthe corpus callosum, outer boundaries of the hippocampus and caudateputamen, and the ventricle system). Since spatial normalization betweenthe PET data and the MRI template was already performed in SPM5, thesame linear transformation obtained from the alignment could be appliedto the PET data (Figure 6T).
RESULTSWe have developed a procedure for 3-D reconstruction of a series of2-D diagrams from conventional brain atlases. The 3-D reconstructedatlases are displayed and utilized in a multi-platform tool (m3d), preparedto include experimental data of different formats (i.e., JPEG, PNG, VRML,and NIfTI). The focus of the present report is to exemplify how a relativelystraightforward atlas approach may be useful for the neuroanatomicalanalysis in the context of import of whole brain MRI and PET data.
The 3-D rat brain atlas currently includes 60 structures, while 30structures have been incorporated in the 3-D mouse brain atlas. Thestructures included are the outer boundaries of the brain and areas, zonesand nuclei of the cerebral cortex, hippocampus, basal ganglia, thalamus,amygdala, as well as major fiber tracts (Figures 2A, 2C, 2E, and 2G).The m3d atlas visualization tool allows interactive inspection of selected3-D reconstructed structures as well as user-defined slicing to createcustomized 2-D atlas diagrams at any position and angle of orientation.This feature is particularly suitable for comparison with experimental datacut at angles different from the standard coronal, sagittal, or horizontalorientations used in printed brain atlases (Figures 3E–3H).
The current version of the m3d tool allows import of image data andsubsequent registration of images to atlas space by interactive scaling,
rotation, and translation on basis of recognizable landmarks. Dependingon the modality of the experimental data, the alignment can be performedglobally for the entire whole brain data set, using the outer boundaries ofthe brain as a template, and/or locally for parts of the whole brain data set,utilizing smaller readily identifiable landmarks in the brain. In addition, thequality of the registration can be enhanced by a step-by-step alignmentof the atlas and image data with use of slicing at different locations andangles. In m3d, co-registered image and atlas representations can beco-visualized as 3-D objects and in 2-D custom defined slices.
In the following, we exemplify the use of the 3-D atlas for assigninglocation to MRI and PET image volumes.
MRI exampleTo illustrate the use of the 3-D atlas to assign location to discrete structuralsignals observed with MRI, we here describe two experiments in whichhigh-resolution in vivo MnCl2/MRI pathway tracing (see e.g., Leergaardet al., 2003; Pautler et al., 1998; Saleem et al., 2002) was used to visu-alize specific corticothalamic connections, and 3-D atlasing was used toassign location to tracer injection sites and observed signal enhance-ment. To evaluate the position of injection sites and the corticothalamicsignal enhancement, the two MR image volumes were registered to atlasspace on basis of multiple recognizable anatomical landmarks and affinetransformations.
In the two example experiments, MnCl2 was injected on basis ofstereotaxic coordinates, respectively aimed at the forelimb or hindlimbrepresentations of the primary somatosensory cortex (SI). When the ani-mals were scanned ∼9 hours after the injection, injection sites were visiblein the T1-weighted images as bright regions, surrounding a core with lowsignal intensity, presumably associated with high concentration of Mn2+
(Figures 4C and 4F; see also discussion in Leergaard et al., 2003). Mn2+
signal enhancement was observed at multiple cortical and sub-corticallocations, as reported in Leergaard et al. (2003). Discrete Mn2+ signalenhancement was observed in the internal capsule (ic) and at multiplesites within the thalamus (Figures 5B, 5C, 5G, and 5H).
Co-visualization in m3d of the co-registered MR image volumes andatlas reconstructions of SI body representations (Figures 4D–4H) demon-strated that the injection site center in one example was located slightlyoutside the targeted forelimb representation (Figure 4E), and in the otherexample that the injection site center was located centrally in the hindlimbrepresentation (Figure 4F). Identical results were obtained with use ofmanual measurements of the mediolateral and anterioposterior distancesfrom the injection site centers to the midline and the genu and splenium ofthe corpus callosum in the MR images. The manual measurements wereconverted to stereotaxic coordinates using the printed atlas of Paxinos andWatson (2005), and compared to known functional maps of SI (Chapin andLin, 1984).
To evaluate the location of Mn2+ signal enhancement within the thala-mus, series of contiguous 200 �m thick coronal and sagittal slices wereobtained from the combined atlas and MRI volume. Overlay images of
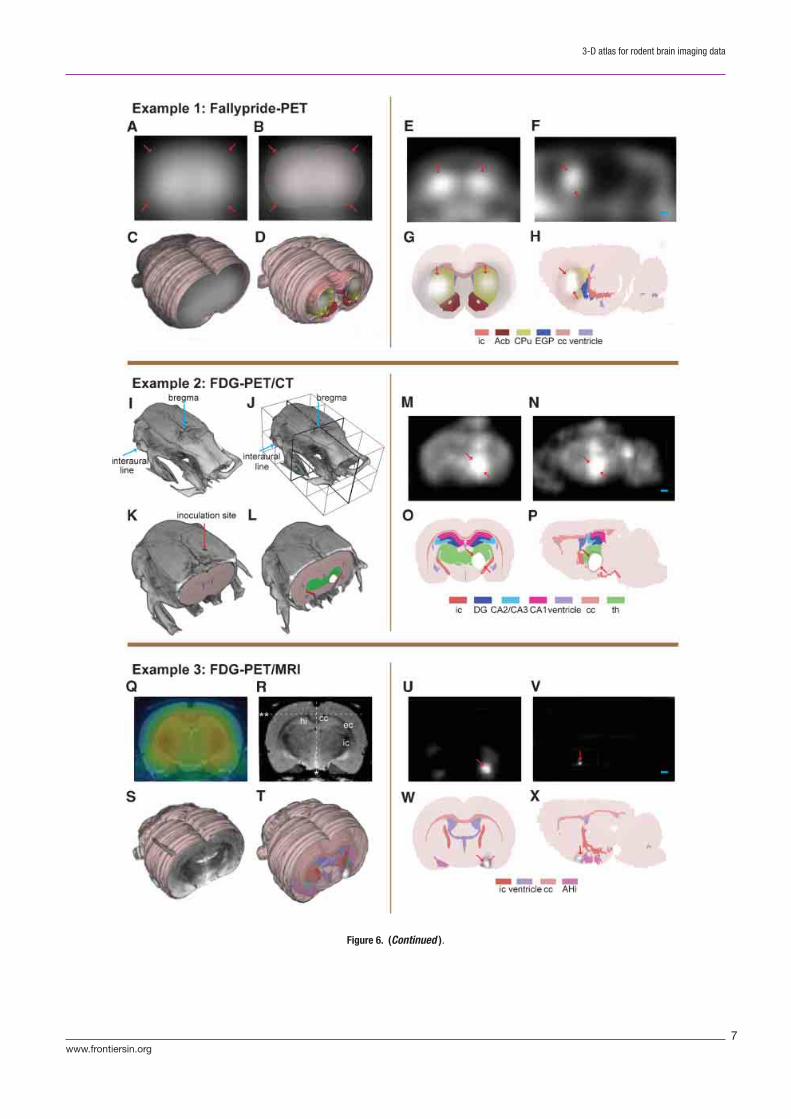
Figure 6. Alignment and localization of PET data. Example 1: (A–C) perfusion image of [18F]-fallypride image was used for alignment to 3-D atlas space.Arrows indicating surface boundaries. (D) Receptor binding image co-registered with the 3-D atlas model. (E, F) [18F]-fallypride-PET coronal and sagittal imagesshowing high-uptake regions. (G, H) Coronal and sagittal atlas sections localizing the high-uptake PET signals to the basal ganglia. Example 2: (I, J) Bregmaand the interaural line in the CT volume. (K) CT volume aligned with the 3-D atlas model. (L) FDG-PET signal aligned with the 3-D atlas on the basis of thesame transformation matrix as for the CT volume. (M, N) Coronal and sagittal PET images showing high-uptake of FDG in the brain tumor. (O, P) Coronal andsagittal atlas diagrams locating the brain tumor in the right thalamic region. Example 3: (Q) co-registered FDG-PET image (colors) and MRI template. (R, S) MRItemplate aligned to the 3-D atlas space on the basis of defined landmarks. *, midline; **, upper boundary of cc. (T) SPM result volume aligned with atlas spaceusing the transformation matrix obtained from the MRI alignment. (U, V) Coronal and sagittal SPM result images showing statistical significant voxels (p < 0.05).(W, X) Coronal and sagittal atlas diagrams locating the significant signal to the rostral part of the amygdala. ic, internal capsule; Acb, accumbens nucleus; CPu,caudate putamen; EGP, external globus pallidus; cc, corpus callosum; DG, dentate gyrus; CA2/CA3, field CA2 and CA3 of the hippocampus; CA1, field CA1 of thehippocampus; th, thalamus, whole region; hi, hippocampal region; ec, external capsule; AHi, amygdalohippocampal area. Arrows indicate boundaries of regionswith increased PET signal. Bar, 1 mm.
8Frontiers in Neuroinformatics | November 2007 | Volume 1 | Article 4
3-D atlas for rodent brain imaging data
relevant atlas structures (thalamic sub-nuclei and the internal capsule)and MR images allowed atlas based anatomical segmentation of the MRimages (Figure 5). Thus, aided by the atlas overlay, it was possible todistinguish Mn2+ signal enhancement located in the internal capsule andwithin the posterior complex thalamus (Po) and the ventral posterolateralnucleus thalamus (VPL) in both examples. Combined analysis of the twodata sets further allowed assessment of topographical organization at afiner scale (Figures 5K and 5L). This analysis clearly demonstrated thatthe discrete clusters of signal enhancement where primarily distributedwithin the boundaries of Po and VPL (Figure 5K), with an inside-out rela-tionship corresponding to the well known internal to external somatotopicdistribution of hindlimb and forelimb representations in these thalamicsub-nuclei (Fabri and Burton, 1991). Signal enhancement was also seenin the reticular thalamic nucleus (Figure 5K), presumably representingpathways en route to the Po and VPL. Furthermore, in our first exam-ple (Figures 5B–5E) some signal enhancement was also observed in theventral posteromedial thalamic nucleus (VPM), known to hold represen-tations of the face (Fabri and Burton, 1991). This finding is presumablyrelated to the location of the injection site center in the dysgranular zonebetween the forelimb and face representations in SI. We conclude that thepresent 3-D atlas approach provided an anatomical segmentation of theobserved signal enhancement sufficiently accurate to resolve finer detailsof the well-known topographical organization found within sub-nuclei ofthe thalamus (see e.g., Deschenes et al., 1998; Fabri and Burton, 1991;Price, 1995).
PET examplesTo illustrate the use of the 3-D atlas to assign location to PET data (Figure6), we have used three different sets of experimental data.
Individual PET receptor binding data. The [18F]-fallypride data setrepresents the D2/D3-receptor binding in the brain. The receptor bind-ing image itself contains little anatomical information and could not bealigned to atlas space (Figures 6E and 6F). “Perfusion” images of earlyframes representing the initial hematogeneous tracer distribution wereused (Figures 6A–6C) to facilitate alignment, since these data show theexternal contours of the cerebrum and cerebellum, as well to a certaindegree the outlining of the basal ganglia using different levels of voxelintensity scaling. The same transformation parameters were then usedto fit the receptor binding image into the atlas space in m3d (Figure6D). Visualization of the receptor binding showed the highest density ofdopamine D2/D3 receptors to be present in the basal ganglia (Figures 6Gand 6H). Only a course alignment of the experimental data with the atlaswas possible due to limited structural information. A further judgment ofdetails of distribution was not deemed possible with the present approach.
Individual FDG-PET and CT data. FDG is a glucose analog and FDG-PETimages represent the rate of glucose metabolism of the cells. Cancer cellsmostly utilize more glucose than healthy tissue and tumors can thereforebe located as regions with high uptake of FDG in a PET scan (Figures 6Mand 6N). To be able to decide the size, extent, and location of the braintumor, the co-registered CT image was imported and aligned to the 3-Datlas space in m3d using the location of bregma and the interaural linewhich could be readily defined in the CT volume (Figures 6I and 6J). Theinoculation site for the glioma cells is shown in Figure 6 K. The sametransformation matrix was applied to the FDG-PET volume in order to fitthe data to atlas space (Figure 6L). The increased FDG signal definingthe brain tumor was located in the right thalamic region. The qualityof the alignment procedure was in this case considerably enhanced byutilizing CT as a complementary imaging modality. The readily identifiablebregma and the interaural line provided concrete landmarks which couldbe aligned in 3-D atlas space. Inaccuracies can occur due to inter-subjectvariations in brain shape and size, and due to the fusion procedure of thePET and CT data prior to import into m3d.
SPM group results. SPM delivers a result volume (cluster of voxels) at aspecified statistical significance value (Figures 6U and 6V). This paramet-ric volume was already fitted to the space of a defined anatomic template.The MRI template was imported and aligned to the 3-D atlas space inm3d by the aim of well-defined landmarks, i.e., white matter and thecontours of the brain (Figures 6R and 6S) The same parameters wereapplied to the significant parametric volume in order to fit the data to theatlas space (Figure 6T). The nociceptive conditioning is an aversive andstressful event, in which amygdala play a crucial role (Sah et al., 2003).After alignment, a significant effect of nociceptive conditioning could belocalized to the rostral volume of the amygdala (Figures 6W and 6X). Thealignment of the MRI template to the 3-D atlas space was performed usinga best-fit approach based on large brain regions. Due to variations in therat brain shape and size, a perfect fit is difficult to obtain. If focusing onspecific areas within the brain, the transformation parameters might bealtered using smaller local sub-regions as alignment landmarks. However,the resolution of microPET and averaging over several individuals has aninherent inaccuracy limiting the detailed localization and separation ofsmaller effects to specific, smaller sub-nuclei of any rat or even mousebrain structure. Once the MRI-template has been sufficiently aligned toa 3-D atlas, the same transformation routine and result reading can beestablished for all data processed with statistical parametric mapping.The 3-D atlas makes the data processing and interpretation less observerdependent. As shown in Figures 6T–6X, the 3-D atlas ensures a suffi-ciently precise allocation of a statistical significant result to a brain areain relation to neighboring structures.
DISCUSSIONWe present a multi-platform tool that provides a new dynamic and analyti-cal environment for comparing experimental image data to a seminal atlasreconstructed in 3-D. Our 3-D reconstruction procedure was applied to twocommonly used rodent brain atlases, but could be applied to other atlasesas long as they provide diagrams from sections with limited distortions,mapped into a stereotaxic coordinate system. We further demonstrate howthe atlas tool can be used to align 3-D data of different origin (PET, PET/CT,and MRI) to the same atlas space, facilitating analysis of localization inthe experimental data.
In the example analyses provided, variable amounts of information wasavailable to assist the user with the registration of the experimental data tothe 3-D atlas space. The most limited structural information was present inthe receptor binding PET data. The global registration performed for thesedata, based on the outer contours of the brain visible in the early framesrecorded, was nevertheless sufficient to identify the caudate-putamenas the region containing the highest [18F]-fallypride receptor binding, inagreement with legacy data (Mukherjee et al., 1995). The acquisition of CTimages in register with the experimental PET images facilitated the atlasregistration considerably, since skull landmarks (readily detected with CT)could be directly mapped to the atlas coordinate space (which is basedon the same skull landmarks). Use of MRI in combination with PET is anemerging new approach (Judenhofer et al., 2007). In our analyses, wedemonstrate an indirect MRI-based co-registration procedure. With thisprocedure, the data sets were aligned to a common MRI template, whichin turn was registered to the 3-D atlas. In this example, the location ofthe statistically significant increased activity was found in the expectedlocation in the brain, in our case the amygdala following a nociceptiveconditioning (Sah et al., 2003). Finally, direct import of experimental MRIdata can be done with a high accuracy since a range of landmarks in thebrain are visible in the MRI data. Our high-resolution MnCl2/MRI examplesdemonstrate the mapping of fine-scale topographical organization withinthalamic sub-nuclei (see also Leergaard et al., 2003), corresponding withprevious maps of the thalamus (Fabri and Burton, 1991).
The general validity of the linear co-registration approach used in thepresent study is indirectly demonstrated by the replication of known find-ings in the shown examples. For example, in the FGD-PET/MRI example,
9www.frontiersin.org
H j o r n e v i k e t a l .
the majority of the observed PET signal is largely confined to the ros-tral part of the amygdala, in accordance with Sah et al. (2003). In theMnCl2/MRI example, in which several anatomical landmarks were seen inthe MR images, the mean spatial displacement between anatomical land-marks in atlas and image volume was found to be less than the size ofone voxel. This correspondence is at a level sufficient to study topographi-cal organization within sub-nuclei. The major displacement between atlasand images in this example, not corrected for in our approach, was foundin the hindbrain. This displacement appears to be due to a dislocationof the hindbrain occurring at the time of extraction of the brain from theskull. Further analyses of the hindbrain would therefore require a secondstep of registration in which the hindbrain is treated in isolation from theremaining part of the brain. Adjustment for size variation alone will clearlyfacilitate comparison of brain stem data from different rat brains (Breviket al., 2001; Leergaard et al., 2000). Thus, for tomographic material ofthe quality here exemplified, our linear procedures appear to provide suf-ficient accuracy to resolve most questions related to localization of dataand comparison between animals. More optimized co-registration of mul-tiple detailed anatomical landmarks derived from histological images (Leinet al., 2007; Toga et al., 1995) or high-resolution structural MRI (Ali et al.,2005; Badea et al., 2007; Benveniste et al., 2000; Ma et al., 2005) wouldrequire the use of non-linear methods.
An important feature of the 3-D atlas tool provided is the ability toco-register image data to an atlas framework. The m3d tool supports theimport of voxel data in NIfTI file format, which allows import of volumedata such as PET, CT, and MRI. Future developments will include otherdata formats. As discussed above, several approaches can be employedfor aligning image data to atlas space. In m3d, image data can be linearlytransformed (i.e., transformed with rotation, scaling, and translation) inorder to fit the 3-D atlas space. The transformation matrix is calculatedbased on identifiable landmarks in the image data. A PET image volumetypically lacks well-defined structural information which may complicatethe alignment. The quality of the co-registration may be enhanced whenthe researcher has access to other modalities such as MRI and/or CT.The alignment of an MRI volume is based on anatomical landmarks suchas the outer boundaries of the brain and white matter. In a CT volume,the definition of bregma and the interaural line provides a rigid aid incalculating the transformation matrix. Since the present approach is basedon linear transformations only, local alignment errors may occur due tointer-subject variations in rodent brain shape and size. High-resolutionMRI based probabilistic atlasing of the mouse brain indicate that thisvariation is relatively low (average structure volume variation coefficientin the order of 7%; Badea et al., 2007; Ma et al., 2005). Given that suchvariations may be partly compensated for by linear transformations, theneed to adjust for remaining variability must be viewed in relation to theresolution employed in the tomographic image volumes to be analyzed.
The present approach, with a common analytical environment forexperimental data and 3-D atlas reconstructions, not only facilitates directassignment of anatomical location, but may also be useful in the contextof generating probabilistic representations of the brain. Probabilistic mapsare typically based on manually segmented cases, but may also incorpo-rate information from reconstructed atlases. Co-registration of manuallysegmented cases into a common atlas space would thus enable the con-struction of a probabilistic atlas, containing a priori probabilities of variousanatomical structures at each location in atlas space. Such a probabilis-tic atlas, in combination with the image contrast properties of differentstructures, can in turn be used to automate the process of anatomicalsegmentation (Ali et al., 2005; Fischl et al., 2002).
A major advantage of reconstructing standard stereotaxic atlases(rather than constructing new customized atlases) is the wide recogni-tion and use, and the high-resolution and comprehensive nomenclature,of these atlases. Similarly, for human brain imaging data, the frequentlyused reference atlas space (Talairach and Tournoux, 1988) has been madeavailable in many different formats in order to have a common refer-ence space in the scientific community. Digital versions of the human
brain atlas exist in three orthogonal planes with a high-speed databaseserver for querying and retrieving data about human brain structures overthe internet (ric.uthscsa.edu/projects/talairachdaemon.html). The presentapplication of the 3-D atlases of the rat and the mouse brain makes itsimpler and more reliable to use these atlases in combination with 3-Dimaging modalities, and to bring data from different modalities into thesame environment. A further challenge would be to bring different tomo-graphic data modalities together with primarily 2-D histological or othersection-based data, such as optical imaging data and autoradiography.At present, the skull-based stereotaxic coordinate system of Paxinos andWatson (1982) would seem to be a suitable common reference space.
Tools availabilityInformation on the availability of tools and atlas data can be found at TheRodent Brain Workbench (http://rbwb.org).
CONFLICT OF INTEREST STATEMENTThe authors declare that the research was conducted in the absence ofany commercial or financial relationships that could be constructed as apotential conflict of interest.
ACKNOWLEDGEMENTSFunded by grants from The Research Council of Norway to J. G. B., T. B.L., and F. W., and grants from the NIH (R01-EB00790, U24-RR021382)to A. M. D. We thank Bent Schoultz and Gjermund Henriksen, Depart-ment of Chemistry, University of Oslo, for synthesis of [18F]-fallypride,Dag R. Sorensen and Hong Qu for expert technical assistance related toPET/CT scanning, Anna Devor and Andre van der Kouwe for expert tech-nical assistance related to MnCl2/MRI tracing, and Johan F. Storm forvaluable discussions and facilitation of the present project.
REFERENCESAli, A. A., Dale, A. M., Badea, A., Johnson, G. A. (2005). Automated segmentation of
neuroanatomical structures in multispectral MR microscopy of the mouse brain.Neuroimage 27, 425–435.
Badea, A., li-Sharief, A. A., and Johnson, G. A. (2007). Morphometric analysis of theC57BL/6J mouse brain. Neuroimage 37, 683–693.
Benveniste, H., Kim, K., Zhang, L., and Johnson, G. A. (2000). Magnetic resonancemicroscopy of the C57BL mouse brain. Neuroimage 11, 601–611.
Boline, J. K., MacKenzie-Graham, A. A., Shattuck, D. W., Yuan, H., Anderson, S. P., Sforza,D. M., Wang, J., Williams, R. W., Wong, W., Martone, M. E., Zaslavsky, I., and Toga,A. W. (2006). A Digital Atlas and Neuroinformatics Framework for Query and Displayof Disparate Data. Society for Neuroscience 2006. Abstract and itinerary viewer.Program No. 100. 12.
Brevik, A., Leergaard, T. B., Svanevik. M., and Bjaalie, J. G. (2001). Three dimensionalcomputerised atlas of the rat brain stem precerebellar system: approaches for map-ping, visualization, and comparison of spatial distribution data. Anat. Embryol. (Berl.)204, 319–332.
Chan, E., Kovacevic, N., Ho, S. K. Y., Henkelman, R. M., and Henderson, J. T. (2007).Development of a high resolution three-dimensional surgical atlas of the murinehead for strains 129S1/SvImJ and C57Bl/6J using magnetic resonance imaging andmicro-computed tomography. Neuroscience 144, 604–615.
Chapin, J. K., and Lin, C. S. (1984). Mapping the body representation in the SI cortex ofanesthetized and awake rats. J. Comp. Neurol. 229, 199–213.
Deschenes, M., Veinante, P., and Zhang, Z. W. (1998). The organization of corticothalamicprojections: reciprocity versus parity. Brain Res. Rev. 28, 286–308.
Fabri, M., and Burton, H. (1991). Topography of connections between primary somatosen-sory cortex and posterior complex in rat: a multiple fluorescent tracer study. BrainRes. 538, 351–357.
Field, K. J., White, W. J., and Lang, C. M. (1993). Anaesthetic effects of chloral hydrate,pentobarbitone and urethane in adult male rats. Lab. Anim. 27, 258–269.
Fischl, B., Salat, D. H., Busa, E., Albert, M., Dieterich, M., Haselgrove, C., van der, K. A.,Killiany, R., Kennedy, D., Klaveness, S., Montillo, A., Makris, N., Rosen, B., and Dale,A. M. (2002). Whole brain segmentation: automated labeling of neuroanatomicalstructures in the human brain. Neuron 33, 341–355.
Gustafson, C., Tretiak, O., Bertrand, L., and Nissanov, J. (2004). Design and implemen-tation of software for assembly and browsing of 3D brain atlases. Comput. MethodsPrograms Biomed. 74, 53–61.
Gustafson, C., Bug, W. L., and Nissanov, J. (2007). Neuroterrain—a client-server systemfor browsing 3D biomedical image data sets. BMC Bioinformatics 8, 40.
Jinyi, Q., and Leahy, R. M. (2000). Resolution and noise properties of MAP reconstructionfor fully 3-D PET. Med. Imaging, IEEE Trans. 19, 493–506.
10Frontiers in Neuroinformatics | November 2007 | Volume 1 | Article 4

3-D atlas for rodent brain imaging data
Jinyi, Q., Leahy, R. M., Chinghan, H., Farquhar, T. H., and Cherry, S. R. (1998). Fully 3DBayesian image reconstruction for the ECAT EXACT HR+. Nucl. Sci., IEEE Trans. 45,1096–1103.
Judenhofer, M. S., Catana, C., Swann, B. K., Siegel, S. B., Jung, W. I., Nutt, R. E., Cherry,S. R., Claussen, C. D., and Pichler, B. J. (2007). PET/MR images acquired with acompact MR-compatible PET detector in a 7-T Magnet. Radiology 244, 807–814.
Kim, J. S., Lee, J. S., Im, K. C., Kim, S. J., Kim, S. Y., Lee, D. S., and Moon, D. H. (2007). Per-formance measurement of the microPET Focus 120 Scanner. J. Nucl. Med., in press.
Leergaard, T. B., Lyngstad, K. A., Thompson, J. H., Taeymans, S., Vos, B. P., De Schutter,E., Bower, J. M., and Bjaalie, J. G. (2000). Rat somatosensory cerebropontocerebellarpathways: spatial relationships of the somatotopic map of the primary somatosen-sory cortex are preserved in a three-dimensional clustered pontine map. J. Comp.Neurol. 422, 246–266.
Leergaard, T. B., Bjaalie, J. G., Devor, A., Wald, L. L., Dale, A. M. (2003). In vivo tracing ofmajor rat brain pathways using manganese-enhanced magnetic resonance imagingand three-dimensional digital atlasing. Neuroimage 20, 1591–1600.
Lein, E. S., Hawrylycz, M. J., Ao, N., Ayres, M., Bensinger, A., Bernard, A., Boe, A. F.,Boguski, M. S., Brockway, K. S., Byrnes, E. J., Chen, L., Chen, L., Chen, T. M., ChiChin, M., Chong, J., Crook, B. E., Czaplinska, A., Dang, C. N., Datta, S., Dee, N.R., Desaki, A. L., Desta, T., Diep, E., Dolbeare, T. A., Donelan, M. J., Dong, H. W.,Dougherty, J. G., Duncan, B. J., Ebbert, A. J., Eichele, G., Estin, L. K., Faber, C., Facer,B. A., Fields, R., Fischer, S. R., Fliss, T. P., Frensley, C., Gates, S. N., Glattfelder, K. J.,Halverson, K. R., Hart, M. R., Hohmann, J. G., Howell, M. P., Jeung, D. P., Johnson,R. A., Karr, P. T., Kawal, R., Kidney, J. M., Knapik, R. H., Kuan, C. L., Lake, J. H.,Laramee, A. R., Larsen, K. D., Lau, C., Lemon, T. A., Liang, A. J., Liu, Y., Luong, L.T., Michaels, J., Morgan, J. J., Morgan, R. J., Mortrud, M. T., Mosqueda, N. F., Ng,L. L., Ng, R., Orta, G. J., Overly, C. C., Pak, T. H., Parry, S. E., Pathak, S. D., Pearson,O. C., Puchalski, R. B., Riley, Z. L., Rockett, H. R., Rowland, S. A., Royall, J. J., Ruiz,M. J., Sarno, N. R., Schaffnit, K., Shapovalova, N. V., Sivisay, T., Slaughterbeck, C.R., Smith, S. C., Smith, K. A., Smith, B. I., Sodt, A. J., Stewart, N. N., Stumpf, K.R., Sunkin, S. M., Sutram, M., Tam, A., Teemer, C. D., Thaller, C., Thompson, C. L.,Varnam, L. R., Visel, A., Whitlock, R. M., Wohnoutka, P. E., Wolkey, C. K., Wong, V. Y.,Wood, M., Yaylaoglu, M. B., Young, R. C., Youngstrom, B. L., Feng Yuan, X., Zhang,B., Zwingman, T. A., and Jones, A. R. (2007). Genome-wide atlas of gene expressionin the adult mouse brain. Nature 445, 168–176.
Ma, Y., Hof, P. R., Grant, S. C., Blackband, S. J., Bennett, R., Slatest, L., Mcguigan, S. J.,and Benveniste, H. (2005). A three-dimensional digital atlas database of the adultC57BL/6J mouse brain by magnetic resonance microscopy. Neuroscience 135,1203–1215.
MacKenzie-Graham, A., Lee, E. F., Dinov, I. D., Bota, M., Shattuck, D. W., Ruffins, S.,Yuan, H., Konstantinidis, F., Pitiot, A., Ding, Y., Hu, G., Jacobs, R. E., and Toga, A.W. (2004). A multimodal, multidimensional atlas of the C57BL/6J mouse brain. J.Anat. 204, 93–102.
Mukherjee, J., Yang, Z. Y., Das, M. K., and Brown, T. (1995). Fluorinatedbenzamide neuroleptics–III. Development of (S)-N-[(1-allyl-2-pyrrolidinyl)methyl]-5-(3-[18F]fluoropropyl)-2, 3-dimethoxybenzamide as an improved dopamine D-2receptor tracer. Nucl. Med. Biol. 22, 283–296.
Palombi, O., Shin, J., Watson, C., and Paxinos, G. (2006). Neuroanatomical affiliationvisualization-interface system. Neuroinformatics 4, 299–318.
Pautler, R. G., Silva, A. C., and Koretsky, A. P. (1998). In vivo neuronal tract tracingusing manganese-enhanced magnetic resonance imaging. Magn. Reson. Med. 40,740–748.
Paxinos, G., and Franklin, K. B. (2001). The mouse brain in stereotaxic coordinates (SanDiego, Elsevier Academic Press).
Paxinos, G., and Watson, C. (1982). The rat brain in stereotaxic coordinates (New York,Academic Press).
Paxinos, G., and Watson, C. (1998). The rat brain in stereotaxic coordinates (San Diego,Academic Press).
Paxinos, G., and Watson, C. (2005). The rat brain in stereotaxic coordinates (San Diego,Elsevier Academic Press).
Price, J. L. (1995). Thalamus. In The Rat Nervous System, G. Paxinos, ed. (San Diego,Academic Press), pp. 629–648.
Sah, P., Faber, E. S., De Lopez, A. M., and Power, J. (2003). The amygdaloid complex:anatomy and physiology. Physiol. Rev. 83, 803–834.
Saleem, K. S., Pauls, J. M., Augath, M., Trinath, T., Prause, B. A., Hashikawa, T., andLogothetis, N. K. (2002). Magnetic resonance imaging of neuronal connections inthe macaque monkey. Neuron 34, 685–700.
Schweinhardt, P., Fransson, P., Olson, L., Spenger, C., and Andersson, J. L. R. (2003).A template for spatial normalisation of MR images of the rat brain. J. Neurosci.Methods 129, 105–113.
Swanson, L. W. (2004). Brain maps: Structure of the rat brain (San Diego, ElsevierAcademic Press).
Talairach, J., and Tournoux, P. (1988). Co-planar stereotaxic atlas of the human brain(New York, Thieme Medical Publishers, Inc.).
Toga, A. W., Santori, E. M., Hazani, R., and Ambach, K. (1995). A 3D digital map of ratbrain. Brain Res. Bull. 38, 77–85.
Welker, C. (1971). Microelectrode delineation of fine grain somatotopic organization of(SmI) cerebral neocortex in albino rat. Brain Res. 26, 259–275.
11www.frontiersin.org