thoughts on grade inflation - eric - education resources … · 2013-08-02 · exploratory...
TRANSCRIPT
Exploratory Examination of Grade Inflation 1
An Exploratory Examination of Grade Inflation at The University of Georgia
Paper Presented at the 2005 AIR Forum
San Diego, CA
Charles Mathies
Karen Webber Bauer
Marsha Allen
Office of Institutional Research
The University of Georgia
Exploratory Examination of Grade Inflation 2
An Exploratory Examination of Grade Inflation at The University of Georgia
Abstract
This study examined the change in term grade point average (GPA) from 1974 through 2004 for 368,282 undergraduate student records at a large, research-extensive university in the Southeast. Descriptive analyses showed an increase in term GPA and average SAT scores over the 31-year period. Although average SAT and GPA increased, standard deviations decreased. To examine possible factors related to predicted GPA, linear regression models were developed for each year 1984-2004. (years 1974 -1983 were not included due to missing data.) Regression analyses found SAT and receipt of the HOPE scholarship, gender, race, and college of major to play a role in predicted GPA, and contributions of some of these variables varied widely over the 21-year period. While preliminary findings indicate the contributing nature of these variables to the change in GPA, the adjusted R square values are relatively low. Other factors such as changing student and faculty demographics, teaching pedagogy and technology in the classroom may likely be important contributors that were not included in this study.

Exploratory Examination of Grade Inflation 3
Introduction
Grade inflation has been a concern for US higher education officials for the past 40+
years. Renewed concerns from both institutional and governmental officials have again caused
educators to examine this issue as we attempt to achieve greater efficiency of higher education.
Although often intermingled with the related concepts of grade compression and grade disparity
(Hu, 2005), grade inflation refers to a rise in a grade or grade point average (GPA) without
evidence that it was earned (Bejar & Blew, 1981; Birnbaum, 1977; Breland, 1976). To show that
grade inflation exists, it is important to demonstrate that achievement has not increased (or risen
at same pace), while grades have increased (Bejar & Blew, 1981 p.143).
A number of factors are cited as causes of, or contributing to, grade inflation. Financial
pressure on students, governments and institutions of higher education is one the most frequently
cited reasons. Institutions are perceived by some government officials as seeking higher
appropriations without a concern for the quality of education they are providing their students.
Enrollment-driven funding has created an imbalance in the priorities of publicly funding higher
education … student enrollment counts greatly, student achievement counts little (Stone, 1995.
In some cases, government officials believe that changes in college grading may not only be
responsible for the growing budgets of higher education, but also for lower academic standards
(Stone).
Higher education officials, however, are feeling the financial pinch in a different manner
and, in some cases, believe that if they do not satisfy student expectations, students will transfer
to another school that offers easy grades. In many ways, institutions are responding to the
changing market of higher education- one that has become consumer-based. “Students have for
higher education exactly the same consumer expectations they have for any other commercial
Exploratory Examination of Grade Inflation 4
enterprise. For colleges and universities, survival means satisfying these consumer expectations
and keeping tuition dollars coming” (Barndt, 2001, ¶ 12).
Students are also experiencing financial pressures in another manner which some believe
leads to grade inflation. “Faculty hesitate to deny students the “B” needed for tax credits”
(Reischauer & Gladieux, 1996). In the state of Georgia (state in which the institution for this
study is located), questions are being raised as to whether faculty are reluctant to give low grades
due to the fact that merit-aid scholarships are only available to students if they maintain a B
average. In some cases, if a student loses their tax credit or merit scholarship, s/he will not be
able to continue his/her education.
In addition to financial issues, student choice of major has also been examined as an
outgrowth of this increased consumer-based higher education. Prather, Smith, and Kodras
(1979) found that students are moving into degree programs that reflect their abilities and
interests. In doing so, they are finding grading standards and course content to be parallel with
their interests, and that leads to greater proficiency, i.e., higher grades.
Along with financial pressures and changes in student choice of major, other possible
correlates or reasons for grade inflation include the combination of changing student and faculty
demographics, perceptions of the teaching-learning process, and the introduction of technology
in the classroom. With SAT scores steadily increasing, even when adjusted for recentering,
some scholars argue that the skills and abilities of today’s undergraduates exceed those of a
generation ago, thus students should be earning higher grades (Student Academic and Financial
Affairs Committee of the Academic Senate Georgia Tech, 2003) . Perhaps older faculty, more
comfortable with the traditional lecture, resist the wide-scale introduction of technology and/or
innovative active learning pedagogies. Students of today look to the internet as their primary

Exploratory Examination of Grade Inflation 5
resource for acquisition of knowledge and other research. The individual and/or combined
influence of instructor attitudes, instructional techniques, and technologies is likely to influence
changes in grades (Hu, 2005).
There is debate among researchers as to the underlying cause of grade inflation. Some
cite student ability as the main cause in the rise of grades (Olsen 1997; Hanson, 1998), while
others provide evidence that student ability does not account for the rise (Bejar & Blew, 1981;
Mullen, 1995; McSpirit & Jones 1999; Rojstaczer, 2003; Merrow, 2004; Wilson, 1999). Kuh
and Hu (1999) researching grades over two time periods (mid-80s and mid-90s) and across
multiple institutions and majors, found evidence supporting grade inflation only at research
universities and selective liberal arts colleges but found grade deflation at general liberal arts
colleges and comprehensive colleges and universities and within the humanities and social
sciences disciplines. Some other theories examined and asserted as reasons for grade inflation
include educational credentialism (Brown, 2001), student consumerism (Farley, 1995; Barndt,
2001, Rosovsky & Harley, 2002), admission of a greater number of unprepared students
(Birnbaum, 1977), responding to diversity concerns (in an effort to keep lower SES and minority
students on campus, faculty graded them more leniently) (Rosovsky & Harley), faculty giving
higher grades in return for higher teaching evaluations (Rosovsky & Harley), and faculty having
more interest (and spending more time) with graduate students and research (Merrow, 2004).
While the correlates of grade inflation are of interest, the outcomes of grade inflation are
equally concerning. Perhaps the most frequently mentioned concern is the devaluing of the
undergraduate degree. Since grades are often used as a method of evaluating the talent/merit of
college students, a widespread rise in grades or GPA across the country might make the degree

Exploratory Examination of Grade Inflation 6
less valuable, because some individuals (e.g., employers) will have trouble distinguishing who is
and who is not an excellent student (i.e. properly prepared for a job, graduate school, etc.).
Another concern is the changing view on what is an acceptable grade distribution. Grade
distributions (while the distribution has been skewed toward higher grades for some time, it has
become more skewed with As being numerous, Bs common, and Cs, Ds, and Fs infrequent) fly
in the face of one of our most deeply cherished educational theories, the bell-shaped curve
(Cosgrove, 1995). The curve in fact has become an upward slope with the “Gentleman’s’ C”
becoming the “Gentleman’s A” as the percentage of Cs to As appears to have reversed itself
(Levine & Cureton, 1998).
Description of the Institution Studied
The University of --- is a large, research-extensive public university located the Southeast
portion of the US. As the state’s flagship and land-grant university, it offers over 150 degree
programs in 13 schools and colleges. The undergraduate student body is comprised (currently
approximately 25,000 undergraduates) mainly of traditional age students (18-22 yrs) enrolling
primarily from the local region. Starting in 1994, the state of Georgia provided merit-based
financial aid (HOPE scholarship) to students who graduate from a Georgia high school and
attend either a public or private institution of higher education within the state (Georgia Student
Finance Commission, 2005). The HOPE scholarship provides full tuition, approved mandatory
fees (i.e., health and student activities fees), and a $300 academic book allowance per year for
students enrolled at public institutions. For students attending private institutions, HOPE
provides $3000 per year plus the Georgia Tuition Equalization Grant of $900 per academic year
(Georgia Student Finance Commission, 2005).

Exploratory Examination of Grade Inflation 7
The HOPE scholarship can be earned by graduating Georgia high school seniors who
have a 3.0 cumulative grade point average (GPA) or an 80 numeric average for all college prep
core curriculum subjects. Students who do not earn HOPE as freshmen can earn it after
checkpoints of 30, 60, and 90 semester hours (45, 90, and 120 quarter hours) and must maintain
a cumulative GPA above 3.0. Conversely, students can lose HOPE at the 30, 60, and 90
semester hour checkpoints of they do not maintain a 3.0 cumulative GPA (Georgia Student
Finance Commission, 2005). Students can receive HOPE through the term in which they reach
127 (semester) attempted hours.
The University of --- officials have observed a rise in SAT scores for incoming first year
students over the past 30 years. Simultaneously, campus officials have noted an increase in
grades and questions have been raised as to specific factors related to this rise. Research
questions guiding this study include:
1. What is the average term grade point average (GPA) for full-time undergraduates at the
University of ---for the fall terms 1974 through 2004?
2. What are the demographics of the undergraduate students in these fall terms?
3. Is there a change in GPA and if so, what factors contributed to the increase/decrease in
grades? Particular factors to examine include demographics, college of enrollment, SAT
score, and receipt and/or loss of the HOPE scholarship (merit-based financial aid)
Sample
The sample for this study consists of 368,282 cases of undergraduate students (144,405
individual students) who completed 12 or more graded hours at the University of --- during the
fall terms 1974 through 2004. The data was extracted from official census files. Students were
included in the study if they had usable SAT score and term GPA. The entire sample consisted

Exploratory Examination of Grade Inflation 8
of, on average, 55% female and 90% White students. All non-white students were grouped
together in one ethnic variable (non-white) due to the relatively small number of minority
students enrolled at the University of --- during 1974 to 2004.
Variables Included in the Analyses
Previous studies have discussed the influence of increased student preparation levels on
grades received by undergraduate students. Factors showing influence include standardized
achievement test score (Birnbaum, 1977; Olsen, 1997; McSpirit & Jones, 1999), gender
(Birnbaum, 1977; Olsen, 1997; McSpirit & Jones, 1999), high school GPA (Olsen, 1997), class
level (Olsen, 1997), and student majors (Birnbaum, 1977; McSpirit & Jones, 1999). In addition,
race and merit-based financial aid (presence of HOPE scholarship) were added as factors in our
analyses to address research question #3.
Analyses Employed
Descriptive and advanced statistics were completed for this study. Basic descriptive
statistics and correlation analyses were completed to provide an understanding of average SAT
scores and GPA each year, over time, and the general relationship among GPA, SAT, and
demographics of the sample. One of the predominant uses of multiple linear regression is for
explanation (Ethington, Thomas, & Pike, 2002). Therefore, multiple regressions were developed
to determine the effect each independent variable has on term GPA, the dependent variable. The
independent variables included in this analysis were:
• SAT score (as a proxy of student ability). For this analysis, all data for the SAT score
variable were re-centered to compensate for the changes made in the scoring of the SAT
in the mid 1990s.
• Gender (coded 1 = female, 0 = male)

Exploratory Examination of Grade Inflation 9
• Race (as defined as white/non-white; 1 = non-white students, 0 = white students)
• College of enrollment (coded as dummy variables; The College of Arts & Sciences
majors were clustered into 6 categories; Biological Sciences, Fine Arts, Physical
Sciences, Language & Literature, Social Sciences, and Other)
• Transfer admit (1 = transfer admit, 0 = non-transfer/native admit
• High School GPA
• Presence of the HOPE scholarship (1 = receiving HOPE in term, 0 = not receiving HOPE
in term. Note: HOPE began in 1994 and is only available for those subsequent terms)
Because of the introduction of two variables in 1984 (hsgpa) and receipt of HOPE
scholarship (1994), regression analyses were completed for 1984 -2004.
Findings
Table 1 delineates mean SAT scores and term GPA, as well as the percentage change for
these variables over the previous year and from the initial year of 1974. As shown, the term
GPA rose from 2.77 in 1974 to 3.27 in 2004 (p <.001). For the first 10 years of the analysis, the
term GPA remained relatively stable (1974-1984) before decreasing for a couple of years. In the
late 1980s, the term GPA began to rise consistently and has continued to do so through the
remaining years of the study.
Figure 1 illustrates the change in average term GPA from 1974 through 2004.
Highlighted bars in the chart indicate the beginning of the HOPE scholarship (1994) and the first
term after a quarter to semester conversion (1998). Figure 2 charts average SAT scores by fall
semester. Average SAT scores rose from 1084 in 1974 to 1201 in 2004 (p<.001; all scores
recentered). Like term GPA, average SAT scores were similarly unchanged in the first 10 years
of the study but remained relatively stable before increasing in the late 1980s. Similar to the rise

Exploratory Examination of Grade Inflation 10
in actual term GPA, the increase in SAT scores continued throughout the remaining years of the
study.
Table 1 Means and Standard Deviations of Term GPA and SAT Scores
GPA % change previou
s Year
Mean Actual GPA year
GPA %
change from 1974
SD GPA
Correlation
between GPA and
SAT
Mean Actual SAT
SAT % change previous year
SAT % change from 1974
SD SAT N
1974 2.771
9 0.00% 0.00% 0.792
2 0.324 1084.
3 0.00% 0.00% 139.7
5 8622
1975 2.761
2 -0.39% -
0.39% 0.804
9 0.338 1079.
6 -0.43% -
0.43% 139.9
5 8671
1976 2.771
1 0.36% -
0.03% 0.789
4 0.308 1076.
9 -0.26% -
0.69% 136.7
6 8732
1977 2.718
3 -1.91% -
1.93% 0.806
9 0.304 1074.
8 -0.19% -
0.88% 135.0
5 9644
1978 2.766
2 1.76% -
0.21% 0.797
5 0.262 1075.
3 0.05% -
0.83% 133.4
4 9706
1979 2.763
4 -0.10% -
0.31% 0.796 0.228 1079.
3 0.37% -
0.46% 129.2
9 10109
1980 2.763
1 -0.01% -
0.32% 0.777
8 0.24 1080.
2 0.08% -
0.38% 127.9
6 9906
1981 2.734
8 -1.02% -
1.34% 0.796 0.271 1076 -0.39% -
0.77% 126.0
5 10621
1982 2.748
4 0.50% -
0.85% 0.767
6 0.241 1081.
5 0.51% -
0.26% 125.8
2 10066
1983 2.736
2 -0.44% -
1.29% 0.776 0.245 1084.
5 0.27% 0.01% 125.7
5 9529
1984 2.764
2 1.02% -
0.28% 0.766 0.238 1080.
1 -0.41% -
0.39% 124.6
5 9393
1985 2.696
8 -2.44% -
2.71% 0.774
4 0.232 1079.
1 -0.09% -
0.48% 126.1
3 9490
1986 2.656 -1.51% -
4.18% 0.785
6 0.238 1082 0.27% -
0.22% 128.3
4 9633
1987 2.689
1 1.25% -
2.99% 0.787
3 0.247 1092.
7 0.99% 0.77% 127.8
8 9686
1988 2.689
1 0.00% -
2.99% 0.795
6 0.231 1100.
3 0.70% 1.47% 128.9
3 10599
1989 2.747 2.15% -
0.90% 0.779
3 0.241 1105.
5 0.48% 1.95% 128.9
4 10995
1990 2.742
7 -0.16% -
1.05% 0.796
3 0.246 1108 0.22% 2.18% 129.2
3 12337
1991 2.791
9 1.79% 0.72% 0.771
4 0.236 1108.
6 0.05% 2.24% 128.0
6 13225
1992 2.835
4 1.56% 2.29% 0.774
8 0.232 1117.
3 0.79% 3.04% 129.5
3 13296
1993 2.871
7 1.28% 3.60% 0.782
9 0.214 1128.
5 1.00% 4.07% 132.4
8 12432

Exploratory Examination of Grade Inflation 11
1994 2.936
3 2.25% 5.93% 0.753
7 0.238 1135.
1 0.59% 4.68% 130.5
2 12923
1995 2.980
8 1.52% 7.54% 0.740
5 0.234 1146.
9 1.04% 5.77% 131 13454
1996 3.019
3 1.29% 8.93% 0.721
7 0.255 1154.
9 0.69% 6.51% 130.8
9 13161
1997 3.065 1.51% 10.57
% 0.712
9 0.257 1158.
4 0.30% 6.83% 131.0
1 13838
1998 3.075
8 0.35% 10.96
% 0.700
7 0.246 1166.
2 0.68% 7.55% 130.1
3 14236
1999 3.093 0.56% 11.58
% 0.703
3 0.241 1170.
8 0.39% 7.98% 129.5
5 14439
2000 3.150
5 1.86% 13.66
% 0.680
8 0.241 1175.
7 0.42% 8.43% 128.6
7 14818
2001 3.166
1 0.50% 14.22
% 0.678
1 0.23 1180.
1 0.37% 8.84% 126.2
6 15631
2002 3.190
9 0.78% 15.12
% 0.658
2 0.248 1186 0.50% 9.38% 125.7 16245
2003 3.240
6 1.56% 16.91
% 0.642
2 0.265 1192 0.50% 9.93% 125.9
2 16600
2004 3.272
2 0.98% 18.05
% 0.624
1 0.261 1201.
1 0.77% 10.77
% 127.5
5 16245 averag
e 2.913
1 0.770
5 0.308 1126.
5 136.5
2 36828
2
Ave. Term GPA UGA FT Undergraduates
0.00
0.50
1.00
1.50
2.00
2.50
3.00
3.50
1974
1977
1980
1983
1986
1989
1992
1995
1998
2001
2004
GPA
Figure 1 Average Term GPA by Fall Semester

Exploratory Examination of Grade Inflation 12
Ave. SAT Total UGA FT Undergraduates
400500600700800900
1000110012001300
1974
1976
1978
1980
1982
1984
1986
1988
1990
1992
1994
1996
1998
2000
2002
2004
SAT
Tota
l
Figure 2 Average SAT Scores
As shown in the Figures 1 and 2 and in Table 1, both term GPA and SAT scores for
undergraduates in this sample increased over time. However, in addition to examining the
average scores over time, it is important to note the relationship between the variances as well
(see Table 1). While SAT scores and GPAs have risen over time, the standard deviation (an
indication of the variance among scores) has decreased. This indicates that while grades and
SAT scores are increasing, the variation between the scores is decreasing.
The change in scores can also be examined by the percentage of change from the start of
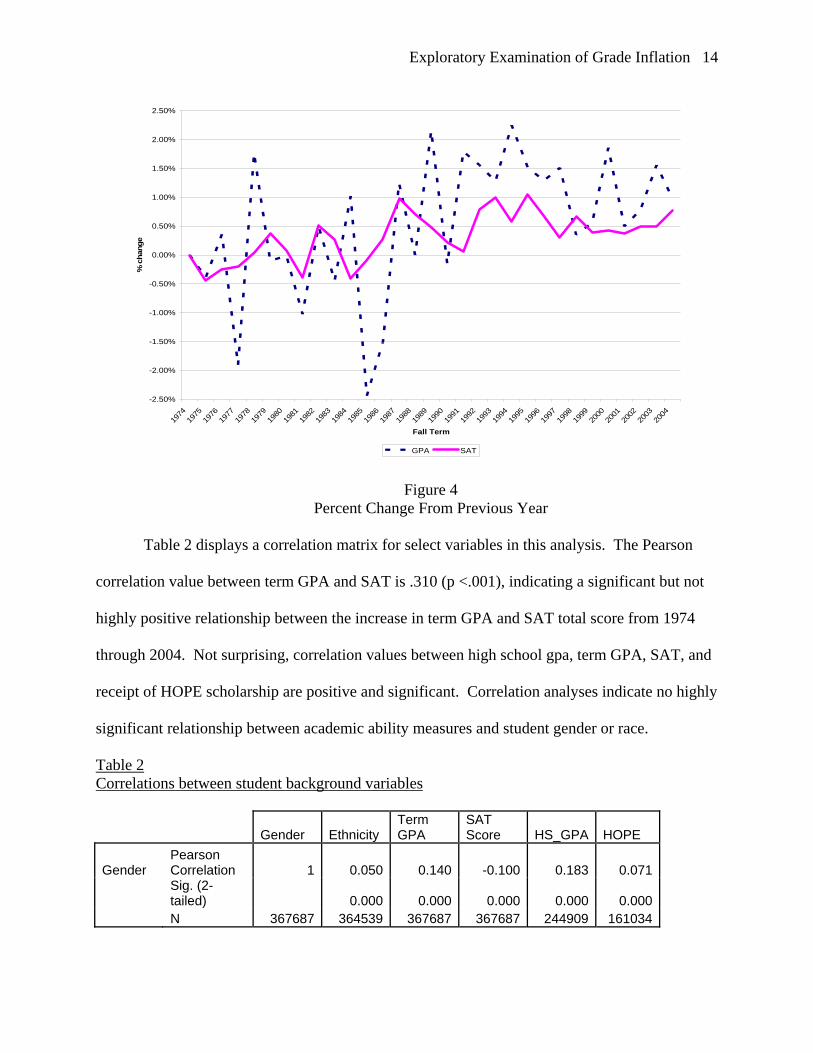
the analysis (Figure 3) and percentage of change from the previous year (Figure 4). In Figure 3,
change in term GPA is relatively stable until mid 1980s where it decreased before increasing
throughout the remaining years. The change in average SAT scores is similar to the change in
term GPA and is relatively stable until the mid 1980s where SAT scores increased for the
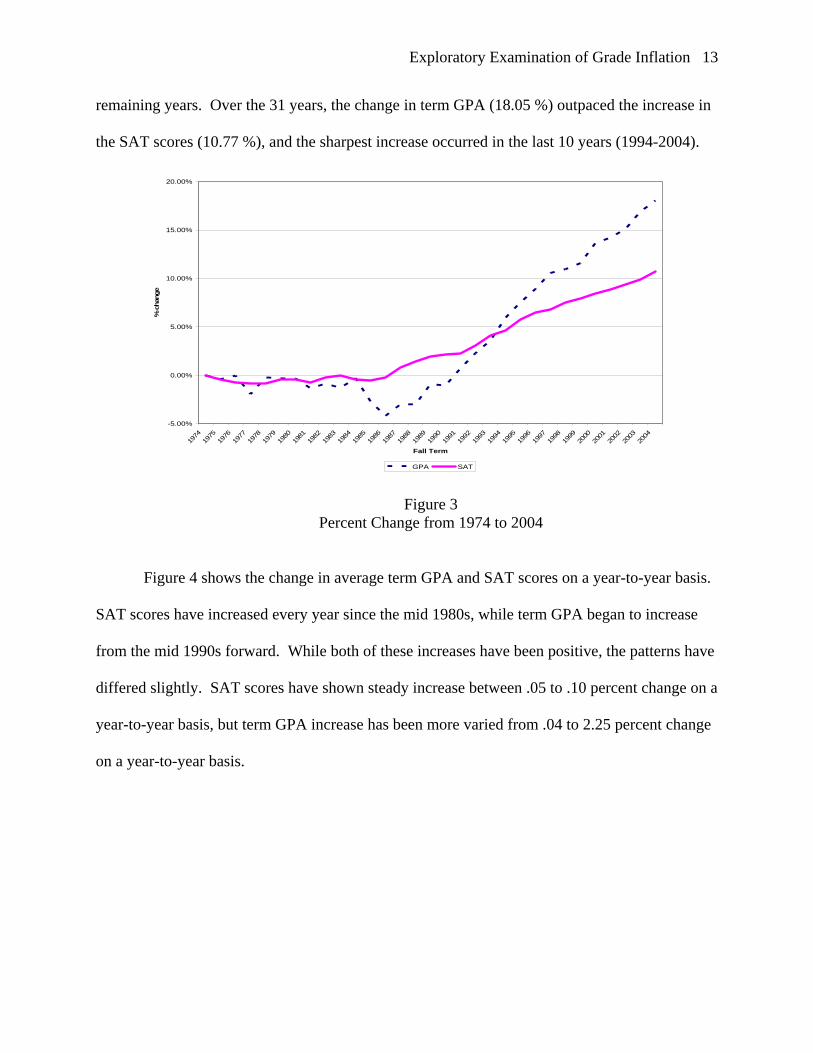
Exploratory Examination of Grade Inflation 13
remaining years. Over the 31 years, the change in term GPA (18.05 %) outpaced the increase in
the SAT scores (10.77 %), and the sharpest increase occurred in the last 10 years (1994-2004).
-5.00%
0.00%
5.00%
10.00%
15.00%
20.00%
1974
1975
1976
1977
1978
1979
1980
1981
1982
1983
1984
1985
1986
1987
1988
1989
1990
1991
1992
1993
1994
1995
1996
1997
1998
1999
2000
2001
2002
2003
2004
Fall Term
% c
hang
e
GPA SAT
Figure 3 Percent Change from 1974 to 2004
Figure 4 shows the change in average term GPA and SAT scores on a year-to-year basis.
SAT scores have increased every year since the mid 1980s, while term GPA began to increase
from the mid 1990s forward. While both of these increases have been positive, the patterns have
differed slightly. SAT scores have shown steady increase between .05 to .10 percent change on a
year-to-year basis, but term GPA increase has been more varied from .04 to 2.25 percent change
on a year-to-year basis.
Exploratory Examination of Grade Inflation 14
-2.50%
-2.00%
-1.50%
-1.00%
-0.50%
0.00%
0.50%
1.00%
1.50%
2.00%
2.50%
1974
1975
1976
1977
1978
1979
1980
1981
1982
1983
1984
1985
1986
1987
1988
1989
1990
1991
1992
1993
1994
1995
1996
1997
1998
1999
2000
2001
2002
2003
2004
Fall Term
% c
hang
e
GPA SAT
Figure 4 Percent Change From Previous Year
Table 2 displays a correlation matrix for select variables in this analysis. The Pearson
correlation value between term GPA and SAT is .310 (p <.001), indicating a significant but not
highly positive relationship between the increase in term GPA and SAT total score from 1974
through 2004. Not surprising, correlation values between high school gpa, term GPA, SAT, and
receipt of HOPE scholarship are positive and significant. Correlation analyses indicate no highly
significant relationship between academic ability measures and student gender or race.
Table 2 Correlations between student background variables
Gender Ethnicity Term GPA
SAT Score HS_GPA HOPE
Gender Pearson Correlation 1 0.050 0.140 -0.100 0.183 0.071
Sig. (2-tailed) 0.000 0.000 0.000 0.000 0.000
N 367687 364539 367687 367687 244909 161034

Exploratory Examination of Grade Inflation 15
Ethnicity Pearson Correlation 1 -0.060 -0.120 0.028 -0.041
Sig. (2-tailed) 0.000 0.000 0.000 0.000
N 364877 364877 364877 243081 158929 Term GPA
Pearson Correlation 1 0.310 0.427 0.308
Sig. (2-tailed) 0.000 0.000 0.000
N 368282 368282 245377 161590 SAT Score
Pearson Correlation 1 0.396 0.224
Sig. (2-tailed) 0.000 0.000
N 368282 245377 161590
HS_GPA Pearson Correlation 1 0.406
Sig. (2-tailed) 0.000
N 245377 151462
HOPE Pearson Correlation 1
Sig. (2-tailed)
N 161590 Note: All correlations significant at the 0.01 level (2-tailed)
Regression Analyses
In order to more fully examine the contribution of certain variables to GPA as well as the
relationship between actual and predicted GPA, Table 3 displays results of actual versus
predicted term GPAs. Because data for high school GPA was not available prior to 1984,
regression analyses shown here are based on data 1984 through 2004 (N=242,800 records).
Table 3 Actual vs. Predicted GPA
Term Actual Term
GPA Predicted Term
GPA 1984 2.667 2.721 1985 2.634 2.697 1986 2.642 2.695 1987 2.687 2.692 1988 2.684 2.700 1989 2.743 2.716 1990 2.734 2.713

Exploratory Examination of Grade Inflation 16
1991 2.789 2.722 1992 2.832 2.751 1993 2.864 2.785 1994 2.938 2.890 1995 2.982 2.963 1996 3.025 3.010 1997 3.071 3.040 1998 3.083 3.084 1999 3.103 3.116 2000 3.161 3.142 2001 3.179 3.156 2002 3.203 3.175 2003 3.250 3.192 2004 3.281 3.215
As shown in Table 3, predicted term GPAs are slightly higher than actual values in early
years (1984-1988) but slightly lower in more recent fall terms (1989-2004). The regression
model overpredicts term GPA in the early years but then underpredicts term GPA in the more
recent terms (most terms 1989 – 2004). Results indicate that holding constant for the variables
(SAT, gender, race, hsgpa, college of major, transfer status and receipt of HOPE) grades are
increasing more than we would predict.
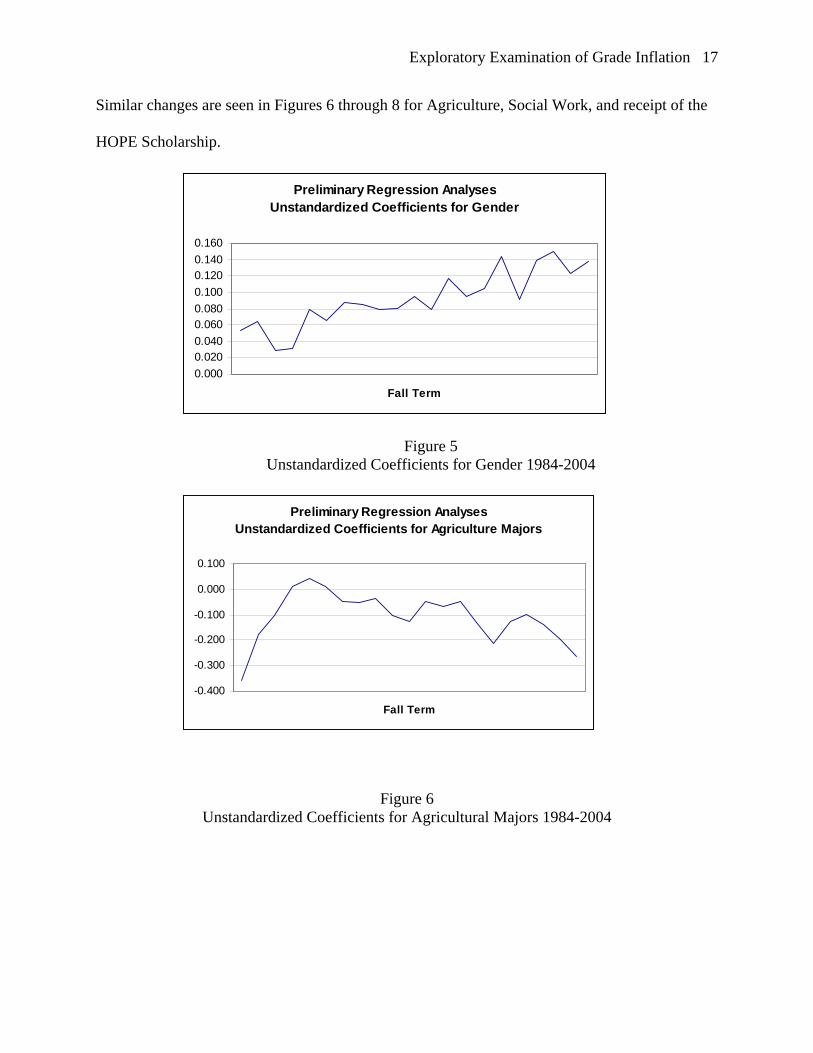
Table 4 (located at end of paper) lists the unstandardized regression coefficients for the
comprehensive model (1984-2004) and for each individual year. The comprehensive model is
helpful in allowing us to compare the contribution of a variable over the 20 year time period. An
examination of unstandardized coefficients each year gives insight into the relative amount of
contribution for that variable and if the contribution changes over the 20 year period. For
example, as shown in Figures 5 through 8, many of the unstandardized B coefficients are
changing over the 20 year period. This indicates a change in the relative contribution of this
variable in predicting term GPA. For example, the coefficient value for gender approximately
doubles over time and thus its subsequent more important contribution to the GPA prediction.
Exploratory Examination of Grade Inflation 17
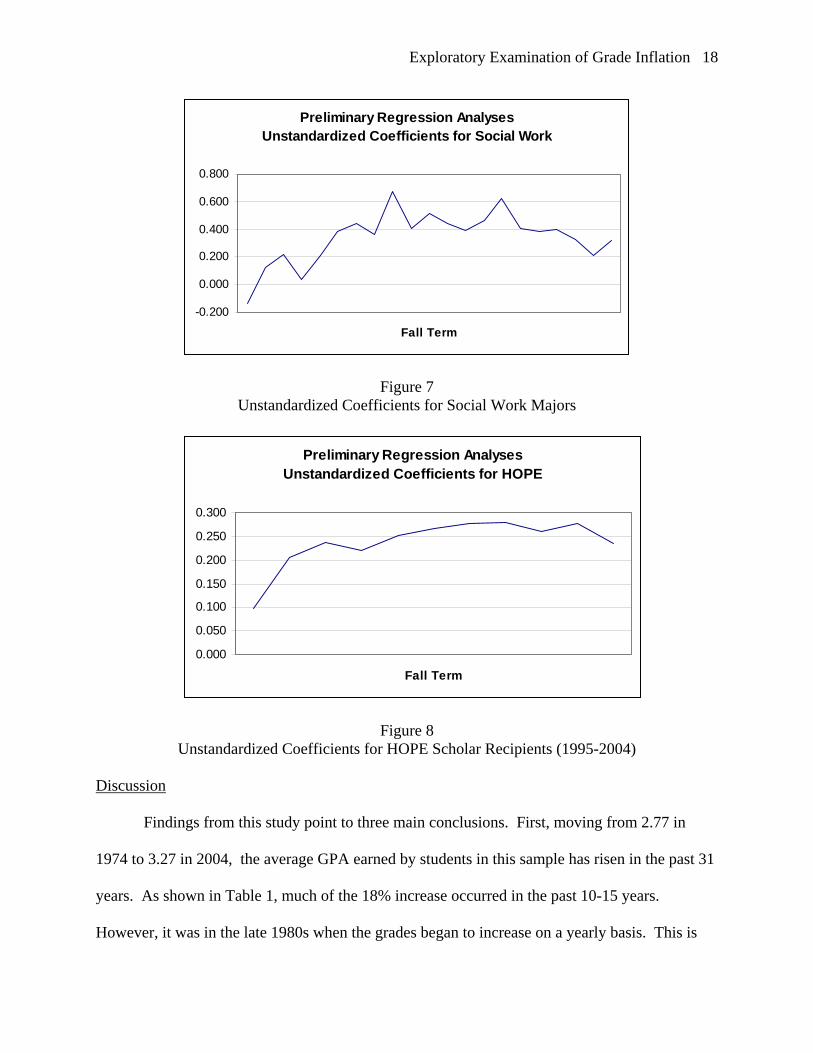
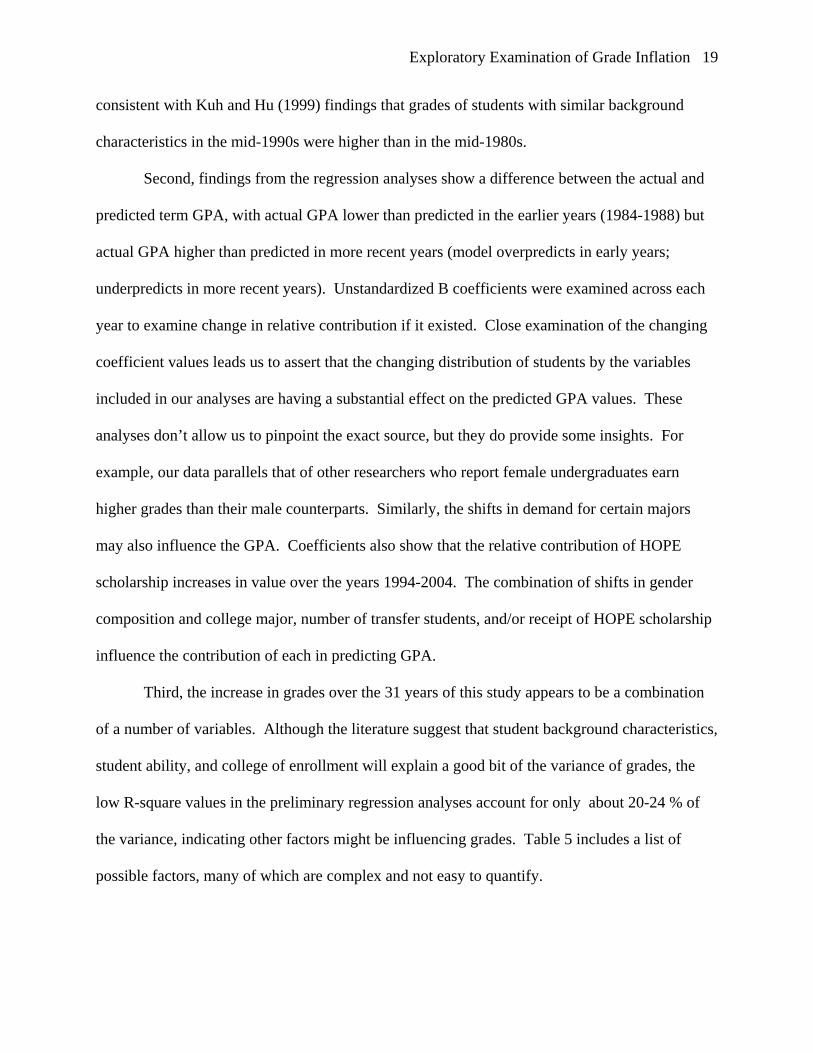
Similar changes are seen in Figures 6 through 8 for Agriculture, Social Work, and receipt of the
HOPE Scholarship.
Preliminary Regression Analyses Unstandardized Coefficients for Gender
0.0000.0200.0400.0600.0800.1000.1200.1400.160
Fall Term
Figure 5 Unstandardized Coefficients for Gender 1984-2004
Preliminary Regression Analyses Unstandardized Coefficients for Agriculture Majors
-0.400
-0.300
-0.200
-0.100
0.000
0.100
Fall Term
Figure 6 Unstandardized Coefficients for Agricultural Majors 1984-2004
Exploratory Examination of Grade Inflation 18
Preliminary Regression Analyses Unstandardized Coefficients for Social Work
-0.200
0.000
0.200
0.400
0.600
0.800
Fall Term
Figure 7 Unstandardized Coefficients for Social Work Majors
Preliminary Regression Analyses Unstandardized Coefficients for HOPE
0.000
0.050
0.100
0.150
0.200
0.250
0.300
Fall Term
Figure 8 Unstandardized Coefficients for HOPE Scholar Recipients (1995-2004)
Discussion
Findings from this study point to three main conclusions. First, moving from 2.77 in
1974 to 3.27 in 2004, the average GPA earned by students in this sample has risen in the past 31
years. As shown in Table 1, much of the 18% increase occurred in the past 10-15 years.
However, it was in the late 1980s when the grades began to increase on a yearly basis. This is
Exploratory Examination of Grade Inflation 19
consistent with Kuh and Hu (1999) findings that grades of students with similar background
characteristics in the mid-1990s were higher than in the mid-1980s.
Second, findings from the regression analyses show a difference between the actual and
predicted term GPA, with actual GPA lower than predicted in the earlier years (1984-1988) but
actual GPA higher than predicted in more recent years (model overpredicts in early years;
underpredicts in more recent years). Unstandardized B coefficients were examined across each
year to examine change in relative contribution if it existed. Close examination of the changing
coefficient values leads us to assert that the changing distribution of students by the variables
included in our analyses are having a substantial effect on the predicted GPA values. These
analyses don’t allow us to pinpoint the exact source, but they do provide some insights. For
example, our data parallels that of other researchers who report female undergraduates earn
higher grades than their male counterparts. Similarly, the shifts in demand for certain majors
may also influence the GPA. Coefficients also show that the relative contribution of HOPE
scholarship increases in value over the years 1994-2004. The combination of shifts in gender
composition and college major, number of transfer students, and/or receipt of HOPE scholarship
influence the contribution of each in predicting GPA.
Third, the increase in grades over the 31 years of this study appears to be a combination
of a number of variables. Although the literature suggest that student background characteristics,
student ability, and college of enrollment will explain a good bit of the variance of grades, the
low R-square values in the preliminary regression analyses account for only about 20-24 % of
the variance, indicating other factors might be influencing grades. Table 5 includes a list of
possible factors, many of which are complex and not easy to quantify.

Exploratory Examination of Grade Inflation 20
Changing demographics of the student body may be influencing grades received. Within
the sample, the population has shifted from a majority of male (51% in 1974) to one that is
majority female (57% in 2004). The unstandardized coefficients in all regression models
developed show a positive coefficient indicating females earn higher GPAs than males. Non-
white students now make up over 14% of the student population, up from just 4% in the mid
1970s. However, the negative beta coefficient indicates that non-white students earned lower
grades than whites. With the growing number of females and non-white students within the
study body, the possibility that these characteristics are influencing grades is likely.
Clearly, student ability as defined by SAT scores has increased over the 31 year period.
However, this increase is not at the same pace as the increase in term GPA. Examining these
descriptive changes might lead one to reach the conclusion that grade inflation exists, but we’re
not certain that the answer is that simple. The regression analyses show there is much
unaccounted for variance in predicted GPA and the relative contribution of the variables
included varies over the 21 year period. These two findings taken together lead us to the
conclusion that the influence of SAT, HS GPA, gender, race, and college of major are important
yet only a part of the full answer.
Many other factors may contribute, and many of these are hard to quantify. For example,
many students now enroll in SAT/ACT preparation classes for the sole purpose to raise their test
scores. While these preparation classes raise student’s scores, do they really improve the level of
knowledge of a student? With the issues associated with standardized tests as a measure of
student ability, to conclude that grade inflation has or has not occurred based solely on the
percentage change of SAT scores and term GPA cannot be accurate.
Exploratory Examination of Grade Inflation 21
In addition, students may be able to manipulate their grade by judiciously choosing
classes they take. Students may be able to “game” the system to their advantage by enrolling in
courses and withdrawing before scores are posted. Based on more generalized data from IR Fact
Books at this institution, we see that undergraduates had a higher rate of withdrawals in the past
ten years compared to earlier years. Are students learning to keep their GPA up by withdrawing
at the last moment?
Changes in faculty demographics, attitudes toward teaching, and/or the distribution of
faculty (by level of courses taught) may also contribute. In 1974, 51% of the lower level
undergraduate courses were taught at UGA by either full, associate, or assistant professors. In
2004, only 44% of lower level undergraduate courses were taught by full, associate, or assistant
professors. For upper division courses in 1974, 78% of undergraduate course were taught by
full, associate, or assistant professors. In 2004, 66% of upper level undergraduate courses were
taught by full, associate, and assistant professors. These shifts indicate that more undergraduate
students are being taught by part-time faculty and graduate students in the later years of this
study. This shift away from the traditional professorial faculty coincides with rising grades. Do
part-time faculty and graduate assistants assign higher grades?
The rewards for faculty to teach and teach well on a research-extensive campus may be
decreasing over the years. Faculty promotion is very dependent on the faculty member’s
research, not necessarily their ability as an instructor. A faculty member who is a good
researcher is well known throughout their field while a good teacher, is usually only well known
on their campus. While the faculty rewards system has been in place for some time, the financial
incentives through research contracts, grants, and even salary available has grown tremendously
Exploratory Examination of Grade Inflation 22
in the later part of this study. This suggests that the role of rewards for faculty to teach needs to
be considered.
The American Academy of Arts and Sciences commissioned a report to investigate grade
inflation (Rosovky & Hartley, 2002). One of the causes suggested is that faculty members are
giving higher grades in return for higher teaching evaluations. Johnson’s (2003) findings also
support this notion. A faculty member not wanting to or having the time to deal with
undergraduate students can give higher grades to appease them. This undoubtedly casts the
faculty member in a more positive light in the eyes of the undergraduate student. This indicates
that the correlation of positive faculty evaluations and grades given needs to be taken into
account.
For contextual issues, pedagogical changes since 1974 have most assuredly affected
course content, method of teaching, and criteria for evaluation for every discipline. While for
some disciplines this change has been relatively small, for others the change has been
tremendous. Students and faculty now communicate and learn via internet, email, PowerPoint,
and with digitized libraries have more access to information than ever before. Does access to
information necessarily equate to more learning? The difficulty in capturing these changes and
their direct impact on learning in a quantifiable manner gives credibility to the notion that this
issue needs to be considered.
Limitations
Findings from this study are limited in several ways. First, this study’s sample was
drawn from a single institution, thus generalizations to students at other institutions can not be
made. Second, analyses presented assume that the courses students have enrolled in are similar
in content and instructional methodology over the period. We recognize that pedagogical

Exploratory Examination of Grade Inflation 23
changes within some fields have been dramatic over the past 30 years and how to capture this
dynamic was discussed at length, but no adequate measure was devised (or conceived).
Third, changes in the demographics of the institution have occurred over the 30 year
period and many of these changes are difficult to quantify in a study as such as this. We
recognize shifts in the percentage of students by gender and race (Table 1) and the relative
contribution of college of major, likely in part due to shifts in distribution of students by major.
Average SAT scores were used as a proxy for student ability in this study. However, the
use of SAT scores as a measure of student ability does have its limitations, yet another adequate
alternative eluded us. Standardized achievement tests (e.g., SAT) are designed to predict first
year GPA for students, not necessarily to describe the level of ability of a student.
Concerns about collinearity are raised due to the mix of variables included in the
regression analyses. A prime example is the receipt of the HOPE scholarship (in first year of
college) which is dependent on high school grades. Collinearity statistics (VIF and tolerance
statistic) were developed for each of the independent variables for all the regressions (whole
model 84-04 as well as for each individual year) and all fell within acceptable ranges (VIF
around 1.0 and tolerance above .5 for all variables). The collinearity diagnostic also shows
evidence supporting the notion that no dependency between variables exists. Finally, a re-check
of the correlations between variables shows no correlations between these variables higher than
.428. (For complete collinearity and diagnostic statistics for any of the regression models, please
contact the authors directly).
The time dimension of the study calls for an examination of the estimated standard errors
which, if violated, would cause the estimated standard errors to be biased downward. This
would lead researchers to mistakenly declare a coefficient significant when in fact it is not
Exploratory Examination of Grade Inflation 24
(Ethington, Thomas, & Pike, 2002). The Durbin-Watson autocorrelation statistic for each of the
models was around 2.0, with the lowest score showing in the 1.5/1.6 range. This finding
indicates the assumption of independent errors has been met.
Implications
In responding to the question on whether there is grade inflation found in this study the
answer is not a clear one. While it appears that an increase in grades has outpaced the increase in
ability (SAT score), to definitively state that grade inflation is occurring in this study is not
appropriate. The low R-square values indicate likelihood that there are number of factors outside
of the models that are contributing to the grades students receive. This study has identified a
number of those factors, but faces a real challenge in defining how to measure those other
factors.
The American Academy of Arts and Sciences report on grade inflation (Rosovky &
Hartley, 2002) offers the best piece of advice in stating that “each institution has to determine
and be responsible for its own standards, and the best beginning is awareness of the issues” (p.1).
Results of this study can assist IR professionals to determine the major issues for his/her campus
and guide campus discussions on changes in grade. In addition to the contributing factors
discussed above, another question to include in the discussion would be “do grades actually tell
us how well students are doing?” For example, at the University of ---, does the rise in the term
GPA really indicate grade inflation, or is the change in grades a tangled mix of many factors? In
light of findings and implications, researchers in this study urge caution in interpretation and
further study with additional factors related to grade inflation.

Exploratory Examination of Grade Inflation 25
References
Birnbaum, R. (1977). Factors Related to University Grade Inflation. The Journal of Higher Education, 48(5), 519-539.
Barndt, R. J. (2001). Fiscal Policy Effects on Grade Inflation. New Foundations. Retrieved September 13, 2004 at http://www.newfoundations.com/Policy/Barndt.html
Bejar, I. I & Blew, E. O. (1981). Grade Inflation and the Validity of Scholastic Aptitude Test. American Educational Research Journal. 18(2), 143-156.
Breland, H. H. (1976). Grade Inflation and Declining SAT Scores: A Research View Point. Paper presented at Annual Meeting of American Psychological Association. Washington, DC (ERIC# ED134610).
Cosgrove, C. (1995). “One Person’s Opinion: How to Deflate Writing Grades: Doing Onto Our Students What We Do unto Ourselves”. The English Journal. 84(3), 15-17.
Ethington, C. A., Thomas, S.L..& Pike, G. R. (2002). Back to the Basics: Regression as it Should Be. Higher Education: Handbook of Theory and Research. Vol. XVII, 263-293.
Farley, B. (1995) A Is for Average: The Grading Crisis in Today’s Colleges. Essay given at Issues of Education at Community Colleges: Essays by Fellows in the Mid-Career Fellowship Program at Princeton University. (ERIC# ED 384384)
Georgia Student Finance Commission (2005) HOPE Scholarship and grant program highlights: A Summary of changes and requirements. Retrieved on April 26, 2005 from http://www.gsfc.org/HOPE/
Hanson, G. R. (1998). Grade inflation: Myth or reality. Student Affairs Research: University of Texas – Austin. Retrieved on September 13, 2004 from http://www.utexas.edu/student/research/reports/Inflation/Inflation.html
Hu, S. (2005). Beyond grade inflation. ASHE Higher Education Report, 30 (6), Hoboken, NJ: Wiley & Co.
Johnson, V. (2003) Grade inflation: A crisis in college education. New York: Springer-Verlag
New York Inc.
Kuh, G, & Hu, S. (1999). Unraveling the Complexity of the Increase in College Grades from the Mid-1980s to the Mid-1990s. Educational Evaluation and Policy Analysis, 21(3).
Levin, A. & Cureton, J. S. (1998). When hope and fear collide: A portrait of today’s college student. San Francisco: Jossey-Bass.

Exploratory Examination of Grade Inflation 26
Merrow, J. (2004, June). Grade Inflation: It’s Not Just an Issue for the Ivy League. Carnegie Perspectives. The Carnegie Foundation for the Advancement of Teaching.
McSpirit, S., & Jones, K. E. (1999) Grade Inflation Rates Among Different Ability Students, Controlling for Other Factors. Educational Policy Analysis Archives, Vol.7, No.30. Retrieved September 14, 2004 from http://epaa.asu.edu/epaa/v7no30.html
Mullen, R. (1995). Indicators of Grade Inflation. Paper presented at 1995 AIR Annual Forum in Boston, Massachusetts. ERIC# ED386970.
Olsen, D. R. (1997). Grade Inflation: Reality or Myth? Student Preparation Level vs. Grades at Brigham Young University, 1975-1994. Paper presented at 1997 AIR Annual Forum in Orlando, Florida. ERIC# ED410880.
Prather, J. E., Smith, G., & Kodras, J. E. (1979). A Longitudinal Study of Grades in 144 Undergraduate Courses. Research in Higher Education. 10(1), 11-24.
Reischauer, R., Gladieux, L. (1996). Higher Tuition, More Grade Inflation. Washington Post. September 4, 1996. Retrieved September 13, 2004 from http://www.brookings.edu/views/op-ed/reischauer/19960904.htm
Rojstaczer, S. (2003). Grade Inflation at American Colleges and Universities. Retrieved September 13, 2004 from http://www.Gradeinflation.com
Rosovsky, H.& Hartley M. (2002) Evaluation and the academy: Are we doing the right thing?
Grade inflation and letters of recommendation. Report for the American Academy of Arts and Sciences. Cambridge, MA: American Academy of Arts and Sciences.
Stone, J.E. (1995). Inflated Grades, Inflated Enrollment, and Inflated Budgets: An Analysis and Call for Review at the State Level. Educational Policy Analysis Archives, 3(11), Retrieved September 14, 2004 from http://epaa.asu.edu/epaa/v3n11.html
Student Academic and Financial Affairs Committee (2003, Spring). Definitions, interpretations,
and data: Grading and grade inflation at Georgia Tech. Atlanta: Georgia Institute of Technology, Academic Senate.
Wilson, B. (1999). The Phenomenon of Grade Inflation in Higher Education. National Forum,
79, Fall, 38-41.

Exploratory Examination of Grade Inflation 27
Table 5 List of possible contributing factors for grade inflation
Students:
• Changing demographics of student body o In ’04, UGA’s student body is more female than male; in ’74 the opposite o Changing distribution of majors – some majors have higher GPA than other
majors o Level of preparedness of students o % of students who are international students
• Increased attention & sensitivity to personal crisis situations of students • Students are able to withdraw from courses in which they are receiving poor grades
before a grade is recorded into the transcript o Question about change in # of withdrawals over time (see grade distribution)
• Students are able to manipulate their GPA through judicious choice of classes o How does information such as “the key” affect student choice of courses?
Key was started in 94-95 o How does student choice of majors affect classes enrolled in and grades?
• Student financial situations o Students influence faculty to give higher grades – not to loose scholarships o HOPE
Does receipt of HOPE influence student’s course choices? Do students with HOPE try to persuade faculty for higher grades?
• Academic load of students • Applied skills versus learning for sake of learning (liberal learning)
o Students taking courses for applied skills learned • Grade distribution
o What is the distribution of As, Bs, Cs, Ds, Etc. over the 30 year period? o Changes in grades over the years by:
Class level Transfer student status
• What are the GPAs over the 30 year period by major/college/department? Context:
• Pedagogical changes within fields • Institutional pressures to retain students
o Cheaper to keep students than recruit students to replace students who drop out • Technology changes course content & delivery • Content deflation
o Ex: large class sections provide incentive to lower # of assigned papers, homework, and expectations of reading
• Institutions changing mission • Has criteria shifted for grading? Regardless of student ability? • When UGA President in the 1990s made decision/statement to begin restrictive
admissions, did changes in GPA/SAT occur after that?
Exploratory Examination of Grade Inflation 28
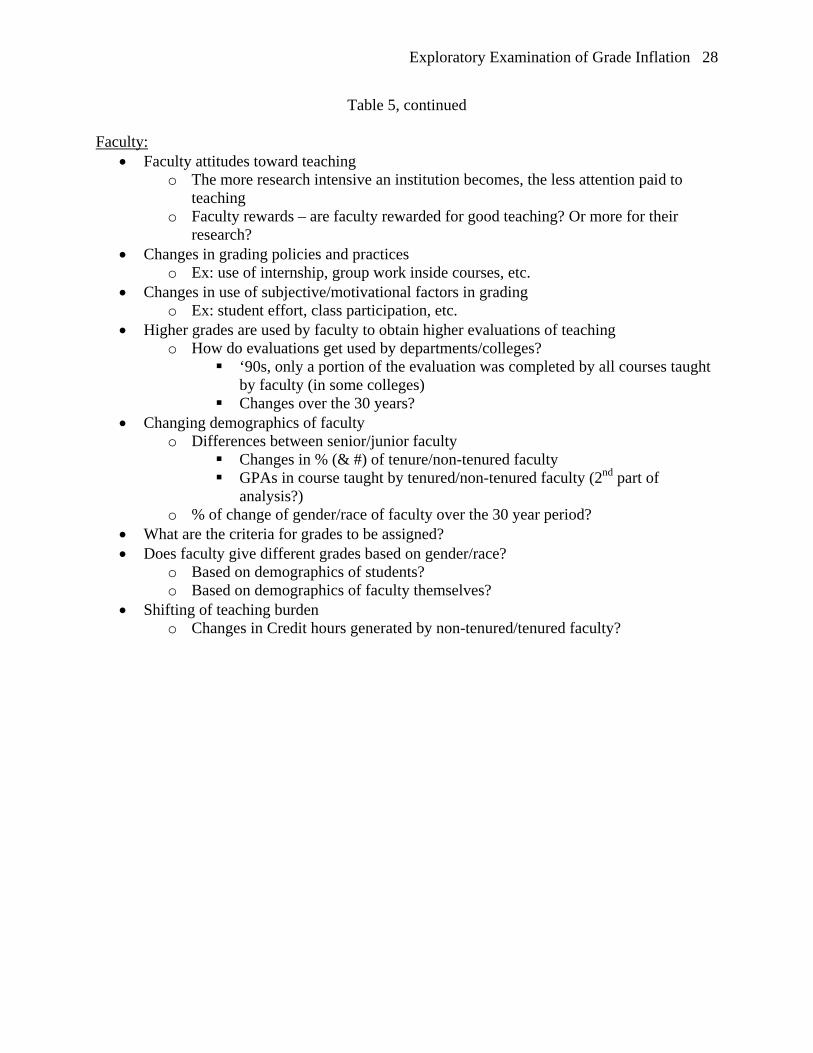
Table 5, continued Faculty:
• Faculty attitudes toward teaching o The more research intensive an institution becomes, the less attention paid to
teaching o Faculty rewards – are faculty rewarded for good teaching? Or more for their
research? • Changes in grading policies and practices
o Ex: use of internship, group work inside courses, etc. • Changes in use of subjective/motivational factors in grading
o Ex: student effort, class participation, etc. • Higher grades are used by faculty to obtain higher evaluations of teaching
o How do evaluations get used by departments/colleges? ‘90s, only a portion of the evaluation was completed by all courses taught
by faculty (in some colleges) Changes over the 30 years?
• Changing demographics of faculty o Differences between senior/junior faculty
Changes in % (& #) of tenure/non-tenured faculty GPAs in course taught by tenured/non-tenured faculty (2nd part of
analysis?) o % of change of gender/race of faculty over the 30 year period?
• What are the criteria for grades to be assigned? • Does faculty give different grades based on gender/race?
o Based on demographics of students? o Based on demographics of faculty themselves?
• Shifting of teaching burden o Changes in Credit hours generated by non-tenured/tenured faculty?

Exploratory Examination of Grade Inflation 29
Table 4 Unstandardized B Coefficients
Year R R-
square Constant GenderWhite/Non-
White SAT Journalism Agricul Education Family Forest Social Whole Model 84-
04 0.511 0.262 0.197 0.098 -0.122 0.001 0.309 -0.092 0.224 0.150 -0.061 0.420 1984 0.500 0.250 0.064 0.054 -0.157 0.001 0.080 -0.360 -0.209 -0.213 -0.537 -0.135 1985 0.475 0.225 -0.135 0.064 -0.207 0.001 0.306 -0.178 0.105 0.038 -0.295 0.119 1986 0.482 0.233 -0.226 0.029 -0.212 0.001 0.304 -0.103 0.301 0.226 -0.226 0.216 1987 0.481 0.232 -0.151 0.031 -0.096 0.001 0.323 0.013 0.363 0.290 -0.148 0.036 1988 0.462 0.214 -0.035 0.079 -0.144 0.001 0.426 0.043 0.379 0.304 0.053 0.209 1989 0.456 0.208 0.001 0.065 -0.153 0.001 0.404 0.011 0.404 0.271 0.157 0.382 1990 0.456 0.208 -0.063 0.088 -0.169 0.001 0.374 -0.046 0.347 0.289 -0.047 0.447 1991 0.433 0.187 0.210 0.085 -0.153 0.001 0.361 -0.050 0.352 0.244 -0.171 0.361 1992 0.447 0.200 0.200 0.078 -0.172 0.001 0.378 -0.037 0.328 0.287 0.001 0.671 1993 0.431 0.186 0.333 0.081 -0.137 0.001 0.395 -0.100 0.311 0.306 -0.032 0.406 1994 0.451 0.203 0.382 0.094 -0.165 0.001 0.319 -0.126 0.226 0.173 -0.116 0.518 1995 0.464 0.215 0.548 0.079 -0.176 0.001 0.293 -0.047 0.271 0.277 -0.052 0.445 1996 0.455 0.207 0.629 0.117 -0.169 0.001 0.318 -0.069 0.253 0.189 -0.054 0.391 1997 0.456 0.208 0.504 0.094 -0.078 0.001 0.279 -0.048 0.260 0.210 -0.027 0.462 1998 0.467 0.218 0.493 0.104 -0.093 0.001 0.263 -0.129 0.089 0.115 -0.042 0.626 1999 0.474 0.225 0.322 0.144 -0.107 0.001 0.236 -0.213 0.098 0.078 -0.110 0.402 2000 0.458 0.210 0.500 0.091 -0.126 0.001 0.302 -0.126 0.127 0.124 -0.052 0.385 2001 0.459 0.211 0.453 0.138 -0.082 0.001 0.375 -0.099 0.178 0.113 -0.046 0.399 2002 0.464 0.216 0.419 0.150 -0.118 0.001 0.251 -0.139 0.115 0.019 -0.100 0.322 2003 0.476 0.226 0.380 0.122 -0.101 0.001 0.177 -0.197 0.049 -0.088 -0.149 0.211 2004 0.472 0.223 0.469 0.137 -0.106 0.001 0.139 -0.266 -0.005 -0.094 -0.154 0.315

Exploratory Examination of Grade Inflation 30
Table 4, continued
Year Environ A&S Bio
A&S F Art
A&S L&L
A&S Phy
A&S Soc
A&S other SPIA
HS GPA transfer Hope
Whole Model 84-04 0.231 -0.057 0.150 0.059 -0.160 0.043 -0.101 0.066 0.435 0.118 0.227
1984 -0.255 -0.199 -0.138 -0.157 -0.349 -0.235 -0.461 0.459 0.144 1985 0.174 0.000 0.025 -0.004 -0.214 -0.061 -0.194 0.467 0.168 1986 0.210 0.026 0.134 0.039 -0.115 0.033 -0.147 0.498 0.208 1987 0.145 -0.006 0.152 0.005 -0.113 0.048 -0.166 0.496 0.166 1988 0.190 -0.056 0.171 0.114 -0.074 0.122 -0.146 0.480 0.120 1989 0.132 -0.055 0.250 0.161 -0.013 0.091 -0.112 0.460 0.160 1990 0.241 -0.098 0.196 0.112 -0.149 0.118 -0.152 0.448 0.103 1991 0.264 0.001 0.213 0.128 -0.096 0.113 -0.050 0.444 0.112 1992 0.264 -0.048 0.130 0.099 -0.064 0.077 -0.106 0.464 0.145 1993 0.209 -0.088 0.148 0.095 -0.191 0.055 -0.168 0.443 0.108 1994 0.099 -0.100 0.119 0.016 -0.250 -0.001 -0.116 0.450 0.140 0.098 1995 0.204 -0.051 0.118 0.033 -0.185 0.066 -0.100 0.418 0.102 0.206 1996 0.229 -0.045 0.174 0.069 -0.109 0.024 -0.063 0.312 0.089 0.238 1997 0.369 -0.054 0.186 0.059 -0.109 0.055 -0.092 0.360 0.086 0.222 1998 0.196 -0.121 0.124 0.044 -0.258 0.005 -0.112 0.393 0.077 0.251 1999 0.177 -0.180 0.105 -0.047 -0.226 0.004 -0.134 0.418 0.126 0.268 2000 0.235 -0.028 0.139 -0.038 -0.162 0.024 -0.084 0.394 0.072 0.277 2001 0.345 -0.006 0.195 0.134 -0.095 0.082 -0.010 0.382 0.096 0.279 2002 0.228 -0.036 0.152 0.026 -0.167 -0.015 -0.084 0.039 0.383 0.055 0.260 2003 0.229 -0.112 0.106 -0.019 -0.233 -0.046 -0.107 -0.040 0.399 0.060 0.277 2004 0.105 -0.139 0.028 -0.068 -0.252 -0.119 -0.147 -0.078 0.404 0.029 0.236