© this is a licensed product of ken research and should … landscape of major players in online...
TRANSCRIPT

1
© This is a licensed product of Ken Research and should not be copied

2
© This is a licensed product of Ken Research and should not be copied
TABLE OF CONTENTS
1. India Used Car Market Introduction
2. Value Chain Analysis of Used Car Industry in India
3. India Used Car Market Size, FY’2008-FY’ 2013
3.1. By Volume, FY’2008- FY’2013
3.2. By Value, FY’2008-FY’2013
4. India Used Car Market Segmentation
4.1. By Organizational Structure
4.1.1. By Value, FY’2013
4.1.2. By Volume, FY’2008-FY’2013
4.2. By Types of Used Cars by Value and Volume, FY’2013
4.2.1. By Value, FY’2013
4.2.2. By Volume, FY’2013
4.3. By Type of Distribution Channels, FY’2013
4.4. By Type of Marketing Channels, FY’2013
4.5. By Major Cities in India by Volume, FY’2013
5. Trends and Developments in Used Car Industry in India
Increasing Popularity of Used Cars
Emergence of Online Auto Portals
Greater Offerings to Customers by Online Channels
6. Government Regulations in Used Car Industry in India
Regulations on Import of Used Cars
Bank Loans for Used Cars
7. Market Share of Major Players in the Used Car Market in India
7.1. By Volume, FY’2013
7.2. By Revenue, FY’2013
8. Company Profiles of Major Players in Used Car Industry in India

3
© This is a licensed product of Ken Research and should not be copied
8.1. Maruti True Value (MTV)
8.1.1. Business Overview
8.1.2. Certification Process of Used Cars by MTV
8.1.3. Business Strategies
8.2. Tata Motors Assured (TMA)
8.2.1. Business Overview
8.2.2. Certification Process of Used Cars by TMA
8.2.3. Business Strategies
8.3. Mahindra First Choice Wheels Limited (MFCWL)
8.3.1. Business Overview
8.3.2. Certification Process of Used Cars by MFCWL
8.3.3. Business Strategies
8.4. Hyundai advantage (HA)
8.4.1. Business Overview
8.4.2. Certification Process of Used Cars by HA
8.4.3. Business Strategies
8.5. Honda Auto Terrace (HAT)
8.5.1. Business Overview
8.5.2. Certification Process of Used Cars by Honda Auo Terrace
8.5.3. Business Strategies
9. India Used Car Market Future Outlook and Projections, FY’2014-FY’2018
9.1. Cause and Effect Relationship between Dependent and Independent Factors of the Used Car Market in India
10. India Online Used Car Market Introduction
10.1. India Online Used Car Market Size, FY’2008-FY’2013
10.2. Customer Profile of Online Used Car Buyers in India
10.3. Market Share of Major Players in Online Used Car Market in India, FY’2013

4
© This is a licensed product of Ken Research and should not be copied
10.4. Competitive Landscape of Major Players in Online Used Car Industry in India
10.4.1. CarWale.com
Company Overview
Key Performance Indicators of Car Wale and Future Endeavors
10.4.2. CarTrade.com
Company Overview
Key Developments and Future Endeavors:
10.4.3. CarDekho.com
Company Overview
Key Performance Indicators of Car Wale and Future Endeavors
10.4.4. Gaadi.com
Company Overview
Key Performance Indicators of Gaadi.com and Future Endeavors
Location of Dealerships
10.5. India Online Used Car Market Future Outlook and Projections, FY’2014 – FY’2018
11. Macroeconomic Indicators of India Used Car Market: Historical and Projections
11.1. Total Passenger Vehicle Sales in India, FY’2008-FY’2018
11.2. Personal Disposable Income in India, FY’2008 – FY’2018
11.3. Population in India, 2008-2018
11.4. Number of Internet Users in India, 2008-2018
12. Appendix
12.1. Market Definition
12.2. Abbreviations
12.3. Research Methodology
Data Collection Methods
Approach
Variables (Dependent and Independent)

5
© This is a licensed product of Ken Research and should not be copied
Multi Factor Based Sensitivity Model
Final Conclusion
12.4. Disclaimer

6
© This is a licensed product of Ken Research and should not be copied
LIST OF FIGURES
Figure 1: Linking of the Value Chain of India’s Automotive Industry with Used Car Market in India
Figure 2: India Used Car Market Size by Number of Cars Sold in Million Units, FY’2008 – FY’2013
Figure 3: India Used Car Market Size by Revenue Generated in INR Million, FY’2008 – FY’2013
Figure 4: India Used Car Market Segmentation by Organized and Unorganized Market Structure on the Basis of Revenue Contribution in Percentage (%), FY’2013
Figure 5: India Used Car Market Segmentation by Unorganized and Organized Market Structure on the Basis of Volume Contribution in Percentage (%), FY’2008-FY’2013
Figure 6: India Used Car Market Segmentation by Types of Cars on the Basis of to Revenue Contribution in Percentage (%), FY’2013
Figure 7: India Used Car Market Segmentation by Types of Cars on the Basis of Contribution to Volume in Percentage (%), FY’2013
Figure 8: India Used Car Market Segmentation by Types of Distribution Channels on the Basis of Contribution to Revenue in Percentage (%), FY’2013
Figure 9: India Used Car Market Segmentation by Types of Marketing Channels on the Basis of Contribution to Revenue in Percentage (%), FY’2013
Figure 10: India Used Car Market Segmentation by Major Cities in India on the Basis of their Contribution to Volume in Percentage (%), FY’2013
Figure 11: India Used Car Market Share of Major Players on the Basis of Contribution to Revenue in Percentage (%), FY’2013
Figure 12: India Used Car Market Future Projections by Revenue in INR Million and Number of Used Cars Sold in Million, FY’2014-FY’2018
Figure 13: Top 10 Most Popular Models of Used Cars by Make Sold Online in India in Percentage (%), 2013
Figure 14: India Online Used Car Market Size by Revenue Generated in INR Million, FY’2008 -FY’2013
Figure 15: Preferences of Online Used Car Buyers across Different Types of Used Car Models in India in Percentage (%), 2013

7
© This is a licensed product of Ken Research and should not be copied
Figure 16: Percentage (%) of Potential Buyers who searched for Used Cars by Major Online Portals, FY’2013
Figure 17: Percentage (%) of Online Used Car Buyers Opting for Petrol, Diesel and Other Cars, 2013
Figure 18: Percentage (%) of Online Used Car Buyers Opting for Manual and Automatic Transmission, 2013
Figure 19: Preferences of Online Used Car Buyers across Different Brands of Used Car Models in India in Percentage (%), 2013
Figure 20: India Online Used Car Market Future Projections by Revenue in INR Million, FY’2014-FY’2018

8
© This is a licensed product of Ken Research and should not be copied
LIST OF TABLES
Table 1: India Used Car Market Segmentation by Organized and Unorganized Market Structure on the Basis of Revenue in INR Million, FY’2013
Table 2: India Used Car Market Segmentation by Unorganized and Organized Market Structure on the Basis of Number of Cars Sold in Million Units, FY’2008-FY’2013
Table 3: India Used Car Market Segmentation by Types of Cars on the Basis of Revenue Generated in INR Million, FY’2013
Table 4: India Used Car Market Segmentation by Types of Cars on the Basis of Number of Cars Sold in Million Units, FY’2013
Table 5: India Used Car Market Segmentation by Types of Distribution Channels on the Basis of Revenue Generated in INR Million, FY’2013
Table 6: India Used Car Market Segmentation by Types of Marketing Channels on the Basis of Revenue Generated in INR Million, FY’2013
Table 7: India Used Car Market Segmentation by Top Metro Cities in India on the Basis of Number of Used Cars sold in Million Units, FY’2013
Table 8: Market Share of Major Players in India Used Car Market on the Basis of Contribution to Volume in Percentage (%), FY’2013
Table 9: Number of Cars Sold by Major Players in Used Car Market in India, FY’2013
Table 10: Cause and Effect Relationship between Industry Factors and Expected Industry Prospects of India Used Car Market
Table 11: Key Performance Indicators of Used Cars at CarWale.com
Table 12: Customer Preferences and Searches of Used Cars at CarWale.com
Table 13: Correlation Matrix of India Used Car Industry
Table 14: Regression Coefficients Output of Indian Used Car Market

9
© This is a licensed product of Ken Research and should not be copied
INDIA USED CAR MARKET SIZE, FY’2008-FY’ 2013
BY VOLUME, FY’2008- FY’2013
India’s used car market has been subject to several changes over the years due to the entrance of new players and as a result there has been a shift in the way this market has been functioning India’s used car market has grown at a compound annual growth rate of nearly 21.8% in terms of the volume of used cars sold during the period FY’2008 to FY’2013…
Figure: India Used Car Market Size by Number of Cars Sold in Million Units, FY’2008 – FY’2013
1.2
0.0
0.5
1.0
1.5
2.0
2.5
3.0
3.5
FY'2008 FY'2009 FY'2010 FY'2011 FY'2012 FY'2013
Mill
ion
Uni
ts

10
© This is a licensed product of Ken Research and should not be copied
The used car sales in India at ~ million vehicles which are approximately ~ times the sales in the new-car segment as recorded in FY’2013.
BY VALUE, FY’2008-FY’2013
The domestic used car market has been constantly evolving and even though most of the major players have made their entry in the used car segment of the industry, many carmakers are still to
realize the potential of this market. Once they do, the used car market will expand further. In fact, a few auto makers have started making it mandatory for their wholesalers to operate used car outlets where multiple numbers of brands will be on
exhibition. The used car sales in India at 3.22 million vehicles which are approximately ~ times the sales in the new-car segment as recorded in FY’2013…
Figure: India Used Car Market Size by Revenue Generated in INR Million, FY’2008 – FY’2013
0.0
100,000.0
200,000.0
300,000.0
400,000.0
500,000.0
600,000.0
FY'2008 FY'2009 FY'2010 FY'2011 FY'2012 FY'2013
INR
Mill
ion

11
© This is a licensed product of Ken Research and should not be copied
INDIA USED CAR MARKET SEGMENTATION
BY ORGANIZATIONAL STRUCTURE
BY VOLUME, FY’2008-FY’2013
The Indian used car market is in a very nascent stage and dominated by the unorganized sector. A total of 3.2 million used cars were sold in India in FY’2013 and out of that nearly ~cars were sold in the unorganized segment of the market the rest by the organized sector. The unorganized sector does not have a definite structure which makes it unreliable and as a result the organized sector is more credible from the point of view of the consumer…
Figure: India Used Car Market Segmentation by Unorganized and Organized Market Structure on the Basis of Volume Contribution in Percentage (%), FY’2008-FY’2013
86.6%
11.0%
0.0%
10.0%
20.0%
30.0%
40.0%
50.0%
60.0%
70.0%
80.0%
90.0%
100.0%
FY'2008 FY'2009 FY'2010 FY'2011 FY'2012 FY'2013
Perc
enta
ge(%
)
Unorganized Segment Organized Segment

12
© This is a licensed product of Ken Research and should not be copied
Table: India Used Car Market Segmentation by Unorganized and Organized Market Structure on the Basis of Number of Cars Sold in Million Units, FY’2008-FY’2013
Organizational Structure FY’2008 FY’2009 FY’2010 FY’2011 FY’2012 FY’2013
Unorganized Sector 1.1
Organized Sector
Total
BY TYPES OF USED CARS BY VALUE AND VOLUME, FY’2013
BY VALUE, FY’2013
The used car market in India can also be segmented into four major categories of cars. As per industry standards, the A segment consists of entry-level cars with length under 3.6 meters and B segment consists of compact cars with length under 4 meters. Both A and B segments contributed nearly ~% to the revenue generated by the used cars in India, as recorded in FY’2013. The average ticket price of used cars under both A and B segments together is nearly INR ~…

13
© This is a licensed product of Ken Research and should not be copied
Figure: India Used Car Market Segmentation by Types of Cars on the Basis of to Revenue Contribution in Percentage (%), FY’2013
Table: India Used Car Market Segmentation by Types of Cars on the Basis of Revenue Generated in INR Million, FY’2013
Types of Used Cars Revenue Generated (INR Million)
D+ Segment (Luxury Cars )
D Segment (Mid - Executive Cars)
A & B Segment (Entry level & Compact Cars)
C Segment (Mid – Size Cars)
Total
37.9%
28.9%
17.1%
16.1% D+ Segment (Luxury cars > 4.5 meters; price - INR more than 20 lakhs)
D Segment (Mid - executive cars - length > 4 meters; price - INR 10-20 lakhs) A & B Segment ( Entry level & Compact - length under 4 meters; price- upto 5 lakhs) C Segment (Mid-size - length > 4 meters; price - INR 5 to 10 lakhs)

14
© This is a licensed product of Ken Research and should not be copied
BY TYPE OF DISTRIBUTION CHANNELS, FY’2013
The used car market in India can be segmented into a number of distribution channels. These distribution channels facilitate the circulation of used cars from sellers to buyers within the market. Each of these channels may follow a different method of circulating their products and hence they can be categorized as follows:
• Consumer to Consumer (C2C) distribution channel, • Business to Business (B2B) distribution channel, • Business to Consumer (B2C) distribution channel, and • Companies to Companies distribution channel.
Not until 2001, the C2C channel controlled over ~% of the used car sales and this was the case before any of the organized players entered the used car market in India. However, the grip of the C2C channel over this market has weakened slightly over the recent few years and is expected to decline further after the structural changes that the used car market is currently undergoing…
Figure: India Used Car Market Segmentation by Types of Distribution Channels on the Basis of Contribution to Revenue in Percentage (%), FY’2013
Consumer to Consumer
Business to Business
Business to Consumer
Companies to Companies

15
© This is a licensed product of Ken Research and should not be copied
Table: India Used Car Market Segmentation by Types of Distribution Channels on the Basis of Revenue Generated in INR Million, FY’2013
Types of Distribution Channels Revenue Generated (INR Million)
Consumer to Consumer
Business to Business
Business to Consumer
Companies to Companies
Total
BY TYPE OF MARKETING CHANNELS, FY’2013
The used car market in India can also be segmented according to the channels through which marketing is carried out for the sale and purchase of cars. In order to make sure that the right information regarding the value and history of a used car is properly communicated to the buyer; proper channels must be utilized by dealers to deliver the information
Table: India Used Car Market Segmentation by Types of Marketing Channels on the Basis of Revenue Generated in INR Million, FY’2013
Types of Marketing Channels Revenue Generated (INR Million)
Multi Brand Showrooms
Online Auto Portals
Others (such as Word-of-Mouth Channels)
Total

16
© This is a licensed product of Ken Research and should not be copied
BY MAJOR CITIES IN INDIA BY VOLUME, FY’2013
The market for used cars in India can also be segmented amongst the major cities of India. Most of the used car buyers are from cities such as Delhi, Mumbai, Bengaluru, Mumbai and Chennai. The Delhi NCR region witnessed the highest volume of used car sales accounting for approximately ~% of the total volume sold as in FY’2013. After Delhi NCR, comes Bengaluru which had a share of almost ~% of the total volume of used cars sold in FY’2013.
Figure: India Used Car Market Segmentation by Major Cities in India on the Basis of their Contribution to Volume in Percentage (%), FY’2013
Delhi NCR
Bengaluru
Chandigarh
Mumbai
Kolkata
Ahmedabad
Hyderabad
Other Cities
17
© This is a licensed product of Ken Research and should not be copied
MARKET SHARE OF MAJOR PLAYERS IN THE USED CAR MARKET IN INDIA
BY VOLUME, FY’2013
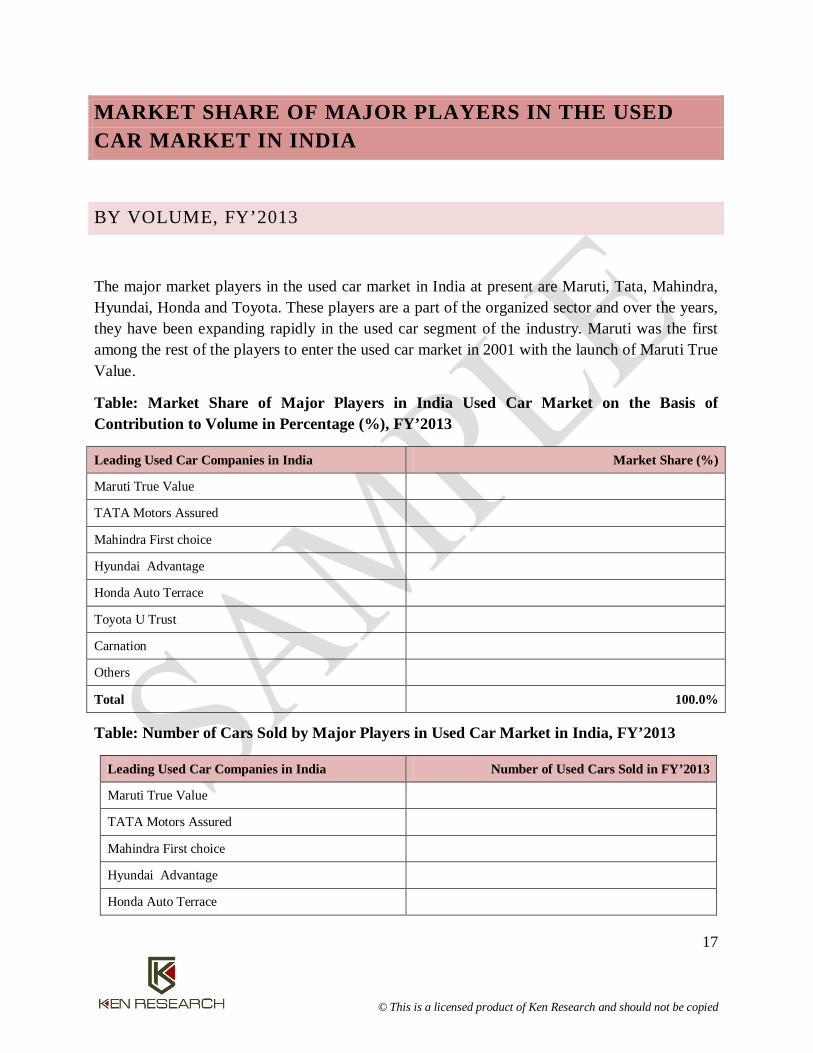
The major market players in the used car market in India at present are Maruti, Tata, Mahindra, Hyundai, Honda and Toyota. These players are a part of the organized sector and over the years, they have been expanding rapidly in the used car segment of the industry. Maruti was the first among the rest of the players to enter the used car market in 2001 with the launch of Maruti True Value.
Table: Market Share of Major Players in India Used Car Market on the Basis of Contribution to Volume in Percentage (%), FY’2013
Leading Used Car Companies in India Market Share (%)
Maruti True Value
TATA Motors Assured
Mahindra First choice
Hyundai Advantage
Honda Auto Terrace
Toyota U Trust
Carnation
Others
Total 100.0%
Table: Number of Cars Sold by Major Players in Used Car Market in India, FY’2013
Leading Used Car Companies in India Number of Used Cars Sold in FY’2013
Maruti True Value
TATA Motors Assured
Mahindra First choice
Hyundai Advantage
Honda Auto Terrace

18
© This is a licensed product of Ken Research and should not be copied
Toyota U Trust
Carnation
Others
Total
INDIA USED CAR MARKET FUTURE OUTLOOK AND PROJECTIONS, FY’2014-FY’2018
In tandem with the escalating growth of the car market in the country, used car sales have also showcased inclining trend over the last few years. With car makers focusing on used-car business in India, the percentage buyers of new vehicles considering buying pre-owned vehicle during their shopping process increased has inclined by 10% in the past 3 years. The major automakers in the country have been increasingly focusing on
In terms of value, the industry is expected to grow at a rate of 19.5% over the period FY’2013-FY’2018 with the revenue reaching to INR ~million by FY’2018 from INR ~ million in FY’2013.

19
© This is a licensed product of Ken Research and should not be copied
Figure: India Used Car Market Future Projections by Revenue in INR Million and Number of Used Cars Sold in Million, FY’2014-FY’2018
INDIA ONLINE USED CAR MARKET SIZE, FY’2008-FY’2013
The online used car market in India generates a large portion of its revenue through advertisements. These advertisements are broadly classified into three types namely, search advertising, display advertising and classifieds.
The revenue generated by the online used car market in India witnessed a consistent increase from FY’2008 to FY’2013, recording a CAGR of ~% during the period. Some of the major online used car players such as CarDekho.com entered in 2008 which increased the pace at which the overall market was growing.
1,061,515
0.0
1.0
2.0
3.0
4.0
5.0
6.0
7.0
8.0
0.0
200,000.0
400,000.0
600,000.0
800,000.0
1,000,000.0
1,200,000.0
1,400,000.0
FY'2014 FY'2015 FY'2016 FY'2017 FY'2018
Mill
ion
INR
Mill
ion
Revenue ( INR Million) Number of Used Cars Sold( Million)

20
© This is a licensed product of Ken Research and should not be copied
Figure: India Online Used Car Market Size by Revenue Generated in INR Million, FY’2008 -FY’2013
COMPETITIVE LANDSCAPE OF MAJOR PLAYERS IN ONLINE USED CAR INDUSTRY IN INDIA
The top three players who are at present leading the online used car market are CarWale.com, CarDekho.com and Gaadi.com. These three companies were initially start-up businesses but they are now flourishing in the automobile sector of e-commerce.
70,591.7
0.0
20,000.0
40,000.0
60,000.0
80,000.0
100,000.0
120,000.0
140,000.0
160,000.0
FY'2008 FY'2009 FY'2010 FY'2011 FY'2012 FY'2013
INR
Mill
ion

21
© This is a licensed product of Ken Research and should not be copied
CARWALE.COM
COMPANY OVERVIEW
Key Developments:
• In 2005, it became the first website in India to consolidate used car inventory across dealers and present it to car buyers as an online marketplace.
• In 2006, the company introduced India’s first Used Car Price Guide. In which a used car buyer or seller could see the actual market value of their vehicle, depending on the car’s model, variant, age, condition, mileage, city and whether they were transacting with a dealer or an individual.
KEY PERFORMANCE INDICATORS OF CAR WALE AND FUTURE ENDEAVORS
• Car Wale, India's largest automotive destination, recorded over 75 lakh visits for the month of November 2013
• ~% of the total number of interested buyers at Car Wale search for Hatchbacks, ~% of them search for Sedans, ~% of them search for SUVs, ~% of them search for luxury cars and the rest ~% search for other types such as MUVs.
Table 1: Key Performance Indicators of Used Cars at CarWale.com
Particulars As of November 2013
Number of Visitors on online websites by potential used car buyers/ sellers
Page Views in a month for non-serious customer
Page Views in a month by a serious customer
% age of customers sticking to one type of car segment
% age of customers sticking to any one price range
Inventory of used cars (daily)
Range of Annual Income of Target Audience

22
© This is a licensed product of Ken Research and should not be copied
DISCLAIMER
The research reports provided by Ken Research are for the personal information of the authorized recipient and is not for public distribution and should not be reproduced or redistributed without prior permission. You are permitted to print or download extracts from this material for your personal use only. None of this material may be used for any commercial or public use.
The information provided in the research documents is from publicly available data and other sources, which are reliable. Efforts are made to try and ensure accuracy of data. With respect to documents available, neither the company nor any of its employees makes any warranty, express or implied, including the warranties of merchantability and fitness for a particular purpose, or assumes any legal liability or responsibility for the accuracy, completeness, or usefulness of any information, apparatus, product, or process disclosed, or represents that its use will not infringe privately owned rights.
The report also includes analysis and views expressed by our research team. The research reports are purely for information purposes. The opinions expressed are our current opinions as of the date appearing in the material and may be subject to change from time to time without notice. Investors should not solely rely on the information contained in the research documents and must make investment decisions based on their own investment objectives, risk profile and financial position. The recipients of this material should take their own professional advice before acting on this information.
Ken Research will not accept returns of reports once dispatched due to the confidentiality of information provided in our reports. In case, a report qualify for return, we will issue a credit, minus shipping charges, of equal value to the original purchase price, toward a future purchase—no refunds. The decision about whether the product return can be accepted or not is solely at our discretion. Any dispute will be subject to laws of India and exclusive jurisdiction of Indian Courts.
No part of this manual or any material appearing may be reproduced, stored in or transmitted on any other Web site without written permission of Ken Research and any payments of a specified fee. Requests to republish any material may be sent to us.