third regional est forum 17-19 march 2008 singapore · third regional est forum 17-19 march 2008...
TRANSCRIPT
THIRD REGIONAL EST FORUM 17-19 MARCH 2008
SINGAPORE
Country ReportMalaysia
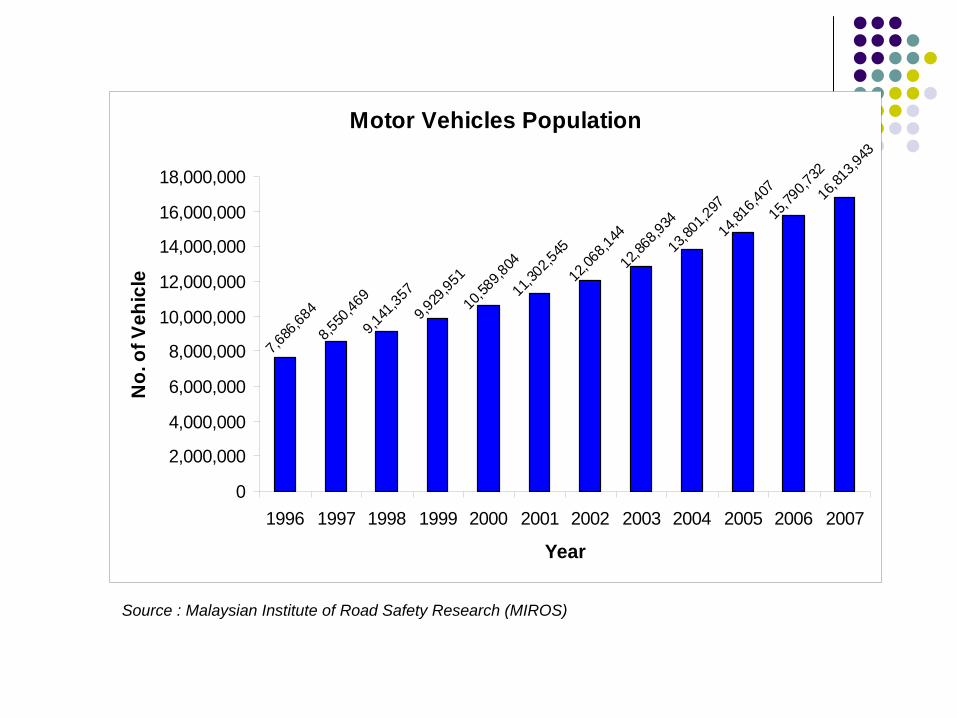
Motor Vehicles Population
7,686
,684
8,550
,469
16,81
3,943
15,79
0,732
14,81
6,407
13,80
1,297
12,86
8,934
12,06
8,144
11,30
2,545
10,58
9,804
9,929
,951
9,141
,357
0
2,000,000
4,000,000
6,000,000
8,000,000
10,000,000
12,000,000
14,000,000
16,000,000
18,000,000
1996 1997 1998 1999 2000 2001 2002 2003 2004 2005 2006 2007
Year
No.
of V
ehic
le
Source : Malaysian Institute of Road Safety Research (MIROS)

No. of Road Accidents & Fatality
189,1
09 215,6
3221
1,037
223,1
66 250,4
1726
5,175
279,2
37 298,6
51 326,8
15
328,2
68
341,2
52
6,304
6,302
5,740
5,794
6,035
5,849
5,887
6,282
6,228
6,200
6,287
0
50,000
100,000
150,000
200,000
250,000
300,000
350,000
1996 1997 1998 1999 2000 2001 2002 2003 2004 2005 2006
Year
Num
bers
No. of AccidentsNo. of Death
Source : Malaysian Institute of Road Safety Research (MIROS)
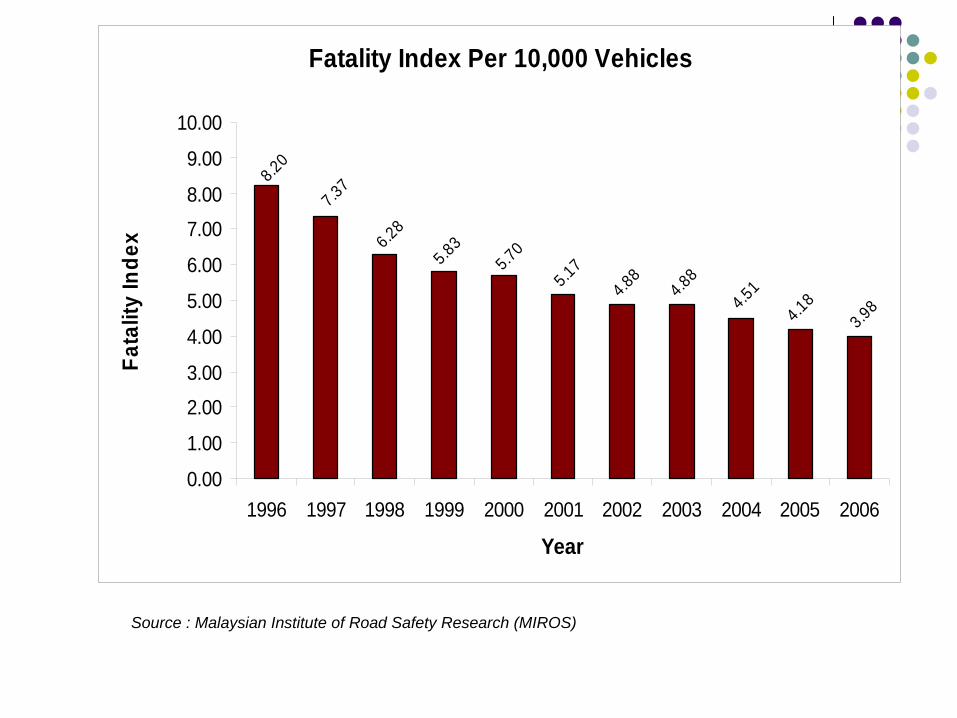
Fatality Index Per 10,000 Vehicles
8.20
7.37
3.984.184.514.88
4.885.175.705.836.28
0.00
1.00
2.00
3.00
4.00
5.00
6.00
7.008.00
9.00
10.00
1996 1997 1998 1999 2000 2001 2002 2003 2004 2005 2006
Year
Fata
lity
Inde
x
Source : Malaysian Institute of Road Safety Research (MIROS)

51 Automatic air quality monitoring stations throughout the country including road site of major cities.
Parameters monitored:PM10 , CO, O3 , NOx , SO2 , Pb.
AIR QUALITY MONITORING
36
289
30 35
289
4
104
205
48 47
276
3462
281
12
67
293
5
54
285
1429
284
47
0
50
100
150
200
250
300
350
Num
ber o
f Day
s
Putrajaya KualaSelangor
Gombak Kajang PetalingJaya
KualaLumpur
Kelang ShahAlam
Area
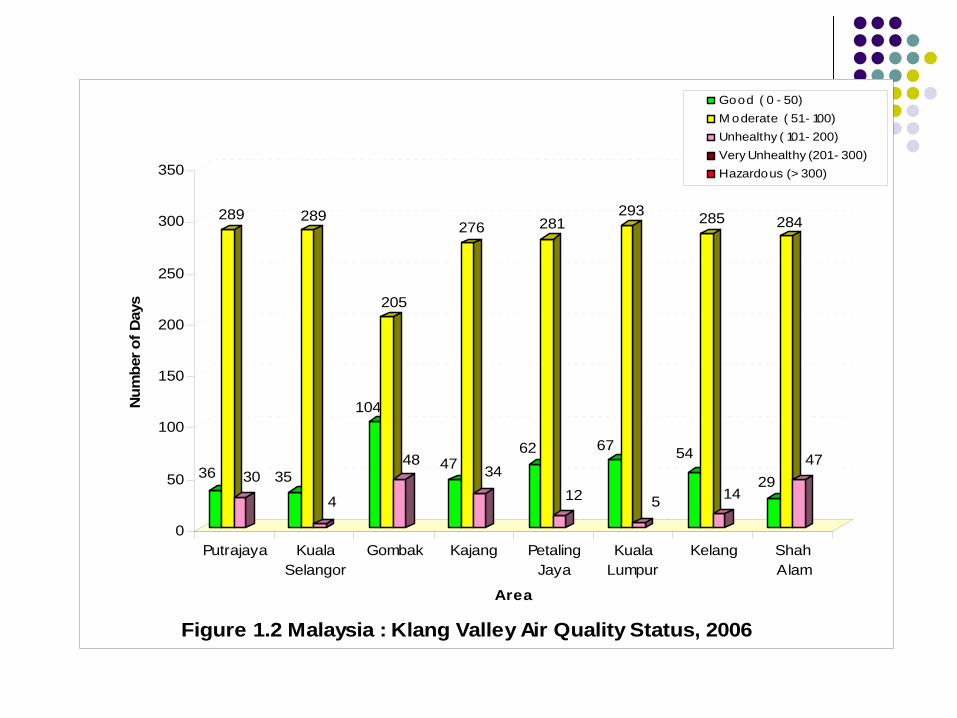
Figure 1.2 Malaysia : Klang Valley Air Quality Status, 2006
Good ( 0 - 50)M oderate ( 51 - 100)Unhealthy ( 101 - 200)Very Unhealthy (201 - 300)Hazardous (> 300)

Malaysia Air Emission Load and Pollutant Sources 2006
Pollutant Overall emission load (tonnes)
Motor Vehicles
Industries Power Plants
Others
CO 1,368,243 98% 1% 1% -
SO2 194,265 9% 21% 50% 20%
PM 29,978 8% 25% 44% 23%
NOx 393,209 70% 24% 6% -
Source : DOE

0.00
0.02
0.04
0.06
0.08
0.10
0.12
0.14
0.16
0.18
Industrial 0.0089 0.0096 0.0093 0.0105 0.0106 0.0104 0.0105 0.0105 0.0105
Urban 0.0141 0.0112 0.0104 0.0113 0.0122 0.0123 0.0122 0.0106 0.0105
Sub Urban 0.0084 0.0062 0.0062 0.0062 0.0065 0.0066 0.0068 0.0069 0.0066
Background 0.0031 0.0030 0.0014 0.0013 0.0018 0.0017 0.0020 0.0026 0.0020
1998 1999 2000 2001 2002 2003 2004 2005 2006
Figure 1.8(a) Malaysia : Annual Average Concentration of Nitrogen Dioxide (NO2) by Land Use, 1998 - 2006
Con
cent
ratio
n (p
pm)
Malaysian Ambient Air Quality Guideline For NO2 = 0.17 ppm

0.00
0.02
0.04
0.06
0.08
0.10
0.12
Industrial 0.0390 0.0380 0.0430 0.0405 0.0413 0.0389 0.0429 0.0431 0.0440
Urban 0.0460 0.0410 0.0490 0.0426 0.0461 0.0428 0.0471 0.0428 0.0429
Sub Urban 0.0390 0.0340 0.0370 0.0348 0.0355 0.0345 0.0363 0.0373 0.0371
Background 0.0280 0.0220 0.0270 0.0279 0.0298 0.0250 0.0287 0.0311 0.0300
1998 1999 2000 2001 2002 2003 2004 2005 2006
Figure 1.9(a) Malaysia : Annual Average Daily Maximum 1 Hour Concentration of Ozone (O3) by Land Use, 1998 - 2006
Con
cent
ratio
n (p
pm)
Malaysian Ambient Air Quality Guideline For O3 = 0.1 ppm

0.0
1.0
2.0
3.0
4.0
5.0
6.0
7.0
8.0
9.0
10.0
Industrial 0.6270 0.5550 0.7390 0.7614 0.7676 0.7405 0.9442 0.8734 0.6777
Urban 1.0670 0.8220 1.0710 1.0091 0.9934 0.9981 0.9632 0.8636 0.6526
Sub Urban 0.8450 0.5200 0.6890 0.7169 0.7187 0.6768 0.6784 0.6335 0.4763
Background 0.4360 0.4480 0.3470 0.3978 0.3182 0.9145 0.3700 0.4582 0.3840
1998 1999 2000 2001 2002 2003 2004 2005 2006
Figure 1.10(a) Malaysia : Annual Average Concentration of Carbon Monoxide (CO) by Land Use, 1998 - 2006
Con
cent
ratio
n (p
pm)
Malaysian Ambient Air Quality Guideline For CO = 9 ppm
0.048 0.024
1.733
0.037
1.233
0.654
0.4070.370
0.280
0.211
0.353
0.230
0.086
0.063 0.045 0.085 0.026 0.0380.053
0.013
1.213
0.159
0.823
0.600
0.4030.345
0.300
0.270
0.0980.054 0.031 0.053 0.025 0.028
0.0700.027 0.021
0.0
0.2
0.4
0.6
0.8
1.0
1.2
1.4
1.6
1.8
Con
cent
ratio
n ( μ
g/m
3 )
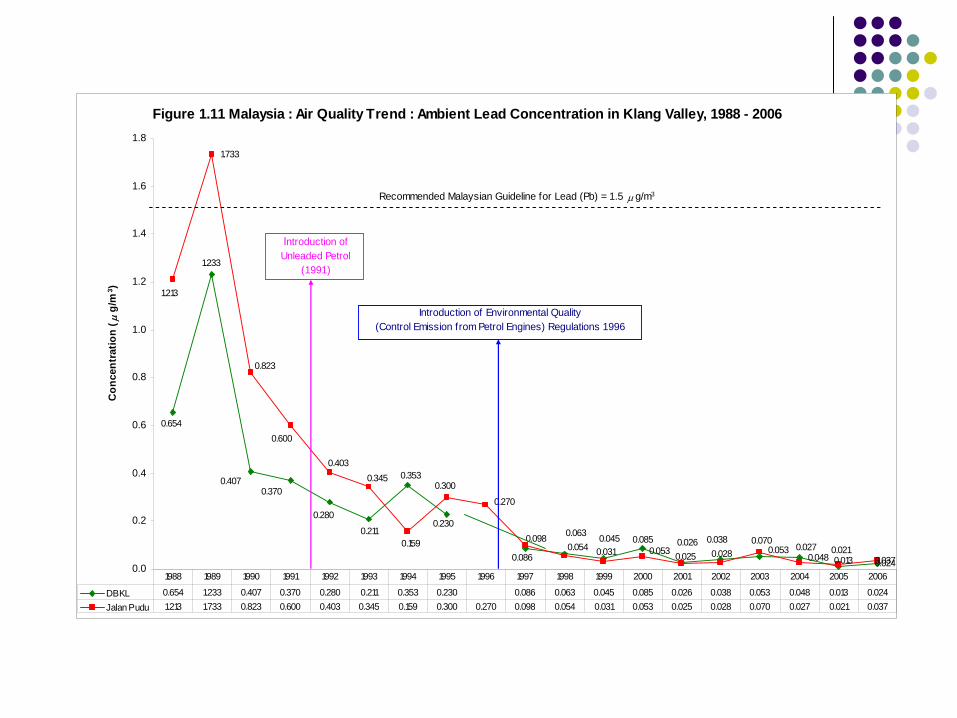
DBKL 0.654 1.233 0.407 0.370 0.280 0.211 0.353 0.230 0.086 0.063 0.045 0.085 0.026 0.038 0.053 0.048 0.013 0.024Jalan Pudu 1.213 1.733 0.823 0.600 0.403 0.345 0.159 0.300 0.270 0.098 0.054 0.031 0.053 0.025 0.028 0.070 0.027 0.021 0.037
1988 1989 1990 1991 1992 1993 1994 1995 1996 1997 1998 1999 2000 2001 2002 2003 2004 2005 2006
Figure 1.11 Malaysia : Air Quality Trend : Ambient Lead Concentration in Klang Valley, 1988 - 2006
Recommended Malaysian Guideline for Lead (Pb) = 1.5 μg/m3
Introduction of Unleaded Petrol
(1991)
Introduction of Environmental Quality (Control Emission from Petrol Engines) Regulations 1996
Ninth Malaysia Plan (2006- 2010)
“Measures will be implemented to improve multimodal public transport, particularly in urban centres, to reduce traffic congestion and air pollution”
POLICY STATEMENT

Department Of Road SafetyEstablished 8 November 2004
Road Map 2005-2010; reduce current fatality of 4.2 deaths per 10,000 vehicles to 2 deaths per 10,000 vehicles by 2010.
Supported by
Malaysia Institute of Road Safety Research (MIROS)Established 3 January 2007
ROAD SAFETY & MAINTENANCE
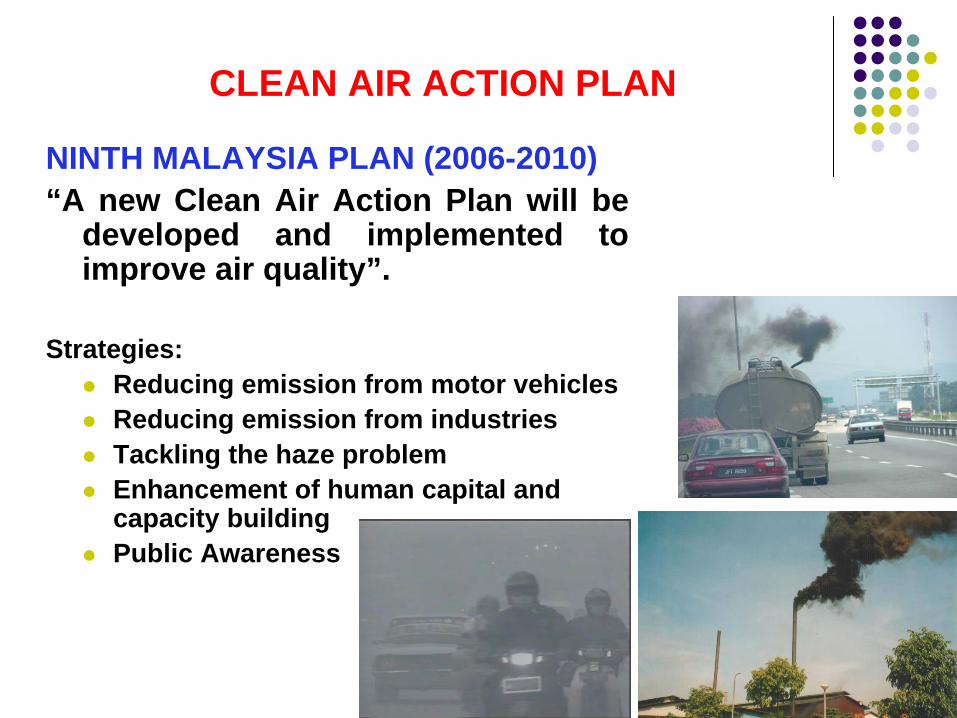
CLEAN AIR ACTION PLAN
NINTH MALAYSIA PLAN (2006-2010)“A new Clean Air Action Plan will be
developed and implemented to improve air quality”.
Strategies:Reducing emission from motor vehiclesReducing emission from industries Tackling the haze problem Enhancement of human capital and capacity buildingPublic Awareness

Emission from motor vehicles is a significant source of air pollution in especially urban areas
Diesel vehicle
Petrol vehicleMotorcycle

ENFORCEMENT
Environmental Quality (Control of Emission from Diesel Engines) Regulations 1996Environmental Quality (Control of Emission from Petrol Engines) Regulations 1996Environmental Quality (Motor Vehicle Noise) Regulations 1987
PK ZAIDI MOHAMEDSeksyen Kawalan PencemaranKenderaan Bermotor

• EURO 1 Standards for diesel vehicles and EURO 2 for petrol vehicles. Working towards EURO 2 and EURO 3 respectively.
• Mandatory six monthly inspection for safety and emission for commercial vehicles.
VEHICLE EMISSION CONTROL AND I/M

• Lead free gasoline since 2000. • ENVO Diesel (5% palm oil + 95%
petroleum diesel) 21 March 2006.• EURO 2 Fuel.
ALTERNATIVE FUEL
NGV promoted since 1989, currently 30,600 NGV on the road.
CLEANER FUEL
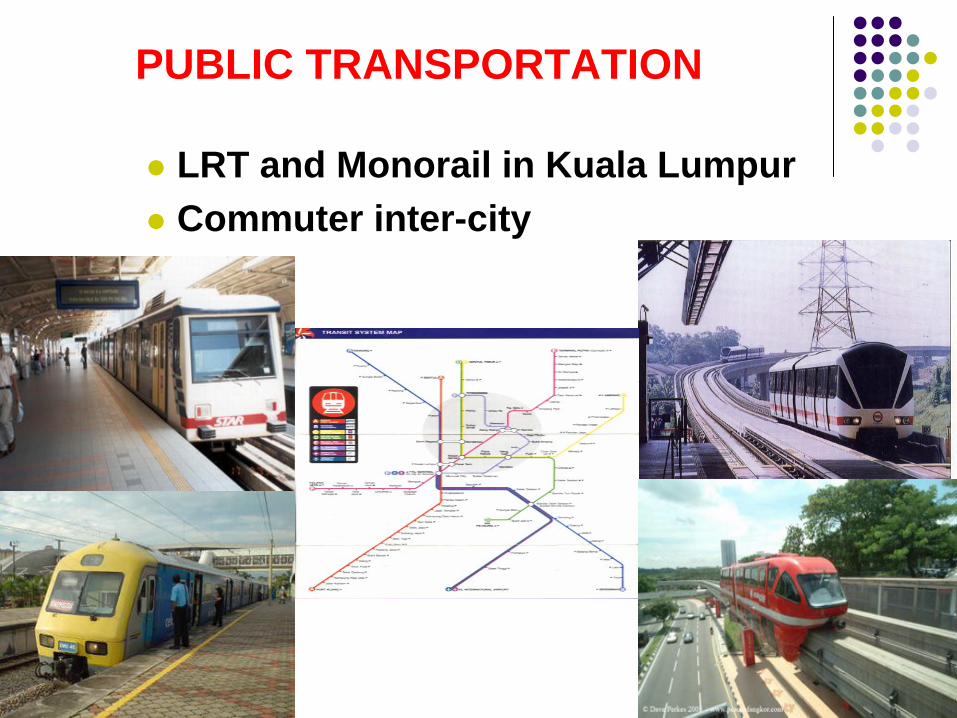
PUBLIC TRANSPORTATION
LRT and Monorail in Kuala LumpurCommuter inter-city

PUBLIC TRANSPORTATION
RapidKLIntegrated rail and bus system in the Klang Valley
4 million passengers per week165 bus routes

PUBLIC TRANSPORTATION
ProposalLRT/monorail in Penang, Putrajayaand Johor BharuAerorail in Melaka
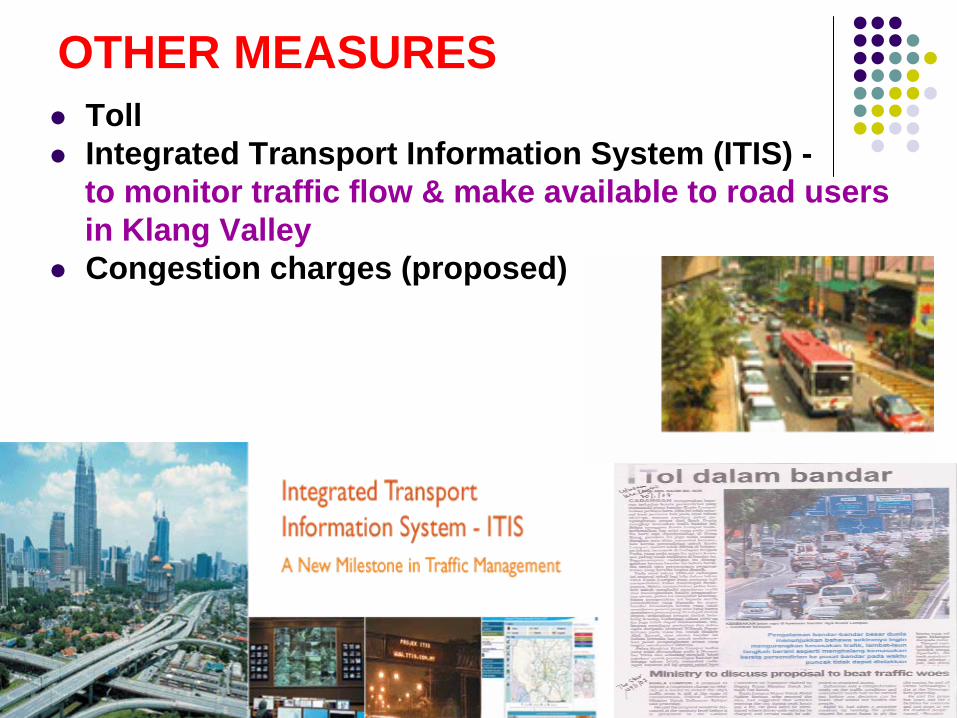
OTHER MEASURESTollIntegrated Transport Information System (ITIS) -to monitor traffic flow & make available to road usersin Klang ValleyCongestion charges (proposed)
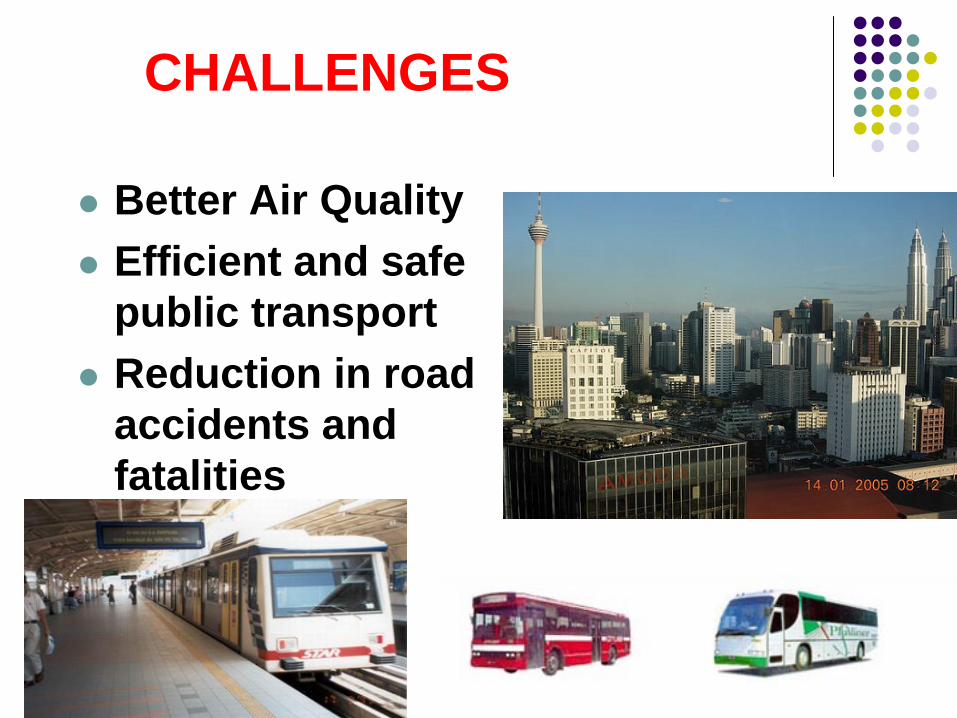
CHALLENGES
Better Air QualityEfficient and safe public transportReduction in road accidents and fatalities

DEPARTMENT OF ENVIRONMENTMINISTRY OF NATURAL RESOURCE & ENVIRONMENT
Thank You