think secular, act cyclical: the pragmatist's guide to water....
TRANSCRIPT

Think Secular, Act Cyclical: The Pragmatist's Guide to Water.
INVESTMENT CONCLUSION:
While catchy hyperbolic sound bites such as "The Oil of the 21st Century" have become de rigueur among mediapundits, the long-term "themes" surrounding water (water scarcity, water quality, and aging infrastructure) actually havelittle bearing on stock performance over the shorter 1-5 year horizon considered by most investors. Sure, these themesabsolutely have merit, and over the long-term allocating a portion of assets to the space will likely boost returns, but thereality is that water equipment and technology companies are for the most part cyclical businesses exhibiting volatiledemand patterns and susceptible company-specific issues (after all, oil was the oil of the 20th century, but that didn't stopTexaco from filing the then-largest bankruptcy in U.S. history in 1987). With this in mind, we believe the most practicalmeans of approaching the space is to acknowledge the compelling themes underlying the sector and screen for companiespositioned to benefit from them over time, but to base tactical investment decisions on a disciplined assessment of theunique cyclical realities facing each company. We base our tactical stock calls in large part on our framework of the FourDemand Channels: Municipal, Industrial, Construction, and Agriculture. In this deep-dive primer, we examine each ofthese key demand channels from the ground up, and also outline the adjacent regulated water utility space.
KEY POINTS:
• The "Big Three" Themes. Here are the water themes in a nutshell: (a) populations are migrating to arid regions(think Phoenix), and this is straining water resources in some areas - a.k.a. "Water Scarcity"; (b) the continuedproliferation of industrial and commercial activity creates pollution issues, requiring more stringent regulations toensure safe drinking water - a.k.a. "Water Quality"; and (c) established population centers (think NYC, Philadelphia)must continually invest to keep water systems in working order - a.k.a. "Aging Infrastructure".
• Be wary of blind theme investing. The paradox of investing in the water space is that while each of these keythemes has merit and will drive commercial opportunities, it is impossible to quantify and/or forecast the impact ofthese issues on demand even under relatively extended investment time horizons of 5+ years. As a result, we believethese themes are useful as a backdrop for thinking about the long-term opportunities on the horizon, but in terms oftactical stock picking they are useless at best and dangerous at worst (we've seen many victims, including ourselvesat times, take the thematic bait only to be caught off guard by the cyclical realities of the business).
• The Four Demand Channels: The path to alpha generation. Among the least appreciated aspects of industrialsinvesting is that in mature industries (unlike, say, technology or healthcare), major shifts in market share big enoughto drive stock calls are extremely rare. As a result, scarce time resources are best spent divining whether the pie itselfwill expand or contract (and by how much) rather than focusing on how the pie will be divvied up. Our demandchannel framework drives our research process, with the four channels being: Municipal (city Water & WWauthorities), Industrial (water-intensive industries such as energy, bio-pharma, and food & beverage), Construction(water infrastructure for use in residential and commercial structures), and Agriculture (i.e. irrigation).
• A guide to tactical investing in the water space. This primer is designed as a guide and desk reference for investorslooking at the water space, laying out the fundamental factors driving each of the four demand channels anddiscussing the key indicators we monitor to gauge the trajectory of demand. In the end, we believe that the vastmajority of stock performance in the water sector can be ascribed to directional trends in the four demand channels,and that this is where investors seeking to generate alpha in the space should focus their attention.
Ryan M. Connors 215.665.1359
Kenneth J. Dorell 215.665.6439
[email protected] & Agriculture
November 13, 2013
Equity Research
Industry Report
Research Analyst Certifications and Important Disclosuresare on page 65 of this report

Introduction to the Four Key Demand Channels
Secular themes supply the long-term investment rational within the subsets of the broader water industry, yet the
cyclical tendencies within each end-market make appreciating the demand determinants vital to the investment
process. As such, our analysis is structured into the four key demand channels of municipal, industrial, construction,
and agriculture, with the fifth section dedicated to the investor-owned water utility industry.
Municipal: Capital expenditures dictate growth opportunity. The budgets of municipalities are divided
between operational expenditures and capital expenditures, with the latter representing the market opportunity for
water infrastructure companies as capital spending represents incremental spending on water product upgrades
ranging from pipe, pump, and meters to the construction of entire plants. With an estimated size of $31.5 billion in
2012 (measured by U.S. Utility CapEx), the highly fragmented market is served by a variety of companies that offer
products spanning from pumps (supplied by companies like Gorman-Rupp [GRC-Buy]) to advanced infrastructure
diagnostics systems (offered by Mueller Water Products [MWA–Buy]).
Industrial: Water treatment regulations & conservation efforts provide recurring demand. Expected to grow
at an annual compounded rate of 6% through 2016, the industrial water equipment market is expanding due in large
part to two secular trends: water scarcity and water quality. With tightened regulations and a renewed focus on water
efficiency, companies are taking a proactive approach to ensure compliance with increasingly stringent regulations
governing both water usage and effluent quality. Indeed, secular drivers provide a longer-term tailwind, yet
investment in water products is largely determined by the investment cycle of each relevant industry. The industrial
demand channel exhibits a relatively high degree of correlation with the broader industrial economy, and as a result,
trends in capacity utilization, industrial production, and industrial capital investment exert a significant influence on
the trajectory of demand for relevant water products.
Construction: Residential and non-res. building erection necessitates water infrastructure. In contrast to the
―megatrend‖ growth stories in the industrial, agriculture, and municipal end markets, the construction market for
water products is more cyclical than its secular counterparts. Driven predominately by macroeconomic factors,
including financing availability, income levels and general consumer outlook, the construction market is split
between two segments: residential and nonresidential. Indeed, every structure includes some degree of water
infrastructure, but there are certain key structures that are highly water intensive. For instance, the full service
nature of a household provides a swift tailwind for plumbing products, as do commercial structures such as lodging
and hospitals. These buildings amplify many of the residential uses for water to mass scale, resulting in extremely
water intensive operations that require complex and reliable systems.
Agriculture: Industry-best practices drive irrigation adoption/applications on the farmstead. The most
influential (and direct) water end-market in agriculture belongs to irrigation, yet the application of precision
agriculture and new, more efficient farm machinery also aids in the movement to reduce water consumption. In
order to anticipate demand trends in these markets, we follow a number of different metrics that amalgamate to
convey a general direction of the ag demand channel: net farm income, farmland values, corn prices, the corn
balance sheet, and farm debt. Shifts in the market conditions typically constitute commensurate shifts in the
performance of the ag companies, though certain conditions may supply different conclusions for each product
offering.
See pages 3-4 for a detailed Table of Contents providing easy reference to the contents of this report.
o Sidenote: For those viewing this document electronically, clicking the desired title on the table of
contents will direct you to the section referenced within the document.
- 2 -

Janney Montgomery Scott Equity Research: Water & Agriculture
Table of Contents
Municipal Demand Channel: An Overview ............................................................................................. 5
Municipal Demand Channel: The Market Opportunity ........................................................................... 6
Focus Issue #1: Pipe Replacement Estimates Out of Touch with ―Urban Reality‖ ......................... 7
Municipal Demand Channel: Growth Dynamics ..................................................................................... 8
Key Upcoming Industry Events ................................................................................................................ 9
Focus Issue #2: Bottled Water Consumption Provides Homes with ―Second Line‖ ..................... 10
Municipal Demand Channel: Key Macroeconomic Indicators ............................................................... 11
Municipal Demand Channel: Sub-sectors & Key Players ...................................................................... 14
Focus Issue #3: The Role of Water Metering in Driving Conservation ........................................ 15
Municipal Demand Channel: Key Players Comparable Analysis .......................................................... 16
Industrial Demand Channel: An Overview ............................................................................................ 17
Industrial Demand Channel: The Market Opportunity ........................................................................... 18
Focus Issue #4: ―Virtual Water‖ – A Holistic Measure of Water Consumption ........................... 19
Industrial Demand Channel: Growth Dynamics ..................................................................................... 21
Focus Issue #5: The Water/Energy Nexus ..................................................................................... 22
Industrial Demand Channel: Key Macro Indicators ............................................................................... 25
Industrial Demand Channel: Subsectors and Key Players in Each ......................................................... 28
Focus Issue #6: Water Treatment Stokes Conservation ................................................................. 29
Industrial Demand Channel: Key Players Comparable Analysis ........................................................... 30
Construction Demand Channel: An Overview ...................................................................................... 31
Construction Demand Channel: Market Opportunity ............................................................................. 32
Construction Demand Channel: Residential Growth Dynamics ............................................................. 33
Construction Demand Channel: Nonresidential Growth Dynamics ....................................................... 34
Construction Demand Channel: Key Indicators ..................................................................................... 35
Commercial Demand Channel: Subsectors and Key Players in Residential Market .............................. 39
Construction Demand Channel: Subsectors and Key Players in Nonresidential Market ....................... 40
Construction Demand Channel: Key Players Comparable Analysis ...................................................... 40
Agriculture Demand Channel: Irrigation Overview ............................................................................. 42
Agriculture Demand Channel: Irrigation Market Opportunity ............................................................... 43
Focus Issue #7: Precision Ag Adoption in Early Stages (Even in Developed Countries) ............. 44
Agriculture Demand Channel: Growth Dynamics .................................................................................. 45
- 3 -
Janney Montgomery Scott Equity Research: Water & Agriculture
Focus Issue # 8: Influence of Net Farm Income on Demand ......................................................... 46
Agriculture Demand Channel: Key Indicators ........................................................................................ 47
Agriculture Demand Channel: Irrigation Key Players and Product Offerings ....................................... 50
Agriculture Demand Channel: Key Players Comparable Analysis ........................................................ 51
Regulated Water Utilities: An Overview ............................................................................................... 52
Regulated Water Utilities: Market Opportunity ...................................................................................... 53
Regulated Water Utilities: Growth Dynamics ........................................................................................ 54
Regulated Water Utilities: Regulatory Climate Indicator .............................................................. 55
Regulated Water Utilities: Key Players .................................................................................................. 58
Appendix .................................................................................................................................................... 59
Analyst Disclosures………………………………………………………………………………………. 65
- 4 -

Janney Montgomery Scott Equity Research: Water & Agriculture
Municipal Demand Channel: An Overview
A large portion of the play on water infrastructure companies is their exposure to municipal investment,
which is susceptible to numerous influences that drive the demand of water products. The budgets of
water utilities are divided between operational expenditures and capital expenditures, with the latter
representing the market opportunity for water infrastructure companies as capital spending represents the
incremental spending on water product upgrades ranging from pipe, pump, and meters to the construction
of entire plants. With an estimated size of $31.5 billion in 2012 (measured by U.S. Utility CapEx), the
highly fragmented market is served by a variety of
companies that offer products spanning from
pumps (supplied by companies like Gorman-Rupp
[GRC-Buy]) to advanced infrastructure diagnostics
systems (offered by Mueller Water Products
[MWA–Buy]). Forecasted by Global Water
Intelligence to reach a size of $46.4 billion by
2016, utility capital expenditures are expected to
expand at a 10% clip from 2012-2016, with
drinking water and wastewater capital expenditures
operating at a projected CAGR of 11.5% and 9.4%
over that time, respectively.1
The deterioration of water infrastructure in the
United States represents the primary growth driver
for water products companies, yet, as 84% of
drinking water systems (and 98% of wastewater
systems) in the United States are publicly-operated,
the financial condition of municipal governments
plays a key role in determining the trajectory of
demand in the short-term. As a result, economic
indicators that track bond issuance, hiring, pricing,
and tax collection trends of municipalities are
useful in assessing the likely trajectory of spending.
While water utilities are notoriously methodical in
their operational and investment trends, there is a
definite correlation between economic prosperity
and increased utility capital expenditures as
housing construction translates into increased
property tax revenue, a key funding mechanism for local municipalities (~80% of local tax revenue).
This influence in spending results in cyclicality for companies that serve the municipal sector, evidenced
in the sharp downturn of many companies exposed to municipal spending in 2008 (see: Badger Meter
[BMI-Neutral] or Xylem [XYL-BUY]). While Badger and Franklin Electric (FELE-NR) represent two
subsectors of the municipal market (Metering and Pumps), the sector is also served by engineering and
construction, water filtration, piping and storage, and infrastructure diagnostics firms that provide
products and services over the full lifecycle of municipal water infrastructure projects.
1 Water Market USA 2011. Oxford, United Kingdom: American Water Intelligence, 2011. Print.
New Water Network
13%
Water Network
Rehab
36%
New Water Treatment
Plant
5%
Water Treatment
Plant
Upgrades23%
New Water Resources
23%
Utility Water CapEx: 2013E
Source: AWI
Size: $15.3 bln
New Wastewater
Network
49%
Wastewater Network
Rehab
9%
New Wastewater Treatment
Plant37%
Related Assets
5%
Utility Wastewater CapEx: 2013E
Source: AWI
Size: $19.6 bln
- 5 -

Janney Montgomery Scott Equity Research: Water & Agriculture
Municipal Demand Channel: The Market Opportunity
Water infrastructure in the United States is
experiencing a prolonged deterioration that has
accelerated throughout the past two decades, with
renovations being deferred in many cases as a
result of trimmed budgets. Aging water and sewer
infrastructure has become so dire that it was cited
as the most important industry issue by water
utilities, above managing capital costs and funding
availability in a report by industry consultant Black
and Veatch. With macro data suggesting a rebound
is likely (seen through improvements in bond
issuance, municipal water pricing and record
property tax receipts) and pent-up projects being
unleashed, investment in some key areas of water
infrastructure is expected to increase. Alternately,
some areas of aging infrastructure are unlikely to
see ―in-kind‖ replacement as demographics shift
and consumer preference continues to shift toward
alternative delivery methods (see pages 7 & 10).
Estimates on the cost of bringing the United States‘
water infrastructure up to date within the next 20
years range from $335 billion to $1 trillion, with
the EPA estimating a cost of $384 billion to
upgrade U.S drinking water infrastructure in a
recent study. While we are somewhat skeptical of
the aging infrastructure theme, the reduced
spending in recent years by municipalities
tightening their belts has resulted in pent-up
demand for structural upgrades that we expect will
result in heightened project activity.
Distrib
65%
Treatment
19%
Storage
10%Source 5%
Other 1%
Water Infrastructure Upgrade Needs by
Function
Source: EPA
$0m
$5,000m
$10,000m
$15,000m
$20,000m
$25,000m
$30,000m
2007 2008 2009 2010 2011 2012 2013E 2014E 2015E 2016E
US Utility Capital Expenditure Profile
Utility Water Capex Utility Wastewater CAPEX
Source: American Water Intelligence
1990 2000 2005 2009 2013
Drinking Water Wastewater
B-
C
DD+
D- D-
A Deteriorating Report Card:
ASCE Grades U.S. Water Infrastructure
Source: ASCE
D- D-
D D
Major investments are needed to shore-up U.S. water
infrastructure. At 7% per year, water tariffs are growing
faster in North America than in any other region of the
world, a positive indicator that funding will be available.
- 6 -

Janney Montgomery Scott Equity Research: Water & Agriculture
Focus Issue #1: Pipe Replacement Estimates Out of Touch with “Urban Reality”
Officials in Youngstown, Ohio made
national news in 2006 by
acknowledging that the city was
unlikely to rebound from decades of
steep population loss, embarking on a
plan to deliberately downsize all aspects
of the city. Essentially, Youngstown‘s
still-unfolding plan (an example of what
urban planners have dubbed the
―Shrinking Cities‖ movement) boils
down to managing decline by
concentrating population in resilient
neighborhoods and decommissioning
sections of the city that are deemed to
have crossed the line of no return on the
vicious cycle of population loss, blight,
and crime. With the EPA and other
groups presuming full renovation of
infrastructure in their estimates, Youngstown‘s final step of razing whole blocks of abandoned homes,
thus eliminating the need for water mains there, leads to likely over-projections of needed investment in
similar cities. A Few cities are following Youngstown‘s lead, and with 22% of water main mileage within
declining urban populations and tightened municipal budgets (in addition to heightened public scrutiny on
overspending), other cities are likely to take similar approaches.
A reasonable counterpoint to this argument is that migration patterns will create demand in the suburbs
and Sun Belt cities that are gaining population (driving infrastructure demand). Unfortunately, while this
is true in the long-term, these areas were
developed so aggressively during the
housing boom that there is now
significantly underutilized infrastructure.
While strides towards reducing the housing
glut are being taken, a prolonged hangover
period for basic water infrastructure
demand is still impacting these areas,
causing the pipe market in particular to
meaningfully lag housing starts on the way
back up. In fact, juxtaposing the housing
overbuild in the suburbs/Sun Belt against
continued urban decline in the Rust Belt,
one way of looking at the issue is that a
considerable portion of the necessary water
infrastructure spending already took place –
in the form of water distribution networks
serving new housing developments.
0.2
0.4
0.6
0.8
1.0
1.2
1.4
1.6
1.8
2.0
2.2
$200
$250
$300
$350
$400
$450
$500
$550
$600
$650
2001 2002 2003 2004 2005 2006 2007 2008 2009 2010 2011
U.S. Pipe Revenue (L, Bar) vs. U.S. Housing Starts (R, Line)
Figures in millions Source: Mueller Water Co; U.S. Census Bureau
4%
-26% -26%
92%
-61%
-35%
-57% -63%
-25% -23%
NYC
Ch
icag
o
Ph
ila.
L.A
.
Det
roit
Bal
t.
Cle
ve.
St. L
ou
is
Was
h.
Bo
sto
n
The 10 LargestU.S. Cities in 1950:
Pop. Change: 1950-2010
Source: U.S. Census Bureau
- 7 -

Janney Montgomery Scott Equity Research: Water & Agriculture
Municipal Demand Channel: Growth Dynamics
The growth profile of municipal spending
must be dissected in disparate ways as it is
subject to both secular and cyclical trends.
Cyclical. Municipal spending is subject to
macroeconomic conditions since it derives
much of its funding from taxes. With
property tax, sales receipts, and income tax
representing 91% of local tax revenue,
municipalities are exposed to trends in
housing (property tax), unemployment and
nonfarm payrolls (income tax) and
consumer expenditures (general sales
receipts). In the case of water infrastructure
spending, funding is principally derived
from rates charged for water consumption, which steadies the amount of spending on operational
expenditures. However, even water consumption revenue benefits from healthy macro conditions as
customer growth is driven by housing construction and commercial/industrial usage is cyclical.
Secular. While macro conditions certainly influence municipal spending (recent trends confirm this),
conventional wisdom holds that the poor condition of water infrastructure throughout the country
provides a significant long-term opportunity for companies serving the municipal market. While we
recognize this (citied in earlier estimates of water infrastructure investment needs), we believe that there
are also prominent trends that dilute the magnitude of water infrastructure needs in the U.S., most notably
the shift in favor towards bottled drinking water and shrinking cities phenomenon. Nevertheless, external
to the water infrastructure argument there remains compelling industry dynamics that present growth
opportunities for those selling into the water municipal channel. A focus on water quality and
conservation is driving demand for products ranging from advanced reverse osmosis treatment facilities
to meters fitted with AMI technology that allows for
enhanced leak detection. As consumers become
more cognizant of their water consumption and
water quality and utilities strive towards pressure
optimization of water systems to reduce non-revenue
water, the market for higher-end products that
expand beyond the basic needs of water distribution
and treatment is gaining traction rapidly.
Additionally, from a timing perspective, companies
servicing water utilities exhibit smoother returns
than those selling to industries like electric utilities,
as water projects are of much lesser size than that of
electric utilities, which leads to a reduced reliance
on large projects and a lower degree of lumpiness
for companies selling into the water utility sector.
Property Tax78%
General Sales/ Gross
Receipts
8%
Individual Income
4%
Corp Income1%
Other9%
Local Tax Revenue Distribution
Source: U.S. Census Bureau
Pipes36%
Pumps23%
Valves6%
Meters2%
Control/ Chemical
feed
systems1%
Filtration/ Treatment
22%
Other10%
Utility Water/WW Utility Market by
Equipment Type: 2013E
Source: AWI
- 8 -

Janney Montgomery Scott Equity Research: Water & Agriculture
Key Upcoming Industry Events
Water Quality Association Aquatec (WQA Aquatec)
Description:
Website: www.wqa-aquatec.com
Upcoming
Conferences:
American Water Works Assocation Annual Conference Exhibition (AWWA ACE)
Description:
Website: www.awwa.org
Upcoming
Conferences:
2014 AWWA ACE
Boston, Massachusetts
June 8th-12th, 2014
2016 AWWA ACE
Chicago, Illinois
June 12th-15th, 2016
2018 AWWA ACE
Las Vegas, NV
June 11th-15th, 2018
2015 AWWA ACE
Anaheim, CA, USA
June 7th-11th, 2015
2017 AWWA ACE
Philadelphia, Pennsylvania
June 11th-14th, 2017
Water Environment Federations Technical Exhibition Conference (WEFTEC)
Description:
Website: www.weftec.org
Upcoming
Conferences:
87th Annual WEFTEC
New Orleans Morial
Convention Center
New Orleans, LA
October 18th-22nd, 2014
WQA is “a one stop event that connects technologies, know-how, education, training, networking, and
business opportunities to multiple water industries”. The conference provides insight into the opportunities
and market conditions in the residential, commercial, and industrial end-markets for water products.
American Water Works Assocation is an organization boasting 50,000 members worldwide, including the
majority of the relevant U.S. water infrastructure companies. The Association's conference is designed to
introduce new trends, technology, and opportunities in the space as well as serving as a platform to discuss
recent ramifications from shifts in the legislative lanscape.
WEFTEC is the biggest meeting of its kind in North America and offers thousands of water quality
professionals from around the world the best water quality education and traning days available. It also
provides a water quality exhibition that provides access to the industry's cutting edge technology.
Key Water Industry Events
2014 WQA Aquatec
Orange County Convention Center
West Building, West Hall B
Orlando, Florida
March 18th-21st, 2014
- 9 -

Janney Montgomery Scott Equity Research: Water & Agriculture
Focus Issue #2: Bottled Water Consumption Provides Homes with “Second Line”
To understand why the inflection point in water
infrastructure investment has stubbornly failed
to realize, it helps to first consider a related
industry topic – the notion of a ―dual pipe‖ water
distribution system. Ingested water represents a
relatively small portion of household water
consumption (less than 3%), yet under a single-
pipe system, all other household applications
must utilize this expensive water. The solution,
say ―dual-pipe‖ advocates, is to have one line
bring top-quality drinking water into the home,
and another bring ―gray water‖ (water treated,
but to a lesser standard) for non-potable
applications. The dual pipe idea makes sense
from a water quality perspective (it makes no
sense to flush toilets with potable water), but
suffers from a fatal, insurmountable flaw: the
massive capital cost associated with such a system makes it a non-starter.
On the surface the solution to the aging infrastructure ―crisis‖ seems slow in materializing, yet the free
market is already dealing with the situation in real-time. An increasing number of people already
effectively operate under a virtual dual pipe system, with the existing drinking water service line
functioning as the ―gray water‖ pipe for non-potable applications and bottled water (or, increasingly,
point-of-use filtration systems) acting as the ―potable water‖ pipe. These alternatives have a strong
advantage in capital aversion, as bottled water utilizes existing civil (roads, rails) and commercial
(beverage industry bottling and distribution capabilities) infrastructure to bring drinking water to
consumers, while point-of-use filtration ―free rides‖ on the existing distribution network (inverting the
traditional utility model by transporting water first, treating it second). Equally important, bottled water
in particular leverages consumers‘ willingness to pay up for a source of drinking water they trust.
0% 20% 40% 60% 80% 100%
20-39
40-59
60+
Water Consumption by Age Group(Cups per day)
Tap Bottled
Source: USDA
Potable Water Landscape
0
2,000
4,000
6,000
8,000
10,000
12,000
14,000
5
5.5
6
6.5
7
7.5
8
8.5
9
9.5
2001 2002 2003 2004 2005 2006 2007 2008 2009 2010 2011
Bottled Water & Water Filter Sales
Bottled Water Consumption - Gallons in Billions (L-Axis)
Filters - Units in Thousands (R-Axis)
Filters 5-yr CAGR: 9.2%
Source: IRI & Bottled Water.org
Water Bottles 10-yr CAGR: 5.8%Bathing
23%
Toilets
28%
Lawn &
Pools 29%
Laundry
10%
Drink &
Cook 2% Other 9%
Water Usage by Application
Source: freedrinkingwater.com
- 10 -

Janney Montgomery Scott Equity Research: Water & Agriculture
Municipal Demand Channel: Key Macroeconomic Indicators
As referenced previously, there are several key economic indicators that help handicap near-term trends
in municipal infrastructure spending and investment. These include: U.S. residential housing starts and
permits, local tax receipts, municipal bond issuance, and the water & wastewater CPI.
U.S. Residential Building Permits. Residential permits offer a reliable forward-looking indicator of
trends in residential construction. As building permits expand and lead to increased construction, this
drives an incremental increase in homes needing water and wastewater services, increasing
municipalities‘ income. This increased income leads to heightened investment, a positive for companies
with exposure to the municipal demand channel. Housing Starts are also a relevant indicator to follow, but
lacks the forward looking benefit of permits.
Municipal Bond Issuance. Municipal bond flotation is a key driver of capital spending for local
government, particularly in the case of large-scale water projects. While the debate rages on whether or
not municipal bonds should continue to offer tax-free interest to investors (which is the asset class‘s most
attractive feature) it continues to be an enormous source of funding for munis. Key benefits of following
municipal issuance include (a) the forward-looking aspect of the data (capital raised in the municipal
bond market is typically deployed 1-2 years after issuance) and (b) the readily accessible nature of real-
time data.
Local Tax Receipts. Local tax revenues are the chief source of funding for municipalities, with stronger
tax receipts customarily translating into budget increases, which determine the level of both capital
investment and, to a lesser extent, operational expenditures in local water infrastructure. While water rates
make up the dominant share of water utility funding (~60% of municipal water utilities are structured as
financially independent ―enterprise funds‖), tax revenue is still a critical driver of spending trends over
the course of the economic cycle.
Municipal Water & Wastewater Pricing. The source of income directly attributable to water and
wastewater infrastructure investment is the charge for water and wastewater services. Many water
utilities continue to charge below cost for their service, yet increases in pricing move the industry toward
a more sustainable ―full cost‖ pricing model that will catalyze infrastructure investment in the
intermediate-term. In recent years, prices have been increasing at multiples of inflation in the broader
economy.
- 11 -

Janney Montgomery Scott Equity Research: Water & Agriculture
Municipal Demand Channel: Economic Indicators – Continued
0
500
1,000
1,500
2,000
2,500
U.S. Residential Permits (000s)
After reaching record heights in 2005 (permits are a leading indicator of the housing cycle), U.S.
Residential permits experienced an extended slump from 2006 to mid 2009. The recovery in permit
activity (though still well below 2005 levels) bodes well for water infrastructure companies that sell into
the residential construction industry.
Source: US Census Bureau
$200,000
$250,000
$300,000
$350,000
$400,000
$450,000
$500,000
$550,000
2003 2004 2005 2006 2007 2008 2009 2010 2011 2012 2013E
U.S. Municipal Bond Issuancein Millions
Source: Bloomberg; JMS Estimates
Municipal bond issuance worked its way higher during the recession as local governments scrambled for funding amid lower tax receipts. This trend took a breather in 2011, but the "above average" borrowing resumed in 2012 as record-low interest rates enticed municipalities.
Lending has since normalized as economic conditions improve and interest rates work their way up. Overall, we view the increased funding from tax receipts as a preferred method of funding for munis.
- 12 -

Janney Montgomery Scott Equity Research: Water & Agriculture
Municipal Demand Channel: Economic Indicators – Continued
3%
4%
5%
6%
7%
Feb
-04
Jul-
04
De
c-04
May
-05
Oct
-05
Mar
-06
Au
g-06
Jan
-07
Jun
-07
No
v-07
Ap
r-08
Sep
-08
Feb
-09
Jul-
09
De
c-09
May
-10
Oct
-10
Mar
-11
Au
g-11
Jan
-12
Jun
-12
No
v-12
Ap
r-13
Sep
-13
Municipal Water & Wastewater Pricing (Year/Year Rate of Change)
Source: U.S. Bureau of Labor
Water pricing has been outpacing broader measures of inflation for years. While downward pressure on interest rates has the ability to
pressure water pricing, tariff growth still runs well above inflation levels even in such an environment, as utilities use rate increases as a method
for financing infrastructure and water sourcing needs.
$0
$100,000
$200,000
$300,000
$400,000
$500,000
$600,000
$700,000
1990 1992 1994 1996 1998 2000 2002 2004 2006 2008 2010 2012
Local Tax Collections(in millions)
Local Taxes
Property Taxes
Source: United States Census Bureau
Local tax collections have expanded over 150% in the past two decades, and although local tax revenue declined from 2009 to 2011,
collections have since rebounded to reach record levels in 2013.
- 13 -

Janney Montgomery Scott Equity Research: Water & Agriculture
Municipal Demand Channel: Sub-sectors & Key Players
The products and services offered in the municipal sector represent vital components at each stage of the
water treatment and distribution process, creating a set of complementary goods (as opposed to
substitutes per se). The supply of potable water is first made possible through engineering and
construction, during which firms like Stantec (TSX:STN–NR) work with municipalities in developing
water plants that treat and distribute raw source water to service the needs of the community. Water
treatment (filtration, purification, etc.) is involved in this process as well, as water utilities are required to
treat water to meet the potable standards outlined by the EPA in the Safe Water Drinking Act. With point-
of-use filtration and wastewater treatment becoming more mainstream, these products are also used at the
back end of the water distribution cycle. Mueller Water (MWA-Neutral) and its privately held peers
provide the distribution vehicle, as piping is laid underground for water mains and ancillary systems.
While pipes provide the vehicle for distributing water, pumps represent the engine, creating water
pressure to transport the water, with valves managing the flow. A multitude of companies operate in this
area, ranging from Gorman-Rupp (GRC-BUY) and Xylem (XYL-BUY) who service high-volume pump
needs to Watts (WTS-BUY) who extends its value offerings to those beyond the municipal system.
Water metering is where the transaction between the consumer and the utility is recognized, and it is
essential for the service provider to properly account for customer usage. There are numerous types of
meters available (PD, impeller, magnetic), but the area that is getting much notoriety and investment is in
the data transmission space, where there are two distinct groups: manual-read and automated (AMR).
AMR technology allows for accurate and timely consumption monitoring, as transmitters communicate
meter readings to the water utility through either walk-by or drive-by sensors, effectively eliminating the
need for manual meter checking. AMI transmission systems take this one step further, leveraging fixed-
communications systems that enable the utility to gather consumption data in house. The evolution of
AMI involves two-way communication (both to the utility and back to the customer), which allows
consumers to adjust their consumption through water-efficient ―best practices‖.
Product Description Companies
Transmission &
Distribution
Underground distribution systems that facilitate
water transportation. Storage primarily involves
reservoir construction.
FSTR, MWA,
NES, NWPX
Pumps/Valves
Primarily flow control devices that promote water
quality, conservation, and safety and are integral
components to water systems of any size or type.
GRC, FLS, IEX,
MWA, PNR, XYL
Engineering &
Construction
Provides consulting, engineering, program
management, construction management, and
technical services for water, natural resources,
environment, infrastructure and energy sectors.
AEC, LAYN, STN,
TTEK, URS
Metering
Flow measurement and control devices that apply
to various applications servicing commercial,
industrial and residential customers.
BMI, Elster*, ITRI,
MWA, ROP, SSNI
Infrastructure
Diagnostics
Services aging infrastructure in the form of water
systems for leak detection, water inefficiencies,
and pressure abnormalities.
MWA, PUR (TSX)
Filtration
Offers filtration materials, systems, and consumer
products that service water, air, food and beverage,
and industrial process streams.
AOS, CCC, PLL,
XYL
*Privately Held
Products & Services Offered to Municipal Customers
- 14 -

Janney Montgomery Scott Equity Research: Water & Agriculture
Focus Issue #3: The Role of Water Metering in Driving Conservation
A strong driver for water efficiency in addition to
minimizing treatment costs for utilities is water
metering. Currently, over a quarter of the water that
is used worldwide is non-revenue water, or the
difference between the water put into a distribution
system and the volume that is billed to customers.
The three types of non-revenue water are: physical
losses, commercial losses, and unbilled authorized
consumption. Physical losses represent the leakage
from all parts of the system and overflows at the
utility‘s storage tanks, typically derived from poor
management of plant operations. Commercial
losses are drawn from customers with meters under
registration, with losses resulting from meter errors or water theft. Unbilled authorized consumption is
water that is used for public goods (i.e. firefighting).
According to the World Bank, nearly 50 billion cubic meters of non-revenue water is used each year,
representing a $14.6 billion annual loss of treated water. While full scale introduction of water metering
would not capture the majority of this revenue, it would ultimately improve the efficiency of water
distribution by identifying systems with water loss in order to more acutely focus infrastructure
improvements. This translates into fewer costs borne by utilities (less non-rev water) for the purchase and
treatment of water and subsequently, lower rates for consumers who would no longer compensate utilities
for non-revenue water. Companies have been noticing the benefits of metering especially, with automated
meter reading technology growing from close to zero a decade ago to 33% today. This significant
improvement highlights the popularity of water metering solutions, but also shows that despite public
presumption of metering installations flattening out, there is still ample opportunity.
12%
21% 21%3%
9%14%
0.0%
5.0%
10.0%
15.0%
20.0%
25.0%
30.0%
35.0%
40.0%
Developed Countries Eurasia Developing
Countries
Global Non-Revenue Water Breakdown*
Physical Losses NRW Commercial Losses NRW
15%
30%
35%
*Percent of Water System Input Source: WHO, World Bank, Janney Captail Markets
- 15 -

Janney Montgomery Scott Equity Research: Water & Agriculture
Municipal Demand Channel: Key Players Comparable Analysis
Ticker PriceMarket
CapSales Ent. Value Fwd P/E
EV/
EBITDA
JMS
Analyst
Water
Exposure
Sourcing & Distribution
LB Foster Co. FSTR $43.75 $451.9 $582.2 $355.9 15.2x 6.8x NR Low
Northwest Pipe Co. NWPX $37.40 $353.4 $496.5 $431.8 24.9x 8.8x NR High
Nuverra Environmental Solutions, Inc. NES $1.46 $379.5 $600.8 $904.7 NM 13.2x NR Medium
Average 20.1x 9.6x
Pumps & Valves
Gorman-Rupp Co. GRC $39.43 $828.1 $388.7 $803.3 23.7x 15.3x Connors High
IDEX Corporation IEX $69.74 $5,657.2 $1,994.3 $6,041.9 21.2x 12.9x Knight Medium
Mueller Water Products, Inc. MWA $8.80 $1,392.5 $1,120.8 $1,869.7 26.5x 11.8x Connors High
Pentair Ltd. PNR $68.05 $13,564.7 $7,313.9 $16,020.2 17.9x 18.6x NR High
Watts Water Technologies, Inc. WTS $58.61 $2,068.9 $1,470.2 $2,150.0 21.3x 11.7x Connors High
Xylem Inc. XYL $33.94 $6,261.5 $3,773.0 $7,069.5 18.3x 12.4x Connors High
Average 21.5x 13.8x
Engineering & Construction
AECOM Technology Corporation ACM $28.96 $2,919.3 $8,153.5 $3,616.5 12.1x 7.7x NR Low
Layne Christensen Company LAYN $15.25 $299.2 $974.3 $393.9 NM 15.7x NR High
Stantec Inc. STN $67.26 $3,120.9 $1,773.8 $3,286.2 18.9x 12.8x NR Medium
Tetra Tech Inc. TTEK $26.42 $1,704.0 $2,029.5 $1,771.0 16.9x 14.3x NR High
Tutor Perini Corporation TPC $21.36 $1,027.7 $4,190.6 $1,675.2 9.3x 6.7x NR Low
Average 14.3x 11.4x
Metering
Arad Ltd. TASE:ARD $26.17 $647.2 $139.0 $649.8 0.0x 9.0x NR High
Badger Meter Inc. BMI $51.76 $744.2 $327.4 $804.7 24.0x 15.8x Connors High
Itron, Inc. ITRI $43.50 $1,703.0 $1,948.5 $2,002.6 15.6x 11.9x Connors Medium
Mueller Water Products, Inc. MWA $8.80 $1,392.5 $1,120.8 $1,869.7 26.5x 11.8x Connors High
Roper Industries Inc. ROP $125.63 $12,476.3 $3,158.9 $14,622.2 20.8x 14.6x NR Medium
Silver Spring Networks, Inc. SSNI $19.42 $915.3 $279.8 $773.6 28.0x NM NR Medium
Average 19.1x 12.6x
Infrastructure Diagnostics
Mueller Water Products, Inc. MWA $8.80 $1,392.5 $1,120.8 $1,869.7 27.5x 11.8x Connors High
Pure Technologies Ltd. TSX:PUR $6.42 $328.0 $59.1 $288.3 32.1x 24.7x NR High
Average 29.8x 18.3x
Filtration/Treatment
Calgon Carbon Corporation CCC $20.48 $1,118.3 $556.6 $1,136.9 21.1x 11.6x NR High
Pall Corporation PLL $81.87 $9,068.7 $2,648.1 $8,769.6 24.0x 15.3x Knight Low
Watts Water Technologies, Inc. WTS $58.61 $2,068.9 $1,470.2 $2,150.0 21.3x 11.7x Connors High
Xylem Inc. XYL $33.94 $6,261.5 $3,773.0 $7,069.5 18.3x 12.4x Connors High
Average 21.2x 12.7x
*Company Descriptions Located in Appendix Source: CapIQ, Company Documents
Municipal Demand Channel: Publicly Traded Company Comp Sheet
- 16 -

Janney Montgomery Scott Equity Research: Water & Agriculture
Industrial Demand Channel: An Overview
Expected to grow at an annual compounded rate of 6% through 2016, the industrial water equipment
market is expanding due in large part to two secular trends: water scarcity and water quality. With
tightened regulations and a renewed focus on water efficiency, companies are taking a proactive approach
to ensure compliance with increasingly stringent regulations governing both water usage and effluent
quality. Indeed, secular drivers provide a longer-term tailwind, yet investment in water products is largely
determined by the investment cycle of each relevant industry. The industrial demand channel exhibits a
relatively high degree of correlation with the broader industrial economy, and as a result, trends in
capacity utilization, industrial production, and industrial capital investment exert a significant influence
on the trajectory of demand for relevant water products.
Improving fundamentals in the U.S. manufacturing sector are augmenting the secular drivers by creating a
cyclical tailwind, with expanding industries such as hydraulic fracturing providing incremental demand
for water transmission and treatment equipment. With this noted, there can be significant shifts in the end
market conditions of the industrial sector, which makes it prudent to continually monitor the economic
trends emerging in the sector. The forward looking indicators that we follow include: the Architecture
Billings Index (ABI), U.S. Capacity Utilization and U.S. Industrial Production Index. The industrial
indicators provide insight into the investment trends in many of the largely cyclical and water dependent
industrial sectors, including the pulp and paper and mining industries. In addition, as the oil and gas
industry‘s water consumption expands (expected 24% 5-yr CAGR vs. 6% for all industrial markets), U.S.
construction spending on Energy and Manufacturing has become a vital metric to follow in projecting
demand for water equipment and technology.
Industrial Water Equipment Market Dynamics
$0
$500
$1,000
$1,500
$2,000
$2,500
$3,000
$3,500
$4,000
$4,500
2007 2008 2009 2010 2011 2012E 2013E 2014E 2015E 2016E
Industrial Water & Wastewater Equipment Market
CAGR: 6%
Numbers in Milliions
Municipal WW
Treatment
Plants87%
Industrial Effluent
Discharge
13%
Wastewater Violations
Source: Public Interest Research Group; GWI/AWI
- 17 -

Janney Montgomery Scott Equity Research: Water & Agriculture
Industrial Demand Channel: The Market Opportunity
Agriculture consumes 70% of the world‘s water (with
the industrial sector using 22% globally), yet when
considering strictly high-income countries the
industrial sector leapfrogs into pole position,
comprising 59% of total water usage. With
globalization driving significant investment in
manufacturing capacity for developing economies, the
industrial sector is arguably the most important leg of
the water equipment growth story in the coming
decades. Indeed, since the United States already stands
as a high-income country it may seem that the market
opportunity for water equipment products is relatively
muted compared to its developing counterparts,
particularly considering its ―service-oriented‖
economy. However, the infusion of cheap energy has
reawakened the United States manufacturing sector,
opening up opportunities in the next few decades as
certain industries refocus on domestic production. In
addition, the country‘s stature as a developed country
enables it to focus on water quality and consumption
improvements amid this uptick, furthering its position
as a leader in driving improved water quality standards
in the industrial sector.
The $2.8 billion
industrial water
equipment market‘s
primary consumer is
the Pharmaceutical
industry ($520 million),
which finds water
particularly useful for a
number of applications
because of its unique
chemical properties.
While pharmaceutical
is expected to remain
the primary demand
channel for water
equipment in the industrial market, over the next five years certain industries are expected to eclipse
pharma‘s CAGR of 6%, including Oil & Gas (24%), Power (7%), and Chemicals (8%).
304
266
136
43
31
22
6
4
1
0 200 400
Russia
India
China
Global Average
USA
France
Germany
Japan
UK
Water Footprint per Unit Value Added(m
3/1,000 USD)
Source: Waterfootprint.com
Source: GWI/AWI
Industrial Water & Wastewater Treatment End Market: 2007 vs. 2016E
18%
14%
13%
11%7%
6%
5%
26%
2016E
Size: $3.8 bln
16%3%
12%
12%
11%9%
6%
31%
2007
Pharmaceutical
Oil & Gas
Food & Bev.
Power
Pulp/Paper
Electronics
Mining
Other
Size: $2.7 bln
- 18 -

Janney Montgomery Scott Equity Research: Water & Agriculture
Focus Issue #4: “Virtual Water” – A Holistic Measure of Water Consumption
The concept of ―Virtual Water‖ measures the volume of water required to produce goods and services,
with the term ―virtual‖ reflecting the fact that finished products contain little of the ―actual‖ water used in
its production. Much of the water efficiency discussion focuses on personal consumption (43,000
gallons/year), but this is minor relative to the nearly 700,000 gallons/year per capita required to enable
modern lifestyles. While academic literature on the concept of virtual water focuses on farming, which
accounts for about 70% of water consumption, the concept is also highly relevant for many industrial
companies, particularly as industry becomes a larger consumer of water. Indeed, many companies not
associated with the so-called ―water industry,‖ such as Dow Chemical (DOW-NR), International Paper
(IP-NR), Intel Corp. (INTC-NR) and U.S. Steel (X-NR), among others, rely upon trillions of gallons of
freshwater annually as a critical component of their everyday processes. With water scarcity and water
quality issues of growing concern worldwide, the business of helping companies minimize their virtual
water footprint should see consistent growth for many years to come.
Though discussions on water usage and conservation efforts often focus on residential consumption, the
concept of virtual water helps to illustrate the actual water usage patterns of modern society. Products
seemingly unrelated to the water industry in actuality are core to the rationale for investing in the water
sector, as the massive use of water highlights the criticality of enhancing water efficiency in these
everyday applications. In particular, companies whose products and services help farmers and industrial
customers use water as efficiently as possible (and to optimize their effluent water quality) should
continue to see a strong secular tailwind in the years ahead. This applies to a wide range of companies,
including those providing efficient irrigation systems (Lindsay Corporation-LNN, Valmont Industries-
VMI) and those working with industrial customers to optimize water usage patterns (Xylem-XYL). This
issue of water conservation is a vital component to the discussion going on today about a budding, water-
intensive activity to be discussed later: hydraulic fracturing.
ProductVirtual
Water Comments Product
Virtual
Water Comments
Egg 35 gall. Chicken feed production. Coffee (8 oz) 37 gall. 1,100 cups of water per cup.
Cotton T-Shirt 530 Cotton farming, processing. Hamburger 650 Raising livestock water intensive.
Bottle of Beer 20 Barley production, brewing. Loaf of Bread 170 10 gallons of water per slice.
Plastic (1 lb) 240Among most water intense
industries in water/sales dollar.Car 38,600 Metal, rubber, vinyl production.
Glass of Wine 32 Vineyards water intensive. Cheese (1 lb) 2,970 2.5 gall. of milk per lb of cheese.
Bag of Potato
Chips 50 Potato production. Milk (1 gal) 1,000 Dairy farming, processing.
Leather Shoes 2,100 Cattle ranching. Microchip 32 Many plants in arid regions.
Source: Hoekstra, Waterfootprint.org, Janney Montgomery Scott LLC Note: All virtual water content figures in gallons.
Virtual Water Content: Water Required to Produce Everyday Products
- 19 -

Janney Montgomery Scott Equity Research: Water & Agriculture
Focus Issue #4: “Virtual Water” – A Holistic Measure of Water Consumption – Cont’d
.
0.5
2
9
27
93
110
354
474
827
1,082
0 200 400 600 800 1,000 1,200
INTC
GM
XOM
NKE
EXC
X
BUD
IP
WLK
MCD
Water & the Income Statement: Gallons per Dollar of Sales
Source: Company Reports, waterfootprint.org
With a tremendous amount of "virtual water" embedded in
everyday items, water efficiency is increasingly relevant to
companies not typically associated with the "Water Sector."
McDonald's uses a whopping
1,082 gallons of virtual water to
generate $1 in revenue.
0
2,000
4,000
6,000
8,000
10,000
12,000
Japan China USA Brazil Australia Russia Italy
Average Virtual Water Content of Selected Products (yd3/ton)
Corn Wheat Soybeans Beef
Global
Average
The virtual water content of products varies greatly from place to place
as a result of differences in climate, farming techniques and land
quality. Due to the large amounts of time and feed required to raise
cattle, beef production requires relatively massive amounts of water.
14,410
27,700
27,500
22,400
22,200
20,275
17,25016,430
Source: waterfootprint.org
- 20 -
Janney Montgomery Scott Equity Research: Water & Agriculture
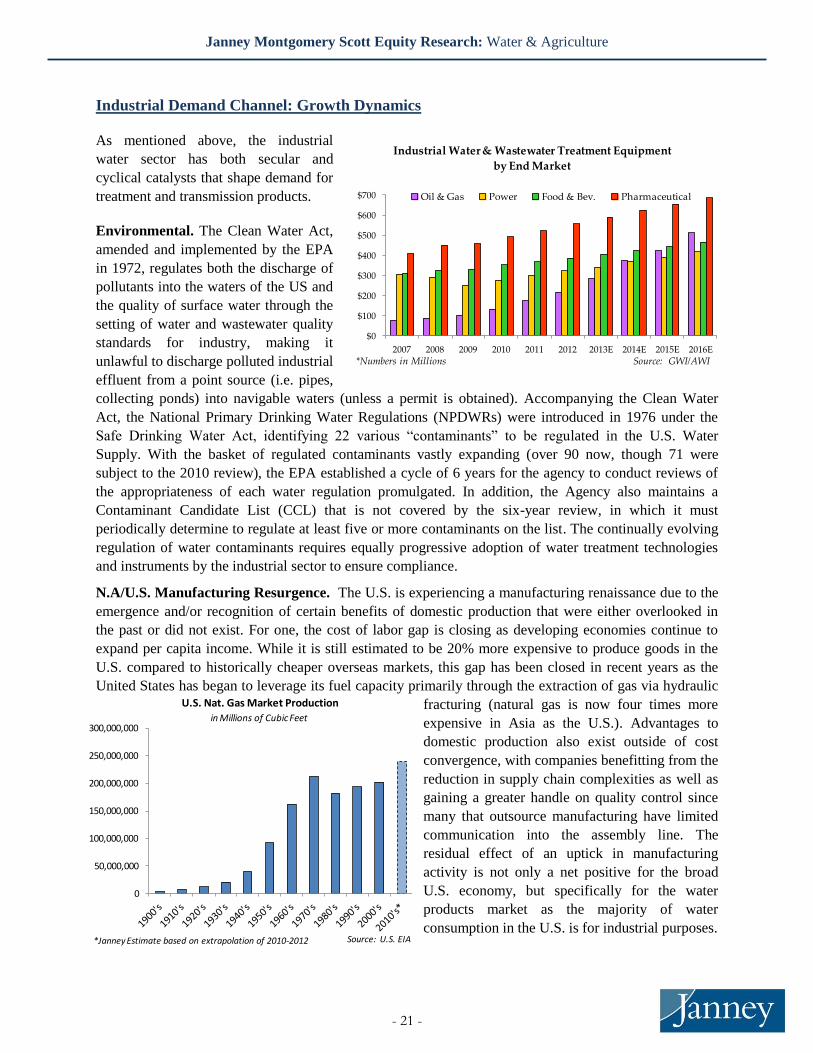
Industrial Demand Channel: Growth Dynamics
As mentioned above, the industrial
water sector has both secular and
cyclical catalysts that shape demand for
treatment and transmission products.
Environmental. The Clean Water Act,
amended and implemented by the EPA
in 1972, regulates both the discharge of
pollutants into the waters of the US and
the quality of surface water through the
setting of water and wastewater quality
standards for industry, making it
unlawful to discharge polluted industrial
effluent from a point source (i.e. pipes,
collecting ponds) into navigable waters (unless a permit is obtained). Accompanying the Clean Water
Act, the National Primary Drinking Water Regulations (NPDWRs) were introduced in 1976 under the
Safe Drinking Water Act, identifying 22 various ―contaminants‖ to be regulated in the U.S. Water
Supply. With the basket of regulated contaminants vastly expanding (over 90 now, though 71 were
subject to the 2010 review), the EPA established a cycle of 6 years for the agency to conduct reviews of
the appropriateness of each water regulation promulgated. In addition, the Agency also maintains a
Contaminant Candidate List (CCL) that is not covered by the six-year review, in which it must
periodically determine to regulate at least five or more contaminants on the list. The continually evolving
regulation of water contaminants requires equally progressive adoption of water treatment technologies
and instruments by the industrial sector to ensure compliance.
N.A/U.S. Manufacturing Resurgence. The U.S. is experiencing a manufacturing renaissance due to the
emergence and/or recognition of certain benefits of domestic production that were either overlooked in
the past or did not exist. For one, the cost of labor gap is closing as developing economies continue to
expand per capita income. While it is still estimated to be 20% more expensive to produce goods in the
U.S. compared to historically cheaper overseas markets, this gap has been closed in recent years as the
United States has began to leverage its fuel capacity primarily through the extraction of gas via hydraulic
fracturing (natural gas is now four times more
expensive in Asia as the U.S.). Advantages to
domestic production also exist outside of cost
convergence, with companies benefitting from the
reduction in supply chain complexities as well as
gaining a greater handle on quality control since
many that outsource manufacturing have limited
communication into the assembly line. The
residual effect of an uptick in manufacturing
activity is not only a net positive for the broad
U.S. economy, but specifically for the water
products market as the majority of water
consumption in the U.S. is for industrial purposes.
0
50,000,000
100,000,000
150,000,000
200,000,000
250,000,000
300,000,000
U.S. Nat. Gas Market Production
Source: U.S. EIA*Janney Estimate based on extrapolation of 2010-2012
in Millions of Cubic Feet
$0
$100
$200
$300
$400
$500
$600
$700
2007 2008 2009 2010 2011 2012 2013E 2014E 2015E 2016E
Industrial Water & Wastewater Treatment Equipment
by End Market
Oil & Gas Power Food & Bev. Pharmaceutical
Source: GWI/AWI*Numbers in Millions
- 21 -

Janney Montgomery Scott Equity Research: Water & Agriculture
Focus Issue #5: The Water/Energy Nexus
Water and energy have a codependent relationship, with the water industry needing energy to treat and
distribute water, and the energy industry needing water for everything from discovery to production and
refining. Representing 15% of the world‘s total water consumption (second only to the Agriculture
industry which requires an astounding 70%), the energy industry uses water for fuel extraction, refining
and processing, transporting and power generation, harboring a massive water equipment end market.
Energy Market Opportunity. The U.S. has long boasted the most formidable energy industry in the
world, yet the mass introduction of revolutionary drilling techniques to release ―trapped‖ oil and gas in
shale rock formations (i.e. horizontal drilling) that started in the late 1990s has taken it to new levels, with
the IEA projecting the U.S. to pass Saudi
Arabia as the largest oil producer by 2020
and become entirely energy self-reliant by
2035 (The U.S. is still the world‘s largest oil
consumer, after all). At the helm of this
transformation is America‘s transition to
natural gas, as the country‘s natural gas
potential has been estimated by the Potential
Gas Committee to be 2,384 trillion cubic feet,
which is double the estimate from ten years
ago and represents enough fuel to sustain the
U.S. economy for 110 years by itself.
As the principal fuel recovered from
hydraulic fracturing, natural gas now represents 26% of total gas consumption (vs. 17% in 1950),
representing 30% of electricity generation (vs. 18% in 1950).2 This presents an incremental opportunity
to water equipment companies as the U.S. energy industry
continues build out, and although the process water
requirement for shale gas is not massive, there is a need to
handle significant water flow as drilling brings about
produced water that must be treated (an expensive process).
In addition to the natural gas revolution is the move towards
ethanol, which is the second most water-intensive fuel type
without considering the amount of water required to produce
the underlying grains (the inclusion makes it larger than the
previously most consumptive fuel type by a factor of 10).3
With mandates set in place by the Federal government that
require 15 billion gallons of grain-based fuel per year, ethanol
production could expand even further behind efforts to raise
the 10% ethanol blends fuel requirement to 15%. Whether or
not Federal policies remain conducive to ethanol production is
yet to be seen, and while we concede that continued ethanol
production would signify sustained opportunity for water
2 "Annual Energy Review 2011." EIA.gov. U.S. Energy Information Administration, n.d. Web. 19 June 2013.
<www.eia.gov/totalenergy/data/annual/pd 3 Water Market USA 2011. Oxford, United Kingdom: American Water Intelligence, 2011. Print.
0
50
100
150
200
250
300
Water Consumption by Fuel Type(Gallons of Water/Million BTU)
Source: GWI/AWI
- 22 -

Janney Montgomery Scott Equity Research: Water & Agriculture
equipment, the benefit of U.S. energy independence alone remains indisputable and should provide
incremental opportunity to water treatment and distribution products regardless of the fuel composition.
Power Market Opportunity. The United States
consumes more electricity than the entire European
Union over the course of a year, or if you prefer, uses
more power than Russia, India, Japan, Canada and
Brazil combined.4 Thermoelectric power plants produce
89% of the United States‘ total energy, distinguishing
them as the primary users of water in the power market.
The industry‘s water footprint makes up 39% of U.S.
water withdrawals, though this only translates to 3.3%
of the U.S.‘s water consumption since much of that
water is returned to the water system from which it is
drawn. In determining the water consumption of
thermoelectric power generation, it is important to
consider the type of cooling technology implemented
since water efficiencies vary dramatically. An open-
loop cooling tower, or once-through, is sent through the system to condense the steam from the turbine
once, then returned to the original source of water about 20 degrees warmer.5 Despite net consumption
being low, the large water intake presents potential bottlenecks during drought conditions, while the
discharge of markedly warmer water carries negative environmental effects as well. Closed-loop cooling
has become the method of choice for recently constructed power plants as a result of these side effects.
The technology more efficiently uses the withdrawn water, which, although significantly increases a
plant‘s water consumption, translates into a smaller withdrawal footprint due to the recycling of cooling
water. Another alternative, although less popular, is dry cooling towers, which use air and turbines as the
cooling mechanism. While effectively eliminating water consumption, it does reduce plant efficiency due
to its reliance on ambient weather conditions (including humidity and temperature).6
4 "Central Intelligence Agency." The World Factbook. N.p., n.d. Web. 8 Nov. 2013.
<https://www.cia.gov/library/publications/the-world-factbook/rankorder/2233rank.html>. 5-6
Mielke, Erik, Laura Diaz Anadon, and Venkatesh Narayanamurti. "Water Consumption of Energy Resource
Extraction, Process and Conversion." Belfer Center for Science and International Affairs [Harvard Kennedy School]
Oct. 2010.
Tower TechnologySteam Turbine (coal,
gas,biomass)
Steam Turbine
(Nuclear)
Combined-
Cycle Turbine
IGCC
(coal)
Capital Cost of
Cooling Tech
Once-through 35,030 42,530 13,780 $19/kW
Closed-loop 480 830 260 389 $28/kW
Dry 30 30 30 $182/kW
Tower TechnologySteam Turbine (Coal,
Gas, Biomass)
Steam Turbine
(Nuclear)
Combined-
Cycle Turbine
IGCC
(coal)
Capital Cost of
Cooling Tech
Once-through 315 415 115 $19/kW
Closed-loop 405 575 195 369 $28/kW
Dry 15 15 15 $182/kW
Source: Electric Power Research Institute, Energy Technology Innovation Policy Research Group
Consumption (gal/MWh)
Withdrawals (gal/MWh)
Power Plant Cooling Towers Water Footprint
-
500
1,000
1,500
2,000
2,500
3,000
3,500
4,000
4,500
5,000
Annual Electricity ConsumptionBillions of MWH
Source: CIA World Factbook
- 23 -

Janney Montgomery Scott Equity Research: Water & Agriculture
Is Fracking Water Footprint Gradually Becoming a Thumbprint?
A combination of an abundant domestic supply and an increasing focus on low-emissions energy has
driven the EIA to project natural gas to comprise 50% of the total U.S. Gas supply by 2035. Hydraulic
fracturing technology is a popular method of extraction, unlocking natural gas through fracturing dense
shale rock formations. The fracturing of the shale rock is traditionally done with pressurized fluids
composed of at least 90% water. This provides significant opportunity for both local utilities and flow
control companies as one horizontal well in a shale formation requires 2-5 million gallons of water. After
the water is used it is then treated to remove contaminants, providing significant commercial
opportunities for water treatment companies at the end of the process as well. Indeed, fracking presents
significant opportunity for water utilities, such as Aqua America (WTR – Neutral) and American Water
(AWK – BUY), which both are engaged in frack-related water supply initiatives, but opponents fear
fracking will compromise water quality in neighboring communities. While the general concern for long-
term water quality is valid, some view its concern in fracking as exaggerated as commissioned studies
continue to represent inconclusive evidence as to the impacts of fracking on groundwater quality.
Post-fracking, millions of gallons of flowback (typically 20-50% of total water used) carries chemicals
used and collected in the fracking process that must be disposed of properly to avoid groundwater
contamination. Companies such as Nuverra (NUV-NR) provide services for the treatment and disposal of
this waste; however the popular method of dumping it in disposal wells has been linked to earthquakes in
Ohio. Waterless alternatives are gaining momentum as public outcries against the water footprint of
fracking grow louder (though hydrofracking remains by far the most prevalent method). Alternative
methods provide environmental benefits as well as economic, whereas Liquefied Propane Gas (LPG)
gel‘s unique advantage—developed by GASFRAC Energy Services (GFS-NR)—is that it reverts to vapor
while underground, which allows for 1) the propane‘s return to the surface in a recoverable form and 2)
the elimination of toxic flowback water. Nitrogen-based fracking fluids, such as Baker Hughes‘s
VaporFrac (BHI-NR), provide similar environmental benefits as nitrogen is simply released into the air
after the process, vastly reducing the cleanup of toxic flowback. Another method developed by Chimera
(CHMR-NR) uses helium, eliminating the need for heat or steam. While these techniques can carry a 50%
premium to conventional hyrdrofracking, those costs are mitigated by the savings from 75% reduced
truck traffic and highly reduced clean up costs. In addition, the alternative methods could skirt
moratoriums on fracking in states like New York who have blocked hydrofracking.
- 24 -

Janney Montgomery Scott Equity Research: Water & Agriculture
Industrial Demand Channel: Key Macro Indicators
Architecture Billings Index (ABI). The Architecture Billings Index is derived from a survey of
architectural firm principals and partners by the American Institute of Architects that tracks business
conditions the participants are facing (referred to as ―Work-on-the-boards‖). The ABI itself is a diffusion
index from this survey that uses a reading of ‗50‘ as neutral (i.e. neither expansion nor contraction).
While its predictive track record is debatable, the reading remains widely viewed as a leading economic
indicator of non-residential construction by about 9-12 months.
U.S. Capacity Utilization. The United States Federal Reserve publishes a monthly reading of the
industrial capacity utilization in the economy, expressed in a percent form. The reading indicates how
much ―slack‖ there is in the U.S. productive landscape, i.e. how much room there is for manufacturing
expansion without having to deploy capital expenditures to increase production. The reading is extremely
high-level, but does provide some indication of impending cap-ex cycles, which can drive demand for
water-related industrial infrastructure products.
U.S. Industrial Production Index. The Industrial Production Index is an economic indicator published
monthly by the Federal Reserve that measures the real output of manufacturing, mining, electric and gas
industries located within the United States. The index measures production relative to 2007, with the
average reading in 2007 assigned a ―100‖ value, and is constructed by over 300 individual series that are
comprised of market groups (products and materials) and industry groups (durable and nondurable
manufacturing, mining, etc.). Similar to capacity utilization, industrial production provides a gauge of
manufacturing activity that ultimately drives investment in industrial facilities.
U.S. Construction Spending on Power and Manufacturing. U.S. Construction Put in Place is a
monthly measure in millions of USD calculated by the U.S. Census Bureau aggregating both private and
public spending. The U.S. Private construction for Power and Manufacturing is of particular interest
given the industries‘ water dependency. The data sets‘ greatest flaw is that it is a lagging economic
indicator, but it does add to the mosaic of information on the critical industrial demand channel.
- 25 -

Janney Montgomery Scott Equity Research: Water & Agriculture
Industrial Demand Channel: Key Macro Indicators – Continued
25
30
35
40
45
50
55
60
65
Jan
-06
May
-06
Sep
-06
Jan
-07
May
-07
Sep
-07
Jan
-08
May
-08
Sep
-08
Jan
-09
May
-09
Sep
-09
Jan
-10
May
-10
Sep
-10
Jan
-11
May
-11
Sep
-11
Jan
-12
May
-12
Sep
-12
Jan
-13
May
-13
Sep
-13
Architectural Billings Index (ABI)
Source: The American Institute of Architects (AIA)
Contraction ↓
Source: The American Institute of Architects (AIA)
Expansion ↑
Commercial construction fell off dramatically during the recession, and the ABI reflected that,
posting 31 consecutive months of negative readings. While commercial construction has yet
to return to the U.S. in the fashion residential construction has, incrementally positive readings
bode well for non-residential markets.
65.0%
67.0%
69.0%
71.0%
73.0%
75.0%
77.0%
79.0%
81.0%
83.0%
Sep-02 Sep-03 Sep-04 Sep-05 Sep-06 Sep-07 Sep-08 Sep-09 Sep-10 Sep-11 Sep-12 Sep-13
Capacity Utilization
Source: U.S. Federal Reserve
Capacity Utilization fell off dramatically during the recession as a sharp reduction in demand left
companies operating well below their productive capacities. The U.S. has since rebounded off its July
2009 trough and continues to approach the 80% level that often spurs investment in new capacity.
- 26 -

Janney Montgomery Scott Equity Research: Water & Agriculture
Industrial Demand Channel: Key Macro Indicators – Continued
80
85
90
95
100
105
9/1/
2000
3/1
/20
01
9/1/
2001
3/1/
2002
9/1
/20
02
3/1/
2003
9/1/
2003
3/1
/20
04
9/1/
2004
3/1/
2005
9/1
/20
05
3/1/
2006
9/1/
2006
3/1
/20
07
9/1/
2007
3/1/
2008
9/1
/20
08
3/1/
2009
9/1/
2009
3/1
/20
10
9/1/
2010
3/1/
2011
9/1
/20
11
3/1
/20
12
9/1/
2012
3/1
/20
13
9/1
/20
13
Industrial Production (Indexed to 2007)
IndustrialProduction fell off dramatically due to the financial downturn in 2008-2009. Activity has
rebounded significantly since, reaching pre-recession levels as manufacturing strength has helped to drive
the U.S. economy back to prosperity.
Source: U.S. Federal Reserve
0
20,000
40,000
60,000
80,000
100,000
120,000
Ap
r-03
Au
g-03
De
c-03
Ap
r-04
Au
g-04
De
c-04
Ap
r-05
Au
g-05
De
c-05
Ap
r-06
Au
g-06
De
c-06
Ap
r-07
Au
g-07
De
c-07
Ap
r-08
Au
g-08
De
c-08
Ap
r-09
Au
g-09
De
c-09
Ap
r-10
Au
g-10
De
c-10
Ap
r-11
Au
g-11
De
c-11
Ap
r-12
Au
g-12
De
c-12
Ap
r-13
Au
g-13
U.S. Private Construction: Power & Manufacturing(in Millions of Dollars, Seasonally Adjusted Annual Rate)
Power (inc. Gas and Oil) Manufacturing
Construction in the Power and Manufacturing industries is a major
driver for water product sales, and the intermittent growth of these end-markets has challenged many OEMs. With power and
manufacturing comprising ~42% of the non-residential construction market, strength in these sectors will be a key component to
growth in water infrastructure product sales in the years ahead.
Source: U.S. Census Bureau
- 27 -

Janney Montgomery Scott Equity Research: Water & Agriculture
Industrial Demand Channel: Subsectors and Key Players in Each
Water is a vital ingredient in the production process for various
industries, including pharmaceuticals, food & beverage,
energy/power, mining, and pulp and paper. Water‘s versatility
renders it useful across all levels of production, serving as
anything from a raw material to a transportation method,
depending on which industry it is applied in. While the range of
uses varies dramatically, the categories of product offerings are
relatively fixed within most industries: valves and pumps to direct
the water flow, piping to transport the necessary water, water
treatment equipment (filters) to process the input and/or output
water, chemicals to assist in the treatment procedure, and water
heating and cooling equipment depending on the process needs.
The market opportunity in the water treatment market is massive,
as UNESCO estimates 300-500 million tons of heavy metals,
solvents, toxic sludge, and other wastes accumulate each year
from industry. In developing countries, this leads to 70% of
industrial wastes being dumped (untreated) into waters that
pollutes and reduces the usable water supply. This phenomenon,
combined with an industrial water productivity level well below
the international average and the sheer size of industry in the
United States supplies an attractive market opportunity for
efficient and reliable water equipment. 3
4
4
4
7
9
10
14
14
18
20
20
23
25
26
27
27
32
34
47
51
60
61
114
120
139
0 50 100 150
Russia
Hungary
Poland
Belarus
Canada
Armenia
USA
Czech Republic
France
Turkmenistan
Latvia
Italy
Germany
Netherlands
Finland
Estonia
Portugal
Spain
Norway
Ukraine
Sweden
Lithuania
Austria
Greece
Japan
Denmark
Industrial Water Productivity(Industrial Value Added/
Industrial Water Use)
Source: World Water Development Report 2, UNESCO 2006
Brief Description Key Players
Valves/
Pumps
Just as in the municipal market, the scale of water use requires reliable and durable
valves and pumps to direct the flow of water towards its required location.
Conbraco, GRC,
FELE, IEX, MWA,
PNR, RXN, Toto,
Watson-Marlow,
WTS, XYL
Piping/
Storage
Pipes allow the flow of water to and from its designated process point. With the water
dependency of industries like oil extraction and coal production, pipelines are often built
solely for the respective plants. Storage tanks are also used for water, often for heating
purposes in order to have larger amounts of hot water on demand.
FSTR, Griffin,
McWane, NES,
NWPX, U.S. Pipe
Water
Treatment
Water treatment activities are executed in a vast range of industrial activities. Whether it
is pretreatment of water for pharmaceutical purposes, or more commonly, treatment of
excess water via productive activities, the EPA enforces strict water quality requirements
that demand companies to properly treat their produced water.
CLC, DCI, GE, ECL,
NES, PLL, XYL
Water
Heating/
Cooling
The scale of industrial operations requires specifically engineered water heating (water
heaters & boilers) for both factory heating and production as well as cooling equipment
(particulary in power production) to remove excess heat emitted from production
activities, most notably in nuclear power plants.
AOS, Bradford
White, HSC,
Rheem, SPW, WTS,
XYL
Water
Treatment
Chemicals/
Disposal
While UV Disinfection continues to gain in popularity, many water treatment processes
still require water disinfectants such as chlorine, ozone, carbon, etc. In addition, many
companies offer services for safe and legal disposal of byproducts from water treatment.
CCC, CBT, TSX:CUS,
CWST, ECL, GE,
HWKN,
Products
Industrial Water Products Market
- 28 -

Janney Montgomery Scott Equity Research: Water & Agriculture
Focus Issue #6: Water Treatment Stokes Conservation
While treatment of process water represents a significant opportunity,
the treatment of produced water (resulting from processes) has become
a major focus in the initiative to decrease the water footprint of
industries. Water used from production is increasing in many
applications, particularly in the oil and gas industry as traditional
sources of energy are exhausted. Expanding alternative sources, such
as fracking and enhanced oil recovery, require enormous water
consumption and produce greater amounts of water as well, leading
companies like Shell to forecast an increase from a 2.7x water/oil
extraction ratio in 2007 to 5x by 2025. With this said, other
applications are becoming more water-efficient, particularly in power
plants, the industry‘s largest consumer of water, as the transition of
coal and oil-fired plants to gas plants reduces their water footprint, with
gas being less water-intensive than other power generation alternatives.
Mining and ballast water also require high amounts of water filtration,
with many industrial companies ―pre-treating‖ water in-house and
recycling in order to combat rising water and treatment costs. Indeed,
many types of water filtration are available, but certain technologies
have experienced growth that is outpacing the market, as zero liquid
discharge (ZLD) systems lead the way with a 27% CAGR from 2007
through 2016, easily beating the market‘s rate of 4.1%. ZLD as well as
ion exchange systems are growing in popularity because they leave
little waste after the water is treated via evaporation technology or
alteration of its chemical composition. The latest technology offered by
companies like Xylem provides an opportunity for firms to both
enhance their environmental performance and reduce costs.
Although a company‘s reuse of treated
wastewater for additional industrial
processes is the preferred method, many
countries are moving towards more
expansive methods of recycling, such as
irrigation and drinking water. Despite the
so-called ―yuck factor‖, the reality is that
over 1 billion people do not have access to
safe drinking water worldwide, and the
greater acceptance of this proven
technology would increase the prospects of
a sustainable water supply, and improve the
possibility of meeting basic needs in
poverty-stricken regions.
0
50
100
150
200
250
300
350
2007 2008 2009 2010 2011 2012 2013 2014 2015 2016
High Growth Water & WW Treatment Equipment
UF/MF Membranes (CAGR: 16.5%) Reverse Osmosis/NF (17.2%)
Ion Exchange / EDI (11.1%) Zero Liquid Discharge (27%)
*In Millions Source: GWI, JCM
70%
3%
86%
60%
10%
100%
30%
16%
9%
100%
50%
71%
78%
100%
100%
61%
87%
23%
63%
58%
61%
115%
40%
75%
10%
23%
7%
1%
15%
131%
35%
79%
41%
3%
0% 100% 200%
Vietnam
USA
UAE
Turkey
Tunisia
Syria
Sd. Arabia
Nicaragua
Mexico
Libya
Lebanon
Kazakhstan
Jordan
Japan
Egypt
China
Argentina
Global Wastewater Profile:
Treatment & Use
Treated WW (% of Produced)
Used WW (% of Treated)
Source: FAO Aquastat, JCM
- 29 -

Janney Montgomery Scott Equity Research: Water & Agriculture
Industrial Demand Channel: Key Players Comparable Analysis
Ticker PriceMarket
CapSales Ent. Value Fwd P/E
EV/
EBITDA
JMS
Analyst
Water
Exposure
Valves/Pumps
Gorman-Rupp Co. GRC $39.43 $828.1 $388.7 $803.3 23.7x 15.3x Connors High
Franklin Electric Co., Inc. FELE $39.84 $1,898.2 $941.0 $1,978.5 20.7x 12.7x NR High
IDEX Corporation IEX $69.74 $5,657.2 $1,994.3 $6,041.9 21.2x 12.9x Knight Medium
Mueller Water Products, Inc. MWA $8.80 $1,392.5 $1,120.8 $1,869.7 26.5x 11.8x Connors High
Pentair Ltd. PNR $68.05 $13,564.7 $7,313.9 $16,020.2 17.9x 18.6x NR High
Rexnord Corporation RXN $23.40 $2,287.9 $2,035.2 $4,066.9 14.8x 10.6x Connors High
Xylem Inc. XYL $33.94 $6,261.5 $3,773.0 $7,069.5 18.3x 12.4x Connors High
Watts Water Technologies, Inc. WTS $58.61 $2,068.9 $1,470.2 $2,150.0 21.3x 11.7x Connors High
Average 20.5x 13.2x
Sourcing & Distribution
LB Foster Co. FSTR $43.75 $451.9 $582.2 $355.9 15.2x 6.8x NR Low
Nuverra Environmental Solutions, Inc. NES $1.46 $379.5 $600.8 $904.7 NM 13.2x NR Medium
Northwest Pipe Co. NWPX $37.40 $353.4 $496.5 $431.8 24.9x 8.8x NR Medium
Average 20.1x 9.6x
Water Treatment
CLARCOR Inc. CLC $58.97 $2,953.1 $1,125.9 $2,765.7 22.2x 13.0x NR Low
Ecolab Inc. ECL $106.43 $32,067.3 $12,739.7 $38,992.9 26.0x 15.7x NR Low
Nuverra Environmental Solutions, Inc. NES $1.46 $379.5 $600.8 $904.7 NM 13.2x NR Medium
General Electric Company GE $27.05 $273,674.8 $144,912.0 $657,920.8 15.5x 22.8x NR Low
Pall Corporation PLL $81.87 $9,068.7 $2,648.1 $8,769.6 24.0x 15.3x Knight Low
Xylem Inc. XYL $33.94 $6,261.5 $3,773.0 $7,069.5 18.3x 12.4x Connors High
Average 21.2x 15.4x
Water Heating/Cooling
AO Smith Corp. AOS $53.20 $4,853.1 $2,119.2 $4,604.1 24.5x 15.1x Connors High
Harsco Corporation HSC $27.13 $2,188.5 $2,981.5 $3,213.3 22.5x 7.5x NR Low
SPX Corporation SPW $94.13 $4,269.2 $5,033.4 $5,479.4 19.5x 10.6x Baliotti Low
Watts Water Technologies, Inc. WTS $58.61 $2,068.9 $1,470.2 $2,150.0 21.3x 11.7x Connors High
Xylem Inc. XYL $33.94 $6,261.5 $3,773.0 $7,069.5 18.3x 12.4x Connors High
Average 21.2x 11.4x
Water Treatment Chemicals/Disposal
Calgon Carbon Corporation CCC $20.48 $1,118.3 $556.6 $1,136.9 21.1x 11.6x NR High
Canexus Corporation TSX:CUS $6.18 $939.4 $558.9 $1,347.0 NM 12.2x NR High
Casella Waste Systems Inc. CWST $5.65 $225.6 $466.3 $726.1 NM 9.7x NR Low
Ecolab Inc. ECL $106.43 $32,067.3 $12,739.7 $38,992.9 26.0x 15.7x NR Low
General Electric Company GE $27.05 $273,674.8 $144,912.0 $657,920.8 15.5x 22.8x NR Low
Hawkins Inc. HWKN $35.85 $380.2 $354.5 $336.0 18.5x 7.8x NR High
Average 20.2x 13.3x
Source: CapIQ, Company Documents
Industrial Demand Channel: Publicly-Traded Company Comp Sheet
- 30 -

Janney Montgomery Scott Equity Research: Water & Agriculture
Construction Demand Channel: An Overview
According to the Bureau of Economic Analysis, the construction industry represented 3.6% of GDP on a
value-added basis in 2012. While materially smaller than the contribution from manufacturing (12%), this
$640 billion industry is substantially larger than
utilities, agriculture, or mining (other key water
product end-markets). The market opportunity for
water products in this space is massive, with each
building constructed requiring significant
plumbing infrastructure. Furthermore, a robust
repair and replacement opportunity exists due to
delayed capital investments by homeowners
during the economic downturn, which companies
such as Rexnord (RXN-Neutral) have exploited
recently with its Zurn brand. Although margins are
somewhat deflated in the aftermarket, remodeling
is an attractive demand channel for water
equipment during down cycles in new
construction activity, and one that has been rapidly
growing as of late (Leading Indicator of Remodeling is running at +9% YoY, fastest rate since 2006).
In contrast to the ―megatrend‖ growth stories in the industrial, agriculture, and municipal end markets, the
construction market for water products is more cyclical than its secular counterparts. Driven
predominately by macroeconomic factors, including financing availability, income levels and general
consumer outlook, the construction
market is split between two segments:
residential and nonresidential. Indeed,
every structure includes some degree
of water infrastructure, but there are
certain key structures that are highly
water intensive. For instance, the full
service nature of a household provides
a swift tailwind for plumbing
products, as do commercial structures
such as lodging and hospitals. These
buildings amplify many of the
residential uses for water to mass
scale, resulting in extremely water
intensive operations that require
complex and reliable systems.
To monitor the state of the construction demand channel, we follow a series of economic indicators,
including: residential housing permits and starts, the Architectural Billings Index, the Leading Index of
Remodeling Activity (LIRA) and Private Construction Put-in-Place. These readings help provide insight
into the demand environment for products sold into the construction market, including pumps and valves,
HVAC, fire protection, point of view systems and water filtration.
209 gal. per
room
231 gal. per
staffed bed
441 gal. per
HH
0
50
100
150
200
250
300
350
400
450
500
Lodging Hospitals Residential
Daily Water Usage
Sources: FDEP, AWWA and Practice Greenhealth
45%
5%
60%
9% 10%
55%
30% 29%
13%
23%
0%
10%
20%
30%
40%
50%
60%
70%
Watts (WTS) Mueller (MWA) AO Smith
(AOS)*
Xylem (XYL) Rexnord (RXN)
Revenue Breakdown: End Market Exposure
Residential Commercial
*Janney Estimate Source: Company Documents
- 31 -

Janney Montgomery Scott Equity Research: Water & Agriculture
Construction Demand Channel: Market Opportunity
As noted previously, the scale of the construction market in the United States is enormous, and in order to
properly examine the opportunity for water infrastructure companies, the analysis is divided into two
distinct sub-markets: residential and nonresidential.
Residential. U.S. Residential Construction was up 21% in August 2013 to $340 billion (annualized),
representing 53% of total private construction in the past twelve months within the United States (with
27% of private construction comprised of single-family homes alone). The market opportunity for water
products within this market is
significant, as the average cost of
plumbing in a new home totals
$11,000. With the 769,000 homes
completed in the twelve months ended
August 2013, this totals roughly $8.5
billion spent on plumbing in the past
year, and while a good portion of that
is attributed to labor, it nonetheless
illustrates a substantial source of
demand for water product companies.
Remodeling is a sizeable market as
well, projected by Harvard Joint
Center for Housing to reach $150
billion annually by the end of 2013, or
~44% of residential construction.
Nonresidential. Private non-residential construction in the United States totaled just over $300 billion in
2013, with power, manufacturing, office buildings, health care, and lodging (to a lesser extent) posing as
large contributors. In addition to the energy and manufacturing industries, commercial construction is also
a significant driver of water product
demand. Office buildings ($29B),
health care ($29B), and lodging
($12B) are acutely relevant as these
structures require extensive water
infrastructure to ensure the
compliance with stringent plumbing
codes and standards, such as the
soon to take effect ―lead-free‖
regulations. This regulated dynamic
provides barriers to entry for
competing firms, allowing
companies like Watts (WTS-
Neutral) to adopt premium pricing
with limited threat of market entry
from low-cost manufacturers.
$0
$200
$400
$600
$800
$1,000
$1,200
$1,400
$1,600
$1,800
$2,000
$0
$50,000
$100,000
$150,000
$200,000
$250,000
$300,000
$350,000
$400,000
$450,000
Non-Residential Construction vs. Watts & Mueller TTM Revenue
Non-Rez Construction TTM (L. Axis) WTS TTM Rev (R. Axis) MWA TTM Rev (R. Axis)
Source: U.S. Census Bureau, CapIQ* Numbers in Millions
$1,000
$1,200
$1,400
$1,600
$1,800
$2,000
$2,200
$0
$50,000
$100,000
$150,000
$200,000
$250,000
$300,000
$350,000
$400,000
Residential Construction vs. Watts & Rexnord Annualized Revenue
Residential Construction LTM (L. Axis) WTS Rev LTM (R. Axis) RXN Rev LTM (R. Axis)
Source: U.S. Census Bureau, CapIQ*Numbers in Millions
- 32 -

Janney Montgomery Scott Equity Research: Water & Agriculture
Construction Demand Channel: Residential Growth Dynamics
Record low interest rates spawned a significant
resurgence in the housing market in 2011-2013,
and the renewed construction activity has been
touted by many as instrumental to the U.S.
turning the page from the ―great recession‖. Yet,
residential housing only contributed 2.7% of GDP
in 1Q2013, which at first blush suggests that
perhaps its contribution to economic activity is
more perception than reality. However, the reason
for the sector‘s vital importance to the economy is
the same argument for its importance to the water
products industry: the spillover effect. As homes
and developments are built, they must be outfitted
with water distribution systems and the
accompanying appliances and infrastructure
within the structure.
This point has been well illustrated, as companies like Mueller Water Products (MWA-Neutral) have
clawed back to profitability on the back of an improved housing market. With this noted, a largely unsung
contributor to the water products industry has been the residential remodeling market, which came alive
in the second half of 2012 and buoyed demand for household products such as faucets, valves, drains and
PEX piping while the housing market decided which way to turn. With 44% of the housing stock in
America constructed before the 1970s, and much in the way of home repairs and remodeling abandoned
in recent years due to the challenging economic conditions, this supplementary demand channel will
provide a long-term (and generally less cyclical) driver for water products as the remodeling and repair
market is expected to accelerate its upward trajectory to a run rate of ~$150 billion by the end of 2013,
expanding 16% over 2012.
Source: U.S. Census Bureau, Industry Sources
Replacement Market Dynamics
68.7
88.4
102.3
119.6124.5 128.2 130.1 132.2
0.0
20.0
40.0
60.0
80.0
100.0
120.0
140.0
1980 1985 1990 1995 2000 2005 2010 2011
U.S. Housing Stock(Millions of Units)
2000s12%
1990s12%
1980s13%
1970s19%
1960s12%
Before 1960s
32%
U.S. Housing Stock by Decade of Construction
3.24
2.89 2.932.82
2.72.52
2.272.42 2.43
0
0.5
1
1.5
2
2.5
3
3.5
4
4.5
1995 1997 1999 2001 2003 2005 2007 2009 2011
Housing InadequacyOwner-Occupied Homes Deemed Moderately or
Severely Inadequate (Millions)
After drifting downward for a number of years, housing inadequacy has begun shifting upward off the trough of the housing market as owners delay necessary improvements.
Source: JCHS
0
20,000
40,000
60,000
80,000
100,000
120,000
140,000
1980 1985 1990 1995 2000 2005 2010
U.S. Housing Stock(Millions of Units)
Occupied Vacant
- 33 -

Janney Montgomery Scott Equity Research: Water & Agriculture
Construction Demand Channel: Nonresidential Growth Dynamics
While residential construction is indeed a
strong driver for water product demand, many
companies cite the commercial construction
market as a larger portion of their end market
exposure. Commercial structures require
analogous functionality to residential
structures, with buildings such as hospitals
requiring similarly functional products
(faucets, valves, drainage, water filtration,
etc.) yet on a larger scale. The amplified size
of each application would perceivably allow
for healthier margins, yet the large project
bias of nonresidential construction can lend to
pricing pressure from companies attempting
to win the contract. In the years since 2008,
challenging economic conditions have caused commercial construction demand to be a headwind to
profitability for companies serving the end-market. The tide is looking to turn however, as investment has
stabilized over the past two years and is expected to post incremental growth from 2013 throughout 2016.
Commercial construction‘s evolution into a tailwind should spawn healthy growth for water equipment
companies over the balance of the next few years, as firms are able to exploit both rebounding
commercial demand and resurgent residential construction activity.
0
10,000
20,000
30,000
40,000
50,000
60,000
Private Construction: Water Intensive Structures
Lodging Hospitals Office
Source: U.S. Census Bureau*2013 as of August data
$288 $287 $281$291
$327$337
$287
$236$223 $223
$214$225
$237$247
0
50
100
150
200
250
300
350
400
2003 2004 2005 2006 2007 2008 2009 2010 2011 2012 2013E 2014E 2015E 2016E
Non-Residential Building Construction(Real USD in Billions)
Source: IHS, Industry Sources
- 34 -

Janney Montgomery Scott Equity Research: Water & Agriculture
Construction Demand Channel: Key Indicators
Housing Permits. Housing permits are a leading indicator of housing construction in the United States.
The U.S. Census Bureau conducts a monthly recording of the housing permits that have been awarded in
the twelve months up until the end date reported. The purpose of the index is to get an early read on
trends in new home construction in the coming months.
Housing Starts. Released by the U.S. Census Bureau, housing starts measures new residential
construction projects that have begun during the twelve months leading up to the end date reported. Water
product sales see a direct benefit from increased housing starts, but there is usually 1-2 quarter lag from a
significant change in housing starts to when the benefit/detriment is recognized by companies like Watts
and Rexnord.
Architecture Billings Index. The ABI is a monthly survey of principals and partners at architecture firms
in the United States that serves as an indicator of commercial construction. The survey, conducted by the
American Institute of Architects, leads nonresidential construction activity by about 9-12 months, with
readings over the ‗50‘ mark indicating billings increasing in the month, and vise versa.
Leading Index of Remodeling Activity (LIRA). The Leading Index of Remodeling Activity is a
quarterly study conducted by the Joint Center for Housing Studies of Harvard University that estimates
national homeowner spending on improvements for the current quarter and subsequent three quarters.
Measured as both an absolute dollar value and annual rate of change, the indicator helps identify
inflection points in the business cycle of home improvement through supplying a short-term outlook on
homeowner remodeling activity.
Private Construction Put in Place. Private Construction Put-in-Place is a survey conducted by the
United States Census Bureau that estimates the total dollar value of construction work done in the private
sector within the U.S. in the twelve months up until the reporting date. The measure includes the cost of
architectural/engineering work, labor and materials, overhead, interest and taxes, and contractor profits.
- 35 -

Janney Montgomery Scott Equity Research: Water & Agriculture
Construction Demand Channel: Key Indicators - Continued
0
500
1,000
1,500
2,000
2,500
U.S. Residential Permits (000s)
After reaching record heights in 2005 (permits are a leading indicator of the housing cycle), U.S.
Residential permits experienced an extended slump from 2006 to mid 2009. The recovery in permit activity (though still below 2005 levels)
bodes well for water infrastructure companies that sell into the residential construction industry.
Source: US Census Bureau
0
500
1,000
1,500
2,000
2,500
U.S. Housing Starts (000s)
U.S. housing starts have rebounded from the trough experienced in 2009, and the percolation in residential construction has been a boon to the U.S. economic recovery. Nonetheless, activity in the housing market still remains well below the
levels experienced from 2000 through 2006.
Source: United States Census BureauSource: United States Census Bureau
- 36 -

Janney Montgomery Scott Equity Research: Water & Agriculture
Construction Demand Channel: Key Indicators - Continued
25
30
35
40
45
50
55
60
65
Jan
-06
May
-06
Sep
-06
Jan
-07
May
-07
Sep
-07
Jan
-08
May
-08
Sep
-08
Jan
-09
May
-09
Sep
-09
Jan
-10
May
-10
Sep
-10
Jan
-11
May
-11
Sep
-11
Jan
-12
May
-12
Sep
-12
Jan
-13
May
-13
Sep
-13
Architectural Billings Index (ABI)
Source: The American Institute of Architects (AIA)
Contraction ↓
Source: The American Institute of Architects (AIA)
Expansion ↑
Commercial construction fell off dramatically during the recession, and the ABI reflected that,
posting 31 consecutive months of negative readings. While commercial construction has yet
to return to the U.S. in the fashion residential construction has, incrementally positive readings
bode well for non-residential markets.
$60
$70
$80
$90
$100
$110
$120
$130
$140
$150
$160
2Q-2
000
4Q-2
000
2Q-2
001
4Q-2
001
2Q-2
002
4Q-2
002
2Q-2
003
4Q-2
003
2Q-2
004
4Q-2
004
2Q-2
005
4Q-2
005
2Q-2
006
4Q-2
006
2Q-2
007
4Q-2
007
2Q-2
008
4Q-2
008
2Q-2
009
4Q-2
009
2Q-2
010
4Q-2
010
2Q-2
011
4Q-2
011
2Q-2
012
4Q-2
012E
2Q-2
013E
4Q-2
013E
2Q-2
014E
Leading Index of Remodeling ActivityHomeowner Improvements (Four-Quarter Moving Total $Billions)
Source: Harvard University Joint Center for Housing Studies
Demand in the remodeling market is expected to tick up notably over the next quarter (and years, in our view) for a number of reasons. 44% of
homes in the United States were constructed during or before the 1970s, and with many homeowners delaying housing improvements during the recession, activity is now percolating as investors pursue delayed repairs.
- 37 -

Janney Montgomery Scott Equity Research: Water & Agriculture
$0
$200,000
$400,000
$600,000
$800,000
$1,000,000
$1,200,000Fe
b-0
0
Au
g-0
0
Feb
-01
Au
g-0
1
Feb
-02
Au
g-0
2
Feb
-03
Au
g-0
3
Feb
-04
Au
g-0
4
Feb
-05
Au
g-0
5
Feb
-06
Au
g-0
6
Feb
-07
Au
g-0
7
Feb
-08
Au
g-0
8
Feb
-09
Au
g-0
9
Feb
-10
Au
g-1
0
Feb
-11
Au
g-1
1
Feb
-12
Au
g-1
2
Feb
-13
Au
g-1
3
U.S. Private Construction Put-in-Place(in Millions of Dollars, Seasonally Adjusted Annual Rate)
Residential Construction Non-Residential Construction Total Private Construction
U.S. Private Construction bottomed out in early 2011 and has struggled to regain a level on par with pre-recession levels since.
With this said, private construction activity has exhibited an decidedly upward trajectory in the past 18 months due initially
to a resurgence in residential construction, with commercial construction adding gains also adding gains more recently.
Source: U.S. Census Bureau
- 38 -

Janney Montgomery Scott Equity Research: Water & Agriculture
Commercial Demand Channel: Subsectors and Key Players in Residential Market
The water infrastructure industry provides countless products to residential construction, equipment that
enables everyday living through ensuring running water and warm homes. The vast majority of these are
―behind-the-wall‖ products whose primary purpose is plumbing, like Watts Water‘s (WTS-BUY) shutoff
valves or water hammer arrestors. These products allow for the functionality of decorative products, like
toilets and sinks by Zurn (owned by RXN-Neutral) or water heaters via General Electric (GE-NR) and
A.O. Smith (AOS-BUY). Within the decorative classification there are a vast array of functions, with
Watts boasting a number of offerings that enable it to satisfy numerous plumbing needs. Other firms in
the industry choose to offer a more focused product to exploit their expertise, such as Conbraco (Private)
who focuses on valves or A.O. Smith, whose focus on the water heating industry has allowed it to achieve
leading market share in both the U.S. and China. Xylem (XYL-BUY) falls somewhere in the middle,
providing many water infrastructure products while choosing not to participate in the decorative products
category.
Although these products are sold to similar end markets, their functions are complimentary and most
applications are non-discretionary for homes and businesses, preventing cannibalization or product
substitution that municipal markets may face if, for instance, a city chose to invest in water meters rather
than infrastructure diagnostics. To illustrate, when a house is constructed it requires valves to monitor the
flow of water; water heating units for showers, cooking and cleaning; drainage systems for showers; and
decorative products such as faucets and showerheads. Luxuries like radiant under-floor heating and
environmentally friendly and energy efficient products such as tankless or solar charging water heaters
are gaining larger popularity in homes as well. Internationally, water heater sales are also experiencing
significant opportunity due in large part to the expansion of the middle class in emerging markets.
Alternative Energy
•Solar Water Heating Systems
•Solar Control Packages•Geothermal ControlPackages
Laundry Room
•Washing Machine Shutoff Valves•Water Hammer Arrestors•Gas/Water Connectors
Water Heater / Boiler
•Conventional/TanklessWater Heaters
•Gas/Electric Boilers
•Temp/Pressure Release Valves•Backflow Preventers
Xylem•Heating & Hot Water SystemPumps
•Steam and Boiler Controls
Bathroom
•Decorative Products•Tempering/Stop Valves•Electric Tile Warming•Waste Drains•Hot Water RecirculationSystems
Kitchen
•Mixing/Stop Valves•Metal/Plastic Tubular products•Electric Tile Warming
•Point-of-Use RO Water Filtration Systems
Radiant Heat Products
•Radiant Underfloor HeatingSystems
•Electronic TemperatureControls
Water Products - Residential
Source: Janney Capital Markets
- 39 -

Janney Montgomery Scott Equity Research: Water & Agriculture
Construction Demand Channel: Subsectors and Key Players in Nonresidential Market
Many products needed in commercial applications are comparable to those used in residential
applications, including: water heaters, backflow preventers and point-of-view products like toilets.
However, the amount of water processed in commercial applications leads to the need for additional
products, i.e. centrifugal pumps and reverse osmosis filtration systems. In particular, commercial
applications in the kitchen require numerous advancements to ensure the safety, sanitation, and
functionality of the kitchen. While some establishments may invest in products like beverage dispensing
and chilling pumps, most commercial kitchens will have grease interceptors, drainage systems, and water
filtration systems for beverages. Fire protection is another instance where the commercial scale creates
additional product categories and drives incremental demand, opening up the market for Gorman-Rupp
(GRC-BUY) and other fire protection system companies who offer fire sprinkler piping, with valves and
sprinkler heads supplied by Watts.
Considering the operations of a commercial property, wastewater drainage will be integral in achieving
efficient and safe operations. While there must be roof and floor drains throughout any building, effluent
drainage systems are of vital importance to ensure the proper and safe disposal of waste byproducts.
Indeed, as the price of water treatment and water itself become more expensive, opportunities exist for
firms to enhance their operational efficiency while also reducing costs through either ―pre-treatment‖ of
water in-house or recycling of used water. Another option is to leverage resources independent of
operations, with offerings such as solar-powered rain barrel pump systems being used to harvest
otherwise underutilized rainfall and solar energy for irrigation purposes.
HVAC
•Water heaters & boilers
G •Various Pumps
•Radiant under floor heating•Expansion valves
Kitchen
•Gas and Water Shutoff Valves•Metal/Plastic Tubular products•Point-of-view products•Steel piping and drains•Grease interceptors•Water Filtration Systems
Xylem•Beverage Dispensing/Chilling Pumps•Water Filtration Systems
Alternative Energy
•Solar Control Packages
•Solar-powered rain barrel pump system
Fire Protection
•Centrifugal Pumps & Systems
•Piping Systems•Valves, couplings, fittings, etc.
•Backflow Preventers•Transition Risers•RF PEX Tubing & Sprinkler Fittings
•Fire Pumps & Systems
Irrigation
•Backflow Preventers/Enclosures•Auto Control/Pressure Reducing Valves•Shutoff/Butterfly/Release Valves
•Water Lift & Booster Pump Station & Controls•Self Priming Centrifugal Pumps
Water Products - Commercial
Filtration/Potable Water
•Gas Connectors/ Various Valves•PEX Plumbing Systems•Backflow Preventers•RO Filtration Systems
•RO Filtration Systems•NF membrane systems•Filter Cartridges and housings•Rapid Gravity Media filtration
Wastewater Drainage
•Roof/Floor Drains•Trench Drains•Acid Waste Systems•Cleanouts•Interceptors•Fixture Carriers
•Sump, effluent and sewage wastewater removal and drainage products
•Electronic temp. controls, manifolds•Steam traps, strainers•Feed water regulators
•Circulator Pumps•Heating/Hot Water pumps•Steam/Boiler controls
Source: Janney Capital Markets
- 40 -

Janney Montgomery Scott Equity Research: Water & Agriculture
Construction Demand Channel: Key Players Comparable Analysis
Ticker PriceMarket
CapSales Ent. Value Fwd P/E
EV/
EBITDA
JMS
Analyst
Water
Exposure
HVAC
AO Smith Corp. AOS $53.20 $4,853.1 $2,119.2 $4,604.1 24.5x 15.1x Connors High
Xylem Inc. XYL $33.94 $6,261.5 $3,773.0 $7,069.5 18.3x 12.4x Connors High
Watts Water Technologies, Inc. WTS $58.61 $2,068.9 $1,470.2 $2,150.0 21.3x 11.7x Connors High
General Electric Company GE $27.05 $273,674.8 $144,912.0 $657,920.8 15.5x 22.8x NR Low
Regal Beloit Corporation RBC $73.31 $3,303.9 $3,084.0 $3,672.1 15.7x 8.7x Burke Low
Average 19.0x 14.1x
Fire Protection
Gorman-Rupp Co. GRC $39.43 $828.1 $388.7 $803.3 23.7x 15.3x Connors High
IDEX Corporation IEX $69.74 $5,657.2 $1,994.3 $6,041.9 21.2x 12.9x Knight Medium
Mueller Water Products, Inc. MWA $8.80 $1,392.5 $1,120.8 $1,869.7 26.5x 11.8x Connors High
Watts Water Technologies, Inc. WTS $58.61 $2,068.9 $1,470.2 $2,150.0 21.3x 11.7x Connors High
Xylem Inc. XYL $33.94 $6,261.5 $3,773.0 $7,069.5 18.3x 12.4x Connors High
Average 22.2x 12.8x
Irrigation
Franklin Electric Co., Inc. FELE $39.84 $1,898.2 $941.0 $1,978.5 20.7x 12.7x NR High
Gorman-Rupp Co. GRC $39.43 $828.1 $388.7 $803.3 23.7x 15.3x Connors High
Toro Co. TTC $58.31 $3,332.8 $1,998.4 $3,395.1 20.4x 11.8x NR Medium
Watts Water Technologies, Inc. WTS $58.61 $2,068.9 $1,470.2 $2,150.0 21.3x 11.7x Connors High
Xylem Inc. XYL $33.94 $6,261.5 $3,773.0 $7,069.5 18.3x 12.4x Connors High
Average 20.9x 12.8x
"Decorative" Plumbing Products
Fortune Brands Home & Security, Inc. FBHS $40.58 $6,745.0 $4,003.4 $6,947.1 21.7x 17.1x NR High
General Electric Company GE $27.05 $273,674.8 $144,912.0 $657,920.8 15.5x 22.8x NR Low
Masco Corporation MAS $20.46 $7,304.0 $8,256.0 $9,654.0 19.1x 12.3x NR High
Rexnord Corporation RXN $23.40 $2,287.9 $2,035.2 $4,066.9 14.8x 10.6x Connors High
Watts Water Technologies, Inc. WTS $58.61 $2,068.9 $1,470.2 $2,150.0 21.3x 11.7x Connors High
Average 18.5x 14.9x
Valves & Pumps
Colfax Corporation CFX $57.84 $5,894.1 $4,063.2 $7,002.9 24.9x 13.6x Burke Low
CIRCOR International, Inc. CIR $76.80 $1,351.0 $845.4 $1,314.5 21.5x 14.4x NR Low
Gorman-Rupp Co. GRC $39.43 $828.1 $388.7 $803.3 23.7x 15.3x Connors High
Franklin Electric Co., Inc. FELE $39.84 $1,898.2 $941.0 $1,978.5 20.7x 12.7x NR High
Flowserve Corp. FLS $70.19 $9,789.3 $4,893.4 $10,790.2 18.6x 12.5x NR High
IDEX Corporation IEX $69.74 $5,657.2 $1,994.3 $6,041.9 21.2x 12.9x Knight Medium
Masco Corporation MAS $20.46 $7,304.0 $8,256.0 $9,654.0 19.1x 12.3x NR High
Mueller Water Products, Inc. MWA $8.80 $1,392.5 $1,120.8 $1,869.7 26.5x 11.8x Connors High
Pentair Ltd. PNR $68.05 $13,564.7 $7,313.9 $16,020.2 17.9x 18.6x NR High
Rexnord Corporation RXN $23.40 $2,287.9 $2,035.2 $4,066.9 14.8x 10.6x Connors High
SPX Corporation SPW $94.13 $4,269.2 $5,033.4 $5,479.4 19.5x 10.6x Baliotti Low
Xylem Inc. XYL $33.94 $6,261.5 $3,773.0 $7,069.5 18.3x 12.4x Connors High
Watts Water Technologies, Inc. WTS $58.61 $2,068.9 $1,470.2 $2,150.0 21.3x 11.7x Connors High
Average 20.6x 13.0x
Water Filtration
AO Smith Corp. AOS $53.20 $4,853.1 $2,119.2 $4,604.1 24.5x 15.1x Connors High
CLARCOR Inc. CLC $58.97 $2,953.1 $1,125.9 $2,765.7 22.2x 13.0x NR Low
Crane Co. CR $62.98 $3,662.3 $2,543.6 $3,592.8 14.5x 9.1x NR Medium
Watts Water Technologies, Inc. WTS $58.61 $2,068.9 $1,470.2 $2,150.0 21.3x 11.7x Connors High
Xylem Inc. XYL $33.94 $6,261.5 $3,773.0 $7,069.5 18.3x 12.4x Connors High
Average 20.2x 12.2x
Source: CapIQ, Company Documents
Construction Demand Channel: Publicly Traded Company Comp Sheet
- 41 -

Janney Montgomery Scott Equity Research: Water & Agriculture
Agriculture Demand Channel: Irrigation Overview
The United States has nearly 200 million farmed acres, and
of that amount 55 million acres are irrigated, or
approximately 28%. While in 1998 flood and gravity
irrigation represented 50% of irrigation systems in the U.S.,
by 2008 that had shrunk to 39%, with center pivots
expanding 11 percentage points to comprise 46% of
irrigation systems today. The move towards more advanced
methods of irrigation stems from a concentration of
intermittent drought conditions and farmers‘ increased
concern over rising water and energy costs. The upward
trajectory of input costs will likely continue to drive
demand for more efficient products, however the influence
of weather on the adoption trends for center pivot systems
results in volatile swings in annual demand.
Given the significant price point of center pivots at just
above $80,000 fully installed, fluctuations in net farm
income can have a material influence on demand in the
short run as farmers, on the margin, are less likely to
pursue such a large capital investment in challenging
economic conditions. Net farm income largely moves with soft commodity prices (most notably corn),
and although the adoption of crop insurance has helped
smooth out farmers‘ income statements, commodity
prices still largely govern farming profits. While
challenging farming weather conditions are generally
dismayed by the agriculture machinery industry, times
of drought actually translate into boom years for
irrigation companies (seen in 2012), while wet
conditions typically pressure sales.
The most influential (and direct) water end-market in
agriculture undoubtedly belongs to irrigation, yet the
application of precision agriculture and new, more
efficient farm machinery also aids in the movement to
reduce water consumption. In order to anticipate
demand trends in these markets, we follow a number of
different metrics that amalgamate to convey a general
direction of the ag demand channel: net farm income,
farmland values, corn prices, and farm debt. Shifts in
the market conditions typically constitute
commensurate shifts in the performance of the ag
companies, though certain conditions may supply
different conclusions for each product offering.
40%
5%
0%
5%
10%
15%
20%
25%
30%
35%
40%
45%
Flood/Furrow
Irrigation
Center Pivot
Irrigation
Irrigation Water Wastage
Factors by Method
Source: OECD; UNEP; JMS
35%
50%
15%
46%
39%
15%
0%
10%
20%
30%
40%
50%
60%
Pivots Gravity Other
Farm and Ranch Irrigation Survey:
System Type
1998 2008
Source: USDA
- 42 -

Janney Montgomery Scott Equity Research: Water & Agriculture
Agriculture Demand Channel: Irrigation Market Opportunity
The long-term drivers in the
agriculture industry are among the
most compelling in any of the
demand channels we have
discussed. With global arable acres
per capita steadily declining,
population and subsequent food
consumption increasing, and gross
water consumption steadily on the
rise, the need for greater
productivity in the farm sector will
be a driver for the decades to come.
Indeed, increased output is the
obvious advantage of center pivot
adoption, yet pivot and lateral systems also have an edge over competing irrigation techniques because
they: a) offer a speedy payback period due to water and energy cost reductions, b) reduce contamination
of local water supplies resulting from fertilizer and chemical runoff, and c) are less susceptible to damage
during harvest.
Center pivot systems are predominately used for ―row crops‖, which represent 70% of center-pivot
irrigated acres, or, 83.7 million hectares harvested annually. An installed base of 240,000 center pivots in
North America services these crops (among others), which gives companies like Lindsay and Valmont a
sizeable and consistent replacement demand channel.
In the long-term, public companies like Lindsay and Valmont and private competitors Reinke and T-L
Irrigation will likely continue to see strong demand, and although we believe the pace of adoption is
likely to moderate in the U.S., opportunity exists abroad with much lower penetration rates of efficient
irrigation practices in emerging farm economies such as Brazil and China. For this reason, OEMs are
investing heavily to expand capacity abroad.
9.38.4
7.46.8
5.5
4.3
2.92.1
1.7 1.5
0
1
2
3
4
5
6
7
8
9
10
1860 1880 1900 1920 1940 1960 1980 2000 2020E 2040E
Global Arable Acres per Capita
Source: United Nations
Standard Center Pivot Irrigation System:
Standard Pivot Device: $50,000
Equipment & Installation: up to $60,000
Total Investment Required: up to $120,000
7-Tower
Standard Pivot Length: 1,300 feet
Standard Irrigation Capacity: 160 acres
Minimum Irrigation Capacity: 25 acres
Maximum Irrigation Capacity: 600+ acres
Additional/Optional Functionality:
Pivot Control Systems:
Remote Monitoring Systems:
Enables farmer to operate pivot remotely; Web-based options available
Enables accumulation of data; Aids in maximizing pivot irrigation benefits
Center Pivot System Overview
- 43 -

Janney Montgomery Scott Equity Research: Water & Agriculture
Focus Issue #7: Precision Ag Adoption in Early Stages (Even in Developed Countries)
GPS applications have come a long way from indentifying and displaying the quickest routes from point
A to point B to transforming the way a farm is managed. Companies like Trimble Navigation, a pioneer in
global positioning, are finding new applications for traditional GPS technology in the agriculture sector
with a line of high-tech products, including automated steering systems for tractors and other equipment,
precise positioning systems and related software for use in land leveling and irrigation design, and
systems optimizing chemical and water application to ensure minimal waste and maximum yield. Indeed,
the use of traditional precision agriculture hardware has picked up in the North America, but the
penetration rate remains low in emerging economies, and even customers in the U.S. haven‘t fully utilized
the benefits offered by comprehensive implementation. In 2000, roughly 40% of farmers in the U.S.
planting corn used some type of precision technology, by 2010 that ballooned to over 70%. While GPS
hardware usage gained popularity, the number of farmers utilizing the technology to create yield maps
that tracks performance on a foot by foot basis remains below 40%. This adoption rate drops even lower
down the value chain of data analytics, which in our opinion represents the largest opportunity today in
precision agriculture. The expanding adoption of technology on the farmstead has allowed farmers to
collect invaluable data that up to this point has in most cases been grossly underutilized. With the help of
increasingly popular technologies such as UAVs, this data pile will grow even larger, and companies like
Trimble are just scratching the surface of the possibilities associated with the harvest of this information.
- 44 -

Janney Montgomery Scott Equity Research: Water & Agriculture
Agriculture Demand Channel: Growth Dynamics
The growth opportunity in the irrigation market lays in the adoption of technology that facilitates the
efficient use of water. With a large percentage of the country currently using water-inefficient gravity
irrigation techniques (39%), a substantial total
addressable market still exists for center pivots.
Cyclical. The agriculture demand channel has
endured its share of boom and bust cycles over
the past century, with the busts primarily coming
off of periods of jumps in food demand
(wartimes in 1910s and 1940s) and low interest
rates. Today, these same market currents have
sustained a thriving ag market in the U.S., with
food demand growing due to record exports and
an increased focus on biofuels, and farmland
values increasing amid dovish monetary policy
by the Federal Reserve. Many (including us)
have signaled a likely moderation in ag
equipment demand in the intermediate-term,
citing an expected mean regression for corn prices due to unfavorable supply/demand metrics and pace of
growth in farmland values, which have only seen one quarterly contraction in the past 13 years (with the
latest 8 quarters each exhibiting over 20% year-over-year growth). We do however believe it is unlikely
for a moderation in the demand metrics to be on par with that of the 1980s due to the significantly lower
level of average debt carried by farmers now. Even if farmers do see a downturn in crop prices and an
uptick in interest rates, their low level of leverage should grant them the ability to borrow. This access to
capital should prevent a drastic reduction in capital spending that was experienced in prior downturns.
Secular. In addition to the low-debt ―back-stop‖ built in for agricultural demand, the secular trends of
expanding food demand and water consumption on top of a fixed amount of arable acres give the
irrigation market healthy demand drivers for the long-term. Of the earth‘s 37 billion acres of land, only
one third (about 13 billion acres) are arable – meaning suitable for agricultural production of human food.
Lack of water is by far the most common reason for land being deemed non-arable (others include being
excessively cold and overly rocky soil), making access
to water a key long-term constraint on expansion of
agricultural production. With the global population
recently crossing the 7 billion mark, arable acres per
capita currently stands at 1.9 – down from 4.3 fifty years
ago. By 2040, some believe arable acres per capita could
approach 1. This issue is even more acute considering
that changing dietary patterns in emerging markets
require per capita agricultural production to increase as
well. The outsized growth of bushels produced relative
to acres planted in the past 20 years shows that farmers
have recognized this circumstance, and the need to
maximize yields is likely to grow in importance in both
the U.S. and emerging economies in the years ahead.
0%
10%
20%
30%
40%
50%
60%
0
5,000
10,000
15,000
20,000
25,000
30,000
1979 1984 1988 1994 1998 2003 2008
U.S. Center Pivot Acresin Millions
Center Pivot Acres Center Pivot % of Irrigated
Source: USDA Farm & Ranch Survey
0
2,000
4,000
6,000
8,000
10,000
12,000
14,000
16,000
0
20
40
60
80
100
120
1930 1940 1950 1960 1970 1980 1990 2000 2010
Corn: Planted Acreage vs. Production (Data in Millions)
Bushels Produced (R-Axis) Planted Acres (L-Axis)
Source: USDA
- 45 -
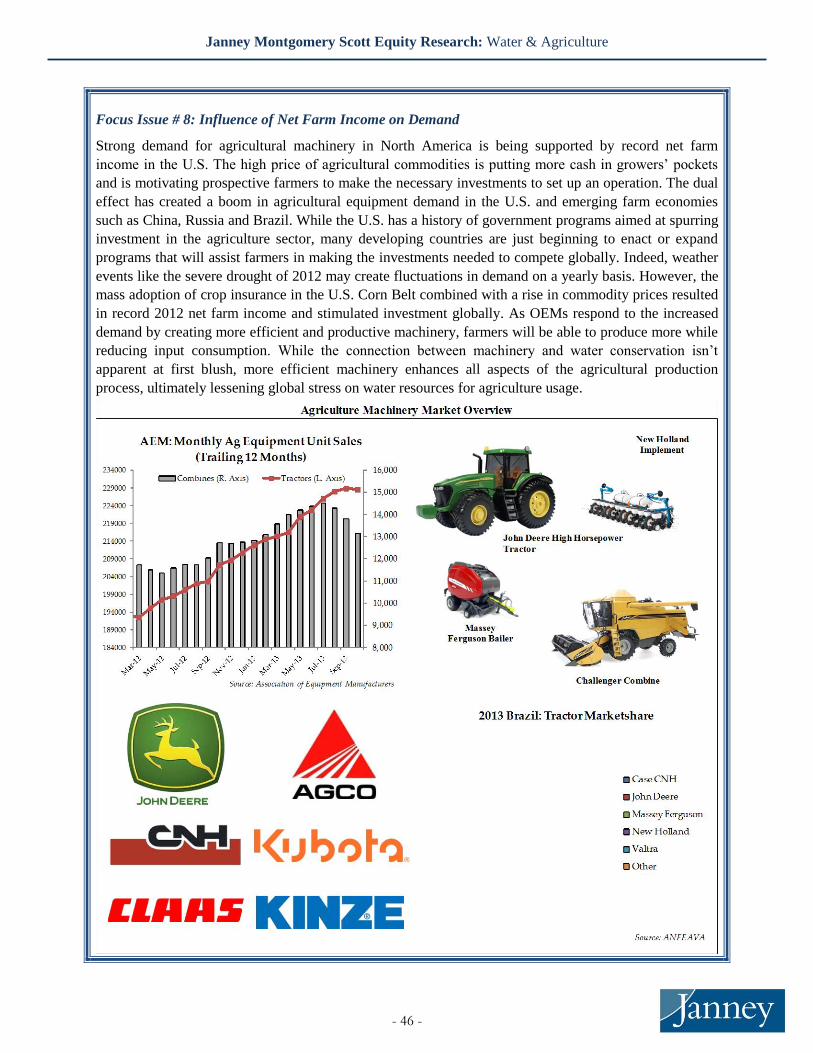
Janney Montgomery Scott Equity Research: Water & Agriculture
Focus Issue # 8: Influence of Net Farm Income on Demand
Strong demand for agricultural machinery in North America is being supported by record net farm
income in the U.S. The high price of agricultural commodities is putting more cash in growers‘ pockets
and is motivating prospective farmers to make the necessary investments to set up an operation. The dual
effect has created a boom in agricultural equipment demand in the U.S. and emerging farm economies
such as China, Russia and Brazil. While the U.S. has a history of government programs aimed at spurring
investment in the agriculture sector, many developing countries are just beginning to enact or expand
programs that will assist farmers in making the investments needed to compete globally. Indeed, weather
events like the severe drought of 2012 may create fluctuations in demand on a yearly basis. However, the
mass adoption of crop insurance in the U.S. Corn Belt combined with a rise in commodity prices resulted
in record 2012 net farm income and stimulated investment globally. As OEMs respond to the increased
demand by creating more efficient and productive machinery, farmers will be able to produce more while
reducing input consumption. While the connection between machinery and water conservation isn‘t
apparent at first blush, more efficient machinery enhances all aspects of the agricultural production
process, ultimately lessening global stress on water resources for agriculture usage.
- 46 -

Janney Montgomery Scott Equity Research: Water & Agriculture
Agriculture Demand Channel: Key Indicators
Many of the economic indicators in the agriculture channel are intertwined with one another, and while
weather drives a substantial portion of the market dynamic, there are measurable metrics that allow for
some insight into the direction of the United States agriculture sector.
Net Farm Income. U.S. Net Farm Income records the profits or losses incurred by the entire farming
sector in the United States throughout a calendar year. This metric is oft cited as a main driver of capital
expenditure for farmers. While true, it is important to note that net farm income is actually what is left in
the farmers‘ pockets after all expenditures for the year are recorded, including capital committed to new
machinery. The USDA forecasts U.S. net farm income for the prospective year, updating estimates three
times each year. The metric provides insight into the economic health of the U.S. farmer, telegraphing the
likely level of capital spending.
Corn Prices. The fluctuation in corn prices heavily influences the profitability of farmers and, as a result,
largely determines investment trends for farm machinery and equipment. While low grain prices are
perceptibly bad for farmers, it is good for livestock and grain storage equipment channels, as farmers are
likely to over-purchase to lock in lower feed costs for the next year and/or store a larger portion of a
strong harvest during low pricing environments.
Farmland Values. Our metric for measuring farmland values is derived from the Kansas City Federal
Reserve, measured in quarterly percent changes over the same period in the prior year. Farmland is each
farmer‘s most important asset, and with the price of corn jumping from $2 per bushel to upwards of $7 at
one point within the past decade, it is no surprise that the price of farmland has enjoyed a concurrent rise.
With this noted, farmland has long term drivers that makes it a bit less susceptible to economic swings as
commercial and residential properties do, with the reduction in arable acres per capita and growing food
demand providing long term trends that should provide some stability to farmland values.
Farm Debt-to-Equity. Farmer debt to equity measures the financial leverage of the U.S. farming sector,
which plays a heavy role in determining the farm sector‘s ability to weather a downturn. As debt-to-
equity levels remain low today compared to the historical level, farmers have the ability to access capital
if in need of financing for an investment during a bad year, potentially smoothing out capital spending.
- 47 -

Janney Montgomery Scott Equity Research: Water & Agriculture
Agriculture Demand Channels: Key Indicators - Continued
$39.1
$61.0
$87.4
$78.8
$57.4
$70.0
$83.7
$60.4
$78.0
$118.0$113.8
$120.6
$20
$30
$40
$50
$60
$70
$80
$90
$100
$110
$120
$130
$140
$150
2002 2003 2004 2005 2006 2007 2008 2009 2010 2011 2012 2013E
U.S. Net Farm Income (In Nominal $ - Billions)
Source: USDA
Net Farm Income has been in rarified air the last several years as elevated commodity prices drove strong price realization for row crop
farmers. This has resulted in a greater adoption of many "best-practices" within the agriculture sector, benefitting companies that
supply technologies to improve efficiency on the farmstead.
$0
$1
$2
$3
$4
$5
$6
$7
$8
$9
4/1
/20
01
9/1
/20
01
2/1
/20
02
7/1
/20
02
12
/1/2
00
2
5/1
/20
03
10
/1/2
00
3
3/1
/20
04
8/1
/20
04
1/1
/20
05
6/1
/20
05
11
/1/2
00
5
4/1
/20
06
9/1
/20
06
2/1
/20
07
7/1
/20
07
12
/1/2
00
7
5/1
/20
08
10
/1/2
00
8
3/1
/20
09
8/1
/20
09
1/1
/20
10
6/1
/20
10
11
/1/2
01
0
4/1
/20
11
9/1
/20
11
2/1
/20
12
7/1
/20
12
12
/1/2
01
2
5/1
/20
13
10
/1/2
01
3
Corn Price (USD per bushel)
Corn Price Trailing 6 mo. Avg. Price
Increased food demands and a higher focus on biofuels has resulted in a 150+% increase in corn prices over the past decade. While debate rages on where the "new norm" is for corn prices,
the elevated state compared to the early 2000s has allowed farmers to achieve record earnings in recent years, a notable
positive for Ag machinery companies.
Source: UW; USDA
- 48 -

Janney Montgomery Scott Equity Research: Water & Agriculture
Agriculture Demand Channel: Key Indicators – Continued
-5.0
0.0
5.0
10.0
15.0
20.0
25.0
30.0
35.0
Farmland Values - Percent Change (Year-over-Year)
NonIrrigated Irrigated
Source: Kansas City Federal Reserve
A farmer's principal asset is his or her land, and with crop prices exploding over the past decade and interest
rates kept at record lows, farmland values have experienced a tremendous rise. This increase has
resulted in record net farm income and, as a result, increased spending on capital equipment.
0.0
5.0
10.0
15.0
20.0
25.0
30.0
U.S. Farm Debt Metrics (%)
Debt/Equity Debt/Assets
Current debt levels have remained relatively low compared to historical periods of other booms in the agriculture sector. This level of discipline
enhances farmers' ability to weather a downturn in commodity prices, such as the one seen in 2013. Of note however, this low-level of debt is not
homogenous across in the entire sector, as larger farms remain much more
levered than the smaller, more reticent proprietors.
Source: USDA & KC Fed
- 49 -

Janney Montgomery Scott Equity Research: Water & Agriculture
Agriculture Demand Channel: Irrigation Key Players and Product Offerings
The center pivot irrigation market is dominated by
public companies Valmont (VMI-Neutral) and
Lindsay (LNN-Neutral), who together represent 73%
of the global market share of pivot and lateral
systems, though privately held companies Reinke and
T&L are formidable rivals. Center pivot systems and
lateral systems are grouped together for all intensive
purposes, and while center pivots represent the vast
majority of the group, it is worth distinguishing
between the two. Center pivots move about in a
circular pattern, with the hub connected to a well at
the center point of the circle, pumping water down
the line to deploy throughout its different sprinklers.
Lateral pivots employ the same distribution method
but the application method is used in square or
rectangular fields and sweeps across the crop from one endpoint to the other (whole system moves side to
side) while drawing water from a large diameter hose or ditch that runs parallel to the field.
Alternatives to center pivots are mainly used out of budgetary reasons, with flood and drip irrigation
representing cheaper (and less efficient) methods of supplying water to crops. Flood, or surface, irrigation
uses gravity to distribute the necessary water to soil as water is filled in ditches at the top of the field (the
highest point) and flows down to the bottom. This method has been virtually unchanged for thousands of
years, which illustrates why many are moving towards a more technologically advanced method. Another
alternative that applies slightly more technology is the drip method, which runs perforated PVC pipe
underneath the crops to distribute water to the roots, removing it from potentially harming weather
conditions. While the method is less expensive than a center pivot system, the maintenance on the system
can be both costly and time consuming for farmers, especially in an age of reduced farm labor.
Valmont
43%
Lindsay
30%
Reinke 9%
T&L 4%
Other 14%
Pivot & Lateral Systems: Global Market Share
Breakdown
Source: Company ReportsSource: Company Reports
Irrigation Practices
Other
Hose Reel Travelers: Large scale hose carrier mounted
with sprinkler unfurls hose to distribute water. Relatively
labor intensive.
Ctr
Pivot
Large scale wheel-mounted water delivery systems.
Confer substantial productivity and water efficiency
benefits, but relatively expensive.
Flood
Oldest and still widely adopted method, involves
diverting natural water source onto crops. Low cost
drives popularity, but makes inefficient use of water
resources.
Drip
Perforated plastic pipe runs underground, dispensing
water at the root level. Uses water more efficiently than
flood irrigation, but maintenance can be costly.
Pivot/Lateral
System
Flood
Irrigation
- 50 -

Janney Montgomery Scott Equity Research: Water & Agriculture
Agriculture Demand Channel: Key Players Comparable Analysis
Ticker PriceMarket
CapSales Ent. Value Fwd P/E
EV/
EBITDA
JMS
Analyst
Water
Exposure
Agriculture Machinery
AGCO Corporation AGCO $58.20 $5,566.0 $10,630.6 $6,272.1 9.6x 5.4x Connors Low
Caterpillar Inc. CAT $83.85 $53,549.4 $57,329.0 $89,039.4 15.2x 10.9x NR Low
CNH Industrial N.V. CNHI $8.38 $12,088.7 $25,858.0 $29,928.7 0.0x 10.4x NR Low
Deere & Company DE $82.12 $31,339.8 $38,136.5 $61,231.9 10.1x 9.7x Connors Low
Average 8.7x 9.1x
Irrigation
Lindsay Corporation LNN $77.93 $1,013.5 $690.8 $861.6 17.3x 7.2x Connors High
Valmont Industries, Inc. VMI $143.48 $3,818.2 $3,291.4 $3,818.2 13.2x 6.8x Connors Medium
Toro Co. TTC $58.31 $3,336.2 $1,998.4 $3,398.5 20.4x 11.8x NR Medium
Average 17.0x 8.6x
Precision Agriculture
Trimble Navigation Limited TRMB $32.15 $8,222.6 $2,204.4 $8,929.7 19.1x 19.9x Connors Low
Raven Industries Inc. RAVN $34.18 $1,236.1 $383.7 $1,180.4 25.3x 14.8x NR Low
Deere & Company DE $82.12 $31,339.8 $38,136.5 $61,231.9 10.1x 9.7x Connors Low
Average 18.2x 14.8x
Seed & Fertilizer
Bunge Limited BG $82.23 $11,990.2 $62,012.0 $17,433.2 10.7x 11.5x NR Low
CF Industries Holdings, Inc. CF $218.32 $12,637.5 $5,629.8 $13,805.4 11.9x 4.8x NR Low
BASF SE DB:BAS $75.94 $69,752.0 $73,805.0 $83,716.0 12.6x 8.2x NR Low
Bayer AG DB:BAYN $93.21 $77,079.8 $40,148.0 $84,741.8 14.8x 9.5x NR Low
E. I. du Pont de Nemours and Company DD $62.05 $57,501.7 $35,547.0 $65,648.7 14.3x 11.6x NR Low
Monsanto Company MON $108.48 $56,001.7 $14,861.0 $54,500.7 20.3x 13.0x NR Low
The Mosaic Company MOS $48.02 $20,502.4 $9,974.1 $18,209.1 18.9x 6.2x NR Low
The Port of Tauranga Limited POT $13.45 $1,803.9 $244.0 $2,002.2 22.8x 15.0x NR Low
Origin Agritech Limited SEED $1.68 $41.0 $419.7 $54.3 NM 12.7x NR Low
Software AG SOW $28.07 $2,328.0 $977.9 $2,438.8 13.6x 9.8x NR Low
Syngenta AG SWX:SYNN $360.50 $33,091.4 $14,327.0 $35,868.2 17.5x 12.8x NR Low
Agrium Inc. TSX:AGU $95.13 $13,747.7 $16,620.0 $17,455.3 12.2x 7.0x NR Low
Average 15.4x 10.2x
Source: CapIQ, Company Documents
Agriculture Demand Channel: Publicly Traded Company Comp Sheet
- 51 -

Janney Montgomery Scott Equity Research: Water & Agriculture
Regulated Water Utilities: An Overview
The publicly traded regulated water utility industry is composed of 9
companies that each operate in distinct geographic markets throughout
the United States, with the largest markets being California and
Pennsylvania. Revenue is principally generated through regulated
operations, which are governed by distinct utilities commissions in
each respective state the companies operate in. The regulated revenue
stream is derived from commission-approved volumetric rate
structures applied to residential customers. Investor-Owned Utilities
operate in a strict regulatory environment given the naturally
monopolistic nature of the water distribution industry, as its capital
intensive nature precludes dual systems, eliminating the prospect of
competition. As a result, the role of each state‘s utility commission
has a prominent effect on the ability of each utility to capture an
attractive return on its investment.
The size of the publicly traded water utility market is relatively small,
with the combined sales of the 9 companies totaling $5.2 billion in
2012. Given the regulated nature of the market, there is rather limited
volatility on the top-line for water utilities, with the group possessing
a standard deviation of 4.6% on its revenue growth over the past
decade. With this noted, the top-line growth of 6.8% (CAGR) for
utilities is fairly competitive, owing to a handful of growth drivers prevalent in the industry.
Per capita water consumption is declining in the United States, leaving utilities to grow their regulated
revenue base two ways: rate expansion and customer growth. Both have contributed to the industry‘s
sustained revenue growth, as the water utilities continue to consolidate and work toward full-cost pricing
models. The primary function of growing a company‘s rate base is to invest in capital projects, with
amount of money a company deploys to upgrade or install water infrastructure determining its rate award.
The respective utilities commissions grant a specified return on equity for each company‘s investment,
with typical ROE awards hovering around 10%. The ROE rate is just one mechanism for determining the
return generated by utilities however, and with other rate-related policies having a substantial impact on
the ROE actually realized in practice.
Investor
Owned
16%
Public &
Other
84%
U.S. Drinking Water Systems
Investor
Owned
2%
Public &
Other
98%
U.S. Wastewater Systems
Source: AWK, EPA
CA CT DE GA HI IL IN IA KY MD ME MO NJ NM NY NC OH PA TN TX VA WA WV
American States Water Company 100%
American Water Works Company, Inc. 8% <5% 10% 8% <5% <5% 11% 25% <5% 22% <5% <5% 5%
Aqua America Inc. 7% <6% <6% 6% 11% 56% 9% <6%
Artesian Resources Corp.* 97% <3% <3%
California Water Service Group 94% 3% 1% 2%
Connecticut Water Service Inc.* 74% 26%
Middlesex Water Co. 27% ~72% <1%
SJW Corp.* 97% 3%
The York Water Company 100%
*Percent of Customer base
Water Utility Universe: Regulated Operations Revenue Distribution by State
- 52 -

Janney Montgomery Scott Equity Research: Water & Agriculture
Regulated Water Utilities: Market Opportunity
As investor-owned water utilities are rewarded for committing capital
to infrastructure upgrades, a vast market opportunity exists due to the
decidedly poor condition of aging U.S. water infrastructure (as noted
previously). The majority of water systems were built before the
1950s during the rapid expansion of U.S. infrastructure. A
consequence of this is the need to replace a vast amount of
infrastructure as it approaches the end of its useful life. The EPA
estimates that while in 2000 just 23% of U.S. pipe infrastructure was
rated ―Poor‖ to ―Life Elapsed‖, by 2020 that is expected to swell to
45% without renewal or replacement of existing systems.
Once the capital is invested, the company either recoups its
investment immediately through an automatic reimbursement
mechanism, such as a DSIC (Distribution System Improvement
Charge) or through the eventual filing of a general rate case, which
requests permission for customer rate increases to both a) combat
declining water consumption trends and, most importantly, b) earn a
fair rate of return on the company‘s capital expenditures.
The turnaround for a decision by Commissions, along with other key
metrics, varies based on the conduciveness of each state‘s regulatory
body. The importance of regulatory exposure is evident in the
valuation of companies, with progressive systems awarding water
utilities like Aqua America (WTR-Neutral) a premium to the peer
group due to its primary operations being based in Pennsylvania (our
#1 ranked market), while haircutting the valuation multiple for IOUs that operate in less favorable
regulatory environments like California, seen in California Water Service (CWT-Neutral).
0%
2%
4%
6%
8%
10%
12%
14%
16%
18%
0
200
400
600
800
1,000
1,200
1,400
1,600
New Jersey American Water's Pipes by Decade
Miles of Pipe (L. Axis) % of Pipe Installed (R. Axis)
Source: AWK
Excellent
42%
Good
17%
Fair
18%
Poor
14%
Very Poor
2%
Life
Elapsed
7%
2000
Excellent
32%
Good
11%Fair
12%
Poor
13%
Very Poor
23%
Life
Elapsed
9%
2020
U.S. Pipes by Classification
Source: EPA
- 53 -

Janney Montgomery Scott Equity Research: Water & Agriculture
Regulated Water Utilities: Growth Dynamics
The ability of the investor-owned water utility industry to achieve 11% compounded EBT growth
annually while possessing a 5-year Beta of 0.4 provides investors a hedge against the market while not
sacrificing earnings expansion as a result. The recent pressure on interest rates has resulted in declining
ROEs awarded by regulatory commissions however, which should pressure earnings expansion by
utilities in the short-term as disinflationary market conditions remain prevalent. With this said, the secular
demand drivers for water utilities are fully intact as IOUs continue to invest in aging infrastructure for the
benefit of its customers, the community, and shareholders of the company. Furthermore, as the trajectory
of interest rates reverses water utilities will begin to enjoy an upward bias on awarded ROEs, a key
benefit to IOUs that is typically underweighted by investors who worry that income-oriented equities such
as utilities will suffer from rotation of asset flows towards increasingly attractive alternatives during
periods of rising interest rates. On the surface, this makes sense, but the historical data indicates that water
utility stocks have not only held up in rising interest rate environments, but actually posted some of their
best performance in the last period of sustained increases in interest rates (2003-2006).
Certain developments and supplements to regulated water delivery operations are worth discussing as
well. Principally, the expansion of unregulated operations in certain water utilities as companies pursue
opportunistic and complementary ventures. Many utilities are now providing insurance-like services to
customers to limit individuals‘ exposure to pipeline damage on his or her property, while others have
pursued projects ranging from the construction of a water pipeline to fracking companies in the Marcellus
Shale region (Aqua America) to Military base water system operations (American States Water).
On the accounting side, while not necessarily a growth driver, the recent adoption of flow-through repair
tax accounting is worth noting as well as it renders growth metrics centered on revenue less meaningful.
The method essentially forgoes rate increases in the near term in exchange for tax deductions for certain
infrastructure investments, shifting earnings power from the top line to the income tax line. While this is
not currently the widely accepted standard of accounting, Aqua America (WTR-Neutral), the country‘s
second largest water utility, adopted the method in Pennsylvania recently and has received a favorable
response from both investors and the Pennsylvania Public Utilities Commission.
$600
$800
$1,000
$1,200
$1,400
$1,600
$1,800
$1,000
$1,500
$2,000
$2,500
$3,000
$3,500
$4,000
$4,500
$5,000
$5,500
2003 2004 2005 2006 2007 2008 2009 2010 2011 2012
Publicly Owned Water Utility Market
Revenue (L. Axis) CapEx (R. Axis)
Source: CapIQ; JMSGroup Includes: WTR, AWK, ARTN.A, AWR, CWT, CTWS, MSEX, SJW, YORW
- 54 -

Janney Montgomery Scott Equity Research: Water & Agriculture
Regulated Water Utilities: Regulatory Climate Indicator
Regulatory climate is the single most important factor driving shareholder returns for water utilities, and a
clear scoring system on this key issue substantially demystifies the investment decision making process.
Our Janney Regulatory Climate Indicator (RCI) assigns a numerical score to each state of relevance based
upon key factors such as Return on Equity and the adoption of key progressive regulatory mechanisms.
While we recognize that no such system is perfect and any attempt to tackle the issue will be controversial
(hence the Street's historical reticence to do so), our system is transparent, easily understandable, and
approximates the relative attractiveness of various regulatory jurisdictions. While the Janney RCI
methodology is explained in full on page 56, the shorthand is that possible scores range from -5.5 (really
bad) to +5.75 (really good).
Key Takeaways:
Record-low interest rates continued to pressure awarded ROEs in 2013, with the average ROE
falling 20 bps from 2012. The lower ROEs caused the average RCI score to fall for the second
consecutive year, as RCI scores fell 0.4 points on average.
Pennsylvania remained the #1 regulatory jurisdiction in 2013 despite its fall in absolute terms from
3.4 in 2012 to 3.1 in 2013. The fall was attributed to lower awarded ROEs (seen in most states), yet
the state‘s numerous progressive mechanisms still supply companies operating within the
jurisdiction with the best chance at actually hitting ROE targets, and thus remains the gold standard.
New Jersey followed its huge jump in 2012 by holding its position in the #5 spot, as the company
continues to evolve into a top flight of progressive regulatory state.
DE and IL round out the top 3 despite so-so ROEs. This shows that despite the importance of
ROEs, key regulatory mechanisms that limit regulatory lag can overcome lackluster approved rates.
3.4
2.3
1.81.6
0.8 0.80.9
0.7
2.0
-0.5
0.03
-1.8
-2.5
3.1
1.3 1.2 1.20.9
0.5 0.5 0.4
-0.3-0.3
-0.8-1.0
-1.3-1.5 -1.5
-1.8
-3.5-3.8
-5.0
-4.0
-3.0
-2.0
-1.0
0.0
1.0
2.0
3.0
4.0
PA DE IL KY NJ OH MO CT WA IN ME NY TX HI VA NC TN NM MD WV CA IA
Janney RCI Scores for Key Investor-Owned Utility States: 2012 vs. 20132012 Values Include Adjustment for New Calculation Methodology
2012 2013
2.3 1.00.4 Flat 1.0 Flat NewNew New NewFlat0.30.40.5 Flat0.3
Flat 0.1 Flat
Key Points:
-Pennsylvania remains the top-ranked U.S. regulatory jurisdiction in absolute terms, though it fell 0.3 point from 2012.
-Ohio was the only jurisdiction to show improvement in 2013, up 0.1 point due to a marginal expansion in awarded ROE.
-New York saw the largest decline, falling to position #11 from #3 a year ago, as the state abandoned its use of the DSIC mechanism.
- 55 -

Janney Montgomery Scott Equity Research: Water & Agriculture
2013 Janney RCI: Summary of Methodology
In designing a system for quantifying the relative attractiveness of various state regulatory systems, we
adhere to the maxim that ―less is more‖ and deliberately favor elegance over complexity. Although a
more intricate approach would have benefits, we believe a simple, transparent system sacrifices little in
the way of accuracy while possessing the key advantage of being easily understandable.
Step-by-Step RCI Calculation:
1. Starting Point. All states are created equal, beginning the process with a baseline score of 0.
2. Allowed Return on Equity Adjustment. The first, and most significant, adjustment to the
baseline score of 0 is the ROE adjustor. Using an average of recent awarded ROEs in the state,
the baseline score is adjusted to reflect the attractiveness of returns on capital. States with ROEs
of 9.5% and below have 1.5 points subtracted from the baseline, while states with ROEs of 11%
and above have 1.5 points added to their baseline score. States with ROEs in between 9.5% and
11% receive a pro-rated adjustment according to their position in this range, with any state
exactly at the midpoint of 10.25% receiving no adjustment to the starting point.
3. Regulatory Mechanism Adjustments. The next set of adjustments takes into account whether a
state has in place key regulatory mechanisms that we believe reduce regulatory lag or otherwise
improve the investment climate. These simple +1/–1 adjustments are as follows:
+1 point if a Future Test Year is used, –1 if Historical (0 for Historical/Updated).
+1 if rate cases must be processed in 9 months or less, –1 if 12 months or more.
+1 if a state has in place single tariff rate structures, –1 if not.
-1 if a state does not have a DSIC, if it does:
i. Formula: 1 + [(% Granted – 7.5%)*100]
ii. i.e. Since the average DSIC percentage is 7.5%, it is awarded a ―+1‖ value, with
all other DSIC percentages adjusted on prorated basis
Summation = Final RCI Score. After all adjustments have been made to the initial starting point of 0,
the end result is the Janney RCI score. The highest possible RCI score is +5.75 (0 + 1.5 for an 11% ROE
+ 1.25 for DSIC + 1 for Future Test Year + 1 for <9 month rate case processing + 1 for Single Tariff =
5.75). Conversely, the lowest possible score is –5.50. Interpreting RCI scores is easy: higher scores
denote states with more capital-friendly regulatory environments.
Starting Point = 0ROE Adjustor – Sliding Scale:
•9.5% and lower: -1.5•11% and higher: +1.5•9.5% - 11%: Prorated Adjustment
Regulatory Mechanism Adjustors:•Test Year: +1 for Future, -1 for Historical•Processing: +1 for <9 mos., -1 for >12 mos.•Single Tariff Structure: +1 if yes, -1 if no•DSIC Like Mechanism:
•-1 if No DSIC•If yes: +0.75 for 5%, +1 for 7.5%, +1.25 for 10%•Other Percentages Prorated
Final RCI Score:•Highest Possible: +5.75•Lowest Possible: -5.5
12
3
4
Simplicity and transparency are key attributes of the RCI scoring system.
The Janney Regulatory Climate Indicator: Methodology
- 56 -

Janney Montgomery Scott Equity Research: Water & Agriculture
2013 Janney RCI: Data Breakdown
REG. ELEMENT GRANTED ROE (PREV) TEST YEAR PROCESSING DSICSINGLE
TARIFF
Sliding Scale Future = +1 <9 mos. = +1 Sliding Scale
9.5% & Below = -1.5 Hist./Updtd = 0 9-12 mos. = 0 No = -1, Yes: 7.5% = +1
11% & Above = +1.5 Historical = -1 >12 mos. = -1 = 1 + [X% - 7.5%)*100]
PENNSYLVANIAWTR,AWK,
YORW10.3% (10.4%) Future: +1 9-12 months: 0 7.5%: + 1 Yes: + 1 3.13 1 (1)
DELAWAREARTNA,
MSEX9.9% (9.9%) Hist./Updtd: 0 <9 months: +1 7.5%: + 1 Yes: + 1 2.33 2 (2)
ILLINOIS WTR,AWK 9.4% (9.8%) Future: +1 9-12 months: 0 5%: + 0.75 Yes: + 1 1.25 3 (4)
KENTUCKY AWK 9.9% (9.9%) Future: +1 <9 months: +1 No: -1 Yes: + 1 1.20 4 (6)
NEW JERSEYWTR,AWK,
MSEX10.0% (10.2%) Hist./Updtd: 0 9-12 months: 0 5%: + 0.75 Yes: + 1 1.15 5 (5)
OHIO WTR 9.6% (9.6%) Hist./Updtd: 0 9-12 months: 0 9%: + 1.15 Yes: + 1 0.90 6 (8)
MISSOURI AWK 10.0% (10.0%) Historical: -1 9-12 months: 0 10%: + 1.25 Yes: + 1 0.75 7 (9)
CONNECTICUT CTWS 9.3% (9.7%) Historical: -1 <9 months: +1 7.5%: + 1 Yes: + 1 0.50 T-8 (7)
WASHINGTON CWT 12.0% Historical: -1 9-12 months: 0 No: -1 Yes: + 1 0.50 T-8 (New)
INDIANA AWK,WTR 10.1% (10.2%) Historical: -1 9-12 months: 0 5%: + 0.75 Yes: + 1 0.38 10 (10)
MAINE CTWS 10.0% (10.0%) Historical: -1 <9 months: +1 10%: + 1.25 No: -1 -0.25 T-11 (12)
NEW YORK AWK 9.6% (9.8%) Hist./Updtd: 0 9-12 months: 0 No: -1 Yes: + 1 -0.25 T-11 (3)
TEXAS WTR,SJW 11.4% (12.0%) Historical: -1 >12 months: -1 No: -1 Yes: + 1 -0.50 13 (13)
HAWAII AWK, CWT 10.4% Future: +1 9-12 months: 0 No: -1 No: -1 -0.80 14 (New)
VIRGINIA WTR,AWK 9.8% (10.3%) Historical: -1 <9 months: +1 No: -1 Yes: + 1 -1.00 15 (11)
N. CAROLINA WTR 10.1% Historical: -1 9-12 months: 0 No: -1 Yes: + 1 -1.30 16 (New)
TENNESSEE AWK 10.0% Hist./Updtd: 0 <9 months: +1 No: -1 No: -1 -1.50 T-17 (New)
NEW MEXICO CWT 10.0% Future: +1 9-12 months: 0 No: -1 No: -1 -1.50 T-17 (New)
MARYLANDAWK,
ARTNA10.4% Historical: -1 <9 months: +1 No: -1 No: -1 -1.75 19 (New)
WEST VIRGINIA AWK 9.8% (10.0%) Historical: -1 9-12 months: 0 No: -1 Yes: + 1 -1.83 20 (14)
CALIFORNIAAWK,SJW,
AWR,CWT9.4% (10.2%) Future: +1 >12 months: -1 No: -1 No: -1 -3.50 21 (15)
IOWA AWK 9.85% Historical: -1 9-12 months: 0 No: -1 No: -1 -3.80 22 (New)
AVERAGE: NA 9.9% (10.1%) NA NA NA NA -0.3 NA
Source: Janney Capital Markets, Company Reports, State Regulatory Agencies
RCI
SCORE
RCI RANK
(PREV)RCI
PARAMETERS
Company
Exposure Yes = +1
No = -1
- 57 -

Janney Montgomery Scott Equity Research: Water & Agriculture
Regulated Water Utilities: Key Players
American Water Works (AWK-BUY) and Aqua America (WTR-Neutral) are far and away the largest
players in the water utility space, boasting market capitalizations of $7.3 billion and $4.4 billion,
respectively, with the American States Water (AWR-Neutral) and California Water (CWT-Neutral)
rounding out ―the big four‖. The size of American and Aqua allow the companies to enjoy geographic
diversification for purposes of both avoiding potentially adverse weather conditions as well as
challenging regulatory environments. Their magnitude also enables the companies to pursue tuck-in
acquisitions or portfolio shifting, such as the system swap that took place in 2012 where Aqua America
obtained American Ohio‘s properties for $101 million while selling American Water its New York
systems for $39 million in cash (without including debt assumptions in either case).
The remaining five publicly traded water utilities are all under $1 billion in market cap, with the average
size standing around $340 million. The majority of these companies have regulated operations that are
principally in one state or region, allowing the smaller companies to capitalize on existing company
infrastructure and established relationships with the Utilities Commissions.
3.38
2.312.14
1.751.36
0.60
-2.34 -2.43 -2.52
3.13
2.211.81
1.51
0.760.31
-3.31 -3.41 -3.50
-5.00
-4.00
-3.00
-2.00
-1.00
0.00
1.00
2.00
3.00
4.00
5.00
YORW ARTNA WTR MSEX AWK CTWS CWT SJW AWR
Weighted Average Janney RCI Scores by Company: 2012 vs. 2013
2012 2013
0.30.30.10.3 1.00.2 0.6 1.01.0
Company Ticker PriceMkt. Cap
(mm)
Sales
(mm)
EV/
EBITDA
EV/
Sales
PEG
Ratio
Price/
Book
EV/ Rate
Base
Fwd
P/E
FY+2
PE
Historical
Fwd P/E
Investor-Owned Water Utilities
American States Water Company AWR $28.46 $1,101.9 $473.7 8.9x 3.0x 7.2x 2.3x 2.3x 20.3x 20.4x 20.3x
American Water Works Company, Inc. AWK $42.67 $7,607.0 $2,870.5 10.2x 4.6x 2.2x 1.6x 1.5x 18.0x 18.0x 18.0x
Aqua America Inc. WTR $25.04 $4,424.8 $767.5 14.0x 7.9x 2.8x 3.2x 2.3x 21.2x 20.9x 21.2x
Artesian Resources Corp. ARTN.A $21.97 $193.0 $69.1 10.8x 4.5x 3.9x 1.6x 1.4x 19.6x 18.0x 19.6x
California Water Service Group CWT $22.38 $1,068.4 $571.9 9.9x 2.6x 3.2x 1.8x 1.5x 21.1x 19.6x 21.1x
Connecticut Water Service Inc. CTWS $32.88 $356.6 $89.4 13.6x 6.0x 4.0x 1.9x 1.9x 21.1x 20.0x 21.1x
Middlesex Water Co. MSEX $21.36 $340.1 $114.5 12.2x 4.4x 4.2x 1.8x 3.1x 20.8x 20.5x 20.8x
SJW Corp. SJW $27.77 $559.9 $272.1 9.7x 3.3x 1.9x 1.8x 2.8x 22.4x 20.1x 22.4x
The York Water Company YORW $20.33 $263.1 $42.1 12.9x 8.1x 4.8x 2.7x 0.7x 24.1x 23.6x 24.1x
Sector Average 11.4x 4.9x 3.8x 2.1x 1.9x 21.0x 20.1x 21.0x
Source: CapIQ, Company Documents
- 58 -

Janney Montgomery Scott Equity Research: Water & Agriculture
Appendix
Ticker Price Market Cap Business Description
Sourcing & Distribution
LB Foster Co. FSTR $43.75 $451.9L.B. Foster Company engages in the manufacture, fabrication, and distribution of products
and services for the rail, construction, energy, and utility markets.
Northwest Pipe Co. NWPX $37.40 $353.4
Northwest Pipe Company manufactures and markets welded steel pipe and other products
in the United States, Canada, and Mexico. The company’s Water Transmission segment
offers large diameter, high pressure, engineered welded steel pipe products for use in water
infrastructure applications, primarily related to drinking water systems.
Nuverra Environmental Solutions, Inc. NES $1.46 $379.5
Nuverra Environmental Solutions, Inc., an environmental solutions company, provides full-
cycle environmental solutions to customers in energy and industrial end-markets in the
United States.
Pumps & Valves
Gorman-Rupp Co. GRC $39.43 $828.1 The Gorman-Rupp Company designs, manufactures, and sells pumps and pump systems.
IDEX Corporation IEX $69.74 $5,657.2IDEX Corporation manufactures and sells various pumps, flow meters, other fluidics
systems and components, and engineered products worldwide.
Mueller Water Products, Inc. MWA $8.80 $1,392.5
Mueller Water Products, Inc. engages in the manufacture and marketing of products and
services used in the transmission, distribution, and measurement of water primarily in the
United States and Canada.
Pentair Ltd. PNR $68.05 $13,564.7
Pentair Ltd. delivers products, services, and solutions for water and other fluids, thermal
management, and equipment protection in the United States, Europe, Asia, and other
regions.
Watts Water Technologies, Inc. WTS $58.61 $2,068.9
Watts Water Technologies, Inc. designs, manufactures, and sells various water safety and
flow control products for the water quality, water conservation, water safety, and water flow
control markets in the North America, Europe, the Middle East, Africa, and Asia.
Xylem Inc. XYL $33.94 $6,261.5Xylem Inc. engages in the design, manufacture, and application of engineered technologies
for water and wastewater applications.
Engineering & Construction
AECOM Technology Corporation ACM $28.96 $2,919.3
AECOM Technology Corporation, together with its subsidiaries, provides professional
technical and management support services for commercial and government clients
worldwide.
Layne Christensen Company LAYN $15.25 $299.2Layne Christensen Company provides water management, construction, and drilling
services in North America and internationally.
Stantec Inc. STN $67.26 $3,120.9
Stantec Inc. provides professional consulting services in planning, engineering, architecture,
interior design, landscape architecture, surveying, environmental sciences, project
management, and project economics for infrastructure and facilities projects in the North
America and internationally.
Tetra Tech Inc. TTEK $26.42 $1,704.0
Tetra Tech Inc., together with its subsidiaries, provides consulting, engineering, program
management, construction management, and technical services for water, environment,
energy, infrastructure, and natural resources sectors.
Tutor Perini Corporation TPC $21.36 $1,027.7Tutor Perini Corporation provides diversified general contracting, construction management,
and design-build services to private customers and public agencies worldwide.
Source: CapIQ , Company Documents
Municipal Demand Channel: Publicly Traded Company Comp Sheet - Business Descriptions
- 59 -

Janney Montgomery Scott Equity Research: Water & Agriculture
Ticker Price Market Cap Business Description
Metering
Arad Ltd. TASE:ARD $26.17 $647.2Arad Ltd. designs, develops, manufactures, sells, and supports water meters for residential,
bulk, irrigation, and water management companies worldwide.
Badger Meter Inc. BMI $51.76 $744.2Badger Meter, Inc. manufactures and markets flow measurement and control products to
water and gas utilities, municipalities, and industrial customers worldwide.
Itron, Inc. ITRI $43.50 $1,703.0Itron, Inc. provides metering solutions, meter data management software, and knowledge
application solutions to electric, natural gas, and water utilities worldwide.
Mueller Water Products, Inc. MWA $8.80 $1,392.5
Mueller Water Products, Inc. engages in the manufacture and marketing of products and
services used in the transmission, distribution, and measurement of water primarily in the
United States and Canada.
Roper Industries Inc. ROP $125.63 $12,476.3
Roper Industries, Inc. designs, manufactures, and distributes radio frequency (RF) products
and services, industrial technology products, energy systems and controls, and medical and
scientific imaging products and software.
Silver Spring Networks, Inc. SSNI $19.42 $915.3Silver Spring Networks, Inc. provides networking platform and solutions that enable utilities
to transform the power grid infrastructure into the smart grid.
Infrastructure Diagnostics
(Invalid Identifier) EMTEK
Mueller Water Products, Inc. MWA $8.80 $1,392.5
Mueller Water Products, Inc. engages in the manufacture and marketing of products and
services used in the transmission, distribution, and measurement of water primarily in the
United States and Canada.
Pure Technologies Ltd. TSX:PUR $6.42 $328.0
Pure Technologies Ltd., an asset management technology and services company, engages
in the development and application of patented technologies for inspection, monitoring, and
management of physical infrastructure worldwide.
Filtration/Treatment
Calgon Carbon Corporation CCC $20.48 $1,118.3
Calgon Carbon Corporation provides services and solutions for purifying water and air,
food, beverage, and industrial process streams primarily in the United States, Europe, and
Japan.
Pall Corporation PLL $81.87 $9,068.7Pall Corporation manufactures and markets filtration, separation, and purification products
and integrated systems solutions worldwide.
Xylem Inc. XYL $33.94 $6,261.5Xylem Inc. engages in the design, manufacture, and application of engineered technologies
for water and wastewater applications.
Watts Water Technologies, Inc. WTS $58.61 $2,068.9
Watts Water Technologies, Inc. designs, manufactures, and sells various water safety and
flow control products for the water quality, water conservation, water safety, and water flow
control markets in the North America, Europe, the Middle East, Africa, and Asia.
Source: CapIQ, Company Documents
Municipal Demand Channel: Publicly Traded Company Comp Sheet - Business Descriptions
- 60 -

Janney Montgomery Scott Equity Research: Water & Agriculture
Ticker Price Market Cap Business Description
Valves/Pumps
Gorman-Rupp Co. GRC $39.43 $828.1 The Gorman-Rupp Company designs, manufactures, and sells pumps and pump systems.
Franklin Electric Co., Inc. FELE $39.84 $1,898.2Franklin Electric Co., Inc., together with its subsidiaries, designs, manufactures, and
distributes water and fuel pumping systems worldwide.
IDEX Corporation IEX $69.74 $5,657.2IDEX Corporation manufactures and sells various pumps, flow meters, other fluidics
systems and components, and engineered products worldwide.
Mueller Water Products, Inc. MWA $8.80 $1,392.5
Mueller Water Products, Inc. engages in the manufacture and marketing of products and
services used in the transmission, distribution, and measurement of water primarily in the
United States and Canada.
Pentair Ltd. PNR $68.05 $13,564.7
Pentair Ltd. delivers products, services, and solutions for water and other fluids, thermal
management, and equipment protection in the United States, Europe, Asia, and other
regions.
Rexnord Corporation RXN $23.40 $2,287.9Rexnord Corporation designs, manufactures, markets, and services process and motion
control, and water management products worldwide.
Xylem Inc. XYL $33.94 $6,261.5Xylem Inc. engages in the design, manufacture, and application of engineered technologies
for water and wastewater applications.
Watts Water Technologies, Inc. WTS $58.61 $2,068.9
Watts Water Technologies, Inc. designs, manufactures, and sells various water safety and
flow control products for the water quality, water conservation, water safety, and water flow
control markets in the North America, Europe, the Middle East, Africa, and Asia.
Sourcing & Distribution
LB Foster Co. FSTR $43.75 $451.9L.B. Foster Company engages in the manufacture, fabrication, and distribution of products
and services for the rail, construction, energy, and utility markets.
Nuverra Environmental Solutions, Inc. NES $1.46 $379.5
Nuverra Environmental Solutions, Inc., an environmental solutions company, provides full-
cycle environmental solutions to customers in energy and industrial end-markets in the
United States.
Northwest Pipe Co. NWPX $37.40 $353.4
Northwest Pipe Company manufactures and markets welded steel pipe and other products
in the United States, Canada, and Mexico. The company’s Water Transmission segment
offers large diameter, high pressure, engineered welded steel pipe products for use in water
infrastructure applications, primarily related to drinking water systems.
Water Treatment
CLARCOR Inc. CLC $58.97 $2,953.1CLARCOR Inc. provides filtration products, filtration systems and services, and consumer
and industrial packaging products worldwide.
Ecolab Inc. ECL $106.43 $32,067.3Ecolab Inc. develops and markets programs, products, and services for hospitality,
foodservice, healthcare, industrial, and energy markets worldwide.
Nuverra Environmental Solutions, Inc. NES $1.46 $379.5
Nuverra Environmental Solutions, Inc., an environmental solutions company, provides full-
cycle environmental solutions to customers in energy and industrial end-markets in the
United States.
General Electric Company GE $27.05 $273,674.8General Electric Company operates as an infrastructure and financial services company
worldwide.
Pall Corporation PLL $81.87 $9,068.7Pall Corporation manufactures and markets filtration, separation, and purification products
and integrated systems solutions worldwide.
Xylem Inc. XYL $33.94 $6,261.5Xylem Inc. engages in the design, manufacture, and application of engineered technologies
for water and wastewater applications.
Water Heating/Cooling
AO Smith Corp. AOS $53.20 $4,853.1
A. O. Smith Corporation engages in the manufacture and sale of water heaters and boilers
to the residential and commercial markets primarily in the United States, Canada, Europe,
India, and China.
Harsco Corporation HSC $27.13 $2,188.5 Harsco Corporation provides industrial services and engineered products worldwide.
SPX Corporation SPW $94.13 $4,269.2 SPX Corporation provides specialized engineered solutions worldwide.
Watts Water Technologies, Inc. WTS $58.61 $2,068.9
Watts Water Technologies, Inc. designs, manufactures, and sells various water safety and
flow control products for the water quality, water conservation, water safety, and water flow
control markets in the North America, Europe, the Middle East, Africa, and Asia.
Xylem Inc. XYL $33.94 $6,261.5Xylem Inc. engages in the design, manufacture, and application of engineered technologies
for water and wastewater applications.
Water Treatment Chemicals/Disposal
Calgon Carbon Corporation CCC $20.48 $1,118.3
Calgon Carbon Corporation provides services and solutions for purifying water and air,
food, beverage, and industrial process streams primarily in the United States, Europe, and
Japan.
Canexus Corporation TSX:CUS $6.18 $939.4
Canexus Corporation, through its subsidiaries, engages in the production and sale of
sodium chlorate and chlor-alkali products primarily for the pulp and paper, and water
treatment industries in North and South America.
Casella Waste Systems Inc. CWST $5.65 $225.6
Casella Waste Systems, Inc., together with its subsidiaries, operates as a regional, vertically-
integrated solid waste, recycling, and resource management services company in the
northeastern United States.
Ecolab Inc. ECL $106.43 $32,067.3Ecolab Inc. develops and markets programs, products, and services for hospitality,
foodservice, healthcare, industrial, and energy markets worldwide.
General Electric Company GE $27.05 $273,674.8General Electric Company operates as an infrastructure and financial services company
worldwide.
Hawkins Inc. HWKN $35.85 $380.2Hawkins, Inc. distributes bulk chemicals, as well as blends, manufactures, and distributes
specialty chemicals.
Source: CapIQ, Company Documents
Industrial Demand Channel: Publicly-Traded Company Comp Sheet - Business Descriptions
- 61 -

Janney Montgomery Scott Equity Research: Water & Agriculture
Ticker Price Market Cap Business Description
HVAC
AO Smith Corp. AOS $53.20 $4,853.1
A. O. Smith Corporation engages in the manufacture and sale of water heaters and boilers
to the residential and commercial markets primarily in the United States, Canada, Europe,
India, and China.
Xylem Inc. XYL $33.94 $6,261.5Xylem Inc. engages in the design, manufacture, and application of engineered technologies
for water and wastewater applications.
Watts Water Technologies, Inc. WTS $58.61 $2,068.9
Watts Water Technologies, Inc. designs, manufactures, and sells various water safety and
flow control products for the water quality, water conservation, water safety, and water flow
control markets in the North America, Europe, the Middle East, Africa, and Asia.
General Electric Company GE $27.05 $273,674.8General Electric Company operates as an infrastructure and financial services company
worldwide.
Regal Beloit Corporation RBC $73.31 $3,303.9
Regal Beloit Corporation, together with its subsidiaries, manufactures and sells electric
motors and controls, electric generators and controls, and mechanical motion control
products in the United States, Asia, and internationally.
Fire Protection
Gorman-Rupp Co. GRC $39.43 $828.1 The Gorman-Rupp Company designs, manufactures, and sells pumps and pump systems.
IDEX Corporation IEX $69.74 $5,657.2IDEX Corporation manufactures and sells various pumps, flow meters, other fluidics
systems and components, and engineered products worldwide.
Mueller Water Products, Inc. MWA $8.80 $1,392.5
Mueller Water Products, Inc. engages in the manufacture and marketing of products and
services used in the transmission, distribution, and measurement of water primarily in the
United States and Canada.
Watts Water Technologies, Inc. WTS $58.61 $2,068.9
Watts Water Technologies, Inc. designs, manufactures, and sells various water safety and
flow control products for the water quality, water conservation, water safety, and water flow
control markets in the North America, Europe, the Middle East, Africa, and Asia.
Xylem Inc. XYL $33.94 $6,261.5Xylem Inc. engages in the design, manufacture, and application of engineered technologies
for water and wastewater applications.
Irrigation
Franklin Electric Co., Inc. FELE $39.84 $1,898.2Franklin Electric Co., Inc., together with its subsidiaries, designs, manufactures, and
distributes water and fuel pumping systems worldwide.
Gorman-Rupp Co. GRC $39.43 $828.1 The Gorman-Rupp Company designs, manufactures, and sells pumps and pump systems.
Toro Co. TTC $58.31 $3,332.8The Toro Company designs, manufactures, and markets professional turf maintenance
equipment and services worldwide.
Watts Water Technologies, Inc. WTS $58.61 $2,068.9
Watts Water Technologies, Inc. designs, manufactures, and sells various water safety and
flow control products for the water quality, water conservation, water safety, and water flow
control markets in the North America, Europe, the Middle East, Africa, and Asia.
Xylem Inc. XYL $33.94 $6,261.5Xylem Inc. engages in the design, manufacture, and application of engineered technologies
for water and wastewater applications.
Point of View Plumbing Products
Fortune Brands Home & Security, Inc. FBHS $40.58 $6,745.0
Fortune Brands Home & Security, Inc. provides home and security products for use in
residential home repair, remodeling, new construction, and security and storage
applications.
General Electric Company GE $27.05 $273,674.8General Electric Company operates as an infrastructure and financial services company
worldwide.
Masco Corporation MAS $20.46 $7,304.0Masco Corporation engages in the manufacture, distribution, and installation of home
improvement and building products primarily in North America and Europe.
Rexnord Corporation RXN $23.40 $2,287.9Rexnord Corporation designs, manufactures, markets, and services process and motion
control, and water management products worldwide.
Watts Water Technologies, Inc. WTS $58.61 $2,068.9
Watts Water Technologies, Inc. designs, manufactures, and sells various water safety and
flow control products for the water quality, water conservation, water safety, and water flow
control markets in the North America, Europe, the Middle East, Africa, and Asia.
Source: CapIQ, Company Documents
Construction Demand Channel: Publicly Traded Company Comp Sheet - Business Descriptions
- 62 -

Janney Montgomery Scott Equity Research: Water & Agriculture
Ticker Price Market Cap Business Description
Valves & Pumps
Colfax Corporation CFX $57.84 $5,894.1
Colfax Corporation, a diversified industrial manufacturing and engineering company,
provides gas- and fluid-handling and fabrication technology products and services to
commercial and governmental customers worldwide.
CIRCOR International, Inc. CIR $76.80 $1,351.0CIRCOR International, Inc. designs, manufactures, and markets valves and other engineered
products, and sub-systems worldwide.
Gorman-Rupp Co. GRC $39.43 $828.1 The Gorman-Rupp Company designs, manufactures, and sells pumps and pump systems.
Franklin Electric Co., Inc. FELE $39.84 $1,898.2Franklin Electric Co., Inc., together with its subsidiaries, designs, manufactures, and
distributes water and fuel pumping systems worldwide.
Flowserve Corp. FLS $70.19 $9,789.3Flowserve Corporation engages in the design, manufacture, distribution, and service of
industrial flow management equipment.
IDEX Corporation IEX $69.74 $5,657.2IDEX Corporation manufactures and sells various pumps, flow meters, other fluidics
systems and components, and engineered products worldwide.
Masco Corporation MAS $20.46 $7,304.0Masco Corporation engages in the manufacture, distribution, and installation of home
improvement and building products primarily in North America and Europe.
Mueller Water Products, Inc. MWA $8.80 $1,392.5
Mueller Water Products, Inc. engages in the manufacture and marketing of products and
services used in the transmission, distribution, and measurement of water primarily in the
United States and Canada.
Pentair Ltd. PNR $68.05 $13,564.7
Pentair Ltd. delivers products, services, and solutions for water and other fluids, thermal
management, and equipment protection in the United States, Europe, Asia, and other
regions.
Rexnord Corporation RXN $23.40 $2,287.9Rexnord Corporation designs, manufactures, markets, and services process and motion
control, and water management products worldwide.
SPX Corporation SPW $94.13 $4,269.2 SPX Corporation provides specialized engineered solutions worldwide.
Xylem Inc. XYL $33.94 $6,261.5Xylem Inc. engages in the design, manufacture, and application of engineered technologies
for water and wastewater applications.
Watts Water Technologies, Inc. WTS $58.61 $2,068.9
Watts Water Technologies, Inc. designs, manufactures, and sells various water safety and
flow control products for the water quality, water conservation, water safety, and water flow
control markets in the North America, Europe, the Middle East, Africa, and Asia.
Water Filtration
AO Smith Corp. AOS $53.20 $4,853.1
A. O. Smith Corporation engages in the manufacture and sale of water heaters and boilers
to the residential and commercial markets primarily in the United States, Canada, Europe,
India, and China.
CLARCOR Inc. CLC $58.97 $2,953.1CLARCOR Inc. provides filtration products, filtration systems and services, and consumer
and industrial packaging products worldwide.
Crane Co. CR $62.98 $3,662.3Crane Co. manufactures and sells engineered industrial products in the United States and
internationally.
Watts Water Technologies, Inc. WTS $58.61 $2,068.9
Watts Water Technologies, Inc. designs, manufactures, and sells various water safety and
flow control products for the water quality, water conservation, water safety, and water flow
control markets in the North America, Europe, the Middle East, Africa, and Asia.
Xylem Inc. XYL $33.94 $6,261.5Xylem Inc. engages in the design, manufacture, and application of engineered technologies
for water and wastewater applications.
Source: CapIQ, Company Documents
Construction Demand Channel: Publicly Traded Company Comp Sheet - Business Descriptions
- 63 -

Janney Montgomery Scott Equity Research: Water & Agriculture
Ticker Price Market Cap Business Description
Agriculture Machinery
AGCO Corporation AGCO $58.20 $5,666.3AGCO Corporation manufactures and distributes agricultural equipment and related
replacement parts worldwide.
Caterpillar Inc. CAT $83.85 $53,358.5Caterpillar Inc. manufactures and sells construction and mining equipment, diesel and
natural gas engines, industrial gas turbines, and diesel-electric locomotives worldwide.
CNA Financial Corporation CNH $30.30 $0.0
CNA Financial Corporation, through its subsidiaries, provides a range of property and
casualty insurance products and services to small, middle market, and large businesses and
organizations in the United States and internationally.
Deere & Company DE $82.12 $31,439.3Deere & Company manufactures and distributes agriculture and turf equipment, and
construction and forestry equipment worldwide.
Irrigation
Lindsay Corporation LNN $77.93 $1,003.2
Lindsay Corporation designs, manufactures, and sells irrigation systems that are primarily
used in the agricultural industry to increase or stabilize crop production while conserving
water, energy, and labor in the United States and internationally.
Valmont Industries, Inc. VMI $143.51 $3,844.2Valmont Industries, Inc. produces and sells fabricated metal products in the United States,
Australia, China, France, and internationally.
Toro Co. TTC $58.31 $3,332.8The Toro Company designs, manufactures, and markets professional turf maintenance
equipment and services worldwide.
Precision Agriculture
Trimble Navigation Limited TRMB $32.15 $8,289.6
Trimble Navigation Limited designs and distributes positioning products and applications
enabled by global positioning system (GPS), optical, laser, and wireless communications
technology.
Raven Industries Inc. RAVN $34.18 $1,243.7
Raven Industries, Inc., together with its subsidiaries, provides various products for the
industrial, agricultural, energy, construction, and military/aerospace markets in the United
States and internationally.
Deere & Company DE $82.12 $31,439.3Deere & Company manufactures and distributes agriculture and turf equipment, and
construction and forestry equipment worldwide.
Seed & Fertilizer
Bunge Limited BG $82.24 $12,109.4Bunge Limited, through its subsidiaries, engages in agriculture and food business
worldwide.
CF Industries Holdings, Inc. CF $218.28 $12,510.3CF Industries Holdings, Inc. manufactures and distributes nitrogen and phosphate fertilizer
products worldwide.
BASF SE DB:BAS $75.94 $69,752.0 BASF SE operates as a chemical company worldwide.
Bayer AG DB:BAYN $93.21 $77,079.8Bayer Aktiengesellschaft develops, produces, and markets health care and agriculture
products, and high-tech materials worldwide.
E. I. du Pont de Nemours and Company DD $62.05 $57,464.7E. I. du Pont de Nemours and Company operates as a science and technology based
company worldwide.
Monsanto Company MON $108.51 $57,058.7Monsanto Company, together with its subsidiaries, provides agricultural products for
farmers worldwide.
The Mosaic Company MOS $48.02 $20,455.6The Mosaic Company produces and markets concentrated phosphate and potash crop
nutrients for the agriculture industry worldwide.
The Port of Tauranga Limited POT $13.45 $1,803.9 Port of Tauranga Limited operates and manages the Port of Tauranga in New Zealand.
Origin Agritech Limited SEED $1.68 $38.9Origin Agritech Limited, an agricultural biotechnology company, specializes in crop seed
breeding and genetic improvement activities in the People’s Republic of China.
Software AG SOW $28.07 $2,328.0Software Aktiengesellschaft provides business process management, data management,
and consulting services worldwide.
Syngenta AG SWX:SYNN $360.50 $33,091.4
Syngenta AG, an agribusiness company, engages in the discovery, development,
manufacture, and marketing of a range of products designed to enhance crop yields and
food quality worldwide.
Agrium Inc. TSX:AGU $95.13 $13,746.3 Agrium Inc. engages in the retail of agricultural products and services.
Source: CapIQ, Company Documents
Agriculture Demand Channel: Publicly Traded Company Comp Sheet - Business Descriptions
- 64 -

IMPORTANT DISCLOSURES
Research Analyst CertificationI, Ryan M. Connors, the Primarily Responsible Analyst for this research report, hereby certify that all of the views expressed inthis research report accurately reflect my personal views about any and all of the subject securities or issuers. No part of mycompensation was, is, or will be, directly or indirectly, related to the specific recommendations or views I expressed in thisresearch report.
Janney Montgomery Scott LLC ("Janney") Equity Research Disclosure LegendIndividual disclosures for the companies mentioned in this report can be obtained by accessing our Firm’s Disclosure Site
Disclosure Site
Definition of RatingsBUY: Janney expects that the subject company will appreciate in value. Additionally, we expect that the subject company willoutperform comparable companies within its sector.
NEUTRAL: Janney believes that the subject company is fairly valued and will perform in line with comparable companieswithin its sector. Investors may add to current positions on short-term weakness and sell on strength as the valuations orfundamentals become more or less attractive.
SELL: Janney expects that the subject company will likely decline in value and will underperform comparable companieswithin its sector.
Janney Montgomery Scott Ratings Distribution as of 9/30/13
IB Serv./Past 12 Mos.
Rating Count Percent Count Percent
BUY [B] 244 51.80 38 15.60
NEUTRAL [N] 221 46.90 21 9.50
SELL [S] 6 1.30 0 0.00
*Percentages of each rating category where Janney has performed Investment Banking services over thepast 12 months.
Other DisclosuresJanney Montgomery Scott LLC, is a U.S. broker-dealer registered with the U.S. Securities and Exchange Commission and amember of the New York Stock Exchange, the Financial Industry Regulatory Authority and the Securities Investor ProtectionCorp.
This report is for your information only and is not an offer to sell or a solicitation of an offer to buy the securities or instrumentsnamed or described in this report. Interested parties are advised to contact the entity with which they deal or the entity thatprovided this report to them, should they desire further information. The information in this report has been obtained or derivedfrom sources believed by Janney Montgomery Scott LLC, to be reliable. Janney Montgomery Scott LLC, however, does notrepresent that this information is accurate or complete. Any opinions or estimates contained in this report represent the judgmentof Janney Montgomery Scott LLC at this time and are subject to change without notice.
Investment opinions are based on each stock's 6-12 month return potential. Our ratings are not based on formal price targets,however, our analysts will discuss fair value and/or target price ranges in research reports. Decisions to buy or sell a stockshould be based on the investor's investment objectives and risk tolerance and should not rely solely on the rating. Investorsshould read carefully the entire research report, which provides a more complete discussion of the analyst's views. Supportinginformation related to the recommendation, if any, made in the research report is available upon request.
- 65 -