thiacloprid 2006 evaluation - food and agriculture ... · cn as, thiacloprid yrc 2894, piz 1264,...
TRANSCRIPT

983
THIACLOPRID (223)
The first draft was prepared by Mr. Christian Sieke, Federal Institute for Risk Assessment, Germany
EXPLANATION
Residue and analytical aspects of thiacloprid were considered for the first time by the present meeting. The manufacturer submitted studies on metabolism, analytical methods, supervised field trials, processing, freezer storage stability, environmental fate in soil and rotational crop residues.
IDENTITY
Common name: Thiacloprid Chemical name:
IUPAC: N-{3-[(6-Chloro-3-pyridinyl)methyl]-1,3-thiazolan-2- yliden}cyanamide CA (index): Cyanamide, [3-[(6-chloro-3-pyridinyl)methyl]-2-
thiazolidinylidene]- Manufacturer's code number: YRC 2894 CAS number: 111988-49-9 CIPAC number: not allocated Molecular formula: C10H9ClN4S
Structural formula:
NCl
N S
N CN
Molecular mass: 252.73 g/mol Formulations:
Formulation Content of active ingredients Trade names
SC 480 480 g/L Thiacloprid Calypso
SC 240 240 g/L Thiacloprid Calypso
OD 240 240 g/L Thiacloprid Biscaya
PHYSICAL AND CHEMICAL PROPERTIES
A detailed chemical and physical characterisation of the active ingredient is given in Table 1. References to test materials used: 1 Thiacloprid (batch 941013ELB01, purity 99.3%) 2 Thiacloprid (batch 950614ELB02, purity 99.7%) 3 Thiacloprid (batch 940629ELB04, purity 98.6%) 4 [methylene-14C] thiacloprid, radiochemical purity > 98%, specific radioactivity 3.43 MBq/mg

984 Thiacloprid
Table 1. Physical and chemical data of thiacloprid.
Property Results Test Material, Method
Reference
Physical state, colour
Active substance, pure: yellowish powder of crystals Active substance as manufactured: yellowish crystalline powder
Material 1 Technical ai
Krohn, J. 1996
Odour Active substance, pure: no characteristic odour Active substance as manufactured: weak characteristic odour
Material 1 Technical ai
Krohn, J. 1996
Melting point
136 °C A second modification has a melting point of 128°C.
Material 1 EU A.1.
Krohn, J. 1996 Goehrt, A. 1995
Density 1.46 g/cm³ at 20°C Material 1, OECD 109
Krohn, J. 1996
Vapour pressure
1.61 · 10-8 to 4.50 · 10-8 Pa at 50°C 1.21 · 10-7 to 1.61 · 10-7 Pa at 60°C 1.68 · 10-7 to 6.31 · 10-7 Pa at 70 °C 3 · 10-10 Pa at 20 °C (extrapolated) 8 · 10-10 Pa at 25 °C (extrapolated)
Material 2, OECD 104 ≅ EU A.4
Krohn, J. 1996
Volatility
Henry's law constant at 20°C (calculated): 5 × 10⁻¹⁰ Pa × m3 ×·mol-1
Krohn, J. 1996
Solubility in water
0.185 g/L at 20°C The solubility is not influenced by the pH in the range between pH 4 and pH 9.
Material 1, OECD 105 ≅ EU A.6.
Krohn, J. 1996
Solubility in organic solvents (at 20 °C, in g/L)
n-heptane < 0.1 g/L at 20°C xylene 0.30 g/L at 20°C 1-octanol 1.4 g/L at 20°C 2-propanol 3.0 g/L at 20°C ethyl acetate 9.4 g/L at 20°C polyethylen glycol (PEG) 42 g/L at 20°C acetonitrile 52 g/L at 20°C acetone 64 g/L at 20°C dichloromethane 160 g/L at 20°C dimethylsulfoxide 150 g/L at 20°C
Material 3, CIPAC MT 157, part 2
Krohn, J. 1996
Dissociation constant
Thiacloprid has no acidic or basic properties in aqueous solutions. It is not possible to specify dissociation constants of the active substance in water.
Material 1, OECD 112
Krohn, J. 1996
Partition coefficient n-octanol/ water
POW = 18 log POW = 1.26 at 20°C The effect of pH (4-9) was not investigated because there is no influence of pH on the water solubility.
Material 1, OECD 107 ≅ EU A.8
Krohn, J. 1996
Hydrolysis rate Thiacloprid is stable at pH 5, 7 and 9. Under the experimental conditions the test substance was recovered from solution at content levels throughout the experiment (95-98% of applied). In the pH range tested formation of hydrolysis products was only observed at pH 9 at amounts less than 2% of the applied radioactivity.
Considering the hydrolytic stability determined under environmental pH and temperature conditions it is not expected that hydrolytic processes will contribute to the degradation of thiacloprid in the environment.
Material 4, EPA 161-1
Brumhard, B. 1998
Thiacloprid 985
Property Results Test Material, Method
Reference
Photochemical degradation
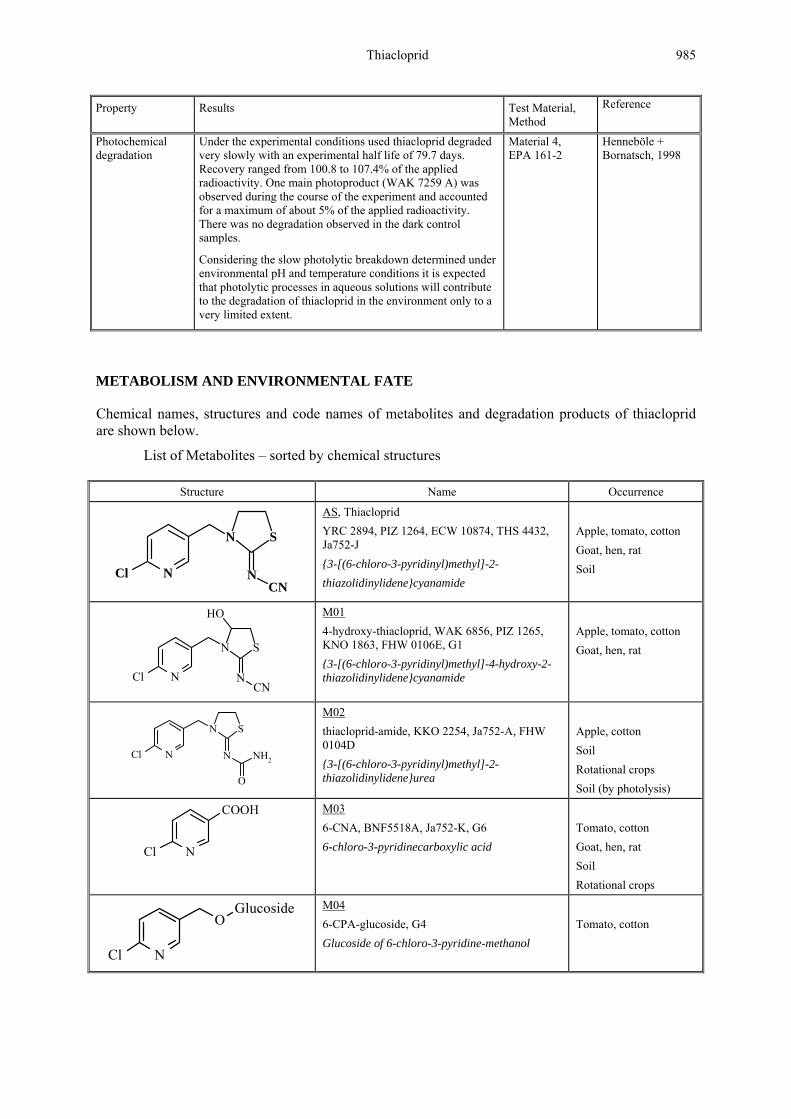
Under the experimental conditions used thiacloprid degraded very slowly with an experimental half life of 79.7 days. Recovery ranged from 100.8 to 107.4% of the applied radioactivity. One main photoproduct (WAK 7259 A) was observed during the course of the experiment and accounted for a maximum of about 5% of the applied radioactivity. There was no degradation observed in the dark control samples.
Considering the slow photolytic breakdown determined under environmental pH and temperature conditions it is expected that photolytic processes in aqueous solutions will contribute to the degradation of thiacloprid in the environment only to a very limited extent.
Material 4, EPA 161-2
Henneböle + Bornatsch, 1998
METABOLISM AND ENVIRONMENTAL FATE
Chemical names, structures and code names of metabolites and degradation products of thiacloprid are shown below.
List of Metabolites – sorted by chemical structures
Structure Name Occurrence
SN
NCl NCN
AS, Thiacloprid YRC 2894, PIZ 1264, ECW 10874, THS 4432, Ja752-J {3-[(6-chloro-3-pyridinyl)methyl]-2- thiazolidinylidene}cyanamide
Apple, tomato, cotton Goat, hen, rat Soil
SN
NCl NCN
OH
M01 4-hydroxy-thiacloprid, WAK 6856, PIZ 1265, KNO 1863, FHW 0106E, G1 {3-[(6-chloro-3-pyridinyl)methyl]-4-hydroxy-2-thiazolidinylidene}cyanamide
Apple, tomato, cotton Goat, hen, rat
SN
NCl N NH2
O
M02 thiacloprid-amide, KKO 2254, Ja752-A, FHW 0104D {3-[(6-chloro-3-pyridinyl)methyl]-2-thiazolidinylidene}urea
Apple, cotton Soil Rotational crops Soil (by photolysis)
NCl
COOH
M03 6-CNA, BNF5518A, Ja752-K, G6 6-chloro-3-pyridinecarboxylic acid
Tomato, cotton Goat, hen, rat Soil Rotational crops
NCl
OGlucoside
M04 6-CPA-glucoside, G4
Glucoside of 6-chloro-3-pyridine-methanol
Tomato, cotton

986 Thiacloprid
Structure Name Occurrence
NCl
OGlucoside R
M05 6-CPA-complex glucoside Complex glucoside of 6-chloro-3-pyridi-ne-methanol
Tomato
N
COOH
SHOOC
M06 6-CMT-nicotinic acid 6-[(carboxymethyl)thio]-3-pyridine-carboxylic acid
Rat
NH
NCl
COOH
O
M07 6-CN-glycine, WAK 3583 N-[(6-chloro-3-pyridinyl)-carbonyl]glycine
Goat, hen, rat
N
NCl
SCH3
O
NHCN
O
M08 6-CP-urea sulfoxide, KNO 2672
N-[(6-chloro-3-pyridinyl)methyl]-N’-cyano-N-[2-(methylsulfinyl)ethyl]urea
Goat, hen, rat
NH
N
COOH
SH3C
O
M09 KNO 1889
N-{[6-(methylthio)-3-pyridinyl]-carbonyl}glycine
Hen, rat
N
NCl
SCH3
O
NH O
NH2 O
M10 6-CP-biuret sulfoxide, KNO 1891, KNO 1873B N-[(6-chloro-3-pyridinyl)methyl]-N-N-[2-(methylsulfinyl)ethyl]iminodi carbonic diamide
Goat, hen, rat
SN
NCl N NH
OOH
M11 thiacloprid-hydroxylamide, KNO 1893 N-{3-[(6-chloro-3-pyridinyl)methyl]-2-thiazolidinylidene}-N’-hydroxyurea
Goat, hen, rat
SN
NCl NCN
OGluc.acid
M12 KNO 2621, PIZ 1270 Glucuronic acid conjugate of {3-[(6-chloro-3-pyridinyl)methyl]-4(or 5)-hydroxy-2-thiazolidinylidene}= cyanamide
Goat, rat
SN
NCl NCN
OGluc.acid
M13 KNO 2665, PIZ 1271 Glucuronic acid conjugate of {3-[(6-chloro-3-pyridinyl)methyl]-5(or 4)-hydroxy-2-thiazolidinylidene}= cyanamide
Goat, rat
NH
NCl NCN
NH2
M14 6-CP-cyanoguanidine, KNO 1872 N-[(6-chloro-3-pyridinyl)methyl]-N’-cyanoguanidine
Hen, rat

Thiacloprid 987
Structure Name Occurrence
NH
NCl SNCN
COOH
NH
O
CH3
M15 S-(6-CP-cyanoamidino)-acetylcystein, KNO 2684 N-acetyl-3-{[N-[(6-chloro-3-pyridinyl) methyl]-N’-cyano]amidinothio}alanine
Goat, hen, rat
ON
NCl NCN
M16 thiacloprid O-analogue, NTN 35078, PIZ 1266, KNO 1859 {3-[(6-chloro-3-pyridinyl)methyl]-2- oxazolidinylidene}cyanamid
Goat, hen, rat
NH
NCl NSH
NH2O
M17 6-CP-thiobiuret, KNO 1864 1-[(6-chloro-3-pyridinyl)methyl]-2-thiobiuret
Goat rat
N
NH2
SHO
NH
COOH
M18 1-CM-2-thiobiuret, PIZ 1241C N-{[(aminocarbonyl)amino]= thioxomethyl}glycine
Rat
SN CH3
NH
O
OH
CN
M19 PIZ 1252, PIZ 1250 N-[cyanimino(methylthio)methyl]= glycine
Rat
SNH
NCN
O
M20 PIZ 1297B (4-oxo-2-thiazolidinylidene)= cyanamide
Rat
SNH
NCN
M21 PIZ 1245 2-thiazolylcyanamide
Rat
OSN
NCNOH OH
OHSO3
M22 PIZ 1243, PIZ 1244 [3-(5-O-sulfono-furanosyl)-2- thiazolyl]cyanamide
Rat
SN
NH
O
NH2
M23 PIZ 1249 2-thiazolylurea
Rat

988 Thiacloprid
Structure Name Occurrence
NH
NCl
SCH3
OO
M24 PIZ 1297E N-[(6-chloro-3-pyridinyl)methyl]-2-(methylsulfinyl)acetamide
Rat
N
NCl
OH
NH O
NH2 O
M25 WAK 6935, PIZ 1297F N-[(6-chloro-3-pyridinyl)methyl]-N-(2-hydroxyethyl)imidodicarbonic diamide
Rat
N
NCl
OH
SH NCN
M26 PIZ 1253 N-[(6-chloro-3-pyridinyl)methyl]-N’-cyano-N-(2-hydroxyethyl)thiourea
Rat
SN
NCl NCN
O
M27 PIZ 1297D {3-[(6-chloro-3-pyridinyl)methyl]-4-oxo-2-thiazolidinylidene}cyanamide
Rat
NH
NCl
SCH3
O O
O
M28 PIZ 1269X N-[(6-chloro-3-pyridinyl)methyl]-2-(methylsulfonyl)acetamide
Rat
SN
NCl NH
M29 thiacloprid thiazolidinimine, KTU 3072, LZR 7497, Ja752-C, NTN 36232, WAK 7376 3-[(6-Chloro-3-pyridinyl)methyl]-2-thiazolidinimine
Soil Rotational crops
N
NCl
SO3- Na+
NH O
NH2 O
M30 thiacloprid sulfonic acid, sodium salt, thiacloprid sodium sulfonate, WAK 6999, Ja752-D, G9 Sodium 2-[[[(aminocarbonyl)amino]-carbonyl][(6-chloro-3-pyridinyl)-methyl]amino]ethanesulfonate
Soil Rotational crops
NH
NCl O NH2
M31 thiacloprid urea, DIJ 10739, Ja752-H [(6-chloro-3-pyridinyl)methyl]urea
Soil Rotational crops
NH
NCl NH O
NH2 O
M32 thiacloprid diamide, WAK 7747, Ja752-I, De23, Z8 N-[(6-chloro-3-pyridinyl)methyl]-imidodicarbonic diamide
Soil
N
NCl
SO3- Na+
NH O
NH2 O
O
M33 thiacloprid oxo-sodium sulfonate, Ja752-B Sodium 2-[[[(aminocarbonyl)amino]-carbonyl][(6-chloro-3-pyridinyl)-carbonyl]amino]ethanesulfonate
Soil

Thiacloprid 989
Structure Name Occurrence
N
NCl
SO3- Na+
O NH2
M34 YRC sulfonic acid amide, SAA, De24, Z1 Sodium 2-[(aminocarbonyl)[(6-chloro-3-pyridinyl)methyl]amino]ethane-sulfonate
Soil Rotational crops
N S
O
NH
NCN
M35 thiacloprid dewar pyridone, WAK 7259A [3-[(3-oxo-2-azabicyclo[2.2.0]hex-5-en-6-yl)methyl]-2-thiazolidinylidene]-cyanamide
Water
NCl
OH
M36 6-CPA, G2 6-chloro-3-pyridinemethanol
Cotton Rotational crops
SN
NCl N
OH
O
NH2
M37 4-hydroxy-KKO 2254, FHW 0104B {3-[(6-chloro-3-pyridinyl)methyl]-4-hydroxy-2-thiazolidinylidene}urea
Cotton Rotational crops
SN
NCl NCN
M38 thiacloprid-olefin, NTN 35099 {3-[(6-chloro-3-pyridinyl)methyl]-2-thiazolylidene}cyanamide
Cotton
NCl
O Glucose Pentose
M39 6-CPA-glucosylpentoside, G7 Glucosylpentoside of 6-chloro-3-pyridine-methanol
Cotton
NCl
O Glucose P/S
M40 6-CPA-glucosylphosphate/sulfate, G10 Glucosylphosphate/sulfate of 6-chloro-3-pyridinemethanol
Cotton
OS
NH
NCl
O CH3
M41 KNO 2673 N-[(6-chloro-3-pyridinyl)methyl]-(methylsulfinyl)carboxamide
Goat, hen
N
NCl
S
NH O
CH3
CN
M42 ANC 1502 N-[(6-chloro-3-pyridinyl)methyl]-N’-cyano-N-[2-(methylthio)ethyl]urea
Goat
N
NCl
S
NH O
NH2 O
CH3
M43 ANC 1503 N-[(6-chloro-3-pyridinyl)methyl]-N-[2-(methylthio)ethyl]imidodi-carbonic diamide
Goat
N
NCl
SCH3
O
O
COOH
M44 ANC 1508A 4-{[(6-chloro-3-pyridinyl)methyl] [2-(methylthio)ethyl]amino}-4-oxo-butanoic acid
Goat

990 Thiacloprid
Structure Name Occurrence
SN
NCl O
COOH
CH3
O
O
M45 ANC 1508B 4-{[(6-chloro-3-pyridinyl)methyl] [(methylsulfinyl)carbonyl]amino}-4-oxo-butanoic acid
Goat
Studies of metabolism and degradation were carried out with [14C]-thiacloprid labelled in the methylene-position and in the thiazolidine-position as shown below.
[Methylene-14C]-thiacloprid [Thiazolidine-14C]-thiacloprid
= position of label
Animal metabolism
The metabolism of thiacloprid has been studied in laboratory rats, goats and hens, in compliance with GLP. Rat metabolism studies were evaluated by the WHO Core Assessment Group of the 2006 JMPR. A short summary of the rat metabolism in comparison with the goat and hen metabolism is given on the end of this section.
Lactating goat
The kinetic behaviour and the metabolism of [methylene-14C]-thiacloprid were investigated in a lactating goat (Anderson, C.; Weber, H. and Bornatsch, W. 1998). A target dose of 10 mg/kg body weight was administered orally as a suspension in tragacanth to one lactating goat (34 kg bw at first dosing) on three consecutive days in time intervals of 24 hours.
Radioactivity was measured in the excreta, plasma and milk at different sampling intervals. The goat was sacrificed 6 hours after the final dosage, after which the edible tissues kidney, liver, muscle and fat were radio-assayed. Metabolites were extracted from milk and edible tissues and purified by applying chromatographic techniques (TLC and HPLC). Metabolite identification was based on co-chromatography with authentic references in two different chromatographic systems or on spectroscopic evidence (mass- and NMR-spectroscopy as well as hyphenated techniques). The quantification of the metabolites was conducted by integrating the 14C-signals in the chromatograms of the tissue extracts.
The radioactivity concentrations in the plasma were followed after the first administration. A broad maximum 2 hours after dosage with a peak level of 4.17 µg/mL, corresponding to about 42% of the equidistribution concentration of 10 µg/mL could be observed. The radioactivity was eliminated from the plasma in two phases. The initial phase was described by a half-life of about 5 hours. Thereafter, the elimination process slowed down and was governed by a half-life of about 32 hours. At this time, the concentration in plasma had decreased to 1.47 µg/mL.
SN
NCl NCN
* *
SN
NCl NCN
*

Thiacloprid 991
The recovery of radioactivity and the excretion behaviour of the lactating goat are presented in Table 2. The excretion amounted to about 53.7% of the total administered radioactivity until sacrifice. A portion of about 48.3% was eliminated with urine and 4.5% with faeces.
A small amount, 0.93% of the total dose, was secreted in milk. Milk was collected twice daily, just before application and again in the evening. An equivalent concentration of 2.43 µg/mL was measured in the milk 8 hours after the first dosage. The maximum concentration of 4.70 µg/mL was obtained at 32 hours.
Table 2. Percentages of the total radioactivity excreted/secreted with urine, faeces and milk.
Sample Time after 1st dose (h) Dose No. % of the total dose
Urine (incl. urine funnel rinse) 0 24 48 54
1 2 3
(sacrifice)
-- 17.95 30.12 0.18
Subto ta l 48.25
Faeces 0 24 48 54
1 2 3
(sacrifice)
-- 0.21 2.90 1.36
Subto ta l 4.47
Milk 0 8
24 32 48 54
1 2 3
(sacrifice)
-- 0.14 0.17 0.27 0.14 0.21
Subto ta l 0.93
Total excreted 53.65
Calculated/estimated residue in edible tissues 5.61
Recovery 59.25
Due to the short survival period after the last dosage, 40% of the dose was not recovered in the excreta.
At sacrifice 6 hours after the last administration, the highest equivalent concentration was measured in the kidney (24.78 mg/kg fresh weight), followed by that obtained for the liver (17.4 mg/kg). These concentrations corresponded to 0.21% and 1.25% of the total dose in the kidneys and liver, respectively. The residue concentrations of the other edible tissues are at least fourfold lower. The detailed data are shown in Table 3.

992 Thiacloprid
Table 3. Residue levels of thiacloprid equivalents in the edible tissues and organs of the lactating goat.
Organ Residue levels (mg/kg) Kidney 24.78 Liver 17.40 Muscle (flank) 4.18 Muscle (loin) 3.92 Muscle (round) 3.81 Fat (omental) 1.56 Fat (perirenal) 1.59 Fat (subcutaneous) 4.86 Milk (at sacrifice) 4.10
The radioactive residues were extracted from milk and edible tissues with high recoveries of 92 up to 99% using acetonitrile and mixtures of acetonitrile with 0.5% aqueous NaCl. In order to optimise the clean-up procedure and to provide sufficient sample material for metabolite identification, several series of extractions were conducted. After sample clean-up the extracts were analysed by HPLC for the quantitative determination of thiacloprid and its metabolites. The radioactive components were identified by co-chromatography with authentic reference compounds and by spectroscopic investigations.
More than about 96% of the TRR in fat and muscle was recovered by extraction. After sample clean-up, 94% of the TRR or more was subjected to quantitative analysis by HPLC. Unchanged thiacloprid was the pre-dominant component of the TRR accounting for at least 87% of the TRR in fat and about 90% in muscle. The corresponding concentrations were 1.6 mg/kg in fat and 3.5 mg/kg in muscle. Several metabolites were detected at levels near the LOQ. The total rate of identification was about 95% of the TRR in fat and at least 93% of that in muscle (Table 4).
In kidney about 90% or more of the TRR was recovered by extraction. Eighty nine percent of the TRR was subjected to quantitative analysis by HPLC after sample clean-up. Unchanged thiacloprid was the main component of the TRR accounting for at least 28.3% of the TRR in kidney, which corresponded to 7.0 mg/kg. The main metabolites in kidney were the glucuronides M12 and M13 as well as M08 with up to 10.7, 7.1 and 12.3% of the TRR each. A series of metabolites such as M01, M07, M10, M11, M16, M41 and M44/M45 accounted for about 2 to 5% of the TRR individually. The metabolite M15 and two peaks of unknown identity were near or below the LOQ of the TRR in kidney. The portion identified was about 81% of the TRR in kidney (Table 4).
About 94% or more of the TRR in liver was recovered by extraction. After sample clean-up at least 90% of the TRR was subjected to quantitative analysis by HPLC. Unchanged thiacloprid was the predominant component of the TRR accounting for at least 83% of the TRR in liver, corresponding to 14.4 mg/kg. Several metabolites were detected at levels near the LOQ. The total rate of identification was 88 to 92% of the TRR in liver (Table 4).
More than 92% of the TRR in milk was recovered by. For quantitative analysis by HPLC samples containing at least 87% of the TRR following sample clean-up were chosen. Unchanged thiacloprid was also the major radioactive component in milk accounting for at least 58% of the TRR, corresponding to 1.4 mg/kg. The main metabolite in milk was M08 at a level of up to 8.7%. Several metabolites such as M07, M16, M17, M42, M43 and M44/M45, were detected at levels below 5% of the TRR. The metabolite M43 could not be quantified due to interference of other minor unknown metabolites and the lack of an authentic reference compound. A few other metabolites were near the LOQ of 0.9% of the TRR. The portion identified was about 83% of the TRR in milk (Table 4).

Thiacloprid 993
Table 4. Quantitative distribution of metabolites in the edible tissues and in milk after administration of [methylene-14C]thiacloprid to a lactating goat based on the first series of extractions.
Metabolite Fat Kidney Liver Muscle Milk % TRR mg/kg % TRR mg/kg % TRR mg/kg % TRR mg/kg % TRR mg/kg M01 1.3 0.024 2.6 0.636 0.9 0.149 < 0.8 0.015 < 0.9 0.011 M071 4.4 1.090 3.5 0.087 M08 12.3 3.055 0.9 0.151 8.7 0.213 M10 < 0.8 0.007 3.3 0.812 < 0.8 0.104 < 0.8 0.017 1.4 0.035 M11 < 0.8 0.013 4.4 1.088 < 0.8 0.105 1.0 0.036 < 0.9 0.009 M12 < 0.8 0.013 10.1 2.500 < 0.8 0.049 M13 < 0.8 0.012 7.1 1.769 < 0.8 0.060 M15 1.1 0.020 0.8 0.200 0.8 0.148 0.9 0.035 < 0.9 0.019 M16 < 0.8 0.012 4.2 1.039 < 0.8 0.060 1.7 0.042 M17 1.6 0.039 M41 1.1 0.277 < 0.9 0.006 M42 2.3 0.057 M44/M45 2.1 0.513 1.0 0.026 thiacloprid 89.8 1.607 28.3 7.012 83.1 14.45 92.0 3.535 61.0 1.494 Unknown 10.0 1.931 2.4 0.411 2.9 0.112 3.6 0.048 Losses 4.6 9.3 9.8 2.3 13.2 Extraction yield 97.1 95.3 93.8 98.5 91.9 Identification 95.4 1.71 80.7 19.99 87.8 15.28 94.7 3.64 83.1 2.04
1) Metabolites not containing the thiazolidine heterocycle
Laying hens
The kinetic behaviour and the metabolism of [methylene-14C]-thiacloprid were studied in laying hens (Weber, H.; Printz, H. and Klempner, A. 1998). The test compound was administered to six hens in tragacanth suspension in three oral doses of 10 mg/kg bw (corresponding to 124 ppm in feed on dry weight basis), one dose per day, on three consecutive days.
Radioactivity was measured in the excreta, plasma and eggs at different intervals. The animals were sacrificed 6 hours after the final dose, after which the edible tissues kidney, liver, skin, muscle and fat were radioassayed. Metabolite analyses were performed with the eggs and the edible tissues except kidney. Metabolites were extracted from eggs and edible tissues with acetonitrile and mixtures of acetonitrile and methanol with a saline solution. This extraction procedure was followed by a microwave extraction step. Purification was conducted by chromatographic techniques (TLC and HPLC). Metabolite identification was based on co-chromatography with authentic references in two different chromatographic systems or on spectroscopic evidence (mass- and NMR-spectroscopy as well as hyphenated techniques). The quantification of the metabolites was conducted by integrating the 14C-signals in the chromatograms of the tissue extracts.
The absorption was fast so that the concentration-time-course of radioactivity in the plasma did not allow a determination of the absorption rate. A concentration of 1.54 µg/mL was obtained at the first sampling point (0.25 hours after dosing). The mean plasma concentration peaked at 3 hours with a mean value of approx. 1.6 µg/mL. Related to the dose of 10 mg/kg body weight, this value corresponded only to 16% of the so-called equidistribution concentration. The radioactivity was monophasically eliminated from the plasma with a half-life of 6.8 hours. Twenty-four hours after a single dose, the mean plasma concentration had declined to 0.19 µg/mL.
Until sacrifice the excretion amounted on average to 75.4% of the radioactivity totally administered. About 29.4% and 29.6% of the radioactivity totally eliminated during the whole test period was excreted within 24 hours after the first and the second administration, respectively. An-other portion of 16.4% was excreted after the last dose until sacrifice. On average, only 0.06% of the total dose was determined in the eggs. The recovery of radioactivity and the excretion behaviour of the laying hens, after administration of a daily dose of 10 mg per kg body weight on three consecutive days, are presented in Table 5.

994 Thiacloprid
Table 5. Percentages of the total radioactivity excreted/secreted with urine, faeces and eggs.
Sample Time after 1st dose (h) % of the total dose Mean CV (%)1 Excreta 24
48 54
29.37 29.62 16.36
11.31 9.64
32.52 Subtotal 75.35 10.22 Eggs; 0 - 54 h 0.06 53.18 Totally excreted 75.41 10.22 Estimated residue in tissues prepared 0.71 14.79 Recovery 76.12 10.16
1) CV: coefficient of variance
The highest equivalent concentrations were determined in the liver (3.061 mg/kg) and kidneys (2.404 mg/kg), respectively. The residue concentrations of the other edible tissues were at least fourfold lower. The average data are shown in Table 6.
Table 6. Residue levels of thiacloprid equivalents in the edible tissues and organs of laying hens.
Organ Residue levels (mg/kg)
Liver 3.061 Kidney 2.404 Muscle (leg) 0.152 Muscle (breast) 0.128 Skin (without fat) 0.295 Fat (subcutaneous) 0.083 Eggs (prior to sacrifice) 0.424 Eggs (from oviduct) 0.652
The radioactivity was extracted with solvent followed by microwave extraction with recoveries above 93%. After purification the extracts were co-chromatographed in two different HPLC-systems with authentic 14C-labelled reference compounds, which were previously isolated during the rat- and goat metabolism studies. All reference compounds were spectroscopically identified.
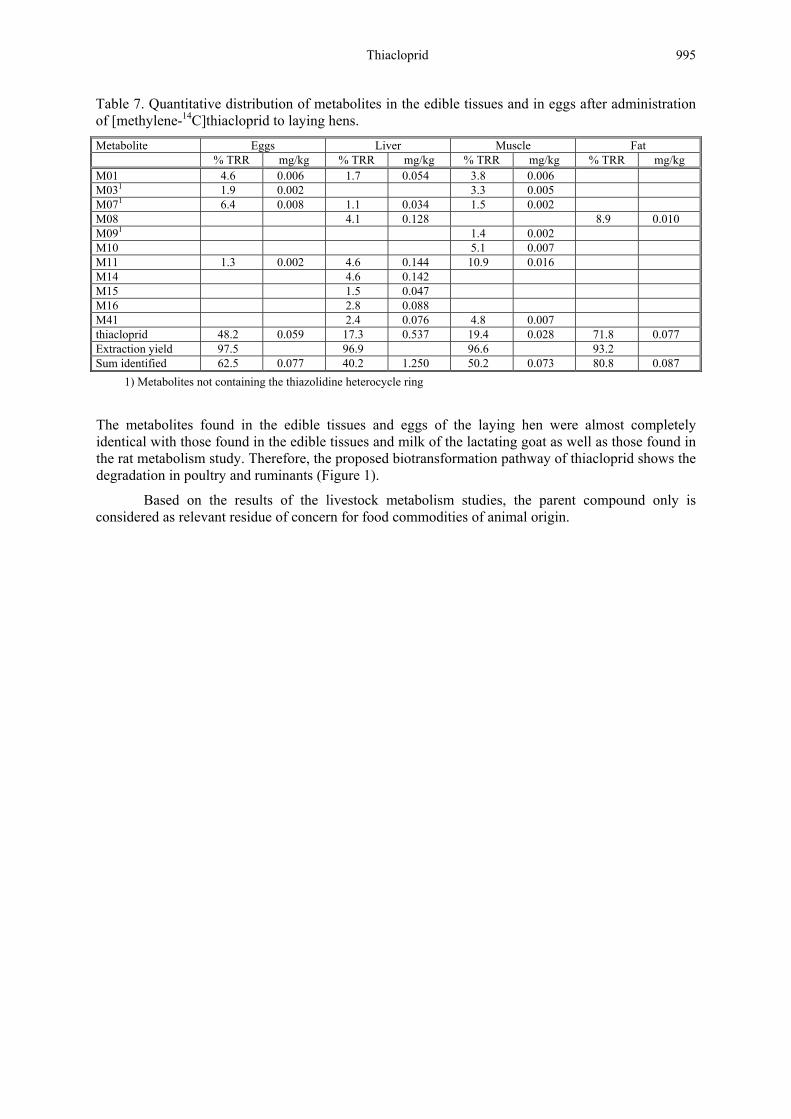
The unchanged parent compound was the major component in all extracts of edible tissues and eggs. Its concentration was higher in the more lipophilic matrices as compared to muscle or liver. Correspondingly, polar metabolites occurred at higher quantities in muscle and liver. In egg and fat extracts thiacloprid was found in quantities ranging from 48.2% to 71.8% of the TRR. In addition, up to four further polar metabolites, ranging from 1.3% to 8.9% of TRR were identified.
In muscle and liver extracts thiacloprid was found at quantities ranging from 17.3% to 19.4% of the TRR, while up to eight further polar metabolites, ranging from 1.1% to 5.1% of the TRR were identified. Table 7 gives a quantitative overview of the extraction yields and the amounts of identified compounds in the extracts of edible tissues and eggs.
Thiacloprid 995
Table 7. Quantitative distribution of metabolites in the edible tissues and in eggs after administration of [methylene-14C]thiacloprid to laying hens.
Metabolite Eggs Liver Muscle Fat % TRR mg/kg % TRR mg/kg % TRR mg/kg % TRR mg/kg M01 4.6 0.006 1.7 0.054 3.8 0.006 M031 1.9 0.002 3.3 0.005 M071 6.4 0.008 1.1 0.034 1.5 0.002 M08 4.1 0.128 8.9 0.010 M091 1.4 0.002 M10 5.1 0.007 M11 1.3 0.002 4.6 0.144 10.9 0.016 M14 4.6 0.142 M15 1.5 0.047 M16 2.8 0.088 M41 2.4 0.076 4.8 0.007 thiacloprid 48.2 0.059 17.3 0.537 19.4 0.028 71.8 0.077 Extraction yield 97.5 96.9 96.6 93.2 Sum identified 62.5 0.077 40.2 1.250 50.2 0.073 80.8 0.087
1) Metabolites not containing the thiazolidine heterocycle ring
The metabolites found in the edible tissues and eggs of the laying hen were almost completely identical with those found in the edible tissues and milk of the lactating goat as well as those found in the rat metabolism study. Therefore, the proposed biotransformation pathway of thiacloprid shows the degradation in poultry and ruminants (Figure 1).
Based on the results of the livestock metabolism studies, the parent compound only is considered as relevant residue of concern for food commodities of animal origin.

996 Thiacloprid
SN
NCl N NH
OOH
SN
NCl NCN
OH
N
NCl
SCH3
O
NHCN
O
M 08
N
NCl
SCH3
O
NH O
NH2 O M 11 M 10
M 01
M 12 / M 13 2 isomers
NH
NCl
COOH
O
M 07
NH
NCl SNCN
COOH
NH
O
CH3
M 15
NH
NCl NSH
NH2O M 17
SN
NCl NCN YRC 2894
SN
NCl NCN
OGluc.acid
NCl
COOH
M 03
NH
NCl XNCN
SN
NCl N
O
NH2
M 02
N
NCl
SCH3
NHCN
O
M 42
ON
NCl NCN
M 16
M 43
M 44
N
NCl
SCH3
O
O
COOH
N
NCl
SCH3
NH O
NH2 O
M 45
NH
NCl
S
O
O
CH3
M 41
SO
CH3N
NCl O
COOH
O
M 14
NH
NCl NH2NCN
NH
NS
COOH
O
CH3
M 09
The fragmentation behaviour does not allow to dis- tinguish between M44 and M45
G
H
G,H
G G
G
G
G,H
G,H
G,H
G,H
H
G,H
G,H
G,H
G,H
G,H
G,H
G
G,H
G,H
G,H
G
G: Goat; H: Hen
Figure 1. Metabolic pathways of thiacloprid in goats and hens.

Thiacloprid 997
Plant metabolism
The metabolism of thiacloprid has been studied after spray application in apples, tomatoes, cotton and wheat in compliance with the GLP.
Apples
Apples of the variety James Grieve were treated twice with [methylene-14C]-thiacloprid at an interval of 14 days (Clark, T. and Bornatsch, W. 1997). The last application was made 14 days prior to harvest. An aqueous suspension of the formulated product was applied uniformly to each of the apples using an Eppendorf syringe fitted with a tuft of hair at the tip. The following amounts were applied to each apple at both application dates: 104.8 µg 600 SC (50.6% ai), 53.0 µg ai, 0.22 MBq. The application rate was slightly exaggerated when compared to the annual recommended field rate of 300 g/ha thiacloprid. The apples were sampled 14 days after the second application (day 0).
In the scope of this study also a translocation experiment was conducted, in which [methylene-14C]-thiacloprid was applied on the same days as for the metabolism experiment. The tests were conducted each with one apple and the adjacent leaves above and below. The same solutions and method of application was used as for the metabolism experiment, i.e., the leaves received the same total amount of radioactivity as each apple in the metabolism experiment.
The apples were extracted with methanol/water (1:1) and methanol. The radioactivity in the extract was measured by liquid scintillation. The solids were air dried and aliquots taken and combusted. The identification was achieved by co-chromatography (TLC and HPLC) with the authentic reference compounds as well as by 1H-NMR and mass-spectroscopic methods.
The total radioactive residue (TRR) in apples amounted to 0.74 mg/kg parent compound equivalents. The vast majority of the TRR was removed by surface washing with dichloromethane (84.4% or 0.62 mg/kg), 12.9% (0.10 mg/kg) was detected in the extract and only 2.7% (0.02 mg/kg) remained unextracted in the solids, which were not investigated further.
Of the radioactivity present in the surface wash solution, extract and solids 90.8% (0.67 mg/kg) was identified as unchanged parent compound. Only two other metabolites were detected in any significant quantities and these were identified as the 4-hydroxy derivative of the parent compound (M01; 2.2%, 0.02 mg/kg) and the amide (M02; 1.3%, 0.01 mg/kg). A summary of the distribution of metabolites in the different fractions of apples is presented in Table 8.
The results of the translocation experiments showed that some of the applied radioactivity (ca. 25% on average) was lost, probably due to volatilisation. Virtually all the recovered radioactivity was found in the treated leaves while only traces of parent compound and metabolites (0.05% on average) were translocated from the leaves to the apples above and below the treated leaves.
Table 8. Distribution of metabolites in the different fractions of apples.
Compound/Metabolite % TRR mg/kg parent equivalents Surface wash solution 84.4 0.62
Thiacloprid 82.4 0.61 M01 1.4 0.01 M02 0.6 < 0.01 Extract 12.9 0.1 Thiacloprid 8.4 0.06 M01 0.8 0.01 M02 0.7 0.01 Polar radioactivity 3.0 0.02 Solids 2.7 0.02 Total 100 0.74

998 Thiacloprid
Tomatoes - metabolism
In a greenhouse 10 bunches of tomatoes (82 tomatoes) were sprayed twice with [methylene-14C]-thiacloprid at an interval of 14 days (Babczinski, P. 1997). The last application was made 14 days prior to the final harvest. An aqueous suspension of the formulated product was applied uniformly to each of the plants using a metre jet spray gun fitted with a flat-fan nozzle. Each bunch of tomatoes including the surrounding leaves and stalks was sprayed separately. In each application a total of 30 mL of formulation was applied which is equivalent to 7.9 mg ai or to 32.6 MBq of total radioactivity, respectively. This corresponded to an application rate of approximately 2 × 0.375 kg ai/ha.
The tomatoes were harvested as follows: Immediately after the second application (day 0) five tomatoes were harvested. Three of these were used to calculate the TRR and to analyse the quantitative distribution of metabolites. The remaining two tomatoes were used to determine the efficiency of surface washing with methanol.
At day 3, after the second application, 29 tomatoes were collected while the final harvest of 38 tomatoes was performed at day 14. Eight tomatoes were also harvested at this time and stored at -20°C without surface wash as a reserve sample for the validation of the residue method.
The tomatoes were surface washed and extracted with methanol. The radioactivity in the extract was measured by liquid scintillation. The solids were air dried and aliquots taken and combusted. The identification was achieved by co-chromatography (TLC and HPLC) with the authentic reference compounds as well as by 1H-NMR and mass-spectroscopic methods.
The TRR in tomatoes at day 0 amounted to 0.76 mg/kg parent compound equivalents. The vast majority of the TRR was removed by surface washing with methanol (95.8% or 0.72 mg/kg), 4.0% (0.03 mg/kg) was detected in the extract and only 0.2% (< 0.01 mg/kg) remained unextracted in the solids.
Tomatoes harvested at day 3 and 14 yielded TRR values of 0.77 and 0.94 mg/kg, respectively. Again, the biggest part could be removed by surface washing and amounted to 87.8% (0.68 mg/kg) on day 3 and 84.3% (0.79 mg/kg) on day 14. The respective amounts in the methanol extract were 11.2% (0.09 mg/kg) on day 3 and 14.1% (0.13 mg/kg) on day 14 indicating a slight increase of the uptake of radioactivity during this time. Also the level of radioactivity in the solids increased slightly from day 0 to day 3 (1.0%, < 0.01 mg/kg) and further to day 14 (1.6%, 0.02 mg/kg). The solids were not investigated further.
Of the radioactivity present in the surface wash solution and the extract 94.4% (0.88 mg/kg) was identified as unchanged parent compound. Six further metabolites were detected in low quantities ranging from < 0.01 to 0.03 mg/kg. The main metabolite was identified as a complex 6-chloropicolyl alcohol glucoside (M05; 2.8%, 0.03 mg/kg). Three further glucosides were detected (together 0.6%, < 0.01 mg/kg), one of which was the 6-chloropicolyl alcohol glucoside (M04, 0.3%, < 0.01 mg/kg). The other two remained unidentified. Two more metabolites were identified as the 4-hydroxy derivative of the parent compound (M01; 0.4%, < 0.01 mg/kg) and 6-chloronicotinic acid (M03; 0.2%, < 0.01 mg/kg). A total of 98.1% (0.92 mg/kg) of the TRR in tomatoes was identified. The results are summarised in Table 9.
Table 9. Distribution of metabolites in different fractions of tomatoes (day 14).
Compound/Metabolite % TRR Mg/kg parent equivalents Surface wash solution 84.3 0.79 Identified 84.3 0.79 Thiacloprid 84.3 0.79 Methanol extract 14.1 0.13 Identified 13.8 0.09 Thiacloprid 10.1 < 0.01 M01 0.4 < 0.01 M03 0.2 < 0.01 M04 0.3 0.03 M05 2.8 < 0.01
Thiacloprid 999
Compound/Metabolite % TRR Mg/kg parent equivalents Characterised as glucose conjugates of M04
0.3 < 0.01
Non extractable residues 1.6 0.02 Subtotal identified 98.1 0.92 Subtotal identified/characterised 98.4 0.92 Total residue 100 0.94
Tomatoes – translocation
In a supplementary study to the above described metabolism study, the translocation in tomatoes was also investigated (Koester, J. 1997). [Methylene-14C-methyl]-thiacloprid, formulated as a 600 SC, was sprayed twice to the soil surface of four container grown plants. The application was based on the assumption that under GAP conditions a certain fraction of the application solution would reach the soil during and after spraying. The application rate was 0.55 mg active substance at the first and 0.58 mg active substance at the second application. The total application rate was equivalent to 89.7 g ai/ha. The time interval between the applications was 14 days. The tomatoes of the first two plants were harvested 3 days after treatment and those of the remaining two plants 14 days after the second application as a mixture of green, reddish, and red fruits.
The TRR in the tomatoes was determined by adding the radioactivity in the extracts and the air-dried solids after extraction. In all cases, less than 0.1% of the radioactivity applied to the soil surfaces was detected in the tomato fruits. From the total amount recovered, an average of 94.1% was found in the extracts, the remainder was measured in the unextracted solids. The transformation of the total residue concentrations to parent compound equivalents yielded in all cases concentrations below 0.001 mg/kg. As a result, further analyses on the extracts were not conducted.
Cotton
[Methylene-14C-methyl]thiacloprid was applied to cotton in three spray applications (Babczinski, P. 1998). The cumulative application rate was 375 g ai/ha. The time interval between each of the treatments was seven days. 120 days after the last application the cotton plants were harvested, i.e., at the time of natural maturity.
Leaves, petals, gin trash, lint, and seeds were collected and homogenised. The homogenised samples were extracted with acetonitrile and acetonitrile/water (1:1). The residue remained in the extracted gin trash was further extracted using acetone/water (1:1) in a microwave at 120°C, and the aqueous remainder partitioned against n-hexane and dichloromethane. The residues in extracted seeds were further extracted with n-hexane, dichloromethane and acetone followed by an extraction of the resulting residue using acetic acid and acetone/water (1:1). The latter extraction step was repeated in a micro-wave. The combined aqueous phases were subsequently partitioned against dichloromethane and ethyl acetate. Radioactivity was determined in the extracts and the extracted solids.
Metabolites were purified from the extracts by solid phase extraction methods and identified by comparative thin-layer chromatography and HPLC with authentic reference compounds using different chromatographic methods. Mass- and NMR-spectroscopy were also employed for structure elucidation.
The total radioactive residue (TRR) in cotton gin trash at harvest amounted to 3.21 mg/kg (ai equivalents), i.e., 97.2% was extracted. The main component was the parent compound (73.5%, 2.36 mg/kg). Fourteen metabolites were detected, twelve of these amounted to 14.8% (0.48 mg/kg) of the gin trash residue. These were: 6-chloronicotinic acid (M03) as the main gin trash metabolite (3.3%, 0.11 mg/kg), 4-hydroxy thiacloprid (M01; 2.7%, 0.08 mg/kg), 6-chloro-picolyl alcohol (M36; 1.5%, 0.05 mg/kg) and its glucoside (M04; 1.2%, 0.04 mg/kg), two complex 6-CPA glucosides (glucosyl-pentoside [M39] and glucosylphosphate or -sulfate [M40]; each 1.1%, 0.04 mg/kg), the sulfonic acid derivative (M30; 0.9%, 0.03 mg/kg) and as a minor component monohydroxylated thiacloprid amide (M37; 0.4%, 0.01 mg/kg). Two further metabolites were identified as thiacloprid amide (M02; 1.9%,

1000 Thiacloprid
0.06 mg/kg) and the olefin derivative of the parent compound (M38; not quantified). In total, 85.7% (2.76 mg/kg) of the TRR in cotton gin trash was identified.
The total radioactive residue in cotton leaves (including petals) amounted to 30.35 mg/kg ai equivalent. In total, 98.1% (29.77 mg/kg) was extracted; the non-extractable residue amounted to 1.9% (0.58 mg/kg). As in gin trash, the main component was thiacloprid (83.9%, 25.46 mg/kg). Thirteen metabolites were detected, amounting to 12.3% (3.73 mg/kg) of the leaves residue. Nine of these were identified, eight of them were also found in gin trash. These were: Two complex 6-CPA glucosides (M39; glucosyl-pentoside as the main leaf metabolite: 2.7%, 0.82 mg/kg; M40; glucosyl-phosphate or -sulphate: 1.4%, 0.43 mg/kg), 6-chloropicolyl alcohol (M36; 0.5%, 0.15 mg/kg) and its glucoside (M04; 1.2%, 0.37 mg/kg), 6-chloronicotinic acid (M03; 1.1%, 0.33 mg/kg), 4-hydroxylated thiacloprid (M01; 0.8%, 0.24 mg/kg), 4-hydroxylated thiacloprid amide (M37; 1.2%, 0.36 mg/kg) and as a minor component the sulfonic acid derivative (M30; 0.3%, 0.09 mg/kg). A further metabolite was characterised as a complex conjugate of 6-chloronicotinic acid with glucose and a plant constituent (possibly protocatechuic acid). This metabolite is probably similar to one of the complex 6-chloronicotinic acid conjugates described for cotton seed. The four unidentified metabolites were polar in nature and each amounted to ≤ 1.2% (≤ 0.37 mg/kg). In total, 93.1% (28.25 mg/kg) of the TRR in cotton leaves was identified.
The TRR in cotton seed at harvest amounted to 1.12 mg/kg ai equivalents, 99.8% thereof was extracted. The main metabolite was free 6-chloronicotinic acid (M03) which accounted for 45.8% (0.51 mg/kg) of the TRR. Unchanged thiacloprid was only a minor component (0.6%, 0.01 mg/kg). Up to twenty further metabolites were detected totally accounting for 42.7% (0.48 mg/kg) of the TRR. That part of the seed residue which was neither free 6-chloronicotinic acid (M03) nor thiacloprid, 41.3% (0.46 mg/kg) was characterised after oxidation to comprise the 6-chloronicotinic acid-moiety by using permanganate oxidation as developed in total residue method for imidacloprid, a structurally related chloronicotinyl insecticide. Therefore, the total residue based on or identical with 6-chloronicotinic acid (including the parent compound) equalled 87.7% (0.98 mg/kg).
The distribution of metabolites in cotton is summarised in Table 10.
Table 10. Distribution of metabolites in different fractions of tomatoes (day 14).
Crop
Cotton leaves Cotton seed
TRR = mg/kg 30.35 1.12 thiacloprid 83.9 0.6 M01 0.8 - M031 1.1 45.8 M041 1.2 - M30 0.3 - M361 0.5 - M37 1.2 - M391 2.7 - M401 1.4 - Complex glucosides of M36 - 0.3 Complex glucosides of M03 - 29.7 Unknown (%) 5.0 23.4 Not extracted (%) 1.9 0.2 Total (%) 100 100
1) Metabolites not containing the thiazolidine heterocycle
Wheat
The metabolism of thiacloprid was investigated in spring wheat following two applications with a spray interval of 14 days and a pre-harvest interval of 21days (Bongartz, R. and Neumann, B. 2001). The actual application conditions simulated normal practice: Radiolabelled [methylene-14C]-thiacloprid was formulated as a 112.5 SE containing 100 g/L thiacloprid and 12.5 g/L of a mixing partner, which was replaced by water in the study. A computer controlled track sprayer with a flat-fan
Thiacloprid 1001
nozzle was used for the two applications. In the first spray application 49.9 g ai/ha was applied to wheat at growth stage 75 of the BBCH code (medium milk stage). The second application of 44.8 g ai/ha followed 14 days later at growth stage 77 of the BBCH code (late milk stage). This resulted in a total application rate of 94.7 g ai/ha. Wheat hay was sampled seven days after the first application. Wheat straw and grain were harvested at maturity 21 days after the second application.
Hay, straw, and grain were homogenised and extracted with acetonitrile/water (1:1) and acetonitrile. The combined extracts for each sample material were partitioned with dichloromethane. All phases were chromatographed and quantitated by HPLC with radioactivity detection. The solid remained after the first extraction was extracted with acetonitrile/water (1:1) at 120°C using a microwave. After this, the residues remaining in straw were hydrolysed with dioxane/2N HCl (9:1). Metabolites were isolated by HPLC and identified by co-chromatography with authentic reference compounds or by mass spectroscopy.
The total radioactive residue (TRR) in hay, which received only one application, amounted to 2.04 mg/kg (parent compound equivalents), 94.6% was extracted by liquid-solid and additional 3% by microwave extraction. The main component was the parent compound (81.4%, 1.66 mg/kg). Many minor metabolites were detected, all amounting to ≤ 0.03 mg/kg each. Ten metabolites were identified: a conjugate of 6-chloronicotinic acid (1.7%, 0.03 mg/kg) and 6-chloronicotinic acid (M03, 1.2%, 0.03 mg/kg), 4-hydroxy-thiacloprid (M01, 1.6%, 0.03 mg/kg), the sulfonic acid derivative (M30, 1.2%, 0.03 mg/kg) and a conjugate thereof (0.4%, 0.01 mg/kg), thiacloprid diamide (M32, 0.5%, 0.01 mg/kg), 6-chloropicolyl alcohol (M36, 0.4%, 0.01 mg/kg), thiacloprid-olefin (M38, 0.4%, 0.01 mg/kg), thiacloprid-amide (M02, 0.2%, < 0.01 mg/kg) and 3-aminocarbonyl-1-(6-chloro-pyridin-3-ylmethyl)-1-(2-hydroxy-ethyl)-urea (M25, 0.1%, < 0.01 mg/kg). In total, 89.3% (1.82 mg/kg) of the TRR in hay was identified.
In straw the TRR amounted to 12.36 mg/kg (parent compound equivalents), 95.0% was extracted by liquid-solid and additional 3.1% by microwave extraction. The extraction residue was further treated with dioxane/HCl, which again released 1.2% of the TRR. The main component in straw was the parent compound (83.4%, 10.30 mg/kg). Ten metabolites were identified: 6-chloronicotinic acid (M03, 2.2%, 0.27 mg/kg) and a conjugate thereof (1.1%, 0.13 mg/kg), 4-hydroxy-thiacloprid (M01, 1.9%, 0.23 mg/kg), the sulfonic acid derivative (M30, 1.0%, 0.13 mg/kg) and a conjugate thereof (0.3%, 0.03 mg/kg), thiacloprid diamide (M32, 0.4%, 0.05 mg/kg), 6-chloropicolyl alcohol (M36, 0.3%, 0.04 mg/kg), thiacloprid-olefin (M38, 0.3%, 0.04 mg/kg), thiacloprid-amide (M02, 0.3%, 0.04 mg/kg) and 3-aminocarbonyl-1-(6-chloro-pyridin-3-ylmethyl)-1-(2-hydroxy-ethyl)-urea (M25, 0.1%, 0.01 mg/kg). In total, 91.3% (11.28 mg/kg) of the TRR in straw was identified.
The total radioactive residue (TRR) in grain amounted to 0.21 mg/kg (parent compound equivalents), 89.6% was extracted by liquid-solid and additional 4.8% by microwave extraction. The main component in grain was the parent compound (80.9%, 0.17 mg/kg). Only few minor metabolites were detected, all of them << 0.01 mg/kg. Two metabolites were assigned to the conjugate of 6-chloronicotinic acid (1.7%, < 0.01 mg/kg) and 4-hydroxy-thiacloprid (M01, 0.7%, < 0.01 mg/kg). In total, 83.3% (0.17 mg/kg) of the TRR in grain was identified. The distribution of metabolites in wheat is summarised in Table 11.
Table 11. Distribution of metabolites in different fractions of wheat.
Crop crop part
Wheat hay Wheat straw Wheat grain
TRR = mg/kg 2.04 12.36 0.21 thiacloprid 81.4 83.4 80.9 M01 1.6 1.9 0.7 M02 0.2 0.3 - M031 1.2 2.2 - M25 0.1 0.1 - M30 1.2 1.0 - M32 0.5 0.4 -

1002 Thiacloprid
Crop crop part
Wheat hay Wheat straw Wheat grain
M361 0.4 0.3 - M38 0.4 0.3 - Conjugate of M03 1.7 1.1 1.7 Conjugate of M30 0.4 0.3 - Unknown (%) 8.3 8.0 11.1 Not extracted (%) 2.4 0.7 5.6 Total (%) 100 100 100
1 Metabolites not containing the thiazolidine heterocycle
Environmental fate in soil
Hydrolysis
The test was performed to determine the rate of hydrolysis of thiacloprid in sterile aqueous solution at various pH values at 25°C and to obtain information on the identity and pattern of hydrolysis products (Brumhard, B. 1998). The hydrolysis of [methylene-14C]-thiacloprid was investigated in the dark at pH values of 5, 7 and 9 at a concentration of 0.35 mg ai/L. Test duration was 30 days with sampling intervals of 0, 2, 7, 13, 20 and 27 days. After the 30 days storage period thiacloprid recoveries were 95–98% of the applied radioactivity in all samples. In the pH range tested formation of hydrolysis products was only observed at pH 9 at amounts less than 2% of the applied radioactivity.
Photolysis on soil surfaces
The photo-transformation of [methylene-14C]-thiacloprid was studied (Brumhard, B. 1998) on thin layers of the sandy loam soil “Howe“ (IN/USA; 65.5% sand; 26.3% silt; 8.2% clay; 1.09% org. C; pH in CaCl2: 7.1) which was also used in the aerobic soil metabolism study. The dose rate was 2.34 mg/kg soil (dry substance) corresponding to about 350 g ai/ha (calculated for a soil density of 1.5 g/cm3 and 1 cm depth). The water content of the samples was adjusted to 75% of the 1/3 bar moisture of the soil. The soil thin layers were continuously irradiated with a Xenon lamp simulating natural sunlight. The spectrum was cut off at wavelengths below 290 nm and the light intensity was 9.3 mW/cm2. The temperature of the testing system was maintained at 25 ± 1°C. Duplicate samples were taken for analysis 0, 4, 7, 13 and 18 days post-treatment. ‘Dark’ samples were taken 7 and 19 days post-treatment. Volatile radioactivity was trapped using soda lime and released for measurement by adding HCl.
Soils were exhaustively extracted by shaking with methanol immediately after sampling. Additionally, the soil was subjected to further extraction with methanol/water (50/50) at about 180°C using a Soxtec® high temperature extraction unit. The radioactivity was determined in all samples and the extracts analysed by AMD (automated multiple development)-TLC and HPLC-methods. Metabolites were identified by NMR- and mass-spectroscopy and by comparison with authentic reference compounds.
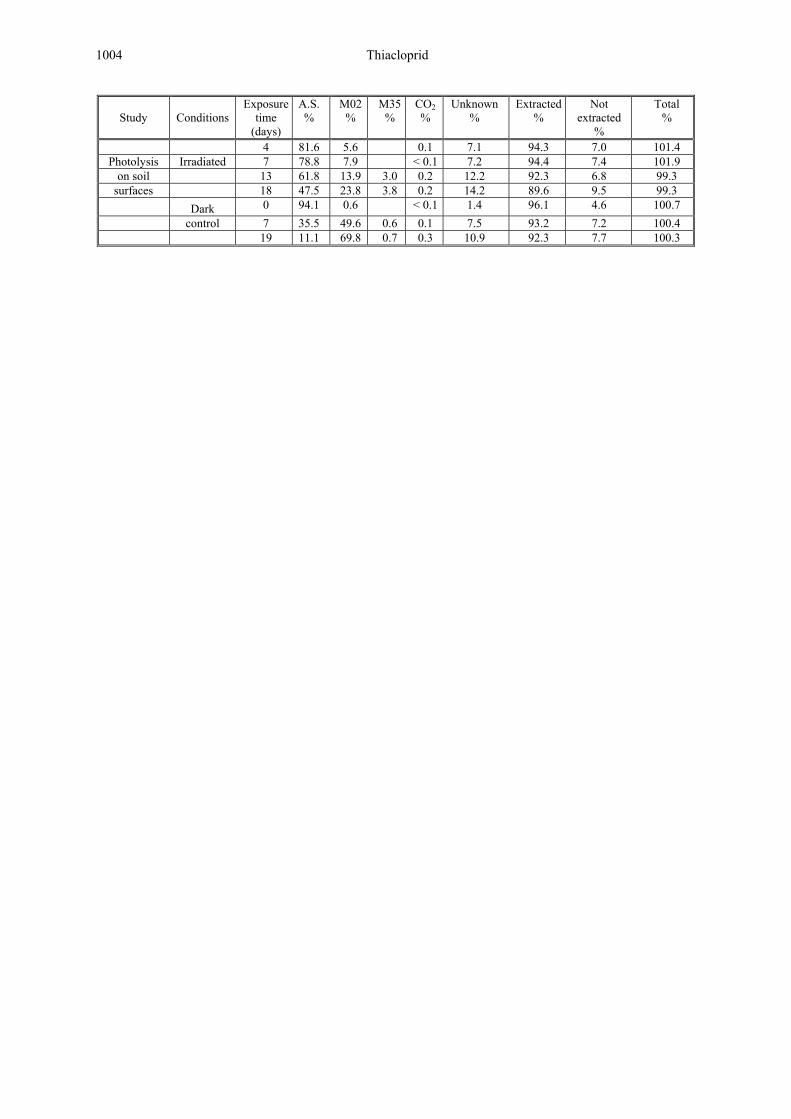
Under the experimental conditions thiacloprid degraded with an experimental half-life (DT50) of 18.8 days in the irradiated samples. This corresponds to a calculated environmental half-life of 74 days during midday and midsummer at 40° of latitude (Phoenix, AZ, USA). It is expected that the half-life at sites with less radiation intensity or in spring, fall or winter would be longer. The amount of unextracted residues was below 10% of the applied radioactivity. Besides the parent compound, one main degradate (M02) was observed in the extracts of irradiated and dark soil samples. At any time of the study all other products, individually made up less than 5% of the applied radioactivity. One of these metabolites was identified as the so-called “Dewar-pyridone” (M35). The results of the distribution of thiacloprid and its degradation products are summarised in Figure 2. Metabolic pathways of thiacloprid in plants
Table 12.

Thiacloprid 1003
The degradation observed in the dark samples (DT50 = 6.3 days) was about threefold faster as compared to the irradiated samples. It is therefore concluded from this study that under environmental conditions the solar reaction will contribute only to a very limited extent to the overall degradation of thiacloprid on soil surfaces.
SN
NCl NCN
OH
N
NCl NHO
SO3H
O NH2
SN
NCl NCN
SN
NCl NCN
SN
NCl N
O
NH2
SN
NCl N
O
NH2
OH
NCl
OH
NCl
COOH
NCl
O Glucose
NCl
O Glucose P/S
NCl
O Glucose Pentose
NCl
O Glucose R
N
NCl NHO
OH
O NH2
NH
NCl NHO
O NH2
M 01 YRC 2894 M 02
M 37
M 30
M 03 (6-CNA)
6-CNA-conjugates
M 36 (6-CPA)
M 04
M 40 M 39
M 38
M 05
sulfonic acid-conjugate
M 25 M 32
Figure 2. Metabolic pathways of thiacloprid in plants
Table 12. Recovery of radioactivity and distribution of the active substance and metabolites after application of [methylene-14C]-thiacloprid to thin soil layers of sandy loam under artificial light conditions and in the dark (in % of the applied radioactivity) [mean of two values].
Study
Conditions
Exposure time
(days)
A.S. %
M02%
M35%
CO2%
Unknown%
Extracted %
Not extracted
%
Total %
0 94.1 0.6 < 0.1 1.4 96.1 4.6 100.7
1004 Thiacloprid
Study
Conditions
Exposure time
(days)
A.S. %
M02%
M35%
CO2%
Unknown%
Extracted %
Not extracted
%
Total %
4 81.6 5.6 0.1 7.1 94.3 7.0 101.4 Photolysis Irradiated 7 78.8 7.9 < 0.1 7.2 94.4 7.4 101.9
on soil 13 61.8 13.9 3.0 0.2 12.2 92.3 6.8 99.3 surfaces 18 47.5 23.8 3.8 0.2 14.2 89.6 9.5 99.3
Dark 0 94.1 0.6 < 0.1 1.4 96.1 4.6 100.7 control 7 35.5 49.6 0.6 0.1 7.5 93.2 7.2 100.4 19 11.1 69.8 0.7 0.3 10.9 92.3 7.7 100.3

Thiacloprid 1005
SN
NCl NCN YRC 2894
SN
NCl NH
NCl
COOH
SN
NCl N
O
NH2
N
NCl NH
SO3H
O
O
NH2
NH
NCl NH
O
O
NH2
M 02
M 32
M 29 M 30 M 33
M 03
M 35
M 31
SN
NCN
NH
O
CO2
N
NCl NH
SO3H
O
O
NH2
O
NH
NCl NH2
O
N
NCl
SO3H
O NH2
M 34
Figure 3. Proposed degradation pathway of thiacloprid in the soil, considering outdoor and photolysis on soil surfaces studies.
Residues in rotational crops
The metabolism of thiacloprid, formulated as a SC 480, was investigated (Clark, T. and Babczinski, P., 1998) in the following rotational crops spring wheat, lettuce and turnips planted into containers of soil treated with of [pyridinyl-14C-methyl]-thiacloprid. The rate applied was approximately 10% above the highest rate used in the first season of residue trials (375 g ai/ha). This was to allow for any losses during application. The soil was aged for 30 days and tilled to a depth of 15 cm prior to planting the first set of rotational crops. Lettuce was transplanted in one quarter of the soil area,

1006 Thiacloprid
turnips were sown in a second quarter and spring wheat was sown in the remaining half. Lettuce was harvested on day 63 (i.e., 63 days after application) and turnips on day 105. Wheat was sampled at three different intervals, immature (day 70), hay (day 128) and maturity (day 170). The roots of lettuce and wheat were not harvested and remained in the soil for all rotations. Following the harvest of wheat, the soil was tilled (as for the first interval) and a second set of rotational crops were sown/transplanted as described above on day 170. In the second cycle the crops were sown/transplanted into different sectors of the container. The harvest days were as follows, lettuce day 220, turnips day 259, immature wheat day 212, wheat hay 232 and wheat grain and straw day 261. The above was repeated for the third rotation at the one year plant back interval (day 354). The harvest days were as follows, lettuce day 387, turnips day 441, immature wheat day 395, wheat hay 455 and wheat grain and straw day 526.
At maturity the wheat was separated into grain and straw. The glumes and the remainder of the ears were added to the straw fraction. Mature turnips were separated into bulbs and tops. The following seven plant fractions were obtained at each of the three intervals: Lettuce, turnip tops, turnip bulbs, immature wheat, wheat hay, wheat straw, and wheat grain. The individual plant fractions were macerated and extracted with methanol/water (1:1). Exhaustive extraction was achieved by microwave extraction using mixtures of acetonitrile/water. The radioactive content was measured by LSC in all extracts and the extraction residues after combustion. The extracts were cleaned by solid phase extraction, where necessary, and analysed by TLC and HPLC. Metabolites were identified by co-chromatography with authentic reference compounds and by spectroscopic methods.
A significant decrease in the TRR was observed over the whole period of the study although in some cases an increase was seen between the 30 and 170 day rotational crops. The TRR ranged from 0.005 mg/kg in turnip bulbs from the 354 day rotation to 2.6 mg/kg in wheat straw from the 170 day rotation. Overall, good extractability was achieved by conventional means, generally over 80%, after which microwave extraction was performed on the solids of the 2nd rotation to extract further radioactivity. A maximum of 9.5% of the TRR (turnip bulbs) was additionally extracted from any of the crops. In all cases, except wheat hay and straw, the amounts additionally extracted by microwave were all below 0.001 mg/kg. Only in wheat straw was the residue of any significance (0.15 mg/kg). Furthermore, radio-TLC showed that the radioactivity extracted by microwave was distributed over many components and therefore no further work was carried out on these samples. Due to the fact that the residues were generally very low and distributed over a number of components, the individual components were not quantified and were thus not accounted for in the distribution of metabolites. The total radioactive residue (TRR) based on fresh weight for each crop in each rotation is given in Table 13.
Table 13. Total radioactive residue (TRR) in rotational crops based on fresh weight.
Thiacloprid Equivalents (mg/kg) 30 day Replant 170 day Replant 354 day Replant
Turnip, tops 0.174 0.088 0.032 Turnip, bulbs 0.014 0.016 0.005
Lettuce 0.111 0.081 0.023 Wheat, immature 0.203 0.128 0.122
Wheat, hay 0.283 0.558 0.135 Wheat, grain 0.101 0.145 0.019 Wheat, straw 1.655 2.595 0.322
In general, all crops had a similar metabolic profile. Metabolites detected in the crops were the thiacloprid amide (M02), 4-OH-thiacloprid amide (M37), 6-chloronicotinic acid (M03), 6-chloropicolyl alcohol (M36), 6-chloropico-lyl urea (M31), the sulfonic acid (M30), the imine (M29) and the sulfonic acid amide (M34), the latter most likely being an artefact formed from the sulfonic acid in the presence of methanol/water. The quantitative distribution of the metabolites is summarised in Table 14.

Thiacloprid 1007
Table 14. Quantitative distribution of metabolites in rotational crops (values are given in % of the total radioactivity at harvest).
Replant (days)
M36 M37 M02 M31 M03 M30 M34 M29 Unknown Sum of metab. not containing
thiazolidine Extracted
Lettuce 30 39.1 52.7 91.9 170 10.3 23.4 6.1 6.9 6.5 5.4 25.9 17.2 90.5 354 14.5 17.4 8.6 43.0 83.5
Turnip 30 8.8 20.5 31.5 12.6 5.6 8.8 79.0 bulbs 170 5.0 7.4 17.5 9.8 16.1 7.5 4.8 14.8 82.2
354 82.0 Turnip 30 12.1 20.4 42.3 6.1 9.9 12.1 90.8
tops 170 11.5 23.2 18.1 6.9 6.5 4.9 16.1 11.5 91.2 354 45.8 23.3 18.3 87.4
Wheat 30 19.7 31.3 31.4 8.0 90.4 forage 170 11.6 28.2 39.7 14.0 94.8
354 10.7 13.4 41.7 20.1 7.5 93.4 Wheat 30 13.4 25.1 39.3 8.8 86.6
hay 170 18.0 25.6 23.6 11.9 7.9 91.4 354 12.7 15.1 34.4 17.3 7.6 87.1
Wheat 30 8.1 31.2 40.3 79.6 grain 170 14.8 27.4 40.7 88.1
354 49.9 Wheat 30 11.2 13.9 31.2 9.0 17.2 82.5 straw 170 15.6 18.2 32.7 19.1 91.3
354 15.9 10.5 24.5 17.9 14.1 83.0
Since most of the metabolites detected in the plants were either soil metabolites or their derivatives, it was concluded that the residues in the rotational crops resulted from uptake of soil metabolites which remained stable in the plants or to some degree were further metabolised by the plant. This is summarised in the proposed degradation scheme shown in Figure 4.

1008 Thiacloprid
SN
NCl NCN YRC 2894
NCl
COOH
M 03
SN
NCl N
O
NH2
M 02
N
NCl NHO
SO3H
O NH2 M 30
NCl
OH
M 36 (6-CPA)SN
NCl N
O
NH2
OH
M 37
SN
NCl NH M 29
M 31
NH
NCl NH2
O
N
NCl NH2O
SO3H
M 34
Figure 4. Metabolic pathway of thiacloprid in rotational crops
METHODS OF RESIDUE ANALYSIS
Analytical methods
Plant matrices-enforcement method
An analytical method for plant matrices based on HPLC-UV was reported (Report No.: MR-295/96 (Placke, F. J., 1996) and Report No.: 5438/1494225/T423 (Zyl, P. F. C. van, 2000)). Thiacloprid was extracted from 25 g of plant material with acetone/water (3:1; v:v). After vacuum filtration, an aliquot of the raw extract corresponding to a 5 g sample is concentrated and evaporated to the aqueous remainder. The residues are dissolved in water and partitioned against cyclohexane/ethyl acetate using a ChemElut column. Further clean-up is performed by column chromatography on Florisil and elution with acetonitrile. The residues of thiacloprid parent compound are quantified by reversed phase HPLC with UV detection at 242 nm.

Thiacloprid 1009
Modifications for citrus: after elution, a partition clean-up step was included using a mixture of hexane and hexane-saturated acetonitrile. Florisil clean-up was not conducted.
The original method was validated by conducting recovery experiments with apple, cucumber, melon, red pepper, peach and tomato. Further recovery experiments were done using citrus matrices. Results obtained were within guideline requirements (recoveries: 70−110%; relative standard deviation (RSD) below 20%).
Control samples were spiked with thiacloprid at fortification levels of 0.02 and 0.2 mg/kg. Recoveries of thiacloprid ranged from 72 to 105% (overall mean: 95%, RSD: 5.8, n=97). Recoveries of thiacloprid for citrus matrices ranged from 77 to 101% (overall mean: 88%, RSD: 11%, n=6). The recoveries were not corrected for interferences. The results are summarised in Table 15 and Table 16.
Table 15. Recovery results from method 00419 for the determination of thiacloprid in plant matrices.
Matrix Fortification level (mg/kg)
Recovery rate (%) mean range
RSD (%)
Number of tests
Apple (fruit) 0.02* 0.2
101 98-103 95 90-99
1.9 3.6
5 5
Apple (dried) 0.02* 0.2
82 72-88 90 86-93
10.6 4.0
3 3
Apple (juice) 0.02* 98 94-100 3.3 3 Apple (pomace, dry) 0.02*
0.2 91 84-98 86 97-97
7.7 0.0
3 3
Apple (sauce) 0.02* 0.2
98 95-100 94 92-98
2.6 3.4
3 3
Cucumber (fruit) 0.02* 0.2
92 89-94 90 83-96
3.1 7.4
3 3
Melon (peel) 0.02* 0.2
90 84-97 98 92-101
6.2 3.5
5 5
Melon (pulp) 0.02* 0.2
95 92-97 96 91-100
2.7 4.7
3 3
Red pepper (fruit) 0.02* 0.2
98 97-99 95 92-99
1.2 3.7
3 3
Peach (fruit) 0.02* 0.2
98 91-103 99 96-102
6.4 3.1
3 3
Peach (preserve) 0.02* 0.2
99 97-100 95 93-96
1.5 1.6
3 3
Tomato (fruit) 0.02* 0.2
99 100-105 100 97-104
4.9 3.6
3 3
Tomato (paste) 0.02* 0.2
98 97-99 96 95-97
1.0 1.2
3 3
Tomato (juice) 0.02* 93 89-97 4.3 3 Tomato (preserve) 0.02*
0.2 94 90-98 91 90-94
4.3 2.5
3 3
*: Limit of quantitation (LOQ), defined by the lowest validated fortification level
Table 16. Recovery results from report no. 5438/1494225/T423 for the determination of thiacloprid in plant matrices.
Matrix Fortification level (mg/kg) Recovery rate (%) mean range
Number of tests
Citrus (peel) 0.04 -- 101 1 Citrus (flesh) 0.04
0.08 0.16
-- 98 -- 87 -- 82
1 1 1
Citrus (whole fruit) 0.08 0.20
-- 82 -- 77
1 1

1010 Thiacloprid
The chromatographic separation in combination with the preceding clean-up steps allows quantitation of the parent compound without significant matrix interferences. Blank values from control samples were well below 30% of the LOQ.
The limit of quantification (LOQ), defined as the lowest concentration at which an acceptable recovery is obtained, was 0.02 mg/kg of thiacloprid for all crop matrices mentioned above. Matrix interference was minimal as illustrated in the control sample chromatograms (< 10% LOQ).
Amendment E001 to method 00419 (Placke, F. J., 1998) was conducted to validate additional plant matrices for cotton, potato, pear, aubergine (eggplant), zucchini (courgette) and cherry. The principle of the method corresponds to the original method no. 00419 (Placke, F. J., 1996).
The method was validated by conducting recovery experiments with the additional commodities cotton, potato, pear, aubergine, zucchini and cherry. Results obtained were within guideline requirements (recoveries: 70−110%; RSD below 20%). Control samples were spiked with thiacloprid at fortification levels of 0.02 and 0.2 mg/kg. Individual recoveries of thiacloprid ranged from 85 to 103% (mean per crop matrix 90−97%, RSDs 1.5−4.4%, n=3−10). The recoveries were not corrected for interferences. The results obtained are summarised in Table 17.
Table 17. Recovery results for method 00419/E001 for the determination of thiacloprid in plant matrices.
Matrix Fortification level (mg/kg)
Recovery rate (%) Mean range
RSD (%)
Number of tests
Cotton (seed) 0.02* 0.2
93 92-96 96 93-97
1.7 1.5
5 5
Potato (tuber) 0.02* 0.2
91 85-93 93 91-95
3.6 1.6
5 5
Potato (French fries) 0.02* 0.2
94 92-96 96 94-99
1.9 2.2
3 3
Cherry (juice) 0.02* 99 97-103 2.6 3 Pear (fruit) 0.02*
0.2 96 95-98 98 97-99
1.4 0.8
3 3
Aubergine (fruit) 0.02* 0.2
89 86-91 91 87-93
2.2 2.4
5 5
Zucchini (fruit) 0.02* 0.2
95 91-97 99 97-100
3.6 1.3
3 3
Cherry (fruit) 0.02* 0.2
97 94-100 93 91-94
2.6 1.6
3 3
*: LOQ, defined by the lowest validated fortification level
An independent laboratory validation of methods 00419 and 00419/E001 was conducted with the representative matrices apple fruit (high acid content), potato tuber (high water content) and cotton seed (high fat content) (Weber, H., 1998). Minor modifications included using chemicals (acetonitrile, cyclohexane and pure water) from a different manufacturer.
Control samples were spiked with thiacloprid at fortification levels of 0.02 and 0.2 mg/kg. Results obtained were within guideline requirements (recoveries: 70−110%; RSD below 20%, n=5). Individual recoveries of thiacloprid ranged from 79 to 110%. Mean recoveries for each crop ranged from 84 to 101%, with RSDs ranging from 3.2 to 8.8%. Blank values were not used for correcting recoveries. The results obtained are summarised in Table 18.

Thiacloprid 1011
Table 18. Recovery results from the independent laboratory validation of method 00419 for the determination of thiacloprid in plant matrices (Weber, H., 1998)
Matrix Fortification level (mg/kg)
Recovery rate (%) mean range
RSD (%)
Number of tests
Apple (fruit) 0.02* 0.20
92 88-95 92 83-97
3.2 6.1
5 5
Potato (tuber) 0.02* 0.20
84 79-88 88 83-94
4.0 4.9
5 5
Cotton (seed) 0.02* 0.20
92 84-98 94 85-102
6.4 7.3
5 5
*: LOQ, defined by the lowest validated fortification level
The enforcement method 00419 is suitable for the determination of residues of thiacloprid parent compound. The LOQ was 0.02 mg/kg in all analysed crop matrices.
Animal matrices-enforcement methods
Residue analysis of thiacloprid parent compound in animal matrices can be done by HPLC-UV according to Placke, F. J., 1998a (method 00519). The method is suitable as an enforcement method.
Thiacloprid is extracted from animal matrices (tissues, eggs and milk) using a mixture of acetonitrile/water or methanol. For milk samples, partitioning of the extracts against n-hexane is performed to remove fat. The extracts are evaporated to the aqueous remainder. For egg samples, clean-up with a polystyrene column (Chromabond HR-P) is performed. The aqueous remainder is partitioned against cyclohexane/ethyl acetate using a ChemElut column. Further clean-up is performed by column chromatography on Florisil and elution with acetonitrile.
The residues are quantified by reversed phase HPLC with UV-detection at 242 nm. The method was validated by conducting recovery tests with muscle, milk and eggs.
Five control samples were spiked with thiacloprid at fortification levels of 0.02 and 0.2 mg/kg for eggs and muscle, and 0.01 and 0.1 mg/kg for milk, respectively. Recoveries of thiacloprid ranged from 82 to 101% (mean: 93%, relative standard deviation (RSD): 5.0%, n=30). The recoveries were not corrected for interference. Blank values were not used for correcting recoveries. The results obtained are summarised in Table 19.
Table 19. Recovery results for method 00519 for the determination of thiacloprid in animal matrices.
Reference Matrix Fortification level (mg/kg)
Recovery rate (%) mean range
RSD (%)
n
Milk 0.01* 0.1
88 80-91 95 90-100
5.4 4.2
55
Placke, 1998 HPLC/UV, thiacloprid parent Muscle 0.02*
0.2 90 82-95 94 92-101
5.8 4.1
55
Egg 0.02 0.2
92 88-96 94 93-96
3.2 1.2
55
HPLC/UV [confirmatory], thiacloprid parent
Milk 0.01* 0.1
87 78-95 98 91-104
8.6 5.9
55
Muscle 0.02* 0.2
90 80-94 93 77-78
6.2 1.2
55
Egg 0.02* 0.2
93 88-100 94 93-95
5.2 0.8
55
*: LOQ, defined by the lowest validated fortification level
An independent laboratory validation of method 00519 was conducted with the representative animal materials milk, egg and meat (Weber, H., 1998a). Duplicates of control- and fortified samples (five each at 0.02 and 0.2 mg/kg, except for milk with five each at 0.01 and 0.1 mg/kg) were extracted and analysed. Minor modifications included the use of chemicals of a different specification.

1012 Thiacloprid
The method was validated for both, the higher and the lower fortification level. Recoveries at the lower level were in the range of 76 to 89% (mean: 82%; RSD: 6.0%) for egg, 75 to 87% (mean: 80%; RSD: 6.3%) for meat, and 85 to 95% (mean: 90%; RSD: 4.5%) for milk. Recoveries at the higher level were in the range of 76 to 102% (mean: 84%; RSD: 12.0%) for egg, 84 to 90% (mean: 86%; RSD: 2.8%) for meat and 93 to 102% (mean: 98%; RSD: 3.4%) for milk. The overall recoveries were 83% (RSD: 9.2%, n=10) for egg, 83% (RSD: 5.9%, n=10) for meat and 94% (RSD: 5.6%, n=10) for milk. Blank values were not used for correcting recoveries. The results obtained are summarised in Table 20.
Table 20. Recovery results from the independent method validation of method 00519 for the determination of thiacloprid in animal matrices.
Reference Matrix Fortification level (mg/kg)
Recovery rate (%) mean range
RSD (%)
n
Weber, 1998 HPLC/UV - ILV
Milk 0.01* 0.1
90 85-95 98 93-102
4.6 3.5
55
Muscle 0.02* 0.2
80 75-87 86 84-90
6.3 2.8
55
Egg 0.02* 0.2
82 76-89 84 76-102
6.0 12
55
*: LOQ, defined by the lowest validated fortification level
Enforcement method 00519 for the determination of residues of thiacloprid parent compound by HPLC-UV in a number of animal matrices was successfully validated by an independent laboratory. The LOQ is 0.01 mg/kg in milk and 0.02 mg/kg in muscle and egg.
Specialised methods- thiacloprid only
For thiacloprid additional specialised methods were presented. A summary of the validation data is given in Table 21.
Schoening (1998, 2001, 2002, 2005, 2005a), Billian, P. and Schoening (2003) and Sur, R. (2000) developed a HPLC-MS/MS method (method 00548) for the analysis of thiacloprid parent compound in various plant matrices. The plant material was extracted with a mixture of acetonitrile/water (1/1, v/v). The residues of thiacloprid parent compound are determined by reversed-phase HPLC on a C18-column using a triple-stage mass spectrometer (HPLC-MS/MS) with an electrospray interface (ESI: TurboIonSpray) operated in the positive ion mode under multiple-reaction monitoring (MRM) conditions.
Ballesteros, C. and Meilland - Berthier, I. (2004, 2005) modified method 00548. Modifications involve a change in the composition of the extraction solvent, and filtration and evaporation steps were replaced by centrifugation.
The original method 00548 was adapted by Clay, S. (2003) to produce a new method for the analysis of thiacloprid parent compound be HPLC-MS(SIM) in a number of plant matrices. The residues of thiacloprid were determined by reversed-phase HPLC on a C18-column using the positive SIM-mode after atmospheric pressure chemical ionisation (APCI). As quantification ion m/z = 253 and as qualifier ion m/z = 255 was used. Quantification was performed using matrix matched standards because signal suppression was observed in matrix standards versus solvent standards.
HPLC/UV based method was presented by Fukuda, T. (1998) for green tea. A comparable method for rice matrices relies on HPLC/UV also (Anon. 2002).
For walnuts Baravelli, P. L. (2003) used a method where the residues of thiacloprid parent compound are determined by reversed-phase HPLC using a triple-stage mass spectrometer (HPLC-MS/MS) with an electrospray interface (ESI: TurboIonSpray) operated in the positive ion mode under multiple-reaction monitoring (MRM) conditions for detection. For quantification the following parent and daughter ion were used: m/z = 230 and m/z = 126, respectively. The daughter ion is used for quantification. Quantitation was done using external standards.

Thiacloprid 1013
A method for animal matrices was developed by Schoening, R. (1998a). Thiacloprid is extracted from animal tissues using a mixture of acetonitrile/water, and from milk samples with methanol and diluted sulphuric acid. The residues are quantified by reversed phase HPLC with electrospray MS/MS-detection using deuterated thiacloprid as internal standard.
Table 21. Validation data for special analytical methods for the determination of parent thiacloprid residues in food of plant and animal origin.
Reference Sample Fortified level, mg/kg
Average recovery [%]
RSD [%] No. of analyses
Schoening, R., 1998
Apple (fruit) 0.02* 0.2
95 91
4.4 1.7
3 3
Aubergine (fruit) 0.02* 0.2
86 93
3.3 1.6
3 3
Cherry (fruit) 0.02* 0.2
88 82
4.7 3.2
3 3
Cherry (juice) 0.02* 0.2
84 87
2.6 3.8
5 5
Cotton (seed) 0.02* 0.2
79 81
5.7 9.5
5 5
Cucumber (fruit) 0.02* 0.2
88 84
1.3 5.5
3 3
Peach (fruit) 0.02* 0.2
86 89
6.5 3.9
3 3
Pepper (fruit) 0.02* 0.2
88 85
4.6 5.3
3 3
Potato (tuber) 0.02* 0.2
92 97
2.5 3.0
5 5
Potato (green matter)
0.02* 0.2
88 98
2.4 8.5
3 3
Potato (French fries)
0.02* 0.2
95 93
5.4 4.0
5 5
Strawberry (fruit) 0.02* 0.2
87 90
3.0 3.2
5 5
Strawberry (marmalade)
0.02* 0.2
86 90
1.5 2.5
5 5
Tomato (fruit) 0.02* 0.2
99 95
4.2 4.8
3 3
Tomato (juice) 0.02* 0.2
89 90
0.9 3.0
5 5
Tomato (puree) 0.02* 0.2
93 92
1.6 2.6
5 5
Tomato (paste) 0.02* 0.2
91 88
5.6 1.5
3 3
Schoening, R., 2001
Melon (pulp) 0.02* 0.2
98 94
2.6 1.1
3 3
Melon (peel) 0.02* 0.2
90 93
12.5 4.1
3 3
Currant (fruit) 0.02* 0.2
95 94
2.2 5.9
3 3
Plum (fruit) 0.02* 0.2
96 95
5.1 3.0
3 3
Sugar beet (leaves) 0.02* 0.2
90 93
13.3 0.6
3 3
Sugar beet (body) 0.02* 0.2
96 93
2.2 3.3
3 3
Wheat (grain) 0.02* 0.2
100 99
4.4 1.2
3 3
Wheat (rest of plant)
0.02* 0.2
98 93
3.6 4.7
3 3

1014 Thiacloprid
Reference Sample Fortified level, mg/kg
Average recovery [%]
RSD [%] No. of analyses
Wheat (straw) 0.02* 0.2
94 98
6.9 1.2
3 3
Barley (grain) 0.02* 0.2
97 95
1.6 1.1
3 3
Barley (rest of plant)
0.02* 0.2
98 95
2.6 3.7
3 3
Barley (straw) 0.02* 0.2
96 92
1.2 4.5
3 3
Pea with pod 0.02* 0.2
100 98
0.0 4.8
3 3
Pea without pod 0.02* 0.2
97 97
3.3 1.8
3 3
Pea (pod empty) 0.02* 0.2
101 96
2.1 2.2
3 3
Schoening, R., 2002
Rape (rest of plant, green material)
0.02* 0.2
92 91
3.1 0.6
3 3
Rape (pod) 0.02* 0.2
96 94
1.2 2.8
3 3
Rape (seed) 0.02* 0.2
96 92
1.0 0.6
3 3
Rape (straw) 0.02* 0.2
87 84
4.1 2.5
3 3
Raspberry (fruit) 0.02* 0.2
96 93
1.6 0.6
3 3
Schoening, R., 2005
Onion (whole plant)
0.01* 0.1
90 97
5.9 1.0
5 3
Schoening, R., 2005a
Leek (whole plant) 0.01* 0.1
94 93
2.7 2.3
3 4
Zucchini (fruit) 0.02* 0.2
90 88
1.3 2.0
3 3
Sur, R., 2000 Strawberry (fruit) 0.02* 0.2
87 90
3.0 3.2
5 5
Strawberry (marmalade)
0.02* 0.2
86 90
1.5 2.5
5 5
Tomato (juice) 0.02* 0.2
89 90
0.9 3.0
5 5
Tomato (puree) 0.02* 0.2
93 92
1.6 2.6
5 5
Tomato (paste) 0.02* 0.2
91 88
5.6 1.5
5 5
Billian, P. and Schoening, R., 2003
Bean (bean with pod)
0.01* 0.02 0.20
98 97 98
5.8 1.6 2.9
3 3 3
Olive (fruit) 0.01* 0.02 0.20
99 89 89
1.5 0.0 1.3
3 3 3
Olive (pomace wet)
0.01* 0.02 0.20
101 88 87
2.0 0.7 0.7
3 3 3
Olive (oil) 0.01* 0.20
104 98
1.4 3.4
5 5
Broccoli (curd) 0.01* 0.02 0.20
97 97 97
2.2 2.0 2.4
5 5 5
Cauliflower (curd) 0.01* 0.02 0.20
97 97 96
4.3 3.3 0.6
3 3 3
Head Cabbage (head)
0.01* 0.02 0.20
96 90 96
1.2 1.3 0.6
3 3 3
Brussels Sprouts 0.01* 0.02 0.20
100 95 94
0.6 0.6 1.1
3 3 3

Thiacloprid 1015
Reference Sample Fortified level, mg/kg
Average recovery [%]
RSD [%] No. of analyses
Kohlrabi (leaf) 0.01* 0.20
102 94
2.8 0.6
3 3
Kohlrabi (corm) 0.01* 0.20
99 94
1.0 1.1
3 3
Corn (whole plant) 0.01* 0.20
98 98
1.0 2.6
3 3
Corn (kernel) 0.01* 0.20
99 96
1.7 0.5
5 5
Corn (cob without husks)
0.01* 0.20
99 97
3.0 0.0
3 3
Artichoke (head) 0.01* 0.20
100 103
3.0 0.0
3 3
Lettuce (head) 0.01* 0.20
97 96
1.6 2.6
3 3
Hazelnut (nut) 0.01* 0.02 0.20
98 95 96
0.6 0.6 1.2
3 3 3
Ballesteros, C. and Meilland - Berthier, I., 2004
Zucchini (fruit) 0.01* 0.10
91 93
1.5 1.1
5 5
Pepper (fruit) 0.01* 0.10
96 96
3.3 3.8
3 3
Ballesteros, C. and Meilland - Berthier, I., 2005
Sugar beet (body) 0.01* 0.1
99 103
1.5 1.5
3 3
Sugar beet (leaves with root collar)
0.01* 0.1
93 88
1.6 2.4
3 3
Tomato (fruit) 0.01* 0.1
104 97
3.6 1.6
3 3
Field pea 0.01* 0.1
90 90
4.0 1.3
3 3
Corn (kernel) 0.01* 0.1
84 84
4.1 4.8
3 3
Corn (whole plant without roots)
0.05* 0.5
76 75
6.8 0.0
3 3
Artichoke (head) 0.01* 0.1
83 88
1.2 1.3
3 3
Watermelon (fruit) 0.01* 0.1
115 109
2.2 3.2
3 3
Lettuce (head) 0.01* 0.1
98 100
4.3 2.6
3 3
Wheat (grain) 0.01* 0.1
92 88
2.9 1.1
3 3
Wheat (straw) 0.05* 0.5
89 86
6.9 3.7
3 3
Barley (grain) 0.01* 0.1
93 93
4.4 3.8
3 3
Barley (straw) 0.05* 0.5
100 93
2.0 4.4
3 3
Clay, S. 2003 Kiwi whole fruit 0.02* 0.20
87 91
8 8
7 7
Peach fruit 0.02* 0.02* 0.20 0.20
84 81 93 90
9.0 7.9 5.3 3.6
8 5 8 5
Sweetcorn 0.02* 0.20
74 82
5.8 4.6
4 5
Lemon pulp 0.02* 0.20
78 83
6.8 5.7
5 5
Nectarine fruit 0.02* 0.20
103 101
9 7
5 5
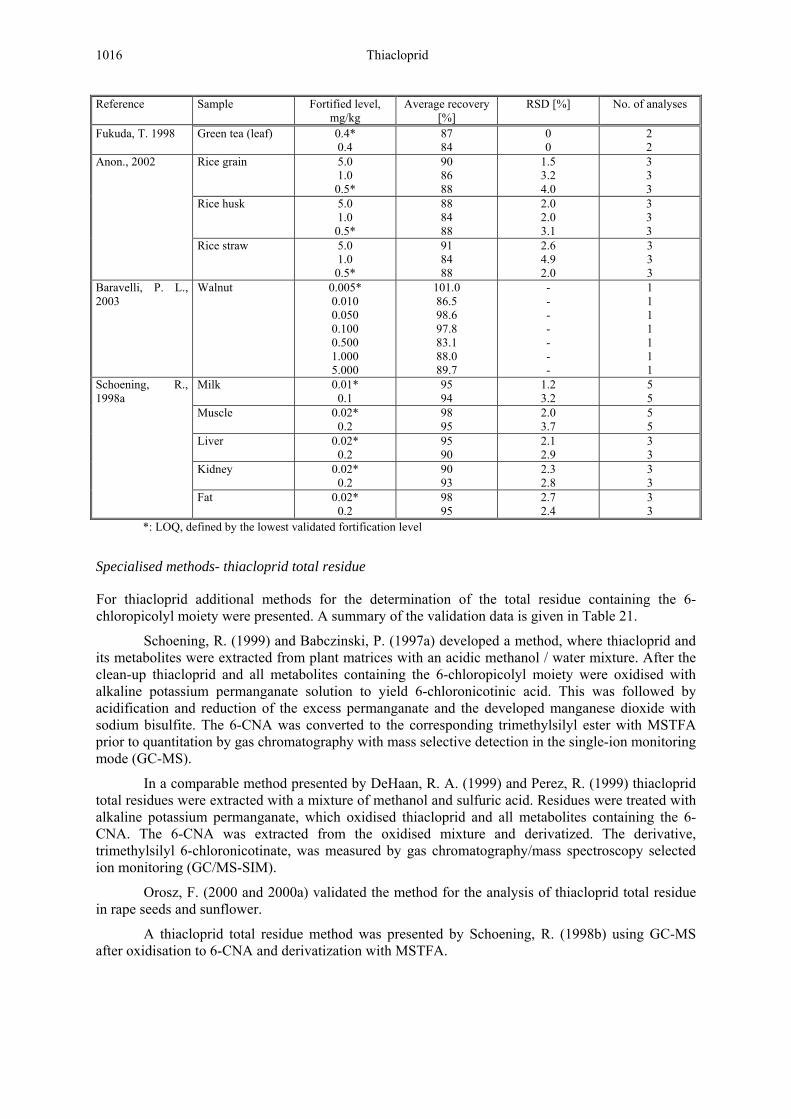
1016 Thiacloprid
Reference Sample Fortified level, mg/kg
Average recovery [%]
RSD [%] No. of analyses
Fukuda, T. 1998 Green tea (leaf) 0.4* 0.4
87 84
0 0
2 2
Anon., 2002 Rice grain 5.0 1.0 0.5*
90 86 88
1.5 3.2 4.0
3 3 3
Rice husk 5.0 1.0 0.5*
88 84 88
2.0 2.0 3.1
3 3 3
Rice straw 5.0 1.0 0.5*
91 84 88
2.6 4.9 2.0
3 3 3
Baravelli, P. L., 2003
Walnut 0.005* 0.010 0.050 0.100 0.500 1.000 5.000
101.0 86.5 98.6 97.8 83.1 88.0 89.7
- - - - - - -
1 1 1 1 1 1 1
Schoening, R., 1998a
Milk 0.01* 0.1
95 94
1.2 3.2
5 5
Muscle 0.02* 0.2
98 95
2.0 3.7
5 5
Liver 0.02* 0.2
95 90
2.1 2.9
3 3
Kidney 0.02* 0.2
90 93
2.3 2.8
3 3
Fat 0.02* 0.2
98 95
2.7 2.4
3 3
*: LOQ, defined by the lowest validated fortification level
Specialised methods- thiacloprid total residue
For thiacloprid additional methods for the determination of the total residue containing the 6-chloropicolyl moiety were presented. A summary of the validation data is given in Table 21.
Schoening, R. (1999) and Babczinski, P. (1997a) developed a method, where thiacloprid and its metabolites were extracted from plant matrices with an acidic methanol / water mixture. After the clean-up thiacloprid and all metabolites containing the 6-chloropicolyl moiety were oxidised with alkaline potassium permanganate solution to yield 6-chloronicotinic acid. This was followed by acidification and reduction of the excess permanganate and the developed manganese dioxide with sodium bisulfite. The 6-CNA was converted to the corresponding trimethylsilyl ester with MSTFA prior to quantitation by gas chromatography with mass selective detection in the single-ion monitoring mode (GC-MS).
In a comparable method presented by DeHaan, R. A. (1999) and Perez, R. (1999) thiacloprid total residues were extracted with a mixture of methanol and sulfuric acid. Residues were treated with alkaline potassium permanganate, which oxidised thiacloprid and all metabolites containing the 6-CNA. The 6-CNA was extracted from the oxidised mixture and derivatized. The derivative, trimethylsilyl 6-chloronicotinate, was measured by gas chromatography/mass spectroscopy selected ion monitoring (GC/MS-SIM).
Orosz, F. (2000 and 2000a) validated the method for the analysis of thiacloprid total residue in rape seeds and sunflower.
A thiacloprid total residue method was presented by Schoening, R. (1998b) using GC-MS after oxidisation to 6-CNA and derivatization with MSTFA.

Thiacloprid 1017
Table 22. Validation data for special analytical methods for the determination of total thiacloprid residues in food of plant and animal origin.
Reference Sample Fortified level, mg/kg
Average recovery [%]
RSD [%] No. of analyses
Schoening, R., 1999 and Babczinski, P., 1997a
Cotton (seed) 0.05* 0.05071
0.5
81 85 100
4.1 3.2 4.4
5 5 5
Potato (tuber) 0.05* 0.05071
0.5
84 86 91
8.1 2.9 0.5
5 5 5
DeHaan, R. A., 1999
Apples (whole fruit)
Thiacloprid: 0.01* 0.05 0.3
4-hydroxy-thiacloprid :
0.01* 0.05 0.3
88 87 90
61 69 61
7.3 9.7 1.7
7.7 8.4 2.3
9 9 3
13 8 3
Apples (juice) Thiacloprid: 0.01* 0.25
4-hydroxy-thiacloprid:
0.01* 0.25
85 84
68 62
5.0 8.4
4.2 3.8
4 3
3 3
Apples (wet pomace)
Thiacloprid: 0.01* 0.6
4-hydroxy-thiacloprid:
0.01* 0.6
81 89
58 61
10.3 4.6
5.7 3.6
3 3
3 3
Pears (whole fruit) Thiacloprid: 0.01* 0.05 0.4
4-hydroxy-thiacloprid:
0.01* 0.05 0.4
100 87 79
56 62 59
10.6 13.3 14.4
10.3 15.8 8.9
5 7 3
10 6 3
Cotton (meal) Thiacloprid: 0.05*
6-CNA: 0.05*
mix of equimolar amounts of
thiacloprid and 6-CNA: 0.05*
80
98
88
- - -
1
1
1 Cotton (hulls) Thiacloprid:
0.05* 0.2
6-CNA: 0.05* 0.2
mix of equimolar amounts of
thiacloprid and 6-CNA: 0.05* 0.2
66 65
100 87
66 78
- - - - - -
1 1
1 1
1 1

1018 Thiacloprid
Reference Sample Fortified level, mg/kg
Average recovery [%]
RSD [%] No. of analyses
Cotton (refined oil)
Thiacloprid: 0.05* 0.5
6-CNA: 0.05* 0.5
mix of equimolar amounts of
thiacloprid and 6-CNA: 0.05* 0.5
94 86
100 95
94 91
- - - - - -
1 1
1 1
1 1
Cotton (undelinted seed)
Thiacloprid: 0.05* 0.1 0.5 1.0
6-CNA: 0.05* 0.5 1.0
mix of equimolar amounts of
thiacloprid and 6-CNA: 0.05* 0.5 1.0
83 78 104 81
98 97 88
82 102 78
15.1 6.5 -
7.1 - - - - - -
4 5 1 2
1 1 1
1 1 1
Cotton (gin trash) Thiacloprid: 0.05* 0.5 5.0 11 15
6-CNA: 0.05*
11 mix of equimolar
amounts of thiacloprid and 6-
CNA: 0.05*
11
94 80 110 73 97
106 61
86 71
16.9
- - - - - - - -
2 1 1 1 1
1 1
1 1
Perez, R., 1999 Cotton (seed) Thiacloprid: 0.05* 1.0
6-CNA: 0.05* 1.0
83 77
89 124
9.9 5.7
5.7 0.0
2 2 2 2
Orosz, F. 2000 Rape (seed) 0.02* 0.1 0.5
89 88 86
20.8 17.3 6.3
7 4 4
Orosz, F. 2000a Sunflower (seed) 0.02* 0.1 0.5
92 93 83
15.3 8.8 6.2
7 4 4
Schoening, R., 1998b
Milk Total residue: 0.01* 0.1
6-CP-urea sulfoxide:
0.01*
92 85
86
2.0 3.1
3.5
5 5
3 Muscle 0.02*
0.2 82 88
6.6 2.5
5 5
Liver 0.02* 87 1.3 3

Thiacloprid 1019
Reference Sample Fortified level, mg/kg
Average recovery [%]
RSD [%] No. of analyses
0.2 94 1.0 3 Kidney Total residue:
0.02* 0.2
6-CP-urea sulfoxide:
0.02*
85 84
64
4.2 1.3
3.5
3 3
3 Fat 0.02*
0.2 102 91
3.7 3.5
3 3
*: LOQ, defined by the lowest validated fortification level 1: Fortification with a mixture of amide-thiacloprid and 6-CNA at 0.02 mg/kg, each, corresponding to 0.0507 mg/kg thiacloprid
Specialised methods- thiacloprid parent and metabolites
An LC-MS/MS method for measuring thiacloprid, thiacloprid-amide, 4-hydroxy-thiacloprid-amide and thiacloprid-sodium sulfonate was developed by Moore, S. M., 2002 and Harbin, A. M., 2004. The analytes were extracted using methanol/water (3:1) followed by 18C solid phase extraction. The quantitation was based on comparison of daughter ion transitions between the analytes and their deuterated analogs, which were used as the internal standards.
Table 23. Validation data for special analytical methods for the determination of thiacloprid residues and its metabolites in food of plant and animal origin.
Reference Sample Fortified level, mg/kg
Average recovery [%]
RSD [%] No. of analyses
Moore, S. M., 2002
Soybean seed Thiacloprid: 0.01* 0.1
thiacloprid-amide:0.01* 0.1
4-hydroxy-thiacloprid-amide:
0.01* 0.1
thiacloprid-sodium-sulfonate:
0.01* 0.1
98 95
96 80
102 91
108 94
4.8
0.58
4.1 2.9
2.5 2.1
2.2 1.5
10 3
10 3
10 3
10 3
Soybean forage Thiacloprid: 0.01* 0.1
thiacloprid-amide:0.01* 0.1
4-hydroxy-thiacloprid-amide:
0.01* 0.1
thiacloprid-sodium-sulfonate:
0.01* 0.1
97 102
100 100
101 95
111 92
5.0 1.5
3.2 1.0
3.0 2.0
2.9 0.58
8 3
8 3
8 3
8 3

1020 Thiacloprid
Reference Sample Fortified level, mg/kg
Average recovery [%]
RSD [%] No. of analyses
Soybean hay Thiacloprid: 0.01* 0.1
thiacloprid-amide:0.01* 0.1
4-hydroxy-thiacloprid-amide:
0.01* 0.1
thiacloprid-sodium-sulfonate:
0.01* 0.1
94 91
103 98
100 100
105 91
3.1 4.7
6.2 3.6
1.8 1.2
2.7 1.5
8 3
8 3
8 3
8 3
Wheat grain Thiacloprid: 0.01* 0.1
thiacloprid-amide:0.01* 0.1
4-hydroxy-thiacloprid-amide:
0.01* 0.1
thiacloprid-sodium-sulfonate:
0.01* 0.1
93 96
94 93
92 93
99 93
2.8 2.3
3.5 2.1
4.4 2.1
5.9 1.2
9 3
9 3
9 3
9 3
Wheat forage Thiacloprid: 0.01* 0.1
thiacloprid-amide:0.01* 0.1
4-hydroxy-thiacloprid-amide:
0.01* 0.1
thiacloprid-sodium-sulfonate:
0.01* 0.1
94 85
94 85
94 85
107 92
2.2 2.1
2.9 1.7
3.8 1.5
4.4 3.5
9 3
9 3
9 3
9 3
Wheat hay Thiacloprid: 0.01* 0.1
thiacloprid-amide:0.01* 0.1
4-hydroxy-thiacloprid-amide:
0.01* 0.1
thiacloprid-sodium-sulfonate:
0.01* 0.1
94 91
93 91
95 87
102 91
4.3 1.0
4.5 2.1
4.3 0.58
6.5 1.0
9 3
9 3
9 3
9 3

Thiacloprid 1021
Reference Sample Fortified level, mg/kg
Average recovery [%]
RSD [%] No. of analyses
Harbin, A. M., 2004
Pecan nutmeat Thiacloprid: 0.01*
thiacloprid-amide: 0.01*
4-hydroxy-thiacloprid-amide:
0.01*
97
97
98
3.2
4.3
3.2
7
7
7 Almond nutmeat Thiacloprid:
0.01* thiacloprid-amide:
0.01* 4-hydroxy-
thiacloprid-amide:0.01*
96
96
97
1.9
6.3
2.3
6
6
6 Almond hulls Thiacloprid:
0.01* thiacloprid-amide:
0.01* 4-hydroxy-
thiacloprid-amide:0.01*
79
86
89
7.2
3.0
5.8
9
9
9
Stability of residues in stored analytical samples
Storage stability was examined in three different water-containing crop commodities (apple fruit, tomato fruit, melon peel), and in cotton seed and potato tuber, representing oil-containing and starch-containing matrices, up to a period of 18 months. In a follow-up study, freezer storage stability was demonstrated for the extended period of 24 months in the additional crops tobacco, wheat, rape, pea, currant and potato. A summary of the results is presented in Table 24.
In the study by Placke, F.J. (1997), samples of apple, tomatoes and melons were fortified with 0.2 mg/kg thiacloprid each. Immediately after fortification, a sample from each matrix was taken to determine the initial residues (fortification level). The remaining fortified samples were deep frozen (approx. -20°C) and analysed after nominal storage intervals of 1, 3, 6, 12 and 18 months.
Schoening, R. (2000 & 2005a) examined the storage stability of thiacloprid using samples of potato tubers, cotton seed, wheat straw, rape seed, peas with pods, currants and tobacco leaves. Tobacco leaf was fortified with a level of 2 mg/kg, all other samples with 0.2 mg/kg. The remaining fortified samples were deep frozen (approximately -20°C) and analysed after nominal storage intervals of 1, 3, 6, 12, 18 and 24 months.
Table 24. Stability of residues in stored analytical samples.
Reference Commodity and fortification level
Storage Interval (days) Procedural recovery (%)
Thiacloprid in stored sample, uncorrected
(%) Placke, F.J. 1997 Tomato, fruit 0 - 90.5 0.2 mg/kg 33 76.5 78.7 90 96.9 95.6 180 92.3 95.2 365 95.8 96.2 540 96.2 97.6 Apple, fruit 0 - 89.7 0.2 mg/kg 32 95.0 99.5 89 98.9 98.9 180 92.1 87.7 364 94.2 95.0 539 96.1 97.2

1022 Thiacloprid
Reference Commodity and fortification level
Storage Interval (days) Procedural recovery (%)
Thiacloprid in stored sample, uncorrected
(%) Melon, peel 0 - 83.8 0.2 mg/kg 29 87.1 88.4 90 94.4 97.7 182 89.3 91.2 365 92.3 91.8 540 95.4 94.6 Schoening, R. 2000 Potato, tuber 0 - 98.6 0.2 mg/kg 75 99.9 101.2 152 93.3 94.5 300 94.5 95.7 540 100.3 98.9 Cotton, seed 0 - 93.9 0.2 mg/kg 75 103.2 94.5 152 99.3 97.0 300 95.0 100.0 540 99.1 93.4 Schoening, R. 2005a Potato, tuber 0 - 105 0.2 mg/kg 30 110 108 90 100 101 180 99 98 360 95 96 540 102 98 730 96 92 Wheat, straw 0 - 104 0.2 mg/kg 30 106 100 90 97 97 180 100 96 360 102 96 540 91 91 730 93 91 Tobacco, leafs dry 0 - 104 2 mg/kg 30 103 102 90 92 97 180 102 102 360 105 106 540 93 92 730 95 96 Peas with pod 0 - 107 0.2 mg/kg 30 108 106 90 104 101 180 105 101 360 102 99 540 100 92 730 93 102 Rape seed 0 - 105 0.2 mg/kg 30 107 106 90 101 96 180 100 95 360 101 103 540 95 91 730 95 97 Currant, fruits 0 - 106 0.2 mg/kg 30 108 108 90 102 99 180 101 94 360 102 93 540 95 85 730 98 90
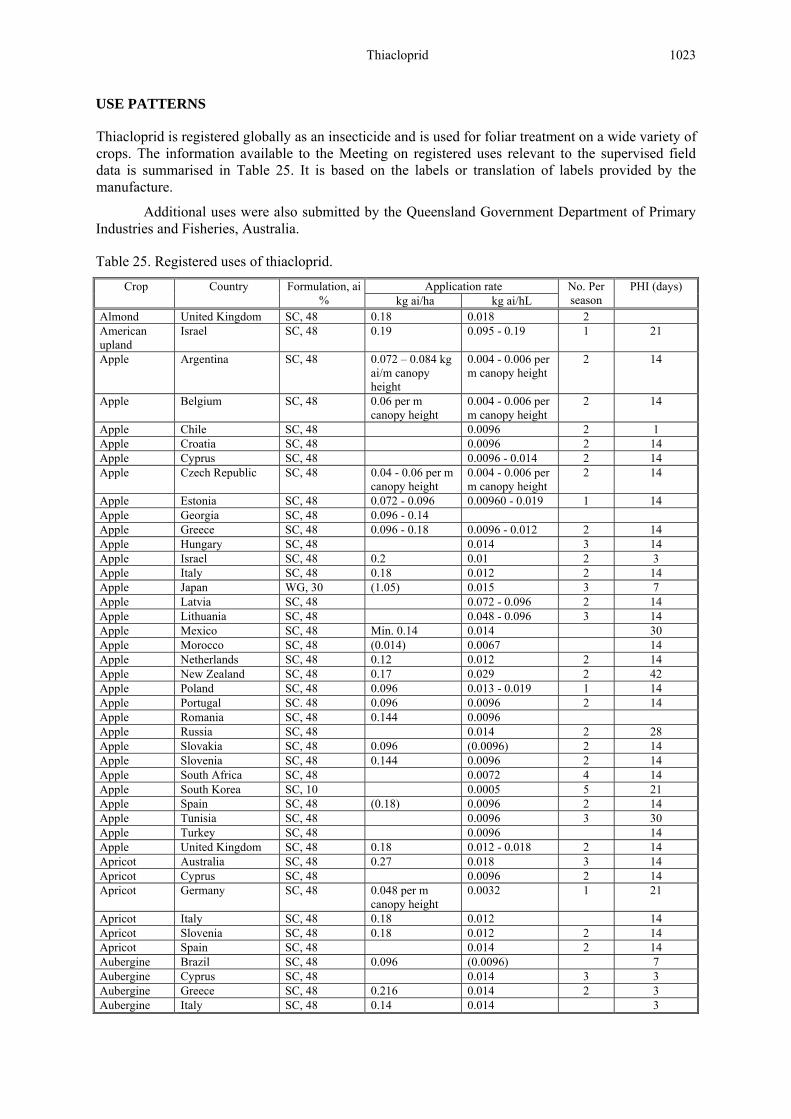
Thiacloprid 1023
USE PATTERNS
Thiacloprid is registered globally as an insecticide and is used for foliar treatment on a wide variety of crops. The information available to the Meeting on registered uses relevant to the supervised field data is summarised in Table 25. It is based on the labels or translation of labels provided by the manufacture.
Additional uses were also submitted by the Queensland Government Department of Primary Industries and Fisheries, Australia.
Table 25. Registered uses of thiacloprid.
Application rate Crop Country Formulation, ai % kg ai/ha kg ai/hL
No. Per season
PHI (days)
Almond United Kingdom SC, 48 0.18 0.018 2 American upland
Israel SC, 48 0.19 0.095 - 0.19 1 21
Apple Argentina SC, 48 0.072 – 0.084 kg ai/m canopy height
0.004 - 0.006 per m canopy height
2 14
Apple Belgium SC, 48 0.06 per m canopy height
0.004 - 0.006 per m canopy height
2 14
Apple Chile SC, 48 0.0096 2 1 Apple Croatia SC, 48 0.0096 2 14 Apple Cyprus SC, 48 0.0096 - 0.014 2 14 Apple Czech Republic SC, 48 0.04 - 0.06 per m
canopy height 0.004 - 0.006 per m canopy height
2 14
Apple Estonia SC, 48 0.072 - 0.096 0.00960 - 0.019 1 14 Apple Georgia SC, 48 0.096 - 0.14 Apple Greece SC, 48 0.096 - 0.18 0.0096 - 0.012 2 14 Apple Hungary SC, 48 0.014 3 14 Apple Israel SC, 48 0.2 0.01 2 3 Apple Italy SC, 48 0.18 0.012 2 14 Apple Japan WG, 30 (1.05) 0.015 3 7 Apple Latvia SC, 48 0.072 - 0.096 2 14 Apple Lithuania SC, 48 0.048 - 0.096 3 14 Apple Mexico SC, 48 Min. 0.14 0.014 30 Apple Morocco SC, 48 (0.014) 0.0067 14 Apple Netherlands SC, 48 0.12 0.012 2 14 Apple New Zealand SC, 48 0.17 0.029 2 42 Apple Poland SC, 48 0.096 0.013 - 0.019 1 14 Apple Portugal SC. 48 0.096 0.0096 2 14 Apple Romania SC, 48 0.144 0.0096 Apple Russia SC, 48 0.014 2 28 Apple Slovakia SC, 48 0.096 (0.0096) 2 14 Apple Slovenia SC, 48 0.144 0.0096 2 14 Apple South Africa SC, 48 0.0072 4 14 Apple South Korea SC, 10 0.0005 5 21 Apple Spain SC, 48 (0.18) 0.0096 2 14 Apple Tunisia SC, 48 0.0096 3 30 Apple Turkey SC, 48 0.0096 14 Apple United Kingdom SC, 48 0.18 0.012 - 0.018 2 14 Apricot Australia SC, 48 0.27 0.018 3 14 Apricot Cyprus SC, 48 0.0096 2 14 Apricot Germany SC, 48 0.048 per m
canopy height 0.0032 1 21
Apricot Italy SC, 48 0.18 0.012 14 Apricot Slovenia SC, 48 0.18 0.012 2 14 Apricot Spain SC, 48 0.014 2 14 Aubergine Brazil SC, 48 0.096 (0.0096) 7 Aubergine Cyprus SC, 48 0.014 3 3 Aubergine Greece SC, 48 0.216 0.014 2 3 Aubergine Italy SC, 48 0.14 0.014 3

1024 Thiacloprid
Application rate Crop Country Formulation, ai % kg ai/ha kg ai/hL
No. Per season
PHI (days)
Aubergine Japan WG, 30 0.23 0.0075 3 1 Aubergine Kenya SC, 48 0.19 (0.019) 4 3 Aubergine Netherlands
(greenhouse use) SC, 48 0.012 4 1
Aubergine Netherlands (greenhouse use, drip irrigation)
SC, 48 0.12 1 3
Aubergine Slovenia SC, 48 0.21 0.014 2 3 Aubergine South Korea SC, 10 0.00025 3 3 Aubergine Spain SC, 48 0.014 3 3 Aubergine United Kingdom SC, 48 0.22 max. 0.022 3 3 Barley Romania SC, 48 0.048 0.012 - 0.016 1 Bell Pepper Tunisia SC, 48 0.014 2 3 Berries Switzerland SC, 48 0.096 0.0096 2 21 Bilberry Netherlands SC, 48 0.14 0.012 2 3 Bilberry United Kingdom SC, 48 0.12 0.024 3 3 Black currants Latvia SC, 48 0.072 (0.019) 2 14 Blackberry Germany SC, 48 0.096 0.0096 2 14 Blackberry Netherlands SC, 48 0.14 0.012 2 3 Blackberry Poland SC, 48 0.072 0.0096 2 5 Blackberry United Kingdom SC, 48 0.12 0.024 3 3 Blueberry Germany SC, 48 0.096 0.0096 2 14 Blueberry Netherlands SC, 48 0.14 0.012 2 3 Blueberry United Kingdom SC, 48 0.12 0.024 3 3 Cherry Australia SC, 48 0.27 0.018 3 14 Cherry Croatia SC, 48 0.096 0.0048 2 14 Cherry Cyprus SC, 48 0.0096 2 14 Cherry Czech Republic SC, 48 0.096 0.0096 2 14 Cherry Germany SC, 48 0.048 per m
canopy height 0.0032 2 14
Cherry Hungary SC, 48 0.0067 3 14 Cherry Japan WG, 30 (1.05) 0.015 2 1 Cherry Netherlands SC, 48 0.12 0.012 2 14 Cherry Poland SC, 48 0.096 0.013 - 0.019 1 14 Cherry Poland SC, 49 0.048 0.007 - 0.01 1 14 Cherry Romania SC, 48 0.096 0.0096 2 14 Cherry Slovakia SC, 48 0.096 14 Cherry Slovenia SC, 48 0.18 0.012 2 14 Cherry Turkey SC, 48 0.0096 14 Cherry United Kingdom SC, 48 0.15 0.015 2 14 Chestnut United Kingdom SC, 48 0.18 0.018 2 Chili Belize SC, 10 0.1 (0.02) 21 Chili Costa Rica SC, 10 0.1 (0.02) 21 Chili Dom. Republic SC, 10 0.1 (0.02) 21 Chili El Salvador SC, 10 0.1 (0.02) 21 Chili Guatemala SC, 10 0.1 (0.02) 21 Chili Honduras SC, 10 0.1 (0.02) 21 Chili Kenya SC, 48 0.19 (0.019) 4 3 Chili Netherlands
(greenhouse use) SC, 48 0.012 4 1
Chili Netherlands (greenhouse use, drip irrigation)
SC, 48 0.12 1 3
Chili Nicaragua SC, 10 0.1 (0.02) 21 Chili Panama SC, 10 0.1 (0.02) 21 Citrus Brazil SC, 48 0.0048 21 Citrus Georgia SC, 48 0.19 – 0.24 Citrus South Africa SC. 48 0.0067 Citrus South Korea SC, 10 0.0024 3 14 Cotton Argentina SC, 48 0.096 1 Cotton Belize SC, 10 0.1 (0.02) 21 Cotton Brazil SC, 48 0.096 0.096 1 28
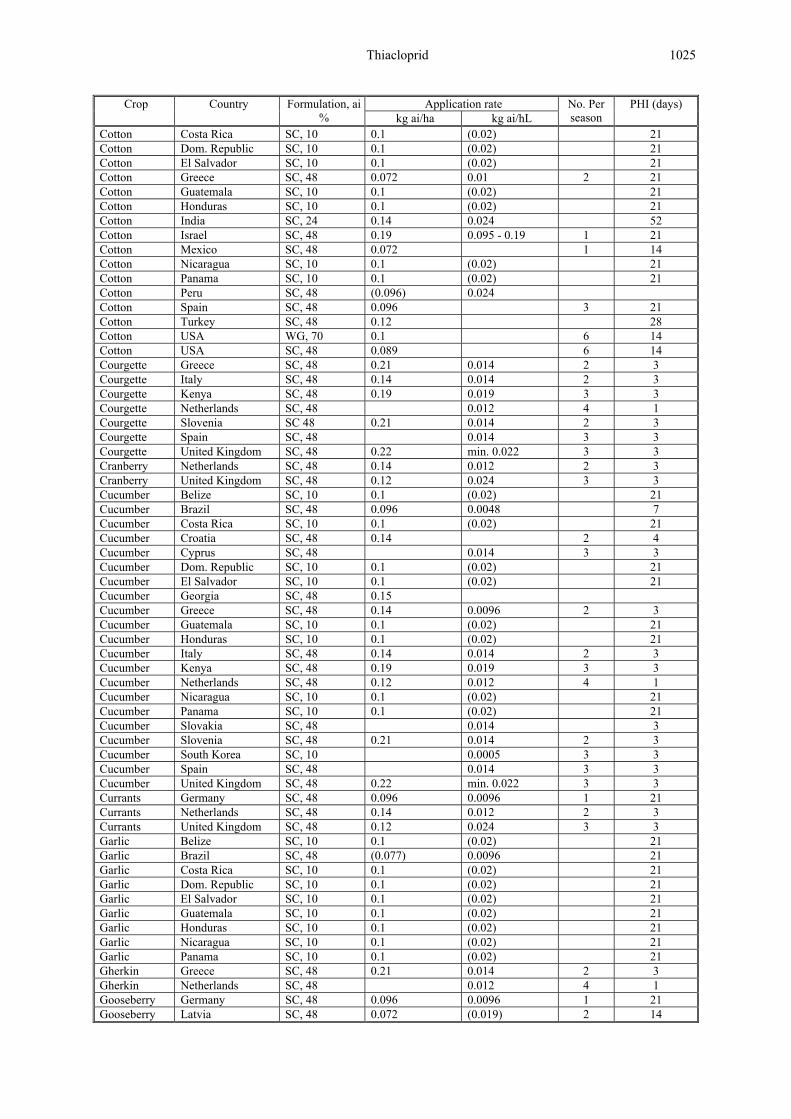
Thiacloprid 1025
Application rate Crop Country Formulation, ai % kg ai/ha kg ai/hL
No. Per season
PHI (days)
Cotton Costa Rica SC, 10 0.1 (0.02) 21 Cotton Dom. Republic SC, 10 0.1 (0.02) 21 Cotton El Salvador SC, 10 0.1 (0.02) 21 Cotton Greece SC, 48 0.072 0.01 2 21 Cotton Guatemala SC, 10 0.1 (0.02) 21 Cotton Honduras SC, 10 0.1 (0.02) 21 Cotton India SC, 24 0.14 0.024 52 Cotton Israel SC, 48 0.19 0.095 - 0.19 1 21 Cotton Mexico SC, 48 0.072 1 14 Cotton Nicaragua SC, 10 0.1 (0.02) 21 Cotton Panama SC, 10 0.1 (0.02) 21 Cotton Peru SC, 48 (0.096) 0.024 Cotton Spain SC, 48 0.096 3 21 Cotton Turkey SC, 48 0.12 28 Cotton USA WG, 70 0.1 6 14 Cotton USA SC, 48 0.089 6 14 Courgette Greece SC, 48 0.21 0.014 2 3 Courgette Italy SC, 48 0.14 0.014 2 3 Courgette Kenya SC, 48 0.19 0.019 3 3 Courgette Netherlands SC, 48 0.012 4 1 Courgette Slovenia SC 48 0.21 0.014 2 3 Courgette Spain SC, 48 0.014 3 3 Courgette United Kingdom SC, 48 0.22 min. 0.022 3 3 Cranberry Netherlands SC, 48 0.14 0.012 2 3 Cranberry United Kingdom SC, 48 0.12 0.024 3 3 Cucumber Belize SC, 10 0.1 (0.02) 21 Cucumber Brazil SC, 48 0.096 0.0048 7 Cucumber Costa Rica SC, 10 0.1 (0.02) 21 Cucumber Croatia SC, 48 0.14 2 4 Cucumber Cyprus SC, 48 0.014 3 3 Cucumber Dom. Republic SC, 10 0.1 (0.02) 21 Cucumber El Salvador SC, 10 0.1 (0.02) 21 Cucumber Georgia SC, 48 0.15 Cucumber Greece SC, 48 0.14 0.0096 2 3 Cucumber Guatemala SC, 10 0.1 (0.02) 21 Cucumber Honduras SC, 10 0.1 (0.02) 21 Cucumber Italy SC, 48 0.14 0.014 2 3 Cucumber Kenya SC, 48 0.19 0.019 3 3 Cucumber Netherlands SC, 48 0.12 0.012 4 1 Cucumber Nicaragua SC, 10 0.1 (0.02) 21 Cucumber Panama SC, 10 0.1 (0.02) 21 Cucumber Slovakia SC, 48 0.014 3 Cucumber Slovenia SC, 48 0.21 0.014 2 3 Cucumber South Korea SC, 10 0.0005 3 3 Cucumber Spain SC, 48 0.014 3 3 Cucumber United Kingdom SC, 48 0.22 min. 0.022 3 3 Currants Germany SC, 48 0.096 0.0096 1 21 Currants Netherlands SC, 48 0.14 0.012 2 3 Currants United Kingdom SC, 48 0.12 0.024 3 3 Garlic Belize SC, 10 0.1 (0.02) 21 Garlic Brazil SC, 48 (0.077) 0.0096 21 Garlic Costa Rica SC, 10 0.1 (0.02) 21 Garlic Dom. Republic SC, 10 0.1 (0.02) 21 Garlic El Salvador SC, 10 0.1 (0.02) 21 Garlic Guatemala SC, 10 0.1 (0.02) 21 Garlic Honduras SC, 10 0.1 (0.02) 21 Garlic Nicaragua SC, 10 0.1 (0.02) 21 Garlic Panama SC, 10 0.1 (0.02) 21 Gherkin Greece SC, 48 0.21 0.014 2 3 Gherkin Netherlands SC, 48 0.012 4 1 Gooseberry Germany SC, 48 0.096 0.0096 1 21 Gooseberry Latvia SC, 48 0.072 (0.019) 2 14
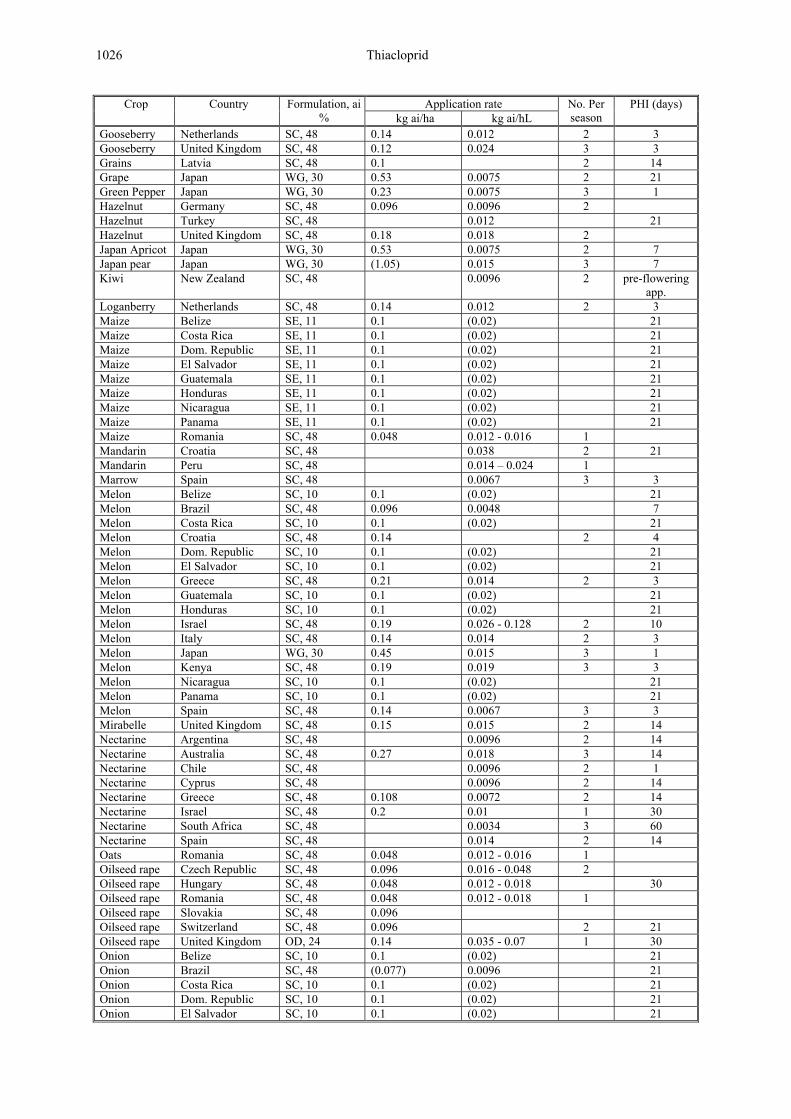
1026 Thiacloprid
Application rate Crop Country Formulation, ai % kg ai/ha kg ai/hL
No. Per season
PHI (days)
Gooseberry Netherlands SC, 48 0.14 0.012 2 3 Gooseberry United Kingdom SC, 48 0.12 0.024 3 3 Grains Latvia SC, 48 0.1 2 14 Grape Japan WG, 30 0.53 0.0075 2 21 Green Pepper Japan WG, 30 0.23 0.0075 3 1 Hazelnut Germany SC, 48 0.096 0.0096 2 Hazelnut Turkey SC, 48 0.012 21 Hazelnut United Kingdom SC, 48 0.18 0.018 2 Japan Apricot Japan WG, 30 0.53 0.0075 2 7 Japan pear Japan WG, 30 (1.05) 0.015 3 7 Kiwi New Zealand SC, 48 0.0096 2 pre-flowering
app. Loganberry Netherlands SC, 48 0.14 0.012 2 3 Maize Belize SE, 11 0.1 (0.02) 21 Maize Costa Rica SE, 11 0.1 (0.02) 21 Maize Dom. Republic SE, 11 0.1 (0.02) 21 Maize El Salvador SE, 11 0.1 (0.02) 21 Maize Guatemala SE, 11 0.1 (0.02) 21 Maize Honduras SE, 11 0.1 (0.02) 21 Maize Nicaragua SE, 11 0.1 (0.02) 21 Maize Panama SE, 11 0.1 (0.02) 21 Maize Romania SC, 48 0.048 0.012 - 0.016 1 Mandarin Croatia SC, 48 0.038 2 21 Mandarin Peru SC, 48 0.014 – 0.024 1 Marrow Spain SC, 48 0.0067 3 3 Melon Belize SC, 10 0.1 (0.02) 21 Melon Brazil SC, 48 0.096 0.0048 7 Melon Costa Rica SC, 10 0.1 (0.02) 21 Melon Croatia SC, 48 0.14 2 4 Melon Dom. Republic SC, 10 0.1 (0.02) 21 Melon El Salvador SC, 10 0.1 (0.02) 21 Melon Greece SC, 48 0.21 0.014 2 3 Melon Guatemala SC, 10 0.1 (0.02) 21 Melon Honduras SC, 10 0.1 (0.02) 21 Melon Israel SC, 48 0.19 0.026 - 0.128 2 10 Melon Italy SC, 48 0.14 0.014 2 3 Melon Japan WG, 30 0.45 0.015 3 1 Melon Kenya SC, 48 0.19 0.019 3 3 Melon Nicaragua SC, 10 0.1 (0.02) 21 Melon Panama SC, 10 0.1 (0.02) 21 Melon Spain SC, 48 0.14 0.0067 3 3 Mirabelle United Kingdom SC, 48 0.15 0.015 2 14 Nectarine Argentina SC, 48 0.0096 2 14 Nectarine Australia SC, 48 0.27 0.018 3 14 Nectarine Chile SC, 48 0.0096 2 1 Nectarine Cyprus SC, 48 0.0096 2 14 Nectarine Greece SC, 48 0.108 0.0072 2 14 Nectarine Israel SC, 48 0.2 0.01 1 30 Nectarine South Africa SC, 48 0.0034 3 60 Nectarine Spain SC, 48 0.014 2 14 Oats Romania SC, 48 0.048 0.012 - 0.016 1 Oilseed rape Czech Republic SC, 48 0.096 0.016 - 0.048 2 Oilseed rape Hungary SC, 48 0.048 0.012 - 0.018 30 Oilseed rape Romania SC, 48 0.048 0.012 - 0.018 1 Oilseed rape Slovakia SC, 48 0.096 Oilseed rape Switzerland SC, 48 0.096 2 21 Oilseed rape United Kingdom OD, 24 0.14 0.035 - 0.07 1 30 Onion Belize SC, 10 0.1 (0.02) 21 Onion Brazil SC, 48 (0.077) 0.0096 21 Onion Costa Rica SC, 10 0.1 (0.02) 21 Onion Dom. Republic SC, 10 0.1 (0.02) 21 Onion El Salvador SC, 10 0.1 (0.02) 21

Thiacloprid 1027
Application rate Crop Country Formulation, ai % kg ai/ha kg ai/hL
No. Per season
PHI (days)
Onion Guatemala SC, 10 0.1 (0.02) 21 Onion Honduras SC, 10 0.1 (0.02) 21 Onion Nicaragua SC, 10 0.1 (0.02) 21 Onion Panama SC, 10 0.1 (0.02) 21 Orange Croatia SC, 48 0.038 2 21 Paddy rice India SC, 24 0.12 0.024 30 Peach Argentina SC, 48 0.0096 2 14 Peach Australia SC, 48 0.27 0.018 3 21 Peach Chile SC, 48 0.0096 2 1 Peach Croatia SC, 48 0.096 0.0048 2 21 Peach Cyprus SC, 48 0.0096 2 14 Peach Germany SC, 48 0.048 per m
canopy height 0.0032 1 21
Peach Greece SC, 48 0.108 0.0072 2 14 Peach Israel SC, 48 0.2 0.01 1 30 Peach Italy SC, 48 0.18 0.012 14 Peach Japan WG, 30 (1.05) 0.015 3 7 Peach Slovenia SC, 48 0.18 0.012 2 14 Peach South Africa SC, 48 0.0034 3 60 Peach South Korea SC, 10 0.0005 3 14 Peach Spain SC, 48 0.014 2 14 Peach Turkey SC, 48 0.0096 14 Pear Argentina SC, 48 0.072 – 0.084 kg
ai/m canopy height
0.004 - 0.006 per m canopy height
2 14
Pear Belgium SC, 48 0.06 per m canopy height
0.004 - 0.006 per m canopy height
2 14
Pear Chile SC, 48 0.0096 2 1 Pear Estonia SC, 48 0.072 - 0.096 0.00960 - 0.019 1 14 Pear Greece SC, 48 0.096 - 0.18 0.0096 - 0.012 2 14 Pear Italy SC, 48 0.18 0.012 2 14 Pear Japan WG, 30 1.05 0.015 3 7 Pear Latvia SC, 48 0.072 - 0.096 2 14 Pear Netherlands SC, 48 0.12 0.12 2 14 Pear Portugal SC. 48 0.096 0.0096 2 14 Pear South Africa SC, 48 0.0072 4 14 Pear South Korea SC, 10 0.0005 5 21 Pear Spain SC, 48 (0.18) 0.0096 2 14 Pepper Belize SC, 10 0.1 (0.02) 21 Pepper Brazil SC, 48 0.096 0.0096 7 Pepper Costa Rica SC, 10 0.1 (0.02) 21 Pepper Croatia SC, 48 0.14 0.014 2 7 Pepper Cyprus SC, 48 0.014 3 3 Pepper Dom. Republic SC, 10 0.1 (0.02) 21 Pepper El Salvador SC, 10 0.1 (0.02) 21 Pepper Greece SC, 48 0.216 0.014 2 3 Pepper Guatemala SC, 10 0.1 (0.02) 21 Pepper Honduras SC, 10 0.1 (0.02) 21 Pepper Italy SC, 48 0.14 0.014 3 Pepper Kenya SC, 48 0.19 0.019 3 3 Pepper Netherlands
(greenhouse use) SC, 48 0.12 0.012 4 1
Pepper Netherlands (greenhouse use, drip irrigation)
SC, 48 0.0096 kg ai per 1000 plants
1 3
Pepper Nicaragua SC, 10 0.1 (0.02) 21 Pepper Panama SC, 10 0.1 (0.02) 21 Pepper Slovakia Sc, 48 0.014 3 Pepper Slovenia SC, 48 0.21 0.014 2 3 Pepper Spain SC, 48 0.014 3 3 Pepper United Kingdom SC, 48 0.22 max. 0.022 3 3 Pistachio Turkey SC, 48 0.012 21

1028 Thiacloprid
Application rate Crop Country Formulation, ai % kg ai/ha kg ai/hL
No. Per season
PHI (days)
Plum Argentina SC, 48 0.0096 2 14 Plum Australia SC, 48 0.27 0.018 3 14 Plum Chile SC, 48 0.0096 2 1 Plum Croatia SC, 48 0.096 0.0048 2 14 Plum Czech Republic SC, 48 0.12 0.012 2 14 Plum Germany SC, 48 0.048 per m
canopy height 0.0032 2 14
Plum Japan WG, 30 0.53 0.0075 3 7 Plum Netherlands SC, 48 0.12 0.012 2 14 Plum Poland SC, 48 0.096 0.013 - 0.019 1 14 Plum Romania SC, 48 0.096 0.0096 2 14 Plum Slovakia SC, 48 0.096 14 Plum United Kingdom SC, 48 0.144 0.014 3 14 Pome fruit Australia SC, 48 0.27 0.018 3 14 Pome fruit Austria SC, 48 0.01 – 0.012 1-2 14 Pome fruit Germany SC, 48 0.048 per m
canopy height 2 14
Pome fruit Switzerland SC, 48 (0.19) 0.0192 2 21 Pome fruit USA SC, 40 0.28 0.01 6 30 Potato Argentina SC, 48 0.072 min. 1 7 Potato Austria SC, 48 0.096 0.019 - 0.048 2 21 Potato Belize SC, 10 0.1 (0.02) 21 Potato Brazil SC, 48 0.048 21 Potato Costa Rica SC, 10 0.1 (0.02) 21 Potato Croatia SC, 48 0.048 2 14 Potato Cyprus SC, 48 0.0096 1 21 Potato Czech Republic SC, 48 0.048 0.0096 - 0.016 2 21 Potato Dom. Republic SC, 10 0.1 (0.02) 21 Potato El Salvador SC, 10 0.1 (0.02) 21 Potato Estonia SC, 48 0.048 0.096 - 0.024 1 21 Potato Georgia SC, 48 0.04 Potato Greece SC, 48 0.072 0.005 - 0.014 2 21 Potato Guatemala SC, 10 0.1 0(0.02) 21 Potato Honduras SC, 10 0.1 (0.02) 21 Potato Hungary SC, 48 0.048 0.012 7 Potato Israel SC, 48 0.096 0.0048 - 0.0096 1 21 Potato Japan WG, 30 (0.23) 0.0075 3 7 Potato Latvia SC, 48 0.048 3 21 Potato Lithuania SC, 48 0.024 – 0.048 0.006 – 0.024 3 21 Potato Mexico SC, 48 0.096 7 Potato Netherlands SC, 48 0.12 3 14 Potato Nicaragua SC, 10 0.1 (0.02) 21 Potato Panama SC, 10 0.1 (0.02) 21 Potato Poland SC, 48 0.048 0.012 1 3 Potato Portugal SC, 48 0.072 0.009 2 21 Potato Romania SC, 48 0.077 2 Potato Slovakia SC, 48 0.048 0.012 2 14 Potato Slovenia SC, 48 0.048 (0.006 - 0.0096) 2 21 Potato South Korea SC, 10 0.00075 3 21 Potato Spain SC, 48 0.096 3 21 Potato Switzerland SC, 48 0.048 3 21 Potato (seed) United Kingdom OD, 24 0.096 0.024 – 0.048 2 14 Potato (ware) United Kingdom OD, 24 0.096 0.024 – 0.048 1 14 Raspberry Germany SC, 48 0.096 0.0096 2 14 Raspberry Netherlands SC, 48 0.14 0.012 2 3 Raspberry and rubus hybrids
United Kingdom SC, 48 0.12 0.024 3 3
Red currants Latvia SC, 48 0.072 (0.019) 2 14 Red Pepper South Korea SC, 10 0.0005 3 3 Rice Belize SE, 11 0.1 (0.02) 21 Rice Costa Rica SE, 11 0.1 (0.02) 21 Rice Dom. Republic SE, 11 0.1 (0.02) 21

Thiacloprid 1029
Application rate Crop Country Formulation, ai % kg ai/ha kg ai/hL
No. Per season
PHI (days)
Rice El Salvador SE, 11 0.1 (0.02) 21 Rice Guatemala SE, 11 0.1 (0.02) 21 Rice Honduras SE, 11 0.1 (0.02) 21 Rice Indonesia SC, 24 0.14 0.028 Rice Nicaragua SE, 11 0.1 (0.02) 21 Rice Panama SE, 11 0.1 (0.02) 21 Rice South Korea GR, 1 0.5 g/box 1 Rice Thailand SC, 24 0.018 14 Rice (nursery box)
Japan GR, 1,5 50 g/box = 0.15 kg ai/ha
1
Squash Cyprus (field and greenhouse use)
SC, 48 0.014 3 3
Squash Netherlands SC, 48 0.012 4 1 Stone fruit Argentina SC, 48 0.0096 2 14 Stone fruit Australia SC, 48 0.27 0.018 3 14 Stone fruit Chile SC, 48 0.0096 2 1 Stone fruit Czech Republic SC, 48 0.096 0.0096 2 14 Stone fruit Switzerland SC, 48 0.0058 2 21 Stone fruit Tunisia SC, 48 0.0096 30 Strawberry Japan WG, 30 0.23 0.0075 3 1 Strawberry Latvia SC, 48 0.096 (0.024) 2 14 Strawberry Netherlands SC, 48 0.14 0.012 2 3 Strawberry Netherlands
(greenhouse use) SC, 48 0.14 0.012 2 1
Strawberry United Kingdom Sc, 48 0.12 0.024 2 3 Strawberry United Kingdom
(greenhouse use) Sc, 48 0.12 0.024 2 3
Sunflower Hungary SC, 48 0.036 0.008 - 0.012 30 Sunflower Slovakia SC, 48 0.048 Sweet Corn Israel SC, 48 0.096 0.013 - 0.064 2 3 Sweet Pepper Japan WG, 30 0.23 0.0075 3 1 Sweet Pepper Tunisia SC, 48 0.014 2 3 Tayberry Netherlands SC, 48 0.14 0.012 2 3 Tea Japan WG, 30 0.6 0.015 1 7 Tomato Argentina SC, 48 0.144 min. 1 3 Tomato Belize SC, 10 0.1 (0.02) 21 Tomato Brazil SC, 48 0.096 (0.0096) 7 Tomato Costa Rica SC, 10 0.1 (0.02) 21 Tomato Croatia SC, 48 0.14 0.014 2 4 Tomato Cyprus SC, 48 0.014 3 3 Tomato Dom. Republic SC, 10 0.1 (0.02) 21 Tomato El Salvador SC, 10 0.1 (0.02) 21 Tomato Greece SC, 48 0.216 0.014 2 3 Tomato Guatemala SC, 10 0.1 (0.02) 21 Tomato Honduras SC, 10 0.1 (0.02) 21 Tomato Israel SC, 48 0.192 3 Tomato Italy SC, 48 0.14 0.014 3 Tomato Japan WG, 30 0.23 0.015 3 1 Tomato Kenya SC, 48 0.19 (0.019) 4 3 Tomato Morocco SC, 48 0.014 3 Tomato Netherlands
(greenhouse use) SC, 48 0.12 0.012 4 1
Tomato Netherlands (greenhouse use, drip irrigation)
SC, 48 0.0096 kg ai per 1000 plants
1 3
Tomato Nicaragua SC, 10 0.1 (0.02) 21 Tomato Panama SC, 10 0.1 (0.02) 21 Tomato Peru SC, 48 0.036 3 Tomato Slovakia SC, 48 0.014 3 Tomato Slovenia SC, 48 0.21 0.014 2 3 Tomato Spain SC, 48 0.014 3 3 Tomato Tunisia SC, 48 0.014 2 3

1030 Thiacloprid
Application rate Crop Country Formulation, ai % kg ai/ha kg ai/hL
No. Per season
PHI (days)
Tomato Turkey SC, 48 0.0096 3 Tomato United Kingdom SC, 48 0.22 max. 0.022 3 3 Tree nuts Italy SC, 48 0.18 0.012 14 Walnut Argentina SC, 48 0.0096 2 21 Walnut Chile SC, 48 0.0096 2 1 Walnut Italy SC, 48 0.18 0.012 14 Walnut United Kingdom SC, 48 0.18 0.018 2 Watermelon Belize SC, 10 0.1 (0.02) 21 Watermelon Brazil Sc, 48 0.096 21 Watermelon Costa Rica SC, 10 0.1 (0.02) 21 Watermelon Cyprus SC, 48 0.014 3 3 Watermelon Dom. Republic SC, 10 0.1 (0.02) 21 Watermelon El Salvador SC, 10 0.1 (0.02) 21 Watermelon Guatemala SC, 10 0.1 (0.02) 21 Watermelon Honduras SC, 10 0.1 (0.02) 21 Watermelon Japan WG, 30 0.45 0.0075 3 1 Watermelon Kenya SC, 48 0.19 0.019 3 3 Watermelon Nicaragua SC, 10 0.1 (0.02) 21 Watermelon Panama SC, 10 0.1 (0.02) 21 Watermelon South Korea SC, 10 0.0005 3 3 Watermelon Spain SC, 48 0.14 0.0067 3 3 Wheat Romania SC, 48 0.048 0.012 - 0.016 1 White mustard Czech Republic SC, 48 0.096 0.016 - 0.048 2 Winter wheat Lithuania SC, 48 0.034 3 21 Wintersquash Israel SC, 48 0.19 0.026 - 0.128 2 10
Values in parenthesis are calculated from the spray volume
RESIDUES RESULTING FROM SUPERVISED TRIALS ON CROPS
The Meeting received information on thiacloprid supervised trials on the following crops (Table 26).
Trials were well documented with laboratory and field reports. The former included method validation including procedural recoveries with spiking at residue levels similar to those occurring in samples from the supervised trials. Dates of analysis or duration of sample storage were also provided. Although trials included control plots, no control data are recorded in the Tables because no residues in control samples exceeded the LOQ. Residues are unadjusted for recoveries.
When residues were not detected they are shown as below the LOQ (e.g. < 0.01 mg/kg). Residues, application rates and spray concentrations have generally been rounded to two significant figures or, for residues near the LOQ, to one significant figure. Residues from the trials conducted according to maximum GAP have been used for the estimation of maximum residue levels. These results are double underlined.
Periods of freezer storage between sampling and analysis were recorded for all trials and were covered by the periods of the freezer storage stability studies.
Table 26. Overview of supervised residue trials.
Commodity Application Country Table no. Citrus Foliar Brazil, New Zealand, South Africa Table 27 Apple Foliar Australia, Belgium, France, Germany, Italy,
Japan, Netherlands, South Africa, Spain, United Kingdom, USA
Table 28
Pear Foliar Australia, Japan, South Africa, USA Table 29 Apricot, Japanese Foliar Japan Table 30 Peach Foliar France, Italy, Japan, Spain Table 31 Cherry Foliar Belgium, France, Germany, Italy, Japan,
Spain, USA Table 32
Plum Foliar France, Germany, Japan, Spain, USA Table 33

Thiacloprid 1031
Grapes Foliar (glasshouse use) Japan Table 34 Strawberries Foliar (field use) Belgium, France, Germany, United
Kingdom Table 35
Strawberries Foliar (greenhouse use) France, Germany, Italy, Japan, Netherlands, Spain
Table 36
Currants Foliar Belgium, Germany, United Kingdom Table 37 Raspberries Foliar Germany, United Kingdom Table 38 Kiwi fruits Foliar New Zealand Table 39 Onions Foliar Brazil. Germany Table 40 Garlic Foliar Brazil Table 41 Eggplants Foliar (glasshouse use) Japan Table 42 Cucumbers Foliar (field use) Germany, Italy, Spain Table 43 Cucumbers Foliar (greenhouse use) Belgium, France, Germany, Greece, Italy,
Netherlands, Spain Table 44
Melons Foliar (field use) France, Greece, Italy Table 45 Melons Foliar (glasshouse use) Japan Table 46 Watermelons Foliar (field use) Greece, Spain Table 47 Watermelons Foliar (glasshouse use) Japan Table 48 Tomato Foliar (field use) France, Italy Table 49 Tomato Foliar (greenhouse use) France, Germany, Japan, Spain Table 50 Tomato Drip application (greenhouse
use) Belgium, Netherlands Table 51
Pepper Foliar (field use) France, Italy, Spain Table 52 Pepper Foliar (greenhouse use) France, Netherlands, Japan, Spain Table 53 Pepper Drip application (greenhouse
use) Belgium, Netherlands Table 54
Potato Foliar Belgium, Brazil, France, Germany, Italy, Japan, Spain, United Kingdom
Table 55
Wheat Foliar France, Germany Table 56 Barley Foliar France, Germany Table 57 Rice Foliar India Table 58 Rice Granular Japan Table 59 Maize Foliar France, Germany, Greece, Italy, Spain Table 60 Walnuts Foliar Italy Table 61 Almonds Foliar USA Table 62 Pecan Foliar USA Table 63 Oilseed rape Foliar France, Germany, Hungary, Spain, Sweden Table 64 Cotton Foliar Greece, Spain, USA Table 651 Sunflowers Foliar Hungary Table 66 Green tea Foliar Japan Table 67
1 Single underlined values were used for the evaluation of rape forage. Double underlined values were used for the evaluation of rape seed and white mustard.
Citrus fruits
Table 27. Thiacloprid residues resulting from foliar application to citrus.
Application Analysis Location Year (variety)
Form kg ai/ha kg
ai/hL No Sample PHI Residues
Reference, Report No.
Brazil, Riberao Preto/SP 1998 (Pera Rio)
480 SC 0.096 0.0048 3 Lemon, peel Lemon, pulp
21 21
0.02 < 0.02
Lancas, F. M. 1998, 1998a M-005338-01-2 and M-005340-01-2
Brazil, Riberao Preto/SP 1998 (Pera Rio)
480 SC 0.19 0.0096 3 Lemon, peel Lemon, pulp
21 21
0.06 0.04
Lancas, F. M. 1998, 1998a M-005338-01-2 and M-005340-01-2

1032 Thiacloprid
Application Analysis Location Year (variety)
Form kg ai/ha kg
ai/hL No Sample PHI Residues
Reference, Report No.
New Zealand Kerikeri 2002 (Yen Ben)
480 SC 0.19 0.0096 1 Lemon, whole fruit 1 3 5 7 10 14
0.19 0.2 0.1 0.14 0.15 0.07
Clay, S. 2002 M-261169-01-1
South Africa Vaalwater, Northern Province 1999 (Navel)
480 SC 0.00043 0.014 1 Orange, whole fruit Orange, peel Orange, pulp
44 93 123 151 190 93 123 151 190
< 0.02 < 0.02 < 0.02 < 0.02 < 0.02 < 0.02 < 0.02 < 0.02 < 0.02
Zyl, P. F. C. van 2000a M-048686-02-1
South Africa Vaalwater, Northern Province 1999 (Navel)
480 SC 0.00086 0.029 1 Orange, whole fruit Orange, peel Orange, pulp
44 93 123 151 190 93 123 151 190
< 0.02 < 0.02 < 0.02 < 0.02 < 0.02 < 0.02 < 0.02 < 0.02 < 0.02
Zyl, P. F. C. van 2000a M-048686-02-1
Pome fruits
Table 28. Thiacloprid residues resulting from foliar application to apples.
Application Analysis Location Year (variety)
Form kg ai/ha kg
ai/hL No Sample PHI Residues
Reference, Report No.
United Kingdom Thurston 1995 (Gloster 69)
480 SC 0.14 – 0.15
0.0096 2 Fruit 01 0 7 10 14 22
< 0.02 0.03 0.05 0.03 0.04 0.04
Placke, F. J. 1997a RA-2062/95
Belgium Kortenaken 1995 (Jonagold)
480 SC 0.14 – 0.15
0.0096 2 Fruit 01 0 7 14 21
0.04 0.18 0.17 0.12 0.09
Placke, F. J. 1997a RA-2062/95
Germany Burscheid 1995 (Jonagold)
480 SC 0.14 0.0096 2 Fruit 01 0 7 10 14 21
0.04 0.16 0.09 0.06 0.07 0.04
Placke, F. J. 1997a RA-2062/95
Germany Monheim 1995 (Golden Delicious)
480 SC 0.14 0.029 2 Fruit 01 0 7 10 14 21
0.04 0.25
< 0.02 0.09 0.07 0.05
Placke, F. J. 1997a RA-2062/95
United Kingdom Bury St. Edmunds 1996 (Golden Delicious)
480 SC 0.18 0.012 2 Fruit 0 14
0.26, 0.28 (0.27)
0.15, 0.16 (0.16)
Placke, F. J. 1997b RA-2114/96

Thiacloprid 1033
Application Analysis Location Year (variety)
Form kg ai/ha kg
ai/hL No Sample PHI Residues
Reference, Report No.
Netherlands Kruisland 1996 (Jonagold)
480 SC 0.18 0.012 2 Fruit 0 14
0.11 0.05
Placke, F. J. 1997b RA-2114/96
Germany Burscheid 1996 (Elstar)
480 SC 0.18 0.012 2 Fruit 0 13
0.23 0.11
Placke, F. J. 1997b RA-2114/96
Germany Monheim 1996 (Golden Delicious)
480 SC 0.14 0.036 2 Fruit 0 14
0.23 0.11
Placke, F. J. 1997b RA-2114/96
France Bossay 2000 (Reine des Reinettes)
480 SC 0.18 0.012 2 Fruit 0 14
0.19 0.21
Schoening, R. 2001aM-080245-01-1
France Azay le Rideau 2000 (Golden)
480 SC 0.18 0.012 2 Fruit 0 14
0.11 0.1
Schoening, R. 2001aM-080245-01-1
Spain Pere Pescador 1995 (Starking)
480 SC 0.14 0.0096 2 Fruit 01 0 7 10 14 21
0.05 0.15 0.11 0.09 0.08 0.07
Placke, F. J. 1997c M-000919-01-1
Italy Laives 1995 (Golden Delicious)
480 SC 0.14 0.0096 2 Fruit 01 0 7 10 14 21
0.03 0.15 0.03 0.03 0.02 0.02
Placke, F. J. 1997c M-000919-01-1
Italy Laives 1995 (Granny Smith)
480 SC 0.14 0.0096 2 Fruit 01 0 7 10 14 21
0.02 0.12 0.13 0.15 0.1 0.08
Placke, F. J. 1997c M-000919-01-1
Spain Pere Pescador 1995 (Golden)
480 SC 0.14 0.0096 2 Fruit 01 0 7 10 14 21
0.05 0.15 0.13 0.13 0.11 0.1
Placke, F. J. 1997c M-000919-01-1
Spain Pere Pescador 1995 (Suprema)
480 SC 0.18 0.012 2 Fruit 0 14
0.19 0.14
Placke, F. J. 1997d M-000913-01-1
Italy Pineta di Laives 1996 (Stark Delicious)
480 SC 0.18 0.012 2 Fruit 0 14
0.14 0.1
Placke, F. J. 1997d M-000913-01-1
Italy Montemarzino 1996 (Golden)
480 SC 0.18 0.012 2 Fruit 0 14
0.48 0.36
Placke, F. J. 1997d M-000913-01-1
France Roches-Prémarie-Andillé 1996 (Golden)
480 SC 0.18 0.012 2 Fruit 0 14
0.22 0.04
Placke, F. J. 1997d M-000913-01-1

1034 Thiacloprid
Application Analysis Location Year (variety)
Form kg ai/ha kg
ai/hL No Sample PHI Residues
Reference, Report No.
France Mas Grenier 2000 (Golden)
480 SC 0.18 0.012 2 Fruit 0 14
0.3 0.13
Schoening, R. 2001b M-075119-01-1
USA Pennsylvania 1998 (Starkrimson Red Delicious)
480 SC 0.28 0.046 2 Fruit 29 46
0.06 0.07
Harbin, A.M. 1999 M-009903-01-1
USA Pennsylvania 1998 (Starkrimson Red Delicious)
480 SC 0.28 0.0098 2 Fruit 29 46
0.11 0.08
Harbin, A.M. 1999 M-009903-01-1
USA New York 1998 (Red Delicious)
480 SC 0.28 0.037 2 Fruit 30 44
0.11 0.05
Harbin, A.M. 1999 M-009903-01-1
USA New York 1998 (Red Delicious)
480 SC 0.28 0.0075 2 Fruit 30 44
0.096 0.05
Harbin, A.M. 1999 M-009903-01-1
USA Pennsylvania 1998 (Law Rome/MM111)
480 SC 0.28 0.048 2 Fruit 30 45
0.03 0.02
Harbin, A.M. 1999 M-009903-01-1
USA Pennsylvania 1998 (Law Rome/MM111)
480 SC 0.28 0.0085 2 Fruit 30 45
0.04 0.03
Harbin, A.M. 1999 M-009903-01-1
USA North Carolina 1998 (Red Delicious)
480 SC 0.28 0.06 2 Fruit 31 45
0.02 0.02
Harbin, A.M. 1999 M-009903-01-1
USA North Carolina 1998 (Red Delicious)
480 SC 0.28 0.0081 2 Fruit 31 45
0.06 0.04
Harbin, A.M. 1999 M-009903-01-1
USA Illinois 1998 (Jonathon)
480 SC 0.28 0.043 2 Fruit 30 45
0.06 0.06
Harbin, A.M. 1999 M-009903-01-1
USA Illinois 1998 (Jonathon)
480 SC 0.28 0.0078 2 Fruit 30 45
0.07 0.03
Harbin, A.M. 1999 M-009903-01-1
USA Utah 1998 (Red Delicious)
480 SC 0.28 0.047 2 Fruit 29 47
0.04 0.01
Harbin, A.M. 1999 M-009903-01-1
USA Utah 1998 (Red Delicious)
480 SC 0.28 0.0074 2 Fruit 29 47
0.02 0.01
Harbin, A.M. 1999 M-009903-01-1
USA Idaho 1998 (Law Spur Rome)
480 SC 0.28 0.034 2 Fruit 30 45
0.03 0.02
Harbin, A.M. 1999 M-009903-01-1

Thiacloprid 1035
Application Analysis Location Year (variety)
Form kg ai/ha kg
ai/hL No Sample PHI Residues
Reference, Report No.
USA Idaho 1998 (Law Spur Rome)
480 SC 0.28 0.0078 2 Fruit 30 45
0.06 0.04
Harbin, A.M. 1999 M-009903-01-1
USA Oregon 1998 (Jonagold)
480 SC 0.28 0.033 2 Fruit 30 46
0.07 0.02
Harbin, A.M. 1999 M-009903-01-1
USA Oregon 1998 (Jonagold)
480 SC 0.28 0.0073 2 Fruit 30 46
0.28 0.04
Harbin, A.M. 1999 M-009903-01-1
USA Washington 1998 (Red Delicious)
480 SC 0.28 0.041 2 Fruit 30 45
0.13 0.04
Harbin, A.M. 1999 M-009903-01-1
USA Washington 1998 (Red Delicious)
480 SC 0.28 0.0077 2 Fruit 30 45
0.14 0.05
Harbin, A.M. 1999 M-009903-01-1
USA Oregon 1998 (Fuji Apple)
480 SC 0.28 0.04 2 Fruit 23 30 37 44 52
0.05 0.03 0.03 0.02 0.03
Harbin, A.M. 1999 M-009903-01-1
USA Oregon 1998 (Fuji Apple)
480 SC 0.28 0.007 2 Fruit 23 30 37 44 52
0.09 0.09 0.03 0.03 0.07
Harbin, A.M. 1999 M-009903-01-1
USA California 1998 (Rome Beauty)
480 SC 0.28 0.038 2 Fruit 25 32 39 46 53
< 0.01 < 0.01 < 0.01 < 0.01 < 0.01
Harbin, A.M. 1999 M-009903-01-1
USA California 1998 (Rome Beauty)
480 SC 0.28 0.007 2 Fruit 25 32 39 46 53
0.02 0.02 0.06 0.02 0.05
Harbin, A.M. 1999 M-009903-01-1
USA Kansas 1998 (Golden Delicious)
480 SC 0.28 0.048 2 Fruit 41 < 0.01 Harbin, A.M. 1999 M-009903-01-1
USA Kansas 1998 (Golden Delicious)
480 SC 0.28 0.0082 2 Fruit 41 0.05 Harbin, A.M. 1999 M-009903-01-1
USA Oregon 1998 (Fuji Apples)
70 WG 0.28 0.04 2 Fruit 23 30 37 44 52
0.08 0.04 0.02 0.05 0.03
Harbin, A.M. 1999 M-009903-01-1
USA Oregon 1998 (Fuji Apples)
70 WG 0.28 0.007 2 Fruit 23 30 37 44 52
0.097 0.07 0.02 0.03 0.03
Harbin, A.M. 1999 M-009903-01-1

1036 Thiacloprid
Application Analysis Location Year (variety)
Form kg ai/ha kg
ai/hL No Sample PHI Residues
Reference, Report No.
USA California 1998 (Rome Beauty)
70 WG 0.08 0.038 2 Fruit 25 32 39 46 53
< 0.01 < 0.01 < 0.01 < 0.01 < 0.01
Harbin, A.M. 1999 M-009903-01-1
USA California 1998 (Rome Beauty)
70 WG 0.08 0.007 2 Fruit 25 32 39 46 53
0.02 0.03 0.02 0.01 0.05
Harbin, A.M. 1999 M-009903-01-1
USA Pennsylvania 1998 (Starkrimson Red Delicious)
70 WG 0.28 0.046 2 Fruit 29 46
0.07 0.08
Harbin, A.M. 1999 M-009903-01-1
USA Pennsylvania 1998 (Starkrimson Red Delicious)
70 WG 0.28 0.0098 2 Fruit 29 46
0.09 0.09
Harbin, A.M. 1999 M-009903-01-1
South Africa Villiersdorp 2000 (Golden Delicious)
480 SC 0.24 0.0096 4 Fruit 01 0 14
0.32, 0.31 (0.32)
0.68, 0.67 (0.68)
0.54, 0.54 (0.54)
Zyl, P. F. C. van 2000b 5438/1493281/T392
South Africa Villiersdorp 2000 (Granny Smith)
480 SC 0.24 0.0096 4 Fruit 01 0 14
0.23, 0.26 (0.25)
0.73, 0.76 (0.75)
0.43, 0.43 (0.43)
Zyl, P. F. C. van 2000c 5438/1493257/T389
South Africa Villiersdorp 2000 (Royal Galaxy)
480 SC 0.19 0.0096 4 Fruit 01 0 14
0.06, 0.06 (0.06)
0.48, 0.45 (0.47)
0.15, 0.14 (0.15)
Garbers, H. V. 20005438/1493265/T390
South Africa Villiersdorp 2000 (Royal Galaxy)
480 SC 0.38 0.019 4 Fruit 01 0 14
0.12, 0.13 (0.13)
0.51, 0.71 (0.61)
0.60, 0.51 (0.56)
Garbers, H. V. 20005438/1493265/T390
Australia Applethorpe 1998 (Granny Smith)
480 SC 0.24 0.018 10 Fruit Replicate trial Fruit
0 7 14 21 0 7 14 21
0.28, 0.55 (0.42)
0.21, 0.21 (0.21)
0.50, 0.23 (0.37)
0.30, 0.31 (0.31)
0.70, 0.44
(0.57) 0.44, 0.38
(0.41) 0.25, 0.31
(0.28) 0.25, 0.32
(0.29)
Tancred, S. 1999 EMH453/99
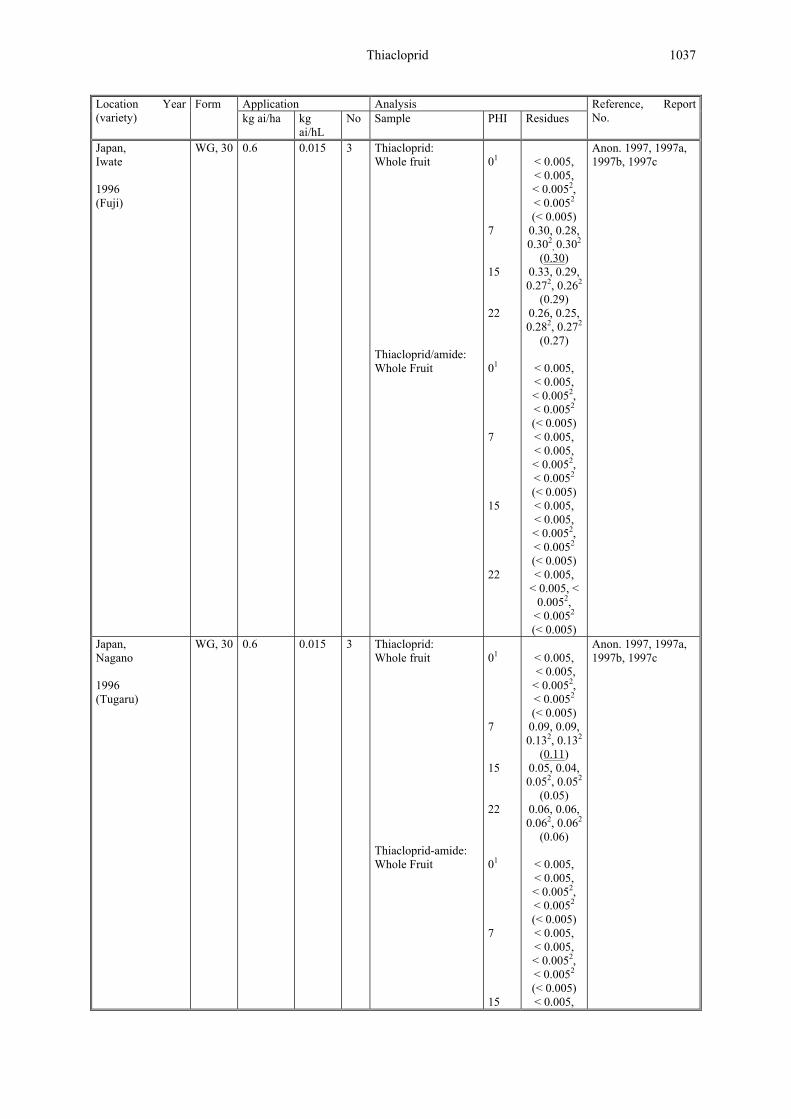
Thiacloprid 1037
Application Analysis Location Year (variety)
Form kg ai/ha kg
ai/hL No Sample PHI Residues
Reference, Report No.
Japan, Iwate 1996 (Fuji)
WG, 30 0.6 0.015 3 Thiacloprid: Whole fruit Thiacloprid/amide: Whole Fruit
01 7 15 22 01 7 15 22
< 0.005, < 0.005, < 0.0052, < 0.0052 (< 0.005)
0.30, 0.28, 0.302
, 0.302 (0.30)
0.33, 0.29, 0.272, 0.262
(0.29) 0.26, 0.25, 0.282, 0.272
(0.27)
< 0.005, < 0.005, < 0.0052, < 0.0052 (< 0.005) < 0.005, < 0.005, < 0.0052, < 0.0052 (< 0.005) < 0.005, < 0.005, < 0.0052, < 0.0052 (< 0.005) < 0.005,
< 0.005, < 0.0052,
< 0.0052 (< 0.005)
Anon. 1997, 1997a, 1997b, 1997c
Japan, Nagano 1996 (Tugaru)
WG, 30 0.6 0.015 3 Thiacloprid: Whole fruit Thiacloprid-amide: Whole Fruit
01 7 15 22 01 7 15
< 0.005, < 0.005, < 0.0052, < 0.0052 (< 0.005)
0.09, 0.09, 0.132, 0.132
(0.11) 0.05, 0.04, 0.052, 0.052
(0.05) 0.06, 0.06, 0.062, 0.062
(0.06)
< 0.005, < 0.005, < 0.0052, < 0.0052 (< 0.005) < 0.005, < 0.005, < 0.0052, < 0.0052 (< 0.005) < 0.005,
Anon. 1997, 1997a, 1997b, 1997c

1038 Thiacloprid
Application Analysis Location Year (variety)
Form kg ai/ha kg
ai/hL No Sample PHI Residues
Reference, Report No.
22
< 0.005, < 0.0052, < 0.0052 (< 0.005) < 0.005, < 0.005, < 0.0052, < 0.0052 (< 0.005)
1) sampling before last application 2) replicate analysis
Table 29. Thiacloprid residues resulting from foliar application to pears.
Application Analysis Location Year (variety)
Form kg ai/ha kg
ai/hL No Sample PHI Residues
Reference, Report No.
USA Pennsylvania 1998 (Bartlett)
480 SC 0.28 0.039 2 Fruit 31 45
0.06 0.08
Harbin, A.M. 1999 M-009903-01-1
USA Pennsylvania 1998 (Bartlett)
480 SC 0.28 0.0097 2 Fruit 31 45
0.13 0.14
Harbin, A.M. 1999 M-009903-01-1
USA California 1998 (Bartlett)
480 SC 0.28 0.031 2 Fruit 29 44
0.25 0.21
Harbin, A.M. 1999 M-009903-01-1
USA California 1998 (Bartlett)
480 SC 0.28 0.0099 2 Fruit 29 44
0.23 0.13
Harbin, A.M. 1999 M-009903-01-1
USA California 1998 (Bosc)
480 SC 0.28 0.032 2 Fruit 30 44
0.21 0.26
Harbin, A.M. 1999 M-009903-01-1
USA California 1998 (Bosc)
480 SC 0.28 0.0094 2 Fruit 30 44
0.27 0.12
Harbin, A.M. 1999 M-009903-01-1
USA Idaho 1998 (Max Red Bartlett)
480 SC 0.28 0.033 2 Fruit 22 29 36 43 50
0.06 0.05 0.05 0.03 0.03
Harbin, A.M. 1999 M-009903-01-1
USA Idaho 1998 (Max Red Bartlett)
480 SC 0.28 0.01 2 Fruit 22 29 36 43 50
0.08 0.06 0.06 0.04 0.05
Harbin, A.M. 1999 M-009903-01-1
USA Oregon 1998 (Red Clapp)
480 SC 0.28 0.033 2 Fruit 30 45
0.04 0.03
Harbin, A.M. 1999 M-009903-01-1
USA Oregon 1998 (Red Clapp)
480 SC 0.28 0.01 2 Fruit 30 45
0.05 0.04
Harbin, A.M. 1999 M-009903-01-1

Thiacloprid 1039
Application Analysis Location Year (variety)
Form kg ai/ha kg
ai/hL No Sample PHI Residues
Reference, Report No.
USA Washington 1998 (Red Bartlett)
480 SC 0.28 0.033 2 Fruit 30 45
0.18 0.14
Harbin, A.M. 1999 M-009903-01-1
USA Washington 1998 (Red Bartlett)
480 SC 0.28 0.01 2 Fruit 30 45
0.24 0.15
Harbin, A.M. 1999 M-009903-01-1
USA Sacramento 1998 (Bartlett)
70 WG 0.28 0.031 2 Fruit 29 44
0.22 0.17
Harbin, A.M. 1999 M-009903-01-1
USA Sacramento 1998 (Bartlett)
70 WG 0.28 0.0099 2 Fruit 29 44
0.14 0.13
Harbin, A.M. 1999 M-009903-01-1
USA Idaho 1998 (Max Red Bartlett)
70 WG 0.28 0.033 2 Fruit 22 29 36 43 50
0.06 0.05 0.08 0.02 0.02
Harbin, A.M. 1999 M-009903-01-1
USA Idaho 1998 (Max Red Bartlett)
70 WG 0.28 0.01 2 Fruit 22 29 36 43 50
0.11 0.08 0.08 0.10 0.06
Harbin, A.M. 1999 M-009903-01-1
South Africa Groot Drakenstein 2000 (Forelle)
480 SC 0.24 0.0096 4 Fruit 01 0 14
0.19, 0.21 (0.20)
0.55, 0.48 (0.52)
0.22, 0.21 (0.22)
Zyl, P. F. C. van 2000d 5438/1502352/T465
South Africa Groot Drakenstein 2000 (Forelle)
480 SC 0.31 0.0096 4 Fruit 01 0 14
0.51, 0.49 (0.50)
0.98, 1.1 (1.04)
0.51, 0.48 (0.50)
Zyl, P. F. C. van 2000e 5438/1502361/T466
South Africa Groot Drakenstein 2000 (Forelle)
480 SC 0.61 0.0192 4 Fruit 01 0 14
0.85, 0.82 (0.84)
1.4, 1.5 (1.5)
1.1, 1.1 (1.1)
Zyl, P. F. C. van 2000e 5438/1502361/T466
Australia Cottenvale 1999 (Packham)
480 SC 0.35 0.018 8 Fruit 01 0 7 14 21 28
0.43 0.66 0.30 0.37 0.34 0.29
Tancred, S. 2001 ADM 172/01
Australia Cottenvale 1999 (Packham)
480 SC 0.35 0.018 4 Fruit 01 0 7 14 21 28
0.41 0.62 0.33 0.26 0.28 0.38
Tancred, S. 2001 ADM 172/01
Japan, Fukushima 1997 (Kousui)
30 WG 0.6 0.015 3 Thiacloprid: Whole fruit
01
< 0.005, < 0.005, < 0.0052, < 0.0052 (< 0.005)
Anon. 1997l, 1997m, 1997n, 1997o

1040 Thiacloprid
Application Analysis Location Year (variety)
Form kg ai/ha kg
ai/hL No Sample PHI Residues
Reference, Report No.
Thiacloprid/amide: Whole Fruit
7 14 21 01 7 14 21
0.67, 0.64, 0.572, 0.572
(0.61)
0.45, 0.45, 0.342, 0.33
(0.39)
0.31, 0.31, 0.192, 0.182
(0.25)
< 0.005, < 0.005, < 0.0052, < 0.0052 (< 0.005)
0.02, 0.01, 0.012, 0.012
(0.01)
0.01, 0.01, 0.012, 0.012
(0.01)
0.01, 0.01, 0.012, 0.012
(0.01) 1 sampling before last application 2 replicate analysis
Stone fruits
Table 30. Thiacloprid residues resulting from foliar application to Japanese apricots.
Application Analysis Location Year (variety)
Form kg ai/ha kg
ai/hL No Sample PHI Residues
Reference, Report No.
Japan, Fukui 1997 (Benisashi)
WG, 30 0.6 0.015 2 Thiacloprid: Whole fruit w/o stone Thiacloprid/amide: Whole Fruit w/o stone
01 7 14 21 01 7
< 0.005, < 0.005, < 0.0052, < 0.0052 (< 0.005) 1.7, 1.6, 1.32
, 1.32 (1.5)
0.91, 0.81, 0.812, 0.772
(0.83) 0.94, 0.83, 0.692, 0.662
(0.78)
< 0.005, < 0.005, < 0.0052, < 0.0052 (< 0.005)
0.09, 0.08,
Anon. 2001a, 2001b
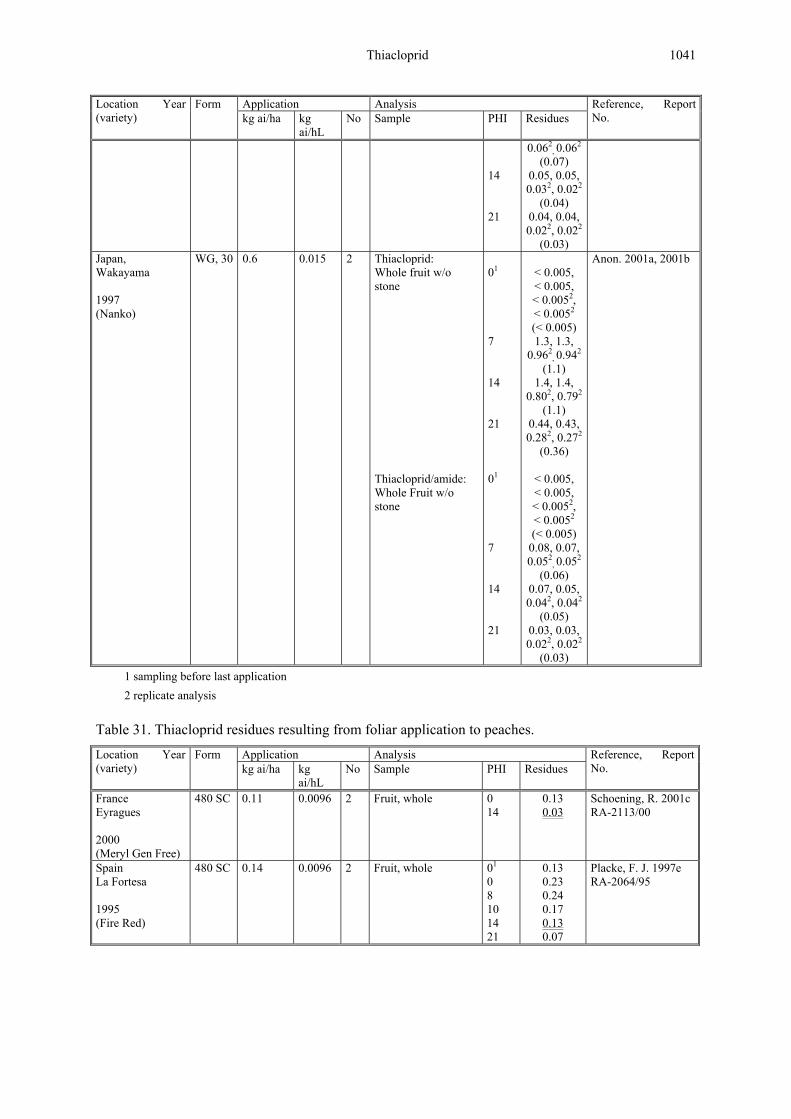
Thiacloprid 1041
Application Analysis Location Year (variety)
Form kg ai/ha kg
ai/hL No Sample PHI Residues
Reference, Report No.
14 21
0.062, 0.062
(0.07) 0.05, 0.05, 0.032, 0.022
(0.04) 0.04, 0.04, 0.022, 0.022
(0.03) Japan, Wakayama 1997 (Nanko)
WG, 30 0.6 0.015 2 Thiacloprid: Whole fruit w/o stone Thiacloprid/amide: Whole Fruit w/o stone
01 7 14 21 01 7 14 21
< 0.005, < 0.005, < 0.0052, < 0.0052 (< 0.005) 1.3, 1.3,
0.962, 0.942
(1.1) 1.4, 1.4,
0.802, 0.792 (1.1)
0.44, 0.43, 0.282, 0.272
(0.36)
< 0.005, < 0.005, < 0.0052, < 0.0052 (< 0.005)
0.08, 0.07, 0.052
, 0.052 (0.06)
0.07, 0.05, 0.042, 0.042
(0.05) 0.03, 0.03, 0.022, 0.022
(0.03)
Anon. 2001a, 2001b
1 sampling before last application 2 replicate analysis
Table 31. Thiacloprid residues resulting from foliar application to peaches.
Application Analysis Location Year (variety)
Form kg ai/ha kg
ai/hL No Sample PHI Residues
Reference, Report No.
France Eyragues 2000 (Meryl Gen Free)
480 SC 0.11 0.0096 2 Fruit, whole 0 14
0.13 0.03
Schoening, R. 2001cRA-2113/00
Spain La Fortesa 1995 (Fire Red)
480 SC 0.14 0.0096 2 Fruit, whole 01 0 8 10 14 21
0.13 0.23 0.24 0.17 0.13 0.07
Placke, F. J. 1997e RA-2064/95
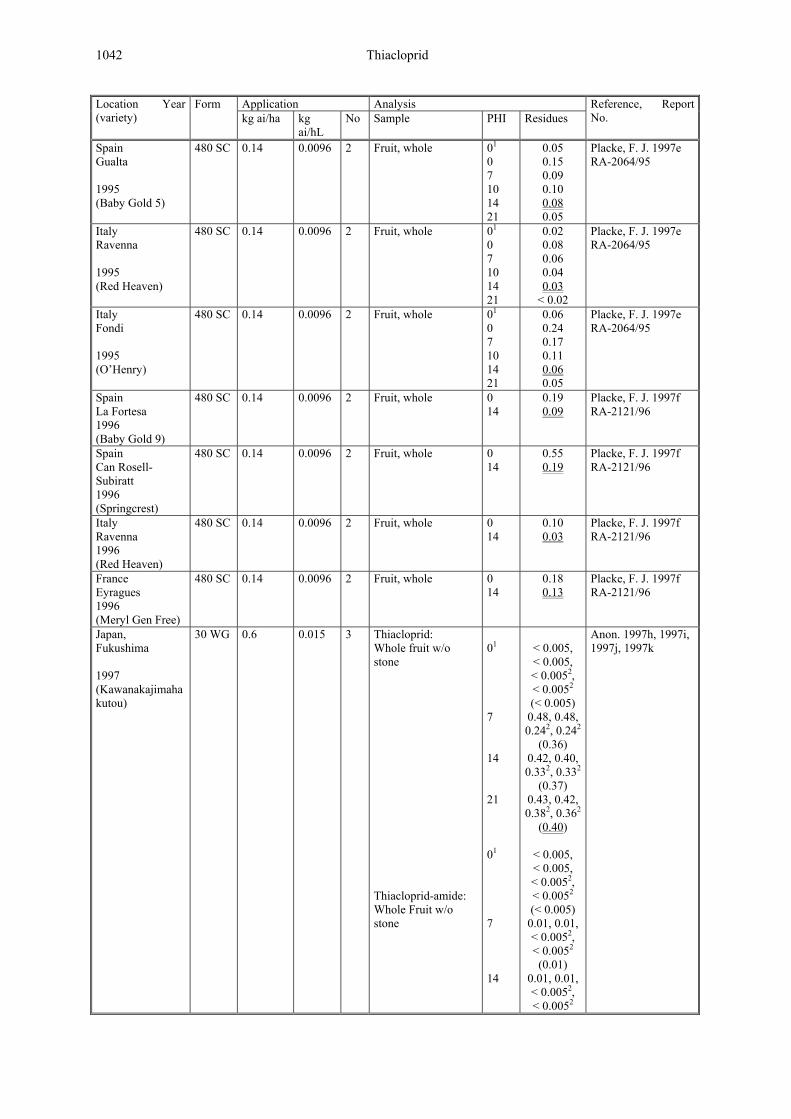
1042 Thiacloprid
Application Analysis Location Year (variety)
Form kg ai/ha kg
ai/hL No Sample PHI Residues
Reference, Report No.
Spain Gualta 1995 (Baby Gold 5)
480 SC 0.14 0.0096 2 Fruit, whole 01 0 7 10 14 21
0.05 0.15 0.09 0.10 0.08 0.05
Placke, F. J. 1997e RA-2064/95
Italy Ravenna 1995 (Red Heaven)
480 SC 0.14 0.0096 2 Fruit, whole 01 0 7 10 14 21
0.02 0.08 0.06 0.04 0.03
< 0.02
Placke, F. J. 1997e RA-2064/95
Italy Fondi 1995 (O’Henry)
480 SC 0.14 0.0096 2 Fruit, whole 01 0 7 10 14 21
0.06 0.24 0.17 0.11 0.06 0.05
Placke, F. J. 1997e RA-2064/95
Spain La Fortesa 1996 (Baby Gold 9)
480 SC 0.14 0.0096 2 Fruit, whole 0 14
0.19 0.09
Placke, F. J. 1997f RA-2121/96
Spain Can Rosell-Subiratt 1996 (Springcrest)
480 SC 0.14 0.0096 2 Fruit, whole 0 14
0.55 0.19
Placke, F. J. 1997f RA-2121/96
Italy Ravenna 1996 (Red Heaven)
480 SC 0.14 0.0096 2 Fruit, whole 0 14
0.10 0.03
Placke, F. J. 1997f RA-2121/96
France Eyragues 1996 (Meryl Gen Free)
480 SC 0.14 0.0096 2 Fruit, whole 0 14
0.18 0.13
Placke, F. J. 1997f RA-2121/96
Japan, Fukushima 1997 (Kawanakajimahakutou)
30 WG 0.6 0.015 3 Thiacloprid: Whole fruit w/o stone Thiacloprid-amide: Whole Fruit w/o stone
01 7 14 21 01 7 14
< 0.005, < 0.005, < 0.0052, < 0.0052 (< 0.005)
0.48, 0.48, 0.242, 0.242
(0.36) 0.42, 0.40, 0.332, 0.332
(0.37) 0.43, 0.42, 0.382, 0.362
(0.40)
< 0.005, < 0.005, < 0.0052, < 0.0052 (< 0.005)
0.01, 0.01, < 0.0052, < 0.0052 (0.01)
0.01, 0.01, < 0.0052, < 0.0052
Anon. 1997h, 1997i, 1997j, 1997k

Thiacloprid 1043
Application Analysis Location Year (variety)
Form kg ai/ha kg
ai/hL No Sample PHI Residues
Reference, Report No.
21
(0.01) 0.01, 0.01, < 0.0052, < 0.0052 (0.01)
Japan, Wakayama 1997 (Takeihakuhou)
30 WG 0.6 0.015 3 Thiacloprid: Whole fruit w/o stone Thiacloprid-amide: Whole Fruit w/o stone
01 7 14 21 01 7 14 21
< 0.005, < 0.005, < 0.0052, < 0.0052 (< 0.005)
0.31, 0.30, 0.232, 0.222
(0.27) 0.1, 0.1,
0.142, 0.142 (0.12)
0.07, 0.06, 0.092, 0.092
(0.08)
< 0.005, < 0.005, < 0.0052, < 0.0052 (< 0.005) < 0.005, < 0.005, < 0.0052, < 0.0052 (< 0.005) < 0.005, < 0.005, < 0.0052, < 0.0052 (< 0.005) < 0.005, < 0.005, < 0.0052, < 0.0052 (< 0.005)
Anon. 1997h, 1997i, 1997j, 1997k
1 sampling before last application 2 replicate analysis
Table 32. Thiacloprid residues resulting from foliar application to cherries.
Application Analysis Location Year (variety)
Form kg ai/ha kg
ai/hL No Sample PHI Residues
Reference, Report No.
Belgium Engelmanshoven 1998 (Cherry, sour Kollaris)
480 SC 0.18 0.012 2 Fruit, whole 01 0 7 14 21
0.03 0.33 0.10 0.04
< 0.02
Schoening, R. 1999aRA-2070/98
Germany Wachtberg – Niederbachem 1998 (Cherry, sour Schattenmorelle)
480 SC 0.18 0.012 2 Fruit, whole 01 0 7 14 21
< 0.02 0.35 0.06 0.02 0.02
Schoening, R. 1999aRA-2070/98
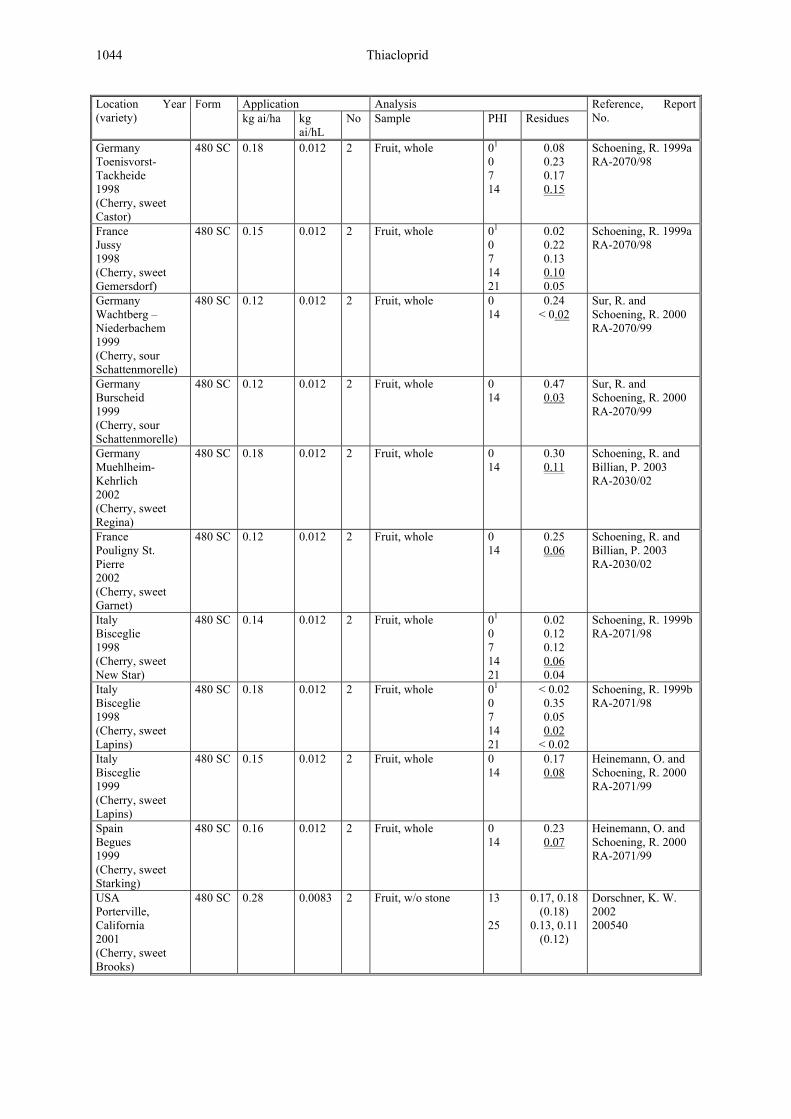
1044 Thiacloprid
Application Analysis Location Year (variety)
Form kg ai/ha kg
ai/hL No Sample PHI Residues
Reference, Report No.
Germany Toenisvorst-Tackheide 1998 (Cherry, sweet Castor)
480 SC 0.18 0.012 2 Fruit, whole 01 0 7 14
0.08 0.23 0.17 0.15
Schoening, R. 1999aRA-2070/98
France Jussy 1998 (Cherry, sweet Gemersdorf)
480 SC 0.15 0.012 2 Fruit, whole 01 0 7 14 21
0.02 0.22 0.13 0.10 0.05
Schoening, R. 1999aRA-2070/98
Germany Wachtberg – Niederbachem 1999 (Cherry, sour Schattenmorelle)
480 SC 0.12 0.012 2 Fruit, whole 0 14
0.24 < 0.02
Sur, R. and Schoening, R. 2000 RA-2070/99
Germany Burscheid 1999 (Cherry, sour Schattenmorelle)
480 SC 0.12 0.012 2 Fruit, whole 0 14
0.47 0.03
Sur, R. and Schoening, R. 2000 RA-2070/99
Germany Muehlheim-Kehrlich 2002 (Cherry, sweet Regina)
480 SC 0.18 0.012 2 Fruit, whole 0 14
0.30 0.11
Schoening, R. and Billian, P. 2003 RA-2030/02
France Pouligny St. Pierre 2002 (Cherry, sweet Garnet)
480 SC 0.12 0.012 2 Fruit, whole 0 14
0.25 0.06
Schoening, R. and Billian, P. 2003 RA-2030/02
Italy Bisceglie 1998 (Cherry, sweet New Star)
480 SC 0.14 0.012 2 Fruit, whole 01 0 7 14 21
0.02 0.12 0.12 0.06 0.04
Schoening, R. 1999bRA-2071/98
Italy Bisceglie 1998 (Cherry, sweet Lapins)
480 SC 0.18 0.012 2 Fruit, whole 01 0 7 14 21
< 0.02 0.35 0.05 0.02
< 0.02
Schoening, R. 1999bRA-2071/98
Italy Bisceglie 1999 (Cherry, sweet Lapins)
480 SC 0.15 0.012 2 Fruit, whole 0 14
0.17 0.08
Heinemann, O. and Schoening, R. 2000 RA-2071/99
Spain Begues 1999 (Cherry, sweet Starking)
480 SC 0.16 0.012 2 Fruit, whole 0 14
0.23 0.07
Heinemann, O. and Schoening, R. 2000 RA-2071/99
USA Porterville, California 2001 (Cherry, sweet Brooks)
480 SC 0.28 0.0083 2 Fruit, w/o stone 13 25
0.17, 0.18 (0.18)
0.13, 0.11 (0.12)
Dorschner, K. W. 2002 200540

Thiacloprid 1045
Application Analysis Location Year (variety)
Form kg ai/ha kg
ai/hL No Sample PHI Residues
Reference, Report No.
USA Visalia, California 2001 (Cherry, sweet Brooks)
480 SC 0.28 0.044 2 Fruit, w/o stone 14 28
< 0.02, < 0.02
(< 0.02) < 0.02 < 0.02
(< 0.02)
Dorschner, K. W. 2002 200540
USA Idaho 2001 (Cherry, sweet Brooks)
480 SC 0.28 0.012 2 Fruit, w/o stone 14 26
0.22, 0.25 (0.24)
0.15, 0.13 (0.14)
Dorschner, K. W. 2002 200540
USA Michigan 2001 (Cherry, sweet Emperor Francis)
480 SC 0.29 0.0498 2 Fruit, w/o stone 14 28
0.22, 0.26 (0.24)
0.13, 0.11 (0.12)
Dorschner, K. W. 2002 200540
USA Michigan 2001 (Cherry, sweet Cavalier)
480 SC 0.29 0.013 2 Fruit, w/o stone 13 27
0.12, 0.13 (0.13)
0.05, 0.05 (0.05)
Dorschner, K. W. 2002 200540
USA Oregon 2001 (Cherry, sweet Bing)
480 SC 0.28 0.011 2 Fruit, w/o stone 14 26
0.18, 0.19 (0.19)
0.10, 0.09 (0.10)
Dorschner, K. W. 2002 200540
USA Washington 2001 (Cherry, sweet Bing)
480 SC 0.295 0.047 2 Fruit, w/o stone 13 26
0.16, 0.17 (0.17)
0.05, 0.05 (0.05)
Dorschner, K. W. 2002 200540
Japan, Alita 2003 (Satonishiki)
WG, 30 0.75 0.015 1 Thiacloprid: Whole fruit w/o stone Thiacloprid-amide: Whole Fruit w/o stone
1 3 7 14 1 3 7 14
1.4, 1.4
(1.4) 0.8, 0.7
(0.8) 1.1, 1.0
(1.1) 0.6, 0.5
(0.6)
< 0.2, < 0.2 (< 0.2)
< 0.2, < 0.2 (< 0.2)
< 0.2, < 0.2 (< 0.2)
< 0.2, < 0.2 (< 0.2)
Anon. 2003

1046 Thiacloprid
Application Analysis Location Year (variety)
Form kg ai/ha kg
ai/hL No Sample PHI Residues
Reference, Report No.
Japan, Fukushima 2003 (Satonishiki)
WG, 30 0.75 0.015 1 Thiacloprid: Whole fruit w/o stone Thiacloprid-amide: Whole Fruit w/o stone
1 3 7 14 1 3 7 14
2.4, 2.3
(2.4) 2.3, 2.1
(2.2) 2.4, 2.3
(2.4) 1.7, 1.7
(1.7)
< 0.2, < 0.2 (< 0.2)
< 0.2, < 0.2 (< 0.2)
< 0.2, < 0.2 (< 0.2)
< 0.2, < 0.2 (< 0.2)
Anon. 2003
1 sampling before last application
Table 33. Thiacloprid residues resulting from foliar application to plums.
Application Analysis Location Year (variety)
Form kg ai/ha kg
ai/hL No Sample PHI Residues
Reference, Report No.
France Billy 2002 (Mirabelle de Nancy)
480 SC 0.1 0.0097 2 Fruit, whole 0 14
0.08 0.02
Schoening, R. and Billian, P. 2003a RA-2080/02
France Thillot 2003 (Mirabelle de Nancy)
480 SC 0.096 0.0096 2 Fruit, whole 01 0 4 10 14 18
0.03. 0.07 0.03 0.02 0.03 0.03
Schoening, R. and Billian, P. 2003a RA-2080/02
Germany Freinsheim 2000 (Auerbacher)
480 SC 0.11 0.0096 2 Fruit, whole 01 0 4 10 14 18
< 0.02 0.04 0.03
< 0.02 < 0.02 < 0.02
Schoening, R. 2001dRA-2126/00
France Saint Maurice 2000 (Dark Red Plum)
480 SC 0.16 0.015 2 Fruit, whole 01 0 4 10 13 17
0.02 0.08 0.03 0.02 0.02
< 0.02
Schoening, R. 2001dRA-2126/00
Germany Freinsheim 2000 (Cydimer)
480 SC 0.11 0.0096 2 Fruit, whole 0 14
0.02 < 0.02
Schoening, R. 2001dRA-2126/00
France Vieville 2000 (Dark Red Plum)
480 SC 0.14 0.014 2 Fruit, whole 0 13
0.11 0.05
Schoening, R. 2001dRA-2126/00
Germany Freinsheim 2001 (Cydimer)
480 SC 0.12 0.0096 2 Fruit, whole 0 14
0.03 < 0.02
Schoening, R. 2002aRA-2120/01

Thiacloprid 1047
Application Analysis Location Year (variety)
Form kg ai/ha kg
ai/hL No Sample PHI Residues
Reference, Report No.
Germany Freinsheim 2001 (Auerbacher)
480 SC 0.12 0.0096 2 Fruit, whole 01 0 4 10 14 18
< 0.02 0.05 0.04 0.02 0.03
< 0.02
Schoening, R. 2002aRA-2120/01
France Moissac 2001 (Prune d’Ente
480 SC 0.14 0.0096 2 Fruit, whole 0 15
0.03 0.02
Schoening, R. 2002bRA-212101
France Montauban 2001 (President)
480 SC 0.096 0.0096 2 Fruit, whole 01 0 4 10 14 18
< 0.02 < 0.02 < 0.02 < 0.02 < 0.02 < 0.02
Schoening, R. 2002bRA-2121/01
Spain St. Feliu de Llobregat 2000 (Black Goal)
480 SC 0.14 0.0096 2 Fruit, whole 0 4 11 14 19
0.06 0.04 0.03 0.02
< 0.02
Schoening, R. 2002cRA-2127/00
Spain St. Vincent dels Horts 2000 (Golden Japan)
480 SC 0.14 0.0096 2 Fruit, whole 0 14
0.04 0.02
Schoening, R. 2002cRA-2127/00
France Montauban 2000 (President)
480 SC 0.096 0.0096 2 Fruit, whole 01 0 4 10 14 18
< 0.02 < 0.02 < 0.02 < 0.02 < 0.02 < 0.02
Schoening, R. 2002cRA-2127/00
France Orgueil 2000 (President)
480 SC 0.096 0.0096 2 Fruit, whole 0 14
0.02 < 0.02
Schoening, R. 2002cRA-2127/00
USA California 2001 (Casselman)
480 SC 0.29 0.046 2 Fruit, w/o stone Fruit, dried w/o stone
15 29 15 29
0.03, < 0.02 (0.03) < 0.02, < 0.02
(< 0.02)
0.05, 0.05 (0.05)
0.05, 0.08 (0.07)
Dorschner, K. W. 2002a 200509
USA California 2001 (Black Beaut)
480 SC 0.29 0.012 2 Fruit, w/o stone 14 28
< 0.02, < 0.02
(< 0.02) < 0.02, < 0.02
(< 0.02)
Dorschner, K. W. 2002a 200509
USA California 2001 (Angeleno)
480 SC 0.28 0.012 2 Fruit, w/o stone 14 28
< 0.02, < 0.02
(< 0.02) < 0.02, < 0.02
(< 0.02)
Dorschner, K. W. 2002a 200509
USA California 2001 (French)
480 SC 0.28 0.014 2 Fruit, w/o stone 14 28
0.03, 0.03 (0.03)
0.03, 0.03 (0.03)
Dorschner, K. W. 2002a 200509

1048 Thiacloprid
Application Analysis Location Year (variety)
Form kg ai/ha kg
ai/hL No Sample PHI Residues
Reference, Report No.
USA Michigan 2001 (Early Golden)
480 SC 0.28 0.060 2 Fruit, w/o stone 0 7 14 28 33
0.06, 0.04 (0.05)
0.08, 0.06 (0.07) < 0.02,
0.03 (0.03) 0.03, 0.03
(0.03) < 0.02,
0.02 (0.02)
Dorschner, K. W. 2002a 200509
USA Oregon 2001 (Brooks)
480 SC 0.28 0.069 2 Fruit, w/o stone 15 26
< 0.02, < 0.02 (< 0.02) < 0.02, < 0.02
(< 0.02)
Dorschner, K. W. 2002a 200509
Japan, Nagano 2001 (Ohishiwase)
30 WG 0.6 0.015 3 Thiacloprid: Whole fruit w/o stone Thiacloprid/amide: Whole Fruit w/o stone
01 7 14 21 01 7 14 21
< 0.01, < 0.01,
< 0.0052, < 0.0052 (< 0.005)
0.06, 0.05, 0.032, 0.032
(0.04)
0.02, 0.02, 0.022, 0.022
(0.02)
0.06, 0.06, 0.022, 0.022
(0.04)
< 0.01, < 0.01
< 0.012, < 0.012 (< 0.01)
< 0.01, < 0.01, < 0.012, < 0.012 (< 0.01)
< 0.01, < 0.01, < 0.012, < 0.012 (< 0.01)
< 0.01, < 0.01, < 0.012, < 0.012 (< 0.01)
Anon. 1997ab, 1997ac, 1997ad, 1997ae

Thiacloprid 1049
Application Analysis Location Year (variety)
Form kg ai/ha kg
ai/hL No Sample PHI Residues
Reference, Report No.
Japan, Wakayama 2001 (Ohishiwase)
30 WG 0.6 0.015 3 Thiacloprid: Whole fruit Thiacloprid/amide: Whole Fruit
01 7 14 21 01 7 14 21
< 0.01, < 0.01,
< 0.0052, < 0.0052 (< 0.005)
0.11, 0.10, 0.072, 0.062
(0.09)
0.05, 0.05, 0.022, 0.022
(0.04)
0.06, 0.06, 0.042, 0.042
(0.05)
< 0.01, < 0.01, < 0.012, < 0.012 (< 0.01)
< 0.01, < 0.01, < 0.012, < 0.012 (< 0.01)
< 0.01, < 0.01, < 0.012, < 0.012 (< 0.01)
< 0.01, < 0.01, < 0.012, < 0.012 (< 0.01)
Anon. 1997ab, 1997ac, 1997ad, 1997ae
1 sampling before last application 2 replicate analysis
Berries and other small fruits
Table 34. Thiacloprid residues resulting from foliar application to grapes (glasshouse use).
Application Analysis Location Year (variety)
Form kg ai/ha kg
ai/hL No Sample PHI Residues
Reference, Report No.
Japan, Ishikawa 2002 (Delaware)
WG, 30 0.6 0.015 2 Thiacloprid: Berries
01 21
< 0.02, < 0.02, < 0.022, < 0.022 (< 0.02)
0.96, 0.94, 0.642, 0.642
(0.80)
Anon. 2002c, 2002d

1050 Thiacloprid
Application Analysis Location Year (variety)
Form kg ai/ha kg
ai/hL No Sample PHI Residues
Reference, Report No.
Thiacloprid-amide: Berries
28 42 01 21 28 42
0.67, 0.66, 0.532, 0.532
(0.60) 0.90, 0.88, 0.562, 0.542
(0.72)
< 0.02, < 0.02, < 0.022, < 0.022 (< 0.02) < 0.02, < 0.02, < 0.022, < 0.022 (< 0.02) < 0.02, < 0.02, < 0.022, < 0.022 (< 0.02) < 0.02, < 0.02, < 0.022, < 0.022 (< 0.02)
Japan, Osaka 2002 (Delaware)
WG, 30 0.6 0.015 2 Thiacloprid: Berries Thiacloprid-amide: Berries
01 21 28 49 01 21 28 42
< 0.02, < 0.02, < 0.022, < 0.022 (< 0.02) 1.9, 1.9, 1.42, 1.32
(1.6) 1.8, 1.8, 1.52, 1.42
(1.6) 1.3, 1.3,
0.852, 0.832 (1.1)
< 0.02, < 0.02, < 0.022, < 0.022 (< 0.02) < 0.02, < 0.02, < 0.022, < 0.022 (< 0.02) < 0.02, < 0.02, < 0.022, < 0.022 (< 0.02) < 0.02, < 0.02, < 0.022, < 0.022
(< 0.02)
Anon. 2002c, 2002d

Thiacloprid 1051
Application Analysis Location Year (variety)
Form kg ai/ha kg
ai/hL No Sample PHI Residues
Reference, Report No.
Japan, Nagano 2002 (Kyoho)
WG, 30 0.6 0.015 2 Thiacloprid: Berries Thiacloprid-amide: Berries
01 21 28 42 01 21 28 42
< 0.02, < 0.02, < 0.022, < 0.022 (< 0.02)
0.46, 0.43, 0.272, 0.262
(0.36) 0.45, 0.44, 0.452, 0.432
(0.44) 0.37, 0.37, 0.262, 0.262
(0.32)
< 0.02, < 0.02, < 0.022, < 0.022 (< 0.02) < 0.02, < 0.02, < 0.022, < 0.022 (< 0.02) < 0.02, < 0.02, < 0.022, < 0.022 (< 0.02) < 0.02, < 0.02, < 0.022, < 0.022 (< 0.02)
Anon. 2002a, 2002b
Japan, Kyoto 2002 (Pione)
WG, 30 0.6 0.015 2 Thiacloprid: Berries Thiacloprid-amide: Berries
01 21 29 42 01 21 29
< 0.02, < 0.02, < 0.022, < 0.022 (< 0.02)
0.11, 0.11, 0.072, 0.072
(0.09) 0.06, 0.06, 0.052, 0.052
(0.06) 0.12, 0.12, 0.132, 0.122
(0.12)
< 0.02, < 0.02, < 0.022, < 0.022 (< 0.02) < 0.02, < 0.02, < 0.022, < 0.022 (< 0.02) < 0.02,
Anon. 2002a, 2002b
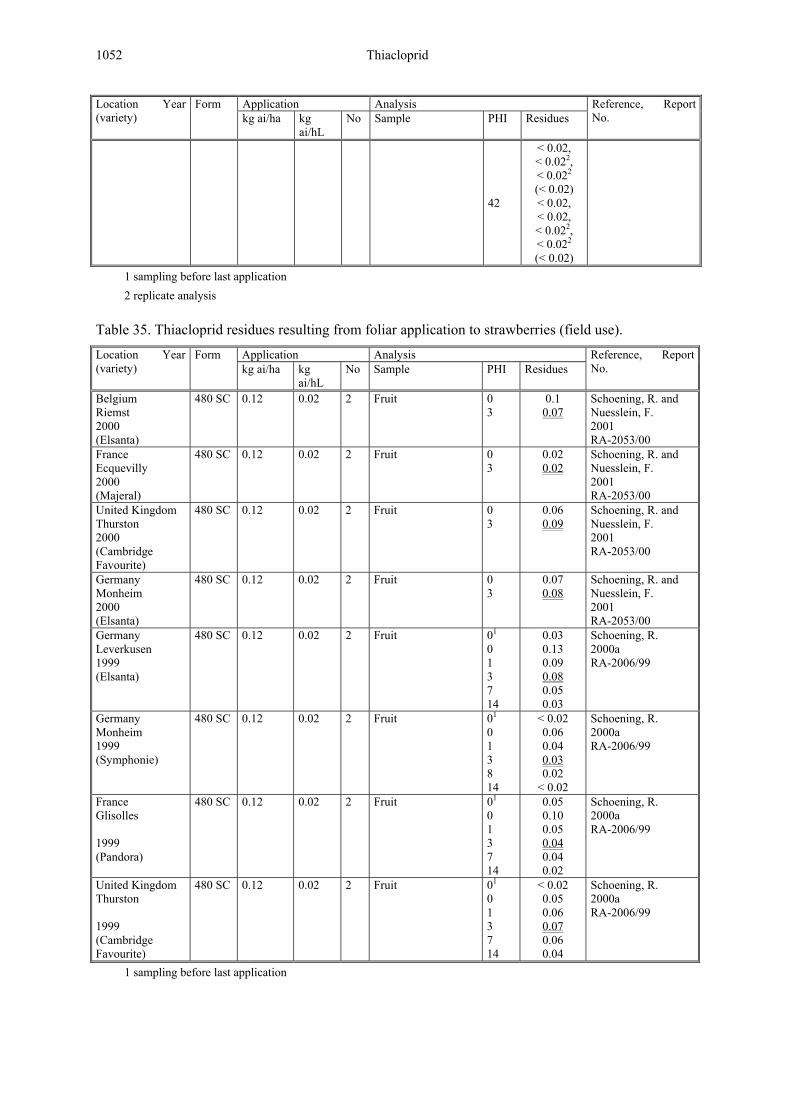
1052 Thiacloprid
Application Analysis Location Year (variety)
Form kg ai/ha kg
ai/hL No Sample PHI Residues
Reference, Report No.
42
< 0.02, < 0.022, < 0.022 (< 0.02) < 0.02, < 0.02, < 0.022, < 0.022 (< 0.02)
1 sampling before last application 2 replicate analysis
Table 35. Thiacloprid residues resulting from foliar application to strawberries (field use).
Application Analysis Location Year (variety)
Form kg ai/ha kg
ai/hL No Sample PHI Residues
Reference, Report No.
Belgium Riemst 2000 (Elsanta)
480 SC 0.12 0.02 2 Fruit 0 3
0.1 0.07
Schoening, R. and Nuesslein, F. 2001 RA-2053/00
France Ecquevilly 2000 (Majeral)
480 SC 0.12 0.02 2 Fruit 0 3
0.02 0.02
Schoening, R. and Nuesslein, F. 2001 RA-2053/00
United Kingdom Thurston 2000 (Cambridge Favourite)
480 SC 0.12 0.02 2 Fruit 0 3
0.06 0.09
Schoening, R. and Nuesslein, F. 2001 RA-2053/00
Germany Monheim 2000 (Elsanta)
480 SC 0.12 0.02 2 Fruit 0 3
0.07 0.08
Schoening, R. and Nuesslein, F. 2001 RA-2053/00
Germany Leverkusen 1999 (Elsanta)
480 SC 0.12 0.02 2 Fruit 01 0 1 3 7 14
0.03 0.13 0.09 0.08 0.05 0.03
Schoening, R. 2000a RA-2006/99
Germany Monheim 1999 (Symphonie)
480 SC 0.12 0.02 2 Fruit 01 0 1 3 8 14
< 0.02 0.06 0.04 0.03 0.02
< 0.02
Schoening, R. 2000a RA-2006/99
France Glisolles 1999 (Pandora)
480 SC 0.12 0.02 2 Fruit 01 0 1 3 7 14
0.05 0.10 0.05 0.04 0.04 0.02
Schoening, R. 2000a RA-2006/99
United Kingdom Thurston 1999 (Cambridge Favourite)
480 SC 0.12 0.02 2 Fruit 01 0 1 3 7 14
< 0.02 0.05 0.06 0.07 0.06 0.04
Schoening, R. 2000a RA-2006/99
1 sampling before last application

Thiacloprid 1053
Table 36. Thiacloprid residues resulting from foliar application to strawberries (greenhouse use).
Application Analysis Location Year (variety)
Form kg ai/ha kg
ai/hL No Sample PHI Residues
Reference, Report No.
Germany Telgte 2002 (Elsanta)
480 SC 0.12 0.012 2 Fruit 0 1 3
0.34 0.31 0.25
Schoening, R. and Billian, P. 2003b RA-2081/02
Germany Bocholt 2002 (Elsanta)
480 SC 0.12 0.012 2 Fruit 0 1 3
0.34 0.33 0.21
Schoening, R. and Billian, P. 2003b RA-2081/02
Netherlands Wognum 2002 (Elsanta)
480 SC 0.12 0.012 2 Fruit 01 0 1 3 7
0.07 0.13 0.12 0.12 0.13
Schoening, R. and Billian, P. 2003b RA-2081/02
Netherlands Wognum 2002 (Polka)
480 SC 0.12 0.012 2 Fruit 01 0 1 3 7
0.13 0.26 0.31 0.27 0.31
Schoening, R. and Billian, P. 2003b RA-2081/02
Italy Francolino 2002 (Marmolada)
480 SC 0.12 0.012 2 Fruit 0 1 3
0.05 < 0.02 0.04
Schoening, R. and Billian, P. 2003b RA-2081/02
Spain Sant Pol de Mar 2002 (Aromas)
480 SC 0.12 0.012 2 Fruit 0 1 3
0.20 0.19 0.22
Schoening, R. and Billian, P. 2003b RA-2081/02
Spain Calella 2002 (Diamante)
480 SC 0.12 0.012 2 Fruit 01 0 1 3 7
0.12 0.39 0.31 0.23 0.25
Schoening, R. and Billian, P. 2003b RA-2081/02
France Reynies 2002 (Gariguette)
480 SC 0.12 0.012 2 Fruit 01 0 1 3 7
0.04 0.06 0.05 0.05 0.04
Schoening, R. and Billian, P. 2003b RA-2081/02
Japan, Saitama 1997 (Nyohou)
30 WG 0.15 0.0075 2 Thiacloprid: Whole fruit Thiacloprid/amide: Whole Fruit
01 1 3 7 01
< 0.005, < 0.005, < 0.0052, < 0.0052 (< 0.005)
0.41, 0.41, 0.342
, 0.342 (0.38)
0.38, 0.35, 0.312, 0.282
(0.33) 0.24, 0.23, 0.192, 0.182
(0.21)
< 0.005, < 0.005, < 0.0052, < 0.0052 (< 0.005)
Anon. 1996d, 1996e, 1996f, 1996g

1054 Thiacloprid
Application Analysis Location Year (variety)
Form kg ai/ha kg
ai/hL No Sample PHI Residues
Reference, Report No.
1 3 7
< 0.005, < 0.005, < 0.0052, < 0.0052
(< 0.005) < 0.005, < 0.005, < 0.0052, < 0.0052 (< 0.005) < 0.005, < 0.005, < 0.0052, < 0.0052 (< 0.005)
Japan, Mie 1997 (Nyohou)
30 WG 0.15 0.0075 2 Thiacloprid: Whole fruit Thiacloprid/amide: Whole Fruit
01 1 3 7 01 1 3 7
< 0.005, < 0.005, < 0.0052, < 0.0052 (< 0.005)
0.81, 0.80, 0.692
, 0.682 (0.75)
0.59, 0.52, 0.722, 0.692
(0.63) 0.53, 0.50, 0.472, 0.472
(0.49)
< 0.005, < 0.005, < 0.0052, < 0.0052 (< 0.005) < 0.005, < 0.005, < 0.0052, < 0.0052 (< 0.005) < 0.005, < 0.005, < 0.0052, < 0.0052 (< 0.005) < 0.005, < 0.005, < 0.0052, < 0.0052 (< 0.005)
Anon. 1996d, 1996e, 1996f, 1996g
1 sampling before last application 2 replicate analysis

Thiacloprid 1055
Table 37. Thiacloprid residues resulting from foliar application to currants.
Application Analysis Location Year (variety)
Form kg ai/ha kg
ai/hL No Sample PHI Residues
Reference, Report No.
Germany Burscheid 2000 (Rofet)
480 SC 0.12 0.012 3 Fruit 01 0 1 3 7 14
0.10 0.28 0.23 0.21 0.13 0.08
Schoening, R. and Nuesslein, F. 2001a RA-2054/00
Belgium Pringen 2000 (Tsema)
480 SC 0.12 0.012 3 Fruit 01 0 1 3 7 14
0.21 0.38 0.39 0.35 0.32 0.32
Schoening, R. and Nuesslein, F. 2001a RA-2054/00
Germany Monheim 2000 (Red Lake)
480 SC 0.12 0.012 3 Fruit 01 0 1 3 7 13
0.35 0.91 0.73 0.59 0.39 0.32
Schoening, R. and Nuesslein, F. 2001a RA-2054/00
United Kingdom Thurston 2000 (Ben Tirran)
480 SC 0.12 0.012 3 Fruit 01 0 1 3 7 14
0.06 0.13 0.12 0.19 0.28 0.13
Schoening, R. and Nuesslein, F. 2001a RA-2054/00
Belgium Meeffe 2001 (Rovada)
480 SC 0.12 0.012 3 Fruit 0 3
0.19 0.16
Schoening, R. 2002d RA-2111/01
United Kingdom Thurston 2001 (Ben Tirran)
480 SC 0.12 0.012 3 Fruit 0 3
0.43 0.37
Schoening, R. 2002d RA-2111/01
Germany Burscheid 2001 (Rovada)
480 SC 0.12 0.012 3 Fruit 0 3
0.24 0.21
Schoening, R. 2002d RA-2111/01
Germany Burscheid 2001 (Titania)
480 SC 0.12 0.012 3 Fruit 0 3
0.19 0.08
Schoening, R. 2002d RA-2111/01
1 sampling before last application
Table 38. Thiacloprid residues resulting from foliar application to raspberries.
Application Analysis Location Year (variety)
Form kg ai/ha kg
ai/hL No Sample PHI Residues
Reference, Report No.
Germany Wachtberg-Niederbachem 2001 (Resa)
480 SC 0.12 0.012 3 Fruit 01 0 1 3 7 14
< 0.02 0.34 0.37 0.15 0.09 0.05
Heinemann, O. and Schoening, R. 2002 RA-2133/01
Germany Monheim 2001 (Schoenemann)
480 SC 0.12 0.012 3 Fruit 01 0 1 3 7 14
0.12 0.81 0.88 0.10 0.08 0.06
Heinemann, O. and Schoening, R. 2002 RA-2133/01

1056 Thiacloprid
Application Analysis Location Year (variety)
Form kg ai/ha kg
ai/hL No Sample PHI Residues
Reference, Report No.
United Kingdom Thurston 2001 (Malling Jewel)
480 SC 0.12 0.12 0.16
0.012 0.012 0.016
3 Fruit 01 0 1 3 7 14
0.10 0.55 0.50 0.31 0.17 0.08
Heinemann, O. and Schoening, R. 2002 RA-2133/01
United Kingdom East Malling 2001 (Ample)
480 SC 0.12 0.012 3 Fruit 01 0 1 3 7 14
0.04 0.29 0.31 0.27 0.19 0.09
Heinemann, O. and Schoening, R. 2002 RA-2133/01
Germany Burscheid 2002 (Winklers Sämling)
480 SC 0.12 0.012 3 Fruit 0 3
0.76 0.62
Schoening, R. and Billian, P. 2003c RA-2082/02
Germany Monheim 2002 (Schoenemann)
480 SC 0.12 0.012 3 Fruit 0 3
0.36 0.34
Schoening, R. and Billian, P. 2003c RA-2082/02
United Kingdom Thurston 2002 (Malling Jewel)
480 SC 0.12 0.012 3 Fruit 0 3
0.49 0.34
Schoening, R. and Billian, P. 2003c RA-2082/02
United Kingdom East Malling 2002 (Ample)
480 SC 0.12 0.012 3 Fruit 0 3
0.27 0.15
Schoening, R. and Billian, P. 2003c RA-2082/02
1 sampling before last application
Tropical fruits – inedible peel
Table 39. Thiacloprid residues resulting from foliar application to kiwi fruits.
Application Analysis Location Year (variety)
Form kg ai/ha kg
ai/hL No Sample PHI Residues
Reference, Report No.
New Zealand Ramarama 2002 (Hayward)
480 SC 0.096 0.0048 1 Fruit 56 84 112 140 184
< 0.02 < 0.02 < 0.02 < 0.02 < 0.02
Clay, S. 2003a LabGLP75
New Zealand Ramarama 2002 (Hayward)
480 SC 0.096 0.0048 2 Fruit 56 84 112 140 184
< 0.02 < 0.02 < 0.02 < 0.02 < 0.02
Clay, S. 2003a LabGLP75
New Zealand Ramarama 2002 (Hayward)
480 SC 0.14 0.0072 1 Fruit 56 84 112 140 184
< 0.02 < 0.02 < 0.02 < 0.02 < 0.02
Clay, S. 2003a LabGLP75

Thiacloprid 1057
Application Analysis Location Year (variety)
Form kg ai/ha kg
ai/hL No Sample PHI Residues
Reference, Report No.
New Zealand Silvervale 2002 (Hayward)
480 SC 0.1 0.0096 2 Fruit 56 63 70 79 117
< 0.02 < 0.02 < 0.02 < 0.02 < 0.02
Clay, S. 2003a LabGLP75
New Zealand Silvervale 2002 (Hayward)
480 SC 0.15 0.014 2 Fruit 56 63 70 79 177
< 0.02 < 0.02 < 0.02 < 0.02 < 0.02
Clay, S. 2003a LabGLP75
New Zealand Silvervale 2002 (Hayward)
480 SC 0.1 0.0096 1 Fruit 56 63 70 79 177
0.04 0.03
< 0.02 < 0.02 < 0.02
Clay, S. 2003a LabGLP75
New Zealand Brightwater 2002 (Hayward)
480 SC 0.096 0.0096 1 Fruit 56 63 70 78 84 173
0.03 < 0.02 < 0.02 < 0.02 < 0.02 < 0.02
Clay, S. 2003a LabGLP75
New Zealand Brightwater 2002 (Hayward)
480 SC 0.096 0.0096 2 Fruit 56 63 70 78 84 173
0.06 0.02
< 0.02 < 0.02 < 0.02 < 0.02
Clay, S. 2003a LabGLP75
New Zealand T.McCormack 2003 (Hayward)
480 SC 0.19 0.19
0.00960.013
2 Fruit 49 57 64 70 77 83
0.10 < 0.02 < 0.02 < 0.02 < 0.02 < 0.02
Clay, S. 2004 LabGLP104
New Zealand Te Puke 2003 (Hayward)
480 SC 0.19 0.19
0.00960.019
2 Fruit 49 56 63 70 84
< 0.02 < 0.02 < 0.02 < 0.02 < 0.02
Clay, S. 2004 LabGLP104
New Zealand Katikati 2003 (Hayward)
480 SC 0.19 0.19
0.00960.013
2 Fruit 48 57 63 70 76 85
0.03 < 0.02 < 0.02 < 0.02 < 0.02 < 0.02
Clay, S. 2004 LabGLP104
New Zealand Gisborne 2003 (Hayward)
480 SC 0.19 0.0096 2 Fruit 49 56 63 70 77 84
0.10 0.05
< 0.02 < 0.02 < 0.02 < 0.02
Clay, S. 2004 LabGLP104
New Zealand Makatu 2003 (Zespri Gold)
480 SC 0.096 0.12
0.0096 2 Fruit 63 70 77 84 91
< 0.02 < 0.02 < 0.02 < 0.02 < 0.02
Clay, S. 2004 LabGLP104
New Zealand Makatu 2003 (Zespri Gold)
480 SC 0.14 0.17
0.014 2 Fruit 63 70 77 84 91
< 0.02 < 0.02 < 0.02 < 0.02 < 0.02
Clay, S. 2004 LabGLP104

1058 Thiacloprid
Application Analysis Location Year (variety)
Form kg ai/ha kg
ai/hL No Sample PHI Residues
Reference, Report No.
New Zealand Appleby 2003 (Hayward)
480 SC 0.19 0.0096 2 Fruit 70 77 84 91 98 105
< 0.02 < 0.02 < 0.02 < 0.02 < 0.02 < 0.02
Clay, S. 2004 LabGLP104
New Zealand Appleby 2003 (Hayward)
480 SC 0.19 0.0096 2 Fruit 49 56 63 70 77 84
< 0.02 < 0.02 < 0.02 < 0.02 < 0.02 < 0.02
Clay, S. 2004 LabGLP104
Bulb vegetables
Table 40. Thiacloprid residues resulting from foliar application to onions.
Application Analysis Location Year (variety)
Form kg ai/ha kg
ai/hL No Sample PHI Residues
Reference, Report No.
Brazil Sta. Inacia 1998 (Taqui / Superex)
480 SC 0.096 0.024 4 Bulb 21 < 0.02 Lancas, F. M. 1998b M-005335-01-2
Brazil Sta. Inacia 1998 (Taqui / Superex)
480 SC 0.19 0.048 4 Bulb 21 0.04 Lancas, F. M. 1998b M-005335-01-2
Germany Schifferstadt 2004 (Elody)
480 SC 0.11 0.24 3 bulb 21 28
< 0.01 < 0.01
Schoening, R. 2005 MR-068/05
Germany Schifferstadt 2004 (Elody)
480 SC 0.1 0.096 0.096
0.016 3 Bulb 0 7 10 14
0.55 0.06 0.03 0.02
Schoening, R. 2005 MR-068/05
Germany Schifferstadt 2004 (Elody)
480 SC 0.096 0.016 3 Bulb 0 7 10 14
0.69 0.05 0.03 0.03
Schoening, R. 2005 MR-068/05
Germany Aholming 2004 (BGS 194)
480 SC 0.096 0.024 3 bulb 21 28
< 0.01 < 0.01
Schoening, R. 2005 MR-068/05
Table 41. Thiacloprid residues resulting from foliar application to garlic.
Application Analysis Location Year (variety)
Form kg ai/ha kg
ai/hL No Sample PHI Residues
Reference, Report No.
Brazil Fazenda Riberao 1998 (Lavinia)
480 SC 0.14 0.036 3 Bulb 21 0.12 Lancas, F. M. 1998c M-005328-01-2
Brazil Fazenda Riberao 1998 (Lavinia)
480 SC 0.29 0.072 3 Bulb 21 0.2 Lancas, F. M. 1998c M-005328-01-2

Thiacloprid 1059
Fruiting vegetables
Table 42. Thiacloprid residues resulting from foliar application to eggplants (glasshouse use).
Application Analysis Location Year (variety)
Form kg ai/ha kg
ai/hL No Sample PHI Residues
Reference, Report No.
Japan, Kochi 2001 (Ryuma)
WG, 30 0.3 0.015 3 Thiacloprid: Whole fruit Thiacloprid-amide: Whole Fruit
01 1 3 7 01 1 3 7
< 0.005, < 0.005, < 0.0052, < 0.0052 (< 0.005)
0.44, 0.42, 0.342, 0.332
(0.38) 0.24, 0.22, 0.302, 0.302
(0.27) 0.1, 0.06, 0.12, 0.12
(0.09)
< 0.005, < 0.005, < 0.0052, < 0.0052
(< 0.005) < 0.005, < 0.005, < 0.0052, < 0.0052 (< 0.005) < 0.005, < 0.005, < 0.0052, < 0.0052 (< 0.005) < 0.005, < 0.005,
< 0.0052, < 0.0052 (< 0.005)
Anon. 2001, 2001a
Japan, Miyazaki 2001 (Kokuyou)
WG, 30 0.3 0.015 3 Thiacloprid: Whole fruit Thiacloprid-amide: Whole Fruit
01 1 3 7 01
< 0.005, < 0.005, < 0.0052, < 0.0052 (< 0.005)
0.27, 0.26, 0.292, 0.282
(0.28) 0.24, 0.23, 0.222, 0.212
(0.23) 0.15, 0.14, 0.162, 0.162
(0.15)
< 0.005, < 0.005, < 0.0052, < 0.0052
Anon. 2001, 2001a

1060 Thiacloprid
Application Analysis Location Year (variety)
Form kg ai/ha kg
ai/hL No Sample PHI Residues
Reference, Report No.
1 3 7
(< 0.005) < 0.005, < 0.005, < 0.0052, < 0.0052 (< 0.005) < 0.005, < 0.005, < 0.0052, < 0.0052 (< 0.005) < 0.005, < 0.005, < 0.0052, < 0.0052 (< 0.005)
1 sampling before last application 2 replicate analysis
Table 43. Thiacloprid residues resulting from foliar application to cucumbers (field use).
Application Analysis Location Year (variety)
Form kg ai/ha kg
ai/hL No Sample PHI Residues
Reference, Report No.
Germany Vetschau 2004 (Dolomit)
480 SC 0.10 0.098
0.033 2 Fruit 3 0.03 Schoening, R. 2005a MR-067/05
Germany Vetschau 2004 (Dolomit)
480 SC 0.10 0.11
0.035 2 Fruit 3 0.02 Schoening, R. 2005a MR-067/05
Germany Aholming 2004 (Melody)
480 SC 0.096 0.024 2 Fruit 0 3 5
0.03 0.02 0.02
Schoening, R. 2005a MR-067/05
Germany Niederhausen 2004 (Dirigent)
480 SC 0.096 0.024 2 Fruit 0 3 5
0.02 0.02 0.01
Schoening, R. 2005a MR-067/05
Spain Cabrera de Mar 1995 (Dasher II)
480 SC 0.12 0.012 3 Fruit 01 0 3 7 9
0.02 0.12 0.03 0.02
< 0.02
Placke, F. J. 1997g RA-2066/95
Italy Borgo Piave 1995 (Hyeld)
480 SC 0.12 0.012 3 Fruit 01 0 3 7 10
< 0.02 0.05 0.03
< 0.02 < 0.02
Placke, F. J. 1997g RA-2066/95
Italy Comiso 1995 (Galo F1)
480 SC 0.12 0.012 3 Fruit 01 0 3 7 10
0.02 0.16 0.10 0.03
< 0.02
Placke, F. J. 1997g RA-2066/95
Spain Viladecans 1995 (Dasher II)
480 SC 0.12 0.012 3 Fruit 01 0 3 7 9
0.02 0.05 0.02 0.02
< 0.02
Placke, F. J. 1997g RA-2066/95

Thiacloprid 1061
Application Analysis Location Year (variety)
Form kg ai/ha kg
ai/hL No Sample PHI Residues
Reference, Report No.
Spain Cabrera de Mar 1996 (Dasher)
480 SC 0.14 0.014 3 Fruit 01 0 1 3 7
0.02 0.08 0.11 0.08
< 0.02
Placke, F. J. 1997h RA-2116/96
Italy Fondi 1996 (Hyeld)
480 SC 0.14 0.014 3 Fruit 01 0 1 3 7
< 0.02 0.04 0.04 0.02
< 0.02
Placke, F. J. 1997h RA-2116/96
Italy Borgo Piave 1996 (Hyeld)
480 SC 0.14 0.014 3 Fruit 01 0 1 3 7
< 0.02 0.03 0.03 0.02
< 0.02
Placke, F. J. 1997h RA-2116/96
Spain Gava 1996 (Dasher)
480 SC 0.14 0.014 3 Fruit 01 0 1 3 7
0.04 0.12 0.14 0.08 0.03
Placke, F. J. 1997h RA-2116/96
1 sampling before last application
Table 44. Thiacloprid residues resulting from foliar application to cucumbers (greenhouse use).
Application Analysis Location Year (variety)
Form kg ai/ha kg
ai/hL No Sample PHI Residues
Reference, Report No.
Germany Leichlingen 1999 (Indira)
480 SC 0.22 0.014 3 Fruit 01 0 1 3 7
0.04 0.13 0.12 0.08 0.04
Schoening, R. 2000a RA-2134/99
Germany Leichlingen 1999 (Indira)
480 SC 0.22 0.014 3 Fruit 01 0 1 3 7
0.03 0.08 0.10 0.07 0.04
Schoening, R. 2000a RA-2134/99
Belgium Brecht 1999 (Korinda)
480 SC 0.22 0.014 3 Fruit 01 0 1 3 7
0.02 0.14 0.12 0.08 0.03
Schoening, R. 2000a RA-2134/99
Netherlands HS Tholen 1999 (Flamingo)
480 SC 0.22 0.20 0.22
0.014 3 Fruit 01 0 1 3 7
0.02 0.05 0.07 0.04 0.02
Schoening, R. 2000a RA-2134/99
Greece Vasilika 1996 (Venus)
480 SC 0.22 0.014 3 Fruit 01 0 1 3 7
0.06 0.18 0.17 0.12 0.05
Placke, F. J. 1997i RA-2117/96
Italy Pozzo Ribaudo 1996 (Sprint)
480 SC 0.22 0.014 3 Fruit 01 0 1 3 7
0.04 0.13 0.11 0.08 0.04
Placke, F. J. 1997i RA-2117/96
Italy Fondi 1996 (Hyeld)
480 SC 0.22 0.014 3 Fruit 01 0 1 3 7
0.03 0.12 0.10 0.07 0.03
Placke, F. J. 1997i RA-2117/96

1062 Thiacloprid
Application Analysis Location Year (variety)
Form kg ai/ha kg
ai/hL No Sample PHI Residues
Reference, Report No.
Spain Ruescas 1996 (Alaska)
480 SC 0.22 0.014 3 Fruit 01 0 1 3 7
0.07 0.25 0.18 0.15 0.09
Placke, F. J. 1997i RA-2117/96
France Avignon 1996 (Aramon)
480 SC 0.22 0.014 3 Fruit 01 0 1 3 7
0.02 0.08 0.08 0.04 0.05
Placke, F. J. 1997i RA-2117/96
Italy Bosco Braccetto 1996 (Sprint)
480 SC 0.22 0.014 3 Fruit 01 0 1 3 7
0.05 0.08 0.09 0.08 0.05
Placke, F. J. 1997i RA-2117/96
Spain Ruescas 1996 (Alaska)
480 SC 0.22 0.014 3 Fruit 01 0 1 3 7
0.09 0.23 0.20 0.15 0.07
Placke, F. J. 1997i RA-2117/96
Spain Ruescas 1996 (Virginia)
480 SC 0.22 0.014 3 Fruit 01 0 1 3 7
0.08 0.26 0.26 0.18 0.07
Placke, F. J. 1997i RA-2117/96
1 sampling before last application
Table 45. Thiacloprid residues resulting from foliar application to melons (field use).
Application Analysis Location Year (variety)
Form kg ai/ha kg
ai/hL No Sample PHI Residues
Reference, Report No.
Greece Larisa 1995 (Midi Star)
480 SC 0.12 0.012 3 Peel Pulp Whole fruit2
01 0 3 7 10 01 0 3 7 10 01 0 3 7 10
0.03 0.08 0.02 0.02
< 0.02
< 0.02 < 0.02 < 0.02 < 0.02 < 0.02
< 0.02 0.04
< 0.02 < 0.02 < 0.02
Placke, F. J. 1997j RA-2061/95
Italy Trinitapoli 1995 (Leglend)
480 SC 0.12 0.012 3 Peel Pulp Whole fruit2
01 0 3 7 10 01 0 3 7 10 01
0.02 0.23 0.08 0.05
< 0.02
< 0.02 < 0.02 < 0.02 < 0.02 < 0.02
< 0.02
Placke, F. J. 1997j RA-2061/95

Thiacloprid 1063
Application Analysis Location Year (variety)
Form kg ai/ha kg
ai/hL No Sample PHI Residues
Reference, Report No.
0 3 7 10
0.09 0.03 0.02
< 0.02 Greece Larisa 1996 (Gold Star F1)
480 SC 0.14 0.014 3 Whole fruit Peel Pulp Whole fruit2
01 0 1 3 7 3 7 3 7
0.04 0.05 0.06
0.36 0.28
< 0.02 < 0.02
0.06 0.04
Placke, F. J. 1997k RA-2118/96
Italy Lequile 1996 (Galia)
480 SC 0.14 0.014 3 Whole fruit Peel Pulp Whole fruit2
01 0 1 3 7 3 7 3 7
0.03 0.06 0.06
0.23 0.23
< 0.02 < 0.02
0.06 0.06
Placke, F. J. 1997k RA-2118/96
France Verlhac7Tescou 2000 (Figaro)
480 SC 0.14 0.014 3 Whole fruit Peel Pulp
0 3 3 3
0.07 0.05
0.13
< 0.02
Schoening, R. and Nuesslein, F. 2001b RA-2115/00
France Sarrians 2000 (Sirio)
480 SC 0.14 0.014 3 Whole fruit Peel Pulp
0 3 3 3
0.05 0.02
0.05
< 0.02
Schoening, R. and Nuesslein, F. 2001b RA-2115/00
1 sampling before last application 2 calculated
Table 46. Thiacloprid residues resulting from foliar application to melons (glasshouse use).
Application Analysis Location Year (variety)
Form kg ai/ha kg
ai/hL No Sample PHI Residues
Reference, Report No.
Japan, Ishikawa 1997 (Arlseseinunatu II)
WG, 30 0.38 0.015 3 Thiacloprid: Pulp
01 1 3
< 0.005, < 0.005, < 0.0052, < 0.0052 (< 0.005) < 0.005, < 0.005, < 0.0052, < 0.0052 (< 0.005) < 0.005, < 0.005, < 0.0052, < 0.0052 (< 0.005)
Anon. 1997d, 1997e, 1997f, 1997g

1064 Thiacloprid
Application Analysis Location Year (variety)
Form kg ai/ha kg
ai/hL No Sample PHI Residues
Reference, Report No.
6
< 0.005, < 0.005, < 0.0052, < 0.0052 (< 0.005)
Thiacloprid-amide: Pulp
01 1 3 6
< 0.005, < 0.005, < 0.0052, < 0.0052 (< 0.005) < 0.005, < 0.005, < 0.0052, < 0.0052 (< 0.005) < 0.005, < 0.005, < 0.0052, < 0.0052 (< 0.005) < 0.005, < 0.005, < 0.0052, < 0.0052 (< 0.005)
Japan, Aichi 1997 (Natsukei No. 15)
WG, 30 0.38 0.015 3 Thiacloprid: Pulp Thiacloprid-amide: Pulp
01 1 3 7 01 1 3
< 0.005, < 0.005, < 0.0052, < 0.0052 (< 0.005) < 0.005, < 0.005, < 0.0052, < 0.0052 (< 0.005) < 0.005, < 0.005, < 0.0052, < 0.0052 (< 0.005) < 0.005, < 0.005, < 0.0052, < 0.0052 (< 0.005)
< 0.005, < 0.005, < 0.0052, < 0.0052 (< 0.005) < 0.005, < 0.005, < 0.0052, < 0.0052 (< 0.005) < 0.005, < 0.005, < 0.0052, < 0.0052 (< 0.005)
Anon. 1997d, 1997e, 1997f, 1997g

Thiacloprid 1065
Application Analysis Location Year (variety)
Form kg ai/ha kg
ai/hL No Sample PHI Residues
Reference, Report No.
7
< 0.005, < 0.005, < 0.0052, < 0.0052 (< 0.005)
1 sampling before last application 2 replicate analysis
Table 47. Thiacloprid residues resulting from foliar application to watermelons (field use).
Application Analysis Location Year (variety)
Form kg ai/ha kg
ai/hL No Sample PHI Residues
Reference, Report No.
Greece Larisa 1995 (Crimson Sweet)
480 SC 0.12 0.012 3 Peel Pulp Whole fruit2
01 0 3 7 10 01 0 3 7 10 01 0 3 7 10
< 0.02 0.03
< 0.02 < 0.02 < 0.02
< 0.02 < 0.02 < 0.02 < 0.02 < 0.02
< 0.02 < 0.02 < 0.02 < 0.02 < 0.02
Placke, F. J. 1997j RA-2061/95
Spain Gavá 1995 (Super Sugarbaby)
480 SC 0.12 0.012 3 Peel Pulp Whole fruit2
01 0 3 7 10 01 0 3 7 10 01 0 3 7 10
0.04 0.07 0.03
< 0.02 < 0.02
< 0.02 < 0.02 < 0.02 < 0.02 < 0.02
< 0.02 0.03
< 0.02 < 0.02 < 0.02
Placke, F. J. 1997j RA-2061/95
Spain Gavá 1996 (Patanegra)
480 SC 0.14 0.014 3 Whole fruit Peel Pulp
01 0 1 3 7 3 7 3 7
< 0.02 < 0.02 < 0.02 < 0.02 < 0.02
< 0.02 < 0.02
< 0.02 < 0.02
Placke, F. J. 1997k RA-2118/96

1066 Thiacloprid
Application Analysis Location Year (variety)
Form kg ai/ha kg
ai/hL No Sample PHI Residues
Reference, Report No.
Spain La Almunia 1996 (Meridiam)
480 SC 0.14 0.014 3 Whole fruit Peel Pulp
01 0 1 3 7 3 7 3 7
0.03 0.08 0.07 0.06 0.06
0.10
< 0.02
< 0.02 < 0.02
Placke, F. J. 1997k RA-2118/96
1 sampling before last application 2 calculated
Table 48. Thiacloprid residues resulting from foliar application to watermelons (glasshouse use).
Application Analysis Location Year (variety)
Form kg ai/ha kg
ai/hL No Sample PHI Residues
Reference, Report No.
Japan, Ishikawa 2002 (Ajihimitsu)
30 WG 0.3 0.015 3 Thiacloprid: Pulp Thiacloprid-amide: Pulp
01 1 3 7 01 1 3 7
< 0.01, < 0.01, < 0.012, < 0.012 (< 0.01)
0.05, 0.04, 0.042, 0.042
(0.04) 0.1, 0.1,
0.092, 0.092 (0.1)
0.08, 0.07, 0.072, 0.072
(0.07)
< 0.01, < 0.01, < 0.012, < 0.012 (< 0.01) < 0.01, < 0.01, < 0.012, < 0.012 (< 0.01) < 0.01, < 0.01, < 0.012, < 0.012 (< 0.01) < 0.01, < 0.01, < 0.012, < 0.012 (< 0.01)
Anon. 2002f, 2002g
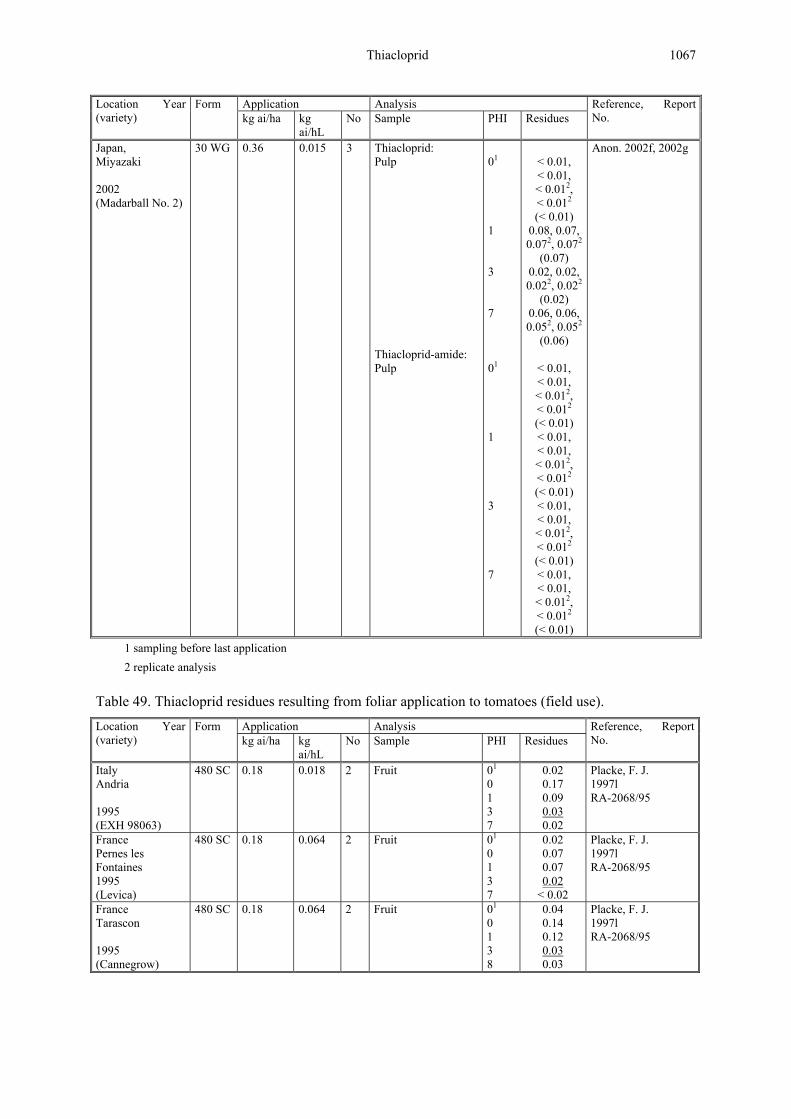
Thiacloprid 1067
Application Analysis Location Year (variety)
Form kg ai/ha kg
ai/hL No Sample PHI Residues
Reference, Report No.
Japan, Miyazaki 2002 (Madarball No. 2)
30 WG 0.36 0.015 3 Thiacloprid: Pulp Thiacloprid-amide: Pulp
01 1 3 7 01 1 3 7
< 0.01, < 0.01, < 0.012, < 0.012 (< 0.01)
0.08, 0.07, 0.072, 0.072
(0.07) 0.02, 0.02, 0.022, 0.022
(0.02) 0.06, 0.06, 0.052, 0.052
(0.06)
< 0.01, < 0.01, < 0.012, < 0.012 (< 0.01) < 0.01, < 0.01, < 0.012, < 0.012 (< 0.01) < 0.01, < 0.01, < 0.012, < 0.012 (< 0.01) < 0.01, < 0.01, < 0.012, < 0.012 (< 0.01)
Anon. 2002f, 2002g
1 sampling before last application 2 replicate analysis
Table 49. Thiacloprid residues resulting from foliar application to tomatoes (field use).
Application Analysis Location Year (variety)
Form kg ai/ha kg
ai/hL No Sample PHI Residues
Reference, Report No.
Italy Andria 1995 (EXH 98063)
480 SC 0.18 0.018 2 Fruit 01 0 1 3 7
0.02 0.17 0.09 0.03 0.02
Placke, F. J. 1997l RA-2068/95
France Pernes les Fontaines 1995 (Levica)
480 SC 0.18 0.064 2 Fruit 01 0 1 3 7
0.02 0.07 0.07 0.02
< 0.02
Placke, F. J. 1997l RA-2068/95
France Tarascon 1995 (Cannegrow)
480 SC 0.18 0.064 2 Fruit 01 0 1 3 8
0.04 0.14 0.12 0.03 0.03
Placke, F. J. 1997l RA-2068/95

1068 Thiacloprid
Application Analysis Location Year (variety)
Form kg ai/ha kg
ai/hL No Sample PHI Residues
Reference, Report No.
Italy Borgo Piave 1995 (Sunseed 6078)
480 SC 0.18 0.018 2 Fruit 01 0 1 3 7
0.03 0.08 0.06 0.05 0.05
Placke, F. J. 1997l RA-2068/95
Italy Giorio 1996 (Marmende)
480 SC 0.22 0.014 2 Fruit 0 3 7
0.14 0.12 0.16
Placke, F. J. 1997n RA-2122/96
France Les Valayans 1996 (Lerika)
480 SC 0.22 0.014 2 Fruit 0 3 7
0.06 0.04 0.02
Placke, F. J. 1997n RA-2122/96
France Tarascon 1996 (Cannegrow)
480 SC 0.22 0.014 2 Fruit 0 3 7
0.18 0.09 0.03
Placke, F. J. 1997n RA-2122/96
Italy Andria 1996 (Red Setter)
480 SC 0.14 0.014 2 Fruit 0 3 7
0.16 0.10 0.03
Placke, F. J. 1997n RA-2122/96
1 sampling before last application
Table 50. Thiacloprid residues resulting from foliar application to tomatoes (greenhouse use).
Application Analysis Location Year (variety)
Form kg ai/ha kg
ai/hL No Sample PHI Residues
Reference, Report No.
Germany Langenfeld-Reusrath 1995 (Hildares)
480 SC 0.18 0.012 3 Fruit 01 0 1 3 7
0.11 0.26 0.19 0.15 0.14
Placke, F. J. 1997m RA-2067/95
Germany Langenfeld-Reusrath 1995 (Piranto)
480 SC 0.18 0.012 3 Fruit 01 0 1 3 7
0.02 0.22 0.20 0.25 0.03
Placke, F. J. 1997m RA-2067/95
Spain La Redonda 1995 (Daniela)
480 SC 0.18 0.012 3 Fruit 01 0 1 3 7
0.16 0.15 0.25 0.18 0.12
Placke, F. J. 1997m RA-2067/95
Spain Ruescas 1995 (Billante)
480 SC 0.18 0.012 3 Fruit 01 0 1 3 7
0.08 0.28 0.20 0.14 0.19
Placke, F. J. 1997m RA-2067/95
Germany Langenfeld 1996 (Ferrari)
480 SC 0.22 0.014 3 Fruit 0 3 7
0.23 0.12 0.08
Placke, F. J. 1997o RA-2123/96
Germany Leichlingen 1996 (Panovy)
480 SC 0.22 0.014 3 Fruit 0 3 7
0.10 0.07 0.06
Placke, F. J. 1997o RA-2123/96
Spain Ruescas 1996 (Brillante)
480 SC 0.22 0.014 3 Fruit 0 3 7
0.22 0.24 0.29
Placke, F. J. 1997o RA-2123/96

Thiacloprid 1069
Application Analysis Location Year (variety)
Form kg ai/ha kg
ai/hL No Sample PHI Residues
Reference, Report No.
France Noves 1996 (Cecilia)
480 SC 0.22 0.014 3 Fruit 0 3 7
0.18 0.12 0.09
Placke, F. J. 1997o RA-2123/96
Japan, Nagano 1997 (Momotaro)
30 WG 0.38 0.015 3 Thiacloprid: Whole fruit Thiacloprid-amide: Whole Fruit
01 1 3 7 01 1 3 7
< 0.005, < 0.005, < 0.0052, < 0.0052 (< 0.005)
0.17, 0.16, 0.122, 0.112
(0.14) 0.15, 0.15, 0.112, 0.102
(0.13) 0.21, 0.21, 0.132, 0.122
(0.17)
< 0.005, < 0.005, < 0.0052, < 0.0052 (< 0.005) < 0.005, < 0.005, < 0.0052, < 0.0052 (< 0.005) < 0.005, < 0.005, < 0.0052, < 0.0052 (< 0.005) < 0.005, < 0.005, < 0.0052, < 0.0052 (< 0.005)
Anon. 1997x, 1997y, 1997z, 1997aa

1070 Thiacloprid
Application Analysis Location Year (variety)
Form kg ai/ha kg
ai/hL No Sample PHI Residues
Reference, Report No.
Japan, Wakayama 1997 (Ohgatafukuju)
30 WG 0.38 0.015 3 Thiacloprid: Whole fruit Thiacloprid-amide: Whole Fruit
01 1 3 7 01 1 3 7
< 0.005, < 0.005, < 0.0052, < 0.0052 (< 0.005)
0.09, 0.08, 0.062, 0.062
(0.07) 0.05, 0.05, 0.062, 0.052
(0.05) 0.08, 0.08, 0.042, 0.042
(0.06)
< 0.005, < 0.005, < 0.0052, < 0.0052 (< 0.005) < 0.005, < 0.005, < 0.0052, < 0.0052 (< 0.005) < 0.005, < 0.005, < 0.0052, < 0.0052 (< 0.005) < 0.005, < 0.005, < 0.0052, < 0.0052 (< 0.005)
Anon. 1997x, 1997y, 1997z, 1997aa
1 sampling before last application 2 replicate analysis
Table 51. Thiacloprid residues resulting from drip application to tomatoes (greenhouse use).
Application Analysis Location Year (variety)
Form kg ai/ha kg
ai/hL No Sample PHI Residues
Reference, Report No.
Belgium Putte 1998 (Tradino)
480 SC 0.251 0.0096 1 Fruit 1 3 7 14 21 28 35 49
< 0.02 < 0.02 < 0.02 0.02 0.02
< 0.02 < 0.02 < 0.02
Schoening, R. 1999c RA-2072/98
Belgium Katelinje-Waver 1998 (Fausto)
480 SC 0.241 0.0096 1 Fruit 1 3 7 14 21 28 35 49
< 0.02 < 0.02 < 0.02 0.02 0.02
< 0.02 < 0.02 < 0.02
Schoening, R. 1999c RA-2072/98

Thiacloprid 1071
Application Analysis Location Year (variety)
Form kg ai/ha kg
ai/hL No Sample PHI Residues
Reference, Report No.
Belgium Putte 1998 (Tradino)
480 SC 0.241 0.0096 1 Fruit 1 3 7 14 21 28 35 49
< 0.02 < 0.02 < 0.02 < 0.02 < 0.02 < 0.02 < 0.02 < 0.02
Schoening, R. 1999c RA-2072/98
Belgium O-L-V Waver 1998 (Blitz)
480 SC 0.231 0.0096 1 Fruit 1 3 7 14 21 28 35 49
< 0.02 < 0.02 0.03 0.03
< 0.02 < 0.02 < 0.02 < 0.02
Schoening, R. 1999c RA-2072/98
Belgium O-L-V Waver 1999 (Style)
480 SC 0.241 0.096 1 Fruit 1 3 7 15 21 28 35 49
< 0.02 < 0.02, < 0.02 (< 0.02) 0.02 0.03 0.03 0.02
< 0.02 < 0.02
Schoening, R. 2000b RA-2072/99
Netherlands Steenbergen 1999 (Jamaica)
480 SC 0.241 0.096 1 Fruit 1 3 7 14 21 28 35 49
< 0.02 < 0.02 < 0.02 < 0.02 < 0.02 < 0.02 < 0.02 < 0.02
Schoening, R. 2000b RA-2072/99
Belgium Katelinje-Waver 1999 (Tradiro)
480 SC 0.221 0.096 1 Fruit 1 3 7 14 21 28 35 49
< 0.02 < 0.02 0.02
< 0.02 < 0.02 < 0.02 < 0.02 < 0.02
Schoening, R. 2000b RA-2072/99
Netherlands Wouwse Plantage 1999 (Ambiance)
480 SC 0.25 0.096 1 Fruit 1 3 7 14 21 28 35 49
< 0.02 < 0.02 < 0.02 < 0.02 < 0.02 < 0.02 < 0.02 < 0.02
Schoening, R. 2000b RA-2072/99
1 corresponding to 0.0096 kg ai per 1000 plants

1072 Thiacloprid
Table 52. Thiacloprid residues resulting from foliar application to sweet peppers (field use).
Application Analysis Location Year (variety)
Form kg ai/ha kg
ai/hL No Sample PHI Residues
Reference, Report No.
Spain Viladecans 1995 (Lipari)
480 SC 0.18 0.012 2 Fruit 01 0 1 3 7
< 0.02 0.19 0.24 0.06 0.04
Placke, F. J. 1997p RA-2070/95
Italy Trinitapoli 1995 (Antares)
480 SC 0.18 0.018 2 Fruit 01 0 1 3 7
< 0.02 0.05 0.05 0.05
< 0.02
Placke, F. J. 1997p RA-2070/95
Italy C. da S. Giorgio 1995 (Pacific)
480 SC 0.18 0.018 2 Fruit 01 0 1 3 7
0.05 0.15 0.16 0.10 0.07
Placke, F. J. 1997p RA-2070/95
Spain Malgrat de Mar 1995 (Italiano)
480 SC 0.18 0.012 2 Fruit 01 0 1 3 7
< 0.02 0.41 0.24 0.11 0.10
Placke, F. J. 1997p RA-2070/95
Spain Vilanovadel Valles 1996 (Largo italiano)
480 SC 0.22 0.014 2 Fruit 0 3 7
0.49 0.45 0.21
Placke, F. J. 1997r RA-2119/96
Italy Pigno 1996 (Rino)
480 SC 0.22 0.014 2 Fruit 0 3 7
0.19, 0.18 (0.19)
0.17, 0.15 (0.16)
0.21, 0.20 (0.21)
Placke, F. J. 1997r RA-2119/96
Italy Andria 1996 (Antares)
480 SC 0.14 0.014 2 Fruit 0 3 7
0.07, 0.07 (0.07)
0.07, 0.07 (0.07)
0.04, 0.04 (0.04)
Placke, F. J. 1997r RA-2119/96
France Pernes les Fontaines 1996 (Lipari)
480 SC 0.22 0.014 2 Fruit 0 3 7
0.15, 0.14 (0.15)
0.07, 0.07 (0.07)
0.09, 0.06 (0.08)
Placke, F. J. 1997r RA-2119/96
1 sampling before last application
Table 53. Thiacloprid residues resulting from foliar application to sweet peppers (greenhouse use).
Application Analysis Location Year (variety)
Form kg ai/ha kg
ai/hL No Sample PHI Residues
Reference, Report No.
Netherlands GS Breda 1995 (Cuby)
480 SC 0.18 0.012 3 Fruit 01 0 1 3 7
0.07 0.09 0.09 0.07 0.05
Placke, F. J. 1997q RA-2069/95
Netherlands SW Heerle 1995 (Spirit)
480 SC 0.18 0.012 3 Fruit 01 0 1 3 7
0.07 0.13 0.14 0.08 0.10
Placke, F. J. 1997q RA-2069/95

Thiacloprid 1073
Application Analysis Location Year (variety)
Form kg ai/ha kg
ai/hL No Sample PHI Residues
Reference, Report No.
Spain Ruescas 1995 (Atol)
480 SC 0.18 0.012 3 Fruit 01 0 1 3 7
0.27 0.54 0.47 0.37 0.34
Placke, F. J. 1997q RA-2069/95
Spain Ruescas 1995 (Espartaco)
480 SC 0.18 0.012 3 Fruit 01 0 1 3 7
0.49 0.72 0.65 0.36 0.38
Placke, F. J. 1997q RA-2069/95
Spain El Ejido 1996 (Dallas)
480 SC 0.22 0.014 3 Fruit 0 3 7
0.48 0.37 0.32
Placke, F. J. 1997s RA-2120/96
France St. Remy de Provence 1996 (Cyrano)
480 SC 0.22 0.014 3 Fruit 0 3 7
0.13 0.11 0.09
Placke, F. J. 1997s RA-2120/96
Spain El Ejido 1996 (Mazurka)
480 SC 0.22 0.014 3 Fruit 0 3 7
0.36 0.33 0.21
Placke, F. J. 1997s RA-2120/96
France Les Sablons 1996 (Laser)
480 SC 0.22 0.014 3 Fruit 0 3 7
0.13 0.08 0.04
Placke, F. J. 1997s RA-2120/96
Japan, Kochi 1997 (Tosahime)
30 WG 0.3 0.015 3 Thiacloprid: Whole fruit Thiacloprid-amide: Whole Fruit
01 1 3 7 01 1 3 7
< 0.005, < 0.005, < 0.0052, < 0.0052 (< 0.005) 1.3, 1.2,
0.972, 0.952 (1.1)
0.81, 0.80, 0.892, 0.832
(0.83) 0.64, 0.58, 0.582, 0.562
(0.59)
< 0.005, < 0.005, < 0.0052, < 0.0052 (< 0.005) < 0.005, < 0.005, < 0.0052, < 0.0052 (< 0.005) < 0.005, < 0.005, < 0.0052, < 0.0052 (< 0.005) < 0.005, < 0.005, < 0.0052, < 0.0052 (< 0.005)
Anon. 1996, 1996a, 1996b, 1996c

1074 Thiacloprid
Application Analysis Location Year (variety)
Form kg ai/ha kg
ai/hL No Sample PHI Residues
Reference, Report No.
Japan, Miyazaki 1997 (TosahikariD)
30 WG 0.38 0.015 3 Thiacloprid: Whole fruit Thiacloprid-amide: Whole Fruit
01 1 3 7 01 1 3 7
< 0.005, < 0.005, < 0.0052, < 0.0052 (< 0.005) 2.2, 2.0, 1.92, 1.82
(2.0) 1.7, 1.6, 1.52, 1.52
(1.6) 1.5, 1.4, 1.32, 1.32
(1.4)
< 0.005, < 0.005, < 0.0052, < 0.0052 (< 0.005) < 0.005, < 0.005, < 0.0052, < 0.0052 (< 0.005) < 0.005, < 0.005, < 0.0052, < 0.0052 (< 0.005) < 0.005, < 0.005, < 0.0052, < 0.0052 (< 0.005)
Anon. 1996, 1996a, 1996b, 1996c
1 sampling before last application 2 replicate analysis
Table 54. Thiacloprid residues resulting from drip application to peppers (greenhouse use).
Application Analysis Location Year (variety)
Form kg ai/ha kg
ai/hL No Sample PHI Residues
Reference, Report No.
Belgium Katelinje-Waver 1998 (Mazurka)
480 SC 0.301 0.0096 1 Fruit 1 3 7 14 21 28 35 49
< 0.02 < 0.02 0.03 0.05 0.05 0.04
< 0.02 < 0.02
Schoening, R. 1999c RA-2072/98
Belgium Katelinje-Waver 1998 (Meteor)
480 SC 0.411 0.0096 1 Fruit 1 3 7 14 21 28 35 49
< 0.02 < 0.02 0.03 0.05 0.04 0.02
< 0.02 < 0.02
Schoening, R. 1999c RA-2072/98

Thiacloprid 1075
Application Analysis Location Year (variety)
Form kg ai/ha kg
ai/hL No Sample PHI Residues
Reference, Report No.
Belgium Katelinje-Waver 1998 (Meteor)
480 SC 0.361 0.0096 1 Fruit 1 3 7 14 21 28 35 49
< 0.02 < 0.02 0.04 0.05 0.04 0.02
< 0.02 < 0.02
Schoening, R. 1999c RA-2072/98
Belgium Katelinje-Waver 1998 (Mazurka)
480 SC 0.281 0.0096 1 Fruit 1 3 7 14 21 28 35 49
< 0.02 < 0.02 0.05 0.04 0.05 0.04
< 0.02 < 0.02
Schoening, R. 1999c RA-2072/98
Netherlands Steenbergen 1999 (Fiesta)
480 SC 0.291 0.096 1 Fruit 1 3 7 14 21 28 35 49
< 0.02 < 0.02 0.02 0.07 0.07 0.06 0.05
< 0.02
Schoening, R. 2000b RA-2072/99
Belgium Rumst 1999 (Meteor)
480 SC 0.221 0.096 1 Fruit 1 3 7 14 21 28 35 49
< 0.02 < 0.02 0.03 0.04
< 0.02 < 0.02 < 0.02 < 0.02
Schoening, R. 2000b RA-2072/99
Belgium Katalijne-Waver 1999 (Mandy)
480 SC 0.321 0.096 1 Fruit 1 3 8 14 21 28 35 49
< 0.02 0.02 0.06 0.05 0.05 0.02
< 0.02 < 0.02
Schoening, R. 2000b RA-2072/99
Netherlands Steenbergen 1999 (Spirit)
480 SC 0.321 0.096 1 Fruit 1 3 7 14 21 28 35 49
< 0.02 < 0.02 < 0.02 0.02 0.04 0.03 0.03
< 0.02
Schoening, R. 2000b RA-2072/99
1 corresponding to 0.0096 kg ai per 1000 plant

1076 Thiacloprid
Root and tuber vegetables
Table 55. Thiacloprid residues resulting from foliar application to potatoes.
Application Analysis Location Year (variety)
Form kg ai/ha kg
ai/hL No Sample PHI Residues
Reference, Report No.
Germany Burscheid 1997 (Hansa)
480 SC 0.096 0.012 3 Thiacloprid only: Tuber Total residue1 Tuber
0 21 0 21
< 0.02 < 0.02
< 0.05 < 0.05
Schoening, R. 2000c RA-2150/97
France Quatremare 1997 (Lisa)
480 SC 0.096 0.034 3 Thiacloprid only: Tuber Total residue1 Tuber
0 21 0 21
< 0.02 < 0.02
< 0.05 < 0.05
Schoening, R. 2000c RA-2150/97
Germany Burscheid 1998 (Hansa)
480 SC 0.096 0.024 3 Thiacloprid only: Tuber Total residue1 Tuber
0 21 0 21
< 0.02 < 0.02
< 0.05 < 0.05
Schoening, R. 2000d RA-2068/98
United Kingdom Thurston 1998 (Desiree)
480 SC 0.096 0.012 3 Thiacloprid only: Tuber Total residue1 Tuber
0 21 0 21
< 0.02 < 0.02
< 0.05 < 0.05
Schoening, R. 2000d RA-2068/98
Germany Monheim 1998 (Hansa)
480 SC 0.096 0.096 0.096
0.012 0.024 0.024
3 Thiacloprid only: Tuber Total residue1 Tuber
0 21 0 21
< 0.02 < 0.02
< 0.05 < 0.05
Schoening, R. 2000d RA-2068/98
United Kingdom Inham Hall 1998 (Fianna)
480 SC 0.096 0.032 3 Thiacloprid only: Tuber Total residue1 Tuber
0 21 0 21
< 0.02 < 0.02
< 0.05 < 0.05
Schoening, R. 2000d RA-2068/98
France Quatremare 1998 (Mona Lisa)
480 SC 0.096 0.012 3 Thiacloprid only: Tuber Total residue1 Tuber
0 21 0 21
< 0.02 < 0.02
< 0.05 < 0.05
Schoening, R. 2000d RA-2068/98
Belgium Soreé 1998 (Bintje)
480 SC 0.096 3 Thiacloprid only: Tuber Total residue1
0 21 0 21
< 0.02 < 0.02
< 0.05 < 0.05
Schoening, R. 2000d RA-2068/98
Spain La Garriga 1997 (Red Pontiac)
480 SC 0.09 0.096 0.096
0.012 0.012 0.012
3 Thiacloprid only: Tuber Total residue1
Tuber
0 22 0 22
< 0.02 < 0.02
< 0.05 < 0.05
Schoening, R. 2000e RA-2151/97

Thiacloprid 1077
Application Analysis Location Year (variety)
Form kg ai/ha kg
ai/hL No Sample PHI Residues
Reference, Report No.
Italy Molino dei Torti 1997 (Mona Lisa)
480 SC 0.096 0.012 3 Thiacloprid only: Tuber Total residue1 Tuber
0 21 0 21
< 0.02 < 0.02
< 0.05 < 0.05
Schoening, R. 2000e RA-2151/97
Spain Cabrera de Mar 1998 (Jerla)
480 SC 0.096 0.09 0.096
0.012 0.012 0.012
3 Thiacloprid only: Tuber Total residue1
0 21 0 21
< 0.02 < 0.02
< 0.05 < 0.05
Schoening, R. 2000f RA-2069/98
Italy Borgo Piave 1998 (Symfonia)
480 SC 0.096 0.012 3 Thiacloprid only: Tuber Total residue1 Tuber
0 7 14 21 0 7 14 21
< 0.02 < 0.02 < 0.02 < 0.02
< 0.05 < 0.05 < 0.05 < 0.05
Schoening, R. 2000f RA-2069/98
Italy Cervesina 1998 (Mona Lisa)
480 SC 0.096 0.012 3 Thiacloprid only: Tuber Total residue1
0 7 14 21 0 7 14 21
< 0.02 < 0.02 < 0.02 < 0.02
< 0.05 < 0.05 < 0.05 < 0.05
Schoening, R. 2000f RA-2069/98
France Les Valayans 1998 (Mona Lisa)
480 SC 0.096 0.012 3 Thiacloprid only: Tuber Total residue1 Tuber
0 21 0 21
< 0.02 < 0.02
< 0.05 < 0.05
Schoening, R. 2000f RA-2069/98
France Noves 1998 (Mona Lisa)
480 SC 0.096 0.012 3 Thiacloprid only: Tuber Total residue1 Tuber
0 21 0 21
< 0.02 < 0.02
< 0.05 < 0.05
Schoening, R. 2000f RA-2069/98
Spain Vilanova del Valles 1998 (Ped Pontiac)
480 SC 0.096 0.096 0.085
0.012 3 Thiacloprid only: Tuber Total residue1 Tuber
0 21 0 21
< 0.02 < 0.02
< 0.05 < 0.05
Schoening, R. 2000f RA-2069/98
Brazil Facenda Rodeio 1998 (Jaete Bintje)
480 SC 0.14 0.024 4 Thiacloprid only: Tuber
21 < 0.02 Lancas, F. M. 1998d RE-059/98
Brazil Facenda Rodeio 1998 (Jaete Bintje)
480 SC 0.29 0.048 4 Thiacloprid only: Tuber
21 < 0.02 Lancas, F. M. 1998d RE-059/98

1078 Thiacloprid
Application Analysis Location Year (variety)
Form kg ai/ha kg
ai/hL No Sample PHI Residues
Reference, Report No.
Japan, Ushiku 1997 (Danshaku)
30 WG 0.3 0.015 3 Thiacloprid: Tuber, washed Thiacloprid-amide: Tuber, washed
02 7 14 21 02 7 14 21
< 0.005, < 0.005, < 0.0053, < 0.0053 (< 0.005) < 0.005, < 0.005, < 0.0053, < 0.0053 (< 0.005) < 0.005, < 0.005, < 0.0053, < 0.0053 (< 0.005) < 0.005, < 0.005, < 0.0053, < 0.0053 (< 0.005)
< 0.005, < 0.005, < 0.0053, < 0.0053 (< 0.005) < 0.005, < 0.005, < 0.0053, < 0.0053 (< 0.005) < 0.005, < 0.005, < 0.0053, < 0.0053 (< 0.005) < 0.005, < 0.005, < 0.0053, < 0.0053 (< 0.005)
Anon. 1997p, 1997q, 1997r, 1997s
Japan, Hiroshima 1997 (Nourin No. 1)
30 WG 0.3 0.015 3 Thiacloprid: Tuber, washed
02 7 14 21
< 0.005, < 0.005, < 0.0053, < 0.0053 (< 0.005) < 0.005, < 0.005, < 0.0053, < 0.0053 (< 0.005) < 0.005, < 0.005, < 0.0053, < 0.0053 (< 0.005) < 0.005, < 0.005, < 0.0053, < 0.0053 (< 0.005)
Anon. 1997p, 1997q, 1997r, 1997s
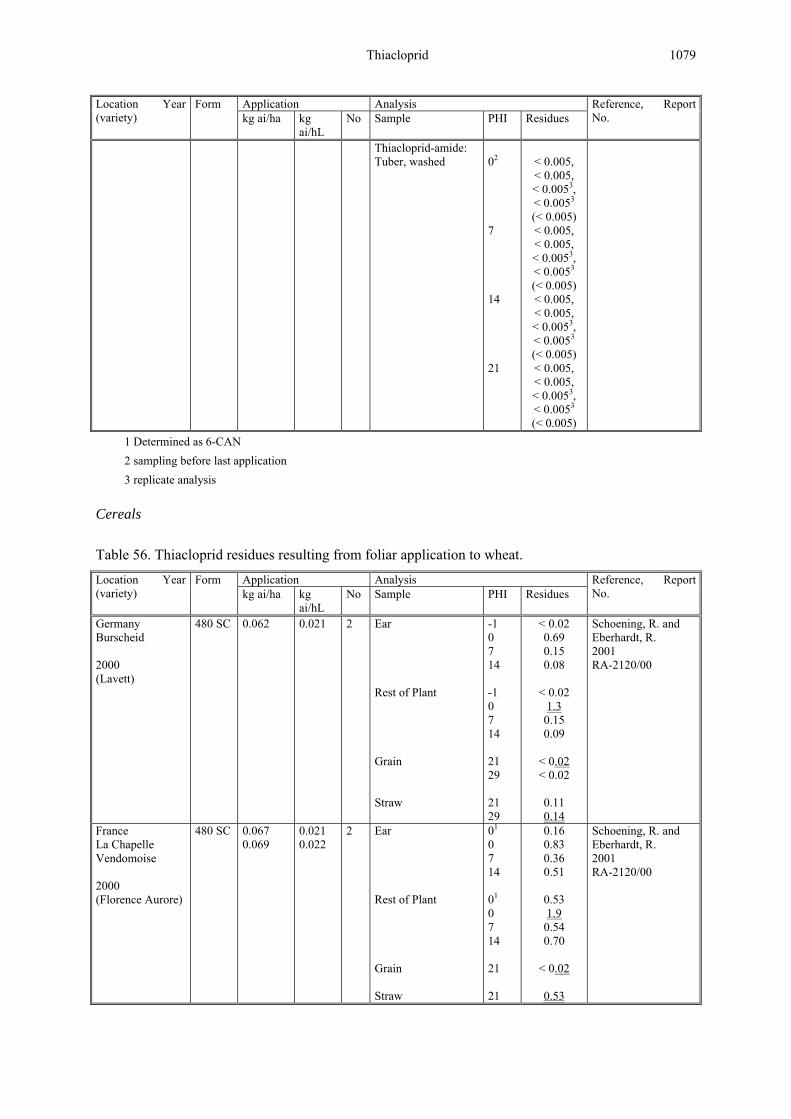
Thiacloprid 1079
Application Analysis Location Year (variety)
Form kg ai/ha kg
ai/hL No Sample PHI Residues
Reference, Report No.
Thiacloprid-amide: Tuber, washed
02 7 14 21
< 0.005, < 0.005, < 0.0053, < 0.0053 (< 0.005) < 0.005, < 0.005, < 0.0053, < 0.0053 (< 0.005) < 0.005, < 0.005, < 0.0053, < 0.0053 (< 0.005) < 0.005, < 0.005, < 0.0053, < 0.0053 (< 0.005)
1 Determined as 6-CAN 2 sampling before last application 3 replicate analysis
Cereals
Table 56. Thiacloprid residues resulting from foliar application to wheat.
Application Analysis Location Year (variety)
Form kg ai/ha kg
ai/hL No Sample PHI Residues
Reference, Report No.
Germany Burscheid 2000 (Lavett)
480 SC 0.062 0.021 2 Ear Rest of Plant Grain Straw
-1 0 7 14 -1 0 7 14 21 29 21 29
< 0.02 0.69 0.15 0.08
< 0.02
1.3 0.15 0.09
< 0.02 < 0.02
0.11 0.14
Schoening, R. and Eberhardt, R. 2001 RA-2120/00
France La Chapelle Vendomoise 2000 (Florence Aurore)
480 SC 0.067 0.069
0.021 0.022
2 Ear Rest of Plant Grain Straw
01 0 7 14 01 0 7 14 21 21
0.16 0.83 0.36 0.51
0.53 1.9 0.54 0.70
< 0.02
0.53
Schoening, R. and Eberhardt, R. 2001 RA-2120/00

1080 Thiacloprid
Application Analysis Location Year (variety)
Form kg ai/ha kg
ai/hL No Sample PHI Residues
Reference, Report No.
Germany Monheim 2000 (Lavett)
480 SC 0.062 0.021 2 Ear Rest of Plant Grain Straw
0 21 0 21 30 30
0.58 0.05
1.7 0.05
< 0.02
0.07
Schoening, R. and Eberhardt, R. 2001 RA-2120/00
France Villexanton 2000 (Lloyd)
480 SC 0.066 0.062
0.022 0.021
2 Ear Rest of Plant Grain Straw
0 0 21 21
0.84
1.3
0.04
0.89
Schoening, R. and Eberhardt, R. 2001 RA-2120/00
France Montamat 2000 (Apache)
480 SC 0.062 0.021 2 Ear Rest of Plant Grain Straw
01 0 7 01 0 7 14 22 14 22
0.20, 0.18 (0.19)
0.87, 0.88 (0.88)
1.4, 1.3 (1.4)
0.25, 0.23
(0.24) 1.9, 1.8
(1.9) 2.4, 1.9
(2.2)
0.02, < 0.02 (0.02) 0.03, 0.03
(0.03)
1.6, 1.6 (1.6)
1.4, 1.4 (1.4)
Schoening, R. and Sur, R. 2001 RA-2121/00
France Martres 2000 (Sidéral)
480 SC 0.062 0.021 2 Ear Rest of Plant Grain Straw
01 0 20 20
1.1
1.8
0.03
0.97
Schoening, R. and Sur, R. 2001 RA-2121/00
Germany Burscheid 2002 (Picolo)
110 OD
0.05 0.017 2 Ear Rest of Plant Grain Straw
01 0 21 01
0 21 35 35
0.04 0.43 0.03
0.03 1.2 0.04
< 0.02
0.07
Schoening, R. 2004 RA/2177/02

Thiacloprid 1081
Application Analysis Location Year (variety)
Form kg ai/ha kg
ai/hL No Sample PHI Residues
Reference, Report No.
France Pithienvile 2002 (Apache)
110 OD
0.05 0.017 2 Ear Rest of Plant Grain Straw
01 0 01
0 21 35 21 35
0.2 0.71
0.6 1.8
0.04
< 0.02
1.7 0.96
Schoening, R. 2004 RA/2177/02
Germany Burscheid 2002 (Picolo)
110 OD
0.05 0.017 1 Ear Rest of Plant Grain Straw
0 21 0 21 35 35
0.36 0.04
1.3 0.04
< 0.02
0.06
Schoening, R. 2004a RA-2177/02
France Pithienvile 2002 (Apache)
110 OD
0.05 0.017 1 Ear Rest of Plant Grain Straw
0 0 21 35 21 35
0.55
1.2
0.03 0.02
1.2 0.56
Schoening, R. 2004a RA-2178/02
1 sampling before last application
Table 57. Thiacloprid residues resulting from foliar application to barley.
Application Analysis Location Year (variety)
Form kg ai/ha kg
ai/hL No Sample PHI Residues
Reference, Report No.
Germany Burscheid 2000 (Baronesse)
480 SC 0.062 0.021 2 Ear Rest of Plant Grain Straw
01 0 6 14 01 0 6 14 22 29 22 29
< 0.02 0.90 0.11 0.08
0.04 1.5 0.18 0.06
0.03 0.06
0.05 0.07
Schoening, R. and Eberhardt, R. 2002 RA-2122/00
France Monnaie 2000 (Prisma)
480 SC 0.062 0.062
0.021 0.019
2 Ear Rest of Plant Grain
01 0 8 14 01 0 8 14 21
0.53 2.6 0.61 0.36
1.8 3.4 1.6 0.44
0.12
Schoening, R. and Eberhardt, R. 2002 RA-2122/00

1082 Thiacloprid
Application Analysis Location Year (variety)
Form kg ai/ha kg
ai/hL No Sample PHI Residues
Reference, Report No.
Straw
21
0.41
Germany Monheim 2000 (Alexis)
480 SC 0.062 0.021 2 Ear Rest of Plant Grain Straw
0 0 20 30 20 30
0.97
1.6
< 0.02 < 0.02
0.08 0.04
Schoening, R. and Eberhardt, R. 2002 RA-2122/00
France Courcy 2000 (Cork)
480 SC 0.068 0.062
0.021 0.021
2 Ear Rest of Plant Grain Straw
0 0 22 22
0.82
1.1
0.05
0.29
Schoening, R. and Eberhardt, R. 2002 RA-2122/00
France St. Pey De Castet 2000 (Gaelic)
480 SC 0.062 0.075
0.021 0.021
2 Ear Rest of Plant Grain Straw
01 0 7 15 01 0 7 15 21 21
0.52 2.0 1.5 1.4
0.25 1.2 0.76 0.99
0.45
0.88
Schoening, R. 2001e RA-2123/00
France Soulan 2000 (Nikel)
480 SC 0.062 0.021 2 Ear Rest of Plant Grain Straw
0 0 21 21
0.88
0.90
0.11
0.15
Schoening, R. 2001e RA-2123/00
1 sampling before last application
Table 58. Thiacloprid residues resulting from foliar application to rice
Application Analysis Location Year (variety)
Form kg ai/ha kg
ai/hL No Sample PHI Residues
Reference, Report No.
India Chakdaha 2000 (Swama masuri)
240 SC 0.18 1 Whole plant w/o roots Grain Husk Straw
0 1 3 7 15 30 39 39 39
12.0 10.2 8.5 6.98 3.0
< 0.0011
< 0.0011
< 0.0011
< 0.0011
Anon. 2002 India-Rice-2002 Season-I, Replicate 1
240 SC 0.18 1 Whole plant w/o roots
0 1 3 7 15 30
8.1 7.1 6.0 4.4 4.1
< 0.0011
Season-I, Replicate 2

Thiacloprid 1083
Application Analysis Location Year (variety)
Form kg ai/ha kg
ai/hL No Sample PHI Residues
Reference, Report No.
Grain Husk Straw
39 39 39
< 0.0011
< 0.0011
< 0.0011
240 SC 0.18 1 Whole plant w/o roots Grain Husk Straw
0 1 3 7 15 30 39 39 39
9.1 8.96 7.99 4.9 2.9
< 0.0011
< 0.0011
< 0.0011
< 0.0011
Season-I, Replicate 3
India Chakdaha 2000 (Swama masuri)
240 SC 0.36 1 Whole plant w/o roots Grain Husk Straw
0 1 3 7 15 30 39 39 39
18.9 15.98 15.1 10.9 3.7
< 0.0011
< 0.0011
< 0.0011
< 0.0011
Anon. 2002 India-Rice-2002 Season-I, Replicate 1
240 SC 0.36 1 Whole plant w/o roots Grain Husk Straw
0 1 3 7 15 30 39 39 39
17.4 16.8 11.6 8.8 4.0
< 0.0011
< 0.0011
< 0.0011
< 0.0011
Season-I, Replicate 2
240 SC 0.36 1 Whole plant w/o roots Grain Husk Straw
0 1 3 7 15 30 39 39 39
16.1 14.3 14.0 10.1 6.9
< 0.0011
< 0.0011
< 0.0011
< 0.0011
Season-I, Replicate 3

1084 Thiacloprid
Application Analysis Location Year (variety)
Form kg ai/ha kg
ai/hL No Sample PHI Residues
Reference, Report No.
India Chakdaha 2000 (Khitish)
240 SC 0.18 1 Whole plant w/o roots Grain Husk Straw
0 1 3 7 15 30 29 29 29
11.1 8.7 8.2 4.5 2.7
< 0.0011
< 0.0011
< 0.0011
< 0.0011
Anon. 2002 India-Rice-2002 Season-II, Replicate 1
240 SC 0.18 1 Whole plant w/o roots Grain Husk Straw
0 1 3 7 15 30 29 29 29
8.9 9.1 7.4 5.9 5.2
< 0.0011
< 0.0011
< 0.0011
< 0.0011
Season-II, Replicate 2
240 SC 0.18 1 Whole plant w/o roots Grain Husk Straw
0 1 3 7 15 30 29 29 29
9.99 10.1 8.5 6.9 3.2
< 0.0011
< 0.0011
< 0.0011
< 0.0011
Season-II, Replicate 3
India Chakdaha 2000 (Khitish)
240 SC 0.36 1 Whole plant w/o roots Grain Husk Straw
0 1 3 7 15 30 29 29 29
19.5 17.9 12.6 11.9 4.9
< 0.0011
< 0.0011
< 0.0011
< 0.0011
Anon. 2002 India-Rice-2002 Season-II, Replicate 1
240 SC 0.36 1 Whole plant w/o roots Grain Husk Straw
0 1 3 7 15 30 29 29 29
16.6 14.9 15.3 9.1 6.2
< 0.0011
< 0.0011
< 0.0011
< 0.0011
Season-II, Replicate 2

Thiacloprid 1085
Application Analysis Location Year (variety)
Form kg ai/ha kg
ai/hL No Sample PHI Residues
Reference, Report No.
240 SC 0.36 1 Whole plant w/o roots Grain Husk Straw
0 1 3 7 15 30 29 29 29
17.0 17.5 16.3 12.3 5.9
< 0.0011
< 0.0011
< 0.0011
< 0.0011
Season-II, Replicate 3
India Chakdaha 2001 (Swama masuri)
240 SC 0.18 1 Whole plant w/o roots Grain Husk Straw
0 1 3 7 15 30 44 44 44
8.98 8.4 8.5 5.3 2.5
< 0.0011
< 0.0011
< 0.0011
< 0.0011
Anon. 2002 India-Rice-2002 Season-III, Replicate 1
240 SC 0.18 1 Whole plant w/o roots Grain Husk Straw
0 1 3 7 15 30 44 44 44
10.96 7.1 7.9 6.7 3.9
< 0.0011
< 0.0011
< 0.0011
< 0.0011
Season-III, Replicate 2
240 SC 0.18 1 Whole plant w/o roots Grain Husk Straw
0 1 3 7 15 30 44 44 44
9.8 10.7 6.6 4.98 3.6
< 0.0011
< 0.0011
< 0.0011
< 0.0011
Season-III, Replicate 3
India Chakdaha 2001 (Swama masuri)
240 SC 0.36 1 Whole plant w/o roots Grain Husk Straw
0 1 3 7 15 30 44 44 44
16.7 14.2
13.96 10.2 3.4
< 0.0011
< 0.0011
< 0.0011
< 0.0011
Anon. 2002 India-Rice-2002 Season-III, Replicate 1

1086 Thiacloprid
Application Analysis Location Year (variety)
Form kg ai/ha kg
ai/hL No Sample PHI Residues
Reference, Report No.
240 SC 0.36 1 Whole plant w/o roots Grain Husk Straw
0 1 3 7 15 30 44 44 44
15.9 16.6 12.2 8.4 5.0
< 0.0011
< 0.0011
< 0.0011
< 0.0011
Season-III, Replicate 2
240 SC 0.36 1 Whole plant w/o roots Grain Husk Straw
0 1 3 7 15 30 44 44 44
18.1 14.7 14.8 12.0 5.5
< 0.0011
< 0.0011
< 0.0011
< 0.0011
Season-III, Replicate 3
1 limit of detection
Table 59: Thiacloprid residues resulting from granular application to rice.
Application Analysis Location Year (variety)
Form kg ai/ha kg
ai/hL No Sample PHI Residues
Reference, Report No.
Japan Miyagi 1997 (Sasanishiki)
GR, 15 1.5 - 1 Thiacloprid: Grain Thiacloprid-amide: Grain
01 152 01 152
< 0.005, < 0.005, < 0.0052, < 0.0052 (< 0.005) < 0.005, < 0.005, < 0.0052, < 0.0052 (< 0.005)
< 0.005, < 0.005, < 0.0052, < 0.0052 (< 0.005) < 0.005, < 0.005, < 0.0052, < 0.0052 (< 0.005)
Anon. 1997t, 1997u, 1997v, 1997w
Japan, Kagoshima 1997 (Koshihikari)
GR, 15 1.5 - 1 Thiacloprid: Grain
01 117
< 0.005, < 0.005, < 0.0052, < 0.0052 (< 0.005) < 0.005, < 0.005, < 0.0052, < 0.0052
Anon. 1997t, 1997u, 1997v, 1997w

Thiacloprid 1087
Application Analysis Location Year (variety)
Form kg ai/ha kg
ai/hL No Sample PHI Residues
Reference, Report No.
Thiacloprid-amide: Grain
01 117
(< 0.005)
< 0.005, < 0.005, < 0.0052, < 0.0052 (< 0.005) < 0.005, < 0.005, < 0.0052, < 0.0052 (< 0.005)
1 sampling before last application 2 replicate analysis
Table 60. Thiacloprid residues resulting from foliar application to maize.
Application Analysis Location Year (variety)
Form kg ai/ha kg
ai/hL No Sample PHI Residues
Reference, Report No.
France Saint Symphorien d’Ancelles 2004 (Texxud)
110 OD
0.075 0.025 2 Green material Ear, corn Kernel
01 0 2 7 21 01 0 2 7 21 30
0.31 1.7 0.89 0.76 0.56
< 0.01 < 0.01 < 0.01 < 0.01 < 0.01
< 0.01
Diot, R. 2005 RA-2512/04
Germany Leverkusen 2004 (Justine)
110 OD
0.075 0.025 2 Green material Ear, corn Kernel
01 0 2 7 21 01 0 2 7 21 30
< 0.05 0.90 0.18 0.10
< 0.05
< 0.01 0.03 0.03 0.02 0.01
< 0.01
Diot, R. 2005 RA-2512/04
Germany Gersthofen 2004 (Banguy)
110 OD
0.075 0.025 2 Green material Ear, corn Kernel
01 0 2 7 22 01 0 2 7 22 31
0.21 0.85 0.67 0.42 0.28
0.01 0.02 0.04 0.03 0.04
< 0.01
Diot, R. 2005 RA-2512/04

1088 Thiacloprid
Application Analysis Location Year (variety)
Form kg ai/ha kg
ai/hL No Sample PHI Residues
Reference, Report No.
France Bacquepuis 2004 (Anjou 285)
110 OD
0.075 0.025 2 Green material Ear, corn Kernel
01 0 2 7 21 01 0 2 7 21 31
0.17 0.87 0.81 0.55 0.66
< 0.01 0.02 0.03 0.02 0.02
< 0.01
Diot, R. 2005 RA-2512/04
France Ambérieux 2004 (34B23)
110 OD
0.075 0.025 2 Green material Ear, corn Kernel
01 0 3 7 22 01 0 3 7 22 31
0.33 1.7 1.7 1.1 0.58
< 0.01 < 0.01 < 0.01 < 0.01 < 0.01
< 0.01
Diot, R. 2005a RA-2511/04
Spain Vila-sacra 2004 (PR32R42)
110 OD
0.075 0.025 2 Green material Ear, corn Kernel
01 0 3 7 21 01 0 3 7 21 30
0.12 0.46 0.36 0.32 0.10
< 0.01 < 0.01 < 0.01 < 0.01 < 0.01
< 0.01
Diot, R. 2005a RA-2511/04
Italy Albaro Di Ronco All’Adige 2004 (PR-33-A46)
110 OD
0.075 0.025 2 Green material Ear, corn Kernel
01 0 3 7 21 01 0 3 7 21 28
0.14 0.74 0.71 0.63 0.13
< 0.01 < 0.01 < 0.01 < 0.01 < 0.01
< 0.01
Diot, R. 2005a RA-2511/04

Thiacloprid 1089
Application Analysis Location Year (variety)
Form kg ai/ha kg
ai/hL No Sample PHI Residues
Reference, Report No.
Greece Xehasmeni-Imathias 2004 (Brasco)
110 OD
0.075 0.025 2 Green material Ear, corn Kernel
01 0 2 7 21 01 0 2 7 21 31
0.62 1.9 1.2 1.3 1.8
0.04, 0.04, 0.03 (0.04) 0.16, 0.15, 0.15 (0.15) 0.08, 0.07, 0.08 (0.08) 0.11, 0.11, 0.11 (0.11) 0.14, 0.12, 0.12 (0.13)
< 0.01
Diot, R. 2005a RA-2511/04
1 sampling before last application
Nuts and seeds
Table 61. Thiacloprid residues resulting from foliar application to walnuts.
Application Analysis Location Year (variety)
Form kg ai/ha kg
ai/hL No Sample PHI Residues
Reference, Report No.
Italy Villadose 2003 (Lara)
480 SC 0.17 0.19
0.03 0.03
2 Nutmeat 0 3 7 14
< 0.005 < 0.005 < 0.005 < 0.005
Baravelli, P. L. 2003 AGRI012/03DEC
Italy Villadose 2003 (Lara)
480 SC 0.17 0.19
0.03 0.03
2 Nutmeat 0 3 7 14
< 0.005 < 0.005 < 0.005 < 0.005
Baravelli, P. L. 2003 AGRI012/03DEC
Italy San Dona di Piave 2003 (Lara)
480 SC 0.19 0.19
0.03 0.03
2 Nutmeat 0 3 7 14
< 0.005 < 0.005 < 0.005 < 0.005
Baravelli, P. L. 2003 AGRI012/03DEC
Italy San Dona di Piave 2003 (Lara)
480 SC 0.19 0.19
0.03 0.03
2 Nutmeat 0 3 7 14
< 0.005 < 0.005 < 0.005 < 0.005
Baravelli, P. L. 2003 AGRI012/03DEC

1090 Thiacloprid
Table 62. Thiacloprid residues resulting from foliar application to almonds
Application Analysis Location Year (variety)
Form kg ai/ha kg
ai/hL No Sample PHI Residues
Reference, Report No.
USA California 2000 (Monterey)
480 SC 0.14 0.15 0.15
0.029 3 Thiacloprid only: Nutmeat Hulls Total residue1: Nutmeat Hulls
14 14 14 14
< 0.01
1.4
< 0.01
1.4
Harbin, A. M. 2004 110307
USA California, Kerman 2000 (Monterey)
480 SC 0.14 0.14 0.14
0.005 3 Thiacloprid only: Nutmeat Hulls Total residue1: Nutmeat Hulls
14 14 14 14
< 0.01
1.5
< 0.01
1.5
Harbin, A. M. 2004 110307
USA California, Hughson 2000 (Merced)
480 SC 0.14 0.14 0.15
0.028 0.028 0.029
3 Thiacloprid only: Nutmeat Hulls Total residue1: Nutmeat Hulls
14 14 14 14
< 0.01
0.99
< 0.01
1.0
Harbin, A. M. 2004 110307
USA California, Hughson 2000 (Merced)
480 SC 0.14 0.14 0.14
0.006 0.006 0.007
3 Thiacloprid only: Nutmeat Hulls Total residue1: Nutmeat Hulls
14 14 14 14
< 0.01
1.3
< 0.01
1.3
Harbin, A. M. 2004 110307
USA California, Porterville 2000 (Mission)
480 SC 0.14 0.14 0.14
0.025 0.026 0.025
3 Thiacloprid only: Nutmeat Hulls Total residue1: Nutmeat Hulls
10 10 10 10
< 0.01
2.1
< 0.01
2.1
Harbin, A. M. 2004 110307
USA California, Porterville 2000 (Mission)
480 SC 0.14 0.14 0.14
0.006 0.006 0.007
3 Thiacloprid only: Nutmeat Hulls Total residue1: Nutmeat Hulls
10 10 10 10
< 0.01
1.8
< 0.01
1.8
Harbin, A. M. 2004 110307

Thiacloprid 1091
Application Analysis Location Year (variety)
Form kg ai/ha kg
ai/hL No Sample PHI Residues
Reference, Report No.
USA California, Glenn 2000 (Non-Pareil)
480 SC 0.14 0.14 0.14
0.038 0.038 0.033
3 Thiacloprid only: Nutmeat Hulls Total residue1: Nutmeat Hulls
14 14 14 14
< 0.01
1.8
< 0.01
1.8
Harbin, A. M. 2004 110307
USA California, Glenn 2000 (Non-Pareil)
480 SC 0.14 0.007 3 Thiacloprid only: Nutmeat Hulls Total residue1: Nutmeat Hulls
14 14 14 14
< 0.01
3.4
< 0.01
3.4
Harbin, A. M. 2004 110307
USA California, Glenn 2000 (Non-Pareil)
70 WG 0.14 0.14 0.14
0.038 0.038 0.033
3 Thiacloprid only: Nutmeat Hulls Total residue1: Nutmeat Hulls
14 14 14 14
0.01
2.0
0.01
2.0
Harbin, A. M. 2004 110307
USA California, Glenn 2000 (Non-Pareil)
70 WG 0.14 0.007 3 Thiacloprid only: Nutmeat Hulls Total residue1: Nutmeat Hulls
14 14 14 14
< 0.01
4.9
< 0.01
4.9
Harbin, A. M. 2004 110307
USA California, Terra Bella 2000 (Monterey)
480 SC 0.14 0.022 3 Thiacloprid only: Nutmeat Hulls Total residue1: Nutmeat Hulls
8 14 20 23 8 14 20 23 8 14 20 23 8 14 20 23
< 0.01 < 0.01 < 0.01 < 0.01
2.3 3.3 2.8 1.8
< 0.01 < 0.01 < 0.01 < 0.01
2.3 3.3 2.8 1.8
Harbin, A. M. 2004 110307

1092 Thiacloprid
Application Analysis Location Year (variety)
Form kg ai/ha kg
ai/hL No Sample PHI Residues
Reference, Report No.
USA California, Terra Bella 2000 (Monterey)
480 SC 0.14 0.007 3 Thiacloprid only: Nutmeat Hulls Total residue1: Nutmeat Hulls
8 14 20 23 8 14 20 23 8 14 20 23 8 14 20 23
< 0.01 < 0.01 < 0.01 < 0.01
3.8 3.7 4.5 2.4
< 0.01 < 0.01 < 0.01 < 0.01
3.8 3.7 4.6 2.5
Harbin, A. M. 2004 110307
USA California, Terra Bella 2000 (Monterey)
70 WG 0.14 0.022 3 Thiacloprid only: Nutmeat Hulls Total residue1: Nutmeat Hulls
8 14 20 23 8 14 20 23 8 14 20 23 8 14 20 23
< 0.01 < 0.01 < 0.01 < 0.01
2.0 3.2 2.6 1.4
< 0.01 < 0.01 < 0.01 < 0.01
2.1 3.2 2.6 1.4
Harbin, A. M. 2004 110307
USA California, Terra Bella 2000 (Monterey)
70 WG 0.14 0.007 3 Thiacloprid only: Nutmeat Hulls Total residue1: Nutmeat Hulls
8 14 20 23 8 14 20 23 8 14 20 23 8 14 20 23
< 0.01 < 0.01 < 0.01 < 0.01
2.4 3.3 2.4 2.3
< 0.01 < 0.01 < 0.01 < 0.01
2.4 3.4 2.4 2.4
Harbin, A. M. 2004 110307
1 Determined as sum of thiacloprid, thiacloprid -amide and 4-hydroxy-thiacloprid-amide

Thiacloprid 1093
Table 63. Thiacloprid residues resulting from foliar application to pecan.
Application Analysis Location Year (variety)
Form kg ai/ha kg
ai/hL No Sample PHI Residues
Reference, Report No.
USA Georgia, Chula 2000 (Summer)
480 SC 0.14 0.15 0.14
0.023 0.027 0.025
3 Thiacloprid only: Nutmeat Total residue1: Nutmeat
13 13
< 0.01
< 0.01
Harbin, A. M. 2004 110307
USA Georgia, Chula 2000 (Summer)
480 SC 0.14 0.14 0.14
0.004 0.005 0.005
3 Thiacloprid only: Nutmeat Total residue1: Nutmeat
13 13
< 0.01
< 0.01
Harbin, A. M. 2004 110307
USA Louisiana, Alexandria 2000 (Cape Fear)
480 SC 0.14 0.029 3 Thiacloprid only: Nutmeat Total residue1: Nutmeat
14 14
< 0.01
< 0.01
Harbin, A. M. 2004 110307
USA Louisiana, Alexandria 2000 (Cape Fear)
480 SC 0.14 0.006 3 Thiacloprid only: Nutmeat Total residue1: Nutmeat
14 14
< 0.01
< 0.01
Harbin, A. M. 2004 110307
USA Louisiana, Alexandria 2000 (Cape Fear)
70 WG 0.14 0.029 3 Thiacloprid only: Nutmeat Total residue1: Nutmeat
14 14
< 0.01
< 0.01
Harbin, A. M. 2004 110307
USA Louisiana, Alexandria 2000 (Cape Fear)
70 WG 0.14 0.006 3 Thiacloprid only: Nutmeat Total residue1: Nutmeat
14 14
< 0.01
< 0.01
Harbin, A. M. 2004 110307
USA Texas, Boling 2000 (Choctaw)
480 SC 0.14 0.029 3 Thiacloprid only: Nutmeat Total residue1: Nutmeat
14 14
< 0.01
< 0.01
Harbin, A. M. 2004 110307
USA Texas, Boling 2000 (Choctaw)
480 SC 0.14 0.006 3 Thiacloprid only: Nutmeat Total residue1: Nutmeat
14 14
< 0.01
< 0.01
Harbin, A. M. 2004 110307
USA Texas, Uvalde 2000 (Stuart)
480 SC 0.14 0.14 0.15
0.033 0.035 0.033
3 Thiacloprid only: Nutmeat Total residue1: Nutmeat
12 12
< 0.01
< 0.01
Harbin, A. M. 2004 110307
USA Texas, Uvalde 2000 (Stuart)
480 SC 0.14 0.007 3 Thiacloprid only: Nutmeat Total residue1: Nutmeat
12 12
< 0.01
< 0.01
Harbin, A. M. 2004 110307

1094 Thiacloprid
Application Analysis Location Year (variety)
Form kg ai/ha kg
ai/hL No Sample PHI Residues
Reference, Report No.
USA Georgia, Albany 2000 (Stuart)
480 SC 0.14 0.14 0.14
0.027 0.029 0.027
3 Thiacloprid only: Nutmeat Total residue1: Nutmeat
9 14 19 23 9 14 19 23
< 0.01 < 0.01 < 0.01 < 0.01
< 0.01 < 0.01 < 0.01 < 0.01
Harbin, A. M. 2004 110307
USA Georgia, Albany 2000 (Stuart)
480 SC 0.14 0.005 3 Thiacloprid only: Nutmeat Total residue1: Nutmeat
9 14 19 23 9 14 19 23
< 0.01 < 0.01 < 0.01 < 0.01
< 0.01 < 0.01 < 0.01 < 0.01
Harbin, A. M. 2004 110307
USA Georgia, Albany 2000 (Stuart)
70 WG 0.14 0.14 0.14
0.027 0.029 0.027
3 Thiacloprid only: Nutmeat Total residue1: Nutmeat
9 14 19 23 9 14 19 23
< 0.01 < 0.01 < 0.01 < 0.01
< 0.01 < 0.01 < 0.01 < 0.01
Harbin, A. M. 2004 110307
USA Georgia, Albany 2000 (Stuart)
70 WG 0.14 0.005 3 Thiacloprid only: Nutmeat Total residue1: Nutmeat
9 14 19 23 9 14 19 23
< 0.01 < 0.01 < 0.01 < 0.01
< 0.01 < 0.01 < 0.01 < 0.01
Harbin, A. M. 2004 110307
1 Determined as sum of thiacloprid, thiacloprid -amide and 4-hydroxy-thiacloprid-amide

Thiacloprid 1095
Oilseeds
Table 64. Thiacloprid residues resulting from foliar application to oilseed rape.
Application Analysis Location Year (variety)
Form kg ai/ha kg
ai/hL No Sample PHI Residues
Reference, Report No.
Hungary Kaposvár-Dénes-major 2000 (Valeska)
480 SC 0.096 0.031 1 Seed 31 0.02, < 0.02, < 0.02 (0.02)
Orosz, F. 2000b 00-BAY-AA-14-04
France Villettes 2001 (Pollen)
240 OD
0.096 0.032 1 Green material Straw Seed
0 30 30
1.0
0.25
0.07
Schoening, R. 2002e RA-2171/01
Germany Burscheid 2001 (Express)
240 OD
0.096 0.032 1 Green material Pod Rest of Plant Seed Straw
0 7 14 7 14 22 29 33 29
1.6
1.4 0.50
0.71 0.08
0.06 0.05 0.04
0.28
Schoening, R. 2002e RA-2171/01
Germany Burscheid 2002 (Licondor)
240 OD
0.12 0.04 1 Pod Rest of Plant Seed Straw
0 0 31 31
2.6
2.2
< 0.02
0.18
Billian, P. and Schoening, R. 2003d RA-2025/02
France Etrepagny 2002 (Zenith)
240 OD
0.12 0.04 1 Pod Rest of Plant Seed Straw
0 7 14 22 0 7 14 22 30 35 30
1.9 0.31 0.22 0.18
1.1 0.17 0.08 0.04
< 0.02 < 0.02
0.31
Billian, P. and Schoening, R. 2003d RA-2025/02
Sweden Dalby 2002 (Stratos)
240 OD
0.12 0.04 1 Pod Rest of Plant Seed Straw
0 0 29 29
3.1
1.9
0.05
0.07
Billian, P. and Schoening, R. 2003d RA-2025/02
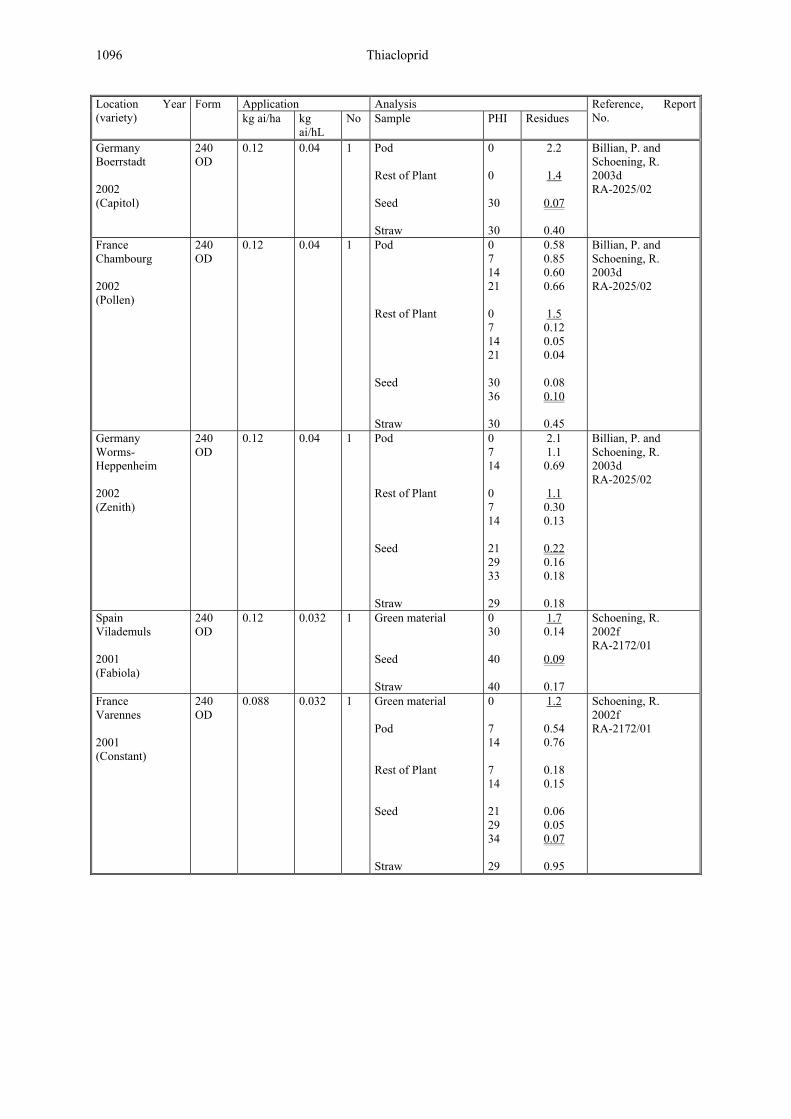
1096 Thiacloprid
Application Analysis Location Year (variety)
Form kg ai/ha kg
ai/hL No Sample PHI Residues
Reference, Report No.
Germany Boerrstadt 2002 (Capitol)
240 OD
0.12 0.04 1 Pod Rest of Plant Seed Straw
0 0 30 30
2.2
1.4
0.07
0.40
Billian, P. and Schoening, R. 2003d RA-2025/02
France Chambourg 2002 (Pollen)
240 OD
0.12 0.04 1 Pod Rest of Plant Seed Straw
0 7 14 21 0 7 14 21 30 36 30
0.58 0.85 0.60 0.66
1.5 0.12 0.05 0.04
0.08 0.10
0.45
Billian, P. and Schoening, R. 2003d RA-2025/02
Germany Worms-Heppenheim 2002 (Zenith)
240 OD
0.12 0.04 1 Pod Rest of Plant Seed Straw
0 7 14 0 7 14 21 29 33 29
2.1 1.1 0.69
1.1 0.30 0.13
0.22 0.16 0.18
0.18
Billian, P. and Schoening, R. 2003d RA-2025/02
Spain Vilademuls 2001 (Fabiola)
240 OD
0.12 0.032 1 Green material Seed Straw
0 30 40 40
1.7 0.14
0.09
0.17
Schoening, R. 2002f RA-2172/01
France Varennes 2001 (Constant)
240 OD
0.088 0.032 1 Green material Pod Rest of Plant Seed Straw
0 7 14 7 14 21 29 34 29
1.2
0.54 0.76
0.18 0.15
0.06 0.05 0.07
0.95
Schoening, R. 2002f RA-2172/01

Thiacloprid 1097
Application Analysis Location Year (variety)
Form kg ai/ha kg
ai/hL No Sample PHI Residues
Reference, Report No.
Spain Vilobi D’Onyar 2001 (Fabiola)
240 OD
0.12 0.04 1 Pod Rest of Plant Seed Straw
0 7 13 20 0 7 13 20 30 34 30
2.5 1.4 1.2 1.4
1.1 0.38 0.22 0.17
0.33 0.30
0.87
Billian, P. and Schoening, R. 2003e RA-2026/02
France Bouloc 2002 (Olara)
240 OD
0.11 0.04 1 Pod Rest of Plant Seed Straw
0 0 30 30
2.3
1.1
0.03
0.10
Billian, P. and Schoening, R. 2003e RA-2026/02
Single underlined values were used for the evaluation of rape forage Double underlined values were used for the evaluation of rape seed and white mustard seed
Table 65. Thiacloprid residues resulting from foliar application to cotton.
Application Analysis Location Year (variety)
Form kg ai/ha kg
ai/hL No Sample PHI Residues
Reference, Report No.
Spain Coria del Rio 1997 (Bravo)
480 SC 0.096 0.019 3 Thiacloprid only: Seed Total residue1: Seed
21 21
< 0.02
0.94
Schoening, R. and Sur, R. 2000a RA-2115/97 Replicate 1
Spain Coria del Rio 1997 (Bravo)
480 SC 0.096 0.019 3 Thiacloprid only: Seed Total residue1: Seed
21 21
< 0.02
1.1
Schoening, R. and Sur, R. 2000a RA-2115/97 Replicate 2
Greece Alexandria 1997 (Tempra)
480 SC 0.096 0.0096 3 Thiacloprid only: Seed Total residue1: Seed
20 20
< 0.02
1.4
Schoening, R. and Sur, R. 2000a RA-2115/97
Greece Alexandria 1997 (Bravo)
480 SC 0.096 0.096 3 Thiacloprid only: Seed Total residue1: Seed
21 21
< 0.02
2.0
Schoening, R. and Sur, R. 2000a RA-2115/97
Spain Palomares 1998 (Bravo)
480 SC 0.096 0.019 3 Thiacloprid only: Seed Total residue1: Seed
21 21
< 0.02
0.76
Schoening, R. and Sur, R. 2000b RA-2073/98 Replicate 1

1098 Thiacloprid
Application Analysis Location Year (variety)
Form kg ai/ha kg
ai/hL No Sample PHI Residues
Reference, Report No.
Spain Palomares 1998 (Bravo)
480 SC 0.096 0.019 3 Thiacloprid only: Seed Total residue1: Seed
21 21
< 0.02
1.0
Schoening, R. and Sur, R. 2000b RA-2073/98 Replicate 2
Greece Trikala 1998 (Bravo)
480 SC 0.096 0.0096 3 Thiacloprid only: Seed Total residue1: Seed
21 21
< 0.02
1.7
Schoening, R. and Sur, R. 2000b RA-2073/98
Greece Alexandria 1998 (Bravo)
480 SC 0.096 0.0096 3 Thiacloprid only: Seed Total residue1: Seed
21 21
< 0.02
0.83
Schoening, R. and Sur, R. 2000b RA-2073/98
USA Louisiana, Cheneyville 1997 (Delta and Pine Land)
480 SC 0.11 0.12 3 Total residue1: Seed Gintrash
13 13
0.24, 0.33
(0.29)
9.5, 10.7 (10.1)
Koch, A. 1999 109011
USA Louisiana, Cheneyville 1997 (Delta and Pine Land)
70 WG 0.11 0.12 3 Total residue1: Seed Gintrash
13 13
0.46, 0.42
(0.44)
9.4, 8.6 (9.0)
Koch, A. 1999 109011
USA Arkansas, Shoffner 1997 (Suregrow 125)
480 SC 0.11 0.15 3 Total residue1: Seed gintrash
15 15
0.49, 0.38
(0.44)
10.9, 8.2 (9.6)
Koch, A. 1999 109011
USA Arkansas, Shoffner 1997 (Suregrow 125)
70 WG 0.11 0.15 3 Total residue1: Seed Gintrash
15 15
0.23, 0.21
(0.22)
8.6, 9.2 (8.9)
Koch, A. 1999 109011
USA Texas, Bernard 1997 (Deltapine 33B)
480 SC 0.11 0.12 3 Total residue1: Seed
14
0.84, 0.62
(0.73)
Koch, A. 1999 109011
USA Texas, Bernard 1997 (Deltapine 33B)
70 WG 0.11 0.12 3 Total residue1: Seed
14
0.31, 0.75
(0.53)
Koch, A. 1999 109011
USA Texas, Floydada 1997 (HS-26)
480 SC 0.11 0.12 3 Total residue1: Seed
14
0.09, 0.11
(0.10)
Koch, A. 1999 109011
USA Texas, Floydada 1997 (HS-26)
70 WG 0.11 0.13 3 Total residue1: Seed
14
0.08, 0.08
(0.08)
Koch, A. 1999 109011

Thiacloprid 1099
Application Analysis Location Year (variety)
Form kg ai/ha kg
ai/hL No Sample PHI Residues
Reference, Report No.
USA Texas, Olton 1997 (Paymaster 145)
480 SC 0.11 0.13 3 Total residue1: Seed Gintrash
14 14
0.70, 0.64
(0.67)
8.4, 8.0 (8.2)
Koch, A. 1999 109011
USA Texas, Olton 1997 (Paymaster 145)
70 WG 0.11 0.13 3 Total residue1: Seed Gintrash
14 14
0.54, 0.50
(0.52)
9.7, 8.1 (8.9)
Koch, A. 1999 109011
USA Oklahoma, Eakly 1997 (Paymaster 183)
480 SC 0.11 0.12 2 Total residue1: Seed Gintrash
17 17
0.14, 0.23
(0.19)
1.1, 1.3 (1.2)
Koch, A. 1999 109011
USA Oklahoma, Eakly 1997 (Paymaster 183)
70 WG 0.11 0.12 3 Total residue1: Seed Gintrash
17 17
0.20, 0.18
(0.19)
1.4, 0.95 (1.2)
Koch, A. 1999 109011
USA Oklahoma, Dill City 1997 (Paymaster HS-200)
480 SC 0.11 0.13 3 Total residue1: Seed Gintrash
20 20
0.56, 0.55
(0.56)
2.5, 1.7 (2.1)
Koch, A. 1999 109011
USA Oklahoma, Dill City 1997 (Paymaster HS-200)
70 WG 0.11 0.13 3 Total residue1: Seed Gintrash
20 20
0.33, 0.41,
(0.37)
2.3, 3.2 (2.8)
Koch, A. 1999 109011
USA California, Madera 1997 (Maxxa)
480 SC 0.11 0.15 3 Total residue1: Seed
15
< 0.05, < 0.05 < 0.05)
Koch, A. 1999 109011
USA California, Madera 1997 (Maxxa)
70 WG 0.11 0.15 3 Total residue1: Seed
15
< 0.05, < 0.05
(< 0.05)
Koch, A. 1999 109011
USA California, Kerman 1997 (Maxxa)
480 SC 0.11 0.15 3 Total residue1: Seed
14
0.15, 0.11
(0.13)
Koch, A. 1999 109011
USA California, Kerman 1997 (Maxxa)
70 WG 0.11 0.15 3 Total residue1: Seed
14
0.21, 0.26
(0.24)
Koch, A. 1999 109011

1100 Thiacloprid
Application Analysis Location Year (variety)
Form kg ai/ha kg
ai/hL No Sample PHI Residues
Reference, Report No.
USA Mississippi, Benoit 1997 (Deltapine 50)
480 SC 0.11 0.20 3 Total residue1: Seed gintrash
8 12 17 21 8 12 17 21
0.11, 0.13
(0.12) 0.09, 0.23
(0.16) 0.26, 0.25
(0.26) 0.46, 0.22
(0.34)
3.5, 5.0 (4.3)
3.3, 3.9 (3.6)
2.4, 2.4 (2.4)
2.9, 2.2 (2.6)
Koch, A. 1999 109011
USA Mississippi, Benoit 1997 (Deltapine 50)
70 WG 0.11 0.21 3 Total residue1: Seed Gintrash
12 12
< 0.05,
0.11 (0.08)
3.1, 3.8 (3.5)
Koch, A. 1999 109011
USA California, Fresno 1997 (Maxxa)
480 SC 0.11 0.12 3 Total residue1: Seed
14
0.34, 0.15
(0.25)
Koch, A. 1999 109011
USA Georgia, Tifton 1997 (DPL5415)
480 SC 0.11 0.13 3 Total residue1: Seed
16
0.48, 0.54
(0.51)
Koch, A. 1999 109011
USA Georgia, Tifton 1997 (DPL5415)
70 WG 0.11 0.13 3 Total residue1: Seed
16
0.49, 0.63
(0.56)
Koch, A. 1999 109011
1 determined as 6-CNA
Table 66. Thiacloprid residues resulting from foliar application to sunflowers.
Application Analysis Location Year (variety)
Form kg ai/ha kg
ai/hL No Sample PHI Residues
Reference, Report No.
Hungary Fonó Somogy 2000 (Arena)
480 SC 0.097 0.031 1 Seed 30 0.02, 0.03, 0.03 (0.03)
Orosz, F. 2000c 00-BAY-AA-14-05
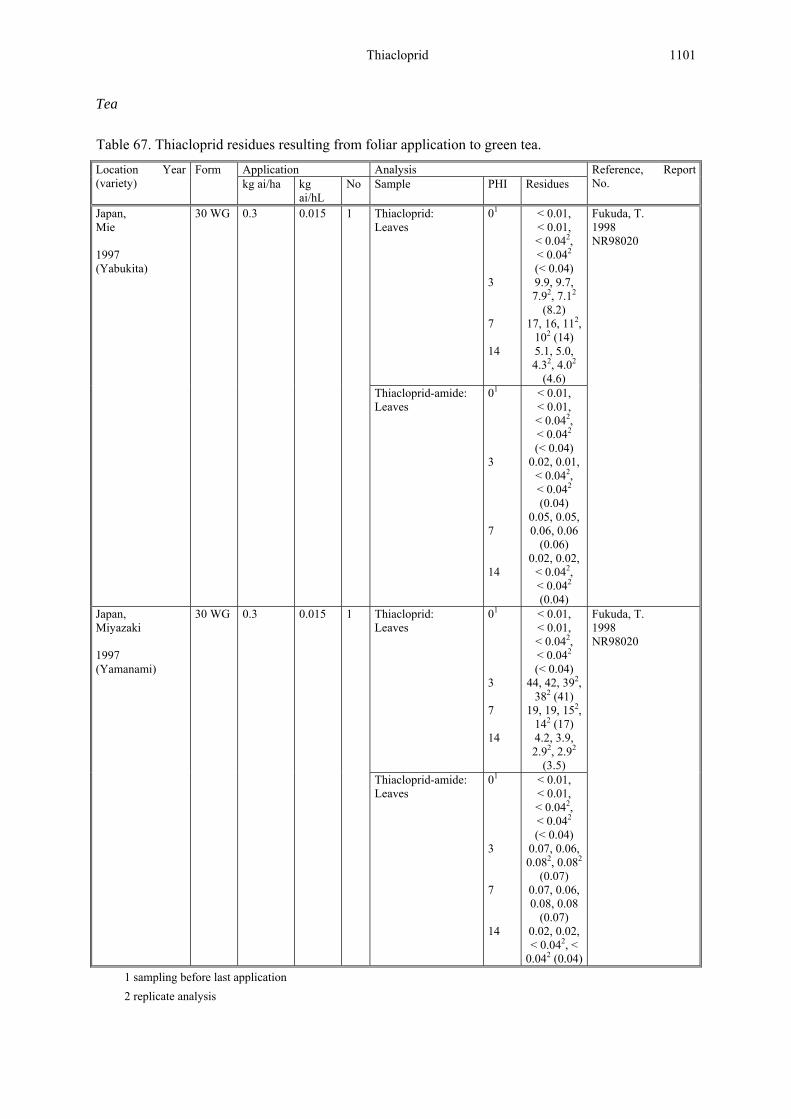
Thiacloprid 1101
Tea
Table 67. Thiacloprid residues resulting from foliar application to green tea.
Application Analysis Location Year (variety)
Form kg ai/ha kg
ai/hL No Sample PHI Residues
Reference, Report No.
Japan, Mie 1997 (Yabukita)
30 WG 0.3 0.015 1 Thiacloprid: Leaves
01 3 7 14
< 0.01, < 0.01, < 0.042, < 0.042 (< 0.04) 9.9, 9.7, 7.92, 7.12
(8.2) 17, 16, 112,
102 (14) 5.1, 5.0, 4.32, 4.02
(4.6)
Fukuda, T. 1998 NR98020
Thiacloprid-amide: Leaves
01 3 7 14
< 0.01, < 0.01, < 0.042, < 0.042 (< 0.04)
0.02, 0.01, < 0.042, < 0.042 (0.04)
0.05, 0.05, 0.06, 0.06
(0.06) 0.02, 0.02,
< 0.042, < 0.042 (0.04)
Japan, Miyazaki 1997 (Yamanami)
30 WG 0.3 0.015 1 Thiacloprid: Leaves
01 3 7 14
< 0.01, < 0.01, < 0.042, < 0.042 (< 0.04)
44, 42, 392, 382 (41)
19, 19, 152, 142 (17) 4.2, 3.9, 2.92, 2.92
(3.5)
Fukuda, T. 1998 NR98020
Thiacloprid-amide: Leaves
01 3 7 14
< 0.01, < 0.01, < 0.042, < 0.042 (< 0.04)
0.07, 0.06, 0.082, 0.082
(0.07) 0.07, 0.06, 0.08, 0.08
(0.07) 0.02, 0.02, < 0.042, <
0.042 (0.04)
1 sampling before last application 2 replicate analysis

1102 Thiacloprid
FATE OF RESIDUES IN STORAGE AND PROCESSING
Processing
In hydrolysis experiments designed to simulate typical procesing operations (Riegner, K., 1998) [methylene-14C]-thiacloprid was incubated in aqueous buffer solutions at a concentration of 0.41 mg/L at 90°C (pH 4 for 20 min), 100°C (pH 5 for 60 min) and 120°C (pH 6 for 20 min) (Table 68).
At zero-time and test termination the samples were analysed by HPLC and by thin-layer chro-matography. The content of radioactivity was determined by liquid scintillation counting. Material balances were established at each sampling time.
Table 68. Representative hydrolysis conditions.
Hydrolysis Sampling time Content of thiacloprid Conditions (min) (% of applied radioactivity *) pH 4; 90 °C; 0 97.6 20 min. 20 98.1 pH 5; 100 °C; 0 97.0 60 min. 60 96.5 pH 6; 120 °C; 0 96.9 20 min. 20 97.0
After incubation, the radioactivity in the neutralised buffer solutions represented unchanged thiacloprid (96.5–98.1% of the applied radioactivity), demonstrating that no significant hydrolytic degradation had taken place under the simulated processing conditions.
Processing studies on melons and watermelons, apples, peaches, cherries and tomatoes were reported.
Melons
Residues in melons and watermelons incurred as a result of foliar treatment . The specific trial data is presented in Table 45 and Table 47. As relevant processing step the seperation of pulp and peel was investigated. In Table 69 the residues and processing factors for melons and watermelons are summarised.
Table 69. Processing studies on melons.
Location Year (variety)
Sample PHI Residues Processing factor Reference, Report No.
MELONS Greece Larisa 1995 (Midi Star)
Peel Pulp Whole fruit2
01 0 3 7
10
01 0 3 7
10
01 0 3 7
10
0.03 0.08 0.02 0.02
< 0.02
< 0.02 < 0.02 < 0.02 < 0.02 < 0.02
< 0.02 0.04
< 0.02 < 0.02 < 0.02
2 1 1 nc
0.5 nc nc nc
Placke, F. J. 1997j RA-2061/95

Thiacloprid 1103
Location Year (variety)
Sample PHI Residues Processing factor Reference, Report No.
Italy Trinitapoli 1995 (Leglend)
Peel Pulp Whole fruit2
01 0 3 7
10
01 0 3 7
10
01 0 3 7
10
0.02 0.23 0.08 0.05
< 0.02
< 0.02 < 0.02 < 0.02 < 0.02 < 0.02
< 0.02 0.09 0.03 0.02
< 0.02
2.6 2.7 2.5 nc
0.22 0.66
1 nc
Placke, F. J. 1997j RA-2061/95
Greece Larisa 1996 (Gold Star F1)
Whole fruit Peel Pulp Whole fruit2
01 0 1 3 7 3 7 3 7
0.04 0.05 0.06
0.36 0.28
< 0.02 < 0.02
0.06 0.04
6 7
0.33 0.5
Placke, F. J. 1997k RA-2118/96
Italy Lequile 1996 (Galia)
Whole fruit Peel Pulp Whole fruit2
01 0 1 3 7 3 7 3 7
0.03 0.06 0.06
0.23 0.23
< 0.02 < 0.02
0.06 0.06
3.8 3.8
0.33 0.33
Placke, F. J. 1997k RA-2118/96
France Verlhac7Tescou 2000 (Figaro)
Whole fruit Peel Pulp
0 3 3 3
0.07 0.05
0.13
< 0.02
2.6
0.4
Schoening, R. and Nuesslein, F. 2001b RA-2115/00
France Sarrians 2000 (Sirio)
Whole fruit Peel Pulp
0 3 3 3
0.05 0.02
0.05
< 0.02
2.5
1
Schoening, R. and Nuesslein, F. 2001b RA-2115/00
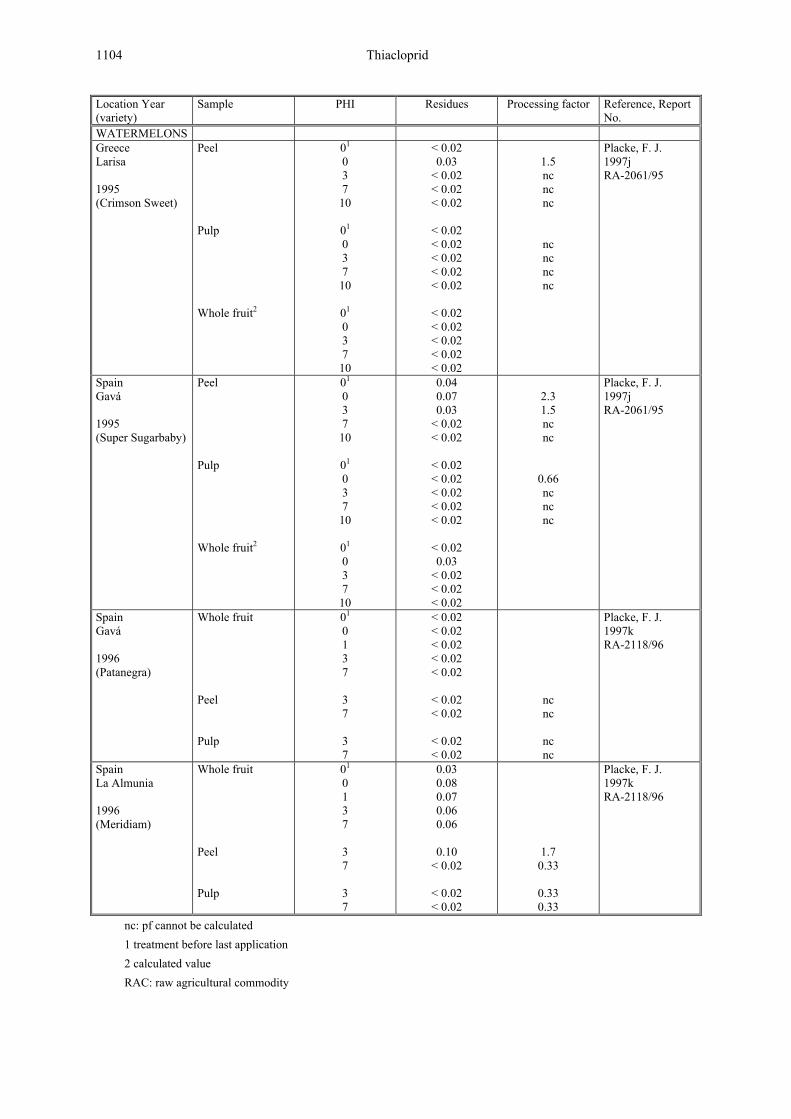
1104 Thiacloprid
Location Year (variety)
Sample PHI Residues Processing factor Reference, Report No.
WATERMELONS Greece Larisa 1995 (Crimson Sweet)
Peel Pulp Whole fruit2
01 0 3 7
10
01 0 3 7
10
01 0 3 7
10
< 0.02 0.03
< 0.02 < 0.02 < 0.02
< 0.02 < 0.02 < 0.02 < 0.02 < 0.02
< 0.02 < 0.02 < 0.02 < 0.02 < 0.02
1.5 nc nc nc
nc nc nc nc
Placke, F. J. 1997j RA-2061/95
Spain Gavá 1995 (Super Sugarbaby)
Peel Pulp Whole fruit2
01 0 3 7
10
01 0 3 7
10
01 0 3 7
10
0.04 0.07 0.03
< 0.02 < 0.02
< 0.02 < 0.02 < 0.02 < 0.02 < 0.02
< 0.02 0.03
< 0.02 < 0.02 < 0.02
2.3 1.5 nc nc
0.66 nc nc nc
Placke, F. J. 1997j RA-2061/95
Spain Gavá 1996 (Patanegra)
Whole fruit Peel Pulp
01 0 1 3 7 3 7 3 7
< 0.02 < 0.02 < 0.02 < 0.02 < 0.02
< 0.02 < 0.02
< 0.02 < 0.02
nc nc
nc nc
Placke, F. J. 1997k RA-2118/96
Spain La Almunia 1996 (Meridiam)
Whole fruit Peel Pulp
01 0 1 3 7 3 7 3 7
0.03 0.08 0.07 0.06 0.06
0.10
< 0.02
< 0.02 < 0.02
1.7 0.33
0.33 0.33
Placke, F. J. 1997k RA-2118/96
nc: pf cannot be calculated 1 treatment before last application 2 calculated value RAC: raw agricultural commodity

Thiacloprid 1105
Residues were below the limit of quantification (< 0.02 mg/kg) in melons before processing, but were quantified in peel or pulp. In cases were residues were measurable in processed fractions, transfer values were calculated by taking residues in whole fruits before processing as equal to the LOQ (0.02 mg/kg).
Apples
Two trials on apples were conducted in Italy and Germany 1995. The application rate was 0.144 kg ai/ha. The water rate was 500 and 1500 L/ha corresponding to a spray concentration of 0.02% or 0.06%, respectively. The two treatments were conducted during fruit development and fruit colouring at an interval of 14 days. The last application was carried out 14 days prior to the expected harvest (recommended waiting period). For processing, apple fruits were taken from the treated and the untreated plot on day 14 (harvest).
The washing of apples was done using domestic practice (see Figure 5). The preparation of dried apples, apple juice, dried pomace and apple sauce simulated the industrial practice at a laboratory scale (see Figures 6, 7 and 8).
The residues of thiacloprid were determined according to method 00419. The recoveries ranged from 77 to 108% at fortification levels of 0.02 and 0.20 mg/kg for fruit, from 92 to 104% at fortification level of 0.02 mg/kg for juice, from 75 to 80% at fortification level of 0.02 mg/kg for pomace, from 88 to 89% at fortification level of 0.02 mg/kg for dried fruit and from 89 to 98% at fortification levels of 0.02 and 0.20 mg/kg for sauce. The limit of quantitation (LOQ) was 0.02 mg/kg.
Figure 5. Flow Diagram for the preparation of washed apples.
Apples
Washing Wash Water Water
Washed Apples
Cutting
Washed Apples
Sampling
Storage of analytical samples
samples or fractions to be analysed
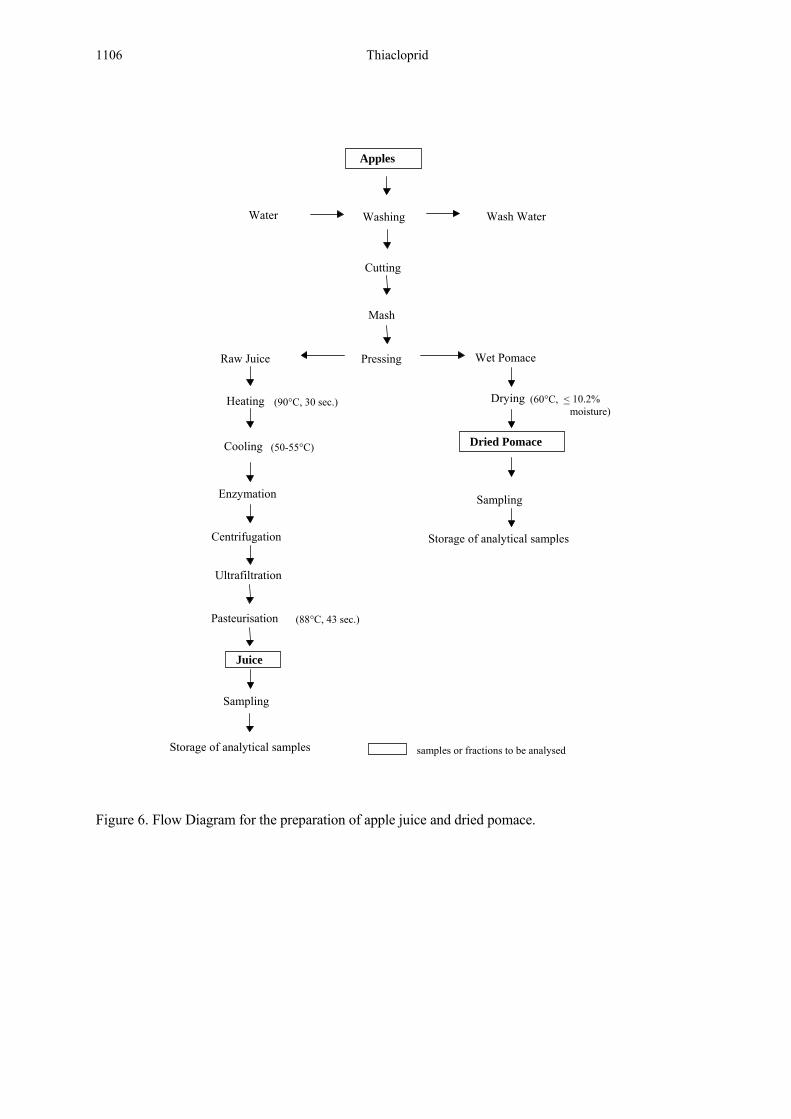
1106 Thiacloprid
Figure 6. Flow Diagram for the preparation of apple juice and dried pomace.
Apples
Washing Wash WaterWater
Cutting
Mash
Pressing Wet PomaceRaw Juice
Heating (90°C, 30 sec.)
Enzymation
Centrifugation
Ultrafiltration
Pasteurisation (88°C, 43 sec.)
Juice
Sampling
Storage of analytical samples
Drying (60°C, < 10.2% moisture)
Dried Pomace
Sampling
Storage of analytical samples
samples or fractions to be analysed
Cooling (50-55°C)

Thiacloprid 1107
Figure 7. Flow Diagram for the preparation of apple sauce.
Washing Wash WaterWater
Cutting
Blanching (98-100°C, 15 min.)
Passing Wet PomaceRaw Apple Sauce
Filling into cans
Pasteurisation (82-91°C)
Apple Sauce
Sampling
Storage of analytical samples
Water
Sugar
samples or fractions to be
Apples
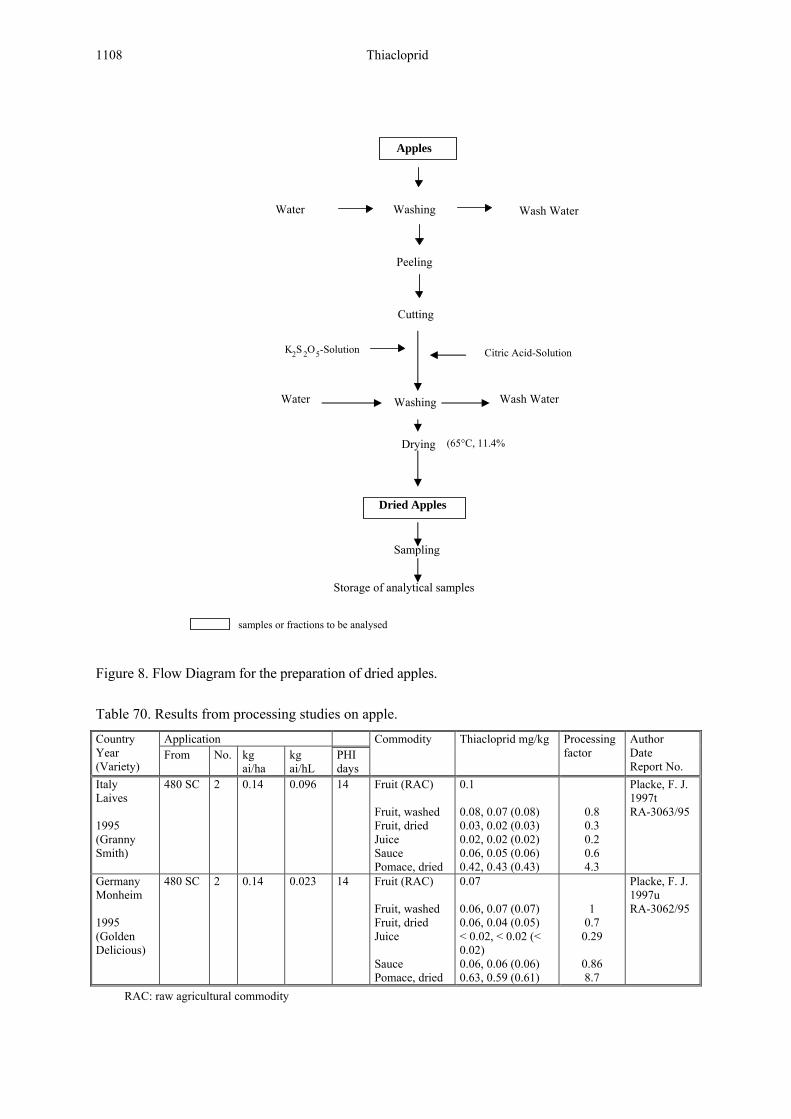
1108 Thiacloprid
Figure 8. Flow Diagram for the preparation of dried apples.
Table 70. Results from processing studies on apple. Application Country
Year (Variety)
From No. kg ai/ha
kg ai/hL
PHI days
Commodity Thiacloprid mg/kg Processing factor
Author Date Report No.
Italy Laives 1995 (Granny Smith)
480 SC 2 0.14 0.096 14 Fruit (RAC) Fruit, washed Fruit, dried Juice Sauce Pomace, dried
0.1 0.08, 0.07 (0.08) 0.03, 0.02 (0.03) 0.02, 0.02 (0.02) 0.06, 0.05 (0.06) 0.42, 0.43 (0.43)
0.8 0.3 0.2 0.6 4.3
Placke, F. J.1997t RA-3063/95
Germany Monheim 1995 (Golden Delicious)
480 SC 2 0.14 0.023 14 Fruit (RAC) Fruit, washed Fruit, dried Juice Sauce Pomace, dried
0.07 0.06, 0.07 (0.07) 0.06, 0.04 (0.05) < 0.02, < 0.02 (< 0.02) 0.06, 0.06 (0.06) 0.63, 0.59 (0.61)
1
0.7 0.29
0.86 8.7
Placke, F. J.1997u RA-3062/95
RAC: raw agricultural commodity
Apples
Washing Wash Water Water
Cutting
Drying (65°C, 11.4%
Storage of analytical samples
Peeling
Washing Wash WaterWater
K2S 2O5-Solution Citric Acid-Solution
Dried Apples
Sampling
samples or fractions to be analysed

Thiacloprid 1109
Peaches
Three trials on peaches were performed in Italy and Spain in 1995 and 1996. The application rate was 0.144 kg ai/ha. The water rate was 1500 L/ha corresponding to a spray concentration of 0.02%. The two treatments were conducted during fruit development and fruit colouring at an interval of 14 days. The last application was carried out 14 days prior to the expected harvest (recommended waiting period). All applications were at the required rate. For processing peaches were taken on day 14 from the treated and the untreated plot.
The washing of peaches was done using domestic practice, i.e., washing in standing water and stoning (Figure ). The preparation of peach preserves simulated industrial practice at a laboratory scale (Figure ). For the preparation of preserves, the peaches were washed in standing water, peeled and stoned. The peeled and stoned peaches were filled into 1L preserving cans and a solution of sugar was added. Then the peach preserves were pasteurised at about 90°C. After pasteurisation, the peach preserve was minced in a mixer.
The residues of thiacloprid were determined according to method 00419. The recoveries ranged from 92 to 104% at fortification levels of 0.02 and 0.20 mg/kg for fruit and from 92 to 99% at a fortification level of 0.02 mg/kg for the peach preserve. The limit of quantitation (LOQ) was 0.02 mg/kg.
Figure 9. Flow Diagram for the preparation of washed peaches
Washing Wash WaterWater
Washed Peaches
Stoning Stones
Washed Peaches
Sub-Sampling
Test portions for analysis
Shredding with dry ice
samples or fractions to be analysed
Peaches

1110 Thiacloprid
Figure 10. Flow Diagram for the preparation of peach preserve
Table 71. Results from processing studies on peach.
Application Country Year (Variety)
From No. kg ai/ha
kg ai/hL
PHI days
Commodity Thiacloprid mg/kg Processing factor
Author Date Report No.
Italy Ravenna 1995 (Red Haven)
480 SC 2 0.14 0.096 14 Fruit w/o stone (RAC) Fruit, washed Preserve
0.03 0.02, 0.02 (0.02) < 0.02, < 0.02 (< 0.02)
0.66 0.66
Placke, F. J.1997v RA-3064/95
Peaches
Washing Wash Water Water
Peeling
Stoning Stones
Filling into cans
Pasteurisation (90°C)
Peel
Sugar Solution
Mincing
Sub-Sampling
Test portion for analysis
Peach Preserves
samples or fractions to be analysed

Thiacloprid 1111
Application Country Year (Variety)
From No. kg ai/ha
kg ai/hL
PHI days
Commodity Thiacloprid mg/kg Processing factor
Author Date Report No.
Italy Ravenna 1996 (Red Haven)
480 SC 2 0.14 0.096 14 Fruit with stone (RAC) Fruit, washed Preserve
0.03 < 0.02, < 0.02 (< 0.02) < 0.02, < 0.02 (< 0.02)
0.66
0.66
Placke, F. J.1997w RA-3121/96
Spain La Fortesa 1996 (Baby Gold 9)
480 SC 2 0.14 0.096 14 Fruit with stone (RAC) Fruit, washed Preserve
0.09 0.06, 0.06 (0.06) < 0.02, < 0.02 (< 0.02)
0.66 0.22
Placke, F. J.1997w RA-3121/96
RAC: raw agricultural commodity
Cherries
For cherries one trial was conducted in Germany in 1999 (Schoening, R. and Sur, R., 2000c). Thiacloprid 480 SC was sprayed twice to sour cherry trees at a rate of 0.25 L/ha, corresponding to 0.12 kg ai/ha. The spray volume was 500 L per metre of plant height per hectare. The volume was adapted to the height of the leafy surface (500 L/(ha × m height) not exceeding 1500 L water/ha). The last treatment was performed 14 days prior to harvest. Samples were taken 14 days after the last application. The washing of cherries was done according to household practice. The preparation of cherry preserves simulated the industrial practice at laboratory scale. The processing procedures are described in Figure 11 and Figure 12. Analysis of thiacloprid was done according to method 00548.
Figure 6. Flow diagram for the preparation of washed cherries.
Cherries
Washing Washing Water Water
Washed Cherries
Shredding with dry ice
Washed Cherries
samples or fractions to be analysed
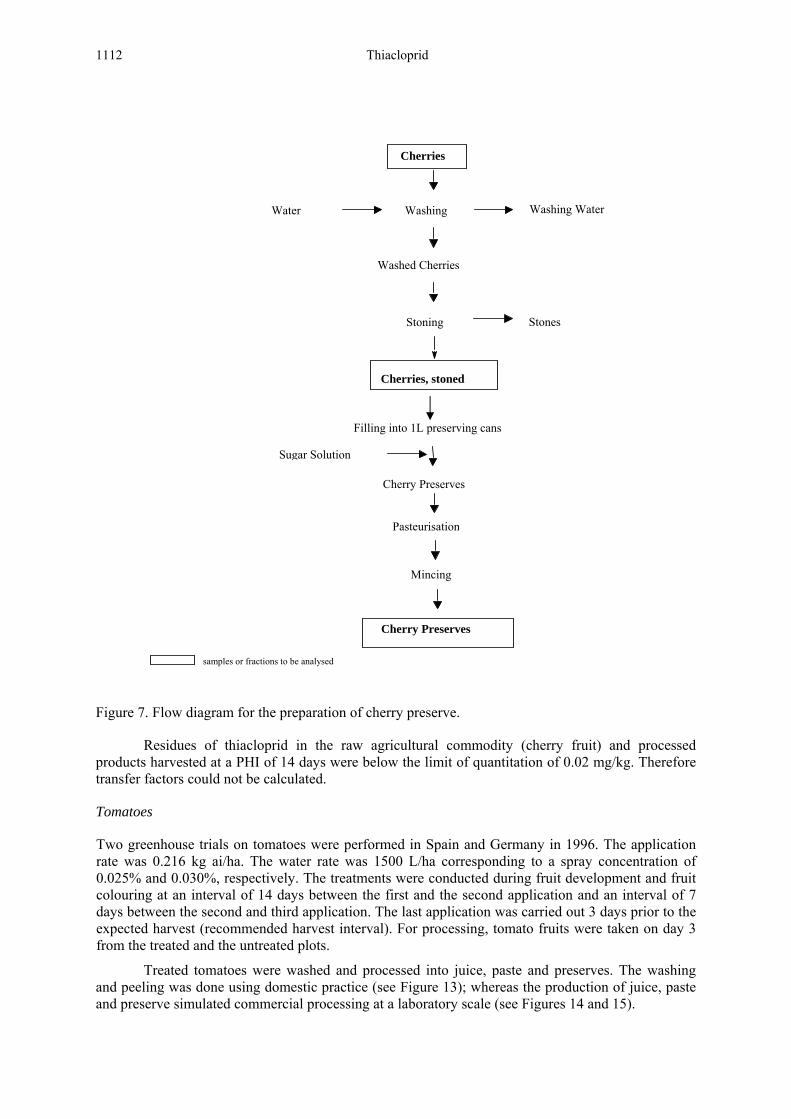
1112 Thiacloprid
Figure 7. Flow diagram for the preparation of cherry preserve.
Residues of thiacloprid in the raw agricultural commodity (cherry fruit) and processed products harvested at a PHI of 14 days were below the limit of quantitation of 0.02 mg/kg. Therefore transfer factors could not be calculated.
Tomatoes
Two greenhouse trials on tomatoes were performed in Spain and Germany in 1996. The application rate was 0.216 kg ai/ha. The water rate was 1500 L/ha corresponding to a spray concentration of 0.025% and 0.030%, respectively. The treatments were conducted during fruit development and fruit colouring at an interval of 14 days between the first and the second application and an interval of 7 days between the second and third application. The last application was carried out 3 days prior to the expected harvest (recommended harvest interval). For processing, tomato fruits were taken on day 3 from the treated and the untreated plots.
Treated tomatoes were washed and processed into juice, paste and preserves. The washing and peeling was done using domestic practice (see Figure 13); whereas the production of juice, paste and preserve simulated commercial processing at a laboratory scale (see Figures 14 and 15).
Cherries
Washing Washing Water Water
Washed Cherries
Stoning Stones
Filling into 1L preserving cans
Pasteurisation
Sugar Solution
Mincing
Cherry Preserves
samples or fractions to be analysed
Cherries, stoned
Cherry Preserves

Thiacloprid 1113
For the preparation of juice the tomatoes were washed in standing water and then cut into small pieces. The tomato pieces were heated, with the addition of 100 mL water per 1 kg of tomatoes, to 100°C for about 8−10 minutes to prevent enzymatic reactions. After this blanching process the tomato pulp was passed through a strainer to separate juice and pomace. Sodium chloride (0.5−0.7% relative to the amount of juice) was added to the raw juice. The tomato juice was then filled into preserving cans and pasteurised for 2 minutes at about 90°C.
For the preparation of tomato paste the tomatoes were washed in standing water and then cut into small pieces. The tomato pieces were heated, with the addition of 100 mL water per 1 kg tomatoes, to approximately 100°C for about 8−10 minutes in order to prevent enzymatic reactions. After this blanching process the tomato pulp was passed through a strainer to separate juice and pomace. Subsequently the tomato juice was concentrated to 38–45% dry weight. After concentration the tomato paste was filled into cans. The tomato paste was then pasteurised for 5 minutes at about 90°C.
For the preparation of preserves the tomatoes were transferred into lukewarm water. After a few minutes the peel was removed. The peeled tomatoes were filled into 1L preserving cans with tomato juice added. The preserves were then pasteurised for 2−3 minutes at about 90 °C.
The residues of thiacloprid were determined according to method 00419. The recoveries ranged from 86 to 107% for fruit, from 89 to 108% for juice, from 93 to 97% for paste and from 80 to 98% for preserve at fortification levels of 0.02 and 0.20 mg/kg. The limit of quantification (LOQ) was 0.02 mg/kg.
Figure 13. Flow diagram for the preparation of peeled tomatoes.
Shredding with dry ice
Tomatoes, washed/peeled
Water Washing/Peeling Wash water
Sub-Sampling
Tomatoes
Test portion for analysis
samples or fractions to be analysed

1114 Thiacloprid
Figure 14. Flow diagram for the preparation of tomato juice and paste
WashingWater Wash water
Cutting
Water
Passing
Raw juice
Pomace, wet
Sodium chloride solution
Blanching water
Sub-Sampling
Test portion for analysis
Pasteurisation (90°C, 2 min.)
Sub-Sampling
Test portion for analysis
Pasteurisation (90°C, 5 min.)
Raw juice
Concentration (38 - 45% dry
Paste
Tomatoes
Blanching (100°C, 3-10 min.)
Juice
Paste
samples or fractions to be analysed
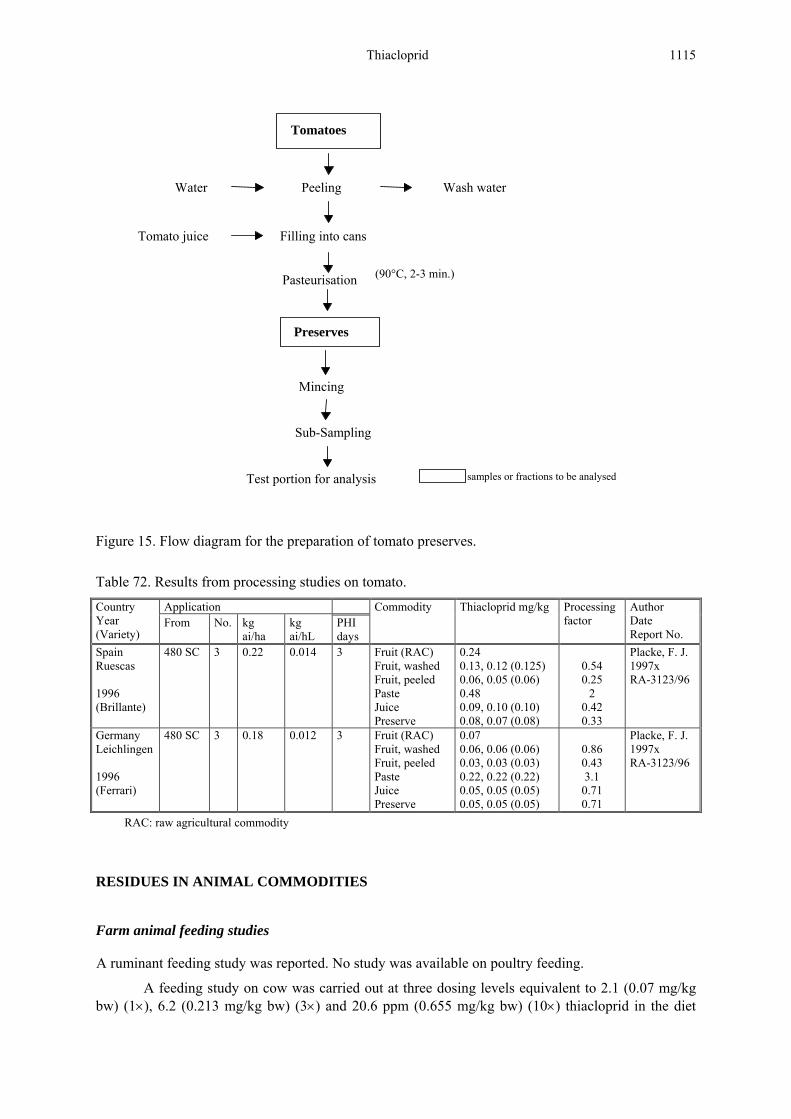
Thiacloprid 1115
Figure 15. Flow diagram for the preparation of tomato preserves.
Table 72. Results from processing studies on tomato.
Application Country Year (Variety)
From No. kg ai/ha
kg ai/hL
PHI days
Commodity Thiacloprid mg/kg Processing factor
Author Date Report No.
Spain Ruescas 1996 (Brillante)
480 SC 3 0.22 0.014 3 Fruit (RAC) Fruit, washed Fruit, peeled Paste Juice Preserve
0.24 0.13, 0.12 (0.125) 0.06, 0.05 (0.06) 0.48 0.09, 0.10 (0.10) 0.08, 0.07 (0.08)
0.54 0.25
2 0.42 0.33
Placke, F. J.1997x RA-3123/96
Germany Leichlingen 1996 (Ferrari)
480 SC 3 0.18 0.012 3 Fruit (RAC) Fruit, washed Fruit, peeled Paste Juice Preserve
0.07 0.06, 0.06 (0.06) 0.03, 0.03 (0.03) 0.22, 0.22 (0.22) 0.05, 0.05 (0.05) 0.05, 0.05 (0.05)
0.86 0.43 3.1 0.71 0.71
Placke, F. J.1997x RA-3123/96
RAC: raw agricultural commodity
RESIDUES IN ANIMAL COMMODITIES
Farm animal feeding studies
A ruminant feeding study was reported. No study was available on poultry feeding.
A feeding study on cow was carried out at three dosing levels equivalent to 2.1 (0.07 mg/kg bw) (1×), 6.2 (0.213 mg/kg bw) (3×) and 20.6 ppm (0.655 mg/kg bw) (10×) thiacloprid in the diet
Filling into cans Tomato juice
Water Peeling Wash water
Pasteurisation (90°C, 2-3 min.)
Mincing
Sub-Sampling
Test portion for analysis samples or fractions to be analysed
Tomatoes
Preserves

1116 Thiacloprid
together with an untreated control group (Placke, F. J., 1998b). There were three cows in each of the treatment groups. After acclimatisation, thiacloprid was administered daily to the cows in gelatine capsules for 28 consecutive days. Milk samples were collected and composited for each cow. At the end of the 28-day dosing period, the cows were sacrificed, and kidney, liver, composite fat (omental and perirenal), and composite muscle (flank, leg, and loin) were removed from each cow. Blood was washed from the tissues. The tissues were immediately cut into small pieces, frozen with dry ice, and stored in a freezer below -18°C until processing. Tissues from each cow were kept separate for individual analysis. All milk samples were kept in a freezer below -18°C until analysis and were also individually processed and analysed.
Samples of tissues and milk were analysed for parent and total residues of thiacloprid. The total residues comprising the active substance and all metabolites containing the 6-chloropyridine moiety were determined according to method 00491 (Schoening, R., 1998b), while the active substance residues were determined according to method 00490 (Schoening, R., 1998a).
The results are shown in Table 73 to Table 76. On average of the three cows treated per dose group, liver contained the highest thiacloprid residue levels (0.10 mg/kg) followed by kidney (0.03 mg/kg), milk and muscle (0.02 mg/kg) and fat (0.01 mg/kg) at the 1× dose level. Maximum levels for tissues were 0.02 mg/kg for fat, 0.02 mg/kg for muscle, 0.04 mg/kg for kidney and 0.11 mg/kg for liver.
In the second dose group thiacloprid residue increased to average values of 0.04 mg/kg in milk and fat (highest value 0.04 mg/kg) 0.05 mg/kg in muscle (highest value 0.06 mg/kg), 0.1 mg/kg in kidney (highest value 0.11 mg/kg) and 0.29 mg/kg in liver (highest value 0.32 mg/kg). In the high dose group the findings were 0.17 mg/kg in milk, 0.12 mg/kg in fat (highest value 0.16 mg/kg), 0.16 mg/kg in muscle (highest value 0.18 mg/kg), 0.27 mg/kg in kidney (highest value 0.32 mg/kg) and 0.94 mg/kg in liver (highest value 1.1 mg/kg).
A linear relation between the dose levels and the residue concentrations was observed. In the milk, residues reached a plateau level within five days and no accumulation was observed.
Table 73. Residues in milk 1× dose group (2.1 ppm, 0.07 mg/kg bw).
Cow 4 Cow 5 Cow 6 Average Days Thiacloprid
mg/kg Total
residue1 mg/kg
Thiacloprid mg/kg
Total residue1 mg/kg
Thiacloprid mg/kg
Total residue1 mg/kg
Thiacloprid mg/kg
Total residue1 mg/kg
1 < 0.01 < 0.01 < 0.01 < 0.01 < 0.01 < 0.01 < 0.01 < 0.01 2 0.01 0.01 0.011 0.014 0.016 < 0.01 0.013 0.011 5 0.014 0.02 0.014 0.02 0.021 0.026 0.016 0.022 8 0.014 0.017 0.014 0.017 0.02 0.025 0.016 0.020 11 0.018 0.02 0.020 0.014 0.03 0.025 0.023 0.020 14 0.013 0.017 0.017 0.022 0.022 0.026 0.017 0.022 17 0.017 0.02 0.015 0.02 0.025 0.027 0.019 0.022 20 0.021 0.025 0.013 0.019 0.021 0.022 0.018 0.022 25 0.011 0.016 0.012 0.017 0.016 0.018 0.013 0.017 28 0.012 < 0.01 < 0.01 0.014 0.016 0.015 0.013 0.013
1 determined as 6-CAN
Table 74. Residues in milk 3× dose group (6.2 ppm, 0.213 mg/kg bw).
Cow 6 Cow 8 Cow 9 Average Days Thiacloprid
mg/kg Total
residue1 mg/kg
Thiacloprid mg/kg
Total residue1 mg/kg
Thiacloprid mg/kg
Total residue1 mg/kg
Thiacloprid mg/kg
Total residue1 mg/kg
1 < 0.01 < 0.01 < 0.01 < 0.01 < 0.01 < 0.01 < 0.01 < 0.01 2 0.031 0.05 0.035 0.052 0.04 0.055 0.035 0.052 5 0.035 0.061 0.034 0.064 0.057 0.084 0.042 0.070 8 0.039 0.066 0.046 0.064 0.054 0.08 0.046 0.070 11 0.039 0.055 0.038 0.043 0.050 0.066 0.042 0.055 14 0.032 0.043 0.04 0.047 0.053 0.059 0.042 0.050

Thiacloprid 1117
Cow 6 Cow 8 Cow 9 Average Days Thiacloprid
mg/kg Total
residue1 mg/kg
Thiacloprid mg/kg
Total residue1 mg/kg
Thiacloprid mg/kg
Total residue1 mg/kg
Thiacloprid mg/kg
Total residue1 mg/kg
20 0.043 0.059 0.059 0.068 0.059 0.061 0.054 0.063 28 0.033 0.046 0.042 0.051 0.043 0.057 0.039 0.051
1 determined as 6-CNA
Table 75. Residues in milk 10× dose group (20.6 ppm, 0.655 mg/kg bw).
Cow 10 Cow 11 Cow 12 Average Days Thiacloprid
mg/kg Total
residue1 mg/kg
Thiacloprid mg/kg
Total residue1 mg/kg
Thiacloprid mg/kg
Total residue1 mg/kg
Thiacloprid mg/kg
Total residue1 mg/kg
1 < 0.01 < 0.01 < 0.01 < 0.01 < 0.01 < 0.01 < 0.01 < 0.01 2 0.119 0.147 0.097 0.119 0.080 0.104 0.099 0.123 5 0.147 0.185 0.142 0.192 0.123 0.155 0.137 0.177 8 0.143 0.192 0.142 0.182 0.126 0.162 0.137 0.179 11 0.122 0.148 0.139 0.189 0.124 0.152 0.128 0.163 14 0.121 0.153 0.152 0.208 0.146 0.184 0.140 0.182 17 0.122 0.201 0.154 0.212 0.150 0.234 0.142 0.216 20 0.127 0.180 0.171 0.230 0.107 0.122 0.135 0.177 25 0.1 0.144 0.094 0.151 0.120 0.170 0.105 0.155 28 0.096 0.136 0.098 0.170 0.063 0.094 0.086 0.133
1 determined as 6-CNA
Table 76. Residue concentrations in the edible tissues.
Liver Kidney Muscle Fat Animal Thiacloprid
mg/kg Total
residue1 mg/kg
Thiacloprid mg/kg
Total residue1 mg/kg
Thiacloprid mg/kg
Total residue1 mg/kg
Thiacloprid mg/kg
Total residue1 mg/kg
Control, Cow 1
< 0.01 < 0.01 < 0.01 < 0.01 < 0.01 < 0.01 < 0.01 < 0.01
Control, Cow 3
< 0.01 < 0.01 < 0.01 < 0.01 < 0.01 < 0.01 < 0.01 < 0.01
1×, Cow 4 0.09, 0.09 (0.09)
0.09, 0.09 (0.09)
0.03, 0.03 (0.03)
0.05, 0.04 (0.05)
0.02, 0.02 (0.02)
0.02, 0.02 (0.02)
0.01, 0.01 (0.01)
0.02, 0.02 (0.02)
1×, Cow 5 0.09, 0.09 (0.09)
0.08, 0.08 (0.08)
0.03, 0.03 (0.03)
0.05, 0.04 (0.05)
0.02, 0.01 (0.02)
0.02, 0.02 (0.02)
0.01, 0.01 (0.01)
0.01, 0.01 (0.01)
1×, Cow 6 0.11, 0.11 (0.11)
0.12, 0.11 (0.12)
0.04, 0.04 (0.04)
0.06, 0.06 (0.06)
0.02, 0.02 (0.02)
0.02, 0.02 (0.02)
0.02, 0.02 (0.02)
0.02, 0.02 (0.02)
1×, mean 0.10 0.10 0.03 0.05 0.02 0.02 0.01 0.02 3×, Cow 7 0.28, 0.26
(0.27) 0.28, 0.27
(0.28) 0.09, 0.09
(0.09) 0.15, 0.14
(0.15) 0.05, 0.05
(0.05) 0.05, 0.05
(0.05) 0.03, 0.03
(0.03) 0.03, 0.03
(0.03) 3×, Cow 8 0.31, 0.32
(0.32) 0.27, 0.29
(0.28) 0.09, 0.09
(0.09) 0.17, 0.20
(0.19) 0.05, 0.05
(0.05) 0.05, 0.05
(0.05) 0.04, 0.04
(0.04) 0.04, 0.04
(0.04) 3×, Cow 9 0.29, 0.27
(0.28) 0.28, 0.30
(0.29) 0.11, 0.11
(0.11) 0.16, 0.18
(0.17) 0.06, 0.06
(0.06) 0.06, 0.06
(0.06) 0.04, 0.04
(0.04) 0.04, 0.04
(0.04) 3×, mean 0.29 0.28 0.10 0.17 0.05 0.05 0.04 0.04 10×, Cow 10 0.91, 0.91
(0.91) 0.87, 0.85
(0.86) 0.23, 0.24
(0.24) 0.51, 0.45
(0.48) 0.15, 0.14
(0.15) 0.15, 0.15
(0.15) 0.12, 0.12
(0.12) 0.14, 0.15
(0.15) 10×, Cow 11 1.1, 1.1
(1.1) 1.1, 1.2
(1.2) 0.32, 0.31
(0.32) 0.61, 0.60
(0.61) 0.18, 0.18
(0.18) 0.19, 0.18
(0.19) 0.12, 0.13
(0.13) 0.16, 0.15
(0.16) 10×, Cow 12 0.81, 0.79
(0.80) 0.81, 0.84
(0.83) 0.26, 0.24
(0.25) 0.48, 0.48
(0.48) 0.15, 0.15
(0.15) 0.15, 0.14
(0.15) 0.10, 0.09
(0.10) 0.12, 0.13
(0.13) 10×, mean 0.94 0.96 0.27 0.52 0.16 0.17 0.12 0.15

1118 Thiacloprid
APPRAISAL
N-{3-[(6-Chloro-3-pyridinyl)methyl]-1,3-thiazolan-2-yliden}cyanamide
NCl
N S
N CN
Residues and analytical aspects of thiacloprid were considered for the first time by the present Meeting.
Thiacloprid is a non-systemic insecticide with registered uses in many countries. Thiacloprid causes disruption of the insect nervous system by acting as an inhibitor at nicotinic acetylcholine receptors.
The following abbreviations are used for the metabolites discussed below: thiacloprid-amide {3-[(6-chloro-3-pyridinyl)methyl]-2-thiazolidinylidene}urea (M02) 6-CNA 6-chloro-3-pyridinecarboxylic acid (M03) thiacloprid-sulfoxide N-[(6-chloro-3-pyridinyl)methyl]-N’-cyano-N-[2-(methylsulfinyl)-
ethyl]urea (M08) M09 N-{[6-(methylthio)-3-pyridinyl]-carbonyl}glycine M12 Glucuronic acid conjugate of {3-[(6-chloro-3-pyridinyl)methyl]-4(or
5)-hydroxy-2-thiazolidinylidene}= thiacloprid sulfonic acid Sodium 2-[[[(aminocarbonyl)amino]-carbonyl][(6-chloro-3-
pyridinyl)-methyl]amino]ethanesulfonate (M30)
Animal metabolism
The Meeting received results of animal metabolism studies in lactating goats and laying hens.
Goats
One lactating goat was dosed with [methylene-14C]-thiacloprid at a rate of 10 mg/kg body weight for three consecutive days. Approximately 53.7% of the total radioactivity administered was excreted until sacrifice. A portion of about 48.3% was eliminated with urine and 4.5% with faeces. Due to the short period between the last dose and sacrifice, 40% of the dose was not recovered in the excreta. A low amount (0.93%) was secreted with the milk. At sacrifice 6 hours after the last dose, the total radioactive residues (TRR) in the edible tissues and organs accounted for 5.6% of the administered radioactivity. The major portion and the highest equivalent concentration were observed in the kidney and the liver.
The metabolism of thiacloprid in goats is comparable to the metabolism in rats.
The unchanged parent compound was found in all goat tissues and ranged from 28% of the TRR (equiv. to 7 mg/kg) in kidney, 61% (equiv. to 1.5 mg/kg) in milk, 83% (equiv. to 14.5 mg/kg) in liver, 90% (equiv. to 1.6 mg/kg) in fat to 92% (equiv. to 3.5 mg/kg) in muscle.
Further main metabolites were identified in kidney. Thiacloprid-sulfoxide was found at levels of 12.3% of the TRR (equiv. to 3.1 mg/kg) and M12 at 10% of the TRR (equiv. to 2.5 mg/kg). Except for thiacloprid-sulfoxide in milk (8.7% of the TRR) no other relevant metabolites in concentrations above 8% of the TRR were identified.

Thiacloprid 1119
Hens
A group of six laying hens were fed with [methylene-14C]-thiacloprid for three consecutive days at a dose rate of 10 mg/kg body weight each. Until sacrifice the excretion amounted on average to 75.4% of the total radioactivity administered. About 29.4% and 29.6% of the radioactivity eliminated during the test period was excreted within 24 hours of the first and the second doses, respectively. Another 16.4% was excreted between the final dose and sacrifice. On average, only 0.06% (equivalent to 0.4 mg/kg) of the total dose was determined in the eggs. Residue levels in liver, kidney, muscle (leg), muscle (breast) and skin (without fat) were 3.1, 2.4, 0.15, 0.13 and 0.30 mg/kg TRR, respectively.
The metabolism of thiacloprid in laying hens is comparable to the metabolism in rats.
The unchanged parent compound was found in all hen tissues and ranged from 17% of the TRR (equiv. to 0.54 mg/kg) in liver, 19% (equiv. to 0.03 mg/kg) in muscle, 48% (equiv. to 0.06 mg/kg) in eggs to 72% (equiv. to 0.08 mg/kg) in fat.
Further main metabolites were identified in muscle only. M9 was found at levels of 10.9% of the TRR (equiv. to 0.016 mg/kg). Except for thiacloprid-sulfoxide in fat (8.9% of the TRR) no other relevant metabolites in concentrations above 8% of the TRR were identified.
Thiacloprid is only moderately metabolized by goats and hens with 5.6% (goats) and 0.7% (hens) of the applied dose remaining in tissues after three days. The proposed metabolic pathway was via hydroxylation and the formation of glucoronide and cysteine conjugates, resulting in a large variety of metabolites in small amounts.
Plant metabolism
The Meeting received plant metabolism studies for thiacloprid on apples, tomatoes, cotton and wheat. In all studies [methylene-14C]-thiacloprid was applied as a spray.
All plant metabolism studies demonstrated that the metabolic pathway of thiacloprid is comparable in all crops investigated. The main metabolic reactions are:
the hydroxylation of the parent compound at the thiazolidine ring
the oxidative cleavage at the methylene bridge leading to the partially and fully oxidised products 6-chloropicolyl alcohol (M36), 6-chloronicotinic acid (M03)
conjugation of these two aglycones with sugars, phosphate/sulfate and endogenous plant components.
Uptake of soil metabolites followed by further metabolisation also took place. However, these metabolic reactions occurred only to a limited extent, the majority of residue remained on the surface of the fruits as unchanged parent compound exceeding 90% of the total residue. The major metabolites identified were the monohydroxylated derivative of thiacloprid (M01; apples) and the oxidation product 6-chloronicotinic acid (M03; cotton seed, wheat) as well as various conjugates thereof or of its precursor 6-chloropicolyl alcohol (M36; cotton, tomatoes, wheat).
In translocation experiments with tomatoes it was shown that less than 0.1% of the radioactivity in the soil was transported into the fruits after uptake via the roots.
In cotton seeds a different metabolic pattern with 6-chloronicotinic acid (M03), being the main residue (46%), was observed, which might be the result of partitioning and selective transport effects. In treated cotton leaves the metabolism followed the same steps found in the other plants investigated:
hydroxylation of the parent compound at the thiazolidine ring;
cleavage at the methylene bridge leading to the partially and fully oxidised products 6-chloropicolyl alcohol (M36) and 6-chloronicotinic acid (M03);

1120 Thiacloprid
conjugation of these two aglycones with sugars, phosphate/sulfate and endogenous plant components.
In each crop tested except cotton seeds, unchanged thiacloprid was found to be relevant residue with amount > 80% of the TRR.
Environmental fate
The Meeting received information on the environmental fate of thiacloprid in soil, including aerobic soil metabolism, field dissipation and crop rotational studies.
The soil photolysis study conducted with [methylene-14C]-thiacloprid gave evidence that no accelerated degradation occurs under irradiation. Thiacloprid-amide could be identified as the main degradation byproduct. The calculated environmental half-life for thiacloprid was 74 days during midday and midsummer at 40° of latitude. No additional metabolites were identified in the samples.
In confined rotational crops studies, soil was treated with [pyridinyl-14C-methyl]-thiacloprid. Turnips, lettuce and wheat were sown into the treated soil at intervals of 30, 170 and 354 days after treatment and were grown to maturity and harvested for analysis. In all matrices radioactivity above 0.01 mg/kg was found. After 354 days the residues measured ranged from 0.005 mg/kg in turnip bulbs up to 0.322 mg/kg in wheat straw. Thiacloprid-amide and thiacloprid sulfonic acid could be identified as relevant metabolites accounting for 15 – 35% of the TRR each. No parent thiacloprid was found.
The Meeting concluded that thiacloprid residues from the use of thiacloprid do not occur in concentrations above 0.01 mg/kg.
Methods of Analysis
The Meeting received descriptions and validation data for analytical methods for thiacloprid in plant and animal matrices. The method for enforcement purposes is based on extraction with acetone/water (3:1; v:v) and a subsequent clean-up by column chromatography on Florisil and elution with acetonitrile. The residues of thiacloprid parent compound are quantified by reversed phase HPLC with UV detection at 242 nm. Validation data for apples, tomatoes, cucumbers, peaches, citrus fruits, cotton seed, potatoes and tobacco was presented. In general a LOQ of 0.02 – 0.05 mg/kg was achieved, the recoveries were in the range of 72% to 105%.
Animal matrices were extracted with a mixture of acetonitrile/water or methanol. For milk samples, partitioning of the extracts against n-hexane was performed to remove fat. The aqueous remainder is partitioned against cyclohexane/ethyl acetate using a ChemElut column. Further clean-up is performed by column chromatography on Florisil and elution with acetonitrile. The residues are quantified by reversed phase HPLC with UV-detection at 242 nm. The method was validated by conducting recovery tests with muscle, milk and eggs. An LOQ of 0.01 mg/kg in milk and 0.02 mg/kg in muscle and egg was achieved, the recoveries were in the range of 75% to 104%
In addition the meeting received information on various specialized methods, mainly based on HPLC-MS/MS techniques with modification in the extraction and clean-up procedure. These methods for plant and animal matrices detect thiacloprid and possible metabolites with LOQs ranging from 0.01 mg/kg to 0.5 mg/kg (rice), depending on the matrix. In general an LOQ of 0.02 mg/kg could be achieved for all matrices except rice.
For thiacloprid, additional methods for the determination of all moieties containing 6-CNA were available. Thiacloprid and its metabolites were extracted from plant matrices with an acidic methanol / water mixture. After the clean-up thiacloprid and all metabolites containing the 6-chloropicolyl moiety were oxidized with alkaline potassium permanganate solution to yield 6-chloronicotinic acid. This was followed by acidification and reduction of the excess permanganate and the developed manganese dioxide with sodium bisulfite. The 6-CNA was converted to the corresponding trimethylsilyl ester with MSTFA (N-methyl-trimethylsilyltrifluoroacetamide) prior to quantitation by gas chromatography with mass selective detection in the single-ion monitoring mode

Thiacloprid 1121
(GC-MS). Validation data for pome fruits, tomatoes, cotton seed, rape seed, sunflower seed, milk, muscle, liver, kidney and fat was presented. In general a LOQ of 0.05 mg/kg for plant matrices and 0.01 − 0.02 mg/kg for animal matrices was achieved, the recoveries were in the range of 66% to 102%.
Stability of pesticide residues in stored analytical samples
The Meeting received information on the stability of thiacloprid in apples, currants, tomatoes, melons, peas, potatoes, cotton seed, rape seed, wheat and tobacco. All samples were fortified at 0.2 mg/kg (except tobacco with 2 mg/kg) and stored at -20°C for between 540 and 730 days. In all matrices the remaining thiacloprid residues levels were above 80% of the initial fortification concentrations.
No stability study was submitted to the Meeting on animal matrices.
Residue definition
The results of the radiolabeled thiacloprid plant metabolism studies on apples, tomatoes, cotton and wheat indicate that thiacloprid metabolizes or degrades slowly under typical foliar application conditions. Greater than 80% of the TRR is recovered as thiacloprid and no significant metabolites or degradates were found in crops treated directly.
In rotational crop studies significant total radioactive residues were found in lettuce and wheat. Most of the residue consisted of the metabolites thiacloprid amide (M02) and thiacloprid sulfonic acid (M30). Unchanged thiacloprid was not identified. These metabolites are not considered toxicologically significant and need not be considered for the residue definition.
In ruminants, orally administered radiolabeled thiacloprid undergoes limited metabolism to glucoronide and cysteine conjugates after hydroxylation. The major component in all matrices was unchanged thiacloprid (> 80% TRR in liver, fat and muscle, 61% TRR in milk and 28% TRR in kidney). Further metabolites were identified in kidney at levels below 12% of the TRR. In poultry orally administered (dosed at 10 mg/kg body weight) thiacloprid was moderately metabolised. In all matrices thiacloprid was identified as the major component (17% TRR liver, 19% TRR muscle, 48% TRR in eggs, 72% TRR in fat). Further metabolite found in muscle, was only M9 which accounted for 10.9% of the TRR.
The log Pow of thiacloprid is 1.26. As no accumulation in fat was observed in animal metabolism studies the Meeting concluded that thiacloprid is not fat-soluble.
The analytical methods determine thiacloprid, possible metabolites or the total residue determined as 6-CNA.
Based on the results of the metabolism studies the Meeting concluded that the residue definition for enforcement and dietary intake calculations in plant and animal commodities is thiacloprid. The residue is not fat-soluble.
Results of supervised trials on crops
Citrus fruit
The Meeting received information on supervised residue trials on lemons and oranges from Brazil, New Zealand and South Africa.
In Brazil thiacloprid can be applied to citrus at 0.0048 kg ai/hL with a PHI of 21 days. In two Brazilian trials on lemons three applications were made at a rate of 0.0048 kg ai/hL and 0.0096 kg ai/hL with a PHI of 21 days. No whole fruit residue data was submitted.

1122 Thiacloprid
One trial on lemons was submitted from New Zealand where a single spray application of 0.0096 kg ai/hL was made. Residues on whole lemon fruit were found to decline from 0.19 mg/kg 1 day after treatment to 0.07 mg/kg by day 14. A GAP for New Zealand was not submitted.
In South Africa thiacloprid can be applied to citrus at a rate of 0.0067 kg ai/hL. Corresponding number of applications or PHI was not stated. In two residue trials on oranges one treatment was conducted with spray concentrations of 0.014 kg ai/hL to 0.029 kg ai/hL with the PHI ranging from 44 to 190 days. No residues above the LOQ of 0.02 mg/kg were found in all samples.
The Meeting concluded that there was insufficient data available to support a recommendation for citrus fruit.
Pome fruit
The Meeting received information on supervised residue trials on apples from Australia, Belgium, France, Germany, Italy, Japan, the Netherlands, South Africa, Spain, United Kingdom and the USA.
Thiacloprid is registered for use on apples or pome fruits in some European countries as a pre-harvest foliar spray treatment. Residue trials were carried out in Belgium, France, Germany, Italy, the Netherlands, Spain and the United Kingdom. The GAPs from Austria, Belgium, Cyprus, Czech Republic, Greece, Hungary, Italy, the Netherlands, Russia and the United Kingdom consisted of two to three spray applications at 0.012 – 0.014 kg ai/hL with a PHI of 14 days. The residues matching this GAP in the whole fruits were: 0.04, 0.05, 0.1 (2), 0.11, 0.13, 0.14, 0.16, 0.21 and 0.36 mg/kg.
In Croatia, Germany, Latvia, Lithuania, Portugal, Romania, Slovakia, Slovenia and Spain the GAP consists of two to three spray application at a rate of 0.0096 kg ai/hL with a PHI of 14 days. The residues matching this GAP in the whole fruits were: 0.02, 0.04, 0.07, 0.08, 0.1, 0.11 and 0.12 mg/kg.
GAP in USA for apples consists of up to six applications at 0.01 kg ai/hL and a PHI of 30 days. The residues from 14 supervised trials in the USA, matching the US GAP (± 30%), were: 0.02, 0.04, 0.05, 0.06 (3), 0.07 (2), 0.09 (2), 0.1, 0.11, 0.14 and 0.28 mg/kg.
GAP in South Africa for apples consists of up to four applications at 0.0072 kg ai/hL and a PHI of 14 days. Of the four supervised trials provided from South Africa none matching South African GAP.
GAP in Japan for apples consists of up to three applications at 0.015 kg ai/hL and a PHI of seven days. The residues from two supervised trials in Japan matching GAP were 0.11 and 0.30 mg/kg.
GAP in Australia for apples consists of up to three applications at 0.018 kg ai/hL and a PHI of 14 days. The residue from one trial in Australia, matching GAP (± 30%), was 0.37 mg/kg.
The Meeting decided to pool the data from Australia, Europe, Japan and the USA. The combined results (n = 34) for apples were: 0.02 (2), 0.04 (3), 0.05 (2), 0.06 (3), 0.07 (3), 0.08, 0.09 (2), 0.1 (4), 0.11 (4), 0.12, 0.13, 0.14, 0.14, 0.16, 0.21, 0.28, 0.30, 0.36 and 0.37 mg/kg.
Field trials involving thiacloprid on pears were provided from Australia, South Africa and USA.
GAP in USA for pears consists of up to six applications at 0.01 kg ai/hL and a PHI of 30 days. The residues from 14 supervised trials in the USA, matching GAP (± 30%), in ranked order were :0.05, 0.06, 0.1, 0.14, 0.14, 0.23, 0.24 and 0.27 mg/kg.
GAP in South Africa for pears consists of up to four applications at 0.0072 kg ai/hL and a PHI of 14 days. Of the four supervised trials provided from South Africa none matched GAP.
GAP in Japan for pears consists of up to three applications at 0.015 kg ai/hL and a PHI of seven days. The residues from two supervised trials in Japan matching GAP were: 0.61 and 0.87 mg/kg.

Thiacloprid 1123
GAP in Australia for pears is up to three applications with 0.018 kg ai/hL each and a PHI of 14 days. The residues from two supervised trials in Australia, matching the GAP, were 0.37 and 0.38 mg/kg.
The Mann-Whitney-U test indicated that the medians of the residues from the Japanese and the combined Australian and US data set for pears were not similar. The Meeting decided to pool only the data from Australia and the USA. The combined results (n = 10) for pears were 0.05, 0.06, 0.1, 0.14, 0.14, 0.23, 0.24, 0.27, 0.37 and 0.38 mg/kg.
The Meeting decided to make a recommendation for the crop group of pome fruits based on the combined data for apples and pears.
For apples and pears the combined results were 0.02, 0.02, 0.04(3), 0.05(3), 0.06(4), 0.07(3), 0.08, 0.09, 0.09, 0.1(5), 0.11(4), 0.12, 0.13, 0.14(4), 0.16, 0.21, 0.23, 0.24, 0.27, 0.28, 0.30, 0.36, 0.37, 0.37 and 0.38 mg/kg.
Based on residue data for apples and pears the Meeting decided to recommend a maximum residue level of 0.7 mg/kg, a STMR of 0.11 mg/kg and a HR of 0.38 mg/kg for pome fruits.
Stone fruits
The Meeting received information on supervised residue trials on Japanese apricots from Japan.
GAP in Japan for Japanese apricots consists of up to two applications at 0.0075 kg ai/hL with a PHI of seven days. The residue trials from Japan were conducted with an application rate of 0.015 kg ai/hL, which did not correspond to the submitted GAP.
Field trials on peaches were available from France, Italy, Japan and Spain.
GAP in Cyprus, Greece, Italy and Slovenia for peaches/nectarines consists of up to two applications at 0.0096 to 0.012 kg ai/hL and a PHI of 14 days. The residues in whole fruits from nine supervised trials in Europe matching the GAP were: 0.03(3), 0.06, 0.08, 0.09, 0.13, 0.13 and 0.19 mg/kg.
GAP in Japan for peaches is up to three applications at 0.015 kg ai/hL and a PHI of 7 days. The residues from two supervised trials from Japan matching the GAP ± 30% were 0.27 and 0.40 mg/kg.
The Mann-Whitney-U test for the data from Japan and the residue data from Europe suggested a similar median for both distributions. The combined residue data was 0.03(3), 0.06, 0.08, 0.09, 0.13, 0.13, 0.19, 0.27 and 0.40 mg/kg.
Field trials on cherries were provided from Belgium, France, Germany, Italy, Japan, Spain and USA.
GAP in Croatia, Cyprus, Czech Republic, the Netherlands, Romania, Slovenia and the United Kingdom for cherries is up to two applications with 0.0096 to 0.015 kg ai/hL each and a PHI of 14 days. The residues in whole fruits from 12 supervised trials in Europe matching the GAP were for sour cherries < 0.02, 0.02, 0.03, 0.04 mg/kg and for sweet cherries 0.02, 0.06, 0.06, 0.07, 0.08, 0.1, 0.11 and 0.15 mg/kg.
GAP in Japan for cherries is up to two applications with 0.015 kg ai/hL each and a PHI of one day. The residues from two supervised trials in Japan matching the GAP were 1.4 and 2.4 mg/kg. The Mann-Whitney-U test indicated that the medians of residues, resulting from applications according to the Japanese and European GAP for cherries, were not similar. Therefore only the data from the European trials were considered for further evaluation.
The Mann-Whitney-U test gave evidence that a similar distribution for sweet and sour cherries were not similar. Therefore only the data for sweet cherries were used for further evaluation.
In Northern America thiacloprid is not registered for use in cherries. Therefore the available supervised residue trials from USA were not considered.

1124 Thiacloprid
Field trials on plums were provided from France, Germany, Spain and USA.
GAP in the Czech Republic, the Netherlands and Romania for plums is up to two applications at 0.0096 to 0.012 kg ai/hL and a PHI of 14 days. The residues in whole fruits from 14 supervised trials in Europe matching the GAP were: < 0.02(6), 0.02(5), 0.03, 0.03 and 0.05 mg/kg.
GAP in Japan for plums is up to three applications with 0.0075 kg ai/hL each and a PHI of seven days. The residue trials from Japan were conducted with an application rate of 0.015 kg ai/hL, which does not correspond to the submitted GAP.
In Northern America thiacloprid is not registered for use in plums. Therefore the available supervised residue trials from USA are not considered for evaluation.
The Meeting decided to make a recommendation for the stone fruits crop group, based on the combined data for peaches and sweet cherries.
For peaches and sweet cherries the combined results were 0.02, 0.03(3), 0.06(3), 0.07, 0.08, 0.08, 0.09, 0.1, 0.11, 0.13, 0.13, 0.15, 0.19, 0.27 and 0.40 mg/kg.
Based on residue data for peaches and sweet cherries the Meeting recommends a maximum residue level of 0.5 mg/kg, a STMR of 0.08 mg/kg and a HR of 0.4 mg/kg for for thiacloprid in stone fruits.
Grapes
Field trials on grapes were provided from Japan.
GAP in Japan for grapes consists of up to two applications at 0.53 kg ai/ha each and a PHI of 21 days. The residues from 4 supervised trials in Japan matching the GAP (± 30%) were: 0.12, 0.44, 0.80 and 1.6 mg/kg. The Meeting decided that four residue trials were not sufficient for a recommendation for grapes.
Berries and other small fruits except grapes
Field and glasshouse trials on strawberries were provided from Belgium, France, Germany, Japan, the Netherlands, Italy, Spain and the United Kingdom.
The GAP for field use in the Netherlands and the United Kingdom for strawberries consists of up to two applications at 0.12 kg ai/ha each and a PHI of three days. The residues from eight supervised trials in Europe matching the GAP were: 0.02, 0.03, 0.04, 0.07, 0.07, 0.08, 0.08 and 0.09 mg/kg.
GAP for glasshouse use in the Netherlands and the United Kingdom for strawberries is up to two applications at 0.12 to 0.14 kg ai/ha each and a PHI of one day. The residues from eight supervised trials in Europe matching the GAP (± 30%) were 0.04, 0.05, 0.13, 0.22, 0.31(3) and 0.33 mg/kg.
GAP in Japan for protected strawberries is up to three applications with 0.23 kg ai/ha each and a PHI of one day. The residue trials from Japan were conducted with an application rate of 0.15 kg ai/ha, which does not correspond to the submitted GAP.
Field trials on currants were provided from Belgium, Germany and the United Kingdom. GAP in Germany, Latvia, the Netherlands and the United Kingdom for currants is up to three applications with 0.072 to 0.14 kg ai/ha each and a PHI of three days. The residues from eight supervised trials in Europe matching the GAP (± 30%) were: 0.08, 0.16, 0.21, 0.21, 0.28, 0.35, 0.37 and 0.59 mg/kg.
Field trials on raspberries were provided from Germany and the United Kingdom. GAP in Germany, the Netherlands and the United Kingdom for raspberries is up to three applications with 0.096 to 0.14 kg ai/ha each and a PHI of three days. The residues from eight supervised trials in Europe matching the GAP (± 30%) were: 0.1, 0.15, 0.15, 0.27, 0.31, 0.34, 0.34 and 0.62 mg/kg.
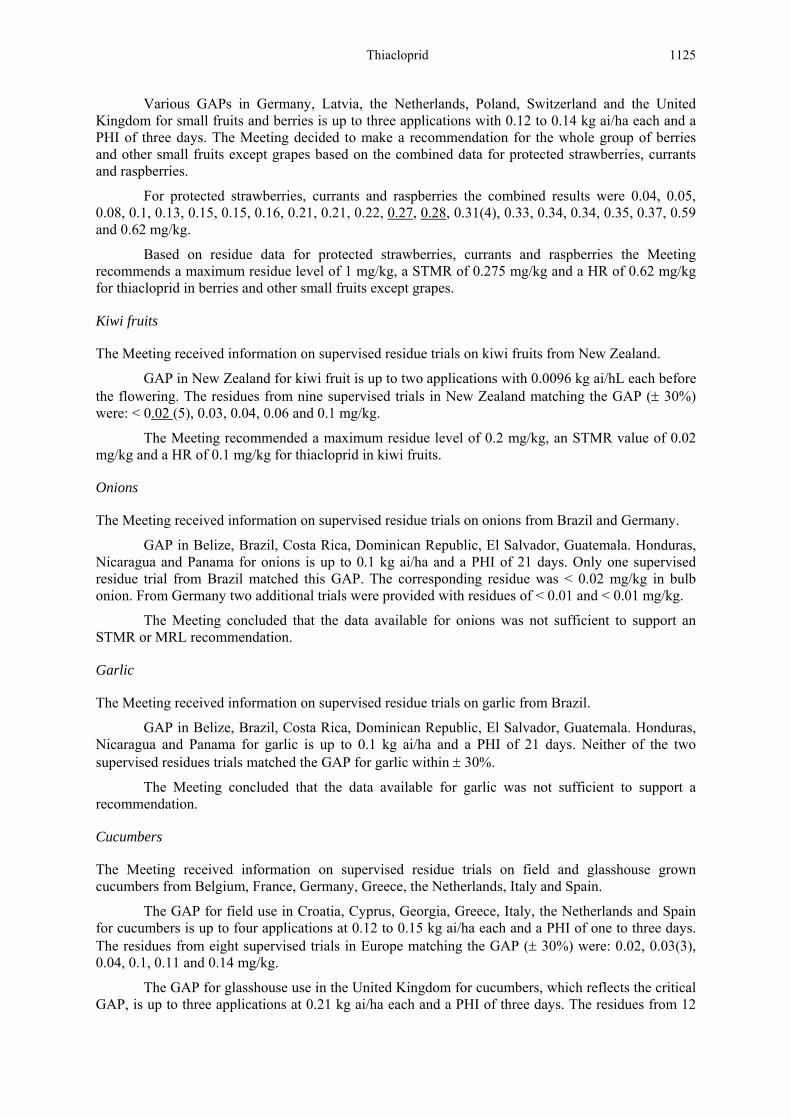
Thiacloprid 1125
Various GAPs in Germany, Latvia, the Netherlands, Poland, Switzerland and the United Kingdom for small fruits and berries is up to three applications with 0.12 to 0.14 kg ai/ha each and a PHI of three days. The Meeting decided to make a recommendation for the whole group of berries and other small fruits except grapes based on the combined data for protected strawberries, currants and raspberries.
For protected strawberries, currants and raspberries the combined results were 0.04, 0.05, 0.08, 0.1, 0.13, 0.15, 0.15, 0.16, 0.21, 0.21, 0.22, 0.27, 0.28, 0.31(4), 0.33, 0.34, 0.34, 0.35, 0.37, 0.59 and 0.62 mg/kg.
Based on residue data for protected strawberries, currants and raspberries the Meeting recommends a maximum residue level of 1 mg/kg, a STMR of 0.275 mg/kg and a HR of 0.62 mg/kg for thiacloprid in berries and other small fruits except grapes.
Kiwi fruits
The Meeting received information on supervised residue trials on kiwi fruits from New Zealand.
GAP in New Zealand for kiwi fruit is up to two applications with 0.0096 kg ai/hL each before the flowering. The residues from nine supervised trials in New Zealand matching the GAP (± 30%) were: < 0.02 (5), 0.03, 0.04, 0.06 and 0.1 mg/kg.
The Meeting recommended a maximum residue level of 0.2 mg/kg, an STMR value of 0.02 mg/kg and a HR of 0.1 mg/kg for thiacloprid in kiwi fruits.
Onions
The Meeting received information on supervised residue trials on onions from Brazil and Germany.
GAP in Belize, Brazil, Costa Rica, Dominican Republic, El Salvador, Guatemala. Honduras, Nicaragua and Panama for onions is up to 0.1 kg ai/ha and a PHI of 21 days. Only one supervised residue trial from Brazil matched this GAP. The corresponding residue was < 0.02 mg/kg in bulb onion. From Germany two additional trials were provided with residues of < 0.01 and < 0.01 mg/kg.
The Meeting concluded that the data available for onions was not sufficient to support an STMR or MRL recommendation.
Garlic
The Meeting received information on supervised residue trials on garlic from Brazil.
GAP in Belize, Brazil, Costa Rica, Dominican Republic, El Salvador, Guatemala. Honduras, Nicaragua and Panama for garlic is up to 0.1 kg ai/ha and a PHI of 21 days. Neither of the two supervised residues trials matched the GAP for garlic within ± 30%.
The Meeting concluded that the data available for garlic was not sufficient to support a recommendation.
Cucumbers
The Meeting received information on supervised residue trials on field and glasshouse grown cucumbers from Belgium, France, Germany, Greece, the Netherlands, Italy and Spain.
The GAP for field use in Croatia, Cyprus, Georgia, Greece, Italy, the Netherlands and Spain for cucumbers is up to four applications at 0.12 to 0.15 kg ai/ha each and a PHI of one to three days. The residues from eight supervised trials in Europe matching the GAP (± 30%) were: 0.02, 0.03(3), 0.04, 0.1, 0.11 and 0.14 mg/kg.
The GAP for glasshouse use in the United Kingdom for cucumbers, which reflects the critical GAP, is up to three applications at 0.21 kg ai/ha each and a PHI of three days. The residues from 12

1126 Thiacloprid
supervised trials in Europe matching the GAP (± 30%) were 0.04, 0.04, 0.07, 0.07, 0.08(4), 0.12, 0.15, 0.15 and 0.18 mg/kg.
The Meeting decided to pool the data from outdoor and indoor residues trials for a recommendation on cucumbers. The combined results are 0.02, 0.03(3), 0.04(3), 0.07, 0.07, 0.08(4), 0.1, 0.11, 0.12, 0.14, 0.15, 0.15 and 0.18 mg/kg.
For gherkins, GAPs from Greece and the Netherlands were available, which correspond to the GAPs for cucumber. The Meeting concluded that an extrapolation of the data from cucumbers to gherkins is not possible, because of the different surface area-to-mass ratio for gherkins, from higher residues can be expected than in cucumbers.
Based on the combined data for cucumbers the Meeting recommended a maximum residue level of 0.3 mg/kg, an STMR value of 0.08 mg/kg and a HR of 0.18 mg/kg for cucumbers.
Squash, summer
The Meeting received GAPs for courgettes and squash corresponding to the uses in cucumbers and gherkins. The treatment methods cover foliar spraying as well as drip application. The Meeting concluded that the residue data for cucumber can be extrapolated to summer squash.
Based on an extrapolation from cucumbers the Meeting recommended a maximum residue level of 0.3 mg/kg, an STMR value of 0.08 mg/kg and a HR of 0.18 mg/kg for thiacloprid in summer squash.
Melons and watermelons
The Meeting received information on supervised residue trials on melons from France, Greece and Italy. Data on protected melons was also received from Japan.
GAP in Croatia, Italy and Spain for melons and watermelons is up to three applications at 0.14 kg ai/ha each and a PHI of three to four days. The residues for whole melon fruits from six supervised trials in Europe matching the GAP (± 30%) were < 0.02, 0.02, 0.03, 0.05, 0.06 and 0.06 mg/kg. In melon pulp all residues were < 0.02(6) mg/kg.
GAP in Japan for protected melons is up to three applications at 0.45 kg ai/ha each and a PHI of one day. The residues from two supervised trials in Japan matching the GAP (±30%) were < 0.005 and < 0.005 mg/kg in the pulp.
Field trials on watermelons were available from Greece and Spain. Data on protected watermelons was also available from Japan.
GAP in Croatia, Italy and Spain for watermelons is up to three applications at 0.14 kg ai/ha each and a PHI of three to four days. The residues for whole watermelon from four supervised trials in Europe matching the GAP (± 30%) were < 0.02(3) and 0.06 mg/kg. In watermelon pulp all residues were < 0.02(4) mg/kg.
GAP in Japan for protected watermelons is up to three applications at 0.45 kg ai/ha each and a PHI of one day. The residue trials from Japan were conducted with an application rate of 0.3 kg ai/ha, which did not correspond to the submitted GAP.
The Mann-Whitney-U test for melons and watermelons indicated that a similar distribution for melons and watermelons can be assumed. The combined residues for whole melons and watermelons were < 0.02(4), 0.02, 0.03, 0.05, 0.06, 0.06 mg/kg.
The Meeting decided to pool the data for melons and watermelons for mutual support and recommended a maximum residue level of 0.2 mg/kg for thiacloprid in melons and watermelons and an STMR of 0.02 mg/kg and HR value of 0.02 mg/kg for melon and watermelon pulp.

Thiacloprid 1127
Squash, winter
GAP in Cyprus and the Netherlands for squash, field and glasshouse grown, is up to four applications at 0.014 kg ai/hL and a PHI of one to three days. This use corresponds to the GAP available for melons and watermelons in field. The Meeting concluded that the residue data for melon and watermelon can be extrapolated for use in winter squash.
Based on an extrapolation from melon and watermelon the Meeting recommends a maximum residue level of 0.2 mg/kg for thiacloprid in winter squash and an STMR of 0.02 mg/kg and HR value of 0.02 mg/kg for winter squash pulp.
Tomatoes
The Meeting received information on supervised residue trials on field and glasshouse grown tomatoes. Supervised trials were provided for field use from France and Italy and for glasshouse use from Germany, France, Japan and Spain. In addition, residue trials with drip application in glasshouse were conducted in Belgium and the Netherlands.
Supervised residue trials of field were conducted with two applications of 0.14 up to 0.22 kg ai/ha each and PHIs from zero to eight days. Corresponding GAPs from Greece and Slovenia were available with a PHI of three days. The residues for tomatoes from seven trials in Europe, matching the GAP (± 30%), in ranked order were: 0.02, 0.03, 0.03, 0.04, 0.05, 0.09 and 0.16 mg/kg.
For foliar use in glasshouses, data from eight supervised residue trials were provided corresponding to the GAP of the United Kingdom (three applications at 0.22 kg ai/ha each and a PHI of three days). The residues from protected tomatoes from eight trials in Europe matching the UK GAP (± 30%) in ranked order were: 0.07, 0.12, 0.12, 0.15, 0.18, 0.19, 0.25 and 0.29 mg/kg.
GAP in Japan for protected tomatoes is up to three applications with 0.23 kg ai/ha each and a PHI of one day. The residue trials from Japan were conducted with an application rate of 0.38 kg ai/ha, which does not correspond to the submitted GAP.
In the Netherlands drip application to glasshouse tomatoes is registered at an application rate of 0.0096 kg ai per 1000 plants and a PHI of three days. The corresponding residues from eight trials on protected tomatoes in Europe matching the GAP (± 30%) were: < 0.02(3), 0.02(3), 0.03 and 0.03 mg/kg.
Based on the glasshouse foliar spray GAP for tomatoes the Meeting recommended a maximum residue level of 0.5 mg/kg, an STMR value of 0.165 mg/kg and a HR value of 0.29 mg/kg for thiacloprid in tomatoes.
Peppers, sweet
Supervised residue field trials were provided from France, Italy and Spain. Data for glasshouse use as foliar spray was generated in France, the Netherlands and Spain. In addition, residue trials with drip application in glasshouse were conducted in Belgium and the Netherlands.
Supervised residue trials in field use with thiacloprid were conducted with two applications of 0.14 up to 0.22 kg ai/ha each and PHIs from zero to seven days. Corresponding GAPs from Greece and Slovenia are available with a PHI of three days. The residues for peppers from seven trials in Europe matching the GAP (± 30%) in ranked order were: 0.05, 0.06, 0.08, 0.1, 0.11, 0.21 and 0.45 mg/kg.
For the use as a foliar spray in glasshouse eight supervised residue trials were conducted, corresponding to the UK GAP (three applications at 0.22 kg ai/ha and a PHI of three days). The residues for protected peppers from eight trials in Europe matching GAP (± 30%) were: 0.07, 0.08, 0.1, 0.11, 0.33, 0.37, 0.37 and 0.38 mg/kg.

1128 Thiacloprid
GAP in Japan for protected peppers is up to three applications with 0.23 kg ai/ha each and a PHI of one day. The residues from two supervised trials in Japan matching the GAP ±30% were 1.1 and 2.0 mg/kg. The Meeting compared the data sets for Japan and Europe using the Mann-Whitney-U test and decided that they belonged to different populations and could not be combined. Therefore only data from European trials was used for further evaluation.
In the Netherlands drip application in glasshouses is registered for peppers with an application rate of 0.0096 kg ai per 1000 plants and a PHI of three days. The corresponding residues from eight trials on protected peppers in Europe matching GAP (± 30%) were: 0.04, 0.04, 0.05(4), 0.06, 0.07 mg/kg.
For chili peppers GAPs are available, which correspond to the GAPs for sweet peppers. The Meeting concluded that an extrapolation of the data from sweet peppers to chili pepper is not possible, because of the different surface area to mass ratio for chili peppers, for which higher residues than in sweet peppers can be expected.
Based on the glasshouse foliar spray GAP for peppers the Meeting recommended a maximum residue level of 1 mg/kg, an STMR value of 0.22 mg/kg and a HR value of 0.38 mg/kg for thiacloprid in sweet peppers.
Eggplants
Field trials on protected aubergines were provided from Japan.
GAP in Japan for eggplants consists of up to three applications at 0.23 kg ai/ha each and a PHI of one day. The residues from two supervised trials in Japan matching the GAP (± 30%) were 0.28 and 0.38 mg/kg.
The Meeting received GAPs for eggplants from the Netherlands, Japan, the United Kingdom and various other countries corresponding to the GAO for field and glasshouse tomatoes. The treatment methods cover foliar spraying as well as drip application. The Meeting concluded that the residue data for tomatoes can be extrapolated to support the use in eggplants.
The Meeting compared the data sets eggplant from Japan and for protected tomatoes using the Mann-Whitney-U test and decided that they belonged to the same population and could be combined. The combined eggplant and protected tomato residues were: 0.07, 0.12, 0.12, 0.15, 0.18, 0.19, 0.25, 0.28, 0.29 and 0.38 mg/kg.
Based on an extrapolation from the critical glasshouse foliar spray GAP for tomatoes and residue trials for eggplants from Japan the Meeting recommended a maximum residue level of 0.7 mg/kg, an STMR value of 0.185 mg/kg and a HR value of 0.38 mg/kg for thiacloprid in eggplants.
Potatoes
The Meeting received information on supervised field trials on potatoes from Belgium, Brazil, France, Germany, Italy, Japan, Spain and the United Kingdom.
The 16 supervised trials available from Europe for potatoes were conducted with up to three applications at 0.096 kg ai/ha each and a PHI of 21 days. This corresponds to the GAP from Austria, Cyprus, Greece, Portugal, Romania, Spain and the United Kingdom. The residues in potato tuber were < 0.02(16) mg/kg.
GAP in Japan for potatoes is up to three applications with 0.23 kg ai/ha each and a PHI of seven days. The residues from two supervised trials in Japan matching GAP (± 30%) were: < 0.005 and < 0.005 mg/kg in the tubers.
In addition the Meeting received information from two supervised residue trials on potatoes from Brazil. The application rates were 0.14 and 0.29 kg ai/ha with a PHI of 21 days. No residue above the LOQ of 0.02 mg/kg was found in potato tubers.
Thiacloprid 1129
The Meeting recommended a maximum residue level of 0.02 (*) mg/kg and an STMR value and HR value of 0 mg/kg for thiacloprid in potatoes.
Wheat
Field trials on wheat were provided from France and Germany.
Thiacloprid is registered for use on wheat in Romania and Lithuania. The application rates are 0.048 kg ai/ha and 0.034 kg ai/ha respectively with a PHI of 21 days for Lithuania and an undefined PHI for Romania. The Meeting received supervised residue trials on wheat with application rates of 0.05 up to 0.062 kg ai/ha, which corresponds to + 29% of the GAP. Residues in wheat grain were < 0.02 (5), 0.03 (3), 0.04 and 0.04 mg/kg.
The Meeting recommended a maximum residue level of 0.1 mg/kg, an STMR value of 0.025 mg/kg and a highest residue value of 0.04 mg/kg for thiacloprid in wheat grain.
Barley
The Meeting received information from supervised residue trials on barley from France and Germany.
Thiacloprid is registered for on barley in Romania. The application rate is 0.048 kg ai/ha with an undefined PHI. The Meeting received supervised residue trials on barley with application rates of 0.062 kg ai/ha, which corresponds to + 29% of the GAP. Residues in barley grain were < 0.02, 0.05, 0.06, 0.11 and 0.12 mg/kg.
The Meeting decided that there was insufficient data from which to recommend a maximum residue level for thiacloprid on barley.
Rice
Field trials on rice were provided from India and Japan. GAP in India for foliar spraying of rice is 0.12 kg ai/ha each and a PHI of 30 days. All supervised residue trials were performed, with application rates of 0.18 up to 0.36 kg ai/ha which were up to 3 × GAP. In addition, only the limit of detection of 0.001 mg/kg was reported for thiacloprid in rice. Nevertheless no residues above this LOD were detected in rice grain without husks or in the husks in any of the six supervised residue trials.
GAP in Japan for rice consists of up to three applications with 0.15 kg ai/ha without a PHI. In two residue trials with an application rate of 1.5 kg ai/ha no residue above the LOQ of 0.005 mg/kg could be detected in the grain after 117, and up to 152 days.
The Meeting concluded that the LOQ of the monitoring method (0.02 mg/kg) is an appropriate estimate for MRL values in rice.
The Meeting recommended a maximum residue level of 0.02 (*) mg/kg, an STMR value of 0 mg/kg and a highest residue of 0 mg/kg for thiacloprid in rice husks.
Maize
Field trials on maize were provided from France, Germany, Greece and Italy. In Europe GAP is available from Romania (an application rate of 0.048 kg ai/ha and no PHI). Eight supervised residue trials were conducted with two treatments of 0.075 kg ai/ha each and a PHI of 28 – 31 days. These trials did not match any of the GAPs provided to the Meeting.
The Meeting concluded that the residue data on maize was not sufficient for recommending MRL, STMR or HR values.

1130 Thiacloprid
Tree nuts
The Meeting received information on supervised field trials on walnuts from Italy. GAP in Argentina, Chile, Italy and the United Kingdom consists of up to two applications at 0.0096 – 0.018 kg ai/hL and a PHI of 1 to 14 days. The four trials provided were performed at above GAP rate (0.03 kg ai/hL), but no residue could be detected in thenut kernel above the trial specific LOQ of 0.005 mg/kg.
Field trials were provided on almonds from USA.
GAP in Italy and the United Kingdom is up to two applications with 0.012 – 0.018 kg ai/hL and a PHI of 14 days. The residues for almond kernel from 14 trials in the USA matching the GAP (± 30%) were: < 0.01(13), 0.01 mg/kg.
Field trials were provided on pecan from USA.
GAP in Italy is up to 0.018 kg ai/hL and a PHI of 14 days. The residues for pecan kernel from 14 trials in USA matching the GAP (± 30%) were < 0.01(14) mg/kg.
Various GAPs in Germany, Italy and Turkey for tree nuts consist of up to two applications at rates of 0.0096 to 0.012 kg ai/hL each and a PHI of 21 days. The Meeting concluded that an extrapolation from almonds, walnuts and pecan to the whole group of tree nuts is possible. As thiacloprid is non-systemic, it was concluded that residues in nuts were comparable from different areas in the world. The combined thiacloprid residues in nuts were: < 0.01 (31), 0.01 mg/kg.
Because the analytical methods for enforcement are validated with a LOQ of 0.02 mg/kg, this value is used for the maximum residue level proposal for tree nuts.
The Meeting recommended a maximum residue level of 0.02 mg/kg and an STMR and HR value of 0.01 mg/kg for thiacloprid in tree nuts.
Oilseed rape and white mustard
Field trials on oilseed rape were provided from France, Hungary, Germany, Spain and Sweden.
Various GAPs in Czech Republic, Slovakia, Switzerland and the United Kingdom are up to two applications with 0.0096 up to 0.14 kg ai/ha. The residues in rapeseeds from 14 supervised trials matching the GAP ± 30% were < 0.02(3), 0.02, 0.03, 0.05, 0.06, 0.07(3), 0.09, 0.1, 0.22, 0.33 mg/kg.
The GAP in Czech Republic for white mustard is up to two applications with 0.096 kg ai/ha each and no PHI reported. The Meeting concluded that residue trials for rapeseed can be extrapolated to white mustard seed.
The Meeting recommended a maximum residue level of 0.5 mg/kg, an STMR value of 0.065 mg/kg and a HR value of 0.33 mg/kg for thiacloprid in rapeseed and white mustard seeds.
Cotton seeds
Field trials on cotton were provided from Greece, Spain and the USA.
For cotton, two sets of supervised residue trials from Europe and USA were made available. The trials conducted in the USA were analyzed using a total residue method measuring 6-CNA. In the European trials total thiacloprid residue, determined as 6-CNA, and thiacloprid only, were analyzed. This data shows clear differences in the residue levels. Therefore the Meeting concluded that the residue data from USA for cotton would not be considered for further evaluation. The residue trials from Europe were conducted with three applications of 0.096 kg ai/ha each and a PHI of 21 days. This use pattern corresponded to GAPs from Greece, Guatemala, Spain and Turkey. The residues in cotton seed from eight supervised trials matching the GAP (± 30%) were < 0.02(8) mg/kg.
The Meeting recommended a maximum residue level of 0.02 (*) mg/kg and an STMR and HR value of 0.02 mg/kg for thiacloprid in cotton seeds.
Thiacloprid 1131
Sunflower seeds
The Meeting received information from one field trial on sunflowers from Hungary.
Registered uses of thiacloprid on sunflowers are available from Hungary and Slovakia. The application rates are 0.036−0.048 kg ai/ha and an undefined PHI and a PHI of 30 days, respectively. The one supervised trial on sunflowers (application rate of 0.097 kg ai/ha) did not correspond to any available GAP.
The Meeting concluded that the available residue data on sunflowers was not sufficient for a recommendation of MRL, STMR of HR values.
Green tea
Field trials on green tea were made available from Japan.
GAP in Japan for green tea is one applications at 0.6 kg ai/ha and a PHI of seven days. The residue trials from Japan were conducted with an application rate of 0.3 kg ai/ha, which did not correspond to the submitted GAP. The Meeting concluded that a recommendation of maximum residue levels for green tea was not possible.
Wheat forage
Field trials on wheat were provided from France and Germany.
Registered uses of thiacloprid on wheat are available from Romania and Lithuania. The application rates are 0.048 kg ai/ha and 0.034 kg ai/ha respectively with a PHI of 21 days for Lithuania and an undefined PHI for Romania. The Meeting received supervised residue trials on wheat with application rates of 0.05 up to 0.062 kg ai/ha, which corresponds to + 29% of the GAP. Residues in wheat forage were: 1.2, 1.2, 1.3(3), 1.7, 1.8, 1.8, 1.9 and 2.2 mg/kg.
The Meeting estimated an STMR value of 1.5 mg/kg and a highest residue value of 2.2 mg/kg for thiacloprid in wheat forage.
Wheat straw
Field trials on wheat straw were available from France and Germany.
Registered uses of thiacloprid on wheat straw are available from Romania and Lithuania with application rates of 0.048 kg ai/ha and 0.034 kg ai/ha respectively, with a PHI of 21 days for Lithuania and an undefined PHI for Romania. The Meeting received supervised residue trials on wheat with application rates of 0.05 up to 0.062 kg ai/ha, which corresponded to + 29% of the GAP. Residues in wheat straw were 0.06, 0.07, 0.07, 0.14, 0.53, 0.89, 0.97, 1.2, 1.6 and 1.7 mg/kg.
The Meeting estimated an STMR value of 0.71 mg/kg and a highest residue value of 1.7 mg/kg for thiacloprid in wheat straw.
Based on 88% dry weight matter the residues in wheat straw (dry matter) were 0.07, 0.08, 0.08, 0.16, 0.6, 1.0, 1.1, 1.3, 1.8, 1.9 mg/kg. The Meeting estimated a MRL of 5 mg/kg for wheat straw (dry matter based).
Almond hulls
Field trials on almonds were made available from the USA.
GAP in Italy and the United Kingdom is up to two applications with 0.012 – 0.018 kg ai/hL and a PHI of 1 to 14 days. The residues for almond hulls from 14 trials in the USA matching the European GAP (± 30%) were 0.99, 1.3, 1.4, 1.5, 1.8, 1.8, 2.0, 2.1, 3.2, 3.3, 3.3, 3.4, 4.5, 4.9 mg/kg.
1132 Thiacloprid
The Meeting estimated an STMR value of 2.05 mg/kg and a highest residue of 4.9 mg/kg for thiacloprid in almond hulls (fresh weight).
Based on 90% dry weight matter the residues in almond hulls were 1.1, 1.4, 1.6, 1.7, 2.0, 2.0, 2.2, 2.3, 3.5, 3.6, 3.6, 3.7, 5.0 and 5.4 mg/kg. The Meeting estimated a MRL of 10 mg/kg for almond hulls (dry matter based).
Rape forage
The Meeting received information on supervised residue trials on oilseed rape from France, Hungary, Germany, Spain and Sweden.
Various GAPs in the Czech Republic, Slovakia, Switzerland and the United Kingdom consist of up to two applications at 0.0096 to 0.14 kg ai/ha with PHI between zero and 30 days. The residues in rape forage from 12 supervised trials matching the GAP (± 30%) were 1.0, 1.1(4), 1.2, 1.4, 1.5, 1.6, 1.7, 1.9 and 2.2 mg/kg.
The Meeting estimated an STMR value of 1.3 mg/kg and a highest residue of 2.2 mg/kg for thiacloprid in rape forage (fresh weight).
Cotton gin by-products
Field trials on cotton gin by-products were provided from Greece, Spain and the USA.
For cotton two sets of supervised residue trials from Europe and USA were made available. The residue trials conducted in the USA were analyzed using a total residue method measuring 6-CNA. In the European trials total thiacloprid residue, determined as 6-CNA, and thiacloprid only, were analyzed. Residues analyzed with the total residue method are much higher than thiacloprid only residues and can not be extrapolated to evaluate the residue situation. In the supervised residue trials according to the residue definition “thiacloprid only” no gin trash samples were analyzed. A recommendation for a STMR or highest residue value for cotton gin by-products was not possible.
Fate of residues during processing
Thiacloprid was generally stable to hydrolysis during pasteurization, baking and boiling conditions.
Information on the fate of thiacloprid residues during food processing was available for melons and watermelons, apples, peaches, cherries and tomatoes.
Calculated processing factors and the mean or best estimate are summarized in the following table.
Raw agricultural commodity
(RAC) Processed commodity Calculated processing factor Estimate of the processing
factor
Apples Apple, dried
Apple, juice
Apple, sauce
Apple, pomace dry
0.3, 0.7
0.2, 0.29
0.6, 0.86
4.3, 8.7
0.5
0.25
0.73
6.5
Peaches without stone Peach, preserve 0.22, 0.66, 0.66 0.66
Tomatoes Tomatoes, peeled
Tomato, paste
Tomato, juice
Tomato, preserve
0.25, 0.43
2, 3.1
0.42, 0.71
0.33, 0.71
0.34
2.6
0.615
0.52

Thiacloprid 1133
For apples the estimated processing factors are applied to the STMR value of 0.11 mg/kg for pome fruits. The Meeting estimated STMR-P values for dried apple of 0.055 mg/kg, for apple juice of 0.0275 mg/kg, for apple sauce of 0.077 mg/kg and for apple pomace dry of 0.71 mg/kg.
For peaches the estimated processing factors are applied to the STMR value of 0.08 mg/kg for stone fruits. The Meeting estimated STMR-P values of 0.05 mg/kg for preserved peaches.
For cherries it was not possible to calculate processing factors as residues in the RAC were below the limit of quantification.
For tomatoes the estimated processing factors are applied to the STMR value of 0.165 mg/kg. The Meeting estimated STMR-P values for peeled tomatoes of 0.056 mg/kg, for tomato paste of 0.429 mg/kg, for tomato juice of 0.1 mg/kg and for tomato preserve of 0.086 mg/kg.
Farm animal dietary burden
The Meeting estimated the dietary burden of thiacloprid residues for ruminants based on STMR and highest residue values obtained from the submitted supervised residue trials. The diets are described in Appendix IX of the FAO Manual (FAO, 2002).
Estimated maximum dietary burden of farm animals Dietary content (%) Residue contribution
(mg/kg) Crop Residue
(mg/kg) Basis Group Dry
matter (%)
Residue/ Dry matter (mg/kg) Beef
cattle Dairy cows
Poultry Beef cattle
Dairy cows
Poultry
Apple, dry pomace 0.72
STMR-P AB 100 0.72 40 20 0.29 0.14 0
Rape, forage 2.2 HR AM 30 7.33 30 30 2.20 2.20 0 Cottonseed (meal) 0.02 HR - 89 0.02 20 0.00 0.00 0.004 Wheat, forage 2.2 HR AF 25 8.80 25 50 2.20 4.40 0 Wheat, grain 0.04 HR GC 89 0.045 5 80 0.002 0.000 0.036 Total 100 100 100 4.7 6.7 0.04
Estimated median dietary burden of farm animals Dietary content (%) Residue contribution
(mg/kg) Crop Residue
(mg/kg) Basis Group Dry
matter (%)
Residue/ Dry matter (mg/kg) Beef
cattle Dairy cows
Poultry Beef cattle
Dairy cows
Poultry
Apple, dry pomace 0.72
STMR-P AB 100 0.65 40 20 0.29 0.14 0
Rape, forage 1.3 STMR AM 30 4.33 30 30 1.3 1.3 0 Cottonseed (meal) 0.02 STMR - 89 0.02 20 0 0 0.004 Wheat, forage 1.5 STMR AF 25 6.00 25 50 1.5 3 0 Wheat, grain 0.025 STMR GC 89 0.03 5 80 0.001 0 0.022 Total 100 100 100 3.1 4.4 0.03

1134 Thiacloprid
The dietary burdens of thiacloprid for estimation of MRL and STMR values for animal commodities are for beef cattle 4.7 and 3.1 mg/kg and for dairy cows 6.7 and 4.4 mg/kg respectively. For poultry a dietary burden of 0.04 and 0.03 mg/kg was calculated.
Farm animal feeding studies
The Meeting received animal feeding studies on ruminants. No study on poultry feeding was available.
Three groups of cows were dosed at levels equivalent to 2.1 (0.07 mg/kg bw) (1×), 6.2 (0.213 mg/kg bw) (3×) and 20.6 ppm (0.655 mg/kg bw) (10×) of thiacloprid in the diet together with a control group. On average from the cows treated at the 1× dose level, the liver contained the highest thiacloprid residue levels (0.10 mg/kg) followed by kidney (0.03 mg/kg), milk and muscle (0.02 mg/kg) and fat (0.01 mg/kg). Maximum levels for tissues were 0.02 mg/kg for fat, 0.02 mg/kg for muscle, 0.04 mg/kg for kidney and 0.11 mg/kg for liver.
In the second dose group thiacloprid residues increased to an average value of 0.04 mg/kg in milk and fat (highest value 0.04 mg/kg), 0.05 mg/kg in muscle (highest value 0.06 mg/kg), 0.1 mg/kg in kidney (highest value 0.11 mg/kg) and 0.29 mg/kg in liver (highest value 0.32 mg/kg). In the high dose group the residues found were 0.17 mg/kg in milk, 0.12 mg/kg in fat (highest value 0.16 mg/kg), 0.16 mg/kg in muscle (highest value 0.18 mg/kg), 0.27 mg/kg in kidney (highest value 0.32 mg/kg) and 0.94 mg/kg in liver (highest value 1.1 mg/kg).
A linear relation between the dose levels and the residue concentrations was observed.
In milk, residues reached a plateau level within five days and no accumulation was observed.
For poultry no feeding studies were provided. In the metabolism study based on a feeding level of 10 mg/kg bw (corresponding to 124 ppm in feed, based on dry weight) thiacloprid residues of 0.06 mg/kg in eggs, 0.03 mg/kg in muscle, 0.08 mg/kg in fat and 0.54 mg/kg in liver were found.
Animal commodity maximum residue levels
The dietary burden for beef and diary cattle was estimated at a maximum level 4.7 and 6.7 mg/kg respectively. The maximum residue level to be expected in tissues can be obtained from the results of feeding at a level of 6.2 ppm.
Thiacloprid residue level (mg/kg)3 Dietary burden
(mg/kg)1 Feeding level [ppm]2 Milk (mean) Fat (high) Muscle (high) Liver (high) Kidney (high)
MRL dairy cattle
(6.7) [6.2]
(0.04) 0.04
(0.04) 0.04
(0.06) 0.06
(0.32) 0.34
(0.11) 0.11
Milk (mean) Fat (mean) Muscle (mean) Liver (mean) Kidney (mean) STMR dairy cattle
(4.4) [2.1,6.2]
(0.02, 0.04) 0.03
(0.02, 0.04) 0.03
(0.02, 0.05) 0.035
(0.1, 0.29) 0.21
(0.04, 0.1) 0.07
1 In parentheses, estimated dietary burden 2 In square brackets, actual feeding level in transfer studies 3 Values in parentheses in italics are derived from the dietary burden, feeding levels and residue levels found in the transfer studies ´. “high” is the highest residue level in an individual tissue in the relevant feeding group. “mean” is the mean residue level in milk in the relevant feeding group.
The median dietary burdens were 3.1 mg/kg for beef cattle and 4.4 mg/kg for dairy cattle. The burden for dairy cows is between the dose levels of 2.1and 6.2 mg/kg of the animal feeding study. Therefore the mean value for each dose group and each commodity is taken for STMR estimation. The values are 0.03 mg/kg for milk, 0.03 mg/kg for mammalian fat, 0.035 mg/kg for mammalian meat and 0.21 mg/kg for edible offal, mammalian. For HR the calculated residues based on the maximum

Thiacloprid 1135
estimated dietary burden were 0.04 mg/kg for mammalian fat, 0.06 mg/kg for mammalian meat and 0.34 for mammalian edible offal.
Based on the highest residues found in the feeding study (3× dose) the Meeting estimated maximum residue levels of 0.1 mg/kg for mammalian meat and 0.5 mg/kg for mammalian edible offal. Based on the mean value the Meeting estimated a maximum residue level of 0.05 mg/kg for milk.
For poultry no feeding studies are available. When the calculated maximum dietary burden for poultry is extrapolated from the results of the poultry metabolism study the resulting residue levels are far below 0.01 mg/kg. The Meeting estimated an STMR value and a highest residue of 0 mg/kg for thiacloprid in poultry products.
The Meeting estimated a MRL of 0.02 (*) mg/kg for poultry meat, poultry edible offal and eggs.
RECOMMENDATIONS
The Meeting estimated the STMR, HR and MRL values shown below.
The definition for the residue in plant and animals (enforcement and risk assessment) is: thiacloprid.
The residue is not fat soluble.
Commodity MRL, mg/kg HR, mg/kg STMR or
STMR-P, mg/kgCCN Name New Previous AM 0660 Almond hulls 10 5.4 2.05 DF 0226 Apple, dried 0.19 0.055 JF 0226 Apple, juice 0.0275 FB0018 Berries and other small fruits
except grapes 1 0.62 0.275
SO 0691 Cotton seed 0.02 (*) 0.02 0.02 VC 0424 Cucumbers 0.3 0.18 0.08 MO 0105 Edible offal, mammalian 0.5 0.34 0.21 VO 0440 Eggplants 0.7 0.38 0.185 PE 0112 Eggs 0.02 (*) 0 0 FI 0341 Kiwi fruits 0.2 0.1 0.02 MF 0100 Mammalian fats, except milk fats 0.04 0.03 MM 0095 Meat, mammalian 0.05 0.06 0.03 VC 0046 Melons 0.2 0.02 0.02 ML 0106 Milks 0.05 - 0.03 SO 0495 Oilseed rape 0.5 0.33 0.065 VO 0445 Pepper, sweet 1 0.38 0.22 FP 0009 Pome fruits 0.7 0.38 0.11 VR 0589 Potatoes 0.02 (*) 0 0 PM 0110 Poultry meat 0.02 (*) 0 0 PO 0111 Poultry, edible offal of 0.02 (*) 0 0 Rape forage (fresh weight) 2.2 1.3 GC 0649 Rice 0.02 (*) 0 0 VC 4207 Squash, summer 0.3 0.18 0.08

1136 Thiacloprid
VC 0431 Squash, winter 0.2 0.02 0.02 FS0012 Stone fruits 0.5 0.40 0.08 JF 0448 Tomato, juice 0.1 Tomato, paste 0.429 Tomato, peeled 0.056 VO 0448 Tomatoes 0.5 0.29 0.165 TN 0085 Treenuts 0.02 0.01 0.01 VC 0432 Watermelons 0.2 0.02 0.02 GC 0654 Wheat 0.1 0.04 0.025 Wheat, forage - 2.2 1.5 AS 0654 Wheat, straw 5 1.7 (fresh matter) 0.71 (fresh matter)SO 0485 White mustard 0.5 0.33 0.065
DIETARY RISK ASSESSMENT
Long-term intake
The International Estimated Daily Intakes (IEDI) of thiacloprid based on 13 GEMS/Food regional diets were in the range of 1−10% of the maximum ADI of 0.01 mg/kg bw. The Meeting concluded that the long-term intake of residues of thiacloprid from uses that have been considered by the JMPR is unlikely to present a public health concern.
Short-term intake
The International Estimated Short Term Intake (IESTI) of thiacloprid on the basis of the recommendations made by the JMPR represented 0−90% of the ARfD (0.03 mg/kg bw) for children and 0−30% for the general population. The Meeting concluded that the short-term intake of residues of thiacloprid resulting from uses that have been considered by the JMPR is unlikely to present a public health concern.
REFERENCES
Document No.Author, Date, Title, Institute, Report Reference, GLP/Non-GLP.
THIA06-004, Anderson, C.; Weber, H. and Bornatsch, W., 1998, [Methylene-14C]YRC 2894: Absorption, distribution, excretion, and metabolism in the lactating goat, Bayer AG, Leverkusen, Germany, Bayer CropScience AG, Report No.: PF4372, Edition Number: M-002130-01-1, Date: 1998-06-24, GLP, unpublished
THIA06-164, Anon., 1996, Thiacloprid residues on sweet pepper - inhouse results, Bayer CropScience, Tokio 1996
THIA06-135, Anon., 1997, Thiacloprid residues on apples - inhouse results, Bayer CropScience, Tokio 1997
THIA06-140, Anon., 2001, Thiacloprid residues on eggplant - official parent and amide, Bayer CropScience, Tokio, 2001
THIA06-139, Anon., 2003, Thiacloprid residues on cherries - official parent and amide, Bayer CropScience, Tokio, 2003
THIA06-165, Anon., 1996a, Thiacloprid residues on sweet pepper - inhouse results, Bayer CropScience, Tokio 1996
THIA06-166, Anon., 1996b, Thiacloprid residues on sweet pepper - inhouse results, Bayer CropScience, Tokio 1996
THIA06-167, Anon., 1996c, Thiacloprid residues on sweet pepper - inhouse results, Bayer CropScience, Tokio 1996
THIA06-172, Anon., 1996d, Thiacloprid residues on strawberries - inhouse results, Bayer CropScience, Tokio 1996
THIA06-173, Anon., 1996e, Thiacloprid residues on strawberries - inhouse results, Bayer CropScience, Tokio 1996
THIA06-174, Anon., 1996f, Thiacloprid residues on strawberries - inhouse results, Bayer CropScience, Tokio 1996

Thiacloprid 1137
THIA06-175, Anon., 1996g, Thiacloprid residues on strawberries - inhouse results, Bayer CropScience, Tokio 1996
THIA06-136, Anon., 1997a, Thiacloprid residues on apples - inhouse amide results, Bayer CropScience, Tokio 1997
THIA06-179, Anon., 1997aa, Thiacloprid residues on tomatoes - inhouse results, Bayer CropScience, Tokio 1997
THIA06-180, Anon., 1997ab, Thiacloprid residues on ume plums - inhouse results, Bayer CropScience, Tokio 1997
THIA06-181, Anon., 1997ac, Thiacloprid residues on ume plums - inhouse results, Bayer CropScience, Tokio 1997
THIA06-182, Anon., 1997ad, Thiacloprid residues on ume plums - inhouse results, Bayer CropScience, Tokio 1997
THIA06-183, Anon., 1997ae, Thiacloprid residues on ume plums - inhouse results, Bayer CropScience, Tokio 1997
THIA06-137, Anon., 1997b, Thiacloprid residues on apples - oficial results, Bayer CropScience, Tokio 1997
THIA06-138, Anon., 1997c, Thiacloprid residues on apples - official amide results, Bayer CropScience, Tokio 1997
THIA06-148, Anon., 1997d, Thiacloprid residues on melons - inhouse results, Bayer CropScience, Tokio 1997
THIA06-149, Anon., 1997e, Thiacloprid residues on melons - inhouse amide results, Bayer CropScience, Tokio 1997
THIA06-150, Anon., 1997f, Thiacloprid residues on melons - oficial results, Bayer CropScience, Tokio 1997
THIA06-151, Anon., 1997g, Thiacloprid residues on melons - official amide results, Bayer CropScience, Tokio 1997
THIA06-152, Anon., 1997h, Thiacloprid residues on peach - inhouse results, Bayer CropScience, Tokio 1997
THIA06-153, Anon., 1997i, Thiacloprid residues on peach - inhouse amide results, Bayer CropScience, Tokio 1997
THIA06-154, Anon., 1997j, Thiacloprid residues on peach - oficial results, Bayer CropScience, Tokio 1997
THIA06-155, Anon., 1997k, Thiacloprid residues on peach - official amide results, Bayer CropScience, Tokio 1997
THIA06-156, Anon., 1997l, Thiacloprid residues on pear - inhouse results, Bayer CropScience, Tokio 1997
THIA06-157, Anon., 1997m, Thiacloprid residues on pear - inhouse amide results, Bayer CropScience, Tokio 1997
THIA06-158, Anon., 1997n, Thiacloprid residues on pear - oficial results, Bayer CropScience, Tokio 1997
THIA06-159, Anon., 1997o, Thiacloprid residues on pear - official amide results, Bayer CropScience, Tokio 1997
THIA06-160, Anon., 1997p, Thiacloprid residues on potato - inhouse results, Bayer CropScience, Tokio 1997
THIA06-161, Anon., 1997q, Thiacloprid residues on potato - inhouse results, Bayer CropScience, Tokio 1997
THIA06-162, Anon., 1997r, Thiacloprid residues on potato - inhouse results, Bayer CropScience, Tokio 1997
THIA06-163, Anon., 1997s, Thiacloprid residues on potato - inhouse results, Bayer CropScience, Tokio 1997
THIA06-168, Anon., 1997t, Thiacloprid residues on rice - inhouse results, Bayer CropScience, Tokio 1997
THIA06-169, Anon., 1997u, Thiacloprid residues on rice - inhouse results, Bayer CropScience, Tokio 1997
THIA06-170, Anon., 1997v, Thiacloprid residues on rice - inhouse results, Bayer CropScience, Tokio 1997
THIA06-171, Anon., 1997w, Thiacloprid residues on rice - inhouse results, Bayer CropScience, Tokio 1997
THIA06-176, Anon., 1997x, Thiacloprid residues on tomatoes - inhouse results, Bayer CropScience, Tokio 1997
THIA06-177, Anon., 1997y, Thiacloprid residues on tomatoes - inhouse results, Bayer CropScience, Tokio 1997
THIA06-178, Anon., 1997z, Thiacloprid residues on tomatoes - inhouse results, Bayer CropScience, Tokio 1997
THIA06-141, Anon., 2001a, Thiacloprid residues on eggplant - official parent and amide, Bayer CropScience, Tokio, 2001
THIA06-146, Anon., 2001a, Thiacloprid residues on Japanese apricot - official parent and amide, Bayer CropScience, Tokio, 2001
THIA06-147, Anon., 2001b, Thiacloprid residues on Japanese apricot - inhouse parent and amide, Bayer CropScience, Tokio, 2001
THIA06-038, Anon., 2002, Report on the project studies on the residues of Calypso 240 SC (Thiacloprid) in/on paddy, Bidhan Chandra Krishi Viswavidyalaya Pesticide Residue Laboratory, Mohanpur, West Bengal, Bayer CropScience AG, Report No.: India-Rice-2002, Edition Number: M-26353
THIA06-142, Anon., 2002a, Thiacloprid residues on grapes, large - inhouse results, Bayer CropScience, Tokio 2002
THIA06-143, Anon., 2002b, Thiacloprid residues on grapes, large - official results, Bayer CropScience, Tokio 2002
THIA06-144, Anon., 2002c, Thiacloprid residues on grapes, small - official parent and amide, Bayer CropScience, Tokio, 2002

1138 Thiacloprid
THIA06-145, Anon., 2002d, Thiacloprid residues on grapes, small - inhouse parent and amide, Bayer CropScience, Tokio, 2002
THIA06-184, Anon., 2002f, Thiacloprid residues on watermelon - official parent and amide, Bayer CropScience, Tokio, 2002
THIA06-185, Anon., 2002g, Thiacloprid residues on watermelon - inhouse parent and amide, Bayer CropScience, Tokio, 2002
THIA06-007, Babczinski, P., 1997, Metabolism of YRC 2894 in tomatoes, Bayer AG, Leverkusen, Germany, Bayer CropScience AG, Report No.: PF4118, Edition Number: M-000673-01-1, Date: 1997-08-15, GLP, unpublished
THIA06-029, Babczinski, P., 1997a, Radiovalidation of YRC 2894 total residue method for cotton seed and gin trash, Bayer AG, Leverkusen, Germany, Bayer CropScience AG, Report No.: PF4297, Edition Number: M-021473-01-1, Method Report No.: PF4297, Date: 11.12.1997, GLP, unpublished
THIA06-009, Babczinski, P., 1998, Metabolism of YRC 2894 in cotton, Bayer AG, Leverkusen, Germany, Bayer CropScience AG, Report No.: PF4256, Edition Number: M-001443-01-1, Date: 1998-03-16, GLP, unpublished
THIA06-026, Ballesteros, C. and Meilland - Berthier, I., 2004, Modification M001 of the residue analytical method 00548 for the determination of residues of YRC 2894 in zuccini and pepper by HPLC with electrospray MS/MS-detection. method no.00548/M001, Bayer CropScience, Lyon, France, Bayer CropScience AG, Report No.
THIA06-027, Ballesteros, C. and Meilland - Berthier, I., 2005, Supplement E006 to the residue analytical method 00548/M001 for the determination of residues of YRC 2894 in plants by HPLC with electrospray MS/MS detection, Bayer CropScience, Lyon, France, Bayer CropScience AG, Report No.: 00548/M001/E006, Edition Numb
THIA06-039, Baravelli, P. L., 2003, Decline curve of thiacloprid active ingredient in walnut after one application with the calypso formulation, AgriParadigma, Italy, Bayer CropScience AG, Report No.: AGRI012/03DEC, Edition Number: M-088081-01-1, Date: 02.12.2003, Non GLP, unpublished
THIA06-025, Billian, P. and Schoening, R., 2003, Validation of the supplement E004 of the analytical method 00548 for the determination of residues of thiacloprid (YRC 2894) in/on plant materials by HPLC-MS/MS, Bayer CropScience AG, Report No.: 00548/E004, Edition Number: M-104531-01-1, Method Report No
THIA06-068, Billian, P. and Schoening, R., 2003, Determination of residues of YRC 2894 in/on sweet cherry following spray application of YRC 2894 480 SC in the field in Germany and Northern France, Bayer CropScience AG, Report No.: RA-2030/02, Edition Number: M-110757-01-1, Date: 10.09.2003, GLP, unpubl
THIA06-072, Billian, P. and Schoening, R., 2003a, Determination of residues of YRC 2894 in/on plum following spray application of YRC 2894 480 SC in the field in Northern France, Bayer CropScience AG, Report No.: RA-2080/02, Edition Number: M-103707-01-1, Date: 13.08.2003, GLP, unpublished
THIA06-080, Billian, P. and Schoening, R., 2003b, Determination of residues of YRC 2894 in/on strawberry following spray application of YRC 2894 480 SC in the greenhouse in Germany, Italy, Spain, the Netherlands and Southern France, Bayer CropScience AG, Report No.: RA-2081/02, Edition Number: M-104912-0
THIA06-084, Billian, P. and Schoening, R., 2003c, Determination of residues of YRC 2894 in/on raspberry following spray application of YRC 2894 480 SC in the field in Germany and Great Britain, Bayer CropScience AG, Report No.: RA-2082/02, Edition Number: M-115998-01-1, Date: 15.09.2003, GLP, unpublished
THIA06-120, Billian, P. and Schoening, R., 2003d, Determination of residues of YRC 2894 in/on rape following spray application of Calypso 240 OD in the field in Germany, Northern France and Sweden, Bayer CropScience AG, Report No.: RA-2025/02, Edition Number: M-110617-01-1, Date: 30.06.2003, GLP, unpubli
THIA06-122, Billian, P. and Schoening, R., 2003e, Determination of residues of YRC 2894 in/on rape following spray application of Calypso 240 OD in the field in Southern France and Spain, Bayer CropScience AG, Report No.: RA-2026/02, Edition Number: M-108111-01-1, Date: 18.06.2003, GLP, unpublished
THIA06-010, Bongartz, R. and Neumann, B., 2001, Metabolism of [pyridinyl-14C-methyl]YRC2894 in spring wheat, Bayer AG, Leverkusen, Germany, Bayer CropScience AG, Report No.: MR-046/01, Edition Number: M-035182-01-1, Date: 2001-09-21, GLP, unpublished
THIA06-003, Brumhard, B., 1998, Hydrolysis of YRC 2894 in sterile aqueous buffer solutions, Bayer AG, Leverkusen, Germany, Bayer CropScience AG, Report No.: PF4338, Edition Number: M-001109-01-1, Date: 1998-02-16, GLP, unpublished
THIA06-012, Clark, T. and Babczinski, P., 1998, Confined rotational crop study with YRC 2894, Bayer AG, Leverkusen, Germany, Bayer CropScience AG, Report No.: PF4351, Edition Number: M-001542-01-1, Date: 1998-03-27, GLP, unpublished
THIA06-006, Clark, T. and Bornatsch, W., 1997, Metabolism of [pyridinyl-14C -methyl]YRC 2894 in apples, Bayer AG, Leverkusen, Germany, Bayer CropScience AG, Report No.: PF4306, Edition Number: M-000686-01-1, Date: 1997-10-02, GLP, unpublished

Thiacloprid 1139
THIA06-047, Clay, S., 2002, Thiacloprid on Lemon Samples, Hill Laboratories, Hamilton, New Zealand, Bayer CropScience AG, Report No.: LabGLP24, Report includes Trial Nos.: R-091-01-PF, Edition Number: M-261169-01-1, Date: 17.12.2002, Non GLP, unpublished
THIA06-036, Clay, S., 2003, Thiacloprid on Kiwifruit, Hill Laboratories, Hamilton, New Zealand, Bayer CropScience AG, Report No.: LabGLP75, Edition Number: M-261169-01-1, Date: 09.10.2003, Non GLP, unpublished
THIA06-085, Clay, S., 2003a, Thiacloprid on Kiwifruit, Hill Laboratories, Hamilton, New Zealand, Bayer CropScience AG, Report No.: LabGLP75, Edition Number: M-261169-01-1, Date: 09.10.2003, Non GLP, unpublished
THIA06-086, Clay, S., 2004, Determination of thiacloprid residues in kiwifruit, Hill Laboratories, Hamilton, New Zealand, Bayer CropScience AG, Report No.: LabGLP104, Edition Number: M-261172-01-1, Date: 05.05.2004
THIA06-030, DeHaan, R. A., 1999, An analytical method for the determination of YRC 2894 residues in plant matrices, Bayer Corporation, Stilwell, KS, USA, Bayer CropScience AG, Report No.: 108450, Edition Number: M-009618-01-1, Date: 17.03.1999, GLP, unpublished
THIA06-116, Diot, R., 2005, Determination of the residues of YRC 2894 (thiacloprid) and deltamethrin in/on corn after spraying of Proteus (110 OD) in the field in northern France and Germany, Bayer CropScience , Lyon, France, Bayer CropScience AG, Report No.: RA-2512/04, Edition Num
THIA06-117, Diot, R., 2005a, Determination of the residues of YRC 2894 (Thiacloprid) and deltamethrin in/on corn after spraying of Proteus (110 OD) in the field in southern France, Spain, Italy and Greece, Bayer CropScience , Lyon, France, Bayer CropScience AG, Report No.: RA-2511/04
THIA06-071, Dorschner, K. W., 2002, Thiacloprid: Magnitude of the residue on sweet cherry, Rutgers, The State University of New Jersey, North Brunswick, NJ, USA, Bayer CropScience AG, Report No.: 200540, Edition Number: M-088976-01-1, Date: 18.12.2002, GLP, unpublished
THIA06-077, Dorschner, K. W., 2002a, Thiacloprid: Magnitude of the residue on plum, Rutgers, The State University of New Jersey, North Brunswick, NJ, USA, Bayer CropScience AG, Report No.: 200509, Edition Number: M-088965-01-1, Date: 18.12.2002, GLP, unpublished
THIA06-112, Eberhardt, R. and Schoening, R., 2001, Determination of residues of YRC 2894 on spring wheat after spray application of YRC 2894 480 SC in the field in Germany and France, Bayer AG, Leverkusen, Germany, Bayer CropScience AG, Report No.: RA-2120/00, Edition Number: M-081927-01-1, Date: 05.11.20
THIA06-114, Eberhardt, R. and Schoening, R., 2002, Determination of residues of YRC 2894 in/on spring barley after spray application of YRC 2894 480 SC in the field in Germany and Northern France, Bayer AG, Leverkusen, Germany, Bayer CropScience AG, Report No.: RA-2122/00, Edition Number: M-056032-01-1, D
THIA06-037, Fukuda, T., 1998, Residues of thiacloprid in green tea, Nihon Bayer Agrochem K. K., Yuki, Japan, Bayer CropScience AG, Report No.: NR98020, Edition Number: M-003954-01-1, Date: 28.04.1998, Non GLP, unpublished
THIA06-058, Garbers, H. V., 2000, Determination of thiacloprid residues in apples, South African Bureau of Standards, Pretoria, South Africa, Bayer CropScience AG, Report No.: 5438/1493265/T390, Edition Number: M-038003-01-1, Date: 11.09.2000, GLP, unpublished
THIA06-002, Goehrt, A., 1995, Crystal structure analysis of YRC 2894, Bayer AG, Leverkusen, Germany, Bayer CropScience AG, Report No.: PC1935, Edition Number: M-002079-01-2, Date: 24.01.1995, Non GLP, unpublished
THIA06-055, Harbin, A. M., 1999, YRC 2894 480SC and 70WG - Magnitude of the residue on pome fruit (Apple/pear), Bayer Corporation, Kansas City, MO, USA, Bayer CropScience AG, Report No.: 108812, Edition Number: M-009903-01-1, Date: 11.03.1999, GLP, unpublished
THIA06-033, Harbin, A. M., 2004, Calypso 480 SC and Calypso 70 WG - Magnitude of the residue in/on almonds and pecans (crop group 14 - tree nuts), Bayer CropScience, Stilwell, KS, USA, Bayer CropScience AG, Report No.: 110307, Edition Number: M-128884-01-1, Date: 12.11.2004 GLP, unpubli
THIA06-070, Heinemann, O. and Schoening, R., 2000, Determination of residues of YRC 2894 480 SC in/on sweet cherry in the field following spray application in Italy and Spain, Bayer AG, Leverkusen, Germany, Bayer CropScience AG, Report No.: RA-2071/99, Edition Number: M-023604-01-1, Date: 17.02.2000, GLP,
THIA06-083, Heinemann, O. and Schoening, R., 2002, Determination of residues of YRC 2894 480 SC in/on raspberry after spray application in the field in Germany and Great Britain, Bayer AG, Leverkusen, Germany, Bayer CropScience AG, Report No.: RA-2133/01, Edition Number: M-065413-01-1, Date: 23.05.2002, G
THIA06-011, Hellpointner, E., 1998b, Photolysis of YRC 2894 on soil, Bayer AG, Leverkusen, Germany, Bayer CropScience AG, Report No.: PF4333, Edition Number: M-001245-01-1, Date: 1998-02-26, GLP, unpublished
THIA06-125, Koch, A., 1999, YRC 2894 480 SC/YRC2894 70WG - Magnitude of the residues in cotton, Bayer Corporation, Stilwell, KS, USA. , Bayer CropScience AG, Report No.: 109011, Edition Number: M-009862-01-1, Date: 23.03.1999, GLP, unpublished
1140 Thiacloprid
THIA06-008, Koester, J., 1997, Translocation of [pyridinyl-14C -methyl]YRC 2894 in tomato plants, Bayer AG, Leverkusen, Germany, Bayer CropScience AG, Report No.: PF4278, Edition Number: M-000671-01-1, Date: 1997-08-19, GLP, unpublished
THIA06-001, Krohn, J., 1996, Physical and chemical properties of YRC 2894, Bayer AG, Leverkusen, Germany, Bayer CropScience AG, Report No.: PC1418, Edition Number: M-000646-01-1, Date: 09.07.1996, GLP, unpublished
THIA06-045, Lancas, F. M., 1998, YRC 2894; 480 SC; mandarin/lemon; Brazil; BBA, Universidade de Sao Paulo, Sao Carlos, Brazil, Bayer CropScience AG, Report No.: M-005338-01-2, Report includes Trial Nos.: BRA-RE-062-98, Edition Number: M-005338-01-2, Date: 25.11.1998, Non GLP, unpublishe
THIA06-046, Lancas, F. M., 1998a, YRC 2894; 480 SC; mandarin/lemon; Brazil; BBA, Universidade de Sao Paulo, Sao Carlos, Brazil, Bayer CropScience AG, Report No.: M-005340-01-2, Report includes Trial Nos.: BRA-RE-061-98, Edition Number: M-005340-01-2, Date: 25.11.1998, Non GLP, unpublishe
THIA06-087, Lancas, F. M., 1998b, YRC 2894; 480 SC; onion; Brazil; BBA, Universidade de Sao Paulo, Sao Carlos, Brazil, Bayer CropScience AG, Report No.: M-005335-01-2, Edition Number: M-005335-01-2 Date: 25.11.1998, Non GLP, unpublished
THIA06-088, Lancas, F. M., 1998c, YRC 2894; 480 SC; garlic; Brazil; BBA, Universidade de Sao Paulo, Sao Carlos, Brazil, Bayer CropScience AG, Report No.: M-005328-01-2, Edition Number: M-005328-01-2 Date: 25.11.1998, Non GLP, unpublished
THIA06-111, Lancas, F. M., 1998d, YRC 2894; 480 SC; potato; Brazil; BBA, Universidade de Sao Paulo, Sao Carlos, Brazil, Bayer CropScience AG, Report No.: RE-059/98, Edition Number: M-005331-01-2, Date: 25.11.1998 Non GLP, unpublished
THIA06-032, Moore, S. M., 2002, An analytical method for the determination of YRC 2894, amide-YRC-2894, 4- hydroxy YRC2894 amide, YRC 2894 sodium sulfonate residues in various plant matrices by LC-MS/MS, Bayer Corporation, Stilwell, KS, USA, Bayer CropScience AG, Report No.: 110879, Edi
THIA06-034, Orosz, F., 2000, Method validation for determination of thiacloprid (YRC 2894) residues in rape seed by GC/MS, Plant Health and Soil Conservation Station, Kaposvár, Hungary, Bayer CropScience AG, Report No.: 00-BAY-AA-14-04-V, Edition Number: M-047645-01-1, Date: 20.11.20
THIA06-035, Orosz, F., 2000a, Method validation for determination of thiacloprid (YRC 2894) residues in sunflower seed by GC/MS, Plant Health and Soil Conservation Station, Kaposvár, Hungary, Bayer CropScience AG, Report No.: 00-BAY-AA-14-05-V, Edition Number: M-047662-01-1, Date: 20.
THIA06-118, Orosz, F., 2000b, Residue study with thiacloprid (YRC 2894) in rape (treatment with Calypso 480 SC, Hungary - season 2000), Plant Health and Conservation Station, Kaposvár, Hungary, Bayer CropScience AG, Report No.: 00-BAY-AA-14-04, Edition Number: M-044105-01-1, Date: 20.
THIA06-126, Orosz, F., 2000c, Residue study with thiacloprid (YRC 2894) in sunflower (treatment with Calypso 480 SC, Hungary - season 2000), Plant Health and Conservation Station, Kaposvár, Hungary, Bayer CropScience AG, Report No.: 00-BAY-AA-14-05, Edition Number: M-044114-01-1, Date
THIA06-031, Perez, R., 1999, Independent laboratory validation of analytical method 108450 for the determination of total residues of YRC 2894 in cotton and cotton processed products, ADPEN Laboratories Inc., Jacksonville, FL, USA, Bayer CropScience AG, Report No.: 108831, Edition Nu
THIA06-013, Placke, F. J., 1996, Residue analytical method for the determination of YRC 2894 residues in plant materials by HPLC, Bayer AG, Leverkusen, Germany, Bayer CropScience AG, Report No.: 00419, Edition Number: M-010844-01-1, Method Report No.: MR-295/96, Date: 29.04.1996, GLP, un
THIA06-042, Placke, F. J., 1997, Storage stability of YRC 2894 residues in crops during freezer storage, Bayer AG, Leverkusen, Germany, Bayer CropScience AG, Report No.: MR-1026/97, Edition Number: M-000994-01-1 Date: 09.12.1997, GLP, unpublished
THIA06-049, Placke, F. J., 1997a, Determination of residues of YRC 2894 480 SC following spray application on apple in Great Britain, Belgium and the Federal Republic of Germany, Bayer AG, Leverkusen, Germany Bayer CropScience AG, Report No.: RA-2062/95, Edition Number: M-000922-01-1, Dat
THIA06-050, Placke, F. J., 1997b, Determination of residues of YRC 2894 480 SC following spray application in the field on apple in Great Britain, Netherlands and the Federal Republic of Germany, Bayer AG, Leverkusen, Germany, Bayer CropScience AG, Report No.: RA-2114/96, Edition Number:
THIA06-052, Placke, F. J., 1997c, Determination of residues of YRC 2894 480 SC following spray application on apple in Spain an Italy, Bayer AG, Leverkusen, Germany, Bayer CropScience AG, Report No.: RA-2063/95, Edition Number: M-000919-01-1, Date: 12.11.1997, GLP, unpublished
THIA06-053, Placke, F. J., 1997d, Determination of residues of YRC 2894, 480 SC following spray application in the field on apple in Spain, Italy and France, Bayer AG, Leverkusen, Germany, Bayer CropScience AG, Report No.: RA-2115/96, Edition Number: M-000913-01-1, Date: 05.11.1997, GLP,

Thiacloprid 1141
THIA06-064, Placke, F. J., 1997e, Determination of residues of YRC 2894 480 SC following spray application on peach in Spain and Italy, Bayer AG, Leverkusen, Germany, Bayer CropScience AG, Report No.: RA-2064/95, Edition Number: M-000958-01-1, Date: 12.11.1997, GLP, unpublished
THIA06-065, Placke, F. J., 1997f, Determination of residues of YRC 2894 480 SC following spray application in the field on peaches in Spain, France and Italy, Bayer AG, Leverkusen, Germany, Bayer CropScience AG, Report No.: RA-2121/96, Edition Number: M-000955-01-1, Date: 18.11.1997, GLP
THIA06-091, Placke, F. J., 1997g, Determination of residues of YRC 2894 480 SC following spray application on cucumber in Spain and Italy, Bayer AG, Leverkusen, Germany, Bayer CropScience AG, Report No.: RA-2066/95, Edition Number: M-000932-01-1, Date: 20.02.1997, GLP, unpublished
THIA06-092, Placke, F. J., 1997h, Determination of residues of YRC 2894 480 SC following spray application in the field on cucumber in Spain an Italy, Bayer AG, Leverkusen, Germany, Bayer CropScience AG, Report No.: RA-2116/96, Edition Number: M-000930-01-1, Date: 23.10.1997, GLP, unpubli
THIA06-093, Placke, F. J., 1997i, Determination of residues of YRC 2894 480 SC following spray application in the greenhouse on cucumber in Spain, France, Greece, and Italy, Bayer AG, Leverkusen, Germany, Bayer CropScience AG, Report No.: RA-2117/96, Edition Number: M-000927-01-1, Date: 2
THIA06-094, Placke, F. J., 1997j, Determination of residues of YRC 2894 480 SC following spray application on watermelon and melon in Greece, Spain and Italy, Bayer AG, Leverkusen, Germany, Bayer CropScience AG, Report No.: RA-2061/95, Edition Number: M-000961-01-1, Date: 03.11.1997, GLP,
THIA06-095, Placke, F. J., 1997k, Determination of residues of YRC 2894 480 SC following spray application in the field on watermelon and melon in Greece, Spain and Italy, Bayer AG, Leverkusen, Germany, Bayer CropScience AG, Report No.: RA-2118/96, Edition Number: M-000972-01-1, Date: 02.
THIA06-097, Placke, F. J., 1997l, Determination of residues of YRC 2894 480 SC following spray application on tomato in Italy and France, Bayer AG, Leverkusen, Germany, Bayer CropScience AG, Report No.: RA-2068/95, Edition Number: M-000966-01-1, Date: 05.03.1997, GLP, unpublished
THIA06-098, Placke, F. J., 1997m, Determination of residues of YRC 2894 480 SC following spray application on tomato in Spain and the Federal Republic of Germany, Bayer AG, Leverkusen, Germany, Bayer CropScience AG, Report No.: RA-2067/95, Edition Number: M-000969-01-1, Date: 23.02.1997,
THIA06-099, Placke, F. J., 1997n, Determination of residues of YRC 2894 480 SC following spray application in the field on tomato in France and Italy, Bayer AG, Leverkusen, Germany, Bayer CropScience AG, Report No.: RA-2122/96, Edition Number: M-000987-01-1, Date: 03.12.1997, GLP, unpubli
THIA06-100, Placke, F. J., 1997o, Determination of residues of YRC 2894 480 SC following spray application in the greenhouse on Tomato in Spain, France and the Federal Republic of Germany, Bayer AG, Leverkusen, Germany, Bayer CropScience AG, Report No.: RA-2123/96, Edition Number: M-00096
THIA06-103, Placke, F. J., 1997p, Determination of residues of YRC 2894 480 SC following spray application on pepper in Spain and Italy, Bayer AG, Leverkusen, Germany, Bayer CropScience AG, Report No.: RA-2070/95, Edition Number: M-000950-01-1, Date: 26.03.1997, GLP, unpublished
THIA06-104, Placke, F. J., 1997q, Determination of residues of YRC 2894 480 SC following spray application on pepper in Spain and Netherlands, Bayer AG, Leverkusen, Germany, Bayer CropScience AG, Report No.: RA-2069/95, Edition Number: M-000953-01-1, Date: 12.03.1997, GLP, unpublished
THIA06-105, Placke, F. J., 1997r, Determination of residues of YRC 2894 480 SC following spray application in the field on peppers in Spain, France and Italy, Bayer AG, Leverkusen, Germany, Bayer CropScience AG, Report No.: RA-2119/96, Edition Number: M-000947-01-1, Date: 10.11.1997, GLP,
THIA06-106, Placke, F. J., 1997s, Determination of residues of YRC 2894 480 SC following spray application in the Greenhouse on Peppers in Spain an France, Bayer AG, Leverkusen, Germany, Bayer CropScience AG, Report No.: RA-2120/96, Edition Number: M-000940-01-1, Date: 10.11.1997, GLP, un
THIA06-128, Placke, F. J., 1997t, Determination of residues of YRC 2894 480 SC following spray application on apple (fruit, juice, pomace, sauce, fruit washed, fruit dried) in Italy, Bayer AG, Leverkusen, Germany, Bayer CropScience AG, Report No.: RA-3063/95, Edition Number: M-000975-01-1
THIA06-129, Placke, F. J., 1997u, Determination of residues of YRC 2894 480 SC following spray application on apple (fruit, juice, pomace, sauce, washed, fruit, dried) in the Federal Republic of Germany, Bayer AG, Leverkusen, Germany, Bayer CropScience AG, Report No.: RA-3062/95, Edition
THIA06-130, Placke, F. J., 1997v, Determination of residues of YRC 2894 480 SC following spray application on peach (fruit, fruit washed, preserve) in Italy, Bayer AG, Leverkusen, Germany, Bayer CropScience AG, Report No.: RA-3064/95, Edition Number: M-000983-01-1, Date: 12.11.1997, GLP,
THIA06-131, Placke, F. J., 1997w, Determination of residues of YRC 2894 480 SC following spray application in the filed on peach (fruit, fruit washed, preserve) in Italy and Spain, Bayer AG, Leverkusen, Germany, Bayer CropScience AG, Report No.: RA-3121/96, Edition Number: M-000981-01-1,

1142 Thiacloprid
THIA06-133, Placke, F. J., 1997x, Determination of residues of YRC 2894 480 SC following spray application on tomato (fruit, juice, paste, preserve, fruit washed, fruit peeled) in Spain and the Federal Republic of Germany, Bayer AG, Leverkusen, Germany, Bayer CropScience AG, Report No.: R
THIA06-015, Placke, F. J., 1998, Amendment E001 of the residue analytical method 00419 for the determination of YRC 2894 residues in plant materials, Bayer AG, Leverkusen, Germany, Bayer CropScience AG, Report No.: 00419/E001, Edition Number: M-010852-01-1, Method Report No.: MR-414/98,
THIA06-017, Placke, F. J., 1998a, Residue analytical method for the determination of YRC 2894 residues in animal matrices by HPLC-UV, Bayer AG, Leverkusen, Germany, Bayer CropScience AG, Report No.: 00519, Edition Number: M-010862-01-1, Method Report No.: MR-337/98, Date: 22.04.1998, GLP
THIA06-134, Placke, F. J., 1998b, YRC 2894 - A 28 day dairy cattle feeding study, Bayer AG, Leverkusen, Germany, Bayer CropScience AG, Report No.: MR-369/98, Edition Number: M-002153-01-1, Date: 26.06.1998 GLP, unpublished
THIA06-127, Riegner, K., 1998, Aqueous hydrolysis of YRC 2894 under conditions of processing studies, Bayer AG, Leverkusen, Germany, Bayer CropScience AG, Report No.: PF4364, Edition Number: M-002136-01-1 Date: 29.05.1998, GLP, unpublished
THIA06-186, Schoening, R., 2004, Determination of Residues of Thiacloprid and Deltamethrin in/on Spring Wheat and Winter Wheat Following Spray Application of Proteus 110 OD in the Field in Germany and Northern France, Bayer CropScience AG, Report No.: RA-2177/02, Edition Number: MO-04-010525, Date: 06.10.2004, GLP, unpublished
THIA06-019, Schoening, R., 1998, Residue analytical method 00548 for the determination of residues of YRC 2894 in/on plant materials by HPLC with Electrospray and MS/MS - detection, Bayer AG, Leverkusen, Germany, Bayer CropScience AG, Report No.: 00548, Edition Number: M-010883-01-1, Met
THIA06-040, Schoening, R., 1998a, Residue analytical method for the determination of YRC 2894 residues in animal material by LC-MS/MS, Bayer AG, Leverkusen, Germany, Bayer CropScience AG, Report No.: 00490, Edition Number: M-010868-01-1, Method Report No.: MR-354/98, Date: 13.05.1998, GL
THIA06-041, Schoening, R., 1998b, Residue analytical method for the determination of YRC 2894 total residues in animal material by GC-MSD, Bayer AG, Leverkusen, Germany, Bayer CropScience AG, Report No.: 00491, Edition Number: M-010877-01-1, Method Report No.: MR-374/98, Date: 18.06.1998,
THIA06-028, Schoening, R., 1999, Residue analytical method 00588 for the determination of YRC 2894 total residue in plant matrices, Bayer AG, Leverkusen, Germany, Bayer CropScience AG, Report No.: 00588, Edition Number: M-023878-01-1, Method Report No.: MR-339/99, Date: 03.12.1999, GLP,
THIA06-066, Schoening, R., 1999a, Determination of residues of YRC 2894 480 SC following spray application in the field on sweet and sour cherry in Germany, Benelux and France, Bayer AG, Leverkusen, Germany, Bayer CropScience AG, Report No.: RA-2070/98, Edition Number: M-010700-01-1, Date
THIA06-069, Schoening, R., 1999b, Determination of residues of YRC 2894 480 SC following spray application in the field on sweet cherry in Italy, Bayer AG, Leverkusen, Germany, Bayer CropScience AG, Report No.: RA-2071/98, Edition Number: M-010673-01-1, Date: 03.05.1999, GLP, unpublished
THIA06-101, Schoening, R., 1999c, Determination of residues of YRC 2894 480 SC following drip irrigation in the greenhouse on pepper and tomato in Benelux, Bayer AG, Leverkusen, Germany, Bayer CropScience AG, Report No.: RA-2072/98, Edition Number: M-019570-01-1, Date: 02.11.1999, GLP, u
THIA06-043, Schoening, R., 2000, Storage stability of YRC 2894 residues in crops during freezer storage, Bayer AG, Leverkusen, Germany, Bayer CropScience AG, Report No.: MR-114/00, Edition Number: M-026241-01-1 Date: 15.11.2000, GLP, unpublished
THIA06-079, Schoening, R., 2000a, Determination of residues of YRC 2894 480 SC (A. S. Thiacloprid) in/on strawberry in the field in Germany, France and Great Britain, Bayer AG, Leverkusen, Germany, Bayer CropScience AG, Report No.: RA-2006/99, Edition Number: M-029242-01-1, Date: 28.03.20
THIA06-089, Schoening, R., 2000a, Determination of residues of YRC 2894 480 SC (a.s. thiacloprid) in/on cucumber in the greenhouse in Germany, Netherlands and Belgium, Bayer AG, Leverkusen, Germany, Bayer CropScience AG, Report No.: RA-2134/99, Edition Number: M-043880-01-1, Date: 03.08.2
THIA06-102, Schoening, R., 2000b, Determination of residues of YRC 2894 (480 SC, A.S. Thiacloprid) in/on pepper and tomato in the greenhouse in Netherlands and Belgium, Bayer AG, Leverkusen, Germany Bayer CropScience AG, Report No.: RA-2072/99, Edition Number: M-039214-01-1, Date: 28.06.2
THIA06-107, Schoening, R., 2000c, Determination of residues of YRC 2894 (480 SC) following spray application in the field on potato in Germany and North France, Bayer AG, Leverkusen, Germany, Bayer CropScience AG, Report No.: RA-2150/97, Edition Number: M-022813-01-1, Date: 01.02.2000, GL
THIA06-108, Schoening, R., 2000d, Determination of residues of YRC 2894 480 SC (A.S. YRC 2894) on potato following spray application in the field in Germany, Great Britain, France and Belgium, Bayer AG, Leverkusen, Germany, Bayer CropScience AG, Report No.: RA-2068/98, Edition Number: M-0

Thiacloprid 1143
THIA06-109, Schoening, R., 2000e, Determination of residues of YRC 2894 (480 SC) following spray application in the field on potato in Spain and Italy, Bayer AG, Leverkusen, Germany, Bayer CropScience AG, Report No.: RA-2151/97, Edition Number: M-022617-01-1, Date: 01.02.2000, GLP, unpubl
THIA06-110, Schoening, R., 2000f, Determination of residues of YRC 2894 (480 SC) on potato in the field in Spain, Italy and France, Bayer AG, Leverkusen, Germany, Bayer CropScience AG, Report No.: RA-2069/98, Edition Number: M-023572-01-1, Date: 10.02.2000, GLP, unpublished
THIA06-023, Schoening, R., 2001, Supplement E002 of the residue analytical method 00548 for the determination of residues of YRC 2894 in plant materials by HPLC with electrospray MS/MS-detection, Bayer AG, Leverkusen, Germany, Bayer CropScience AG, Report No.: 00548/E002, Edition Number:
THIA06-051, Schoening, R., 2001a, Determination of residues of YRC 2894 480 SC following spray application in the field on apple in France (North), Bayer AG, Leverkusen, Germany, Bayer CropScience AG, Report No.: RA-2111/00, Edition Number: M-080245-01-1, Date: 23.10.2001, GLP, unpublish
THIA06-054, Schoening, R., 2001b, Determination of residues of YRC 2894 480 SC following spray application in the field on apple in France (South), Bayer AG, Leverkusen, Germany, Bayer CropScience AG, Report No.: RA-2112/00, Edition Number: M-075119-01-1, Date: 27.09.2001, GLP, unpublishe
THIA06-063, Schoening, R., 2001c, Determination of residues of YRC 2894 480 SC following spray application in the field on peach in France (South), Bayer AG, Leverkusen, Germany, Bayer CropScience AG, Report No.: RA-2113/00, Edition Number: M-077085-01-1, Date: 01.10.2001, GLP, unpublishe
THIA06-073, Schoening, R., 2001d, Determination of residues of YRC 2894 on plum after spray application of YRC 2894 480 SC in the field in Germany and France (North), Bayer AG, Leverkusen, Germany, Bayer CropScience AG, Report No.: RA-2126/00, Edition Number: M-089903-01-1, Date: 17.12.20
THIA06-115, Schoening, R., 2001e, Determination of residues of YRC 2894 on barley after spray application of YRC 2894 480 SC in the field in France (south), Bayer AG, Leverkusen, Germany, Bayer CropScience AG, Report No.: RA-2123/00, Edition Number: M-089143-01-1, Date: 11.12.2001, GLP, u
THIA06-024, Schoening, R., 2002, Supplement E003 of the residue analytical method 00548 for the determination of residues of YRC 2894 in plant materials by HPLC with electrospray MS/MS-detection, Bayer AG, Leverkusen, Germany, Bayer CropScience AG, Report No.: 00548/E003, Edition Number:
THIA06-074, Schoening, R., 2002a, Determination of residues of YRC 2894 480 SC (A.S. YRC 2894) in/on plum following spray application in the field in Germany, Bayer CropScience AG, Report No.: RA-2120/01, Edition Number: M-073425-01-1, Date: 05.12.2002, GLP, unpublished
THIA06-075, Schoening, R., 2002b, Determination of residues of YRC 2894 480 SC (A.S. YRC 2894) in/on plum following spray application in the field in France (South), Bayer CropScience AG, Report No.: RA-2121/01, Edition Number: M-073458-01-1, Date: 05.12.2002, GLP, unpublished
THIA06-076, Schoening, R., 2002c, Determination of residues of YRC 2894 on plum after spray application of YRC 2894 80 SC in the field in Spain and France, Bayer AG, Leverkusen, Germany, Bayer CropScience AG, Report No.: RA-2127/00, Edition Number: M-035900-01-1, Date: 12.02.2002, GLP,
THIA06-082, Schoening, R., 2002d, Determination of residues of YRC 2894 (480 SC) in/on red currant and black currant following spray application in the field in Belgium, Great Britain and Germany, Bayer AG, Leverkusen, Germany, Bayer CropScience AG, Report No.: RA-2111/01, Edition Number:
THIA06-119, Schoening, R., 2002e, Determination of residues of YRC 2894 (240 OS) in/on winter rape following spray application in the field in France (North) and Germany, Bayer AG, Leverkusen, Germany, Bayer CropScience AG, Report No.: RA-2171/01, Edition Number: M-053894-01-1, Date: 22.0
THIA06-121, Schoening, R., 2002f, Determination of residues of YRC 2894 (240 OS) in/on winter rape following spray application in the field in Spain and Southern France, Bayer AG, Leverkusen, Germany, Bayer CropScience AG, Report No.: RA-2172/01, Edition Number: M-053924-01-1, Date: 28.03
THIA06-187, Schoening, R., 2004a, Determination of Residues of YRC 2894 and Deltamethrin in/on Spring Wheat and Winter Wheat Following Spray Application of Proteus 110 OD in the Field in Germany and Northern France, Bayer CropScience AG, Report No.: RA-2178/02, Edition Number: MO-04-010536, Date: 06.10.2004, GLP, unpublished
THIA06-020, Schoening, R., 2005, Determination of residues of thiacloprid after application of Calypso (480 SC) in/on onion in Germany, Bayer CropScience AG, Report No.: MR-068/05, Edition Number: M-252576-01-1, Date: 06.06.2005, Non GLP, unpublished
THIA06-021, Schoening, R., 2005a, Determination of residues of thiacloprid after application of Calypso (480 SC) in/on leek in Germany, Bayer CropScience AG, Report No.: MR-185/04, Edition Number: M-252578-01-1, Date: 06.06.2005, Non GLP, unpublished
THIA06-044, Schoening, R., 2005a, Storage stability of YRC 2894 in/on potato (tuber), tobacco (leaf, dry), wheat (straw), rape (seed), pea (pea with pod) and currant (fruit) for 24 months, Bayer CropScience AG, Report No.: MR-073/03, Edition Number: M-252414-01-1, Date: 01.06.2005, GLP, u

1144 Thiacloprid
THIA06-090, Schoening, R., 2005a, Determination of residues of Thiacloprid after application of Calypso (480 SC) in/on cucumber in Germany, Bayer CropScience AG, Report No.: MR-067/05, Edition Number: M-252962-01-1 Date: 17.06.2005, GLP, unpublished
THIA06-078, Schoening, R. and Nuesslein, F., 2001, Determination of residues of YRC 2894 480 SC following spray application in the field on strawberry in Belgium, France (North), Great Britain and Germany, Bayer AG, Leverkusen, Germany, Bayer CropScience AG, Report No.: RA-2053/00, Edition Number: M-04205
THIA06-081, Schoening, R. and Nuesslein, F., 2001a, Determination of residues of YRC 2894 on red and black currant following spray application of YRC 2894 480 SC in the field in Belgium, Great Britain and Germany, Bayer AG, Leverkusen, Germany, Bayer CropScience AG, Report No.: RA-2054/00, Edition Number:
THIA06-096, Schoening, R. and Nuesslein, F., 2001b, Determination of residues of YRC 2894 on melon following spray application of YRC 2894 480 SC in the field in France (South), Bayer AG, Leverkusen, Germany, Bayer CropScience AG, Report No.: RA-2115/00, Edition Number: M-087877-01-1, Date: 03.12.2001, GLP
THIA06-067, Schoening, R. and Sur, R., 2000, Determination of residues of YRC 2894 480 SC in/on sour cherry in the field following spray application in Germany, Bayer AG, Leverkusen, Germany, Bayer CropScience AG, Report No.: RA-2070/99, Edition Number: M-023995-01-1, Date: 15.02.2000, GLP, unpublis
THIA06-123, Schoening, R. and Sur, R., 2000a, Determination of residues of YRC 2894 (480 SC) on cotton after spray application in the field in Spain and Greece, Bayer AG, Leverkusen, Germany, Bayer CropScience AG, Report No.: RA-2115/97, Edition Number: M-021336-01-1, Date: 02.02.2000, GLP, unpublish
THIA06-124, Schoening, R. and Sur, R., 2000b, Determination of residues of YRC 2894 in/on cotton after three spray applications of YRC 2894 480 SC in the field in Spain and Greece, Bayer AG, Leverkusen, Germany, Bayer CropScience AG, Report No.: RA-2073/98, Edition Number: M-024052-01-1, Date: 22.02.
THIA06-132, Schoening, R. and Sur, R., 2000c, Determination of residues of YRC 2894 480 SC in/on sour cherry in the field following spray application in Germany (fruit, fruit-washed, fruit-stoned, preserve, washing water), Bayer AG, Leverkusen, Germany, Bayer CropScience AG, Report No.: RA-3070/99, E
THIA06-113, Schoening, R. and Sur, R., 2001, Determination of residues of YRC 2894 in/on winter wheat after spray application of YRC 2894 480 SC in France (South), Bayer AG, Leverkusen, Germany, Bayer CropScience AG, Report No.: RA-2121/00, Edition Number: M-090057-01-1, Date: 17.12.2001, GLP, unpub
THIA06-022, Sur, R., 2000, Supplement E001 to residue method 00548 for the determination of the insecticide YRC 2894 (thiaclopride) in/on strawberry and tomato including processed products, Bayer AG, Leverkusen, Germany, Bayer CropScience AG, Report No.: 00548/E001, Edition Number
THIA06-059, Tancred, S., 1999, Determination of thiacloprid residues in apple fruit following ten application of YRC 2894 480 SC as dilute sprays, Bayer Australia Ltd., Pymble, Australia, Bayer CropScience AG, Report No.: EMH453/99, Edition Number: M-037947-02-1, Date: 13.10.1999, Amen
THIA06-062, Tancred, S., 2001, Contract trail to determine thiacloprid residues in pear fruit following four early, four late or eight total applications of YRC 2894 480 SC, applied as dilute sprays to Packham pears Bayer Australia Ltd., Pymble, Australia, Bayer CropScience AG, Report
THIA06-016, Weber, H., 1998, Independent laboratory validation (ILV) of Bayer methods 00419 and 00419/E001 for the determination of the residues of YRC 2894 in plant material, Dr. Specht & Partner, Chemische Laboratorien GmbH, Hamburg, Germany, Bayer CropScience AG, Report No.: BAY-9
THIA06-018, Weber, H., 1998a, Independent laboratory validation (ILV) of BAYER method 00519 for the determination of the residues of YRC 2894 in animal matrices, Dr. Specht & Partner, Chemische Laboratorien GmbH, Hamburg, Germany, Bayer CropScience AG, Report No.: BAY-9802V, Edition N
THIA06-005, Weber, H.; Printz, H.and Klempner, A., 1998, [Methylene-14C]YRC 2894 Absorption, distribution, excretion and metabolism in laying hens, Bayer AG, Leverkusen, Germany, Bayer CropScience AG, Report No.: PF4347, Edition Number: M-002160-02-1, Date: 1998-06-26, Amended: 1999-03-15, GLP, unpublished
THIA06-014, Zyl, P. F. C. Van, 2000, Determination of thiachloprid residues in citrus, South African Bureau of Standards, Pretoria, South Africa, Bayer CropScience AG, Report No.: 5438/1494225/T423, Edition Number: M-048686-02-1, Date: 15.09.2000, Amended: 20.10.2000, Non GLP, unpublished
THIA06-048, Zyl, P. F. C. van, 2000a, Determination of thiachloprid residues in citrus, South African Bureau of Standards, Pretoria, South Africa, Bayer CropScience AG, Report No.: 5438/1494225/T423, Report includes Trial Nos.: SAF-00-00914, Edition Number: M-048686-02-1, Date: 15.09.2000, Am
THIA06-056, Zyl, P. F. C. Van, 2000b, Determination of thiachloprid residues in apples, South African Bureau of Standards, Pretoria, South Africa, Bayer CropScience AG, Report No.: 5438/1493281/T392, Edition Number: M-038463-01-1, Date: 30.08.2000, Non GLP, unpublished
THIA06-057, Zyl, P. F. C. Van, 2000c, Determination of thiachloprid residues in apples, South African Bureau of Standards, Pretoria, South Africa, Bayer CropScience AG, Report No.: 5438/1493257/T389, Edition Number: M-038487-01-1, Date: 30.08.2000, Non GLP, unpublished

Thiacloprid 1145
THIA06-060, Zyl, P. F. C. Van, 2000d, Determination of thiachloprid residues in pears, South African Bureau of Standards, Pretoria, South Africa, Bayer CropScience AG, Report No.: 5438/1502352/T465, Edition Number: M-038574-01-1, Date: 19.09.2000, Non GLP, unpublished
THIA06-061, Zyl, P. F. C. Van, 2000e, Determination of thiachloprid residues in pears, South African Bureau of Standards, Pretoria, South Africa, Bayer CropScience AG, Report No.: 5438/1502361/T466, Edition Number: M-038630-01-1, Date: 15.09.2000, Non GLP, unpublished
CROSS REFERENCESAuthor Code Year Anderson, C.; Weber, H. and Bornatsch, W. THIA06-004 1998 Anon. THIA06-164 1996 Anon. THIA06-135 1997 Anon. THIA06-140 2001 Anon. THIA06-139 2003 Anon. THIA06-165 1996a Anon. THIA06-166 1996b Anon. THIA06-167 1996c Anon. THIA06-172 1996d Anon. THIA06-173 1996e Anon. THIA06-174 1996f Anon. THIA06-175 1996g Anon. THIA06-136 1997a Anon. THIA06-179 1997aa Anon. THIA06-180 1997ab Anon. THIA06-181 1997ac Anon. THIA06-182 1997ad Anon. THIA06-183 1997ae Anon. THIA06-137 1997b Anon. THIA06-138 1997c Anon. THIA06-148 1997d Anon. THIA06-149 1997e Anon. THIA06-150 1997f Anon. THIA06-151 1997g Anon. THIA06-152 1997h Anon. THIA06-153 1997i Anon. THIA06-154 1997j Anon. THIA06-155 1997k Anon. THIA06-156 1997l Anon. THIA06-157 1997m Anon. THIA06-158 1997n Anon. THIA06-159 1997o Anon. THIA06-160 1997p Anon. THIA06-161 1997q Anon. THIA06-162 1997r Anon. THIA06-163 1997s Anon. THIA06-168 1997t Anon. THIA06-169 1997u Anon. THIA06-170 1997v Anon. THIA06-171 1997w Anon. THIA06-176 1997x Anon. THIA06-177 1997y Anon. THIA06-178 1997z Anon. THIA06-141 2001a Anon. THIA06-146 2001a Anon. THIA06-147 2001b Anon. THIA06-038 2002 Anon. THIA06-142 2002a Anon. THIA06-143 2002b Anon. THIA06-144 2002c

1146 Thiacloprid
Author Code Year Anon. THIA06-145 2002d Anon. THIA06-184 2002f Anon. THIA06-185 2002g Babczinski, P. THIA06-007 1997 Babczinski, P. THIA06-029 1997a Babczinski, P. THIA06-009 1998 Ballesteros, C. and Meilland - Berthier, I. THIA06-026 2004 Ballesteros, C. and Meilland - Berthier, I. THIA06-027 2005 Baravelli, P. L. THIA06-039 2003 Billian, P. and Schoening, R. THIA06-025 2003 Billian, P. and Schoening, R. THIA06-068 2003 Billian, P. and Schoening, R. THIA06-072 2003a Billian, P. and Schoening, R. THIA06-080 2003b Billian, P. and Schoening, R. THIA06-084 2003c Billian, P. and Schoening, R. THIA06-120 2003d Billian, P. and Schoening, R. THIA06-122 2003e Bongartz, R. and Neumann, B. THIA06-010 2001 Brumhard, B. THIA06-003 1998 Clark, T. and Babczinski, P. THIA06-012 1998 Clark, T. and Bornatsch, W. THIA06-006 1997 Clay, S. THIA06-047 2002 Clay, S. THIA06-036 2003 Clay, S. THIA06-085 2003a Clay, S. THIA06-086 2004 DeHaan, R. A. THIA06-030 1999 Diot, R. THIA06-116 2005 Diot, R. THIA06-117 2005a Dorschner, K. W. THIA06-071 2002 Dorschner, K. W. THIA06-077 2002a Eberhardt, R. and Schoening, R. THIA06-112 2001 Eberhardt, R. and Schoening, R. THIA06-114 2002 Fukuda, T. THIA06-037 1998 Garbers, H. V. THIA06-058 2000 Goehrt, A. THIA06-002 1995 Harbin, A. M. THIA06-055 1999 Harbin, A. M. THIA06-033 2004 Heinemann, O. and Schoening, R. THIA06-070 2000 Heinemann, O. and Schoening, R. THIA06-083 2002 Hellpointner, E. THIA06-011 1998b Koch, A. THIA06-125 1999 Koester, J. THIA06-008 1997 Krohn, J. THIA06-001 1996 Lancas, F. M. THIA06-045 1998 Lancas, F. M. THIA06-046 1998a Lancas, F. M. THIA06-087 1998b Lancas, F. M. THIA06-088 1998c Lancas, F. M. THIA06-111 1998d Moore, S. M. THIA06-032 2002 Orosz, F. THIA06-034 2000 Orosz, F. THIA06-035 2000a Orosz, F. THIA06-118 2000b Orosz, F. THIA06-126 2000c Perez, R. THIA06-031 1999 Placke, F. J. THIA06-013 1996 Placke, F. J. THIA06-042 1997 Placke, F. J. THIA06-049 1997a Placke, F. J. THIA06-050 1997b Placke, F. J. THIA06-052 1997c Placke, F. J. THIA06-053 1997d Placke, F. J. THIA06-064 1997e Placke, F. J. THIA06-065 1997f
Thiacloprid 1147
Author Code Year Placke, F. J. THIA06-091 1997g Placke, F. J. THIA06-092 1997h Placke, F. J. THIA06-093 1997i Placke, F. J. THIA06-094 1997j Placke, F. J. THIA06-095 1997k Placke, F. J. THIA06-097 1997l Placke, F. J. THIA06-098 1997m Placke, F. J. THIA06-099 1997n Placke, F. J. THIA06-100 1997o Placke, F. J. THIA06-103 1997p Placke, F. J. THIA06-104 1997q Placke, F. J. THIA06-105 1997r Placke, F. J. THIA06-106 1997s Placke, F. J. THIA06-128 1997t Placke, F. J. THIA06-129 1997u Placke, F. J. THIA06-130 1997v Placke, F. J. THIA06-131 1997w Placke, F. J. THIA06-133 1997x Placke, F. J. THIA06-015 1998 Placke, F. J. THIA06-017 1998a Placke, F. J. THIA06-134 1998b Riegner, K. THIA06-127 1998 Schoening, R. THIA06-186 2004 Schoening, R. THIA06-019 1998 Schoening, R. THIA06-040 1998a Schoening, R. THIA06-041 1998b Schoening, R. THIA06-028 1999 Schoening, R. THIA06-066 1999a Schoening, R. THIA06-069 1999b Schoening, R. THIA06-101 1999c Schoening, R. THIA06-043 2000 Schoening, R. THIA06-079 2000a Schoening, R. THIA06-089 2000a Schoening, R. THIA06-102 2000b Schoening, R. THIA06-107 2000c Schoening, R. THIA06-108 2000d Schoening, R. THIA06-109 2000e Schoening, R. THIA06-110 2000f Schoening, R. THIA06-023 2001 Schoening, R. THIA06-051 2001a Schoening, R. THIA06-054 2001b Schoening, R. THIA06-063 2001c Schoening, R. THIA06-073 2001d Schoening, R. THIA06-115 2001e Schoening, R. THIA06-024 2002 Schoening, R. THIA06-074 2002a Schoening, R. THIA06-075 2002b Schoening, R. THIA06-076 2002c Schoening, R. THIA06-082 2002d Schoening, R. THIA06-119 2002e Schoening, R. THIA06-121 2002f Schoening, R. THIA06-187 2004a Schoening, R. THIA06-020 2005 Schoening, R. THIA06-021 2005a Schoening, R. THIA06-044 2005a Schoening, R. THIA06-090 2005a Schoening, R. and Nuesslein, F. THIA06-078 2001 Schoening, R. and Nuesslein, F. THIA06-081 2001a Schoening, R. and Nuesslein, F. THIA06-096 2001b Schoening, R. and Sur, R. THIA06-067 2000 Schoening, R. and Sur, R. THIA06-123 2000a
1148 Thiacloprid
Author Code Year Schoening, R. and Sur, R. THIA06-124 2000b Schoening, R. and Sur, R. THIA06-132 2000c Schoening, R. and Sur, R. THIA06-113 2001 Sur, R. THIA06-022 2000 Tancred, S. THIA06-059 1999 Tancred, S. THIA06-062 2001 Weber, H. THIA06-016 1998 Weber, H. THIA06-018 1998a Weber, H.; Printz, H.and Klempner, A. THIA06-005 1998 Zyl, P. F. C. Van THIA06-014 2000 Zyl, P. F. C. van THIA06-048 2000a Zyl, P. F. C. Van THIA06-056 2000b Zyl, P. F. C. Van THIA06-057 2000c Zyl, P. F. C. Van THIA06-060 2000d Zyl, P. F. C. Van THIA06-061 2000e