thesis draft final 7-8-19
TRANSCRIPT
ABSTRACT
WEDEGAERTNER, OLIVIA ANN. Handling Characteristic Evaluation and Broiler Growth and Production Trait Effects of Free and Lipid Matrix Encapsulated Vitamin and Trace Mineral Premixes. (Under the direction of Dr. Peter R. Ferket).
Good handling characteristics of feedstuffs and feed ingredients are essential for the
efficiency of animal feed manufacturing. Often animal feed additive and premix manufacturers
are concerned with the stability and efficacy of their products as well as cost of manufacture and
sale price and therefore the handling characteristics tend to suffer, causing problems at the feed
mill. The ability of feed ingredients to change physically or chemically when exposed to
moisture, heat or pressure determines how well they flow through a bin and disperse throughout
the feed. Free vitamin and mineral premixes are commonly mixed with a carrier to improve
handling and storage properties and form commercial ‘standard’ vitamin and mineral premixes,
but these premixes are still known to be dusty, electrostatic, hygroscopic, and chemically
reactive. Microencapsulation or spray drying are technologies used to improve the stability and
handling characteristics of feed additives.
The first chapter discusses the importance of common handling characteristics, ways of
determining and evaluating handling properties and techniques for feed additive manufacturing.
The procedures included in the review can be used as a reference for evaluating the relative
handling characteristics of various feed ingredients. No solution guarantees perfect results for
stability, efficacy or handling properties but microencapsulation has been shown to be an
effective and efficient solution. Encapsulation techniques related specifically to the animal feed
industry include spray drying, spray chilling and spray cooling.
The second chapter tests the hypothesis that lipid matrix encapsulation of free vitamin
and trace mineral premixes will significantly improves their handling characteristics, making

them more desirable products for feed mills. Triplicate samples of free, standard and lipid matrix
encapsulated vitamin and mineral premixes were evaluated for the following handling
characteristics: particle size (Dgw), particle size variability (Sgw), flowability (measured by
angle of repose and minimum orifice diameter), lumping, compressibility, bulk and tapped
density, solubility and hygroscopic percent change in weight (day 0-1, 0-2, 0-3, 3-5, 0-5, 5-6, 5-
7, 5-8, 5-9, 0-9)). Lipid matrix encapsulation improved handling characteristics of vitamin and
mineral premixes by significantly increasing the average particle size (dgw), by reducing the
angle of repose and minimum orifice diameter measurements, resulting in improved flowability,
by reducing the percent compressibility (calculated with the bulk and tapped densities) and
improving storage properties, and by reducing the amount of moisture uptake and loss which
improved hygroscopic characteristics. The benefits gained from lipid matrix encapsulation
technology will not only improve the stability of vitamin and mineral premixes and other feed
additives, but also improves the handling characteristics of animal feed additives.
The third chapter reports on a study of reduced dietary inclusion levels of free and lipid
matrix encapsulated VM premixes on production traits and enteric health of broiler chickens.
Two 2 X 2 factorial designed experiments were conducted in which free or lipid matrix
encapsulated VM premixes were included at 100% of Aviagen recommended levels or at 60% or
70% reduced levels in trials 1 and 2, respectively and combinations thereof. Lipid matrix
encapsulated VM premixes improved growth performance, enteric health, and market value of
poultry products, regardless of dietary level. Encapsulation also remediated the risk of lower
dietary VM premix inclusion levels that would otherwise be infeasible as free premix forms.

© Copyright 2019 by Olivia Ann Wedegaertner
All Rights Reserved
Handling Characteristic Evaluation and Broiler Growth and Production Trait Effects of Free and Lipid Matrix Encapsulated Vitamin and Trace Mineral Premixes.
by Olivia Ann Wedegaertner
A thesis submitted to the Graduate Faculty of North Carolina State University
in partial fulfillment of the requirements for the degree of
Master of Science
Nutrition
Raleigh, North Carolina
2019
APPROVED BY:
_______________________________ _______________________________
Dr. Peter R. Ferket Dr. Robert B. Beckstead Committee Chair
_______________________________ Dr. Adam C. Fahrenholz

ii
DEDICATION
To my grandparents, John and Dolores Loftus, and my late grandparents, Victor and
Jewell Wedegaertner, for your love and support and for emphasizing the value of education. To
my parents Tom and Mary Rose Wedegaertner for your encouraging motivation. And to my rock
through it all, Jesus Christ.

iii
BIOGRAPHY
Olivia Ann Wedegaertner, daughter of Thomas Calvin and Mary Rose Wedegaertner,
was born in Raleigh, North Carolina on September 9, 1994. She and her younger brother, Kurt
Tobin Wedegaertner, were raised in North Raleigh on a small ‘hobby farm’ with chickens, quail,
dogs, horses, fish, a cat and a couple pigs throughout her childhood. Since the time Olivia could
walk, her parents encouraged and supported her passion for and interest in animals.
Olivia attended Millbrook High School and was accepted into North Carolina State
University as a Statistics major but transitioned to an Animal Science major with a statistics
minor sophomore year. During college, Olivia got involved in the Animal Science Club at NC
State where she was heavily involved in outreach and volunteering at the NC State fair with the
Milk Booth. Through this club Olivia developed a passion for educating people about common
misconception pertaining to agriculture, specifically in animal production. Olivia also joined a
professional agricultural sorority, Sigma Alpha, where she learned about professionalism in the
agriculture industry and the importance of women leadership in agriculture and STEM fields.
Olivia graduated with a B.S. in Animal Science with minors in statistics and nutrition and
was hired as a full-time temporary feed mill operation technician at NC State University’s Feed
Mill Educational Unit. Here she learned how animal feed is manufactured and how different
processing methods affect nutritional quality of feed and feedstuffs and became interested in
perusing a graduate degree in poultry nutrition. She decided to work with Dr. Peter Ferket,
focusing on the handling characteristics of lipid matrix encapsulated vitamin and mineral
premixes as well as the effect of those premixes on production traits and the enteric health of
broiler chickens for her master’s degree. Olivia plans to continue working on encapsulation
related research in Dr. Ferket’s lab as a PhD student.

iv
ACKNOWLEDGMENTS
I would like to thank Dr. Peter Ferket for allowing me to pursue my master’s degree and
for being so supportive and helpful throughout all of it. I would especially like to thank Dr.
Ferket for giving me the opportunity and motivation to step outside my comfort zone and present
my research at multiple scientific meetings, the experience was invaluable. Thank you to Dr.
Ramon Malheiros for all of your assistance and guidance. Further thanks to Dr. Robert
Beckstead and Dr. Adam Fahrenholz for your supervision and for serving on my graduate
committee.
None of this research could have been done alone. I extend many thanks to all members of
the Beckstead and Livingston lab groups for your help, advice and critique. Also, thank you to
Dr. Kimberley Livingston for allowing me to sit in on your lab meetings, gain experience, and
for taking time to critique my presentations. A special thanks to those who helped in any way
with data collection or sample analysis for these JEFO projects including Ramon Malheiros,
Vera Moraes, Matthew Warren, Julie Angerman and Elle Chadwick. Thank you specifically, Elle
Chadwick, for everything that you did to make the bird trials happen. Thanks also go to JEFO
Nutrition, Inc. for their assistance and advice.
I would like to extend a special thank you to Kelly Grace Keen for being the absolute
perfect office-mate and genuine friend. Many, many thanks to my friends Daniel Adams,
Karlinton Flores, Carol Wu and Brittany Wall for your wonderful friendship, support, lunch
dates and comic relief. Thank you to Savanna Lohrey and Meredith Sokolowski for being my
support system outside of school.
Finally, I would like to thank my wonderful parents, brother and grandparents for always
and unconditionally supporting and encouraging me in everything I do.

v
TABLE OF CONTENTS
LIST OF TABLES ....................................................................................................................... vii
LIST OF FIGURES ...................................................................................................................... xi
LIST OF ABBREVIATIONS ...................................................................................................... xii
CHAPTER 1: Handling characteristic importance, problems and solutions: A review ....... 1
Introduction .................................................................................................................................... 2
Handling Characteristics ................................................................................................................ 5
Physical Properties ............................................................................................................... 5
Particle Size Distribution ........................................................................................... 5
Flowability ............................................................................................................... 10
Physical Effects of Storage ................................................................................................ 15
Lumping ................................................................................................................... 15
Compressibility ....................................................................................................... 17
Hydration Stability ............................................................................................................. 20
Solubility .................................................................................................................. 20
Hygroscopicity ......................................................................................................... 22
Encapsulation: An Effective Solution .......................................................................................... 24
General Stability ................................................................................................................ 24
Product Manufacturing and Micro Encapsulation Techniques .......................................... 25
Conclusion ........................................................................................................................ 29
References .................................................................................................................................... 31
CHAPTER 2: Physical property and handling characteristic evaluation of free,
standard and lipid matrix encapsulated vitamin and trace mineral premixes .................... 41
Abstract ........................................................................................................................................ 42
Introduction .................................................................................................................................. 44
Materials and Methods ................................................................................................................. 48
Material Preparation and Sample Analysis ...................................................................... 48
Physical Properties ................................................................................................ 48
Physical Impacts of Storage .................................................................................. 50
Hydration Stability ................................................................................................ 51

vi
Experimental Design ........................................................................................................ 51
Results and Discussion ................................................................................................................ 52
Physical Properties .......................................................................................................... 52
Physical Impacts of Storage ............................................................................................ 54
Hydration Stability .......................................................................................................... 57
Conclusions .................................................................................................................................. 60
References .................................................................................................................................... 61
CHAPTER 3: Economically important production traits and enteric health of
broilers fed free or lipid matrix encapsulated vitamin and/or trace mineral elements
at recommended and reduced levels ........................................................................................ 74
Abstract ........................................................................................................................................ 75
Introduction .................................................................................................................................. 77
Materials and Methods ................................................................................................................. 80
Experimental Design ........................................................................................................ 80
Statistical Analyses .......................................................................................................... 82
Results .......................................................................................................................................... 83
Trial 1 ............................................................................................................................... 83
Trial 2 .............................................................................................................................. 85
Discussion .................................................................................................................................... 89
Conclusion .................................................................................................................................. 95
References .................................................................................................................................... 97
CHAPTER 4: Conclusion ........................................................................................................ 120

vii
LIST OF TABLES
Chapter 1
Table 1 Sieve and sieve agitator arrangement for particle size distribution analysis ............ 36
Table 2 Angle of repose (AOR) conversion table ................................................................. 37
Table 3 Scoring description chart for animal feed ingredient, additive and premix
lumping test evaluation, BASF Handbook ............................................................... 38
Table 4 Scoring description chart for animal feed ingredient, additive and premix
compression test evaluation, BASF Handbook ........................................................ 39
Table 5 Scoring description chart for animal feed ingredient, additive and premix
hygroscopic evaluation, BASF Handbook ............................................................... 40
Chapter 2
Table 1 Vitamin sensitivity to common factors present during modern animal feed
manufacturing practices ............................................................................................ 64
Table 2 Nine premixes evaluated for their physical properties, effects of storage,
hydration stability and handling characteristics ....................................................... 65
Table 3 Sieve and sieve agitator arrangement for particle size distribution analysis ............ 66
Table 4 Scoring description chart for animal feed ingredient, additive and premix
lumping test evaluation ............................................................................................ 67
Table 5 Scoring description chart for animal feed ingredient, additive and premix
compression test evaluation ...................................................................................... 68
Table 6 Premix physical property results .............................................................................. 69
Table 7 Premix physical impacts of storage results .............................................................. 70
Table 8 Premix insoluble fraction results .............................................................................. 71

viii
Table 9 Premix hygroscopicity percent increase results ....................................................... 72
Table 10 Premix hygroscopicity percent decrease results ....................................................... 73
Chapter 3
Table 1 Combinations of vitamin and trace mineral supplementation levels associated
with each experimental treatment used in Trial 1 .................................................. 100
Table 2 Formulated experimental treatment diets fed to Ross 708 Broilers in Trial 1 ....... 101
Table 3 Dietary levels of vitamins and trace minerals supplemented as free or lipid
matrix encapsulated premixes in the experimental treatment diets and fed
to Ross 708 Broilers in Trial 1 ............................................................................... 102
Table 4 Combinations of vitamin and trace mineral supplementation levels associated
with each of the experimental treatments used in Trial 2 ....................................... 103
Table 5 Formulated experimental treatment diets fed to Ross 708 Broilers in Trial 2 ....... 104
Table 6 Dietary levels of vitamins and trace minerals supplemented as free or lipid
matrix encapsulated premixes in the experimental treatment diets and fed
to Ross 708 Broilers in Trial 2 ............................................................................... 105
Table 7 Effect of dietary level and form of vitamin and mineral premix
supplementation on pen body weight (kg) of Male Ross 708 boiler chickens
(Trial 1) ................................................................................................................... 106
Table 7.1 Effect of diet on individual body weight (kg) of Male Ross 708 boiler chickens
on day 28 (Trial 1) .................................................................................................. 106
Table 8 Effect of dietary level and form of vitamin and mineral premix
supplementation on % coefficient of variation (%CV) of body weight (kg)

ix
of Male Ross 708 boiler chickens (Trial 1) ............................................................ 107
Table 9 Effect of dietary level and form of vitamin and mineral premix
supplementation on jejunum mucosa histomorphometric analysis of Male
Ross 708 boiler chickens at 28 days of age (Trial 1) ............................................. 108
Table 10 Effect of dietary level and form of vitamin and mineral premix
supplementation on jejunum mucosa histomorphometric analysis of Male
Ross 708 boiler chickens at 42 days of age (Trial 1) ............................................. 109
Table 11 Effect of dietary level and form of vitamin and mineral premix
supplementation on ceca microbiota distribution of Male Ross 708 boiler
chickens at 42 days of age (Trial 1) ........................................................................ 110
Table 12 Effect of dietary level and form of vitamin and mineral premix
supplementation on feed intake (kg) of Male Ross 708 boiler chickens
(Trial 2) ................................................................................................................... 111
Table 13 Effect of dietary level and form of vitamin and mineral premix
supplementation on body weight (kg) of Male Ross 708 boiler chickens
(Trial 2) ................................................................................................................... 112
Table 14 Effect of dietary level and form of vitamin and mineral premix
supplementation on Feed Conversion Ratio (Feed/Gain, adjusted for mortality)
of Male Ross 708 boiler chickens (Trial 2) ............................................................ 113
Table 15 Effect of dietary level and form of vitamin and mineral premix
supplementation on carcass parts yield of Male Ross 708 boiler chickens at
42 days of age (Trial 2) .......................................................................................... 114
Table 16 Effect of dietary level and form of vitamin and mineral premix

x
supplementation on shank color of Male Ross 708 boiler chickens at 28 days
of age (Trial 2) ........................................................................................................ 115
Table 17 Effect of dietary level and form of vitamin and mineral premix
Supplementation on shank color of Male Ross 708 boiler chickens at 42 days
of age (Trial 2) ....................................................................................................... 116
Table 18 Effect of dietary level and form of vitamin and mineral premix
supplementation on breast meat color and myopathy (White stripping and
wooden breasts) of Male Ross 708 boiler chickens at 42 days of age (Trial 2) ..... 117
Table 18.1 Effect of dietary level and form of vitamin and mineral premix
supplementation on breast skin color of Male Ross 708 boiler chickens at 49
days of age (Trial 2) ............................................................................................... 117
Table 19 Effect of dietary level and form of vitamin and mineral premix
supplementation on breast meat drip loss percentage (standard bag method)
of Male Ross 708 boiler chickens at 42 days of age (Trial 2) ................................ 118
Table 20 Effect of dietary level and form of vitamin and mineral premix
supplementation on breast meat drip loss percentage (diaper method) of Male
Ross 708 boiler chickens at 42 days of age (Trial 2) ............................................. 119
Table 21 Effect of dietary treatment and drip loss analysis method on breast meat drip
loss percentage of Male Ross 708 boiler chickens at 49 days of age (Trial 2) ...... 119

xi
LIST OF FIGURES
Chapter 1
Figure 1.1 Depiction of negative result for minimum orifice diameter ..................................... 35
Figure 1.2 Depiction of positive result for minimum orifice diameter ...................................... 35
Chapter 2
Figure 1.1 Depiction of negative result for minimum orifice diameter ..................................... 63
Figure 1.2 Depiction of positive result for minimum orifice diameter ...................................... 63

xii
LIST OF ABBREVIATIONS
AOR angle of repose
oC degrees Celsius
cm centimeter
d day
dgw particle geometric diameter average (μm)
oF degrees Fahrenheit
FCR feed conversion ratio
g gram
kg kilogram
mL milliliter
mm millimeter
RH relative humidity
Sgw particle geometric standard deviation (particle size variation)
μm micrometer (micron)
VM vitamin and trace mineral

1
CHAPTER 1
Handling characteristic importance, problems and solutions: A review

2
INTRODUCTION
Automation and increased scale of operation in the feed industry in recent decades has led to
an increase in the number of premixes and feed additives being used in animal feed formulations.
These ingredients are included in the diet at small inclusion levels, but the nutrients in these
additives are often essential for optimal growth and development of production animals. Feed
additives and premixes usually have a small particle size and are known to be dusty, have poor
flow characteristics and in general be difficult to handle at the feed mill. The handling
characteristics of feed additives are not always high priority to companies formulating and
manufacturing these products because they are more concerned with the efficacy, stability and
cost of their products, rather than how compatible their products are with specific feed mill
equipment. Poor handling characteristics of the vitamin and mineral premixes, enzyme additives,
probiotics, prebiotics, and other low inclusion-level feed additives may cause feed manufacturing
process issues like bridging in bins, poor dispersibility in the feed and reduced labor time
(“BASF Vitamin Quality School Handbook,” 1994; Ganesan et al., 2008). Many properties of
feed ingredients can be used to estimate the relative handling characteristics of ingredients at a
feed mill, but for the purpose of this review, these properties are broken up into three categories:
the physical properties of feed ingredients, the physical effects of storage on feed ingredients,
and the hydration stability of feed ingredients. There is adequate data evaluating the effects and
importance of the physical properties of feed ingredients, but less research exists evaluating the
effects and importance of storage or hydration stability. The purpose of this review is to discuss
the importance of each category, tests and analyses to easily evaluate feed ingredients for their
relative handling properties and discuss common methods of processing and manufacturing feed
additives such as microencapsulation and spray drying.

3
The physical properties of feed ingredients include average particle size, particle size
distribution and flowability. Determining the particle size distribution of a feed ingredient is the
principal way to evaluate the average size of the particles (dgw) in microns, as well as how
variable (Sgw) those particles are in size. Feed additives designed for feed mills should have an
average particle size no less than 50 microns and no more than 1,200 microns and ideally have
little variability in particle size (Kalivoda et al., 2015). Flowability is an estimation of how well a
feed ingredient will flow through the equipment at a feed mill during animal feed manufacturing.
The two most common ways of determining the flowability of feed ingredients are by measuring
the angle of repose and the critical orifice diameter. The angle of repose is the maximum angle in
degrees at which a pile of ingredient retains its slope. The critical orifice diameter is the smallest
hole size that will allow an ingredient to flow from the bottom of a cylindrical bin (Train, 1958;
Kalivoda, 2016). Both of these measurements help estimate relative feed mill performance and
flow characteristics of various feed ingredients.
Storage and transport can have degrading effects on feed additives, premixes and other
ingredients. Bagged ingredients can be stacked on pallets and transported across the country or
stored in warehouses for months at a time. Bulk ingredients are transported in trucks to bins at
feed mills where they can stay for days, weeks or up to months at a time. This long-term storage
can have serious effects on the bioavailability of nutrients in those ingredients. The lumping test
and the compression test can be used to evaluate the effects of storage conditions on feed
ingredients. The lumping test evaluates the effect of high heat in a low moisture environment,
such as being stored in bags during hot weather, and rates the effects on a subjective scale. The
compression test evaluates the effect of pressure on the ingredient, such as being stacked in bags
on a pallet, and also rates the effects on a subjective scale (“BASF Vitamin Quality School

4
Handbook,” 1994). Percent compressibility of an ingredient can be determined by measuring the
initial (bulk) and final tapped densities, and can also be used as an estimation of flowability. The
change in compressibility, expressed as a percentage, can be calculated by finding the difference
between the bulk and tapped densities, dividing by the bulk density, and multiplying by 100. The
Carr’s Compressibility Index [ C = 100 * (1 – bulk / tapped) ] and Hausner Ratio [ H = (tapped /
bulk) ] can also be calculated and are commonly used to express the percent compressibility of
powders and feed additives (Abdullah and Geldart, 1999; Emery et al., 2009).
The stability of a feed ingredient when exposed to water or moisture can be used to evaluate
relative stability among feed ingredients. Simply measuring the reactivity of an ingredient with
water can help estimate the stability of an ingredient, specifically in regard to hydration stability,
or how resistant an ingredient is to degradation when exposed to moisture. Sophisticated
equipment, such as High Performance Liquid Chromatography (HPLC) and Gas
Chromatography (GC), can be used to determine the actual chemical stability of a feed
ingredient but this equipment is expensive and can be difficult to use. A very simple and
effective method of measuring hydration stability is to mix an ingredient in water and observe
how soluble the ingredient is in relation to other ingredients (“BASF Vitamin Quality School
Handbook,” 1994). The percent insoluble fraction of ingredients can also be determined and used
to compare the hydration stability of various additives and premixes. Hygroscopicity is defined
as the ability of a product or ingredient to react with moisture in the air by absorbing or releasing
water vapor. This is measured by placing the ingredient in a petri dish and exposing it to a high
humidity, high temperature environment for a certain period of time. The change in weight is
recorded after each day to determine the percent increase in weight. The samples can then be left
in ambient conditions for another period of time and weighed each day to determine the percent

5
decrease in weight. Knowing the hygroscopic properties of a feed ingredient is important
because hygroscopicity has a strong impact on flowability, dispersibility in the feed, lumping and
compressibility. Products that are highly hydroscopic, or readily absorb water vapor from the air,
do not store or transport well, do not handle well at feed mills, do not disperse in mash feed
effectively and have issues with nutrient degradation from chemical reactions involving water
(“BASF Vitamin Quality School Handbook,” 1994).
The handling characteristics and physical properties of animal feed additives, premixes and
ingredients can be overlooked by ingredient manufacturers, but they are essential to the efficient
operation of feed mills. This review discusses the importance of the handling characteristics
mentioned above, ways of determining and evaluating handling properties, and techniques for
feed additive manufacturing. The procedures included in this review can be used as a reference
for evaluating the relative handling characteristics of various feed ingredients.
HANDLING CHARACTERISTICS
Physical Properties
Particle Size Distribution
Importance. Particle size is an important part of the animal feed industry due to the
significant balance between chemical stability and dispersion of particles in the feed. The larger
the particles, the more stable the product is because as a whole it has a smaller surface area
exposed to chemical reactions. On the other hand, products with larger particles have less
particles per gram, and therefore do not distribute well in the feed. Ingredients with smaller
particle size tend to have increased dustiness, hygroscopicity, susceptibility to static charge,
lumping, and caking due to compression all which decrease flowability. Smaller particles also
expose a greater surface area to digestive enzymes and chemicals than larger particles, improve

6
mixing characteristics of some ingredients, and increase pelleting efficiency and pellet quality
therefore satisfying customer preference (Behnke, 1993; “BASF Vitamin Quality School
Handbook,” 1994). Nearly all ingredients in modern animal feed manufacturing are subjected to
particle size reduction either at the feed mill during feed manufacturing or prior to receipt.
It has been shown that sieving techniques work well for separating common agricultural
products in the 50 - 2000 micron size ranges that are either cubic or spherical in shape and that
sieving is an effective way of determining particle size distribution of feed ingredients (Pfost,
1976, [CSL STYLE ERROR: reference with no printed form.]; Behnke, 1993). The first
accepted method of expressing the particle size of feed ingredients was approved in the 1940s by
the American Society of Agricultural Engineers and was described as the “Method of
determining modulus of uniformity and modulus of fineness of ground feed”. The procedure
uses a set of sieves with different sizes to separate a one-pound sample of feed into eight size
categories (“BASF Vitamin Quality School Handbook,” 1994). Subsequently, the first standard
for estimating particle size was published in the 1959 Agricultural Engineers Yearbook as ASAE
R246.1 “Method of determining modulus of uniformity and modulus of fineness of ground
feed”. The ASAE R246.1 protocol determined particle size by using a 250-gram sample shaken
for 5 minutes with seven sieves of varying sizes (3/8, 4, 8, 14, 28, 48, and 100-mesh) and a pan.
After sieving, the material on each of the screens 3/8, 4, and 8 was designated as “coarse”,
material on screens 14 and 28 was designated as “medium” and material in the pan and on
screens 48 and 100 was designated as “fine”. The uniformity or size variability of the sample
was determined by finding the proportion of particles designated as coarse, medium, and fine.
The subsequent and current standard ASAE S319 “Methods of determining and expressing
fineness of feed materials by sieving” calculates the particle size of ingredients based on the

7
amount of material left on each sieve from a stack of sieves after a period of sieving time. The
equipment required for the current particle size analysis includes a scale, sieve shaker, sieves,
sieve cleaners and sieve agitators (optional). The sieve shaker most commonly used is a Tyler
Ro-Tap (Mentor, OH), which mechanically replicates the circular motion that occurs during hand
sieving, while simultaneously tapping the sieve stack to help the particles fall through the mesh
screens.
ASAE S319 “Methods of determining and expressing fineness of feed materials by sieving”
allows for several variations in the analysis including machine type, addition of sieve agitators,
the use of a dispersing agent and sieving time. Sieve agitators, such as leather rings, small sieve
brushes or small rubber balls, may be needed to break up agglomerates on finer sieves, less than
a U.S. Sieve No. 50. Dispersing agents could be helpful in sieving high fat or similar materials
and the ASAE S319 notes that a dispersing agent, if used, should be added at 0.5% (“S319.
Method of determining and expressing fineness of feed materials by sieving.,” 1969). These
suggestions are included in the current ASAE S319 method but a majority of the research
conducted over the last 30 years did not include the addition of the dispersing agent (Kalivoda,
2016). A recent study evaluated the sieving method by varying the type of sieve shaker, sieve
agitators, dispersing agent, and sieving time and determined that not using sieve agitators
resulted in the highest dgw and the lowest Sgw and a sieving time of 15 minutes resulted in the
lowest dgw and greatest Sgw, only when agitators and dispersion agents were used (Fahrenholz et
al., 2010). The Tyler Ro-Tap sieve shaker is most commonly used in the feed industry but, as the
ASAE standard states, a Retsch or other equivalent sieve shakers can also be used. Though both
sieve shakers involve particle flow through a sieve stack, it could be argued that particle motion
within the sieve stack is different between the two. This difference was proven in a study when
8
the use of the Ro-Tap yielded a dgw 93 microns greater than that from the Retsch. The Sgw varied
by 0.42, with the Retsch yielding the greater value (Fahrenholz et al., 2010). Other data suggest
that variations in the procedure such as sieve age, how the sieve shaker is mounted on the table
and the individual running the analysis can also substantially affect the results (Fahrenholz et al.,
2010). Another similar experiment determined that when using a dispersing agent, the dgw value
was consistently 80 microns lower than when a dispersing agent was not used (Diederich et al.,
2006). A more recent study concluded that the addition of a dispersing agent to particle size
analysis better estimated the dgw and Sgw than did the addition of sieve agitators (Stark and
Chewning, 2012).
Determining Particle Size. Particle size measurement is a useful and meaningful
technique to define the results of an operation, such as grinding, or to determine an ingredient or
product’s particle size distribution. The principle of the test is to determine the percent of a
sample passing through a stack of standard sieves with successively larger mesh numbers and
smaller sieve size in order to calculate the average particle size, variability in particle size and
number of particles per gram (Pfost and Headley, 1976). Particle size should be determined
according to the American Society of Agricultural and Biological Engineers ASAE S319
procedure. To evaluate the particle size distribution of a 100-gram sample, the sample is sieved
using a stainless-steel or brass sieve stack (14-sieves) optionally containing sieve agitators
(bristle sieve cleaners and rubber balls measuring 16 mm in diameter) further detailed in Table 1.
A dispersing agent (optional) is mixed with the sample and the sample is placed on the top sieve.
The sieve stack is then placed in the Ro-Tap or other sieve shaker machine and agitated for 10
minutes. Once completed, each sieve is individually weighed without the sieve agitator(s) to
obtain the weight of the sieve. The sieves are then cleaned and weighed again to determine the

9
weight of the sample retained in each sieve. As specified in the ASAE S319, the weight of the
dispersing agent should not be subtracted from the weight of the pan. Sieves should be cleaned
after each analysis with a vacuum or compressed air and a stiff bristle sieve cleaning brush.
Calculations for the average particle size in microns (dgw) are typically performed according to
the equations listed and described in ASAE standard S319. The variability (Sgw) can be
calculated according to the ASAE standard S319.2 or S319.4. The revised ASAE S319.4 used
microns as the unit of measurement for Sgw and the older ASAE S319.2 does not. It is under
debate in the feed milling industry which version is the most accurate one. A graphical
description of the sieving results is often adequate to define mean particle diameter and the
degree of uniformity (“BASF Vitam. Qual. Sch. Handb.,” 1994, “S319. Method of determining
and expressing fineness of feed materials by sieving.,” 1969).
The most common and efficient way to reduce the particle size of a feed ingredient is by
grinding with a hammer mill or roller mill. These pieces of equipment mechanically reduce the
particle size of feed ingredients like whole corn, wheat or soybean meal, but can also be used to
reduce the particle size of most any feed additive or ingredient to better utilize these products in
animal feed. Products and ingredients with a smaller particle size have a larger surface area
exposed to the environment and therefore a higher chance of chemical degradation during
processing and storage, but also potentially more bioavailability in the gut. Smaller particles
improve the ease of mixability and increase pelleting efficiency and pellet quality (in some
cases), but also tend to have poor handling characteristics like increased dustiness,
hygroscopicity, static charge ability, lumping, caking due to compression and decreased
flowability. Reduction in particle size often decreases the flowability of a given material due to
the increased surface area per unit mass. Increasing the particle size of a feed ingredient can be

10
more challenging because it involves combining particles and ingredients together while still
maintaining the efficacy of the product and avoiding chemical interactions. This can be achieved
through physically encapsulating the product in a larger structure or ingredient or through
processing techniques like microencapsulation or spray drying (“BASF Vitamin Quality School
Handbook,” 1994).
Flowability
Importance. Flow behavior is multifactorial and depends on many physical characteristics.
Flowability is a consequence of the combination of an ingredient’s physical properties,
environmental conditions, and the equipment used for handling, storing, and processing these
ingredients (Prescott and Barnum, 2000). Because of this, no single test can fully quantify an
ingredient’s flowability. Some of the factors that may act alone or in combination to affect the
flowability of bulk solids and powders include moisture content, humidity, temperature,
pressure, fat content, particle size, and the presence of flow agents (Ganesan et al., 2008). These
factors illustrate the complex nature of ingredient flowability comprising of both physical and
chemical properties of the feed ingredient in addition to mechanical or engineering components
such as bin and hopper design. Good flowability is one of the most important physical properties
of a feed ingredient and is essential for reducing labor and improving accuracy and throughput at
feed mills. The flowability of human pharmaceuticals and bulk grains has been studied in detail
but little research has been done related to the flow characteristics of animal feed additives and
premixes. Good flowability is essential for an accurate metering of ingredients from bins and
augers, micro-ingredient metering machines and for accurate distribution of ingredients in
premixes and feeds. Poor flowability also leads to ingredients caking in bins, augers and mixers
leading to poor finished product quality, the potential for chemical degradation or bacterial

11
growth and increased downtime to clean the system. From a biosecurity and health standpoint,
ingredients caking, lumping and sticking to feed mill equipment can become a safety issue for
feed mill employees as well as the animals consuming the feed. Ingredients with small particle
size, high hygroscopicity or electroactivity reduce flowability and may result in vitamin
deficiencies as these nutrients may end up clinging to the sides of the mixer or other equipment
(“BASF Vitamin Quality School Handbook,” 1994; Ganesan et al., 2008).
The initial characterization of the flow properties of solids was conducted in the works of
Carr (1965) and Jenike (1954). Carr found that density of a powder depends on particle packing
and that density changes as the powder consolidates. He also found the percent compressibility
of a powder could be used as an index of flow (Carr, 1965). Jenike (1954) investigated the
adhesive/cohesive forces of particles as they relate to flow behavior and developed a "flow
factor" that can be used as a measure of powder flow. A number of procedures, mostly in the
pharmaceutical industry, have been developed to determine the flowability of various products.
One of the more widely used flow parameters is the angle of repose (Train, 1958; Brown and
Richards, 1970). Other dynamic methods can be as simple as measuring the rate at which a
powder discharges from a small container or hopper. Typically, a slide valve is opened, the time
for the powder to completely discharge from the container is recorded and the mass flow rate is
calculated. One dynamic method, which is gaining in popularity, is the critical orifice diameter.
This measurement device uses a cylinder with a series of interchangeable base plate discs that
have different interior hole (orifice) diameters. The critical or minimum orifice diameter is the
size of the smallest orifice in a base plate disc through which the powder in a cylinder will flow
(Gioia, 1980; Taylor et al., 2000).
12
The flowability of feed ingredients through bins and feeders has been a growing concern for
animal feed producers, especially as the particle size of ingredients and products has continued to
decrease over the last decade. One hypothesis is that poor feed flowability is caused by greater
fines and a wider distribution of particles than by the targeted lower dgw (Kalivoda, 2016). Poor
flowability may be affected by particle shape, by fine particle sizes or by particle size variability.
Essentially, samples with a greater Sgw or more variation of particles have more fines, decreasing
the flowability (Goodband et al., 2006). Goodband et al. (1983) reported that when particle size
dropped below 500 microns, flowability in the bulk bins and feeders was decreased. De Jong et
al. (2012) reported that as particle size decreased, angle of repose increased and bulk density
decreased, indicating poor flowability. A similar study observed no difference for flow
properties, compressibility or angle of repose when moisture content differed but an observed
difference in Sgw may be due to a combination of a reduction in the amount of fines and particle
cohesion due to increased moisture content (Probst et al., 2013).
Finding a way to improve the flowability of premixes is critical since feed premixes and
additives tend to have poor flowability due to nutrient reactivity with oil or water and
hygroscopic substances being used as carriers. Several methods exist to alleviate some of the
negative impacts associated with poor ingredient flowability. For example, the flowability of
vitamin premixes can be improved by increasing the particle size using granulation or
encapsulation or by selecting less hygroscopic vitamin or nutrient forms (“BASF Vitamin
Quality School Handbook,” 1994). Ingredients that tend to lump and cake should not be stored in
bins and should be added only to the final feed. Flow conditioners and anticaking agents are
commonly used as additives that can assist a powder in maintaining a steady flow and/or
increase its flow rate. Flow conditioners are usually made from chemically inert substances and

13
are often effective at concentrations up to 2%. Most are insoluble in water, but many of them can
adsorb significant quantities of moisture as a result of their very large surface areas (Irani et al.,
1959).
Determining Flowability, Angle of Repose. A common laboratory method to determine
flowability involves the measurement of the angle of repose. The angle of repose can be defined
as the maximum angle in degrees at which a pile of material retains its slope and can be
determined by measuring the angle between the horizontal plane and the height of a pile of
material. There are several variations of the procedure for the angle of repose but the most
common involves 100-200 grams of the product being run through a funnel (~15 cm from the top
of a cylinder with a solid flat top surface) to provide an even flow onto the cylinder, on which the
product forms a cone. From the height (h) of the cone and the radius of the cylinder, the angle of
repose (a) can be calculated using the inverse tangent of the height divided by the radius
[tana=h/r] (Table 2). Another variation of the procedure involves pouring the feedstuff of
interest through an orifice in which the feed falls between two glass planes at a constant rate. In
this method, the angle is measured with a protractor (Train, 1958; “BASF Vitamin Quality
School Handbook,” 1994; Emery et al., 2009).
In general, feed ingredients possessing a low angle of repose (30o or less) have excellent
flowability properties, whereas feed ingredients possessing high angles of repose (60o or more)
have poor flowability. Ingredients with angle of repose measurements between 30o and 45o tend
to have good flowability and between 45o and 60o have fair flowability (“BASF Vitamin Quality
School Handbook,” 1994). From a practical standpoint, high angles of repose are a frequent and
serious cause of particle segregation in the feed industry ultimately leading to a poor uniformity
of mix. For example, an ingredient or feed possessing a high angle of repose that is dumped into

14
a feed bin may result in finer particles settling in the middle of the pile or bin while particles with
large, round shapes or flat angles will concentrate towards the outside of the pile, thus resulting
in particle size and potentially nutrient separation. If this type of segregation were to occur with a
feed ingredient, a disproportionate aliquot of the ingredient will be weighed as it is augured out
of the bin making it difficult to get uniform batches of finished feed, which could lead to nutrient
deficiencies (“BASF Vitamin Quality School Handbook,” 1994). The moisture content of a feed
ingredient is positively correlated with the angle of repose and therefore flowability (Craik and
Miller, 1958). Other factors influencing the angle of repose include the shape and size of the feed
mill bins, how the bins are emptied and filled, and the equipment involved. The angle of repose
gives a reproducible numerical value, so it has been adopted as a common method to assess flow
properties (Craik and Miller, 1958; Train, 1958; “BASF Vitamin Quality School Handbook,”
1994; Emery et al., 2009).
Determining Flowability, Critical Orifice Diameter. The critical or minimum orifice
diameter is determined using a powder flowability test instrument such as a FlodexÒ apparatus
(Paul N. Gardner Company, Inc., Pompano Beach, FL). The FlodexÒ consists of a receptacle
cylinder with interchangeable discs that have holes of various diameters at the bottom of the
cylinder. The determination of flowability is based upon the ability of the sample to fall freely
through a hole in the disc. The smaller the hole through which the sample falls freely, the better
the flowability. To measure the critical orifice diameter, a 50-gram sample is allowed to flow
through a stainless-steel funnel into the FlodexÒ cylinder. The sample rests in the cylinder for 30
seconds and is then evaluated based on its ability to flow through the opening in the disc at the
bottom of the cylinder. Each disc is 6 cm in diameter and the interior hole (orifice) diameter
ranges from 4 to 34 mm. A negative result is recorded when the sample does not flow through
15
the opening in the disc or does not form a cylindrical hole (Fig. 1.1). The disc hole size diameter
is then increased by one disc size until a positive result is observed. A positive result is recorded
when the material flows through the disc opening forming an inverted cone shape (Fig. 1.2). If a
positive result is observed, the disc hole size diameter is decreased until a negative result is
observed. Three positive results on the same disc size are used to determine the critical orifice
diameter (mm) of a sample (Taylor et al., 2000; Abe et al., 2009; Kalivoda, 2016).
Physical Effects of Storage
Lumping
Importance. One major issue feed manufacturers experience is feed ingredients in bags and
bins lumping and forming semi-solid clumps of product that require force to break apart. Most of
the time feed mill machinery, like augers, can break apart these clumps but on occasion physical
labor or various tools are required to break apart clumps in bins or bagged ingredients. In most
cases heat, moisture or pressure can cause the incidence of lumping to increase and the presence
of more than one makes the lumping worse. A lumping test is used to evaluate the effect of heat
on the clump-ability of a feed additive or ingredient. The purpose of this test is to determine the
tendency of a feed additive to solidify when exposed to heat and form lumps in packaged
products with limited external moisture exposure (“BASF Vitamin Quality School Handbook,”
1994). This test is most typically applied to additives that tend to solidify on exposure to heat in
order to determine if the additive is suitable for storage in hot environments or needs special
storage instructions. Especially in the area of premixes and blends, it is frequently overlooked
that some feed additives become chemically active in the presence of heat as well as moisture.
Transport and storage of feed ingredients in hot weather results in an elevation of temperature
and in a closed container or bag moisture bound to carriers or feed additives will be released.
16
This moisture and the presence of hygroscopic substances, such as choline chloride, free
vitamins or salt, causes caking of the feed or product. The lumping and caking of feed
ingredients are signs of a chemical moisture reaction and indicate a potential loss of bioactivity
of the nutrients (“BASF Vitamin Quality School Handbook,” 1994).
Some vitamins are more sensitive to heat than others which is particularly important for free
and standard vitamin premix formulations. For example, Vitamin B12 is stable to mild heat in
neutral solution, but is rapidly destroyed by heating in dilute acid or alkali (Halver, 1980).
Products free of lumps and cakes are vital for an accurate metering of ingredients, metering
machine function and accurate distribution of ingredients in premixes and feeds. Lumps and
cakes also reduce finished product quality due to poor appearance and result in assays below
claim. Spray dried vitamins, choline chloride, ethoxyquin and all other hygroscopic and starch
containing ingredients increase lumping and caking (“BASF Vitamin Quality School
Handbook,” 1994).
The addition of absorptive materials, such as silica, pre-dried carriers or carriers with less
moisture, and the substitution of feed additives that have a high incidence of clumping, may
discourage lumping. Lumping of the final feed is reduced by using forms of ingredients with less
tendency to lump and maintaining all high lumping feed additives separate and adding them
directly to the final feed. Coating or encapsulating ingredients or nutrients can also decrease
lumping, depending on the material used for encapsulation. For example, lipid encapsulations are
protective against moisture but can sometimes melt when exposed to high heat, depending on the
form and type of lipid used, like during pelleting or extrusion (“BASF Vitamin Quality School
Handbook,” 1994).

17
Determining Lumpability. There are no standardized procedures published for the evaluation
of the lumpability of animal feed additives and premixes. The BASF Vitamin Quality School
Handbook, 1994 provides a procedure for the “lumping test” to evaluate the effect of heat on
premixes. The procedure involves placing 10 grams of a feed ingredient or additive in a closed
bottle or tube, such as a 50 mL centrifuge tube, with an air-tight cap. Bottles are stored in a
heating chamber or oven at 50oC, removed after 24 hours and allowed to cool. The samples are
then poured out of the containers and rated on a subjective scale from 0-5 (Table 3). Very often,
due to chemical reactions, a darkening or browning of the heated sample is observed in
association with an increase in the degree of lumping. All samples rated between 3 and 5 are not
suitable for storage in hot weather. Products of this type should be kept in air-conditioned places
to preserve the efficacy and nutrient bioavailability of the product (“BASF Vitamin Quality
School Handbook,” 1994).
Compressibility
Importance. Another factor besides heat that can cause feed ingredients to form clumps and
affect ingredient flow is pressure, especially in regard to bagged products. Most free vitamins
and vitamin and mineral premixes are shipped stacked on pallets 4-8 bags high and can remain
on these pallets in storage for months at a time. Ingredients may be subjected to compaction due
to vibration during transportation, impact from a falling stream of solids like filling an ingredient
bin or external loading. The purpose of measuring the compressibility of a feed additive is to
determine the additive’s tendency to form lumps or cakes when the product is exposed to
pressure for an extended period of time. During prolonged periods of pressure, moisture bound to
carriers or additives is released which in turn causes caking in the presence of hygroscopic
substances, such as free vitamins, salt or other hygroscopic ingredients. This moisture can cause

18
chemical reactions to occur between nutrients which will contribute to hardening of the product
and nutrient degradation (“BASF Vitamin Quality School Handbook,” 1994). Chemical reactions
in the presence of moisture or the liberation of moisture will cause clumping of the ingredient
and the incidence of clumping increases with the pressure of being stacked on a pallet. The
amount of reactivity is also influenced by the material of the bags the ingredients are stored in
due to the sensitivity of some vitamins and nutrients to light oxidation. For example, riboflavin
(Vitamin B2) is susceptible to degradation on exposure to light, but the use of light-proof
packaging material prevents its deterioration (Irani et al., 1959; “BASF Vitamin Quality School
Handbook,” 1994; DSM, 2002). Particle size also plays an important role in the compressibility
of powders and feed ingredients. An increase in particle size generally leads to an increase in
compressibility (Yan and Barbosa-Cánovas, 2001). The finer the particle size and greater the
range of particle sizes, the greater the cohesive strength, and lower the flow rate (Marinelli and
Carson, 1992). Reduction in size increases the contact area between the particles, thereby
increasing the cohesive forces.
The compressibility of a feed ingredient is also important for ingredients stored in macro-
and micro-ingredient bins. Bulk ingredients, like corn, tend to be used frequently and usually do
not have enough time in the bins to compress and bridge. However, ingredients less commonly
used or only used in small amounts at a time, like premixes, additives and micro-ingredients,
tend to stay in bins longer and have time to react with the environment and compress, bridge and
cause flow issues. Compressibility and flowability are correlated and some studies have used
measures of compressibility as estimates of flowability (Abe et al., 2009; Emery et al., 2009).
Studies have evaluated the bulk and tapped density measurements and found that the density of a
powder depends on particle packing and that density changes as the powder consolidates. The

19
degree of consolidation is unique to the powder sample and the ratio of these densities, or
percent compressibility, was used as an index of flow (Taylor et al., 2000). Lumping or caking
due to compression can be reduced by using forms of ingredients with less tendency to lump or
cake and by maintaining all feed additives with a tendency to lump separate and adding them
directly to the final feed.
Determining Compressibility, Compression Test. Determining the exact compressibility of a
premix or feed additive can involve the use of expensive equipment but the BASF Vitamin
Quality School Handbook, 1994 provides a simple procedure for the “compression test” to
evaluate the effect of pressure on premixes and feed additives, specifically for bagged
ingredients. The procedure involves a 15-gram sample being filled into a hollow cylinder, that
the sample will not stick to, standing on a plane surface. The surface of the sample is smoothed
and a solid cylinder of a known weight (1,250 grams corresponds roughly to the weight of four
20-kg bags on an area of 25 by 50 cm) is placed on top of the sample, fitting inside the hollow
cylinder. After 24 hours at ambient temperature, the solid cylinder is carefully removed. The
hollow cylinder is slowly lifted up and the results are rated on a subjective scale from 0-5 (Table
4). Products with a compression score of 4 and 5 are not suitable for bagging and stacking on a
pallet. Very often, a deepening of the color is observed, or single colored spots are noted, which
indicates a chemical reaction has occurred. Hygroscopic products, products with high moisture
and products with very low particle size have a higher tendency to cake or form lumps when
exposed to pressure (“BASF Vitamin Quality School Handbook,” 1994).
Determining Compressibility, Bulk and Tapped Densities. Compressibility can also be
determined by measuring the initial (bulk) and final tapped densities of a feed ingredient or
additive and using those measurements to determine the percent change in density or

20
compressibility. The bulk density is measured by recording the exact weight (g) and volume
(mL) of a feed ingredient or additive sample in a graduated cylinder or beaker. The sample is
then tapped until no further change in the volume is observed and the weight (g) and volume
(mL) are again recorded. This second density represents the tapped density of the feed
ingredient. The change in compressibility, expressed as a percentage, can be calculated by
finding the difference between the bulk and tapped densities of the sample, dividing by the bulk
density and multiplying by 100 (Abdullah and Geldart, 1999; Santomaso et al., 2003). The Carr’s
Compressibility Index [ C = 100 * (1 – bulk / tapped) ] or [ C = 100 * ((tapped - bulk) / tapped) ]
can also be calculated and used as another way of expressing compressibility. The Hausner
Ratio, or the ratio between the tapped and bulk density [ H = (tapped / bulk) ], is also used to
quantify the compressibility of bulk solids (Fernandes et al., 2013). The bulk density of granular
solids and powders depends on particle size, moisture, and chemical composition, but also on
handling and processing operations. Bulk density of food powders has been observed to decrease
with an increase in the particle size as well as with an increase in relative humidity (Yan and
Barbosa-Cánovas, 2001).
Hydration Stability
Solubility
Importance. Feed ingredients, additives and premixes ideally should be as stable against
moisture and water as possible. This is because many nutrient degrading chemical reactions
occur in the presence of water and because some amount of moisture is present in almost all
animal feed ingredients and feedstuffs. Sophisticated equipment, such as High Performance
Liquid Chromatography (HPLC) and Gas Chromatography (GC), can be used to determine the
actual stability of a feed ingredient by measuring the retention over time. Equipment to run these
21
analyses is expensive and not available in every lab. Instead, preforming a quick solubility test in
water among different ingredients or different forms of the same ingredient or additive is an
effective way of determining the relative stability among those ingredients. The purpose of this
test is to quickly and simply evaluate the relative chemical stability of different ingredients by
evaluating their solubility in water. A higher solubility in water corresponds to increased
chemical reactivity and therefore decreased stability of products. Degradation is likely to occur
during the manufacturing, storage and transport of feed additives, premixes and ingredients,
followed by more nutrient degradation at the feed mill during animal feed manufacturing. This is
one of the reasons nutritionists in the poultry industry over-formulate for vitamin and mineral
inclusion as a risk management strategy to compensate for the potential nutrient degradation of
the premixes. The feed industry strives to improve nutrient stability and use more stable forms of
vitamin and mineral premixes, enzymes, probiotics and other feed additives. Premix and feed
additive manufacturers are constantly improving stability by decreasing the solubility of their
products and formulations. Addition of more soluble feed additive products increases nutrient
degradation, ingredient lumping and caking and ingredient hygroscopicity which results in a
premix or feed of inferior quality (“BASF Vitamin Quality School Handbook,” 1994).
Determining Solubility. There are no standard protocols for determining the relative
solubility of premixes and feed additives. It is a very simple procedure though that involves
mixing a known amount of different feed ingredients with the same amount of water and
observing how soluble the samples are (“BASF Vitamin Quality School Handbook,” 1994). A
more precise and applicable method is to measure the percent insoluble fraction of premixes and
additives. To do this, ingredients and water are mixed together for about a minute and then
poured through a filter paper to drain of any excess water. The filter paper is left to dry and then
22
weighed to determine the amount of the ingredient that is insoluble. The weight of the feed
ingredient remaining on the filter paper after it has dried is divided by the starting weight to
determine the percent insoluble fraction of each sample. These values can be compared among
ingredients to determine relative solubility and reactivity among feed premixes and additives.
Hygroscopicity
Importance. The hygroscopic nature of a feed ingredient can be defined as its ability to react
with moisture in the air by absorbing or releasing water vapor. The purpose of measuring the
hygroscopic properties of feed ingredients or additives is to determine the potential of that
ingredient to absorb water or moisture from its surrounding environment. This is especially
important for storage and transport in hot and humid weather. The principle of the test is to
expose the sample to an environment of high relative humidity at a high temperature for an
extended period of time and record the change in weight of the sample after each day. If the
material is hygroscopic, the sample weight will increase from moisture taken up over the course
of time. This can induce changes in physical appearance due to chemical interactions,
crystallization or recrystallization as well as dissolution. In rare cases after increasing weight
from moisture uptake, the weight may decrease while the sample is still in the high temperature,
high humidity environment indicating a ready loss of water or another volatile substance (“BASF
Vitamin Quality School Handbook,” 1994). A variation to the procedure includes exposing
samples to ambient temperature and humidity after taking them out of the high temperature, high
humidity environment for a period of time to measure the amount of the moisture released and
retained. Particle size and structure of the samples plays an important role in hygroscopicity
because of the surface area/weight ratio. The smaller the particle size, the more absorptive the
product is because there is more surface area and more interaction between particles. The

23
hygroscopicity of feed ingredients effects the flowability, lumping and compressibility
properties. Hygroscopicity problems can be solved or reduced using less hygroscopic
ingredients, using carriers with less than 5% moisture, adding hygroscopic ingredients such as
choline directly to the final feed, by using flow agents to remove moisture or by using an
encapsulation method (“BASF Vitamin Quality School Handbook,” 1994). The literature is very
scant in regard to the hygroscopic nature of animal feed additives and ingredients, even though
the importance of hydration stability is well accepted and recognized in the industry.
Determining Hygroscopicity. The BASF Vitamin Quality School Handbook, 1994 provides
a simple procedure for measuring the hygroscopic properties of premixes and feed additives. The
procedure involves placing 10 grams (exactly weighed) of the ingredient in a petri dish and
storing it in an environmental chamber in at least 85oF and 90% relative humidity (RH). The
increase in weight of each sample is recorded after 1 and 2 days. Samples are then taken out of
the environmental chamber and allowed to sit in ambient conditions for 1 day. The weight is
again recorded (day 3) and used to calculate the decrease in weight of each sample (%). Changes
in appearance after each day are noted and rated according to a subjective scale from 1-7 (Table
5) (“BASF Vitamin Quality School Handbook,” 1994) Variations of this method include
increasing the temperature and/or humidity as well as increasing the length of time samples
spend in each environment.
Another method for determining hygroscopicity involving spray dried pigments was
proposed by Cai and Corke (2000), in which samples (about 2 grams) were placed at 25 °C in an
airtight plastic container (40 x 20 x 25-cm) filled with Na2SO4 saturated solution (81% RH).
After 1 week, hygroscopic moisture (hygroscopicity) was weighed and expressed as grams of
moisture per 100 grams of dry solids (g/100 g). A modification of that method involved samples
24
(approximately 1 gram) placed in a container with saturated NaCl solution (75.29% RH) at 25
ºC. After one week, the samples were weighed, and hygroscopicity was again expressed as grams
of adsorbed moisture per 100 grams of dry solids (g/100 g) (Fernandes et al., 2013).
ENCAPSULATION: AN EFFECTIVE SOLUTION
General Stability
Vitamins are a group of chemically diverse compounds that vary considerably in their
stability and susceptibility to degradation by physical and chemical factors. The stability of
individual vitamins in premixes and finished feed varies due to a number of factors. Thus, animal
feed premix and additive manufacturers are constantly trying to improve the stability and
efficacy of their products. A number of common physical and chemical factors affect the
stability of vitamins in premixes and finished feeds (Frye, 1994; Reddy and Love, 1999).
Exposure to multiple stressors generally multiplies the negative effects on vitamin or nutrient
stability. Premix composition affects vitamin stability as well, especially with regard to the
presence or absence of choline and inorganic trace minerals, since these compounds are reactive
with vitamins and reduce their stability (Frye, 1994). Similarly, the processes used in feed
conditioning and manufacturing affect vitamin activity. Both pelleting and extrusion reduce
vitamin activity proportionally to the amount of heat and pressure applied to the feed during
processing (Reddy and Love, 1999). Significant research by major vitamin manufacturers has led
to the development of many specialized vitamin products to provide increased stability at
reasonable cost (Frye, 1994). No product form can assure complete stability of a vitamin or other
nutrient, but the advanced product forms now available to commercial feed and premix
manufacturers provide far superior stability than the raw vitamin products, improving value to
the feed manufacturer and livestock producer (DSM, 2015). Besides stability, other factors

25
considered in the development of additive products are bioavailability, uniform nutrient activity
within the product, and lastly optimal handling and mixing characteristics, such as high
flowability, low dusting, low hygroscopicity and caking, and minimal segregation (Frye, 1994).
These characteristics are especially important yet often overlooked with vitamins because these
essential nutrients are normally added in small amounts to livestock diets, where their presence
or absence in individual rations can seriously affect animal performance and health.
Strategies for improving vitamin stability while maintaining bioavailability through product
formulation have been developed since the beginning of commercial vitamin synthesis in the
1950s (Frye, 1994). More recently, several major vitamin manufacturers have developed and
advanced the spray-dried and microencapsulation beadlet product forms (DSM, 2015). These
products provide consistent levels of vitamin activity under commercial feed manufacturing
conditions. Assurance of nutrient concentrations in feeds and premixes is a vital component of
quality assurance programs and can become a complex problem due to the variety of chemical
interactions that may occur among vitamins and between other compounds. Certain vitamins,
such as vitamins A and C, are most subject to losses during manufacturing and storage (DSM,
2015). Therefore, these vitamins are typically included in the diet with larger safety margins and
might be chosen as monitors of overall vitamin stability in feeds (DSM, 2015). Typically, the use
of good manufacturing procedures (GMP) and other quality assurance and regulatory guidelines
require periodic mixer studies, including nutrient or mixability assays, which can help find and
remediate issues for feed ingredients with poor dispersibility.
Product Manufacturing and Micro Encapsulation Techniques
Before vitamin and mineral premixes arrive at the feed mill stacked in bags on a pallet to
be mixed into animal feed, the premixes are manufactured elsewhere. Free vitamins and minerals

26
are processed into products that are then mixed with carriers, such as rice hulls or oat hulls, to
make the common vitamin and mineral premixes that are formulated into animal diets. There are
many different processes and methods of formulating, processing and manufacturing free
vitamins and minerals, as well as other feed additives like enzymes, prebiotics and probiotics.
These methods vary in their severity of complexity as well as cost. The cheapest and simplest
process for manufacturing free vitamins and minerals is the crystalline process. In this process,
the products are sold without any further formulation or processing. This process produces many
particle shapes and particles with sharp angles that mix well in mash feed (“BASF Vitamin
Quality School Handbook,” 1994). Products manufactured by the crystalline process are very
susceptible to degradation because they have no protection from the environment or factors, like
water or heat. This results in these products used in animal diets at a higher inclusion levels to
compensate for the nutrient losses during processing, storing and manufacturing animal feed
containing these products. Beyond the crystalline process, free vitamins, minerals, and other
additives may be encapsulated by some means that vary in terms of cost or complexity (“BASF
Vitamin Quality School Handbook,” 1994). One relatively inexpensive and simple process to
protect and carry free vitamins is the silica absorbing process, in which a mixer is charged with
silica and the vitamin oil is sprayed in as the mixer rolls. Only oily stable vitamins can be
processed with this method. This process produces somewhat round particles with a very rough
surface that tend to have good flowability (“BASF Vitamin Quality School Handbook,” 1994). A
slightly more complex method is the ethylcellulose coating process, where free vitamin and
mineral crystals are mixed with ethylcellulose fibers in an alcohol medium. As the alcohol
evaporates, the fibers attach to the crystals, forming a fiber net around the crystal. This process
improves compression properties for tableting purposes but does not protect the crystals from

27
chemical reaction, imparting no improvement in stability (“BASF Vitamin Quality School
Handbook,” 1994).
During the past two decades, great advancements have been made in the area of feed
additive and premix processing and manufacturing, including the microencapsulation of
nutrients, flavors and other components. Today, the process of encapsulation consists of two
steps: the first is often emulsification of a core material with a solution or wall material, such as a
polysaccharide, lipid or protein; and the second is the drying or cooling of the emulsions
(Madene et al., 2005). Encapsulation can be used to retain bioactivity in a product during
storage, protect the nutrients from chemical interactions, increase shelf‐life, guard against light-
induced reactions and/or oxidation, or allow for the controlled release of nutrients. Encapsulation
is defined as a process in which small particles are surrounded by a coating or embedded in a
homogeneous or heterogeneous matrix, to produce small capsules. In its simplest form, a
microcapsule is a small sphere with a uniform wall around it. The material inside the
microcapsule is referred to as the core or internal phase, and the wall is referred to as the shell,
coating, wall material or membrane. Practically, the core may be a crystalline material, a jagged
adsorbent particle, an emulsion, a suspension of solids or a suspension of smaller microcapsules.
The core of a microcapsule may be composed of just one or several ingredients and the wall may
be single or double-layered (Poshadri and Kuna, 2010). In general, three precautions need to be
considered for developing microcapsules: formation of the wall around the material, ensuring
that the core does not leach out and ensuring that undesired materials do not leach in.
The selection of a microencapsulation method and coating materials are interdependent.
Coating materials, which are film-forming materials, can be selected from a wide variety of
natural or synthetic polymers, depending on the material to be coated and characteristics desired

28
in the final microcapsules. The composition of the coating material determines the properties of
the microcapsule as well as microencapsulation efficiency and microcapsule stability during
storage (Poshadri and Kuna, 2010). Carbohydrates, such as starches, maltodextrins and corn
syrup, are usually used in microencapsulation of human food ingredients. However, wall
materials that are based on these compounds have poor interfacial properties and therefore poor
handling characteristics. In contrast, proteins have an amphiphilic character that offers properties
required to encapsulate hydrophobic core materials and protein compounds, such as sodium
caseinate, soy protein isolate, and whey protein concentrates and isolates have good
microencapsulating properties (Gharsallaoui et al., 2007). Encapsulation techniques related
specifically to the animal feed industry include spray drying, spray chilling and spray cooling.
Other encapsulation techniques used more commonly in the human food and pharmaceutical
industries include techniques called liposomal entrapment, lyophilization, coacervation, co-
crystalization, extrusion coating, fluidized-bed coating, centrifugal suspension separation and
inclusion complexation (Gibbs et al., 1999; Poshadri and Kuna, 2010).
Spray Drying. Spray drying is the most common microencapsulation technique used in
the food industry (Poshadri and Kuna, 2010). Vitamins and minerals, colorants, fat and oil
flavor, aroma compounds and enzymes have been encapsulated using this technique. It is an
economical and effective method for protecting materials. For the encapsulation process,
modified starch, maltodextrin, gum or other materials are hydrated and used as the carrier or wall
material. The material for encapsulation or core is homogenized with the carrier material, usually
at a ratio of 1 to 4. The mixture is then loaded into a spray dryer and atomized through a nozzle
or spinning wheel. Water is evaporated by the hot air contacting the atomized material and the
capsules are collected as they fall to the bottom of the drier (Gibbs et al., 1999).
29
Microencapsulation by spray drying produces microcapsules via a relatively simple, continuous
process offering advantages over conventional microencapsulation techniques.
Spray Chilling and Spray Cooling. Spray chilling and spray cooling are similar to spray
drying, in that the core material is homogenized in a liquified wall material and atomized.
However, unlike spray drying, there is generally no water to be evaporated. The core and wall
mixture are atomized into either cool or chilled air, which causes the wall to solidify around the
core material forming a capsule. In spray cooling, the wall is typically a vegetable oil, although
other materials can be used with a melting point in the range of 45oC to 122oC. In spray chilling,
the coating is typically a fractionated or hydrogenated vegetable oil with a melting point of 32oC
to 42oC. These two methods, only differing in the melting point of the wall material, are most
often used to encapsulate solid materials, such as vitamins, minerals or organic acids. With the
ability to select the melting point of the wall, these methods of encapsulation can be used for
controlled release during processing or in the gut of the animal (Risch, 1995; Poshadri and Kuna,
2010).
CONCLUSION
The purpose of this review was to discuss the importance of ingredient physical
properties, storage stability and hydration stability, tests and analyses used to easily evaluate feed
ingredients for their relative handling characteristics and common methods of processing and
manufacturing feed additives like microencapsulation or spray drying. Feed additives and
premixes are manufactured with product stability and bioactivity as the first priority, to the
detriment of handling characteristics that sometimes cause problems for efficient feed milling
operation. No solution guarantees perfect results for stability, efficacy or handling properties, but
microencapsulation has been shown to be an effective and promising solution. Encapsulation

30
techniques related specifically to the animal feed industry include spray drying, spray chilling or
spray cooling, extrusion coating, fluidized-bed coating and centrifugal suspension separation.
31
REFERENCES
Abdullah, E. C., and D. Geldart. 1999. The use of bulk density measurements as flowability
indicators. J. Powder Technol. 102:151–165.
Abe, H., S. Yasui, A. Kuwata, and H. Takeuchi. 2009. Improving Powder Flow Properties of a
Direct Compression Formulation Using a Two-Step Glidant Mixing Process. Chem. Pharm.
Bull. (Tokyo). 57:647–652.
BASF Vitamin Quality School Handbook. 1994.in BASF Vitamin Quality School.
Brown, R. L., and J. C. Richards. 1970. Principles of Powder Mechanics (Oxford, Ed.).
Pergamon Press Ltd.
Carr, R. 1965. Evaluating flow properties of solids. J. Chem. Eng. 72.
Craik, D. J., and B. F. Miller. 1958. The Flow Properties of Powders Under Humid Conditions. J.
Pharm. Pharmacol. 10.
Diederich, W., R. D. Goodband, M. D. Tokach, J. M. DeRouchey, J. L. Nelssen, and S. S. Dritz.
2006. Comparison of particle size analysis of ground grain with, or without, the use of a
flow agent.
DSM. 2002. Fortification Basics: Stability.
DSM. 2015. Vitamin Stability.
Emery, E., J. Oliver, T. Pugsley, J. Sharma, and J. Zhou. 2009. Flowability of moist
pharmaceutical powders. Powder Technol. 189:409–415.
Fahrenholz, A. C., L. J. McKinney, C. E. Wurth, and K. C. Behnke. 2010. The importance of
defining the method in particle size analysis by sieving. Kansas Agric. Exp. Stn. Res.
Reports 0:261–264.
Fernandes, R. V. de B., S. V. Borges, and D. A. Botrel. 2013. Influence of spray drying
32
operating conditions on microencapsulated rosemary essential oil properties. J. Food Sci.
Technol. 33:171–178
Frye, T. M. 1994. The performance of vitamins in multicomponent premixes. Proc. Roche Tech.
Symp.
Ganesan, V., K. A. Rosentrater, and K. Muthukumarappan. 2008. Flowability and handling
characteristics of bulk solids and powders - a review with implications for DDGS. Biosyst.
Eng. 101:425–435
Gharsallaoui, A., G. Roudaut, O. Chambin, A. Voilley, and R. Saurel. 2007. Applications of
spray-drying in microencapsulation of food ingredients: An overview. Food Res. Int.
40:1107–1121.
Gibbs, B. F., S. Kermasha, I. Alli, and C. N. Mulligan. 1999. Encapsulation in the food industry:
A review. Int. J. Food Sci. Nutr.
Gioia, A. 1980. Intrinsic flowability: a new technology for powder-flowability classification.
Pharm Tech:65–68.
Goodband, R. D., M. D. Tokach, and J. L. Nelssen. 2002. The Effects of Diet Particle Size on
Animal Performance. Kansas State Univ. Agric. Exp. Stn. Coop. Ext. Serv.:1–6.
Goodband, B., C. Groesbeck, M. Tokach, S. Dritz, J. DeRouchey, and J. Nelssen. 2006. Effects
of diet particle size on pig growth performance, diet flow ability, and mixing characteristics.
Halver, J. E. 1980. Fish Feed Technology.in FAO, Seattle, Washington.
Irani, R. R., C. F. Callis, and T. Liu. 1959. Flow Conditioning Anticaking Agents. Res. Dep.
Inorg. Chem. Div. Monsanto Chem. Co. 51:1285–1288.
Jenike, A. W. 1954. Flow of solids in bulk handling systems: report on the development of a
quantitative method of design. Flow of bulk solids in bins.
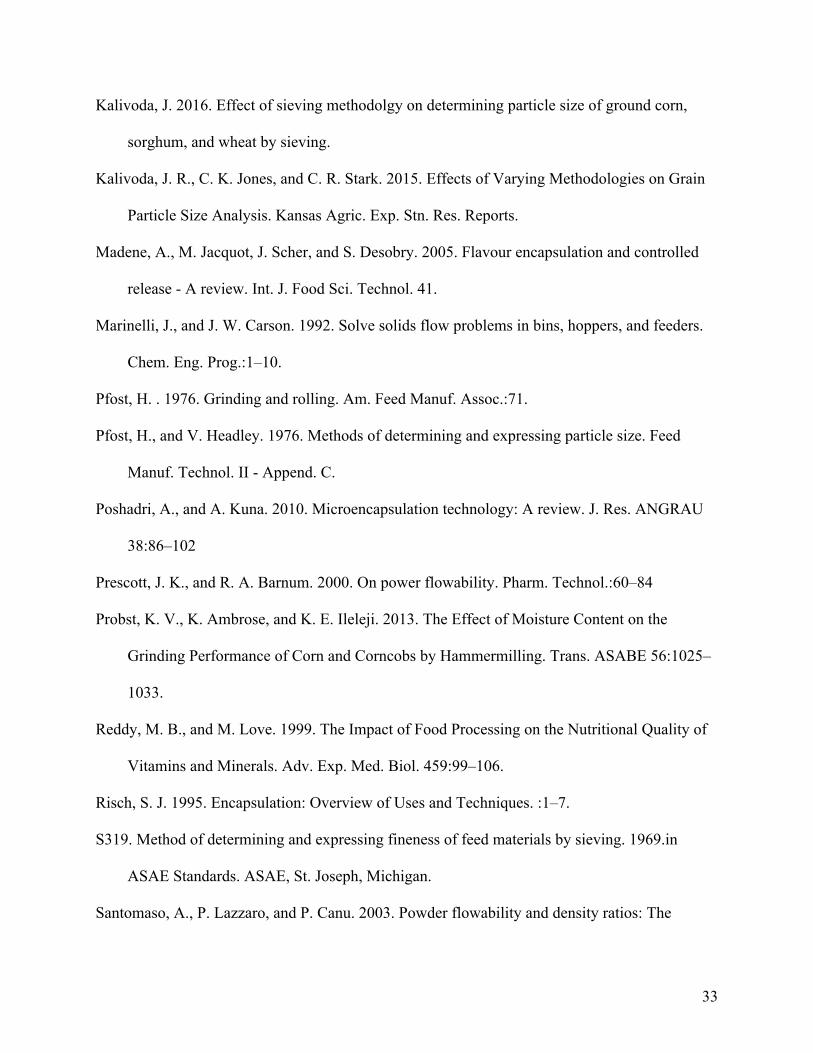
33
Kalivoda, J. 2016. Effect of sieving methodolgy on determining particle size of ground corn,
sorghum, and wheat by sieving.
Kalivoda, J. R., C. K. Jones, and C. R. Stark. 2015. Effects of Varying Methodologies on Grain
Particle Size Analysis. Kansas Agric. Exp. Stn. Res. Reports.
Madene, A., M. Jacquot, J. Scher, and S. Desobry. 2005. Flavour encapsulation and controlled
release - A review. Int. J. Food Sci. Technol. 41.
Marinelli, J., and J. W. Carson. 1992. Solve solids flow problems in bins, hoppers, and feeders.
Chem. Eng. Prog.:1–10.
Pfost, H. . 1976. Grinding and rolling. Am. Feed Manuf. Assoc.:71.
Pfost, H., and V. Headley. 1976. Methods of determining and expressing particle size. Feed
Manuf. Technol. II - Append. C.
Poshadri, A., and A. Kuna. 2010. Microencapsulation technology: A review. J. Res. ANGRAU
38:86–102
Prescott, J. K., and R. A. Barnum. 2000. On power flowability. Pharm. Technol.:60–84
Probst, K. V., K. Ambrose, and K. E. Ileleji. 2013. The Effect of Moisture Content on the
Grinding Performance of Corn and Corncobs by Hammermilling. Trans. ASABE 56:1025–
1033.
Reddy, M. B., and M. Love. 1999. The Impact of Food Processing on the Nutritional Quality of
Vitamins and Minerals. Adv. Exp. Med. Biol. 459:99–106.
Risch, S. J. 1995. Encapsulation: Overview of Uses and Techniques. :1–7.
S319. Method of determining and expressing fineness of feed materials by sieving. 1969.in
ASAE Standards. ASAE, St. Joseph, Michigan.
Santomaso, A., P. Lazzaro, and P. Canu. 2003. Powder flowability and density ratios: The
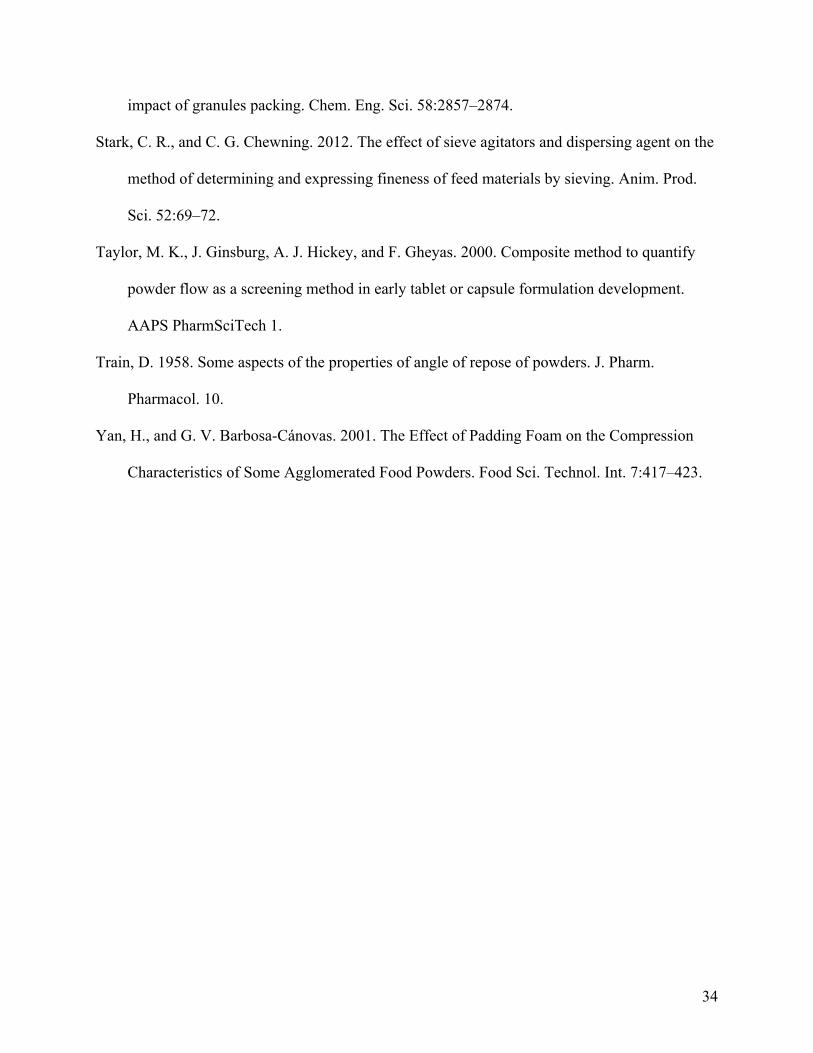
34
impact of granules packing. Chem. Eng. Sci. 58:2857–2874.
Stark, C. R., and C. G. Chewning. 2012. The effect of sieve agitators and dispersing agent on the
method of determining and expressing fineness of feed materials by sieving. Anim. Prod.
Sci. 52:69–72.
Taylor, M. K., J. Ginsburg, A. J. Hickey, and F. Gheyas. 2000. Composite method to quantify
powder flow as a screening method in early tablet or capsule formulation development.
AAPS PharmSciTech 1.
Train, D. 1958. Some aspects of the properties of angle of repose of powders. J. Pharm.
Pharmacol. 10.
Yan, H., and G. V. Barbosa-Cánovas. 2001. The Effect of Padding Foam on the Compression
Characteristics of Some Agglomerated Food Powders. Food Sci. Technol. Int. 7:417–423.
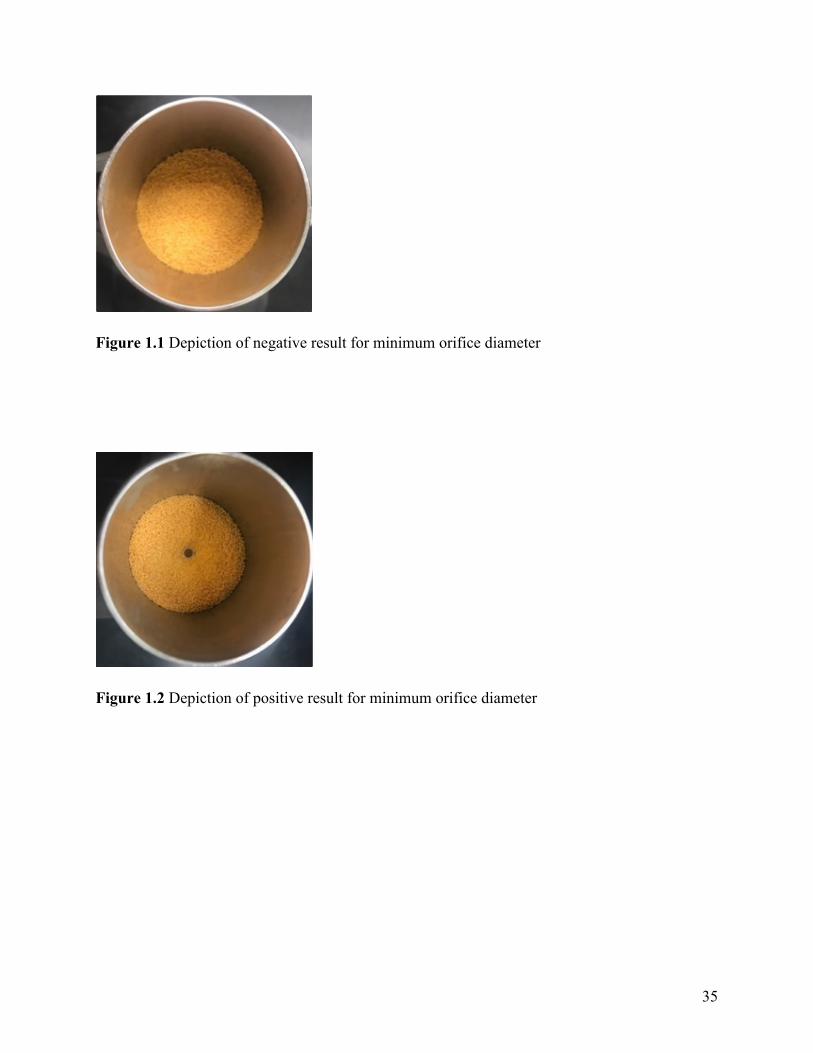
35
Figure 1.1 Depiction of negative result for minimum orifice diameter
Figure 1.2 Depiction of positive result for minimum orifice diameter

36
Table 1. Sieve and sieve agitator arrangement for particle size distribution analysis
US sieve number Sieve opening (micron) Sieve agitator(s)
4 4760 None 6 3360 None 8 2380 None 12 1680 Three rubber balls 16 1190 Three rubber balls 20 840 Three rubber balls 30 590 One rubber ball, one bristle sieve cleaner 40 420 One rubber ball, one bristle sieve cleaner 50 297 One rubber ball, one bristle sieve cleaner 70 210 One rubber ball, one bristle sieve cleaner 100 149 One bristle sieve cleaner 140 105 One bristle sieve cleaner 200 74 One bristle sieve cleaner 270 53 One bristle sieve cleaner Pan 37 None
37
Table 2. Angle of repose (AOR) conversion table
tan! Angle of repose* (!, degrees)
0.5 27 0.6 31 0.7 35 0.8 39 0.9 42 1.0 45 1.1 48 1.2 50 1.3 52 1.4 54 1.5 56 1.6 58 1.7 60 1.8 61 1.9 62 2.0 63
* From the height (h) of the ingredient cone and the radius of the cylinder, the angle of repose (a) can be calculated using the inverse tangent of the height divided by the radius [tana=h/r]

38
Table 3. Scoring description chart for animal feed ingredient, additive and premix lumping test evaluation, BASF Handbook
Score Description
0 Product flows as freely as starting material 1 Product flows freely when tapped 2 Product flows freely as tapped; a few small lumps are observed 3 Product barely flows; when tapped lumps are observed 4 Product does not flow, when tapped and removed from container the sample falls apart in soft lumps 5 Product does not flow at all, sample has form one solid lump
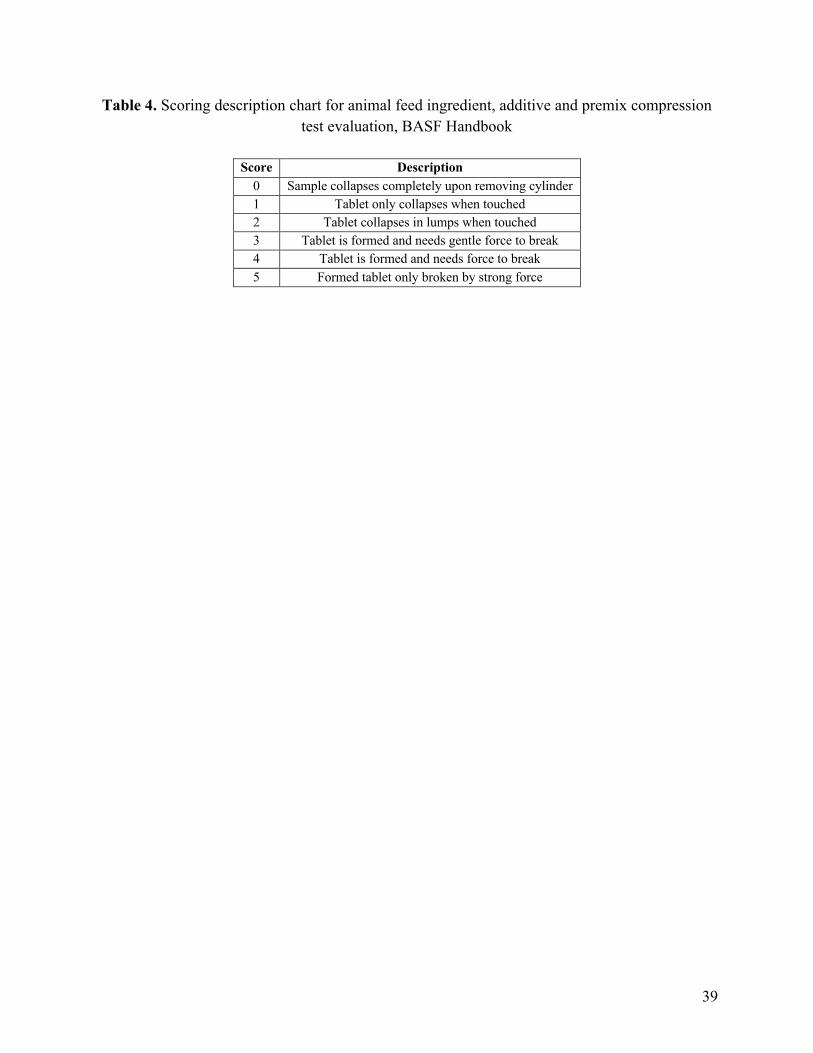
39
Table 4. Scoring description chart for animal feed ingredient, additive and premix compression test evaluation, BASF Handbook
Score Description
0 Sample collapses completely upon removing cylinder 1 Tablet only collapses when touched 2 Tablet collapses in lumps when touched 3 Tablet is formed and needs gentle force to break 4 Tablet is formed and needs force to break 5 Formed tablet only broken by strong force

40
Table 5. Scoring description chart for animal feed ingredient, additive and premix hygroscopic evaluation, BASF Handbook
Score Description
0 Sample is unchanged 1 Sample is dry and firm 2 Surface of sample is moist and sticky 3 Sample is moist and sticky, surface forms a crust 4 Sample is moist and lumpy 5 Sample is moist and lumpy and forms solid lump 6 Sample solidifies to form a cake 7 Sample is partly liquified
41
CHAPTER 2
Physical property and handling characteristic evaluation of free, standard and lipid matrix
encapsulated vitamin and trace mineral premixes

42
ABSTRACT
Handling characteristics of feed ingredients are vital to the efficiency of animal feed
manufacturing. The ability of feed ingredients to change physically or chemically when exposed
to moisture, heat or pressure determines how well they flow through a bin and disperse
throughout the feed. Vitamin and trace mineral premixes are known to be dusty, electrostatic,
hygroscopic, and chemically reactive. Free vitamin and mineral premixes are commonly mixed
with a carrier to form commercial ‘standard’ vitamin and mineral premixes. Micro-encapsulation
of free premixes is a relatively new technique used to reduce reactivity and improve storage and
handling characteristics of nutrients. We hypothesize that lipid matrix encapsulation of free
vitamin and trace mineral premixes significantly improves their handling characteristics making
them more desirable products for feed mills. Triplicate samples of free, standard and lipid matrix
encapsulated vitamin and mineral premixes were evaluated for the following handling
characteristics: particle size (dgw), particle size variability (Sgw), flowability (measured by angle
of repose and minimum orifice diameter), lumping, compressibility, bulk and tapped density,
solubility and hygroscopic percent change in weight (day 0-1, 0-2, 0-3, 3-5, 0-5, 5-6, 5-7, 5-8, 5-
9, 0-9). Results were analyzed in a 3x2 factorial (JMP Pro 14) of form (free, standard, lipid
matrix encapsulated) by type (vitamin, mineral). Lipid matrix encapsulated vitamins and
minerals had the highest Dgw (611.0 and 722.7 microns, respectively) and free and encapsulated
premixes had the smallest Sgw (1.73 and 1.61, respectively), regardless of type. Lipid matrix
encapsulated premixes had significantly lower angle of repose (21.78o and 19.78o for vitamins
and minerals, respectively) and minimum orifice diameter values (5 mm for both vitamins and
minerals) than all other premixes, corresponding to improved flowability. The lipid matrix
encapsulated premixes had the highest compression score (4.67) but the lowest percent

43
compressibility when measured by the bulk and tapped densities (2.59 and 1.29 for vitamins and
minerals, respectively). From days 0-3 and 0-5, lipid matrix encapsulated premixes absorbed
about half as much moisture (1.62% and 2.24%, respectively) than the free (3.48% and 5.04%,
respectively) or standard (3.74% and 5.26%, respectively) premixes. Lipid encapsulated vitamin
and mineral premixes and standard mineral premixes decreased the least in weight from days 5-9
(-1.56%, -1.06% and -1.78%, respectively). Lipid matrix encapsulation improves handling
characteristics of vitamin and mineral premixes by significantly increasing the average particle
size (dgw), by reducing the angle of repose and minimum orifice diameter measurements
resulting in improved flowability, by reducing the percent compressibility (calculated with the
bulk and tapped densities) therefore improving storage properties, and by reducing the amount of
moisture uptake and loss resulting in improved hygroscopic characteristics. The benefits gained
from lipid matrix encapsulation technology not only improves the stability of vitamin and
mineral premixes, but also improves the handling characteristics of animal feed additives.
44
INTRODUCTION
The handling characteristics of feed premixes and additives are essential to the efficiency of
animal feed manufacturing, although they are not usually the only concern or priority for
companies formulating and manufacturing these products. This can result in vitamin and mineral
premixes, enzyme additives, probiotics and prebiotics and other essential feed additives of low
dietary inclusion levels to bridge in bins and cause issues at the feed mill that result in poor
dispersibility in the feed (“BASF Vitamin Quality School Handbook,” 1994; Ganesan et al.,
2008). There are many properties of feed ingredients that can be used to estimate relative
handling characteristics at a feed mill. These properties are broken up into three categories: the
physical properties of feed ingredients, the physical effects of storage on feed ingredients, and
the hydration stability of feed ingredients. There is adequate data evaluating the effects and
importance of feed ingredient physical properties, but little research has been done to evaluate
the effects and importance of storage or hydration stability.
The physical properties of feed additives include particle size distribution and flowability.
Determining the particle size distribution of a feed ingredient is an important way to evaluate the
average size of the particles in microns (dgw) as well as how variable those particles are in size
(Sgw). Feed additives designed for feed mills should have an average particle size no less than 50
microns and no more than 1,200 microns and ideally have little variability in particle size
(Kalivoda et al., 2015). Flowability is an estimation of how well a feed ingredient will flow
through the equipment at a feed mill during animal feed manufacturing. Measuring the angle of
repose and the minimum or critical orifice diameter are two of the simplest ways to determine
the flowability of feed ingredients. The angle of repose is the maximum angle, in degrees, at
which a pile of ingredient retains its slope. The minimum orifice diameter is the smallest hole
45
size that will allow an ingredient to flow from the bottom of a cylindrical bin (Train, 1958;
Kalivoda, 2016). Both of these measurements help estimate relative feed mill performance and
flow characteristics of various feed ingredients.
Storage and transport can have degrading effects on feed additives, premixes and other
ingredients. To evaluate the effects of storage on feed premixes, the lumping test and the
compression test can be used. The lumping test evaluates the effect of high heat in a low
moisture environment, such as being stored in bags during hot weather, and rates the effects on a
subjective scale. The compression test evaluates the effect of pressure on the ingredient, such as
being stacked in bags on a pallet, and also rates the effects on a subjective scale (“BASF Vitamin
Quality School Handbook,” 1994). Percent compressibility of an ingredient can be determined
by measuring the initial (bulk) and final tapped densities and can also be used as an estimation of
flowability. The Carr’s Compressibility Index [ C = 100 * (1 – bulk / tapped) ] and Hausner
Ratio [ H = (tapped / bulk) ] can be calculated and are commonly used to express the percent
compressibility and flow of powders and feed additives (Abdullah and Geldart, 1999; Emery et
al., 2009).
The stability of a feed ingredient when exposed to water or moisture can be used to evaluate
relative stability among feed ingredients. The percent insoluble fraction of ingredients can be
calculated and used to compare the hydration stability of various animal feed additives and
premixes. Hygroscopicity is defined as the ability of a product or ingredient to react with
moisture in the air by absorbing or releasing water vapor. Knowing the hygroscopic properties of
feed additives is important because hygroscopicity has a strong impact on flowability,
dispersibility in the feed, lumping and compressibility. Products that are highly hygroscopic, or
readily absorb water vapor from the air, do not store or transport well, do not handle well in feed

46
mills, do not disperse in mash feed effectively, and have issues with nutrient degradation from
chemical reactions involving water (“BASF Vitamin Quality School Handbook,” 1994).
Vitamins are chemically diverse compounds that vary in their chemical stability and
susceptibility to degradation by physical or chemical factors. The stability of individual vitamins
in premixes and finished feeds varies due to a number of factors, so animal feed premix and
additive manufacturers constantly strive to improve the stability and efficacy of their products.
Exposure to multiple stressors generally exacerbates the negative effects on vitamin and nutrient
stability (Frye, 1994; Reddy and Love, 1999). Premix composition affects vitamin stability as
well, especially with regard to the presence of inorganic trace minerals, since these compounds
are highly reactive with vitamins and can drastically reduce their stability (Frye, 1994).
Similarly, the processes used in feed conditioning and manufacturing affect vitamin and nutrient
bioactivity. Pelleting and extrusion both reduce bioactivity proportionally to the amount of heat
and pressure applied to the feed during processing (Reddy and Love, 1999). Table 1 shows
vitamin sensitivity to common factors that additives are exposed to during modern feed
manufacturing processes like trace minerals, moisture, light and high temperature. Research by
different vitamin manufacturers has led to many specialized vitamin products that were
developed to provide increased stability at a reasonable cost (Frye, 1994).
No product form can assure complete stability of a vitamin or other nutrient, but the
advanced product forms now available to commercial feed and premix manufacturers provide
superior stability than the free vitamin products. Free vitamin and mineral premixes are
commonly mixed with a carrier to form commercial ‘standard’ vitamin and mineral premixes.
Free and standard premixes are very susceptible to nutrient degradation due to a lack of
protection from the environment. Microencapsulation and spray drying can be used to retain

47
bioactivity in a product during storage, protect the nutrients from chemical interactions, increase
shelf‐life, guard against light‐induced reactions and/or oxidation or allow for the controlled
release of nutrients (Poshadri and Kuna, 2010). Microencapsulation is defined as a process in
which small particles are surrounded by a coating or embedded in a homogeneous or
heterogeneous matrix, to produce small capsules. Essentially, a microcapsule is a small sphere
with a uniform ‘wall’ around it. The nutrients inside the microcapsule are often referred to as the
core and are surrounded or encapsulated within the wall material or membrane material. The
core of a microcapsule may be composed of just one or several ingredients and the wall may be
single or double-layered (Poshadri and Kuna, 2010).
The specific encapsulation technique used for the vitamins and minerals in this
manuscript is detailed in U.S. Patent WO2018089516 “Encapsulation of nutritional and/or
compounds for controlled release and enhancing their bioavailability by limiting chemical or
microbial exposure” (Ferket et al., 2017). The patent specifics include “a controlled release lipid
matrix consisting of at least one hydrogenated vegetable triglyceride selected from the group
consisting of palm butter, sunflower oil, corn oil, rape oil, peanut oil and soybean oil; or at least
one animal triglyceride selected from the group consisting of bovine tallow and swine lard; and
one or more nutrients encapsulated within the controlled release lipid matrix, wherein each of the
one or more nutrients is selected from the group consisting of a vitamin, a mineral, and an amino
acid” (Ferket et al., 2017).
Encapsulation of nutrients like free vitamin and mineral premixes in a hydrogenated lipid
matrix encapsulation provides protection to sensitive nutrients from factors like moisture and
trace minerals, improving the stability of these products. We hypothesize that lipid matrix
encapsulation of vitamins and trace minerals according to US Patent WO2018089516,

48
significantly improves their handling characteristics, in turn making them more desirable
products for feed mills and animal feed manufacturers. The objective of this experiment was to
quantify the physical characteristics, physical effects of storage and hydration stability of free,
standard and lipid matrix encapsulated animal vitamin and mineral premixes. There is no
published literature that evaluates different animal vitamin and mineral premix forms for their
relative handling characteristics. The materials and methods described in this manuscript can be
used as a procedure for measuring the relative handling properties of different feed ingredients.
MATERIALS AND METHODS
Nine vitamin and trace mineral premixes, detailed in Table 2, were evaluated for their
handling characteristics and data were analyzed comparing the three premix forms (free,
standard or lipid matrix-encapsulated). The particle size distribution, flowability, lumping score,
compressibility, bulk and tapped density, percent insoluble fraction and hygroscopicity were
evaluated in triplicate for each of the 9 premixes. For the standard form, all three samples for
each premix were from different manufacturing lots and the carrier for all standard premixes was
rice hulls. Free and lipid matrix-encapsulated premixes were only manufactured in one lot,
specifically for experimental purposes. All 27 premix samples were divided using a riffle divider
to approximately 500 g for each analysis. The 500 g sample was then divided using a riffle
divider to reach the appropriate sample size requested for each analysis.
Material Preparation and Sample Analysis
Physical Properties
Particle size was determined according to the procedure in the ASAE S319. To evaluate
the particle size distribution of each sample, 100 g was sieved with a brass sieve stack (14-
sieves) containing sieve agitators with bristle sieve cleaners and rubber balls measuring 16 mm

49
in diameter (Table 3). A dispersing agent (Model SSA- 58, Gilson Company, Inc., Lewis Center,
OH; 0.5 g) was mixed with the sample and the sample was placed on the top sieve. The sieve
stack was placed in the Ro-Tap machine (Model RX- 29, W. S. Tyler Industrial Group, Mentor,
OH) and agitated for 10 minutes. Once completed, each sieve was individually weighed without
the sieve agitator(s) to obtain the weight of the sieve. The sieves were then cleaned and weighed
again to determine the weight of the sample from each sieve. The weight of the dispersing agent
was not subtracted from the weight of the pan as specified in ASAE S319. Sieves were cleaned
after each analysis with a vacuum and a stiff bristle sieve cleaning brush. Calculations for the
average particle size in microns (dgw) were performed according to the equations listed and
described in ASAE standard S319.4 and the variability (Sgw) according to ASAE S319.2. Two
different ASAE versions were used because ASAE S319.4 allows for variations in sieving time
but ASAE S319.2 uses the traditional Sgw calculations, which does not include units for Sgw.
Flowability was measured in two ways, by the angle of repose and by the minimum
orifice diameter. The angle of repose was measured according to the procedure listed in the
BASF Vitamin Quality School Handbook, 1994. To measure the angle of repose, 200 g of each
sample was allowed to flow from a funnel 12 cm above a free-standing platform, 5 cm in
diameter. The angle between the free-standing platform of the sample pile and the height of the
pile (the angle of repose) was calculated by taking the inverse tangent of the height of the pile
divided by the platform radius. The minimum orifice diameter was determined using a powder
flowability test instrument (Flodex Model WG-0110, Paul N. Gardner Company, Inc., Pompano
Beach, FL). To measure the minimum orifice diameter, 50 g of each sample was allowed to flow
through a stainless-steel funnel into a cylinder. The samples rested for 30 seconds in the cylinder
and were then evaluated based on their ability to flow through an opening in a horizontal disc at

50
the bottom of the cylinder. Each disc was 6 cm in diameter and the interior hole (orifice)
diameter ranged from 4 to 34 mm. A negative result was recorded when the sample did not flow
through the opening in the disc or formed a cylindrical hole (Fig. 1.1). The disc hole size
diameter was then increased by one disc size until a positive result was observed. A positive
result was recorded when the material flowed through the disc opening forming an inverted cone
shape (Fig. 1.2). If a positive result was observed, the disc hole size diameter was decreased until
a negative result was observed. Three positive results consecutively on the same disc size were
used to determine the minimum orifice diameter (mm) of each sample.
Physical Impacts of Storage
The lumping score was measured according to the procedure listed in the BASF Vitamin
Quality School Handbook, 1994. To evaluate the lumping tendency of each sample, 10 g was
measured into a 50 mL centrifuge tube. Tubes were tightly closed and stored in a heating oven at
122oF (50oC) for 24 hours. Tubes were then removed from the oven and allowed to cool. The
samples were poured out of the tubes and scored on a subjective scale from 1-6 (Table 4).
The compression score was measured according to a modified version of the procedure in
the BASF Vitamin Quality School Handbook, 1994. To evaluate the compression capacity of
each sample, 15 g was poured into a hollow cylinder standing on a plane surface. The surface of
each sample was smoothed and a solid cylinder weighing 1,250 g was placed on top. After 24
hours at ambient temperature, the solid cylinder was carefully removed, and the hollow cylinder
was slowly lifted up. The results were rated on a subjective scale from 1-6 (Table 5).
Percent compressibility was also determined by measuring the bulk and tapped densities
(kg/m3) of each premix. About 50 g of each sample was poured into a 150 mL graduated cylinder
and the exact weight (g) and volume (mL) were recorded. These were used to calculate the

51
premixes’ bulk density. The cylinder was then tapped until no further change in the volume was
observed. The weight (g) and volume (mL) were again recorded. This represented the premixes’
tapped density. The Carr’s Compressibility Index [ C = 100 * (1 – bulk / tapped) ] and Hausner
Ratio [ H = (tapped / bulk) ] were calculated for each sample.
Hydration Stability
To determine the percent insoluble fraction of each premix, 10 g was mixed in a beaker
with 15 mL distilled water for 1 minute. Samples were then poured through a filter paper to drain
off the water. The filter paper was left to dry and the residue on the paper was weighed. The
weight of the premix remaining on the filter paper was divided by the starting weight to
determine the percent insoluble fraction of each premix.
Hygroscopicity was measured according to a modified version of the procedure listed in the
BASF Vitamin Quality School Handbook, 1994. For each sample, 10 g was measured into a petri
dish and stored in an CO2 incubator (Model 5300, Precision Scientific, Chicago, IL) at 95oF
(35oC) and 99% relative humidity (RH) for 5 days. The weight of each sample was recorded on
days 0, 1, 2, 3 and 5. The percent increase in weight (%) of each sample was calculated after
each day. Samples were then taken out of the high temperature, high humidity environment and
allowed to sit in ambient conditions (70oF (21oC), 50% RH) for 4 days. The weight of each
sample was again recorded on days 6, 7, 8 and 9 and used to calculate the percent decrease in
weight (%) of each sample. Percent change in weight for each time period was calculated by
taking the difference of the two weights, dividing by the original weight and multiplying by 100.
Experimental Design
Twenty-seven samples were evaluated for the following handling characteristic analyses:
particle size (dgw, μm), particle size variability (Sgw), angle of repose (o), minimum orifice
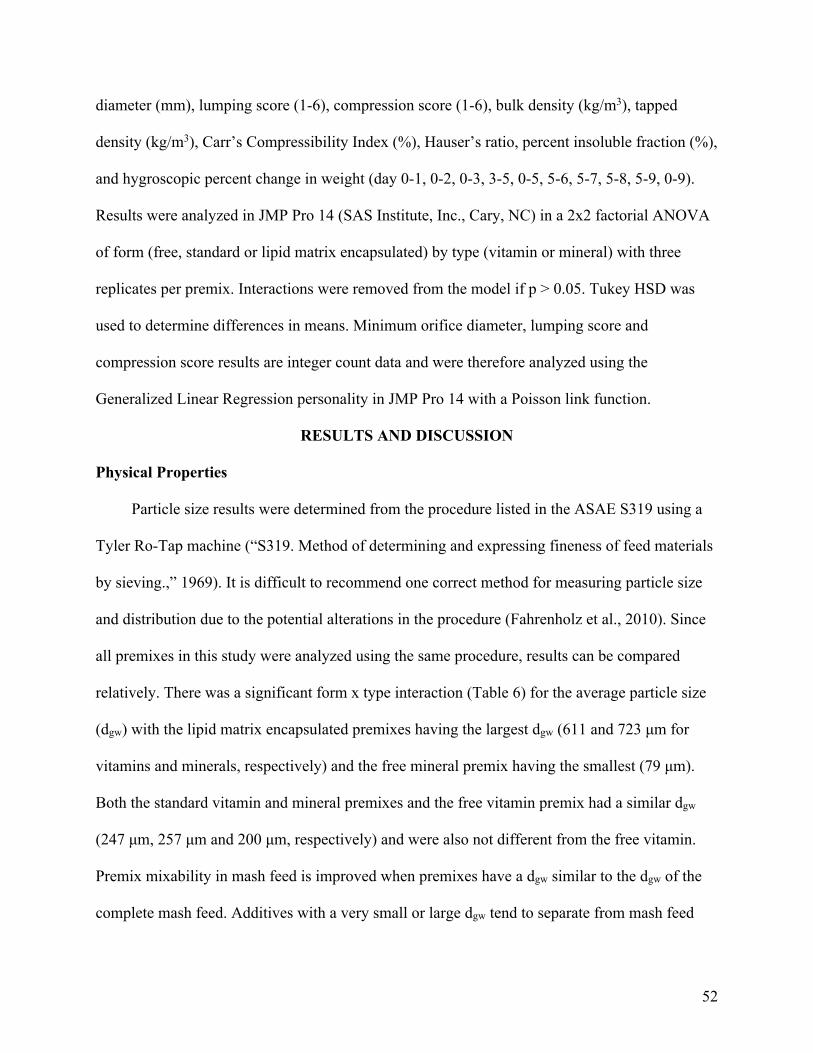
52
diameter (mm), lumping score (1-6), compression score (1-6), bulk density (kg/m3), tapped
density (kg/m3), Carr’s Compressibility Index (%), Hauser’s ratio, percent insoluble fraction (%),
and hygroscopic percent change in weight (day 0-1, 0-2, 0-3, 3-5, 0-5, 5-6, 5-7, 5-8, 5-9, 0-9).
Results were analyzed in JMP Pro 14 (SAS Institute, Inc., Cary, NC) in a 2x2 factorial ANOVA
of form (free, standard or lipid matrix encapsulated) by type (vitamin or mineral) with three
replicates per premix. Interactions were removed from the model if p > 0.05. Tukey HSD was
used to determine differences in means. Minimum orifice diameter, lumping score and
compression score results are integer count data and were therefore analyzed using the
Generalized Linear Regression personality in JMP Pro 14 with a Poisson link function.
RESULTS AND DISCUSSION
Physical Properties
Particle size results were determined from the procedure listed in the ASAE S319 using a
Tyler Ro-Tap machine (“S319. Method of determining and expressing fineness of feed materials
by sieving.,” 1969). It is difficult to recommend one correct method for measuring particle size
and distribution due to the potential alterations in the procedure (Fahrenholz et al., 2010). Since
all premixes in this study were analyzed using the same procedure, results can be compared
relatively. There was a significant form x type interaction (Table 6) for the average particle size
(dgw) with the lipid matrix encapsulated premixes having the largest dgw (611 and 723 μm for
vitamins and minerals, respectively) and the free mineral premix having the smallest (79 μm).
Both the standard vitamin and mineral premixes and the free vitamin premix had a similar dgw
(247 μm, 257 μm and 200 μm, respectively) and were also not different from the free vitamin.
Premix mixability in mash feed is improved when premixes have a dgw similar to the dgw of the
complete mash feed. Additives with a very small or large dgw tend to separate from mash feed

53
due to their size and are therefore inefficient feed products because they do not disperse well.
Dispersibility and mixability in the feed is also improved with less variation in particle size or a
smaller Sgw (“BASF Vitamin Quality School Handbook,” 1994). Mash poultry and swine feed
often has a dgw around 400-700 microns, indicating that the lipid matrix encapsulated premixes
are likely to have the best mixability due to the fact that they have a dgw closer to 500 microns
and the particles in the premix are all very similar in size.
There was a significant form effect in the particle size variability (Sgw) of the premixes and
no significant interaction. Standard premixes, regardless of type, had the largest Sgw (2.50), while
free and lipid matrix encapsulated premixes had a significantly smaller Sgw (1.73 and 1.61,
respectively). Standard premixes have more variability in particle size due to the addition of a
carrier (rice hulls). There was also a significant type effect on the Sgw with the mineral premixes
having more variability in particle size than the vitamin premixes. This is due to the different
properties and processing methods used for vitamins versus minerals. Ingredients with a larger
Sgw could disperse worse in mash feed because the really small particles that increase the Sgw
separate from the mash feed due to their small size.
Flowability is difficult to estimate exactly because ingredient flow behavior is solely a
function of the manufacturing equipment used and the physical properties of the feedstuffs
(Prescott and Barnum, 2000). Because of this, it is more useful to estimate the relative
flowability among feed ingredients using analyses such as the angle of repose or minimum
orifice diameter. Good flowability is invaluable to feed manufacturers and feed mill employees
but sometimes falls lower on the priority list when companies develop additives and premixes for
animal feeds. There was a significant form x type interaction for both the angle of repose (AOR)
and minimum orifice diameter measurements (Table 6). A smaller AOR and smaller minimum

54
orifice diameter both correspond to improved bin flowability. The lipid matrix encapsulated
premixes had a significantly smaller AOR (21.78o and 19.78o for vitamins and minerals,
respectively) and minimum orifice diameter (5 mm for both vitamins and minerals) than
premixes of both the free and standard forms. The free mineral and standard mineral premixes
had the largest AOR (28.59o and 35.99o, respectively) and free vitamin and standard vitamin
premixes had similar AOR measurements (29.23o and 32.22o, respectively). Lipid matrix
encapsulated premixes had significantly lower minimum orifice diameters (5 mm) than premixes
of the free (15 mm) or standard (16.5) forms. There was also a significant type effect (p=0.0041)
for the minimum orifice diameter, with minerals having the smaller value (worse flowability).
The significant reduction in minimum orifice diameter values seen with the encapsulated
premixes corresponds to a significant improvement in flowability. These results demonstrate that
poor flowing free premixes and additives could be encapsulated in a hydrogenated lipid matrix to
improve characteristics to make products that are more compatible with feed mills.
Physical Impacts of Storage
The lumping test evaluated the premixes’ tendency to lump and form a solid cake when
subjected to a high heat environment. Premixes were scored on a scale from 1-6 (Table 4) with
premixes scoring a 5 or 6 not being suitable for high temperature storage. There were no
significant differences observed with the lumping scores between premixes (Table 7). The small
numerical difference between the free and standard premix lumping scores demonstrates that
carriers, like rice hulls, are added to free premixes to improve storage characteristics, such as
lumping tendency. A slightly higher lumping score in the lipid matrix encapsulated premixes
makes sense because there is the addition of a lipid, even though it is in its hydrogenated form.
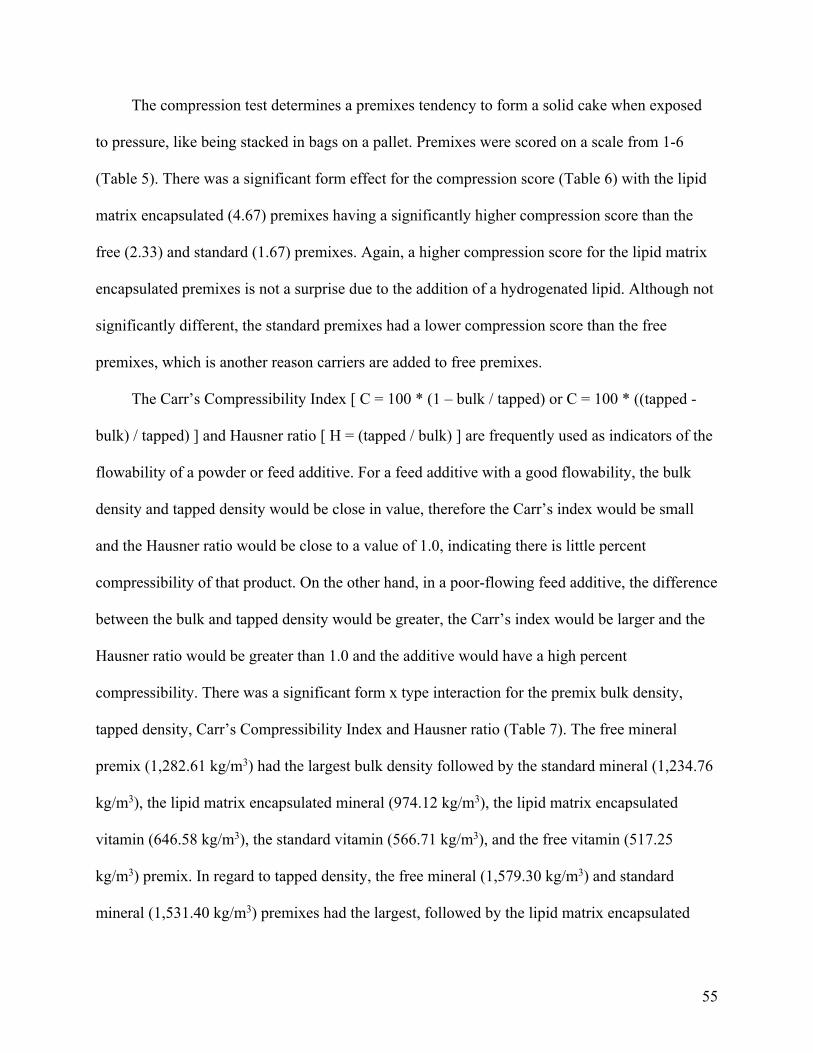
55
The compression test determines a premixes tendency to form a solid cake when exposed
to pressure, like being stacked in bags on a pallet. Premixes were scored on a scale from 1-6
(Table 5). There was a significant form effect for the compression score (Table 6) with the lipid
matrix encapsulated (4.67) premixes having a significantly higher compression score than the
free (2.33) and standard (1.67) premixes. Again, a higher compression score for the lipid matrix
encapsulated premixes is not a surprise due to the addition of a hydrogenated lipid. Although not
significantly different, the standard premixes had a lower compression score than the free
premixes, which is another reason carriers are added to free premixes.
The Carr’s Compressibility Index [ C = 100 * (1 – bulk / tapped) or C = 100 * ((tapped -
bulk) / tapped) ] and Hausner ratio [ H = (tapped / bulk) ] are frequently used as indicators of the
flowability of a powder or feed additive. For a feed additive with a good flowability, the bulk
density and tapped density would be close in value, therefore the Carr’s index would be small
and the Hausner ratio would be close to a value of 1.0, indicating there is little percent
compressibility of that product. On the other hand, in a poor-flowing feed additive, the difference
between the bulk and tapped density would be greater, the Carr’s index would be larger and the
Hausner ratio would be greater than 1.0 and the additive would have a high percent
compressibility. There was a significant form x type interaction for the premix bulk density,
tapped density, Carr’s Compressibility Index and Hausner ratio (Table 7). The free mineral
premix (1,282.61 kg/m3) had the largest bulk density followed by the standard mineral (1,234.76
kg/m3), the lipid matrix encapsulated mineral (974.12 kg/m3), the lipid matrix encapsulated
vitamin (646.58 kg/m3), the standard vitamin (566.71 kg/m3), and the free vitamin (517.25
kg/m3) premix. In regard to tapped density, the free mineral (1,579.30 kg/m3) and standard
mineral (1,531.40 kg/m3) premixes had the largest, followed by the lipid matrix encapsulated

56
mineral (986.93 kg/m3), the lipid matrix encapsulated vitamin (663.90 kg/m3) and standard
vitamin (655.56 kg/m3), and finally the free vitamin (559.72 kg/m3) premix. Lipid matrix
encapsulation significantly decreases the density of free and standard mineral premixes and
significantly increases the density of the free and standard vitamin premixes. Free mineral
premixes are very dense, while free vitamin premixes are not, and the lipid matrix encapsulation
equilibrates the bulk densities of the vitamins and minerals, making them physically more similar
and improving the handling properties.
The lipid matrix encapsulated vitamin and mineral premixes had the lowest Carr’s
Compressibility Index (2.59% and 1.29%, respectively), a measurement of the premixes’ percent
compressibility. The free mineral (18.75%) and standard mineral (19.34%) premixes had the
highest Carr’s Index values and the free vitamin (7.58%) and standard vitamin (13.56%)
premixes were between the lipid matrix encapsulated and free and standard mineral premixes.
The vitamin and mineral lipid matrix encapsulated premixes also had the lowest Hausner ratio
(1.03 and 1.01, respectively) followed by the free vitamin (1.08), the standard vitamin (1.16),
and the free mineral (1.23) and standard mineral (1.24) premixes. It is interesting that the lipid
matrix encapsulated premixes had the highest compression score but lowest percent
compressibility (Carr’s index). This is most likely due to the length of time and type of pressure
that was applied during each analysis. The compression test involves a weighted object
compressing the ingredient for a longer period of time whereas the Carr’s index utilizes gravity
and tapping force to compact the ingredient. The lipid matrix encapsulated premixes have
significantly lower Carr’s index and Hausner ratio values than all other premixes, indicating that
premixes of this form would have better flowability than premixes of the other forms. This idea
is also demonstrated by the angle of repose and minimum orifice diameter results (Table 6).

57
Lipid matrix encapsulation also increases the compression score though, indicating that these
premixes are more likely to cake during bagged storage. Both the Carr’s Compressibility Index
and Hausner ratio are sometimes criticized as not having a strong theoretical basis, despite their
relationship to flowability being demonstrated, but the use of these measurements continues
because the equipment is relatively cheap and the technique is easy to learn.
Hydration Stability
Measuring the solubility of a premix or feed additive is an easy way to estimate an
ingredient’s chemical reactivity when exposed to water or moisture during the storage, transport
or manufacturing of feed and feed ingredients. Solubility results (Table 8) are presented as the
percent insoluble fraction of each premix. There was a significant form effect on the percent
insoluble fraction, but there was also a significant form x type interaction. Vitamin and mineral
lipid matrix encapsulated premixes were essentially insoluble (100.86% and 105.78%,
respectively) and actually increased in weight, indicating some water absorption, but no change
in physical or textural appearance was observed after the premixes had dried on the filter paper.
The increase in weight of the lipid matrix encapsulated vitamin and mineral premixes could be
due to the premixes not having enough time to dry, although they appeared and felt like no
moisture was remaining when they were weighed. Regardless, the results describe relative
solubility and the encapsulated premixes had the highest percent insoluble fraction. The free
vitamin (73.89%), free mineral (88.81%) and standard vitamin (90.29%) premixes had similar
percent insoluble fractions. Standard mineral premixes had the lowest percent insoluble at
75.77%. This means that almost 25% of the standard trace mineral premixes, commonly included
in poultry and swine diets, are soluble and reactive when exposed to moisture. This increase in
reactivity results in a lower bioavailability of nutrients in these premixes, causing nutritionists to

58
compensate for the loss by increasing inclusion levels of these premixes in diets. Higher
inclusion levels of trace mineral premixes can have negative impacts on gut health and the
environment. The lipid matrix encapsulated premixes being essentially insoluble indicates that
the nutrients in these premixes are protected from chemical reactions involving water resulting in
increased bioavailability of nutrients.
The hygroscopic nature of premixes and feed additives is very important to feed
manufactures because it influences flowability and the general handling ability of ingredients at a
feed mill. Ingredients like salt, choline chloride and dried distillers grains are notorious for being
very hygroscopic ingredients, often bridge in bins causing “no flow” alarms and slow the
production and efficiency of feed manufacturing. Premixes in this study were subjected to a high
humidity and high temperature environment for 5 consecutive days and then removed and kept in
ambient conditions for 4 days. The percent increase in weight from moisture absorption was
recorded for days 0-5 (Table 9) and the percent decrease in weight due to moisture loss was
recorded for days 5-9 (Table 10). There were no differences in premix percent increase in weight
from day 0-1. A significant form effect was observed on percent change in weight for days 0-2,
0-3 and 0-5 with the lipid matrix encapsulated premixes increasing the least in weight (1.20%,
1.62% and 2.24%, respectively) and standard (3.17%, 3.74% and 5.26%) and free (2.59%, 3.48%
and 5.04%) premixes increasing the most, regardless of type; free premixes were not different
from the lipid matrix encapsulated premixes until day 3. Even though it is only a 1-3% difference
in weight, it is important to note that the free and standard premixes absorbed over twice the
amount of moisture than the lipid matrix encapsulated premixes did over the day 0-1, 0-2, 0-3
and 0-5 time periods. There was a significant form x type interaction for day 3-5 with the vitamin
and mineral lipid matrix encapsulated premixes again having the smallest increase in weight

59
(0.44% and 0.78%, respectively) followed by the standard vitamin (1.02%), the free mineral
(1.44%) and finally the free vitamin (1.58%) and standard mineral (1.87%) premixes with the
largest weight increase. This data shows that lipid matrix encapsulated premixes absorb less
moisture from water vapor than standard or free premixes indicating encapsulated premixes may
be more protected against degradation and chemical interactions involving water.
There was a significant form x type interaction for the premix percent decrease in weight
for days 5-6, 5-7, 5-8 and 5-9 (Table 9) with the lipid matrix encapsulated mineral premix
consistently decreasing the least in weight (-.55%, -.70%, -.93% and -1.06%, respectively) and
the free vitamin premixes consistently decreasing the most (-1.20%, -2.13%, -3.44% and -
4.48%). For days 5-6, 5-8 and 5-9 the free mineral (-1.02%, -2.77% and -3.08%, respectively)
and standard vitamin (-1.14%, -3.14%, -3.74%) premixes had similar percent change in weight.
For day 5-6 and 5-7 the standard mineral premix (-0.61% and -0.81%, respectively) lost a similar
amount of weight as the lipid matrix encapsulated mineral, both significantly less than the other
premixes. For days 5-8 and 5-9 the standard mineral (-1.35% and-1.78%, respectively) and the
lipid matrix encapsulated vitamin (-1.50% and -1.56%) premixes lost a similar amount of weight.
Looking at the day 0-9 results (Table 9), all premixes absorbed more moisture than they
released and there was a significant form x type interaction effect. The standard mineral retained
the most in moisture weight (3.81%) and increased in weight significantly more than all other
premixes. The lipid encapsulated mineral (1.43%), free mineral (1.09%), free vitamin (1.03%),
standard vitamin (0.91%) and lipid encapsulated vitamin (0.38%) premixes all had similar day 0-
9 percent change in weight. Interestingly, the lipid matrix encapsulated mineral premix retained
the second highest amount of moisture, behind the standard mineral, which may explain why the
lipid matrix encapsulated mineral actually increased by nearly 5% of its weight during the

60
solubility analysis. The free and standard premixes increased the most in weight from days 0-5
and decreased the most in weight from days 5-9. The large decrease in weight of the free and
standard premixes from days 5-9 could be from moisture loss as well as other volatile losses
from chemical reactions resulting in 0-9 day results similar to the encapsulated premixes. On the
other hand, the lipid matrix encapsulated premixes increased the least in weight from days 5-9,
allowing for less chemical reactions to occur and also less weight to be lost.
CONCLUSION
The handling characteristics of feed ingredients, and especially feed additives and
premixes, are essential to the efficiency of animal feed manufacturing. Often animal feed
additive manufacturers are concerned more with the stability and efficacy of their products and
the handling characteristics tend to suffer, making feed manufacturing more difficult for feed
mill employees. Lipid matrix encapsulation by means of U.S. Patent WO2018089516 improves
handling characteristics of vitamin and mineral premixes by significantly increasing the average
particle size (dgw), by reducing the angle of repose and minimum orifice diameter measurements
resulting in improved flowability, by reducing the percent compressibility (calculated with the
bulk and tapped densities) but also increasing the compression score, and by reducing the
amount of moisture uptake and loss resulting in improved hygroscopic characteristics. The
various handling characteristic materials and methods in this manuscript can be used as a
procedure for measuring the relative handling properties of different feed ingredients. The
benefits gained from lipid matrix encapsulation technology will not only improve the stability of
vitamin and mineral premixes and other feed additives but also improves the handling
characteristics of animal feed additives.

61
REFERENCES
Abdullah, E. C., and D. Geldart. 1999. The use of bulk density measurements as flowability
indicators. J. Powder Technol. 102:151–165.
BASF Vitamin Quality School Handbook. 1994.in BASF Vitamin Quality School.
Emery, E., J. Oliver, T. Pugsley, J. Sharma, and J. Zhou. 2009. Flowability of moist
pharmaceutical powders. Powder Technol. 189:409–415.
Fahrenholz, A. C., L. J. McKinney, C. E. Wurth, and K. C. Behnke. 2010. The importance of
defining the method in particle size analysis by sieving. Kansas Agric. Exp. Stn. Res.
Reports 0:261–264.
Ferket, P. R., J. Fontaine, and J.-D. Bunod. 2017. Encapsulation of nutritional and/or compounds
for controlled release and enhancing their bioavailability by limiting chemical or microbial
exposure.
Frye, T. M. 1994. The performance of vitamins in multicomponent premixes. Proc. Roche Tech.
Symp.
Ganesan, V., K. A. Rosentrater, and K. Muthukumarappan. 2008. Flowability and handling
characteristics of bulk solids and powders - a review with implications for DDGS. Biosyst.
Eng. 101:425–435
Kalivoda, J. 2016. Effect of sieving methodolgy on determining particle size of ground corn,
sorghum, and wheat by sieving.
Kalivoda, J. R., C. K. Jones, and C. R. Stark. 2015. Effects of Varying Methodologies on Grain
Particle Size Analysis. Kansas Agric. Exp. Stn. Res. Reports.
Poshadri, A., and A. Kuna. 2010. Microencapsulation technology: A review. J. Res. ANGRAU
38:86–102
62
Prescott, J. K., and R. A. Barnum. 2000. On power flowability. Pharm. Technol.:60–84
Reddy, M. B., and M. Love. 1999. The Impact of Food Processing on the Nutritional Quality of
Vitamins and Minerals. Adv. Exp. Med. Biol. 459:99–106.
S319. Method of determining and expressing fineness of feed materials by sieving. 1969.in
ASAE Standards. ASAE, St. Joseph, Michigan.
Train, D. 1958. Some aspects of the properties of angle of repose of powders. J. Pharm.
Pharmacol. 10.

63
Figure 1.1 Depiction of negative result for minimum orifice diameter
Figure 1.2 Depiction of positive result for minimum orifice diameter
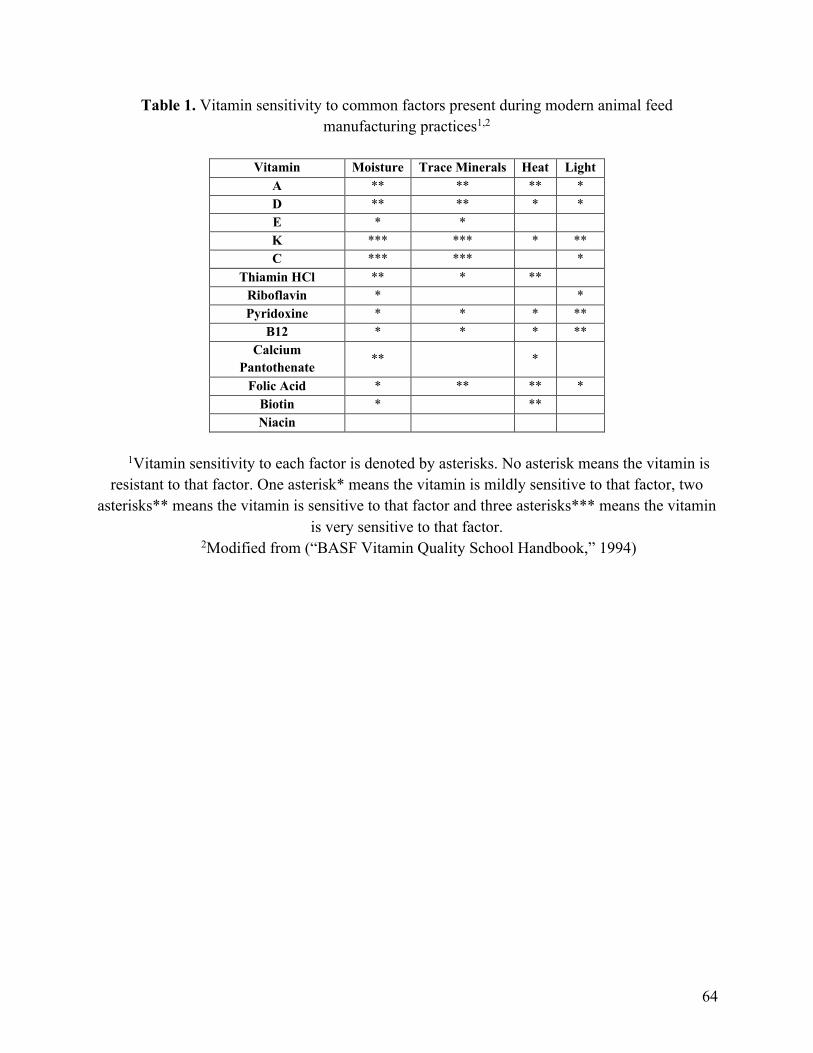
64
Table 1. Vitamin sensitivity to common factors present during modern animal feed manufacturing practices1,2
Vitamin Moisture Trace Minerals Heat Light
A ** ** ** * D ** ** * * E * * K *** *** * ** C *** *** *
Thiamin HCl ** * ** Riboflavin * * Pyridoxine * * * **
B12 * * * ** Calcium
Pantothenate ** *
Folic Acid * ** ** * Biotin * ** Niacin
1Vitamin sensitivity to each factor is denoted by asterisks. No asterisk means the vitamin is resistant to that factor. One asterisk* means the vitamin is mildly sensitive to that factor, two
asterisks** means the vitamin is sensitive to that factor and three asterisks*** means the vitamin is very sensitive to that factor.
2Modified from (“BASF Vitamin Quality School Handbook,” 1994)

65
Table 2. Nine premixes evaluated for their physical properties, effects of storage, hydration stability and handling characteristics
Form Type Premix Name
Free Vitamin Free Poultry Vitamin Premix Mineral Free Poultry Trace Mineral Premix
Standard
Vitamin NCSU Poultry Vitamin Premix Vitamin NCSU Swine Sow/pig Vitamin Premix Vitamin NCSU Market Swine Vitamin Premix Mineral NCSU Poultry Trace Mineral Premix Mineral NCSU Swine Trace Mineral Premix
Lipid Matrix Encapsulated Vitamin Lipid Matrix Encapsulated Vitamin Premix Mineral Lipid Matrix Encapsulated Trace Mineral Premix

66
Table 3. Sieve and sieve agitator arrangement for particle size distribution analysis
US sieve number Sieve opening (micron) Sieve agitator(s)
4 4760 None 6 3360 None 8 2380 None 12 1680 Three rubber balls 16 1190 Three rubber balls 20 840 Three rubber balls 30 590 One rubber ball, one bristle sieve cleaner 40 420 One rubber ball, one bristle sieve cleaner 50 297 One rubber ball, one bristle sieve cleaner 70 210 One rubber ball, one bristle sieve cleaner 100 149 One bristle sieve cleaner 140 105 One bristle sieve cleaner 200 74 One bristle sieve cleaner 270 53 One bristle sieve cleaner Pan 37 None
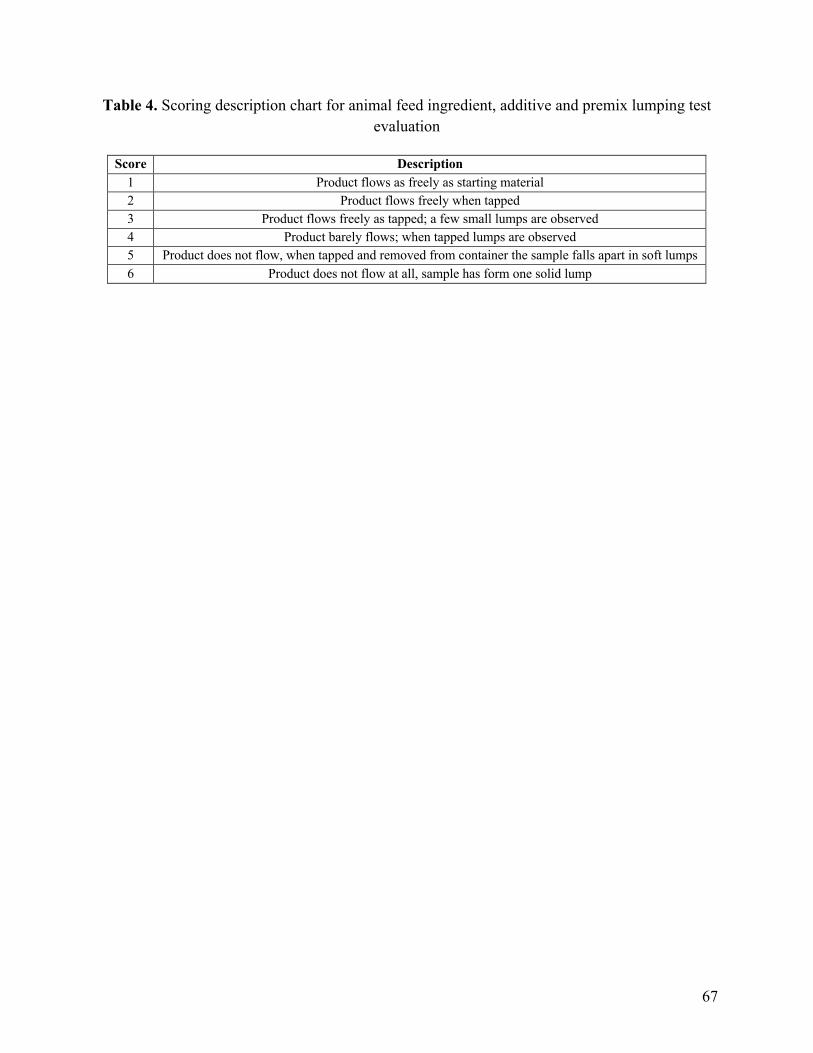
67
Table 4. Scoring description chart for animal feed ingredient, additive and premix lumping test evaluation
Score Description
1 Product flows as freely as starting material 2 Product flows freely when tapped 3 Product flows freely as tapped; a few small lumps are observed 4 Product barely flows; when tapped lumps are observed 5 Product does not flow, when tapped and removed from container the sample falls apart in soft lumps 6 Product does not flow at all, sample has form one solid lump

68
Table 5. Scoring description chart for animal feed ingredient, additive and premix compression test evaluation
Score Description
1 Sample collapses completely upon removing cylinder 2 Tablet only collapses when touched 3 Tablet collapses in lumps when touched 4 Tablet is formed and needs gentle force to break 5 Tablet is formed and needs force to break 6 Formed tablet only broken by strong force

69
Table 6. Premix physical property results+
Form Type dgw (microns, μm) Sgw Angle of Repose (o) Minimum Orifice
diameter (mm)
Free Vitamin 200.33b ± 29.07 1.67c ± 0.07 29.23b ± 1.09 12c ± 0.31
Mineral 78.67c ± 29.07 1.78c ± 0.07 38.59a ± 1.09 18a ± 0.31
Standard Vitamin 246.11b ± 16.78 2.33b ± 0.04 32.22b ± 0.63 14b ± 0.18
Mineral 256.50b ± 20.56 2.69a ± 0.05 35.99a ± 0.77 19a ± 0.22
Lipid Matrix
Encapsulated
Vitamin 611.00a ± 29.07 1.49c ± 0.07 21.78c ± 1.09 5d ± 0.31
Mineral 722.67a ± 29.07 1.74c ± 0.07 19.78c ± 1.09 5d ± 0.31 p-value (form) <.0001 <.0001 <.0001 <.0001*
p-value (type) 0.9952 <.0001 0.0001 0.0041
p-value (form x type) 0.0024* 0.1232* 0.0002* 0.6331
* p-value associated with the difference in means, denoted by superscript letters
+standard deviations (mean ± standard deviation) are for n=3 samples

70
Table 7. Premix physical impacts of storage results+
* p-value associated with the difference in means, denoted by superscript letters
+standard deviations (mean ± standard deviation) are for n=3 samples
Form Type Lumping Score (1-6)
Compression Score (1-6)
Bulk Density (kg/m3)
Tapped Density (kg/m3)
Carr’s Compressibility Index (%) Hausner Ratio
Free Vitamin
3.16 ± 0.30 2.33b ± 0.24 517.25f ± 10.81 559.72d ± 14.19 7.58c ± 0.95 1.08c ± 0.01
Mineral 1,282.61a ± 10.81 1,579.30a ± 14.19 18.75a ± 0.95 1.23a ± 0.01
Standard Vitamin
2.22 ± 0.20 1.67b ±0.16 566.71e ± 6.24 655.56c ± 8.19 13.56b ± 0.55 1.16b ± 0.01
Mineral 1,234.76b ± 7.65 1,531.40a ± 10.04 19.34a ± 0.67 1.24a ± 0.01 Lipid Matrix Encapsulated
Vitamin 3.67 ± 0.30 4.67a ± 0.24
646.58d ± 10.81 663.90c ± 14.19 2.59d ± 0.95 1.03cd ± 0.01 Mineral 974.12c ± 10.81 986.93b ± 14.19 1.29d ± 0.95 1.01d ± 0.01
p-value (form) 0.1655 0.0009* <.0001 <.0001 <.0001 <.0001 p-value (type) 0.4686 0.6218 <.0001 <.0001 <.0001 <.0001
p-value (form x type) --- --- <.0001* <.0001* <.0001* <.0001*

71
Table 8. Premix insoluble fraction results+
Form Type Insoluble fraction (%)
Free Vitamin 73.89bc ± 4.82 Mineral 88.81abc ± 4.82
Standard Vitamin 90.29ab ± 2.78 Mineral 75.77c ± 3.41
Lipid Matrix Encapsulated
Vitamin 100.86a ± 4.82 Mineral 105.78a ± 4.82
p-value (form) 0.0001 p-value (type) 0.6210
p-value (form x type) 0.0034*
* p-value associated with the difference in means denoted by superscript letters +standard deviations (mean ± standard deviation) are for n=3 samples
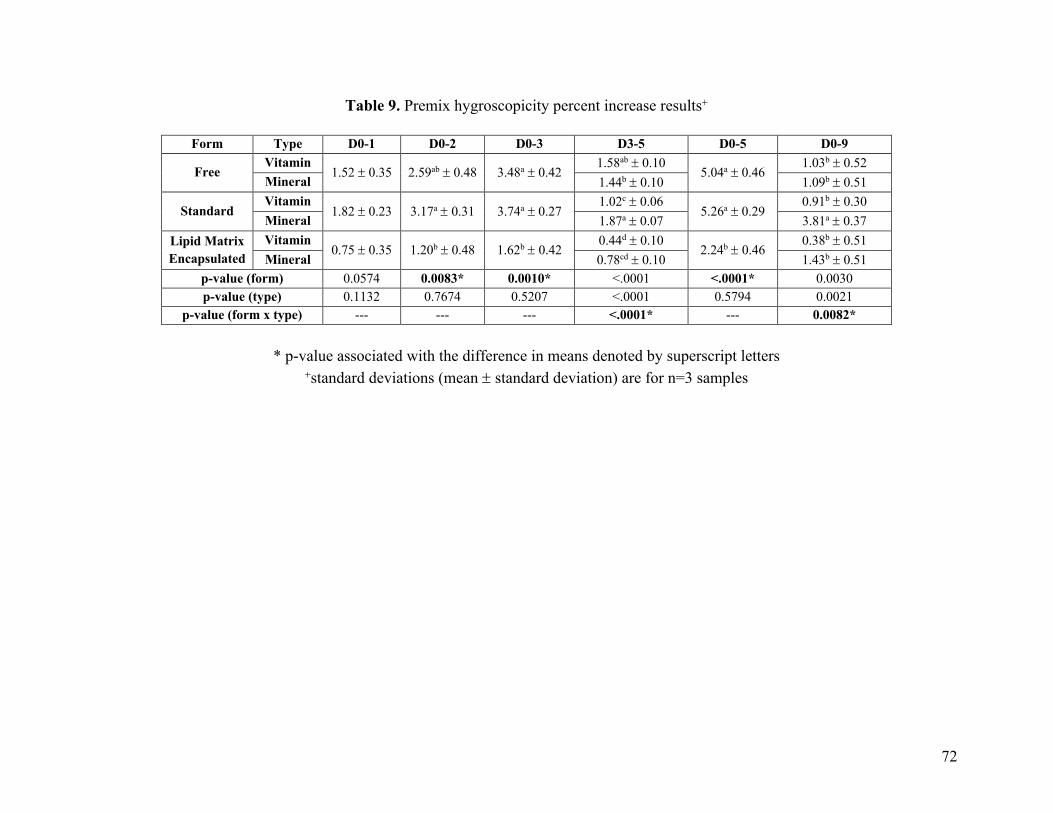
72
Table 9. Premix hygroscopicity percent increase results+
Form Type D0-1 D0-2 D0-3 D3-5 D0-5 D0-9
Free Vitamin
1.52 ± 0.35 2.59ab ± 0.48 3.48a ± 0.42 1.58ab ± 0.10
5.04a ± 0.46 1.03b ± 0.52
Mineral 1.44b ± 0.10 1.09b ± 0.51
Standard Vitamin
1.82 ± 0.23 3.17a ± 0.31 3.74a ± 0.27 1.02c ± 0.06
5.26a ± 0.29 0.91b ± 0.30
Mineral 1.87a ± 0.07 3.81a ± 0.37 Lipid Matrix Encapsulated
Vitamin 0.75 ± 0.35 1.20b ± 0.48 1.62b ± 0.42
0.44d ± 0.10 2.24b ± 0.46
0.38b ± 0.51 Mineral 0.78cd ± 0.10 1.43b ± 0.51
p-value (form) 0.0574 0.0083* 0.0010* <.0001 <.0001* 0.0030 p-value (type) 0.1132 0.7674 0.5207 <.0001 0.5794 0.0021
p-value (form x type) --- --- --- <.0001* --- 0.0082*
* p-value associated with the difference in means denoted by superscript letters +standard deviations (mean ± standard deviation) are for n=3 samples

73
Table 10. Premix hygroscopicity percent decrease results+
Form Type D5-6 D5-7 D5-8 D5-9
Free Vitamin -1.20c ± 0.05 -2.13c ± 0.08 -3.44d ± 0.11 -4.48d ± 0.18 Mineral -1.02bc ± 0.05 -1.64b ± 0.08 -2.77c ± 0.11 -3.08c ± 0.18
Standard Vitamin -1.14c ± 0.03 -2.04c ± 0.05 -3.14cd ± 0.06 -3.74c ± 0.10 Mineral -0.61a ± 0.03 -0.81a ± 0.06 -1.35b ± 0.08 -1.78b ± 0.13
Lipid Matrix Encapsulated
Vitamin -0.94b ± 0.05 -1.32b ± 0.08 -1.50b ± 0.11 -1.56ab ± 0.18 Mineral -0.55a ± 0.05 -0.70a ± 0.08 -0.93a ± 0.11 -1.06a ± 0.18
p-value (form) <.0001 <.0001 <.0001 <.0001 p-value (type) <.0001 <.0001 <.0001 <.0001
p-value (form x type) 0.0007* <.0001* <.0001* 0.0004*
* p-value associated with the difference in means denoted by superscript letters +standard deviations (mean ± standard deviation) are for n=3 samples

74
CHAPTER 3
Economically important production traits and enteric health of broilers fed free or lipid
matrix encapsulated vitamin and/or trace mineral elements at recommended and reduced
levels

75
ABSTRACT
Protection of vitamin and mineral (VM) premixes in a lipid encapsulated matrix for controlled
release could enhance bioactivity and permit lower dietary inclusion levels by limiting chemical
or microbial exposure without adversely affecting growth, welfare, enteric health or value of
poultry products. The objective was to determine the effect of reduced inclusion levels of free
and lipid matrix encapsulated VM premixes on production traits and enteric health. Two 2 X 2
factorial designed experiments were conducted in which free or lipid matrix encapsulated VM
premixes were included at 100% of Aviagen recommended levels or at 60% or 70% reduced
levels in trials 1 and 2, respectively and combinations thereof to make 6 total dietary treatments.
Reduced levels of free VM are not commercially feasible due to the risk of activity losses during
feed manufacturing and storage. In trial 1, Ross 708 male broilers were randomly assigned to 6
dietary treatments (25 birds/pen, 2 pens/trt). Feed and individual bird weights were recorded on
D7, 14, 21, 28 and 42. Samples for 28d and 42d jejunum histology and 42d cecal 16s RNA
analysis were collected from 3 birds per pen. Based on trial 1 results replicates were increased
for trial 2. In trial 2 Ross 708 male and female broilers were assigned to 6 treatments (32
birds/pen, 6 pens/trt). Feed and bird weights were recorded on D14, 28 and 42. On D49 birds
from trial 2 were processed; carcass and cut up weights, white striping, wooden breast, drip loss,
paw quality, and shank, skin and breast meat color (Minolta Colorimeter) were recorded. No
dietary effects were observed on feed intake, body weight or feed conversion ratio (FCR) in trial
1 but a significant premix level effect on body weight at day 28 was observed with the reduced
diets having larger body weights. There was a significant diet effect on % coefficient of variation
CV at day 21 (p=0.017). There were significant treatment effects observed on jejunum villi tip
width, crypt depth and surface area with lipid matrix encapsulation diets significantly reduced,
76
regardless of inclusion level (p<0.10). Day 42 cecal microbiome results showed a shift to higher
Firmictes:Bacteroidetes with the encapsulated diets. In trial 2, no treatment effects were
observed on female or male feed intake, body weight, FCR, muscle myopathies, ammonia lesion
scores, carcass yield or breast skin color. The lipid matrix encapsulated VM did improve
adjusted feed conversion ratio (FCR) by an astounding 12 points at the 100% level (1.68 vs
1.56), whereas at the 30% supplementation level the free VM premixes resulted in a better FCR
than the lipid matrix encapsulated VM (1.59 vs 1.64). A 70% reduction in the dietary level of
free VME resulted in the highest incidence of hock and paw lesions. In contrast encapsulated
VM improved the yellowness values of paws and yellowness and redness of breast meat.
Encapsulated VM premixes significantly reduced breast meat drip loss after 3, 5 and 7 days of
refrigerated storage (p<.01). Lipid matrix encapsulated VM premixes improve growth
performance, enteric health, and market value of poultry products regardless of dietary level, but
encapsulation also remediates the risk of lower dietary VM premix inclusion levels that would
otherwise be infeasible as free premix forms.

77
INTRODUCTION
The animal feed industry, consumers and feed manufacturers demand for nutritional
supplements, premixes and feed additives that have high integrity, stability, and bioavailability.
They want premixes and additives with acceptable palatability that also provide desired health
and performance benefits at the lowest possible costs. Nutritional feed additive product
manufacturers try to improve stability and efficacy of their products in a variety of ways. It is
common practice to add extra ingredients and carriers to nutritional additive blends to make
premixes that minimize unfavorable ingredient interactions or improve handling and stability
characteristics. These non-nutritional carrier ingredients (like rice hulls, oat hulls, etc.) take up
valuable space in diet formulations, only partly solve problems with stability and flowability and
have their own stability and flow issues. The over-formulation of micro ingredients is another
approach used to achieve high nutrient bioavailability by compensating for nutritional losses
during feed manufacturing. This risk management approach can significantly increase feed costs,
is wasteful and not environmentally cautious, and can negatively impact palatability therefore
reducing feed intake and growth performance. Dietary inclusion levels above an animal’s
requirement resulting from the over-formulation of nutrients, such as vitamin and mineral
premixes, may also disrupt the microflora and enteric ecosystem.
Vitamins are a chemically diverse group of compounds that vary in their stability and
susceptibility to degradation by physical or chemical factors. The stability of individual vitamins
and nutrients in premixes and finished feeds varies due to a number of factors and exposure to
multiple factors generally amplifies the negative effects on vitamin or nutrient stability (Frye,
1994; Reddy and Love, 1999). Premix composition affects vitamin stability as well, especially
with regard to the presence of inorganic trace minerals, since these compounds can be highly

78
reactive with vitamins and reduce their bioavailability (Frye, 1994). Likewise, the processes used
in feed conditioning and manufacturing affect vitamin activity as well. Both pelleting and
extrusion reduce vitamin bioactivity, with the severity of degradation depending on the amount
of heat and pressure applied to the feed (Reddy and Love, 1999). Besides stability, other factors
considered in the development of animal feed additive products are bioavailability, uniform
nutrient activity within the product, and optimal handling and mixing characteristics such as high
flowability, low dusting, low hygroscopicity and caking, and minimal segregation (Frye, 1994).
These characteristics are especially important but often overlooked with vitamins because these
essential nutrients are normally only added in small amounts to livestock diets. If these products
do not handle well at feed mills, they can be poorly dispersed in the feed where the presence or
absence of the nutrients in individual rations can affect animal performance and health.
Encapsulation is a process where particles of a bioactive substance are protected from their
environment by inclosing them in a protective barrier or coating material. Coating, or wall,
materials can be comprised of various fats, waxes, carbohydrates and polysaccharides, proteins,
and synthetic compounds. Encapsulated products are often designed to release the core nutrients
through different mechanisms, depending on the environmental conditions like pH or
temperature or after a certain time or duration. For example, coating materials can be designed to
dissolve slowly or quickly when a particular pH is reached in the enteric lumen, or when they are
exposed to the complementary digestive enzymes within the digestive tract of an animal
(Poshadri and Kuna, 2010). Encapsulation allows animal feed additive manufacturers to achieve
an effective balance between stability and efficacy of bioactive nutrients and thus improve
product bioavailability. Lipid matrix encapsulation technology is designed to present bioactive
compounds, like vitamins and minerals, to the enteric ecosystem at concentrations and release
79
rates that are more compatible with enteric microflora and absorptive capacity of the animal’s
enteric mucosa, thus avoiding an off-balance of microflora (Ferket et al., 2017).
The specific encapsulation technique used for the vitamin and minerals in this manuscript
is detailed in U.S. Patent WO2018089516 “Encapsulation of nutritional and/or compounds for
controlled release and enhancing their bioavailability by limiting chemical or microbial
exposure” (Ferket et al., 2017). The patent specifics include “a controlled release lipid matrix
consisting of at least one hydrogenated vegetable triglyceride selected from the group consisting
of palm butter, sunflower oil, corn oil, rape oil, peanut oil and soybean oil; or at least one animal
triglyceride selected from the group consisting of bovine tallow and swine lard; and one or more
nutrients encapsulated within the controlled release lipid matrix, wherein each of the one or more
nutrients is selected from the group consisting of a vitamin, a mineral, and an amino acid”
(Ferket et al., 2017). Additionally, core materials may consist of “one or more vitamins selected
from the group consisting of vitamin A, vitamin E, vitamin D3, vitamin C, vitamin K, vitamin B1
(thiamin), vitamin B2 (riboflavin), vitamin B3 (niacin), choline, vitamin B5 (pantothenic acid),
vitamin B6 (pyridoxine), biotin, inositol, vitamin B9 (folic acid), vitamin B10 (para amino benzoic
acid), vitamin B12 (cyano-cobalamin), and beta-carotene; one or more minerals selected from the
group consisting of cobalt, copper, selenium, iodine, iron, manganese, magnesium, sulfur, zinc,
calcium, sodium, potassium, and phosphorus; or one or more amino acids selected from the
group consisting of alanine, arginine, asparagine, aspartic acid, cysteine, glutamine, glutamic
acid, glycine, histidine, isoleucine, lysine, methionine, phenylalanine, proline, serine, threonine,
tryptophan, tyrosine, and valine; and combinations thereof” (Ferket et al., 2017).
Studies have been done evaluating the effects of vitamin and/or mineral premix
withdrawal during the grower or finisher periods of broiler production. No literature exists
80
exploring the effects of vitamin and mineral premix reduction combined with premix form
(encapsulated or not) on broiler growth performance and important production traits. Lipid
encapsulation of vitamins and trace minerals for controlled release would enhance nutrient
bioavailability and could permit lower dietary inclusion levels by limiting chemical or microbial
exposure. Our objective was to determine the effect of reduced inclusion levels of free and lipid
matrix encapsulated vitamin and trace mineral premixes on the production traits and enteric
health of broiler chickens. It was hypothesized that lipid matrix encapsulation of vitamin and
mineral premixes will limit product degradation and allow for reduced dietary inclusion levels
throughout the starter, grower and finisher periods of broiler production.
MATERIALS AND METHODS
Experimental Design
Two experiments were conducted in which free or lipid-matrix encapsulated vitamin and
trace mineral (VM) premixes were included at 100% of Aviagen (2014) recommended dietary
levels for Ross 708 broiler chickens or included at 40% or 30% (a 60% or 70% reduction in trials
1 and 2, respectively) or combinations thereof to make 6 total dietary treatments. The two
experimental free vitamin and free trace mineral premixes were formulated to meet the Ross 708
recommendations for vitamins and minerals, if added at 0.2% of the complete feed. The free VM
premixes were encapsulated in a hydrogenated vegetable oil to produce the lipid matrix
encapsulated VM premixes. Included in the diet at Aviagen recommended levels, these free and
lipid matrix encapsulated premixes represent the 100% treatment level in both trials. Feed for
both trials was manufactured by the North Carolina State University Feed Mill. As demonstrated
in tables 3 and 6, the hydrogenated vegetable fat source and amount was the same for all diets in
both trials. The treatment diets were formulated to be isocaloric and the diets containing free

81
premixes had hydrogenated oil flakes added to the diet in addition to the premixes. In trial 1
birds were fed mash feed. In trial 2 feed was pelleted (crumbled for the starter) with a
conditioning temperature of approximately 170oF. There were no differences in pellet durability,
pelleting temperature, conditioner retention time or storage environment for any treatments.
Trial 1. In the first trial, 300 tagged male Ross 708 broiler chicks were randomly
assigned to one of six dietary treatments, outlined in Table 1, and distributed among 12 floor
pens with 25 birds per pen and 2 pens per treatment. All birds were challenged with a
commercial recommended dose of coccidia vaccine at placement. Birds were fed a corn-soybean
meal three-phase diet: starter from 1-14 days, grower from 15-28 days, and finisher from 29-42
days of age (Table 2) and had access to feed and water ad libitum. Descriptions of the vitamin
and mineral supplementation levels of the free and lipid matrix encapsulated premixes for each
experimental treatment are shown in Table 3. Individual body weights and feed intake from each
pen were recorded at 7, 14, 21, 28 and 42 days of age. Mortality rate was observed daily, used to
adjust pen feed conversion ratio data. Histology samples of the jejunum mucosa were collected
on days 28 and 42 and analyzed for changes in villi and crypt height and depth. Microbiome
samples from the ceca were collected on day 42 and sent to the UNC Microbiome Center for 16s
RNA analysis.
Trial 2. In the second trial, 1,152 tagged male Ross 708 chicks were randomly assigned
to 36 floor pens (32 birds/pen) and 1,152 tagged female Ross 708 chicks were randomly assigned
to another 36 floor pens in the same house. Each pen was assigned to one of six dietary
treatments as outlined in Table 4, with 12 replicate pens (6 male, 6 female) per treatment.
Description of the vitamin and mineral supplementation levels of each treatment are shown in
Table 6. Each pen had used litter from the previous flock, and all birds were challenged with a
82
commercial recommended dose of coccidia vaccine at placement. The basal corn-soybean meal
diets were formulated to meet the requirements for Ross 708 broilers as recommended by
Aviagen for the starter (1-14d), grower (15-28d), and finisher (29-42d) periods (Table 5). Pen
weight and feed consumption was recorded on days 14, 28 and 42, and individual body weights
were recorded at day 42. On day 28, shank skin color was measured using a Minolta colorimeter
(L*, a*, b* values).
On day 49, five birds per pen representing the mean body weight +/- ½ standard
deviation were selected from treatments 1, 2, and 5 for slaughter and carcass cut up yield and
meat quality measurements. Broilers were slaughtered and processed according to standard
commercial protocols and the eviscerated carcasses were chilled in ice until 4°C, where they
remained overnight. Shank and breast meat and skin color were determined by the Minolta
colorimeter (L, a*, b* values), and the major breast muscle was scored for white striping and
wooden breast. Paw quality (foot and hock ammonia lesion burn scores) was also recorded. The
left breast muscle was used to determine drip loss by hanging the piece of breast meat on a hook
in a sealed moisture impermeable bag or wrapped in a moisture-wicking pad.
Statistical Analyses
Growth performance data for trials 1 and 2 was run using a one-way ANOVA in JMP Pro
14. Tukey’s HSD was used to find differences in the means. The main effects and interaction
effects of the vitamin and mineral premix form (free versus lipid matrix encapsulated) and
premix supplementation level (100% versus 40% or 30%) on was determined using a factorial
ANOVA with only treatments 1, 2, 5 and 6 for trial 1growth performance and histology data, as
well as trial 2 growth performance data and day 28 shank color data. Day 49 processing data was
analyzed as a one-way ANOVA using Tukey’s HDS to find differences in the means and

83
Dunnett’s to find significant differences from the control (treatment 1). White stripping, wooden
breast and foot pad and hock ammonia burn scores are integer count data and were therefore
analyzed using the Generalized Linear Regression personality in JMP Pro 14 with a Poisson link
function. Drip loss data for days 0-7 were also analyzed using a 2x3 ANOVA of method
(standard bag or diaper) and treatment (100% free, 30% lipid matrix encapsulated or 30% free).
RESULTS
Trial 1
Growth Performance. Growth performance was evaluated at 7, 14, 21, 28 and 42 days of
age and analyzed using pen weights as the experimental unit. No significant treatment effects
were observed for feed intake, body weight or adjusted feed conversion ratio (FCR) during any
time period. A significant inclusion level effect was observed on day 28 pen body weight (Table
7), with the 60% reduced VM premix levels (included at only 40% of recommended levels)
resulting in a higher 28-day body weight than the 100% VM level treatments, regardless of form
(p=0.031). These differences were gone by day 42. Looking at the day 28 body weight data using
the individual bird weights as the experimental unit (Table 7.1), treatment 1 (100% free VM),
treatment 3 (100% free vitamin + 40% lipid encapsulated mineral) and treatment 4 (40% lipid
encapsulated vitamin + 100% free mineral) resulted in the lowest day 28 body weights. A
significant dietary treatment effect as well as premix form x inclusion level interaction was
observed on the body weight percent coefficient of variation (%CV) at 21 days (Table 8).
Treatment 1 (100% free VM), treatment 2 (100% lipid encapsulated VM) and treatment 6 (40%
free VM) had the highest %CV at 21 days of age but the differences did not continue through to
28 or 42 days. Interestingly, the 40% encapsulated diet (treatment 5) resulted in a significantly

84
lower %CV (15.21 vs 33.54) than the 100% encapsulated diet (treatment 2) (p=0.0177),
indicating that reducing and encapsulating VM levels may improve broiler growth variability.
Enteric Ecosystem. There was a significant dietary treatment effect on the villi tip width,
villi base width, and villi surface area at 28 days of age (Table 9), and a significant premix form
effect on villi tip width, crypt depth and surface area regardless of the level of supplementation,
indicating that lipid matrix encapsulation of the VM premixes significantly reduces villi surface
area during the starter and grower periods. Histology data is often quite variable, and
significance is typically reported with a higher p-value (a=0.10). Treatment 4 (40% lipid
encapsulated vitamin + 100% free mineral) consistently had the largest villi tip (p=0.0521) and
base width (p=0.0981) values, while treatment 5 (40% lipid encapsulated VM) consistently had
the lowest values. Regardless of supplementation level, encapsulated VM premixes resulted in a
smaller villi tip width and smaller villi surface area for days 28 and 42. Treatment 3 (100% free
vitamin + 40% lipid encapsulated mineral) resulted in a similar favorable response of reduced
villi tip width, crypt depth and surface area as the diets containing both lipid encapsulated
vitamins and minerals. There was a significant form effect (p<0.09) for villi tip width and villi
surface area at 42 days of age (Table 10). At the 100% supplementation level the lipid matrix
encapsulated VM premixes resulted in a larger villi tip width and surface area but at the 40%
level the lipid matrix encapsulated VM premixes resulted in smaller villi tip width and surface
area. There was a significant supplementation level effect (p<0.09) on day 42 villi surface area
with the 40% supplementation level diets resulting in a larger villi surface area than the 100%
level diets, regardless of VM premix form.
Table 11 illustrates the dietary treatment effects on the microbiota (Phylum) distribution
in the ceca of male Ross 708 broilers from trial 1 at 42 days of age. Due to the nature of the
85
microbiota data analysis and the way the samples were collected, phylum percentages can only
be compared relatively. The lipid matrix encapsulated VM premix diets resulted in a higher
Firmicute:Bacteroidetes ratio than the free VM premix diets, with a larger difference in
concentration at the 100% supplementation level. A high Firmicute:Bacteroidetes ratio is more
symbiotic with the chicken enteric ecosystem and is known to increase caloric utilization and
body weight and improve FCR (Wei et al., 2013). The lipid encapsulated premixes included at
100% (Treatment 2) resulted in the highest Firmicute:Bacteroidetes ratio (74.7% : 20.4%).
Treatment 5 (40% lipid encapsulated VM) had the next highest Firmicute proportion (63.7%).
Treatment 3 (100% free vitamin + 40% lipid encapsulated mineral) and treatment 4 (40% lipid
encapsulated vitamin + 100% free mineral) had the lowest Firmicute:Bacteroidetes ratios (45.1%
: 51.6% and 54.9% : 41.8%, respectively) with treatment 3 actually having a higher
Bacteroidetes concentration than Firmicutes.
Trial 2
Growth Performance. Because male and female broilers were raised in separate pens,
body weights, feed intake, and feed conversion ratios were determined by sex on days 14, 28 and
42. There were no significant dietary treatment effects observed among the male or female
broilers for feed intake, body weight or feed conversion ratio during any time period. Significant
factorial effects were observed for several key growth performance indicators among the male
broilers, specifically related to the form of VM premixes (free versus lipid matrix encapsulated)
and the supplementation level (100% or 30%) of VM premixes. There were no significant
premix form x inclusion level interaction effects observed on feed intake or body weight, but
three significant main effects were observed (Tables 12 and 13). A significant premix form effect
(p=0.04) was observed on day 28 feed intake with the free premix diets having higher intake than

86
the encapsulated diets. A premix level effect (p=0.02) was observed for day 42 feed intake with
the reduced diets resulting in lower intake. The lower feed intake in birds fed the lipid matrix
encapsulated VM premixes was not accompanied by a similar significant decrease in body
weight (Table 13), which indicates significant reduction in feed input costs. A significant premix
level effect (p=0.04) was observed for day 14 body weight, with the reduced inclusion level diets
having lower body weight (Table 13). Most notable is the dietary treatment effects on the overall
(0-42 day) feed conversion ratio (Table 14). Although there were no significant main effects of
VM premix supplementation level or form, a highly significant premix form x supplementation
level was observed. At the 100% level of VM premix supplementation, the lipid matrix
encapsulated VM premix improved adjusted feed conversion ratio (FCR) by an astounding 12
points (1.68 vs 1.56), whereas at the 30% supplementation level the free VM premix resulted in a
better FCR than the lipid matrix encapsulated VM premixes (1.59 vs 1.64). Treatment 5 (30%
lipid encapsulated VM) had a 4 point better FCR than the 100% free VM diet (treatment 1),
which was formulated to meet industry standard premix inclusion levels.
Processing. Because of the limited capacity to process a statistically relevant number of
animals, three treatments were evaluated for important processing traits: treatment 1 (100% free
VM), treatment 5 (30% lipid encapsulated VM), and treatment 6 (30% free VM). Since there
were no significant dietary treatment effects on body weight, carcass parts yield was expressed
as actual weights for carcass parts rather than as a percentage of the live weight or eviscerated
carcass. All cuts resulted in similar weights except the breast meat, the most valuable part of the
chicken, with the 30% level diets resulting in greater breast meat yield than the 100% level diets,
and encapsulation having little additional benefit (Table 15).

87
Shank color was recorded on day 28 from six birds per treatment (Table 16). No
significant differences were observed in the L* or b* values between treatments. A significant
treatment effect was observed on the a* values (p=0.0430). Birds fed treatment 3 (100% free
vitamin + 30% lipid encapsulated mineral) had significantly higher a* values (more red color)
than all other treatments, indicating that lipid matrix encapsulation of the trace minerals allows
for more red color expression in the shank during the grower period.
Paw quality was analyzed on day 49 for color changes in the shank as well as ammonia
burns on the footpad and hawk (Table 17). Significant differences were found in day 49 shank b*
measurements with the 30% free VM premixes, resulting in lower b* values than the 100% free
VM premixes with encapsulation adding little additional benefit. Although no significant
differences in hock or foot pad ammonia scores were observed, reducing the VM premix
inclusion level by 70% in the free form increased the hawk ammonia burn incidence. Lipid
matrix encapsulated VM premixes at 30% level actually resulted in the lowest incidence of hawk
burns, allowing for a possible decrease in VM premix inclusion levels that would not be feasible
with free VM premixes.
Breast skin and meat were analyzed using a Minolta colorimeter as well as subjective
palpation for white striping and wooden breast (Table 18). No significant differences were
identified with the breast skin color (Table 18.1). Significant treatment effects were observed for
breast meat a* and b*values. Both 30% level diets had a significantly higher b* value (more
yellow color) than the 100% free diet (p=0.0054). Treatment 5 (30% lipid encapsulated VM) had
a significantly higher a* value (more red color) than the other treatments processed. The increase
in a* and b* values indicates that the encapsulated premix allows for a more red and yellow
88
color to be expressed in the breast meat, which meets customer preference. White striping and
wooden breast scores were not different between treatments.
Breast meat drip loss analysis was performed via two techniques: the “standard” bag
technique (Table 19), in which breast meat was hung on a hook with a plastic bag surrounding it
to collect liquid that was lost from the meat; and the “diaper” technique (Table 20), in which
breast meat was surrounded by a moisture wicking pad to absorb liquid lost from the breast meat.
The first technique was used to determine drip loss from an industry standard method, while the
second was a new approach that would simulate prolonged packed storage and handling to
determine how well the breast meat would retain moisture. Using the standard bag method,
treatment 5 (30% lipid encapsulated VM) resulted in significantly less (>1% difference) percent
drip loss than both treatment 1 (100% free VM) and treatment 6 (30% free VM) from day 5-7
(p=0.0004) and day 0-7 (p=0.0007). Reducing the premix level had no effect on day 3-5 drip
loss, but at the reduced level the encapsulated premix had significantly less drip loss than the
30% free VM diet. No treatment effects were observed for day 0-3 drip loss using the standard
bag method. A similar moisture retention benefit was observed using the diaper method for drip
loss analysis. Percent drip loss from day 0-3, 3-5 and 0-7 was significantly reduced as the premix
inclusion level was reduced, but from day 5-7 the 100% free and 30% lipid matrix encapsulated
premixes had significantly less drip loss than the 30% free VM premix treatment. The “diaper”
method resulted in a higher percentage of drip loss than the bag method in general for all
treatments, likely because the moisture wicking pad drew water out of the breast meat more
aggressively, resulting in more percent moisture lost. Treatment 5 (30% lipid encapsulated VM)
resulted in the lowest percent drip loss from days 3-5, 5-7 and 0-7 for both techniques. Drip loss
data for day 0-7 were analyzed using a 2x3 ANOVA to determine the main effects and
89
interaction effects of method and treatment on drip loss (Table 21). There was a significant
interaction effect (p=0.0038) with the diaper method resulting in a higher percent moisture loss
than the bag method. Evidently, protecting the vitamin and mineral premixes in a hydrogenated
fat helped prevent meat tissue degradation during 7 days of storage and thus helped retain
moisture, which is a highly valuable trait for meat processors and value-added for breast meat
food products.
DISCUSSION
Trial 1. No significant treatment effects were observed for body weight intake or FCR in
treatment 1 and neither premix form nor inclusion level had much effect on bird growth
performance. An effect was observed on day 21 %CV, but this difference did not continue
subsequently. No data exists on evaluating the combined effects of premix inclusion level and
premix form on broiler growth and production traits. Studies that completely remove the vitamin
and/or minerals from the diet during the grower or finisher periods though had similar results.
Sayadi (2005) found that reduction or removal of trace mineral supplements from 21 to 35 days
caused no significant effect on growth performance, however, extension of this mineral
withdrawal from 21-42 days negatively affected weight gain and feed conversion ratio (Jafari
Sayadi et al., 2005). The results of that study are supported by the findings of similar studies
which found reduction of vitamins and/or trace minerals during the grower or finisher phase had
little to no effect on broiler growth (Skinner et al., 1992; Christmas et al., 1995; Durand and
Gernt, 1997). It is suggested that under a heat stress conditions, a bird's requirements for mineral
premix is higher than under normal conditions (Deyhim et al., 1995). The removal or reduction
of vitamin and mineral premixes from broiler formulations does not imply that these diets are
void of these essential nutrients. Even unfortified diets, especially those that contain animal

90
protein, may contain amounts of vitamins adequate to meet or even exceed the minimum
recommended requirements (Moravej et al., 2013). Interestingly, treatment 3 (100% free vitamin
+ 40% lipid encapsulated mineral) had one of the lowest %CV at day 21 and the lowest body
weight at day 28, while treatment 2 (100% lipid encapsulated VM) had the highest %CV at day
21 and one of the highest body weights at day 28. This is most likely due to the larger birds in
treatment 2 that are increasing the variability in bird size (%CV) at day 21 also increasing the
average body weight at day 28. The release of the vitamins and minerals incorporated in the lipid
matrix encapsulation depends on the lipase activity in the gut of the individual birds, so birds
with inefficient lipase enzyme activity would not be able to digest the nutrients as well for
absorption and would theoretically not grow as well. With a higher inclusion level (at the 100%
level) the growth difference between the birds who can efficiently break down the encapsulation
and access the nutrients and birds that cannot would be greater than at the 40% inclusion level
which may explain why treatment 2 (100% lipid encapsulated VM) consistently had a larger
%CV than all other treatments during the growing phases. The lipid matrix encapsulation
increases the particle size (dgw) of the vitamin and mineral premixes which reduces the particles
per gram in the final feed. When chicks are young they eat less feed and will consume less
vitamin and mineral particles with the encapsulated premixes. It is also noteworthy that broiler
chicks are often recovering from enteric disease challenges prior to 28 days of age and that early
enteric disease challenges increase variation in growth performance because any antigen
(pathogen or vaccination) that mounts an immune response will depress appetite (Ferket and
Gernat, 2006). Evidently, protecting vitamin and mineral premixes by lipid matrix encapsulation
reduces the adverse effects of enteric challenges on the variation of growth. Feeding lower levels

91
of vitamin and mineral premixes also prevents over supply of these nutrients to the enteric
ecosystem which favors better body weight gain during the early growth.
Jejunum mucosal histomorphology analysis is often used to evaluate enteric health.
Assessing mucosal histology at 28 days of age is particularly critical for broiler chickens because
this is soon after they recover from coccidiosis vaccine reactions and when they begin to
establish a stable enteric microflora. The jejunum is the section of the small intestine where most
of the nutrient absorption occurs and as mucosal distress increases, jejunum villus surface area
increases as a means to replenish the villi enterocytes that make up the absorptive part of the gut
lumen. Villus surface area also increases to maintain the body’s need for nutrient absorption in
situation of nutrient competition with the mucosal microflora (Collins and Badireddy, 2019).
Regardless of supplementation level, encapsulated VM premixes resulted in a smaller villi tip
width and smaller villi surface area on day 28. The encapsulation may be preventing mucosal
distress, specifically during the starter and grower phase at the high premix inclusion levels.
Treatment 3 (100% free vitamin + 40% lipid encapsulated mineral) resulted in a similar
favorable response of reduced villi tip width, crypt depth and surface area, suggesting that
commercially recommended levels of free minerals may cause significant distress to the jejunum
mucosa and that encapsulation of free mineral premixes reduces villi surface area.
The gut is a dynamic ecosystem consisting of microflora that compete with each other
and with the host animal, particularly in the lower intestine (ileum and ceca/colon). Enteric
microflora within the Firmicute phylum are generally synergetic with the host animal gut,
whereas Bacteroidetes, Tenericutes, and Proteiobacteria tend to be more competitive and
typically include pathogens that can cause enteric disease. Wei et al. (2013) found that the
predominance of Firmicutes documented in the chicken gut and was much greater than in the gut

92
of other domesticated food animals sampled. Moreover, the presence of Firmicutes was much
greater than that of Bacteroidetes, indicating that a higher Firmicute:Bacteroidetes population
ratio is more symbiotic with the gut ecosystem of the chicken (Wei et al., 2013). Of the 13
bacterial phyla identified in both chicken and turkey species, Firmicutes, Bacteroidetes, and
Proteobacteria were the largest phyla, accounting for more than 90% of all the sequences
(Wei et al., 2013). The coexistence of Bacteroidetes and Firmicutes in the gut implies
minimal competition for resources because of microflora cooperation or specialization (Ley et
al., 2006). The ratio of Firmicutes to Bacteroidetes is consistently associated with changes in
calorie intake, where a higher Firmicute population is linked to increase calorie absorption and
therefore obesity in humans (Gill et al., 2006). This is ideal for broilers though, in which calorie
utilization is necessary for maximal growth in their short grow-out period. Treatment 2 (100%
lipid encapsulated VM) had the greatest Firmicute phylum population and lowest Bacteroidetes
phylum population, by over 10% for both. Treatment 5 (30% lipid encapsulated VM) had the
next highest Firmicute phylum population, indicating that encapsulation seems to improve
symbiosis of the enteric environment. Treatment 3 (100% free vitamin + 40% lipid encapsulated
mineral) had the lowest Firmicute phylum population and highest Bacteroidetes phylum,
population by almost 10%, and actually had a higher Bacteroidetes:Firmicutes population ,
which is not symbiotic with the gut of broiler chickens. This could be a result of an over
supplementation of free vitamins in the gut. It is also interesting to note the decrease in
Proteobacteria between treatment 1 (100% free VM) and all other treatment groups. This
phylum contains multiple foodborne pathogens, suggesting that encapsulation and reduced
inclusion levels of vitamins and/or minerals could decrease the population of foodborne
pathogens in the gut of broiler chickens.

93
Trial 2. In the second trial that involved a 70% reduction in the dietary inclusion levels of
the premixes, there were no significant treatment effects on male or female broiler body weight
feed intake or FCR for any phase. These findings are similar to another study that used vitamin
and mineral premixes at 0, 25, 50, 75 and 100 percent of recommended levels: the researchers
concluded that the reduction of their premix by up to 50% did not have any adverse effect on
broiler chickens (Nilipour et al., 1994). In the male birds, feed intake for day 28 was less for the
encapsulated diets, whereas feed intake for day 42 was less for the free diets. Day 42 FCR for
treatment 2 (100% lipid encapsulated VM) was 12 points better than treatment 1 (100% free
VM) and 3 points better than treatment 6 (30% free VM). Even the lipid matrix encapsulated
vitamins and trace minerals included at 30% of industry standard (treatment 5) had a 4-point
better FCR than treatment 1. It can be inferred that the lipid matrix encapsulated vitamin and
trace mineral diets allow for improved nutrient utilization for converting feed to meat. This
indicates that lipid matrix encapsulation improves caloric and nutrient utilization, even when the
vitamins and trace minerals are supplemented at only 30% of the industry standard dose.
Carcass cut up yield, and pigmentation of skin and breast meat are important qualitative
characteristics that impact the economic value and consumer preference of poultry products. On
day 28, treatment 3 (100% free vitamin + 40% lipid encapsulated mineral) had a significantly
higher shank a* value (more red color) than all other diets. This indicates that encapsulation and
reduced dietary inclusion levels of mineral premixes allows for increased red color in the shank
during the growing period. Shank b* color (yellowness) at 42 days of age was lower with the
30% level of free VM as compared to the 100% industry standard levels, but shank b* values
were maintained in the 30% level implying that encapsulation remediated the negative effects of
shank color caused by reduced premix inclusion levels. Protection of vitamins and minerals by

94
hydrogenated fat encapsulation will help maintain carotenoid pigment absorption, which is
dependent on gut health and nutrient absorptive capacity. Boulianne and King (1995, 1998)
examined the biochemical properties associated with the occurrence of pale and dark colored
broiler breast fillets. The pale fillets had significantly greater lightness (L*) values, less redness
(a*), greater yellowness (b*), less total pigments, less myoglobin, less iron, but a higher pH
(Boulianne and King, 1995). The undesirable dark fillets had significantly greater total pigment,
myoglobin, iron, pH, and a* values and significantly lower L* values (Boulianne and King,
1998). Treatment 5 (30% lipid encapsulated VM) had a significantly higher breast meat a* value
than other treatments and both reduced premix level diets (treatments 5 and 6) had higher breast
meat b* values than the 100% free diet (treatment 1). Shank color and breast meat color were
improved (more red and yellow) by the lipid matrix encapsulated vitamins and minerals, even at
low dosage levels, indicating improved carotenoid pigment absorption and improved gut health.
In poultry, carotenoids in the feed are deposited in peripheral tissues and also into the egg yolk to
confer orange/yellow pigmentation, which is an important source of carotenoids, particularly
lutein, in the human diet and poor pigmentation in poultry can be an indication of poor health
(Moreno et al., 2016).
The main determinants of water holding capacity of breast meat muscle are pH and
protein denaturation (Puerto et al., 2016). Dark broiler breast fillets were found to have lower L*
values, higher muscle pH, higher percentages of marinade pick-up, higher amounts of retained
moisture, lower percentages of drip-loss, and lower percentages of cook-loss than light broiler
breast fillets, although tenderness values were not affected by color (Allen et al., 1998). In
general, as drip loss increases, L* values also increase with little effect on pH (Woelfel et al.,
2002). We did not see any dietary effects on the L* values of breast meat or skin, but significant

95
results were observed for drip loss using both techniques. Using the standard bag method to
measure breast meat drip loss, a significant reduction in drip loss was observed with the 30%
encapsulated diet (treatment 5) from day 0-7. This indicates that even at reduced inclusion levels,
encapsulation of VM improves the integrity of the breast meat and reduces moisture loss during
storage, a desirable trait for consumers. Using the diaper method to determine percent drip loss,
the reduced inclusion level diets (treatments 5 and 6) had significantly less moisture loss than
treatment 1 (100% Free VM) from day 0-7. This significant reduction in drip loss indicates
reduced oxidative damage of muscle tissues in birds fed lipid matrix encapsulated premixes at
reduced dietary inclusion levels and shows that the breast meat would retain more moisture
during storage, processing, and cooking. The results from the two different trips boss methods
suggest that the diaper method may actually be a quicker and easier way to estimate the potential
for breast meat moisture loss. With the standard bag method significant differences among
treatments were not seen until day 3-5 and the day 0-7 pattern of significance wasn’t apparent
until day 5-7, whereas with the diaper method the day 0-7 treatment differences were evident at
day 0-3. This indicates that the diaper method may aid in obtaining relevant trip loss data quicker
then with the standard bag method the diaper method may also be more representative of what
consumers experience in the store since chicken breasts are commonly package on moisture
absorbing pads.
CONCLUSIONS
In conclusion, protecting vitamin and mineral premixes by hydrogenated fat
encapsulation results in minimal growth performance changes. Lipid matrix encapsulation of
vitamin and trace mineral premixes does not adversely affect growth performance, but it may
improve enteric health or market value of poultry products regardless of dietary level, and
96
encapsulation also remediates the risk of lower dietary premix inclusion levels that would
otherwise be infeasible as free premix forms.

97
REFERENCES
Allen, C. D., D. L. Fletcher, J. K. Northcutt, and S. M. Russell. 1998. The Relationship of
Broiler Breast Color to Meat Quality and Shelf-Life. J. Poult. Sci. 77:361–366.
Boulianne, M., and A. J. King. 1995. Biochemical and color characteristics of skinless boneless
pale chicken breast meat. J. Poult. Sci. 74:1693–1698.
Boulianne, M., and A. J. King. 1998. Meat color and biochemical characteristics of unaccepted
dark-colored broiler chicken carcasses. J. Food Sci. 63:759–762.
Christmas, R. B., R. H. Harms, and D. R. Sloan. 1995. The absence of vitamins and trace
minerals and broiler performance. J. Appl. Poult. Res. 4:407–410.
Collins, J. T., and M. Badireddy. 2019. Anatomy, Abdomen and Pelvis, Small Intestine.
Deyhim, F., B. S. Stoecker, B. G. Adeleye, and R. G. Teeter. 1995. The effects of heat distress
environment, vitamin, and trace mineral supplementation on performance, blood
constituents, and tissue mineral concentrations in broiler chickens. J. Nutr. Res. 15:521–
526.
Durand, S. J., and A. G. Gernt. 1997. Effect of removal of vitamin-trace premix and
supplemental calcium and phosphorus from grower and finisher diets on broiler
performance. J. Poult. Sci. 76:28.
Ferket, P. R., J. Fontaine, and J.-D. Bunod. 2017. Encapsulation of nutritional and/or compounds
for controlled release and enhancing their bioavailability by limiting chemical or microbial
exposure.
Ferket, P. R., and A. G. Gernat. 2006. Factors That Affect Feed Intake of Meat Birds: A Review.
Int. J. Poult. Sci. 5:905–911.
Frye, T. M. 1994. The performance of vitamins in multicomponent premixes. Proc. Roche Tech.

98
Symp.
Gill, S. R., P. B. Eckburg, P. J. Turnbaugh, B. S. Samuel, J. I. Gordon, D. A. Relman, C. M.
Fraser-liggett, and K. E. Nelson. 2006. Metagenomic Analysis of the Human Distal Gut
Microbiome. Science (80-. ). 312:1355–1359.
Jafari Sayadi, A., B. Navidshad, A. Abolghasemi, M. Royan, and R. Seighalani. 2005. Effects of
dietary mineral premix reduction or withdrawal on broilers performance. Int. J. Poult. Sci.
4:896–899.
Ley, R. E., P. J. Turnbaugh, S. Klein, and J. I. Gordon. 2006. Human gut microbes associated
with obesity. Microb. Ecol. 444:1022–1023
Moravej, H., M. Alahyari-Shahrasb, A. Kiani, M. Bagherirad, and M. Shivazad. 2013. Effects of
different levels of vitamin premix in finisher diets on performance, immuno-competence
and meat lipid oxidation of chickens fed on corn-soybean meal. Vet. Res. Forum 4:13–18
Moreno, J. A., Díaz-Gómez, J., Nogareda, C., Angulo, E., Sandmann, G., Portero-Otin, M., …
Christou, P. (2016). The distribution of carotenoids in hens fed on
biofortified maize is influenced by feed composition, absorption, resource
allocation and storage. Scientific reports, 6, 35346. doi:10.1038/srep35346
Nilipour, A. H., R. Fabego, and B. D. Butcher. 1994. Determine the effect of withdrawing
various levels of vitamin and minerals from the broiler male finisher diets. J. Poult. Sci.
73:153.
Poshadri, A., and A. Kuna. 2010. Microencapsulation technology: A review. J. Res. ANGRAU
38:86–102
Puerto, M., A. Terevinto, A. Saadoun, R. Olivero, M. C. Cabrera, C. This, A. Marta, A.
Terevinto, A. Saadoun, R. Olivero, and M. Cristina. 2016. Effect of Different Sources of

99
Dietary Starch on Meat Quality , Oxidative Status and Glycogen and Lactate Kinetic in
Chicken pectoralis Muscle. 4:185–194.
Reddy, M. B., and M. Love. 1999. The Impact of Food Processing on the Nutritional Quality of
Vitamins and Minerals. Adv. Exp. Med. Biol. 459:99–106.
Skinner, J. T., A. L. Waldroup, and P. W. Waldroup. 1992. Effects of removal of vitamin and
trace mineral supplements from grower and finisher diets on live performance and carcass
composition of broilers. J. Appl. Poult. Res. 1:280–286.
Wei, S., M. Morrison, and Z. Yu. 2013. Bacterial census of poultry intestinal microbiome. J.
Poult. Sci. 92:671–683.
Woelfel, R. L., C. M. Owens, E. M. Hirschler, R. Martinez-Dawson, and A. R. Sams. 2002. The
characterization and incidence of pale, soft, and exudative broiler meat in a commercial
processing plant. J. Poult. Sci. 81:579–84

100
Table 1. Combinations of vitamin and trace mineral supplementation levels associated with each experimental treatment used in Trial 1
Treatment ID (Trial 1)
Vitamin Premix supplementation Mineral Premix Supplementation Level of
supplementation (%)
Form Level of
supplementation (%)
Form
1 100 Free 100 Free 2 100 Lipid matrix encapsulated 100 Lipid matrix encapsulated 3 100 Free 40 Lipid matrix encapsulated 4 40 Lipid matrix encapsulated 100 Free 5 40 Lipid matrix encapsulated 40 Lipid matrix encapsulated 6 40 Free 40 Free

101
Table 2. Formulated experimental treatment diets fed to Ross 708 Broilers in Trial 1
Ingredient Starter (day 1-14) Grower (day 15-28) Finisher (day 29-42)
(%) (%) (%) Corn 50.70 55.59 60.54
Soybean meal 40.65 35.41 30.04 Poultry fat 4.49 5.18 5.88 Limestone 1.37 1.25 1.15
Mono-Dicalcium phosphate 1.51 1.33 1.18 Salt NaCl 0.24 0.24 0.24
Soda bicarbonate 0.16 0.16 0.17 L-Lysine HCl 98% 0.17 0.17 0.18
DL-Methionine 99.0% 0.34 0.31 0.29 L-Threonine 98.5% 0.10 0.09 0.08
TEST PREMIX SPACE 0.20 0.20 0.20 Choline chloride 60% 0.07 0.07 0.07
Total 100.00 100.00 100.00

102
Table 3. Dietary levels of vitamins and trace minerals supplemented as free or lipid matrix encapsulated premixes in the experimental treatment diets and fed to Ross 708 Broilers in Trial 1
Experimental Treatments Used in Trial 1
Ingredients 1 2 3 4 5 6 Vitamin Premix1 Biologically activity of Nutrient Expressed as the Unit per kg of Complete Diet
Vitamin A Suppl. 1,000,000 IU/g 10,000 IU 10,000 IU 10,000 IU 4,000 IU 4,000 IU 4,000 IU Vitamin D3 Suppl. 500,000 ICU/g 4,500 ICU 4,500 ICU 4,500 ICU 1,800 ICU 1,800 ICU 1,800 ICU
Vitamin E Suppl. 500 IU/g 65 IU 65 IU 65 IU 26 IU 26 IU 26 IU Vitamin K3 MNB 43% 3 mg 3 mg 3 mg 1.2 mg 1.2 mg 1.2 mg
Thiamin Mononitrate 76.92% 2.5 mg 2.5 mg 2.5 mg 1.0 mg 1.0 mg 1.0 mg Riboflavin HCL 80% 6.5 mg 6.5 mg 6.5 mg 2.6 mg 2.6 mg 2.6 mg
Pyridoxine HCL 81.48% 3.2 mg 3.2 mg 3.2 mg 1.28 mg 1.28 mg 1.28 mg d-Ca Pantothenate 91% 18 mg 18 mg 18 mg 7.2 mg 7.2 mg 7.2 mg
Folic acid 99% 1.9 mg 1.9 mg 1.9 mg 0.95 mg 0.95 mg 0.95 mg Biotin 2% 0.18 mg 0.18 mg 0.18 mg 0.072 mg 0.072 mg 0.072 mg
Niacin 99% 60 mg 60 mg 60 mg 24 mg 24 mg 24 mg Vitamin B12 1% 0.017 mg 0.017 mg 0.017 mg 0.0068 mg 0.0068 mg 0.0068 mg
Hydrogenated Fat Encaps. 0 g 0.335 g 0 g 0.134 g 0.134 g 0 g Trace Mineral Premix1 Biologically activity of Nutrient Expressed as the Unit per kg of Complete Diet
EDDI, 79% I 0.95 mg 0.95 mg 0.38 mg 0.95 mg 0.38 mg 0.38 mg Ferrous Sulfate, 30% Fe 50 mg 50 mg 20 mg 50 mg 20 mg 20 mg Sodium Selenite, 45% Se 0.3 mg 0.3 mg 0.12 mg 0.3 mg 0.12 mg 0.12 mg
Zinc Oxide, 72% Zn 85 mg 85 mg 34 mg 85 mg 34 mg 34 mg Manganese Oxide, 60% Mn 85 mg 85 mg 34 mg 85 mg 34 mg 34 mg
Copper Sulfate, 25% Cu 10 mg 10 mg 4 mg 10 mg 4 mg 4 mg Hydrogenated Fat Encaps. 0 g 0.532 g 0.213 g 0 g 0.213 g 0 g
Other Ingredients Grams per Kg of Complete Diet Hydrogenated Veg. Fat1 0.867 0 0.335 0.213 0 0.347
Vermiculite carrier 0.400 0.400 0.320 0.320 0.160 0.160
1Hydrogenated vegetable oil was added on the vermiculite carrier in the free vitamin or mineral premixes to equate the amount of hydrogenated vegetable fat used to encapsulate the vitamins
and minerals in the lipid matrix encapsulated premixes.
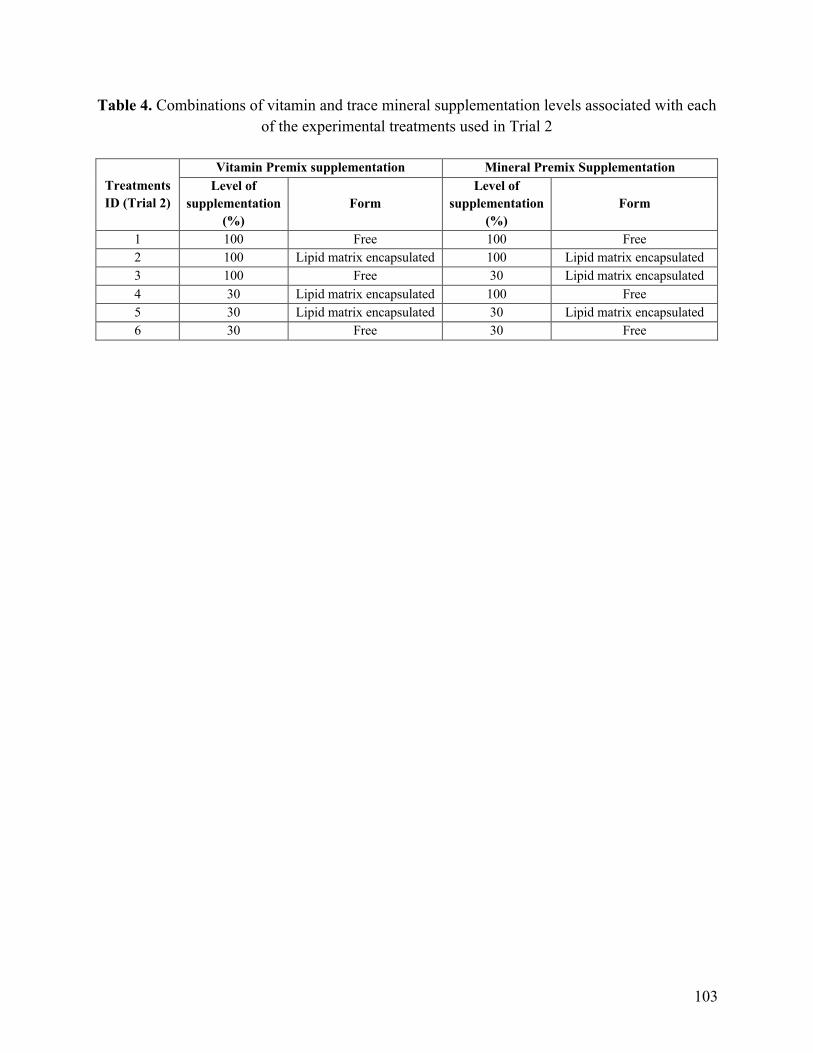
103
Table 4. Combinations of vitamin and trace mineral supplementation levels associated with each of the experimental treatments used in Trial 2
Treatments ID (Trial 2)
Vitamin Premix supplementation Mineral Premix Supplementation Level of
supplementation (%)
Form Level of
supplementation (%)
Form
1 100 Free 100 Free 2 100 Lipid matrix encapsulated 100 Lipid matrix encapsulated 3 100 Free 30 Lipid matrix encapsulated 4 30 Lipid matrix encapsulated 100 Free 5 30 Lipid matrix encapsulated 30 Lipid matrix encapsulated 6 30 Free 30 Free

104
Table 5. Formulated experimental treatment diets fed to Ross 708 Broilers in Trial 2
Ingredient Starter (day 1-14) Grower (day 15-28) Finisher (day 29-42)
(%) (%) (%) Corn 54.443 59.333 64.258
Soybean meal 40.011 34.773 29.421 Poultry fat 1.854 2.549 3.249 Limestone 1.315 1.195 1.093
Mono-Dicalcium phosphate 1.022 0.842 0.687 Salt NaCl 0.235 0.237 0.233
Soda bicarbonate 0.165 0.164 0.171 L-Lysine HCl 98% 0.183 0.177 0.188
DL-Methionine 99.0% 0.338 0.308 0.283 L-Threonine 98.5% 0.104 0.087 0.078
TEST PREMIX SPACE 0.200 0.200 0.200 Quantum Blue Phytase1 0.015 0.015 0.015 JEFO Enzyme Blend2 0.050 0.050 0.050 Choline chloride 60% 0.067 0.070 0.074
Total 100.000 100.000 100.000 1Phytase concentration (2,500 FTU/kg)
2Product containing dried extracted Streptomyces fermentation solubles, dried Bacillus subtillis fermentation extract, and dried Aspergillus niger fermentation extract

105
Table 6. Dietary levels of vitamins and trace minerals supplemented as free or lipid matrix encapsulated premixes in the experimental treatment diets and fed to Ross 708 Broilers in Trial 2
Experimental Treatments Used in Trial 2
Ingredients 1 2 3 4 5 6 Vitamin Premix1 Biologically activity of Nutrient Expressed as the Unit per kg of Complete Diet
Vitamin A Suppl. 1,000,000 IU/g 10,000 IU 10,000 IU 10,000 IU 3,000 IU 3,000 IU 3,000 IU Vitamin D3 Suppl. 500,000 ICU/g 4,500 ICU 4,500 ICU 4,500 ICU 1,350 ICU 1,350 ICU 1,350 ICU
Vitamin E Suppl. 500 IU/g 65 IU 65 IU 65 IU 19.5 IU 19.5 IU 19.5 IU Vitamin K3 MNB 43% 3 mg 3 mg 3 mg 0.9 mg 0.9 mg 0.9 mg
Thiamin Mononitrate 76.92% 2.5 mg 2.5 mg 2.5 mg 0.75 mg 0.75 mg 0.75 mg Riboflavin HCL 80% 6.5 mg 6.5 mg 6.5 mg 1.95 mg 1.95 mg 1.95 mg
Pyridoxine HCL 81.48% 3.2 mg 3.2 mg 3.2 mg 0.96 mg 0.96 mg 0.96 mg d-Ca Pantothenate 91% 18 mg 18 mg 18 mg 5.4 mg 5.4 mg 5.4 mg
Folic acid 99% 1.9 mg 1.9 mg 1.9 mg 0.57 mg 0.57 mg 0.57 mg Biotin 2% 0.18 mg 0.18 mg 0.18 mg 0.054 mg 0.054 mg 0.054 mg
Niacin 99% 60 mg 60 mg 60 mg 18 mg 18 mg 18 mg Vitamin B12 1% 0.017 mg 0.017 mg 0.017 mg 0.0051 mg 0.0051 mg 0.0051 mg
Hydrogenated Fat Encaps. 0 g 0.335 g 0 g 0.100 g .100 g 0 g Trace Mineral Premix1 Biologically activity of Nutrient Expressed as the Unit per kg of Complete Diet
EDDI, 79% I .95 mg .95 mg 0.285 mg .95 mg 0.285 mg 0.285 mg Ferrous Sulfate, 30% Fe 50 mg 50 mg 15 mg 50 mg 15 mg 15 mg Sodium Selenite, 45% Se 0.3 mg 0.3 mg 0.09 mg 0.3 mg 0.09 mg 0.09 mg
Zinc Oxide, 72% Zn 85 mg 85 mg 25.5 mg 85 mg 25.5 mg 25.5 mg Manganese Oxide, 60% Mn 85 mg 85 mg 25.5 mg 85 mg 25.5 mg 25.5 mg
Copper Sulfate, 25% Cu 10 mg 10 mg 3 mg 10 mg 3 mg 3 mg Hydrogenated Fat Encaps. 0 g 0.532 g 0.160 g 0 g 0.160 g 0 g
Other Ingredients Grams per Kg of Complete Diet Hydrogenated Veg. Fat1 0.867 0 0.335 0.532 g 0 0.260 g
Vermiculite carrier 0.400 0.400 0.290 0.290 0.120 0.120
1Hydrogenated vegetable oil was added on the vermiculite carrier in the free vitamin or mineral premixes to equate the amount of hydrogenated vegetable fat used to encapsulate the vitamins
and minerals in the lipid matrix encapsulated premixes.

106
Table 7. Effect of dietary level and form of vitamin and mineral premix supplementation on pen body weight (kg) of Male Ross 708 boiler chickens (Trial 1)2
Treatment Day 7 Day 14 Day 21 Day 28 Day 42
1) 100% Free V M 0.126 0.343 0.721 1.229 2.698 2) 100% Encap. V M 0.133 0.344 0.689 1.287 2.733
3) 100% Free V + 40% Encap. M 0.133 0.354 0.698 1.166 2.618 4) 40% Encap. V + 100% Free M 0.126 0.339 0.736 1.246 2.747
5) 40% Encap. V M 0.130 0.338 0.752 1.293 2.632 6) 40% Free V M 0.132 0.346 0.726 1.314 2.787 P value (a = 0.05) 0.1264 0.8550 0.7240 0.4383 0.9192
Source of Variation1 ---------------------- (P-value) ------------------- Premix Form (Free vs Encapsulated) 0.41 0.75 0.75 0.85 0.67
Premix Level (100% vs 40%) 0.59 0.9 0.9 0.031 0.96 Level X Form 0.19 0.72 0.72 0.25 0.51
SEM+ 0.0015 0.006 0.006 0.009 0.07
1Source of Variation is described for the factorial analysis of 2 premix forms (Free and Encapsulated) X 2 premix levels (100 and 40%), from data presented by treatments 1, 2, 5, and 6
2standard error of the mean (SEM) for n=2 pens
Table 7.1. Effect of diet on individual body weight (kg) of Male Ross 708 boiler chickens on day 28 (Trial 1)1
Treatment Day 28
1) 100% Free V M 1.228ab ± 0.03 2) 100% Encap. V M 1.302a ± 0.03
3) 100% Free V + 40% Encap. M 1.149b ± 0.03 4) 40% Encap. V + 100% Free M 1.243ab ± 0.03
5) 40% Encap. V M 1.320a ± 0.03 6) 40% Free V M 1.300a ± 0.03 P value (a = 0.05) 0.0015
1standard deviations (mean ± standard deviation) are for n=25 birds/pen

107
Table 8. Effect of dietary level and form of vitamin and mineral premix supplementation on % coefficient of variation (%CV) of body weight (kg) of Male Ross 708 boiler chickens (Trial 1)2
Treatment Day 7 Day 14 Day 21 Day 28 Day 42
1) 100% Free V M 17.42 24.22 21.89ab 19.21 14.00 2) 100% Encap. V M 18.56 23.26 33.54a 22.45 15.59
3) 100% Free V + 40% Encap. M 13.74 14.46 14.78b 14.81 11.81 4) 40% Encap. V + 100% Free M 15.62 19.31 17.61b 16.48 10.86
5) 40% Encap. V M 14.74 16.84 15.21b 13.33 10.07 6) 40% Free V M 15.86 19.78 23.60ab 19.07 14.07 P value (a = 0.05) 0.24 0.3606 0.0177 0.1668 0.6185
Source of Variation1 ------------------------- (P-value) ---------------------- Premix Form (Free vs Encapsulated) 0.09 0.21 0.051 0.13 0.42
Premix Level (100% vs 40%) 1.00 0.62 0.62 0.64 0.71 Level X Form 0.41 0.80 0.03 0.14 0.41
SEM+ 0.61 1.82 1.51 1.22 1.50
1Source of Variation is described for the factorial analysis of 2 premix forms (Free and Encapsulated) X 2 Premix levels (100 and 40%), from data presented by treatments 1, 2, 5, and 6
2standard error of the mean (SEM) for n=2 pens
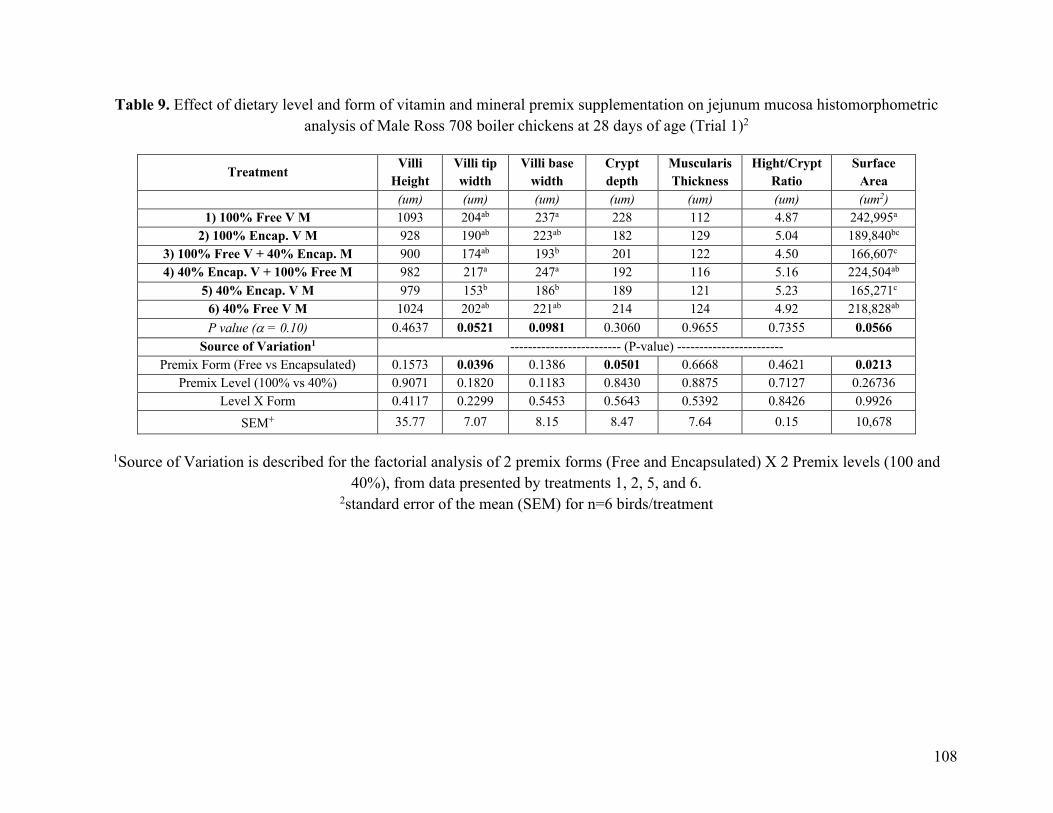
108
Table 9. Effect of dietary level and form of vitamin and mineral premix supplementation on jejunum mucosa histomorphometric
analysis of Male Ross 708 boiler chickens at 28 days of age (Trial 1)2
Treatment Villi
Height Villi tip width
Villi base width
Crypt depth
Muscularis Thickness
Hight/Crypt Ratio
Surface Area
(um) (um) (um) (um) (um) (um) (um2) 1) 100% Free V M 1093 204ab 237a 228 112 4.87 242,995a
2) 100% Encap. V M 928 190ab 223ab 182 129 5.04 189,840bc
3) 100% Free V + 40% Encap. M 900 174ab 193b 201 122 4.50 166,607c
4) 40% Encap. V + 100% Free M 982 217a 247a 192 116 5.16 224,504ab
5) 40% Encap. V M 979 153b 186b 189 121 5.23 165,271c
6) 40% Free V M 1024 202ab 221ab 214 124 4.92 218,828ab
P value (a = 0.10) 0.4637 0.0521 0.0981 0.3060 0.9655 0.7355 0.0566 Source of Variation1 ------------------------- (P-value) ------------------------
Premix Form (Free vs Encapsulated) 0.1573 0.0396 0.1386 0.0501 0.6668 0.4621 0.0213 Premix Level (100% vs 40%) 0.9071 0.1820 0.1183 0.8430 0.8875 0.7127 0.26736
Level X Form 0.4117 0.2299 0.5453 0.5643 0.5392 0.8426 0.9926
SEM+ 35.77 7.07 8.15 8.47 7.64 0.15 10,678
1Source of Variation is described for the factorial analysis of 2 premix forms (Free and Encapsulated) X 2 Premix levels (100 and
40%), from data presented by treatments 1, 2, 5, and 6.
2standard error of the mean (SEM) for n=6 birds/treatment

109
Table 10. Effect of dietary level and form of vitamin and mineral premix supplementation on jejunum mucosa histomorphometric
analysis of Male Ross 708 boiler chickens at 42 days of age (Trial 1)2
Treatment Villi
Height Villi tip width
Villi base width
Crypt depth
Muscularis Thickness
High/Crypt Ratio
Surface Area
(um) (um) (um) (um) (um) (um) (um2) 1) 100% Free V M 1142 163b 187 181 170 6.27 200,932b
2) 100% Encap. V M 1132 196ab 232 174 178 6.55 242,251ab
3) 100% Free V + 40% Encap. M 1224 158b 181 228 172 5.61 202,743b
4) 40% Encap. V + 100% Free M 1254 230a 244 198 186 6.51 301,663a
5) 40% Encap. V M 1184 188ab 230 178 182 6.72 250,970ab
6) 40% Free V M 1381 221a 228 214 162 6.84 312,006a
P value (a = 0.10) 0.3396 0.0866 0.2220 0.2786 0.9804 0.6543 0.0717 Source of Variation1 ------------------------- (P-value) ------------------------
Premix Form (Free vs Encapsulated) 0.2589 0.9819 0.3260 0.1977 0.5184 0.8888 0.7648
Premix Level (100% vs 40%) 0.1162 0.2075 0.4071 0.2839 0.9088 0.5057 0.0803 Level X Form 0.3042 0.1004 0.3537 0.3935 0.8062 0.7127 0.1311
SEM+ 44.29 9.45 8.10 8.28 10.92 0.28 16,255
1Source of Variation is described for the factorial analysis of 2 premix forms (Free and Encapsulated) X 2 Premix levels (100 and
40%), from data presented by treatments 1, 2, 5, and 6.
2standard error of the mean (SEM) for n=6 birds/treatment

110
Table 11. Effect of dietary level and form of vitamin and mineral premix supplementation on ceca microbiota distribution of Male
Ross 708 boiler chickens at 42 days of age (Trial 1)
Percentage of Phylum Recovery per Treatment (D42)
Treatment
Phylum 1) 100% Free
V M
2) 100% Encap.
VM
3) 100% Free vit,
40% Encap. min
4) 40% Encap. vit,
100% free min
5) 40% Encap.
VM
6) 40% Free
VM
Firmicutes 59.679% 74.683% 45.105% 54.942% 63.736% 61.440% Bacteroidetes 35.204% 20.395% 51.639% 41.822% 32.718% 31.058%
Tenericutes 2.499% 2.665% 1.967% 1.796% 1.658% 5.113%
Unassigned;Other 0.229% 0.187% 0.192% 0.204% 0.060% 0.329%
Actinobacteria 0.131% 0.090% 0.094% 0.104% 0.091% 0.050%
Cyanobacteria 0.194% 0.215% 0.242% 0.170% 0.015% 0.295%
Proteobacteria 2.064% 1.766% 0.761% 0.958% 1.722% 1.714%
TM7 0.000% 0.000% 0.000% 0.004% 0.000% 0.000%

111
Table 12. Effect of dietary level and form of vitamin and mineral premix supplementation on feed intake (kg) of Male Ross 708 boiler chickens (Trial 2)2
Treatment Day 0-14 Day 0-28 Day 0-42
1) 100% Free V M 0.582 2.387 4.697 2) 100% Encap. V M 0.589 2.355 4.449
3) 100% Free V + 40% Encap. M 0.593 2.359 4.722 4) 40% Encap. V + 100% Free M 0.584 2.311 4.562
5) 40% Encap. V M 0.588 2.287 4.577 6) 40% Free V M 0.588 2.352 4.642 P value (a = 0.05) 0.8666 0.1492 0.1114
Source of Variation1 ------------------ (P value) ------------- Premix Form (Free vs Encapsulated) 0.72 0.04 0.58
Premix Level (100% vs 30%) 0.50 0.05 0.02 Level X Form 0.52 0.48 0.16
SEM+ 0.003 0.012 0.032
1Source of Variation is described for the factorial analysis of 2 premix forms (Free and Encapsulated) X 2 Premix levels (100 and 30%), from data presented by treatments 1, 2, 5, and 6
2standard error of the mean (SEM) for n=6 pens/treatment

112
Table 13. Effect of dietary level and form of vitamin and mineral premix supplementation on body weight (kg) of Male Ross 708 boiler chickens (Trial 2)2
Treatment Day 14 Day 28 Day 42
1) 100% Free V M 0.549 1.742 2.885 2) 100% Encap. V M 0.537 1.669 2.887
3) 100% Free V + 40% Encap. M 0.539 1.734 3.099 4) 40% Encap. V + 100% Free M 0.534 1.720 2.936
5) 40% Encap. V M 0.537 1.669 2.887 6) 40% Free V M 0.533 1.729 3.065 P value (a = 0.05) 0.4977 0.3891 0.0541
Source of Variation1 ------------------ (P value) --------- Premix Form (Free vs Encapsulated) 0.88 0.16 0.11
Premix Level (100% vs 30%) 0.04 0.21 0.12 Level X Form 0.42 0.34 0.06
SEM+ 0.003 0.013 0.024
1Source of Variation is described for the factorial analysis of 2 premix forms (Free and Encapsulated) X 2 Premix levels (100 and 30%), from data presented by treatments 1, 2, 5, and 6
2standard error of the mean (SEM) for n=6 pens/treatment

113
Table 14. Effect of dietary level and form of vitamin and mineral premix supplementation on Feed Conversion Ratio (Feed/Gain, adjusted for mortality) of Male Ross 708 boiler chickens
(Trial 2)2
Treatment Day 0-14 Day 0-28 Day 0-42
1) 100% Free V M 1.14 1.37 1.68 2) 100% Encap. V M 1.17 1.36 1.56
3) 100% Free V + 40% Encap. M 1.19 1.36 1.59 4) 40% Encap. V + 100% Free M 1.18 1.36 1.60
5) 40% Encap. V M 1.18 1.37 1.64 6) 40% Free V M 1.19 1.37 1.59 P value (a = 0.05) 0.4108 0.8764 0.0505
Source of Variation1 ------------------ (P value) --------- Premix Form (Free vs Encapsulated) 0.07 0.84 0.87
Premix Level (100% vs 30%) 0.50 0.54 0.18 Level X Form 0.29 0.45 0.007
SEM+ 0.008 0.006 0.013
1Source of Variation is described for the factorial analysis of 2 premix forms (Free and Encapsulated) X 2 Premix levels (100 and 40%), from data presented by treatments 1, 2, 5, and 6
2standard error of the mean (SEM) for n=6 pens/treatment
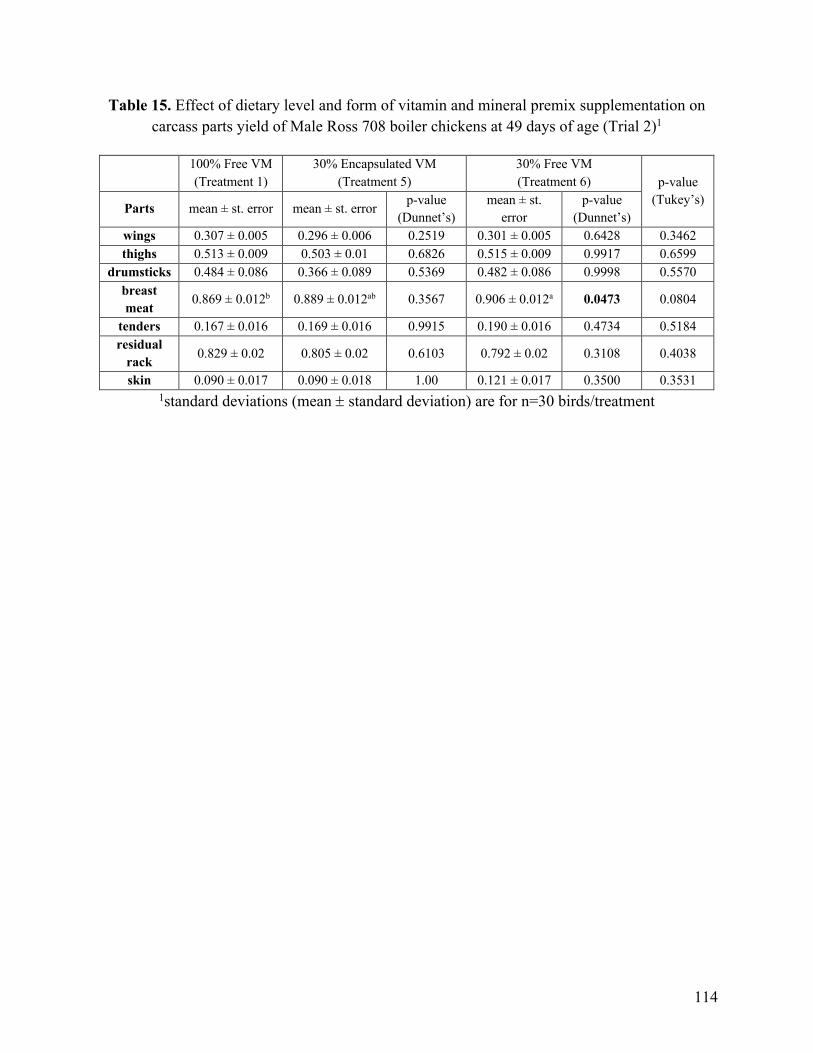
114
Table 15. Effect of dietary level and form of vitamin and mineral premix supplementation on carcass parts yield of Male Ross 708 boiler chickens at 49 days of age (Trial 2)1
100% Free VM (Treatment 1)
30% Encapsulated VM (Treatment 5)
30% Free VM (Treatment 6) p-value
(Tukey’s) Parts mean ± st. error mean ± st. error p-value
(Dunnet’s) mean ± st.
error p-value
(Dunnet’s) wings 0.307 ± 0.005 0.296 ± 0.006 0.2519 0.301 ± 0.005 0.6428 0.3462 thighs 0.513 ± 0.009 0.503 ± 0.01 0.6826 0.515 ± 0.009 0.9917 0.6599
drumsticks 0.484 ± 0.086 0.366 ± 0.089 0.5369 0.482 ± 0.086 0.9998 0.5570 breast meat
0.869 ± 0.012b 0.889 ± 0.012ab 0.3567 0.906 ± 0.012a 0.0473 0.0804
tenders 0.167 ± 0.016 0.169 ± 0.016 0.9915 0.190 ± 0.016 0.4734 0.5184 residual
rack 0.829 ± 0.02 0.805 ± 0.02 0.6103 0.792 ± 0.02 0.3108 0.4038
skin 0.090 ± 0.017 0.090 ± 0.018 1.00 0.121 ± 0.017 0.3500 0.3531 1standard deviations (mean ± standard deviation) are for n=30 birds/treatment
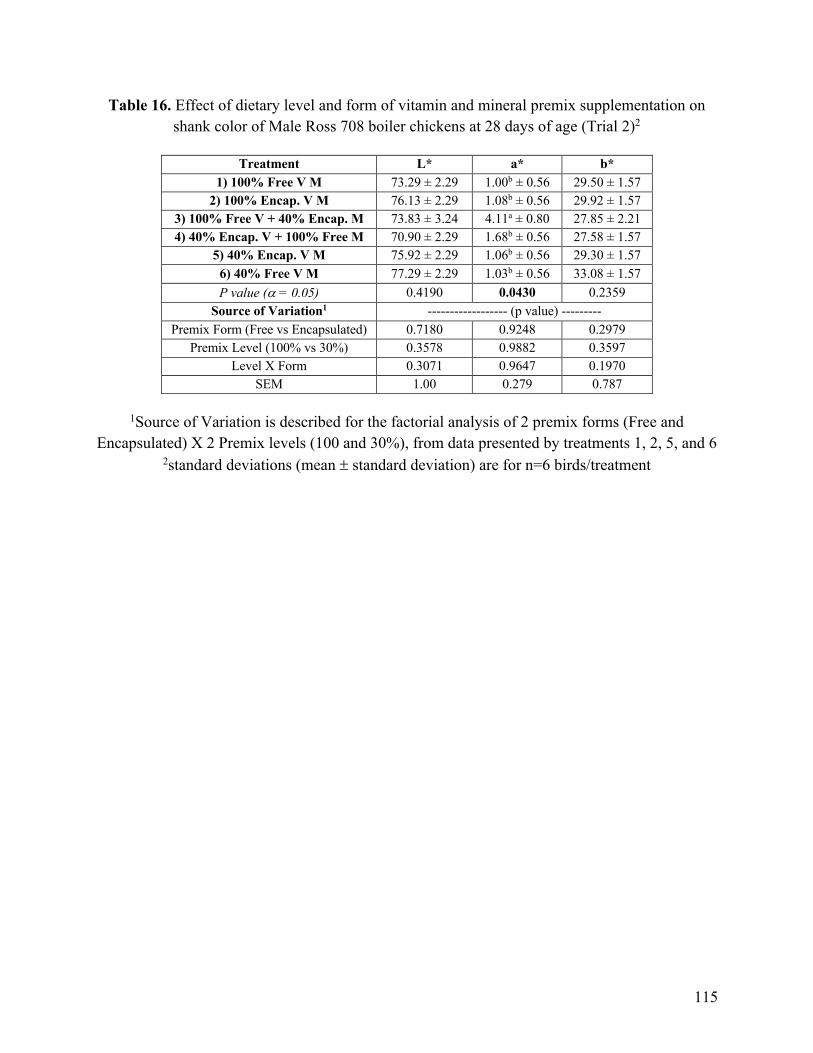
115
Table 16. Effect of dietary level and form of vitamin and mineral premix supplementation on shank color of Male Ross 708 boiler chickens at 28 days of age (Trial 2)2
Treatment L* a* b*
1) 100% Free V M 73.29 ± 2.29 1.00b ± 0.56 29.50 ± 1.57 2) 100% Encap. V M 76.13 ± 2.29 1.08b ± 0.56 29.92 ± 1.57
3) 100% Free V + 40% Encap. M 73.83 ± 3.24 4.11a ± 0.80 27.85 ± 2.21 4) 40% Encap. V + 100% Free M 70.90 ± 2.29 1.68b ± 0.56 27.58 ± 1.57
5) 40% Encap. V M 75.92 ± 2.29 1.06b ± 0.56 29.30 ± 1.57 6) 40% Free V M 77.29 ± 2.29 1.03b ± 0.56 33.08 ± 1.57 P value (a = 0.05) 0.4190 0.0430 0.2359
Source of Variation1 ------------------ (p value) --------- Premix Form (Free vs Encapsulated) 0.7180 0.9248 0.2979
Premix Level (100% vs 30%) 0.3578 0.9882 0.3597 Level X Form 0.3071 0.9647 0.1970
SEM 1.00 0.279 0.787
1Source of Variation is described for the factorial analysis of 2 premix forms (Free and Encapsulated) X 2 Premix levels (100 and 30%), from data presented by treatments 1, 2, 5, and 6
2standard deviations (mean ± standard deviation) are for n=6 birds/treatment

116
Table 17. Effect of dietary level and form of vitamin and mineral premix supplementation on shank color analysis of Male Ross 708 boiler chickens at 49 days of age (Trial 2)1
100% Free VM (Treatment 1)
30% Encapsulated VM (Treatment 5)
30% Free VM (Treatment 6) p-value
(Tukey’s) mean ± st. error mean ± st. error p-value
(Dunnet’s) mean ± st. error p-value (Dunnet’s)
L* 75.05 ± 0.38 75.24 ± 0.37 0.9179 75.56 ± 0.36 0.5276 0.6215 a* (-0.78) ± 0.24 (-0.38) ± 0.23 0.3815 (-0.77) ± 0.22 0.9995 0.3851 b* 38.38a ± 0.7 36.58ab ± 0.68 0.1182 35.09b ± 0.66 0.0016 0.0036 1standard deviations (mean ± standard deviation) are for n=30 birds/treatment

117
Table 18. Effect of dietary level and form of vitamin and mineral premix supplementation on breast meat color and myopathy (White stripping and wooden breasts) of Male Ross 708 boiler
chickens at 49 days of age (Trial 2)1
100% Free VM (Treatment 1)
30% Encapsulated VM (Treatment 5)
30% Free VM (Treatment 6) p-value
mean ± st. error mean ± st. error p-value (Dunnet’s) mean ± st. error p-value
(Dunnet’s) L* 63.75 ± 0.64 63.58 ± 0.65 0.9754 63.86 ± 0.64 0.9891 0.9535 a* 2.47 ± 0.32b 3.59 ± 0.32a 0.0264 2.44 ± 0.32b 0.9959 0.0163 b* 7.00 ± 0.45b 9.03 ± 0.46a 0.0040 8.57 ± 0.45a 0.0296 0.0054
White Striping 2.13 ± 0.12 2.20 ± 0.13 -- 2.30 ± 0.12 -- 0.6374
Wooden Breast 1.93 ± 0.12 2.10 ± 0.13 -- 2.07 ± 0.12 -- 0.6070
1standard deviations (mean ± standard deviation) are for n=30 birds/treatment
Table 18.1. Effect of dietary level and form of vitamin and mineral premix supplementation on
breast skin color of Male Ross 708 boiler chickens at 49 days of age (Trial 2)1
100% Free VM (Treatment 1)
30% Encapsulated VM (Treatment 5)
30% Free VM (Treatment 6) p-value
mean ± st. error mean ± st. error mean ± st. error L* 72.82 ± 0.50 71.38 ± 0.50 71.84 ± 0.5 0.0752 a* 4.76 ± 0.47 5.34 ± 0.46 4.93 ± 0.46 0.5995 b* 12.34 ± 0.63 13.55 ± 0.61 12.02 ± 0.62 0.8182
1standard deviations (mean ± standard deviation) are for n=30 birds/treatment

118
Table 19. Effect of dietary level and form of vitamin and mineral premix supplementation on breast meat drip loss percentage (standard bag method) of Male Ross 708 boiler chickens at 49
days of age (Trial 2)1
100% Free VM (Treatment 1)
30% Encapsulated VM (Treatment 5)
30% Free VM (Treatment 6) p-value
(Tukey’s) mean ± st. error mean ± st. error p-value (Dunnet’s) mean ± st. error p-value
(Dunnet’s) Drip loss %
day 0-3 2.09 ± 0.19 1.86 ± 0.19 0.5921 2.26 ± 0.19 0.7621 0.3310
Drip loss % day 3-5 0.33ab ± 0.11 0.14b ± 0.11 0.3409 0.59a ± 0.11 0.1524 0.0129
Drip loss % day 5-7 1.30a ± 0.19 0.21b ± 0.19 0.0002 0.92a ± 0.19 0.2753 0.0004
Drip loss % day 0-7 3.72a ± 0.32 2.21b ± 0.32 0.0021 3.77a ± 0.32 0.9901 0.0007
1standard deviations (mean ± standard deviation) are for n=30 birds/treatment

119
Table 20. Effect of dietary level and form of vitamin and mineral premix supplementation on breast meat drip loss percentage (diaper method) of Male Ross 708 boiler chickens at 49 days of
age (Trial 2)1
100% Free VM (Treatment 1)
30% Encapsulated VM (Treatment 5)
30% Free VM (Treatment 6) p-value
(Tukey’s) mean ± st. error mean ± st. error p-value (Dunnet’s) mean ± st. error p-value
(Dunnet’s) Drip loss %
day 0-3 6.77a ± 0.31 5.82b ± 0.31 0.0549 5.73b ± 0.31 0.0336 0.0321
Drip loss % day 3-5 3.75a ± 0.17 1.56b ± 0.17 <.0001 2.01b ± 0.17 <.0001 <.0001
Drip loss % day 5-7 0.68b ± 0.16 0.55b ± 0.16 0.7930 1.34a ± 0.16 0.0092 0.0016
Drip loss % day 0-7 11.20a ± 0.43 7.93b ± 0.43 <.0001 9.08b ± 0.43 0.0017 <.0001
1standard deviations (mean ± standard deviation) are for n=30 birds/treatment
Table 21. Effect of dietary treatment and drip loss analysis method on breast meat drip loss percentage of Male Ross 708 boiler chickens at 49 days of age (Trial 2)1
Treatment Method Day 0-7 drip loss (%)
100% Free Bag 3.01c ± 0.34
Diaper 11.20a ± 0.34 30% Lipid Matrix
Encapsulated Bag 1.73c ± 0.34
Diaper 7.93b ± 0.34
30% Free Bag 2.89c ± 0.34
Diaper 9.08b ± 0.34 p-value (treatment) <.0001 p-value (method) <.0001
p-value (treatment x method) 0.0038* 1standard deviations (mean ± standard deviation) are for n=30 birds/treatment

120
CHAPTER 4
Conclusion
121
CONCLUSION
Encapsulation is an effective solution for improving the hydration stability of animal
feed additives and premixes however it is not a perfect solution. Lipid matrix encapsulation
improves the hydration stability and flowability of vitamin and mineral premixes but comes with
some concerns such as storage and particle size.
The increase in compression score for the encapsulated premixes indicates that this
product may form solid cakes and lumps when exposed to pressure and therefore may not be
suitable for bagged storage, especially in hot and humid environments. Large tote bags or bins
may be better suited for storing this type of product in order to prevent lumping issues. Also,
lipid encapsulated premixes should not be stored in very hot environments because the incidence
of lumping could increase. Every feed mill is designed differently and therefore has to make
decisions differently but one of the main decision-making factors at all feed mills and during
feed formulation is cost. This is one reason why standard premixes are most commonly used.
They may not be prefect products, but they are relatively cheap and work well.
Another concern with the lipid encapsulated vitamin and mineral premixes is the
increase in particle size. Standard and free vitamin and mineral premixes have small particles
and therefore more particles per gram so small inclusion levels still result in efficient
dispersibility. Lipid matrix encapsulation increases the particle size of the premixes resulting in
less particles per gram. This could be a concern when dietary inclusion levels are being
dramatically reduced by 70% and especially during the starter phase or a broiler’s life when they
are eating very small amounts of feed. This may be a reason for the minor growth differences
that were observed in manuscript 2, especially in the starter and grower periods. If the
dispersibility of the premixes is poor, then birds (especially during the starter phase) will not all
122
be getting an equal amount of premix in the feed causing the percent coefficient of variation
(%CV) can increase within a pen. A solution to this could be to not reduce the dietary inclusion
levels of the premixes until after the starter period or find a way to reduce the particle size of the
product during product manufacturing.
The drip loss data that was produced from the second trial of manuscript 2 indicates
that there is the possibility to explore new and different drip loss analysis methods.
Encapsulation and a 70% reduction of vitamin and trace mineral premixes resulted in the lowest
percent drip loss, regardless of the method used for analysis. The data also shows that the diaper
method produced significant results at day 3 whereas the standard method did not produce
significant results until day 5. This means the diaper method could be used to determine the
relative percent drip loss of breast meat quicker than using the standard bag method.
Lipid matrix encapsulation of vitamin and trace mineral premixes is an effective
solution for improving general handling characteristics like hydration stability and flowability
but products should still be stored in appropriate environments. Encapsulation of premixes
increases the particle size of the products, resulting in reduced dispersibility, which should be
considered when determining the inclusion level of the products for the starter, grower and
finisher periods. Lipid encapsulation results in minimal growth performance changes and
improved breast muscle drip loss. There is also evidence from the data described in this thesis
that lipid encapsulation may improve feed conversion ratio, enteric microbe symbiosis and villi
health.