thermal-work strain and energy … · thermal-work strain and energy expenditure during marine...
TRANSCRIPT

TECHNICAL REPORT NO. T15-7
DATE August 2015
ADA
THERMAL-WORK STRAIN AND ENERGY EXPENDITURE
DURING MARINE RIFLE SQUAD OPERATIONS IN
AFGHANISTAN (AUGUST 2013)

24
DISCLAIMER
The opinions or assertions contained herein are the private views of the authors and are not to be construed as official or as reflecting the views of the Army or the Department of Defense. The investigators have adhered to the policies for protection of human subjects as prescribed in Army Regulation 70-25 and SECNAVINST 3900.39D, and the research was conducted in adherence with the provisions of 32 CFR Part 219. Citations of commercial organizations and trade names in this report do not constitute an official Department of the Army endorsement or approval of the products or services of these organizations.

USARIEM TECHNICAL REPORT T15-7
THERMAL-WORK STRAIN AND ENERGY EXPENDITURE DURING MARINE RIFLE
SQUAD OPERATIONS IN AFGHANISTAN (AUGUST 2013)
Alexander P. Welles1
Mark J. Buller1
Mark W. Richter2
Sean McCarthy2
Reed W. Hoyt1
1Biophysics and Biomedical Modeling Division, USARIEM
2Marine Expeditionary Rifle Squad, Marine Corps Systems Command
August 2015
U.S. Army Research Institute of Environmental Medicine
Natick, MA 01760-5007

Standard Form 298 (Rev. 8/98)
REPORT DOCUMENTATION PAGE
Prescribed by ANSI Std. Z39.18
Form Approved OMB No. 0704-0188
The public reporting burden for this collection of information is estimated to average 1 hour per response, including the time for reviewing instructions, searching existing data sources, gathering and maintaining the data needed, and completing and reviewing the collection of information. Send comments regarding this burden estimate or any other aspect of this collection of information, including suggestions for reducing the burden, to Department of Defense, Washington Headquarters Services, Directorate for Information Operations and Reports (0704-0188), 1215 Jefferson Davis Highway, Suite 1204, Arlington, VA 22202-4302. Respondents should be aware that notwithstanding any other provision of law, no person shall be subject to any penalty for failing to comply with a collection of information if it does not display a currently valid OMB control number. PLEASE DO NOT RETURN YOUR FORM TO THE ABOVE ADDRESS. 1. REPORT DATE (DD-MM-YYYY) 2. REPORT TYPE 3. DATES COVERED (From - To)
4. TITLE AND SUBTITLE 5a. CONTRACT NUMBER
5b. GRANT NUMBER
5c. PROGRAM ELEMENT NUMBER
5d. PROJECT NUMBER
5e. TASK NUMBER
5f. WORK UNIT NUMBER
6. AUTHOR(S)
7. PERFORMING ORGANIZATION NAME(S) AND ADDRESS(ES) 8. PERFORMING ORGANIZATION REPORT NUMBER
9. SPONSORING/MONITORING AGENCY NAME(S) AND ADDRESS(ES) 10. SPONSOR/MONITOR'S ACRONYM(S)
11. SPONSOR/MONITOR'S REPORT NUMBER(S)
12. DISTRIBUTION/AVAILABILITY STATEMENT
13. SUPPLEMENTARY NOTES
14. ABSTRACT
15. SUBJECT TERMS
16. SECURITY CLASSIFICATION OF: a. REPORT b. ABSTRACT c. THIS PAGE
17. LIMITATION OF ABSTRACT
18. NUMBER OF PAGES
19a. NAME OF RESPONSIBLE PERSON
19b. TELEPHONE NUMBER (Include area code)
10-08-2015 Technical Report 2013 - 2015
THERMAL-WORK STRAIN AND ENERGY EXPENDITURE DURING MARINE RIFLE SQUAD OPERATIONS IN AFGHANISTAN (AUGUST 2013).
Alexander P. Welles Mark J. Buller Mark W. Richter Sean McCarthy Reed W. Hoyt
Biophysics and Biomedical Modeling Division U.S. Army Research Institute of Environmental Medicine Building 42 - Kansas Street Natick, MA 01760
U.S. Army Medical Research and Materiel Command, Fort Detrick, MD 21702
Approved for public release; distribution unlimited
Marines in-theater must often accomplish demanding mission goals in extreme environments. The collection of physiological and metabolic data provides a means to characterize, and potentially mitigate, thermal-work strain. Heart rate (HR), core body temperature (Tcore), skin temperature (Tskin), activity counts, and average total daily energy expenditures (TDEE) were collected from 19 USMC test volunteers in the 2nd Battalion 2nd Marines (2/2), Fox Company during regular patrols as well as non-mission activities while stationed in Afghanistan. All mission periods occurred during white/green or yellow Wet Bulb Globe Temperature (WBGT) flag conditions. Test volunteers (n = 13) experienced low levels of thermal-work strain during missions as indicated by mean physiological strain index (PSI) values between 2.7 and 3.6 PSI units with a maximum of 4.6. The combination of combat load and mission demands resulted in a mean TDEE of 13.20 ± 1.41 MJ/day (3150 ± 630 kcal/day, mean ± standard deviation, n = 17) as determined by doubly labeled water (DLW) over four days. Metabolic rates for mission activities were back calculated using Tcore and environmental data as inputs for the SCENARIO thermo regulatory model Mean modeled TDEE values were 13 18 ±
metabolic rate;metabolic modeling; physiological monitoring; predictive modeling; thermoregulation
Unclassified Unclassified Unclassified Unclassified 35
Adam Potter
508-233-4735
Reset

iii
TABLE OF CONTENTS
Section Page
List of Figures ............................................................................................................... iv
List of Tables ................................................................................................................. v
Background .................................................................................................................. vi
Acknowledgments ....................................................................................................... vii
Executive Summary ................................................................................................... viii
Introduction .................................................................................................................. 1
Methods ....................................................................................................................... 2
Procedures ......................................................................................................... 2
Meteorological Conditions .................................................................................. 2
Mission Groups and Volunteers .......................................................................... 2
Clothing and Equipment Characteristics ............................................................. 3
Physiological Measures ..................................................................................... 3
Energy Expenditure – Doubly Labeled Water .......................................... 3
Thermal-Work Strain Physiological Parameters ...................................... 5
Activity Monitoring .................................................................................... 5
Metabolic Rate Estimation Using Thermoregulatory Model ................................ 5
Results .......................................................................................................................... 7
Meteorological Conditions .................................................................................. 7
Mission Groups and Test Volunteers .................................................................. 8
Clothing and Equipment Characteristics ............................................................. 9
Physiological Measures .................................................................................... 10
Metabolic Rate Estimation Using Thermoregulatory Model .............................. 16
Discussion ................................................................................................................... 22
Thermal-Work Strain ........................................................................................ 22
Metabolic Modeling and Estimation .................................................................. 22
Conclusions ................................................................................................................ 23
Disclaimer ................................................................................................................... 24
References ................................................................................................................. 25
iv
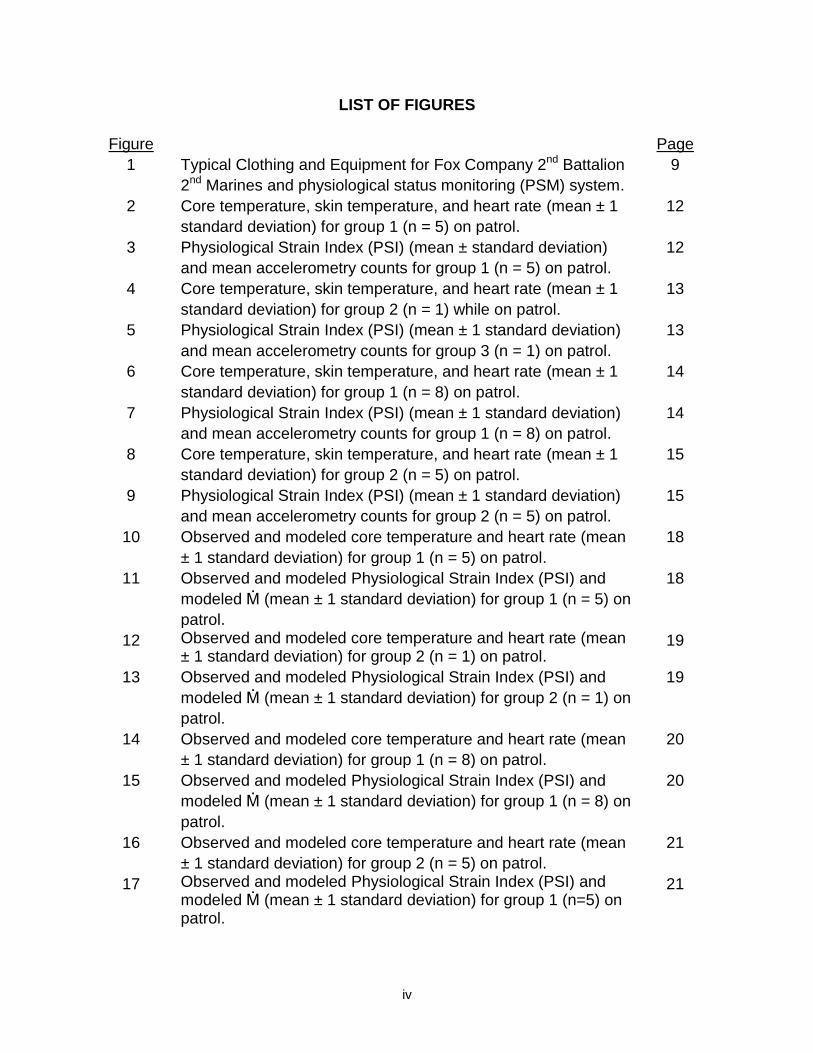
LIST OF FIGURES
Figure Page
1 Typical Clothing and Equipment for Fox Company 2nd Battalion
2nd Marines and physiological status monitoring (PSM) system.
9
2 Core temperature, skin temperature, and heart rate (mean ± 1
standard deviation) for group 1 (n = 5) on patrol.
12
3 Physiological Strain Index (PSI) (mean ± standard deviation)
and mean accelerometry counts for group 1 (n = 5) on patrol.
12
4 Core temperature, skin temperature, and heart rate (mean ± 1
standard deviation) for group 2 (n = 1) while on patrol.
13
5 Physiological Strain Index (PSI) (mean ± 1 standard deviation)
and mean accelerometry counts for group 3 (n = 1) on patrol.
13
6 Core temperature, skin temperature, and heart rate (mean ± 1
standard deviation) for group 1 (n = 8) on patrol.
14
7 Physiological Strain Index (PSI) (mean ± 1 standard deviation)
and mean accelerometry counts for group 1 (n = 8) on patrol.
14
8 Core temperature, skin temperature, and heart rate (mean ± 1
standard deviation) for group 2 (n = 5) on patrol.
15
9 Physiological Strain Index (PSI) (mean ± 1 standard deviation)
and mean accelerometry counts for group 2 (n = 5) on patrol.
15
10 Observed and modeled core temperature and heart rate (mean
± 1 standard deviation) for group 1 (n = 5) on patrol.
18
11 Observed and modeled Physiological Strain Index (PSI) and
modeled M (mean ± 1 standard deviation) for group 1 (n = 5) on
patrol.
18
12 Observed and modeled core temperature and heart rate (mean ± 1 standard deviation) for group 2 (n = 1) on patrol.
19
13 Observed and modeled Physiological Strain Index (PSI) and
modeled M (mean ± 1 standard deviation) for group 2 (n = 1) on
patrol.
19
14 Observed and modeled core temperature and heart rate (mean
± 1 standard deviation) for group 1 (n = 8) on patrol.
20
15 Observed and modeled Physiological Strain Index (PSI) and
modeled M (mean ± 1 standard deviation) for group 1 (n = 8) on
patrol.
20
16 Observed and modeled core temperature and heart rate (mean
± 1 standard deviation) for group 2 (n = 5) on patrol.
21
17 Observed and modeled Physiological Strain Index (PSI) and modeled M (mean ± 1 standard deviation) for group 1 (n=5) on patrol.
21
v
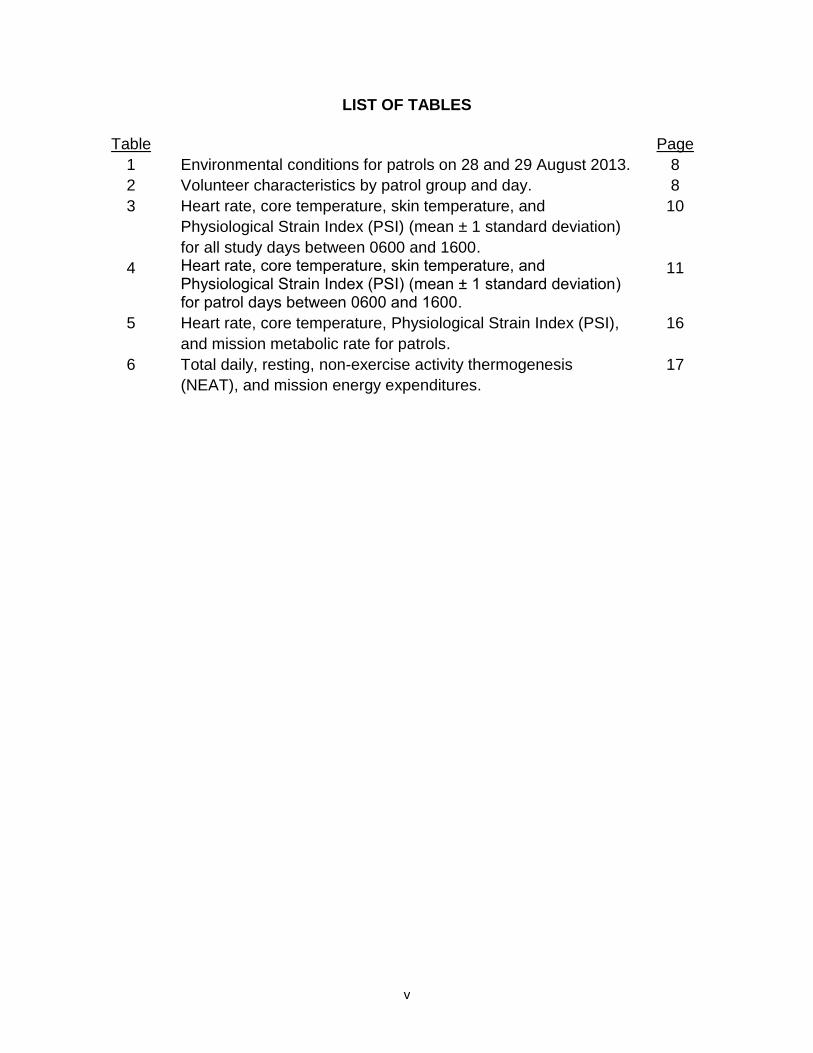
LIST OF TABLES
Table Page
1 Environmental conditions for patrols on 28 and 29 August 2013. 8
2 Volunteer characteristics by patrol group and day. 8
3 Heart rate, core temperature, skin temperature, and
Physiological Strain Index (PSI) (mean ± 1 standard deviation)
for all study days between 0600 and 1600.
10
4 Heart rate, core temperature, skin temperature, and Physiological Strain Index (PSI) (mean ± 1 standard deviation) for patrol days between 0600 and 1600.
11
5 Heart rate, core temperature, Physiological Strain Index (PSI),
and mission metabolic rate for patrols.
16
6 Total daily, resting, non-exercise activity thermogenesis
(NEAT), and mission energy expenditures.
17
vi
BACKGROUND
The United States Marine Corps (USMC) Marine Expeditionary Rifle Squad (MERS) and the U.S. Army Research Institute of Environmental Medicine (USARIEM) have conducted a series of in-theater equipment surveys and physiological data collections with Regimental Combat Teams (RCT) stationed in Iraq and Afghanistan. These studies focused primarily on thermal-work strain levels [4,19] recorded by ambulatory physiological status monitors. However, metabolic rates were not measured or were only roughly estimated. This report details the total daily energy expenditures and physiological profiles (heart rate, core temperature, and accelerometry counts) of Marines during two ten hour patrols on two separate days as well as their estimated average total daily energy expenditure over a four day period.

vii
ACKNOWLEDGMENTS
Special thanks to the test volunteers from the 2nd Battalion 2nd Marines Fox Company who made this study possible. The authors would also like to thank the 14th Weather Squadron for assistance with weather data collection and preparation and Mr. Anthony Karis for thermal manikin analysis of various Marine ensembles including the one used for data analysis in this report.
viii
EXECUTIVE SUMMARY
The purpose of this study was to characterize the thermal-work strain and total daily energy expenditures (TDEE) of Infantry Marines in Afghanistan. Additionally, we report a novel use of the SCENARIO physics and physiology based thermo-regulatory model to estimate metabolic rate from core body temperature.
Heart rate (HR), core body temperature (Tcore), skin temperature (Tskin), activity counts, and average total daily energy expenditures (TDEE) were collected from 19 USMC test volunteers in the 2nd Battalion 2nd Marines (2/2), Fox Company. The test volunteers were stationed at Patrol Base Boldak, Helmand Province, Afghanistan. Physiological data (HR, Tcore, and Tskin) were collected using the chest-worn Equivital-2 (Hidalgo Ltd., Cambridge UK) physiological status monitoring (PSM) system during regular patrols on the 28th and 29th as well as non-mission activities on the 30th and 31st of August 2013. The environmental conditions the Marines operated in were warm and dry with mean air temperatures (TA) between 33.6 ºC (92.5 ºF) and 34.0 ºC (93.2 ºF) and mean relative humidity (RH) between 9.3% and 11.6%. All mission periods occurred during white/green or yellow Wet Bulb Globe Temperature (WBGT) flag conditions. Test volunteers (n = 13) experienced low levels of thermal-work strain during missions as indicated by mean physiological strain index (PSI) values between 2.7 and 3.6 PSI units with a maximum of 4.6.
The combination of combat load and mission demands resulted in a mean TDEE of 13.20 ± 1.41 MJ/day (3150 ± 630 kcal/day, mean ± standard deviation, n = 17) as determined by doubly labeled water (DLW) over four days. Observed physiology and thermal-work strain data for mission and non-mission days were similar. Metabolic rates for mission activities were back calculated using Tcore and environmental data as inputs for the SCENARIO thermo-regulatory model. Mean modeled TDEE values were 13.18 ± 2.54 MJ/day (3160 ± 340 kcal/day) (n = 13), corresponding well to mean TDEE values measured by the criterion DLW method. However, the large standard deviation of percent error (-1.59 ± 18.58 %, -0.21 ± 2.49 MJ) suggests that this model of metabolic rate estimation may not be appropriate for individuals.
1
INTRODUCTION
Marines in-theater must often accomplish demanding mission goals in extreme environments. The risk of heat illness or heat injury is significant despite following heat injury prevention guidelines for water consumption and work rest scheduling [8,12,13,15]. The collection of physiological and metabolic data in-theater provides a means to characterize, and potentially mitigate, thermal-work strain.
Previously it has been shown that Marines on dismounted hot weather patrols in Iraq reached high levels of thermal-work strain by the end of a slow foot patrol [4] even though they followed TB MED 507 work-rest and water intake guidance. It was also predicted that dismounted Marine missions with periods of hard work (> 600W work rate) could result in high thermal-work strain even during White/Green flag WBGT conditions common to Afghanistan during the Spring and Summer (March, July) [20]. In both instances, physiological data including core body temperature (Tcore), skin temperature (Tskin), and heart rate (HR) were collected in-theater and used to quantify the thermal-work strain experienced by the Marines. During both studies metabolic rate (M) was estimated but, not measured.
The metabolic energy expenditures of Warfighters during a variety of different
training events and exercises have been characterized [18], but to our knowledge very little energy expenditure data have been collected in-theater or during actual missions. This is not surprising given the difficulties inherent to collecting data under the constraints imposed by in-theater operations. For example, measuring oxygen consumption requires a whole room calorimeter or a worn/tethered breathing apparatus, the intake-balance method requires detailed and long term records of caloric intake and changes in body composition, and the factorial method requires a detailed recording of activity type and duration. The use of doubly labeled water (DLW) is tenable during field operations as it only requires the collection of periodic urine samples for later analysis. However, the DLW method typically provides a measure of total daily energy expenditure (TDEE) over a minimum interval of one to two days. A more detailed view of Warfighter thermal-work strain and metabolic rate can be provided by a combination of DLW data, wearable physiological status monitoring (PSM), and mathematical modeling of human thermo-regulatory physiology.
The purpose of the present study was to characterize the physiology and energy expenditures of Marines during in-theater missions in Afghanistan. This report details the average total daily energy expenditures of Marines across four days. Subjects engaged in ten hour patrol missions on the first two days and spent the remaining two days “behind the wire” at their patrol base. Physiological and thermal-work strain data are also presented for the patrol mission periods. This report also examines the novel use of the SCENARIO thermo-regulatory model and observed Tcore as a means to estimate energy expenditure over the course of missions.
2
METHODS
The thermal-work strain experienced by USMC volunteers operating out of Patrol Base Boldak (Helmand Province, Afghanistan) was assessed during routine patrol missions on 28 and 29 August, 2013 between the hours of 0600 and 1600. Individual physiological data (HR, respiratory rate, Tcore, Tskin, and body motion) were collected using a chest-mounted Equivital-2 (Hidalgo Ltd., Cambridge UK) physiological status monitoring (PSM) system, along with contextual information such as meteorology, clothing characteristics, individual equipment descriptions, and TDEE as determined by DLW. These data were also collected while volunteers were at their patrol base on 30 and 31 August, 2013. PROCEDURES
The afternoon and evening of August 27th (1500-2130), prior to the initiation of data collection, volunteers were briefed and provided their informed consent. Following informed consent, thermometer pills were orally administered, volunteers provided an initial urine sample, consumed their DLW dose (see below), and were fitted with PSM systems. Each subsequent morning, urine samples were collected and temperature pill presence was checked. Volunteers were instructed to wear the PSM belts for the entirety of each day. PSM systems were swapped each evening enabling daily data downloads and battery recharging. Equipment inventory and anthropometric measures were collected throughout the day on August 30th as the volunteers’ duty requirements permitted. Urine samples were collected each day from 28 to 31 August.
METEOROLOGICAL CONDITIONS
Hourly meteorological data were collected at the Camp Bastion Airfield and provided by the 14th Weather Squadron (Asheville, NC). Air temperature (TA), dew point, wind speed (WS), black globe temperature (TBG), and relative humidity (RH) were provided for the month of August, 2013.
MISSION GROUPS AND VOLUNTEERS
Nineteen USMC volunteers (age = 21.7 ± 3.8 yr, height = 168.4 ± 38.5 cm, weight = 76.8 ± 17.7 Kg, waist circumference = 81.7 ± 6.6 cm, 3 mile run time = 19.8 ± 3.2 minutes) from Fox Company, 2nd Battalion 2nd Marines Regimental Combat Team stationed at Patrol Base Boldak participated in this study. Participants volunteered for this study after being briefed on the research procedures, risks, and benefits. The investigators adhered to the policies for protection of human subjects as prescribed in Army Regulation 70-25 and SECNAVINST 3900.39D, and the research was conducted in adherence with the provisions of 32 CFR Part 219.
Height (self-report), body weight (semi-nude with shorts and t-shirt), and waist circumference at the navel (anthropometric tape measure) were recorded to estimate percent body fat using Wright and Wilmore’s technique [20]. Fighting weight (total weight with combat clothing and equipment) were also measured when possible. In

3
addition to these data, all test volunteers provided a self-reported 3-mile run time, a standard USMC physical training benchmark.
Data were collected during two patrols (~10 hours each, 28 and 29 August, 2013). Patrols on both days were performed by two groups of volunteers (labeled group 1 and group 2) and included mounted and dismounted operations. Additional data were collected on 30 and 31 August, 2013 when all volunteers remained at Patrol Base Boldak or, in the case of one evacuated subject, at a nearby medical facility.
Full data sets were not collected for all nineteen volunteers. Two volunteers received placebos in place of DLW doses to control for local baseline isotope abundances (see Physiological Measures/Energy Expenditure section for explanation) resulting in an N of 17 for TDEE data. Additionally, physiological data from six subjects, including the two given placebos, were discarded due to one or more of the following issues: loss of temperature pill data, poor quality HR data (complications with load carriage/shifting of Equivital belt during wear), and equipment malfunction (e.g., battery failure, device damage). Overall, this resulted in DLW data being collected for 17 volunteers and full physiological datasets for 13 volunteers.
CLOTHING AND EQUIPMENT CHARACTERISTICS
Total clothing insulation (Itot,clo) and water vapor permeability index (im) of the Marine ensemble were measured via thermal manikin (Newton Manikin System, Thermetrics; Seattle, WA) by USARIEM personnel according to ASTM standards [1, 2]. A clo is a unit of thermal resistance defined as the insulation required to keep a resting man comfortable at 21 ºC [2]. A clo value of 1 is equal to 0.155 K•m2/W [2] and roughly equivalent (Itot,clo = 1.17 clo) to wearing an ensemble including men’s underwear briefs, khaki pants, belt, socks, athletics shoes, and a short-sleeved shirt [2]. The permeability index is a non-dimensional index from 0 to 1 where 0 indicates a garment or ensemble is impermeable to vapor transfer and allows for no evaporative heat transfer. An im of 1 indicates the theoretical maximum of evaporative heat loss given the worn ensemble’s insulation [3]. The ratio of im/Itot,clo indicates the “cooling power” of an ensemble [3]. Photos and descriptions of typical ensembles were also taken when possible (e.g., Figure 1).
PHYSIOLOGICAL MEASURES
Energy Expenditure – Doubly Labeled Water
Doubly labeled water containing the stable, naturally-occurring isotopes H218O
and 2H2O in known proportions, (Cambridge Isotopes, Cambridge, MA) was given to volunteers to determine total energy expenditure during the study. Urine samples were collected and stored in urine sample tubes and 18O and 2H isotope abundances were measured on a Stable Isotope Ratio Mass Spectrometer (MAT 252, Thermo Fisher Scientific; Waltham, MA) at the Stable Isotope Laboratory Pennington Biomedical Research Center (Baton Rouge, LA).

4
The DLW method of measuring total energy expenditure [16] is based on the assumption that an initial oral dose of stable 2H2
18O, deuterium (2H) is eliminated from the body as water, whereas 18O leaves as both water and exhaled carbon dioxide (CO2). The rate of CO2 production (VCO2) can be calculated from the difference in the elimination rates of the two isotopes. Energy expenditure is calculated from VCO2 using a metabolic fuel quotient (calculated from the food quotient (FQ) or assumed to be a standard western FQ) and conventional indirect calorimetric relationships. The mean daily CO2 production (r CO2 mol/day) is calculated according to Schoeller (1988) [17]:
r CO2 = (N/2.078) * (1.007 k0 – 1.041 kd) – 0.0246 rH2Ot (2)
where, r CO2 = rate of CO2 in mol/day N = average of initial and final estimated total body weight (TBW) k0 = H2
18O elimination rate kd = 2H2O elimination rate rH2Ot = rate of fractionated evaporated water loss estimated as 1.05 N * (1.01 k0 – 1.04 kd) [5] Water turnover for a given period of time is determined by multiplying TBW by kd. Total daily energy expenditure is calculated using the two-point methods described by Schoeller, et al. (1986) [16]. The calculations are done via the equation:
k = [ln (σi – σb) – ln (σf – σb - ∆ σc)]/t (3) where, k = isotopic elimination rate σi = initial isotopic abundance (%) σb = pre-dose baseline isotopic abundance (%) σf = final isotopic abundance (%) σc = corresponding change in mean baseline isotopic abundance (%) in control group that did not receive H2
18O t = time period between the initial and final samples of the energy expenditure period
Abrupt changes in 2H and 18O are often unavoidable when sources of drinking water change [7]. Therefore, isotopic elimination rates for 2H and 18O were corrected for changes in baseline isotopic abundances (Schoeller et al., 1986) [16], with two volunteers drinking local water (i.e., not dosed with DLW). Energy expenditure data were calculated by multiplying rCO2 by the energy equivalent of CO2 for an assumed Respiratory Quotient (RQ) of 0.83 or an RQ calculated from the FQ of the foods consumed, and the estimated changes in body energy stores during the study (DeLany et al., 1989) [5].
5
Thermal-Work Strain Physiological Parameters
Each volunteer wore a chest belt PSM system (Equivital-2, Hidalgo Ltd. Cambridge UK) and ingested a thermometer pill (Jonah ™ Core Temperature Pill, Respironics, Bend OR). The PSM system measured heart rate (derived from electrocardiogram waveform), respiration rate (derived from chest expansion/contraction waveform), activity level (derived from tri-axial accelerometer waveforms), skin temperature (infrared thermometer), and core body temperature (thermometer pill). All PSM data was collected at least every 15 seconds.
Heart rate, Tskin, and Tcore were used to characterize the thermal-work strain experienced by each volunteer. The Physiological Strain Index (PSI) [14], a measure combining HR and Tcore, was calculated as an overall indicator of thermal-work strain on a scale from 0 to 10.
Due to mission and time constraints (volunteers had strict departure time requirements and could not adjust the PSM system once on patrol), routine functionality checks for the PSM system (i.e., viewing the electrocardiogram to ensure that the PSM belt was collecting clean data and that the core temperature pill was present and broadcasting) were not always possible. In at least one case, a PSM system malfunctioned, most likely due to a damaged battery, and failed to record data properly. Thus, full PSM datasets were collected for 13 of our 19 volunteers.
Activity Monitoring
Three dimensional accelerometry data from the chest-mounted PSM device were used to estimate work intensity in the form of activity counts. Activity counts were calculated for each 15s sample period using the accelerometry wave forms (sampled at 25.6 Hz). Activity counts were computed as follows:
3
1
383
1
1
n t
ntnt ACACuntsActivityCo (4)
where AC = acceleration (mG), t = sample, n = accelerometer channel.
Activity counts provide an estimate of total activity based on the difference between each accelerometry axes’ data sample within a 15 second period. The AC value is a representation of total accelerations on all three axes which increases as there are more and larger changes in accelerations. METABOLIC RATE ESTIMATION USING THERMOREGULATORY MODEL
The SCENARIO model predicts core temperature given a number of inputs in addition to M, including: environmental parameters (TA, TBG, WS, and RH), worn ensemble characteristics (im, Itot,clo), and individual anthropometrics (height, weight, and % body fat). SCENARIO takes inputs and produces outputs for one minute time steps. With the exception of M, all input values for SCENARIO were collected in the field.

6
Metabolic rate was modeled by matching the modeled Tcore output by SCENARIO to the observed Tcore of a given volunteer. At each time-step, M input values ranged from a volunteer’s estimated resting metabolic rate (SCENARIO estimates this as 1.5 x body weight (kg), ~115 W) up to 1000 W. These M values were input along with the volunteer’s anthropometrics, clothing, and environmental data. Root mean squared error (RMSE) between the observed Tcore and each modeled Tcore generated by the range of M values were calculated. The M with the lowest error was retained for each time-step.
Initially, matching M rates using SCENARIO’s default minute-to-minute time step resulted in physiologically unlikely metabolic profiles. These profiles were characterized by extreme metabolic “yoyo-ing” or railing where modeled M would alternate between resting or near resting M (~115 W), ~255 W, and 1000 W. This railing effect was due to the first order change-of-state lags built into SCENARIO to counteract large and sudden changes in M, blood flow, and stroke volume [9] by effectively smoothing transitions between different M values. The first order lag function is defined as:
Xm + 1 = Xm + (Xnew − Xold) • [1 − 𝑒𝑥𝑝 (−0.693𝑡𝑚
𝑡0.5)] (5)
where, Xm + 1 is the new time-lagged value, Xm is the previously lagged value, Xnew is the new non-lagged value, Xold is the previous non-lagged value, tm is the elapsed time, and t0.5 is the response half-time (30 seconds in the case of M),
While railing between minimum and maximum M inputs is explained by SCENARIO attempting to mute the magnitude of the metabolic transitions, we hypothesize that the prevalence of 255 W outputs is likely due to the use of 255 W in the original validation of SCENARIO and the generation of some of its internal set points (e.g., work rates were modulated between resting and 255 W during several of the validation studies) [9,10].
To achieve a gradual M profile and reduce the effects of the change-of-state lags, we incrementally increased the M time step from 1 minute to 5, 10, 15, 20, and 25 minutes thereby reducing the number of M transitions. Twenty minute time steps resulted in the lowest mean Tcore RMSE across volunteers (Figures 10 through 17) while generating smooth and stable M profiles. Using these M profiles we calculated modeled mission M energy expenditure (MMEE) and total mission energy expenditures in megajoules.
For comparison to DLW total daily energy expenditure (TDEEDLW) data, we calculated estimated total daily energy expenditure (TDEEEST) by summing three values: SCENARIO modeled mission M values (MMEE), estimated resting energy expenditures (MREE), and estimated non-exercise activity thermogenesis (NEAT) energy expenditures (MNEAT). Resting energy expenditure, the number of calories required to sustain the body while non-active, were calculated using Mifflin et al. [11] using equation 6:

7
MREE = (10 • BW + 6.25 • HT − 5 • age + 5) •4184
24 • 602 (6)
where BW is body weight in kilograms, HT is height in centimeters, age is in years, and the fraction at the end converts between kilocalories and watts (Js-1). Non-exercise activity thermogenesis energy expenditures include any activities that are not sleeping, eating, or volitional exercise. This includes sitting, standing, maintaining non-recumbent body positions, changing body positions, fidgeting, and spontaneous muscle contraction [6]. Equation 7 calculates NEAT in Watts as:
M𝑁𝐸𝐴𝑇 = (1.5 • 𝐵𝑊 + 2.0 • (𝐵𝑊 + 𝐿) (𝐿/𝐵𝑊)^2 + MREE)/2 (7)
where L is load carried in kilograms.
The in-theater investigator noted that missions lasted approximately 10 hours and we assumed an additional half hour of mission M values due to equipment stowage and walking movement between activities post and pre mission. The remaining 13.5 hours were broken down into 5 hours of MREE and 8.5 hours of MNEAT activities. Because we had no logs of any non-mission activities, including sleep, we estimated 5 hours of sleep by averaging length of time in the evening during which HR dropped below 60 beats per minutes while coinciding with low accelerometry counts. Thus, TDEEEST was calculated in megajoules as:
TDEEEST = (10.5 • MMEE + 5.0 • M𝑅𝐸𝐸 + 13.5 • M𝑁𝐸𝐴𝑇) •602
106 (8)
This allowed us to estimate M for each individual and mission period as well as estimate TDEE (Figures 6-9, Table 5). We also calculated the percent error of TDEEEST compared to TDEEDLW. Conversions from megajoules to kilocalories can be made using equation 9 below.
𝑘𝑐𝑎𝑙 = 𝑀𝐽 •106 J/MJ
4184 J/kcal (9)
RESULTS
METEOROLOGICAL CONDITIONS
Table 1 shows air temperature, relative humidity, wind speed, black globe temperatures, and WBGT for each of the mission periods. Meteorological data used for modeling purposes were collected during mission periods. Flag conditions were calculated from WBGT with an added 2.8 °C to account for body armor [15]. Overall, flag conditions did not exceed yellow although recorded temperatures reached as high as 40 °C.

8
Table 1: Environmental conditions for patrols on 28 and 29 August 2013.
Mission Period Air Temp.
(°C)
Relative Humidity
(%)
Wind Speed (m/s)
Black Globe (°C)
WBGT (°C)
Flag Cond.*
28 AUG 0600-1600
MIN 22.0 5.0 1.5 26.0 14.0 No Flag
MAX 40.0 17.0 5.7 60.5 26.7 Yellow
MEAN 34.0 9.3 3.6 43.8 22.1 No Flag
STD 5.6 4.2 1.2 10.3 3.7 -
29 AUG 0600-1600
MIN 23.0 7.0 0.5 28.0 14.1 No Flag
MAX 38.0 20.0 5.7 58.5 27.2 Yellow
MEAN 33.6 11.6 3.0 43.1 22.4 No Flag
STD 4.3 3.6 1.5 9.4 3.7 - *Note: flag condition takes into account adding 2.8 °C to WBGT to account for the effects of wearing body armor.
MISSION GROUPS AND TEST VOLUNTEERS
Table 2 presents volunteer characteristics (age, height, weight, percent body fat, 3 mile run time, and load carried). Volunteers in separate groups (G1, G2) engaged in separate mission activities and had different mission start and end times. Waist circumferences were 80.2 ± 5.2 cm, 83.2 cm, 81.5 ± 9.9 cm, and 81.9 ± 3.4 cm (mean ± standard deviation) for groups 1 and 2 on August 28th and August 29th respectively.
Table 2: Volunteer characteristics by patrol group and day.
Day & Group
N Age (yr) Height (cm)
Weight (kg)
Body Fat (%)
3 Mi. Run Time (min)
Load (kg)
28 Aug
G1 5 22.0 ± 3.5 182.0 ± 5.3 78.3 ± 6.7 14.2 ± 5.0 20.8 ± 1.0 22.8 ± 4.8
G2 1 20.0 69.0 82.6 13.9 19.5 Not recorded*
29 Aug
G1 8 20.7 ± 2.0 176.7 ± 9.8 81.1 ± 14.4 12.0 ± 4.7 20.3 ± 3.3 22.7 ± 5.0
G2 5 21.2 ± 2.2 178.3 ± 5.5 79.4 ±4.0 13.4 ± 2.0 19.3 ± 0.8 27.2 ± 5.8
Note: for 28 August 2013 group 2, only one subject’s data was useable for modeling and no load data was recorded for this volunteer (22.7kg was estimated*). G1 indicates group one and G2 indicates group two. Values shown are mean ± standard deviation.

CLOTHING AND EQUIPMENT CHARACTERISTICS
Volunteers from Fox Company 2/2nd reported wearing the Flame Retardant Organizational Gear (FROG) uniform, Scalable Plate Carrier (SPC), front, back and side Enhanced Small Arms Protective Insert (E-SAPI) plates, and Kevlar combat helmet. Figure 1 shows a typical C&IE configuration for the 2/2nd, and the physiological status monitor used to collect physiology data. Thermal manikin analysis found the Marine ensemble to have an insulation factor (ltot,cJo) of 1.34 clo, a permeabi lity index (im) of 0.39, and an im/ ltot,clo ratio of 0.26 at a wind speed of 1.0 m/s.
Figure 1: Typical clothing and individual equipment configurations (A, B, and C) for Fox Company 2nd Battalion 2nd Marines and physiological status monitoring (PSM) system
(Hidalgo EQ-02, D).
9
10
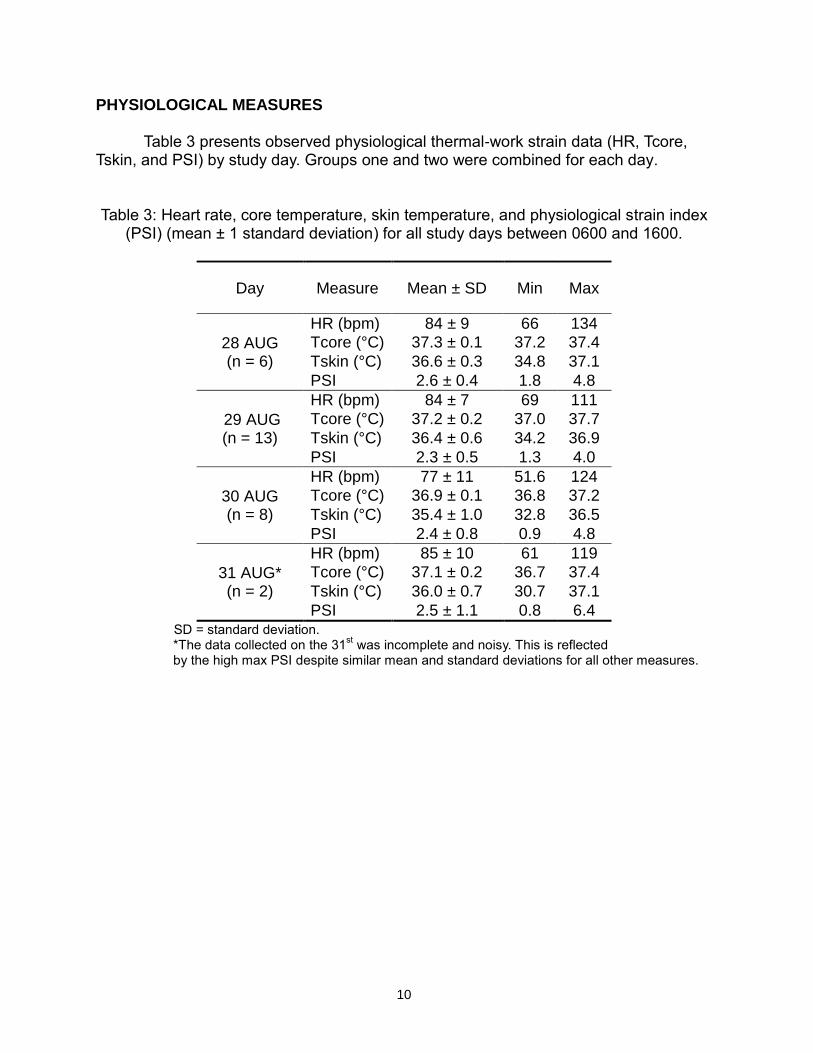
PHYSIOLOGICAL MEASURES Table 3 presents observed physiological thermal-work strain data (HR, Tcore,
Tskin, and PSI) by study day. Groups one and two were combined for each day.
Table 3: Heart rate, core temperature, skin temperature, and physiological strain index (PSI) (mean ± 1 standard deviation) for all study days between 0600 and 1600.
Day Measure Mean ± SD Min Max
28 AUG (n = 6)
HR (bpm) 84 ± 9 66 134
Tcore (°C) 37.3 ± 0.1 37.2 37.4
Tskin (°C) 36.6 ± 0.3 34.8 37.1
PSI 2.6 ± 0.4 1.8 4.8
29 AUG (n = 13)
HR (bpm) 84 ± 7 69 111
Tcore (°C) 37.2 ± 0.2 37.0 37.7
Tskin (°C) 36.4 ± 0.6 34.2 36.9
PSI 2.3 ± 0.5 1.3 4.0
30 AUG (n = 8)
HR (bpm) 77 ± 11 51.6 124
Tcore (°C) 36.9 ± 0.1 36.8 37.2
Tskin (°C) 35.4 ± 1.0 32.8 36.5
PSI 2.4 ± 0.8 0.9 4.8
31 AUG* (n = 2)
HR (bpm) 85 ± 10 61 119
Tcore (°C) 37.1 ± 0.2 36.7 37.4
Tskin (°C) 36.0 ± 0.7 30.7 37.1
PSI 2.5 ± 1.1 0.8 6.4 SD = standard deviation.
*The data collected on the 31st was incomplete and noisy. This is reflected
by the high max PSI despite similar mean and standard deviations for all other measures.
11
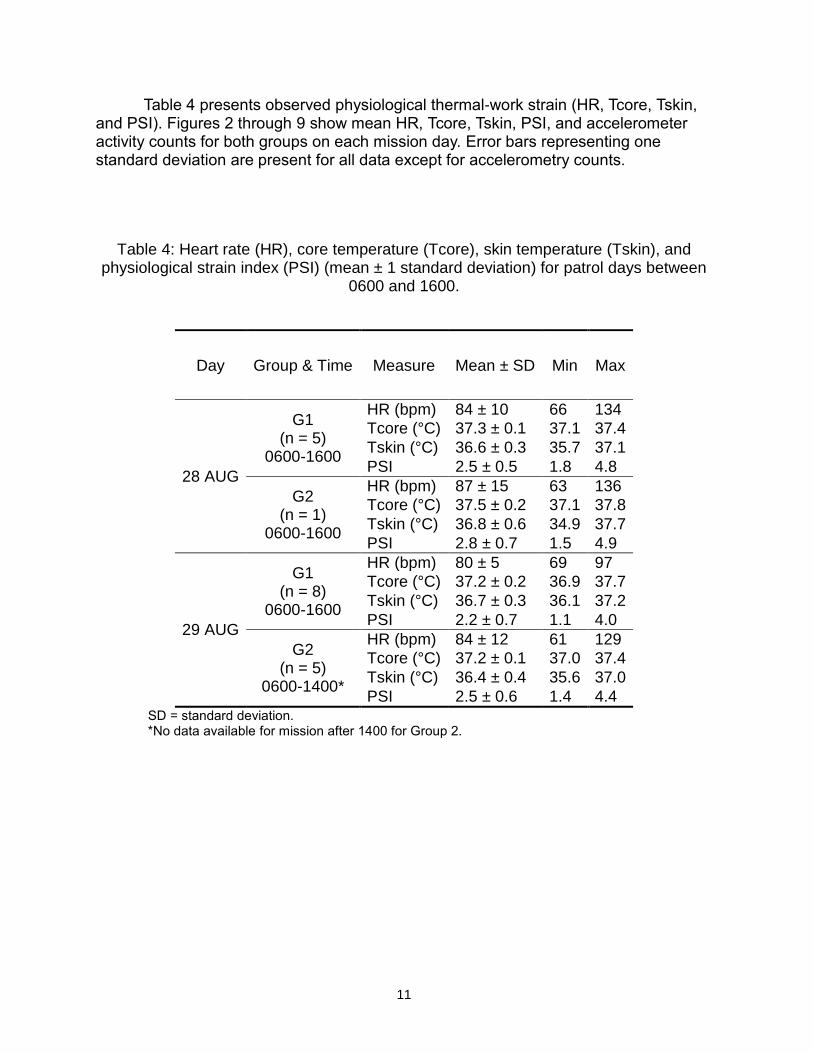
Table 4 presents observed physiological thermal-work strain (HR, Tcore, Tskin, and PSI). Figures 2 through 9 show mean HR, Tcore, Tskin, PSI, and accelerometer activity counts for both groups on each mission day. Error bars representing one standard deviation are present for all data except for accelerometry counts.
Table 4: Heart rate (HR), core temperature (Tcore), skin temperature (Tskin), and physiological strain index (PSI) (mean ± 1 standard deviation) for patrol days between
0600 and 1600.
Day Group & Time Measure Mean ± SD Min Max
28 AUG
G1 (n = 5)
0600-1600
HR (bpm) 84 ± 10 66 134
Tcore (°C) 37.3 ± 0.1 37.1 37.4
Tskin (°C) 36.6 ± 0.3 35.7 37.1
PSI 2.5 ± 0.5 1.8 4.8
G2 (n = 1)
0600-1600
HR (bpm) 87 ± 15 63 136
Tcore (°C) 37.5 ± 0.2 37.1 37.8
Tskin (°C) 36.8 ± 0.6 34.9 37.7
PSI 2.8 ± 0.7 1.5 4.9
29 AUG
G1 (n = 8)
0600-1600
HR (bpm) 80 ± 5 69 97
Tcore (°C) 37.2 ± 0.2 36.9 37.7
Tskin (°C) 36.7 ± 0.3 36.1 37.2
PSI 2.2 ± 0.7 1.1 4.0
G2 (n = 5)
0600-1400*
HR (bpm) 84 ± 12 61 129
Tcore (°C) 37.2 ± 0.1 37.0 37.4
Tskin (°C) 36.4 ± 0.4 35.6 37.0
PSI 2.5 ± 0.6 1.4 4.4 SD = standard deviation. *No data available for mission after 1400 for Group 2.
12
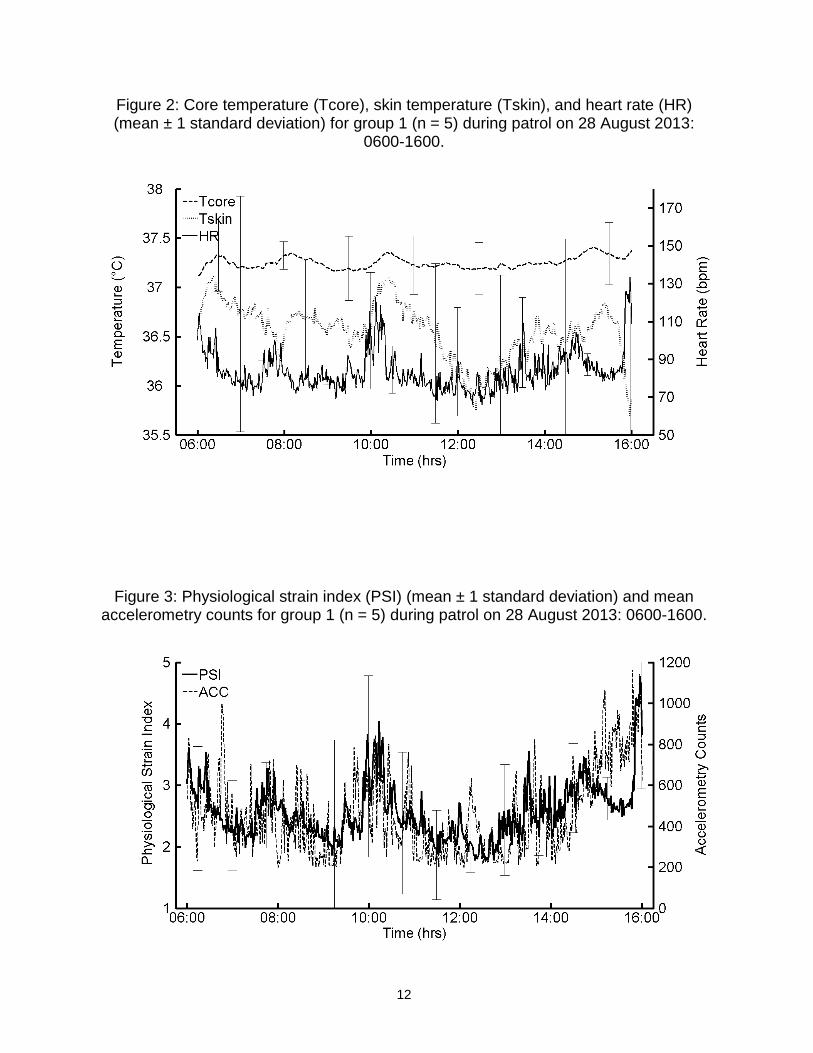
Figure 2: Core temperature (Tcore), skin temperature (Tskin), and heart rate (HR) (mean ± 1 standard deviation) for group 1 (n = 5) during patrol on 28 August 2013:
0600-1600.
Figure 3: Physiological strain index (PSI) (mean ± 1 standard deviation) and mean accelerometry counts for group 1 (n = 5) during patrol on 28 August 2013: 0600-1600.

13
Figure 4: Core temperature (Tcore), skin temperature (Tskin), and heart rate (HR) (mean ± 1 standard deviation) for group 2 (n = 1) during patrol on 28 August 2013:
0600-1600. Note: HR data was lost at ~1300.
Figure 5: Physiological strain index (PSI) (mean ± 1 standard deviation) and mean accelerometry counts for group 2 (n = 1) during patrol on 28 August 2013: 0600-1600.
Note: HR data was lost for the only volunteer at ~1300 hours but the accelerometry data for 1300 on suggests a high degree of either movement or mounted transport.

14
Figure 6: Core temperature (Tcore), skin temperature (Tskin), and heart rate (HR) (mean ± 1 standard deviation) for group 1 (n = 8) during patrol on 29 August 2013:
0600-1600.
Figure 7: Physiological strain index (PSI) (mean ± 1 standard deviation) and mean accelerometry counts for group 1 (n = 8) during patrol on 29 August 2013: 0600-1600.

15
Figure 8: Core temperature (Tcore), skin temperature (Tskin), and heart rate (HR) (mean ± 1 standard deviation) for group 2 (n = 5) during patrol on 29 August 2013:
0600-1600.
Figure 9: Physiological strain index (PSI) (mean ± 1 standard deviation) and mean accelerometry counts for group 2 (n = 5) during patrol on 29 August 2013: 0600-1600.
16
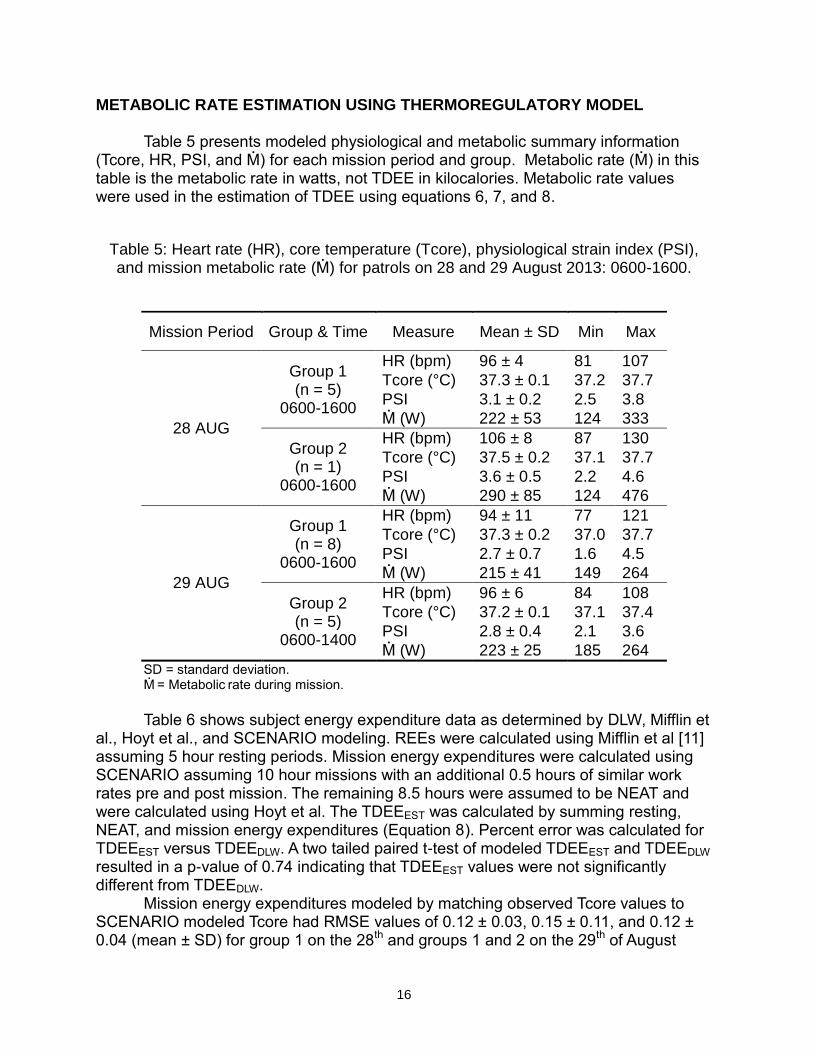
METABOLIC RATE ESTIMATION USING THERMOREGULATORY MODEL Table 5 presents modeled physiological and metabolic summary information
(Tcore, HR, PSI, and M) for each mission period and group. Metabolic rate (M) in this table is the metabolic rate in watts, not TDEE in kilocalories. Metabolic rate values were used in the estimation of TDEE using equations 6, 7, and 8.
Table 5: Heart rate (HR), core temperature (Tcore), physiological strain index (PSI), and mission metabolic rate (M) for patrols on 28 and 29 August 2013: 0600-1600.
Mission Period Group & Time Measure Mean ± SD Min Max
28 AUG
Group 1 (n = 5)
0600-1600
HR (bpm) 96 ± 4 81 107
Tcore (°C) 37.3 ± 0.1 37.2 37.7
PSI 3.1 ± 0.2 2.5 3.8
M (W) 222 ± 53 124 333
Group 2 (n = 1)
0600-1600
HR (bpm) 106 ± 8 87 130
Tcore (°C) 37.5 ± 0.2 37.1 37.7
PSI 3.6 ± 0.5 2.2 4.6
M (W) 290 ± 85 124 476
29 AUG
Group 1 (n = 8)
0600-1600
HR (bpm) 94 ± 11 77 121
Tcore (°C) 37.3 ± 0.2 37.0 37.7
PSI 2.7 ± 0.7 1.6 4.5
M (W) 215 ± 41 149 264
Group 2 (n = 5)
0600-1400
HR (bpm) 96 ± 6 84 108
Tcore (°C) 37.2 ± 0.1 37.1 37.4
PSI 2.8 ± 0.4 2.1 3.6
M (W) 223 ± 25 185 264 SD = standard deviation. M = Metabolic rate during mission.
Table 6 shows subject energy expenditure data as determined by DLW, Mifflin et
al., Hoyt et al., and SCENARIO modeling. REEs were calculated using Mifflin et al [11] assuming 5 hour resting periods. Mission energy expenditures were calculated using SCENARIO assuming 10 hour missions with an additional 0.5 hours of similar work rates pre and post mission. The remaining 8.5 hours were assumed to be NEAT and were calculated using Hoyt et al. The TDEEEST was calculated by summing resting, NEAT, and mission energy expenditures (Equation 8). Percent error was calculated for TDEEEST versus TDEEDLW. A two tailed paired t-test of modeled TDEEEST and TDEEDLW resulted in a p-value of 0.74 indicating that TDEEEST values were not significantly different from TDEEDLW.
Mission energy expenditures modeled by matching observed Tcore values to SCENARIO modeled Tcore had RMSE values of 0.12 ± 0.03, 0.15 ± 0.11, and 0.12 ± 0.04 (mean ± SD) for group 1 on the 28th and groups 1 and 2 on the 29th of August

17
respectively. Group 2 on the 28th of August was comprised of only one volunteer with an RMSE of 0.07. Mean RMSE across all volunteers was 0.13 ± 0.08.
Table 6: Total daily, resting, non-exercise activity thermogenesis (NEAT), and mission energy expenditures*.
Estimated Energy Expenditures
TDEEDLW
(MJ) TDEEEST
% Error Resting (MJ)
NEAT (MJ)
Mission (MJ)
TDEEEST (MJ)
1.69 3.51 8.61 13.81 13.50 2.28
1.61 3.29 7.91 12.81 13.78 -7.07
1.54 3.15 6.19 10.88 14.68 -25.90
1.51 3.00 11.49 16.00 11.94 34.08
1.56 2.95 6.39 10.90 13.34 -18.34
1.84 4.01 11.17 17.03 15.37 10.78
1.58 3.19 11.50 16.27 13.25 22.80
1.33 2.55 4.13 8.01 9.90 -19.03
1.59 3.25 10.75 15.59 13.74 13.51
1.50 3.01 9.14 13.66 14.15 -3.43
1.61 3.32 8.65 13.58 12.74 6.60
1.57 3.11 7.60 12.28 14.32 -14.24
1.60 3.12 5.84 10.56 13.66 -22.67
Mean 1.58 3.19 8.41 13.18 13.41 -1.59
SD 0.11 0.32 2.28 2.54 1.30 18.58
** ** ** ** 12.51 **
** ** ** ** 10.56 **
** ** ** ** 14.38 **
** ** ** ** 12.63 **
Mean ** ** ** ** 13.20 **
SD ** ** ** ** 1.41 **
* Resting Energy Expenditures were calculated using Mifflin et al. (1990) assuming 5 hours of rest. Estimated Mission Energy Expenditures were calculated using the SCENARIO model assuming 10 hour mission periods plus an additional 0.5 hours of post and pre mission movement. NEAT estimated energy expenditures were calculated using Hoyt et al. (2004). TDEEEST is the sum of Resting, NEAT, and Mission estimated energy expenditures. TDEEDLW is the total daily energy expenditure as measured by doubly labeled water. TDEEEST % Error = (TDEEEST–TDEEDLW) /TDEEDLW • 100. SD = standard deviation. ** Values were not calculated because physiological data for subject were lost/corrupt/discarded.

Figure 10: Observed (Obs) and modeled (Mod) core temperature(Tcore) and heart rate (HR) (mean± 1 standard deviation) for group 1 (n = 5) on patrol on 28 August 2013:
0600-1600.
38
37.5
0 0 -(J) 37 .... ::J
-ro .... (J)
~ 36.5 (J)
r
36
- Obs. Tcore
35·5 06:00 08:00 10:00 12:00 14:00 Time (hrs)
170
150 ,......_ E
130 _g. (J) -110 &.
90
70
16:00 50
t ro (J)
I
Figure 11: Observed (Obs) and modeled (Mod) physiological strain index (PSI) and modeled metabolic rate (M) (mean ± 1 standard deviation) for group 1 (n = 5) on patrol on 28 August 2013: 0600-1600. Note: the grey box highlights a time step lag between
modeled and observed PSI created by using a time step of 20 minutes. Further explanation is given in the discussion.
5 1000 - Obs. PSI ---Mod. PSI 900
>. I I
I \
' --, •
~ ······ ··Mod. M -g 4
800
700 I 600
(J) -ro 0::::
500 -~ 0
400 ..0 ro
I····· ...... ,............... .. \..}······· ..... ~
-300 (J)
2
200
08:00 10:00 12:00 14:00 Time (hrs)
18

19
Figure 12: Observed (Obs) and modeled (Mod) core temperature (Tcore) and heart rate (HR) (mean ± 1 standard deviation) for group 2 (n = 1) on patrol on 28 August
2013: 0600-1600.
Figure 13: Observed (Obs) and modeled (Mod) Physiological Strain Index (PSI) and modeled M (mean ± 1 standard deviation) for group 2 (n = 1) on patrol on 28 August
2013: 0600-1600.

Figure 14: Observed (Obs) and modeled (Mod) core temperature (Tcore) and heart rate (HR) (mean ± 1 standard deviation) for group 1 (n = 8) on patrol on 29 August
2013: 0600-1600. Note: the grey box highlights a time step lag between modeled and observed physiological strain index (PSI) created by using a time step of 20 minutes.
Further explanation is given in the discussion.
0 0 -
38 - Obs. Tcore ---Mod. Tcore
37.5 - Obs. HR ---Mod. HR
(J) 37 .... ::J
-ro .... (J)
~ 36.5 (J)
r
36
35·5
06:00 08:00 10:00 12:00 14:00 Time (hrs)
170
150 ,......_ E
130 _g. (J) -
110 &.
90
70
16:00 50
t ro (J)
I
Figure 15: Observed (Obs) and modeled (Mod) physiological strain index (PSI) and modeled metabolic rate (M) (mean ± 1 standard deviation) for group 1 (n = 8) on patrol
on 29 August 2013: 0600-1600.
5 1000 -Obs. PSI ---Mod. PSI 900
~ ······ ··Mod. M -g 4
800
700 I '•
I \
' I
600 (J) -ro
0:::: \ .,.,./" \ ..... ___ _ 500 -~
0 400 ..0
ro -300 (J)
2
200
10:00 12:00 14:00 Time (hrs)
20
21
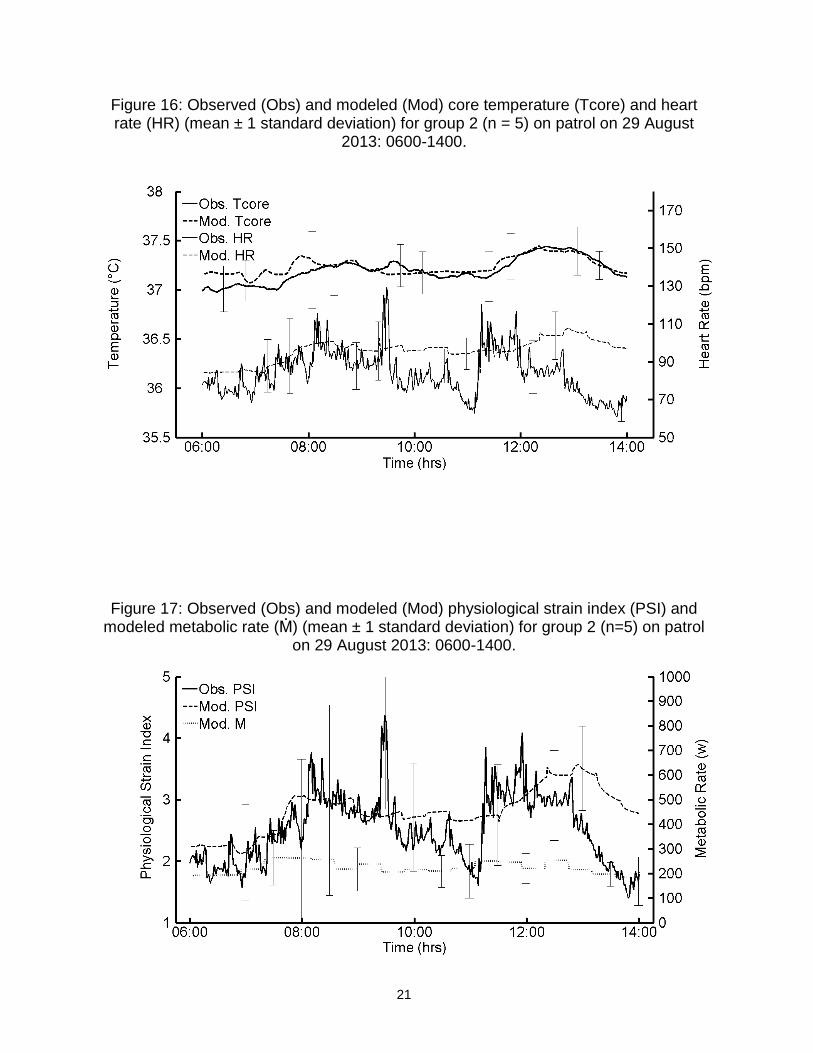
Figure 16: Observed (Obs) and modeled (Mod) core temperature (Tcore) and heart rate (HR) (mean ± 1 standard deviation) for group 2 (n = 5) on patrol on 29 August
2013: 0600-1400.
Figure 17: Observed (Obs) and modeled (Mod) physiological strain index (PSI) and modeled metabolic rate (M) (mean ± 1 standard deviation) for group 2 (n=5) on patrol
on 29 August 2013: 0600-1400.
22
DISCUSSION Thermal-Work Strain
The environmental conditions during the August 2013 missions were temperate and the Marine test volunteers experienced limited thermal-work strain. Mean WBGT for both patrol Day 1 and patrol Day 2 (28th and 29th of August) were 22.1 ± 3.7 °C and 22.4 ± 3.7°C. Mean PSI values for both days indicated low thermal-work strain with values of 2.5 ± 0.5 and 3.1 ± 1.1 for groups 1 and 2 on Day 1 and values of 2.2 ± 0.7 and 2.5 ± 0.6 on Day 2. Observed PSI reached a maximum of 4.9 on Day 1 for group 2 indicating a short period of low to moderate thermal-work strain.
Physiological data for all study days also reflected low levels of thermal-work
strain. Core temperature and HR never exceeded 37.8 °C and 136 beats per minute respectively despite the in-theater investigator describing mission events including sniper fire, securing weapon caches, and an IED explosion. In fact, mean mission physiological data were similar to mean data for non-mission days. Core temperature ranged from 36.7 to 37.7 ºC and HR from 52 to 134 bpm over the four day period (Table 4). Low Tcore and HR data may be partially explained by prolonged periods of mounted travel as well as the loss of data during periods of greater activity (due to disruption by load carriage and movement) but overall suggest a relatively low level of physiological exertion. Metabolic Modeling and Estimation
Overall low thermal-work strain levels seem reasonable given the moderate
energy expenditures observed. The slopes for 2H and 18O elimination were consistent across subjects over the four days of data collection resulting in a mean TDEEDLW (13.20 ± 1.41 MJ) similar to values documented for Marine construction missions (13.0 ± 2.30 MJ). In comparison, energy expenditures observed during combat unit training have been observed to be in the 14.0 – 20.0 MJ/day range [18].
Estimated TDEE values also appear reasonable given the accuracy with which
we modeled Tcore. Back calculation of M using the SCENARIO thermo-regulatory model [9,10] resulted in low observed versus modeled Tcore RMSE values (0.13 ± 0.08) and a p-value of 0.74 (two tailed paired t-test) indicating that estimated versus observed TDEE values are not significantly different across subjects. However, the large standard deviation of percent error (-1.59 ± 18.58 %, -0.21 ± 2.49 MJ) suggests that estimating M using SCENARIO may not be suitable for individuals. Furthermore, because volunteers did not log their non-mission activities, we have no way to verify how accurate our estimations of NEAT and resting time periods were.
Our metabolic rate modeling efforts yielded several interesting but unexpected
results. Initial attempts to back calculate M using 1-10 minute bins or “epochs” resulted in highly variable and physiologically unlikely, if not impossible, M profiles. This was due to the first order change-of-state lags built into SCENARIO designed to prevent

23
physiologically unrealistic changes in M, stroke volume, and blood flow. It was only by increasing the time step length to 15-25 minutes that M outputs began to stabilize into profiles which reflected our DLW results while still matching modeled Tcore to observed. SCENARIO also consistently over estimated HR values which may suggest an underlying issue in one or more of SCENARIO’s physiological heat transfer components.
Although the M time step length (20 minutes) created a generally smoother and
more stable M profile, it also introduced errors into the modeled data. When observed Tcore rose or fell rapidly, larger time steps created modeling errors by reducing a region of rapid metabolic change to only one M value. These errors are visible as delays in the modeled Tcore and PSI (Figure 11 and 14, highlighted regions). Modeling lags could potentially be reduced using several methods including matching the size of the time step to the rate of change of observed Tcore, using a set of M transition probabilities to select an appropriate range of M values each time step, or removing the change-of-state lags built into the SCENARIO model.
Future work will include improving the SCENARIO model by using a dataset containing higher resolution M data. Specifically, we hope to compare SCENARIO’s physiological outputs to observed values using an observed M profile with a resolution of minutes rather than days. By examining SCENARIO’s internal variables and outputs, we hope to determine which sub components (active physiology versus passive heat transfer) produce anomalous heat balance or physiology values.
CONCLUSIONS
The mean TDEEDLW of in-theater Marines who engaged ten hour patrols on two days followed by two days on base was 13.20 ± 1.41 MJ (n = 17). This metabolic rate is comparable to rates observed during Marine construction missions. Volunteers experienced mostly low to moderate thermal-work strain levels during both patrol mission periods and the days spent on base.
Accurately determining M in the field remains a challenge to scientists.
Developing a method of estimating M using accepted thermo-regulatory models and physiological data may provide a valuable tool for modeling and planning purposes in environments where accurate methods of measuring metabolic rate are otherwise precluded. Our approach of back-calculating M using a validated thermo-regulatory model shows agreement for group means but needs further work for extension to individuals.

25
REFERENCES
1. ASTM Standard F2370-10: Standard Test Method for Measuring the
Evaporative Resistance of Clothing Using a Sweating Manikin. West Conshohocken, PA, ASTM International, 2010.
2. ASTM Standard F1291-10: Standard Test Method for Measuring the Thermal Insulation of Clothing Using a Heated Manikin. West Conshohocken, PA, ASTM International, 2010.
3. ASTM Standard F1868-09: Standard Test Method for Thermal and Evaporative
Resistance of Clothing Materials Using a Sweating Hot plate. West Conshohocken, PA, ASTM International, 2009.
4. Buller MJ, Wallis DC, Karis AJ, Herbert NJ, Cadarette BS, Blanchard LA, Amin MM, DiFilippo JL, Economos D, Hoyt RW, and Richter MW (2008). Thermal-Work Strain During Marine Rifle Squad Operations In Iraq (Summer 2008). Technical Report T09-01(ADA474825). Natick, MA: U.S. Army Research Institute of Environmental Medicine.
5. DeLany JP, Schoeller DA, Hoyt RW, Askew EW, and Sharp MA (1989). Field
use of D2 18O to measure energy expenditure of soldiers at different energy intakes. Journal of Applied Physiology, 67(5): 1922-1929.
6. Hoyt RW, Buller MJ, Santee WR, Yokota M, Weyand PG, and Delany JP (2004).
Total energy expenditure estimated using foot-ground contact pedometry. Diabetes Technology & Therapeutics, 6(1): 71-81.
7. Hoyt RW, Jones TE, Stein TP, McAninch GW, Lieberman HR, Askew EW, and Cymerman A (1991). Doubly labeled water measurement of human energy expenditure during strenuous exercise. Journal of Applied Physiology, 71(1): 16-22.
8. Kark JA, Burr PQ, Wenger CB, Gastaldo E, and Gardner JW (1996). Exertional
heat illness in Marine Corps recruit training. Aviation, Space, and Environmental Medicine, 67(4): 354-360.
9. Kraning KK, and Gonzalez RR (1997). A mechanistic computer simulation of
human work in heat that accounts for physical and physiological effects of clothing, aerobic fitness, and progressive dehydration. Journal of Thermal Biology, 22(4): 331-342.
26
10. Kraning KK, and Gonzalez RR (1997). SCENARIO: A Military/Industrial Heat Strain Model Modified to Account for Effects of Aerobic Fitness and Progressive Dehydration. Technical Report TN-97-1 ( ADA278323). Natick, MA: US Army Research Institute of Environmental Medicine.http://www.dtic.mil/cgi-bin/GetTRDoc?Location=U2&doc=GetTRDoc.pdf&AD=ADA323872
11. Mifflin MD, St Jeor ST, Hill LA, Scott BJ, Daugherty SA, and Koh YO (1990). A
new predictive equation for resting energy expenditure in healthy individuals. The American Journal of Clinical Nutrition, 51(2): 241-247.
12. Minard D, Belding HS, and Kingston JR (1957). Prevention of heat casualties.
Journal of the American Medical Association, 165(14): 1813-1818.
13. Minard D (1961). Prevention of heat casualties in Marine Corps recruits. Period
of 1955-60, with comparative incidence rates and climatic heat stresses in other training categories. Military medicine, 126: 261-72.
14. Moran DS, Shitzer A, and Pandolf KB (1998). A physiological strain index to
evaluate heat stress. American Journal of Physiology-Regulatory, Integrative and Comparative Physiology, 275(1): R129-R134.
15. Sawka MN, Wenger CB, Montain SJ, Kolka MA, Bettencourt B, Flinn S, Gardner
J, Matthew WT, Lovell M, and Scott C (2003). Heat stress control and heat casualty management Technical Bulletin MED 507 (ADA433236). Natick, MA: US Army Research Institute of Environmental Medicine. http://www.dtic.mil/get-tr-doc/pdf?AD=ADA433236
16. Schoeller DA, Ravussin E, Schutz Y, Acheson KJ, Baertschi P, and Jequier E
(1986). Energy expenditure by doubly labeled water: validation in humans and proposed calculation. American Journal of Physiology-Regulatory, Integrative and Comparative Physiology, 250(5): R823-R830.
17. Schoeller DA (1988). Measurement of energy expenditure in free-living humans
by using doubly labeled water. The Journal of Nutrition, 118(11): 1278-1289.
18. Tharion WJ, Lieberman HR, Montain SJ, Young AJ, Baker-Fulco CJ, DeLany
JP, and Hoyt RW (2005). Energy requirements of military personnel. Appetite, 44(1): 47-65.
19. Welles AP, Buller MJ, Margolis L, Economos D, Hoyt RW, and Richter MW (2013). Thermal-Work Strain During Marine Rifle Squad Operations in Afghanistan. Military medicine, 178(10): 1141-1148.

27
20. Wright HF and Wilmore JH (1974). Estimation of relative body fat and lean body
weight in a United States Marine Corps population. Aerospace medicine, 45(3): 301-306.