uni-axial stress–strain response and thermal...
TRANSCRIPT

Proc. R. Soc. A (2009) 465, 2849–2876doi:10.1098/rspa.2009.0276
Published online 1 July 2009
Uni-axial stress–strain response and thermalconductivity degradation of ceramic matrix
composite fibre towsBY C. TANG, M. BLACKLOCK AND D. R. HAYHURST*
Department of Mechanical, Aerospace and Civil Engineering, University ofManchester, PO Box 88, Sackville Street, Manchester M60 1QD, UK
A physical model, previously developed by one of the authors, has been extended to coverthermal conductivity degradation owing to the uni-axial stress–strain response of alignedgroups of fibres or tows found in ceramic matrix composites. Both the stress–strainand thermal models, together with their coupling, have been shown to predict knowncomposite behaviour qualitatively. The degradation of longitudinal thermal properties isshown to be driven by strain-controlled fibre failure; while the degradation of transversethermal properties is because of the growth of fibre–matrix interface wake-debondedcracks, coupled with strain-driven fibre failure.
Keywords: ceramic matrix composites; tows; stress–strain response; longitudinaland transverse thermal conductivity; fibre pullout; wake debonding
1. Introduction
Ceramic matrix composites (CMCs; Kelly 1989) are candidate replacementmaterials for metallic superalloys used in high-temperature parts of aeroengines,heavy-duty gas turbines, nozzles in rocket engines and flight and combustionsurfaces of hypersonic vehicles and devices. Increased operating temperaturesfrom 900–1200◦C for coated metallic superalloys, to above 1300◦C, for CMCs,have the potential to achieve higher thermal efficiencies and lower emissions(Evans & Naslain 1995). In addition to favourable mechanical properties,these materials require good thermal properties for heat transfer in CMCengine components.
Cox & Yang (2006) have identified, as a necessary requirement, the abilityto predict at the design stage both mechanical and thermal properties of aCMC composite material test sample and those of an engineering componentof the same material. It is only by proceeding in this way that one can achieveoptimal selection of: constituent materials; composite materials lay-up; weavingand manufacturing route; thermo-mechanical response of a component; predictionof component failure; and component life-cycle cost. Hence, there is a very strongdriver to be able to model the life scenario using advanced computer techniques,
*Author for correspondence ([email protected]).
Received 28 May 2009Accepted 2 June 2009 This journal is © 2009 The Royal Society2849
on June 15, 2018http://rspa.royalsocietypublishing.org/Downloaded from

2850 C. Tang et al.
and so avoid the unsatisfactory, costly and time-consuming current practice ofprototype development. Probably the most demanding of these requirements isthe ability to predict the degradation of thermal properties with composite strain,and this paper addresses the topic.
A deficiency of CMCs, when compared with metallic superalloys, is thedegradation of thermal transport properties because of internal damage.The presence of damage and cracks can be introduced in an engineeringcomponent, either during manufacture or in service. First, damage is introducedin manufacture as a result of the different thermo-mechanical properties ofthe constituent materials, which, during cooling, introduce thermal gradients,thermal stresses, localized failure and hence damage. This manifests itself aftercooling as micro-porosity. Second, damage is created in-service (Bruggeman1935) by mechanical overloads, fatigue and time-dependent and environmentaleffects that produce matrix and fibre–matrix interfacial cracks. The aircontained within the micro-porosity and cracks degrades the thermal transportproperties and renders the component unserviceable; at that point, eithercomponent repair or replacement is necessary. The very strong coupling betweenmechanical behaviour and thermal properties is, at the present time, not wellunderstood, and is not capable of being accurately predicted. Hence, the driverfor this research is the need to describe and predict these effects at thedesign stage.
The modelling of CMCs requires a number of factors to be taken into accountthat influence thermal transport, such as composite architecture, propertiesof constituent materials and influence of defects (Del Puglia & Sheikh 2001).Some of the first approaches to thermal finite-element modelling were two-dimensional (Lu & Hutchinson 1996; Klett et al. 1999). The limitation oftheir approaches is simplicity, which does not reflect the complexities of realcomposites. Sheikh et al. (2001) have presented a complex weave model of aplain weave CMC. Their model is three-dimensional, and is a step towardsthe modelling of complex composite architectures. Their research included theeffect of directionality in thermal transport by the introduction of the individualproperties of fibre and matrix. However, the main deficiency was the absence ofinitial porosity.
Del Puglia et al. (2004a) focused on the identification and classification ofinitial/manufacturing porosity and introduced four different classes. A furtherpaper by Del Puglia et al. (2004b) addressed how, for three classes of porosity,finite-element analysis techniques can be used to quantify the effect of eachtype on the spatial heat transport properties assessed at the level of a micro-unit cell of tow and matrix. The research of Del Puglia et al. (2004a,b) wasfurther advanced (Del Puglia et al. 2005) for the same (DLR-XT) material, byinclusion of a fourth class of porosity at the macro-unit cell level. They proceededto accurately predict the measured thermal properties of a 10-high laminate,plain weave DLR-XT composite from knowledge of the individual constituentmaterials properties and of the levels of manufacturing porosity. In this way,they established the link between constituent material properties and those ofthe unit cell.
The present paper builds on the work of Del Puglia et al. (2005) by consideringa single tow of fibres and its associated matrices. The objective is to establisha simple tow model for both the stress–strain and thermal conductivity–strain
Proc. R. Soc. A (2009)
on June 15, 2018http://rspa.royalsocietypublishing.org/Downloaded from
Thermo-mechanical behaviour of CMC tows 2851
responses, which is linked to the physical and mechanical properties of theconstituent materials. Then, in subsequent papers, the tow model will bedeveloped to cater for multi-axial loadings that include superimposed tensionorthogonal to the tow and shear stresses in planes both parallel and transverseto the tow.
In the multi-axial mechanical model, the interactions will be included betweendamage mechanisms that are associated with the loading systems operatingin three mutually perpendicular directions. For example, the following willbe considered: matrix cracking; inter-laminae damage; and the effect of wakedebonding on the degradation of Poisson’s ratio. Since there is a dearth ofexperimental data that can be used to isolate the influence of individualmechanisms, the computational modelling approach will be used to postulatemechanisms, predict their consequences and then assess their significance byassessment against the results of experiments that have been carried out onDLR-XT and HITCO woven composites.
Once an understanding has been obtained of the controlling damagemechanisms and their interactions, the multi-axial tow model will be usedto construct a unit cell model. A follow-up paper by Tang et al. (2009)reports predictions, based on the tow model developed here, of the thermo-mechanical response of a simplified unit cell model of 0/90 and woven composites,which takes account of only the axial tow mechanical behaviour, coupled withlongitudinal and transverse thermal transport. The latter investigation has beencarried out to provide insight into the dominant damage mechanisms and theirinteractions.
The key to the achievement of the latter objective will be the use of a numericaltechnique that makes an approximation with acceptable accuracy possible, andyet has the computational efficiency required to model large assemblages of unitcells that might be encountered in structural components. Two approaches canmeet these requirements: first, the binary method of finite-element analysis ofCox et al. (1994), Xu et al. (1995) and McGlockton et al. (2003), and second, themodelling of tows using a finite-element-based multi-linear elastic orthotropicmaterials approach. The finite-element-based multi-linear elastic orthotropicmaterials approach has the simplicity of considering only one material and avoidsthe complexity of having to define the effective medium properties used in thebinary approach. Either of the two approaches allows a composite unit cell to bemodelled by a small number, usually less than 20, of finite elements, comparedwith the tens of thousands of conventional finite elements used by Del Pugliaet al. (2005). Inevitably, this reduction in element numbers is achieved withsome loss of accuracy; however, it is these features that make possible the finite-element analysis of large components. The common link between a composite tow,modelled by multi-axial finite elements, unit cells and engineering components,is provided by the fibre tow.
The present paper does not address the implementation or use of the finite-element method. Instead, it focuses on the development of a simple, approximate,uni-axial tow model that describes the stress–strain response of a fibre tow andassociated matrices and the dependency of axial and transverse tow thermalconductivities on axial tow strain. Two classes of fibre tow and associated matricesare considered here. They are: (i) C/C–SiC DLR-XT material (Krenkel 2005) and(ii) C–C HITCO material (R. Mathur 1991, personal communication). The former
Proc. R. Soc. A (2009)
on June 15, 2018http://rspa.royalsocietypublishing.org/Downloaded from

2852 C. Tang et al.
carbon fibre
amorphouscarbon matrix
SiC matrix
(a) (b)
Figure 1. Schematic drawings of: (a) a DLR-XT C/C–SiC tow and (b) a HITCO C/C tow.
D
Eσmc CBEI
EI + ΔEI
A
stre
ss, σ
∞
strain, ε∞
Figure 2. Schematic diagram of a typical stress–strain curve for a uni-directional CMC tow.
material has been produced as a 10-high plain weave laminate and the latteras a 9-high 8-harness satin weave laminate. The tow configurations associatedwith these materials are shown schematically in figure 1 for an idealized tow ofrectangular cross section.
The paper reports the uni-axial thermo-mechanical tow theory and theidentification of those damage mechanisms that are responsible for thedegradation of tow thermal properties with strain. The next section addressesmechanical behaviour at the tow level.
2. Mechanical behaviour
(a) Stress–strain response and length scale
(i) Stress–strain analysis of uni-directional tow model
When a uni-directional fibre-reinforced CMC is under remote tensile stress,σ∞, the schematic stress–strain response shown in figure 2 can be observed(Hayhurst et al. 1991).
Proc. R. Soc. A (2009)
on June 15, 2018http://rspa.royalsocietypublishing.org/Downloaded from

Thermo-mechanical behaviour of CMC tows 2853
(b)
(c)
(a)
σ∞
σ∞
Figure 3. Continuous cracking of matrix: (a) characteristic spacing of matrix crack, (b) matrixcrack and (c) a uni-directional fibre.
The four characteristic stages in the stress–strain curve are now described.
AB: initially, the composite behaves as a virgin, undamaged, linear elasticmaterial,
BC: periodic matrix cracking with intact fibre bridging (Evans & Marshall1989) originates from pre-existing flaws, which can occur in manufacture(figure 3), and forms a continuum of matrix crack damage,
CD: weaker fibres fail and determine the maximum stress, andDE: the majority of fibres fail and are pulled out against the frictional shear
stress along the interface, hence giving the brittle material ‘toughness’.
Two assumptions are made in the σ−ε model (Hayhurst et al. 1991). First, theaverage nominal stress on the fibres (load/total initial fibre area) can be expressedas a function of the damage variable, ω = r/n, where r is the number of failedfibres and n is the total number of fibres. In this paper, ω is treated as a continuumdamage parameter, and, in the same way as stress and strain, it has continuumproperties. The nominal stress has two contributions: to extend the fibres andto pull out failed fibres from the matrix. Second, the strain of the compositeis controlled by two aspects of the elasticity of the unfailed fibres: (i) the stressincrement required to change the damage at constant elastic modulus and (ii) thechange in strain, at constant stress, owing to the change in current modulus. Thisis expressed as
dεf
dσf= ∂εf
∂σf+ ∂εf
∂E(ω)
dE(ω)
dω
dω
dσf, (2.1)
Proc. R. Soc. A (2009)
on June 15, 2018http://rspa.royalsocietypublishing.org/Downloaded from

2854 C. Tang et al.
where the subscript ‘f’ refers to fibres. This relationship can be rewritten in termsof the global or composite stress, σ∞, and strain, ε∞. Before matrix cracking(σ∞ < σmc), the effect of damage on Young’s modulus of the fibres is insignificant,and the second term on the right-hand side of equation (2.1) can be neglected;hence, σf and εf for the fibres can then be replaced by σ∞ and ε∞. After matrixcracking (σ∞ > σmc), the majority of the load is carried both by fibres and by fibrepullout. The strain εf is set equal to ε∞, the stress σf becomes σ∞/Vf (Hayhurstet al. 1991) and equation (2.1) can be written as
dλ∞dΣ∞
= ∂λ∞∂Σ∞
+ Vf∂λ∞
∂E(ω)
dE(ω)
dω
dω
dΣ∞, (2.2)
where λ∞ = ε∞/εff , Σ∞ = σ∞/σff , εff = σff/EI, EI is the initial Young’s modulus ofthe entire composite and is given by EI = VfEf + VimEim, Vf and Vim denotethe volume fraction of fibres and inner matrix, respectively, Ef and Eim denoteYoung’s moduli of the materials and σff is the average Weibull (1939) fibre failurestress. The term E(ω) in equations (2.1) and (2.2) refers to the change in Young’smodulus caused by the failure of the fibres after matrix cracking.
A considerable amount of micro-structural evidence shows that, whenreinforced ceramic composites are subjected to homogeneous states ofuni-directional stress, failure of the matrix takes place at σ∞ = σmc, not bythe propagation of a single dominant crack, but by the development of afield of matrix cracks with periodical crack spacing, w, shown in figure 3(Aveston et al. 1971; Hashin 1980). Namely, a stable continuum damage field isestablished.
(ii) Effect of damage on remote composite elastic modulus
After matrix cracking, the elastic modulus is assumed to be ΘEI, where Θ is aparameter relating to the change of Young’s modulus due to matrix cracking atσmc and Θ = (EI + EI)/EI (figure 2). It is assumed that once matrix cracking hasoccurred, all direct load-carrying capability of the matrix is lost, therefore EI =−VimEim. For subsequent values of ω, the value of Young’s modulus is E(ω) =ΘEI(1 − ω); however, because of the interaction between matrix and fibres, thisrelationship is nonlinear and is assumed to be (Hayhurst et al. 1991)
E(ω) = ΘEI(1 − ω)B , (2.3)
where B ≥ 1 is the elastic modulus decay index (Vavakin & Salganik 1975;Budiansky & O’Connell 1976), and for simplicity has been given the value of unity.
(iii) Contribution to overall axial force from unfailed fibres
Weibull (1939) statistics will be used to describe the failure of the brittlefibres. It is assumed that the strength, σf , of a particular fibre depends on itsphysical length, , a reference length, 0, the average failure strength of thefibres, σff , and the Weibull index, m. Based on the statistical model of Hult &Travnicek (1983), and on the length scale theory by Jansson & Leckie (1992) and
Proc. R. Soc. A (2009)
on June 15, 2018http://rspa.royalsocietypublishing.org/Downloaded from

Thermo-mechanical behaviour of CMC tows 2855
Ashby & Jones (2005), the probability of the fibre failure at a stress σf is
F(σf) = ω = 1 −[exp
{−
(
0
) (σf
σff
)m}], (2.4)
where the length scale ratio of 0/ = 1 has been used throughout this paper.When fibres begin to fail, 0 ≤ r ≤ n, stresses are redistributed among the
unfailed fibres, and the stress on intact fibres is expressed in terms of the nominalfibre stress, σ0,
σf = σ0
1 − ω. (2.5)
Combination of equations (2.4) and (2.5) yields
Σ0 = σ0
σff= (1 − ω)
[−
(0
)ln(1 − ω)
]1/m
. (2.6)
As fibre–matrix interfacial debonding will influence equation (2.5) more stronglythan reflected by the linear term (1 − ω), this term will be replaced by (1 − ω)A,where A is a constant to be determined by experiment (Hayhurst et al. 1991).Then, equation (2.6) becomes
Σ0 = σ0
σff= (1 − ω)A
[−
(0
)ln(1 − ω)
]1/m
. (2.7)
(iv) Contribution to overall axial force from pullout of failed fibres
By considering a fibre that fails at ωpo and is then pulled out at the stress σpo,the normalized pullout stress of a single fibre can be written as
σpo
σff= S
[1 − ω
1 − ωpo
]D
, (2.8)
where S(= σmaxpo /σff) is the maximum normalized pullout stress and D is a
parameter that controls the nonlinear decay of the pullout stress. Calibrationof D is addressed in §2b. Integration of equation (2.8), at the current damagevariable, ωpo, gives the contribution of all failed fibres as
σpo
σff=
∫ωpo=ω
ωpo=0S
[1 − ω
1 − ωpo
]D
dωpo = S{ [(1 − ω)D − (1 − ω)]
1 − D
}. (2.9)
(v) Overall axial force
The total stress on the fibres involves contributions from both the failed andunfailed fibres, and summation of these two terms yields (Hayhurst et al. 1991)
Σ0 = σ0
σff= Σ∞
Vf= Σf(1 − ω)A = (1 − ω)A
[−
(0
)ln(1 − ω)
]1/m
+ S [(1 − ω)D − (1 − ω)]1 − D
. (2.10)
Proc. R. Soc. A (2009)
on June 15, 2018http://rspa.royalsocietypublishing.org/Downloaded from

2856 C. Tang et al.
0
0.1
0.2
0.3
0.2 0.4 0.6 0.8 1.0
norm
aliz
ed s
tres
s, Σ
∞
normalized composite strain, λ∞
Figure 4. Stress–strain curve of a typical uni-directional tow.
Differentiation of equation (2.10) with respect to ω gives
dω
dΣ∞= 1
Vf
[(0
)1/m
(1 − ω)(A−1)
[1m
[− ln(1 − ω)](1−m)/m − A[− ln(1 − ω)]1/m]
+ S(1 − D(1 − ω)D−1)
1 − D
]−1
. (2.11)
Combination of equations (2.2), (2.3) and (2.11) gives
dλ∞dΣ∞
=[(
0
)1/m
(1 − ω)A−1[−
(1m
)ln(1 − ω)
](1−m)/m
− A[− ln(1 − ω)]1/m
+{S
[(1 − ω)D − (1 − ω)]1 − D
}](σ0/σff)B
Θ(1 − ω)B+1+ 1
Θ(1 − ω)B. (2.12)
Equation (2.12) describes the normalized stress–strain relationship for auni-directional tow; this is shown in figure 4 for typical material properties:A = 1.025, B = 1, D = 0.1375, S = 0.103, m = 4.8, σff = 1.748 GPa, σmc =108.5 MPa, Θ = 0.937, Ef = 294 GPa, Eim = 62.56 GPa, Vf = 0.494, Vim = 0.156and Vom = 0.35. The value of Θ depends on whether matrix cracking has occurred.Prior to matrix cracking, it is unity, as the initial modulus is unchanged.After matrix cracking, it is calculated (for the parameters given earlier) by theequation Θ = (EI + EI)/EI = 0.937, previously discussed in §2a(ii). This changein slope takes place at the strain level λmc = 0.062, and figure 4 shows it to beinsignificant. Equation (2.12) allows the stress–strain tow response to be predictedfrom constituent material properties and some relatively insensitive empiricalparameters. In the following sections, the calibration of D is addressed, andthen the model will be used to study the degradation of thermal properties withnormalized composite strain, λ∞.
Proc. R. Soc. A (2009)
on June 15, 2018http://rspa.royalsocietypublishing.org/Downloaded from

Thermo-mechanical behaviour of CMC tows 2857
U0
hδf
ξ
Figure 5. Schematic diagram of fibre pullout near a single matrix crack.
It is worth addressing how the stress–strain curve shown in figure 4 for theuni-axial tow might be influenced by multi-axial loading. It is expected that theapplication of either a small orthogonal tension stress or a small shear stress in aplane either parallel or perpendicular to the tow axis would attenuate the curvein figure 4. Two alternative outcomes might be expected. First, wake debonding,and the contribution of stress owing to fibre pullout, could be negated, as shownby Hayhurst et al. (1991) in fig. 7 of that paper. Second, this first mechanismcould be enhanced by catastrophic fibre failure following wake debonding. Thefirst alternative would produce a steadily decreasing stress–strain curve, and thesecond option would give a sudden drop in stress at constant strain. It is the latterthat is often observed in experimental data (Sheikh et al. in press). These optionshave been explored by Zhang & Hayhurst (2009).
(b) Calibration of fibre pullout stress decay index D
In this section, the mechanisms of matrix cracking, fibre failure and fibrepullout are each discussed in turn. An expression is derived for the variation offibre pullout distance with strain and damage, which can then be used to calibrateD. Fibre pullout adjacent to a single matrix crack, of the type represented infigure 3, is shown schematically in figure 5. In the figure, δf represents the fibrepullout distance after failure, h is the average failure location after all fibres fail(Thouless & Evans 1988), U0 is the equilibrium separation distance of adjacentcracked matrix surfaces (Marshall et al. 1985) and ξ is the remaining embeddedlength of failed fibre within the matrix.
(i) Matrix cracking separation distance
For steady-state crack propagation, the distance between two parallel matrixsurfaces will reach an equilibrium distance 2U0 (Marshall et al. 1985) (cf.experiments carried out by Jansson & Leckie 1992). The expression for U0 is
U0 = σ 2mcDf
8[τpoV 2f Ef(1 + EfVf/EimVim] , (2.13)
where Df is the fibre diameter and τpo is the constant fibre pullout interfacialshear stress.
Proc. R. Soc. A (2009)
on June 15, 2018http://rspa.royalsocietypublishing.org/Downloaded from

2858 C. Tang et al.
Df
S(b)(a)
damage variable, w
0.30.6
D = 1
0 1
ξ
σpo
σ/σ ff
τpo
wpo
Figure 6. Schematic diagram showing: (a) pullout of an arbitrary fibre and (b) the decrease in fibrepullout stress in an individual fibre σpo with ω, which fails arbitrarily at ωpo, for different valuesof D.
(ii) Fibre failure and pullout
Fibre strength varies statistically, resulting in different fibre failure stresses andlocations. The average fibre failure location, when all the fibres have failed, hasbeen determined by Thouless & Evans (1988) using a statistical approach,
h =(
A0
2πDf
) (σff
Ω
)mΓ
[m + 2m + 1
], (2.14)
where Ω = [2A0σmff τpo(m + 1)/πD2
f ]1/(m+1), A0 is an arbitrary normalizing area,defined such that A1/m
0 σff is constant and Γ is the complete gamma functionΓ (n) = ∫∞
0 xn−1e−x dx , where x ≥ 0 is an arbitrary variable (Thouless & Evans1988). The term h will be used to determine the variation of the failed fibrepullout distance with damage, ω, and normalized composite strain, λ∞.
A fibre having failed at ωpo sustains a normalized stress (σpo/σff), given byequation (2.8). The pullout process and the decay of the pullout stress are shownin figure 6. There are only two stresses acting along the axis of a failed fibre: thepullout stress σpo and the equilibrating frictional stress around its surface, τ .The remaining embedded length of the fibre, ξ , can be derived by equatingthe frictional force with the pullout force given in equation (2.8). Assumingthe frictional resistance stress, τ , to be constant (τpo), the force equilibriumequation is
πDfτpoξ = S[
1 − ω
1 − ωpo
]DσffπD2
f
4. (2.15)
Rearrangement of equation (2.15) gives
ξ =(
SDfσff
4τpo
) [1 − ω
1 − ωpo
]D
. (2.16)
Proc. R. Soc. A (2009)
on June 15, 2018http://rspa.royalsocietypublishing.org/Downloaded from

Thermo-mechanical behaviour of CMC tows 2859
–1
0
1
2
0.5 1.51.0
norm
aliz
ed p
ullo
ut d
ista
nce,
δ f / D
f
normalized composite strain, λ∞
D = 0.2300
D = 0.1375
D = 0.0300
Figure 7. Normalized pullout distance of a uni-directional tow.
It can be observed, from figure 5, that the pullout distance, δf , can be expressedby the subtraction of U0 and ξ from the average failure location of the fibre
δf = h − U0 − ξ . (2.17)
Substitution of h, U0 and ξ into equation (2.17) gives an expression for the fibrepullout distance,
δf
Df= A0
2πD2f
(σff
Ω
)mΓ
[(m + 2)
(m + 1)
]− σ 2
mc
8[τpoV 2f Ef(1 + EfVf)/EimVim]
− Sσff
4τpo
[(1 − ω)
(1 − ωpo)
]D
. (2.18)
When normalized pullout distance, δf/Df , is plotted against normalized compositestrain, λ∞, it becomes evident that the selection of the value of D is crucial tomaintaining the physical sense of the equation. Namely, D influences the predictednormalized stress–strain curve and the value of δf/Df when λ∞ = 0. It is thereforenecessary to determine D such that δf/Df = 0 when λ∞ = 0 (cf. figure 7).
The set of typical material properties, defined in §2a(iv), together withτpo = 10 MPa, Df = 5.5 μm, A0 = 0.4 m2, ωpo = 0.622 and an optimized value ofD = 0.1375, have been used to determine the variation of δf/Df with normalizedcomposite strain; the results are presented in figure 7.
(c) Discussion on mechanical response
The normalized stress–strain tow response and the normalized pulloutdistance-composite strain response have been predicted and are shown infigures 4 and 7 respectively. Both figures reflect the known macroscopic compositebehaviour (Jansson & Leckie 1992; Sheikh et al. in press).
The fidelity of the model tow predictions can only be assessed after unit cellbehaviour has been analysed for the woven laminates that have been used to testindustrial samples of the composite. This will be addressed in subsequent papers(Tang et al. 2009; Zhang & Hayhurst 2009).
Proc. R. Soc. A (2009)
on June 15, 2018http://rspa.royalsocietypublishing.org/Downloaded from

2860 C. Tang et al.
3. Thermal behaviour
(a) Longitudinal thermal response of a uni-directional tow
The thermal response of a CMC under tension is usually measured in termsof the degradation of thermal conductivity, k, with respect to strain. The initiallongitudinal thermal conductivity, k Initial
L , of a typical tow that consists of an innertow matrix and an outer composite matrix (figure 1a) can be represented by asimple one-dimensional parallel rule of mixtures model, and can be expressed by
k InitialL = kf//Vf + k imVim + k omVom + k airVair, (3.1)
where kf// represents the thermal conductivity of fibres in the longitudinaldirection, kim and kom are the thermal conductivities of the inner tow matrixand the outer composite matrix, respectively, Vom is the volume fraction of theouter matrix and kair and Vair are the thermal conductivity and volume fraction ofinitial porosity present in the tow. For a material with a single inner tow matrix,the term komVom is omitted, and since kair ≈ 0, the term kairVair is also neglected.
Micrographs (Del Puglia et al. 2004a) show that the outer matrix of atypical CMC is subjected to cracking in manufacture, which occurs on planesperpendicular to the tow axis. The consequence of matrix cracking is to create athermal barrier across the cracks and thus prevent heat flow through the matrix.According to Lu & Hutchinson (1996), the air gap must be at least 0.1 μm toprevent heat flow effectively. Hence, kom parallel to the tow axis becomes zeroduring manufacture. In addition, after cracking of the inner matrix because ofapplied strain, the right-hand side of equation (3.1) reduces to kf//Vf .
As well as matrix cracking, fibre failure must also be taken into account. Oncea fibre has failed and an air gap generated, it is assumed that it can no longerconduct heat along it owing to the distance between the fibre ends at the failurepoint being greater than 0.1 μm. Since the damage variable, ω, is directly relatedto the number of failed fibres, the following relationship can be obtained for thelongitudinal thermal conductivity of a single tow:
kL = kf//Vf(1 − ω) + kimVim. (3.2)
Equations (2.11) and (2.12) can be coupled to yield an expression for dω/dλ∞;this expression has been integrated numerically and, together with equation (3.2),produces the kL/k Initial
L − λ∞ curve, shown in figure 8, for typical material datadefined in §2a(v) with kf// = 40 W m−1K−1 and kim = 10 W m−1K−1.
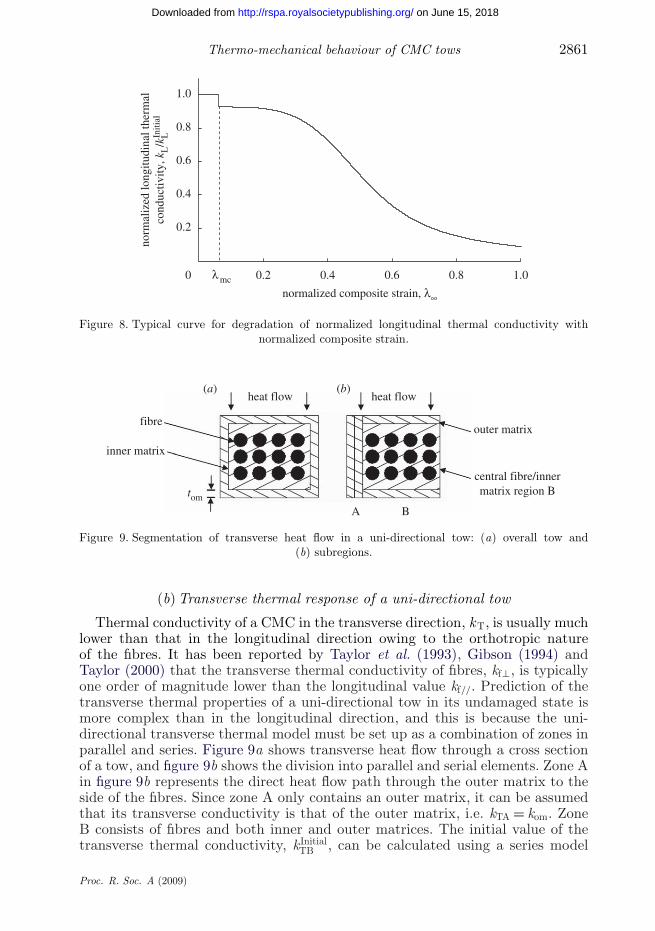
The effect of cracking within the inner matrix is significant and shows asharp drop in conductivity at the matrix cracking strain, λmc = 0.062. The curveproceeds at a near-constant thermal conductivity until the majority of fibres beginto fail at λ∞ ≈ 0.3−0.5. Between normalized strains of 0.3 and 1.0, approximately80 per cent of thermal conductivity is lost. After this, the remaining conductivityreduces to zero as the remaining fibres fail.
There is no experimental data available to categorize the longitudinal thermalresponse of CMCs under in-plane tensile straining.
Proc. R. Soc. A (2009)
on June 15, 2018http://rspa.royalsocietypublishing.org/Downloaded from
Thermo-mechanical behaviour of CMC tows 2861
0
0.2
0.4
0.6
0.8
1.0
0.2 0.4 0.6 0.8 1.0
normalized composite strain, λ∞
norm
aliz
ed lo
ngitu
dina
l the
rmal
cond
uctiv
ity, k
L/k
LIniti
al
λ mc
Figure 8. Typical curve for degradation of normalized longitudinal thermal conductivity withnormalized composite strain.
heat flow heat flow (a) (b)
fibre
inner matrix
outer matrix
A B
central fibre/innermatrix region Btom
Figure 9. Segmentation of transverse heat flow in a uni-directional tow: (a) overall tow and(b) subregions.
(b) Transverse thermal response of a uni-directional tow
Thermal conductivity of a CMC in the transverse direction, kT, is usually muchlower than that in the longitudinal direction owing to the orthotropic natureof the fibres. It has been reported by Taylor et al. (1993), Gibson (1994) andTaylor (2000) that the transverse thermal conductivity of fibres, kf⊥, is typicallyone order of magnitude lower than the longitudinal value kf//. Prediction of thetransverse thermal properties of a uni-directional tow in its undamaged state ismore complex than in the longitudinal direction, and this is because the uni-directional transverse thermal model must be set up as a combination of zones inparallel and series. Figure 9a shows transverse heat flow through a cross sectionof a tow, and figure 9b shows the division into parallel and serial elements. Zone Ain figure 9b represents the direct heat flow path through the outer matrix to theside of the fibres. Since zone A only contains an outer matrix, it can be assumedthat its transverse conductivity is that of the outer matrix, i.e. kTA = kom. ZoneB consists of fibres and both inner and outer matrices. The initial value of thetransverse thermal conductivity, k Initial
TB , can be calculated using a series model
Proc. R. Soc. A (2009)
on June 15, 2018http://rspa.royalsocietypublishing.org/Downloaded from

2862 C. Tang et al.
comprising the two different regions. The first region consists of only the top andbottom layers of outer matrix, and can be assumed to have a thermal conductivityof the outer matrix, kom. The second or central region contains both fibre andinner matrix material. The initial transverse thermal conductivity of this region,k InitialTB.Cent., can be calculated using the following equation:
1 − V B.Cent.f = kf⊥ − k Initial
TB.Cent.
kf⊥ − kim
[kim
k InitialTB.Cent.
]1/(X+1)
, (3.3)
where V B.Cent.f is the volume fraction of fibres in the central region of zone B.
This expression, which can be found as eqn (12) in Mottram & Taylor (1987),has its origins in the work of Rayleigh (1892) and subsequently that of Bruggeman(1935). This development has been reviewed by Clayton (1971) and formalizedby Mottram & Taylor (1987) and Whittaker & Taylor (1990). Equation (3.3)describes transverse heat conduction through a two-phase medium: the innermatrix material is treated as the continuous phase and the cylindrical fibresas the discontinuous phase. The shape factor X = 1 relates to a regular arrayof cylindrical fibres. Rearrangement of equation (3.3) gives k Initial
TB.Cent. in terms ofkim, kf⊥ and V B.Cent.
f ,
k InitialTB.Cent. =
12kim
[α ±
√α2 − 4k2
f⊥k2im
], (3.4)
where α = (k2f⊥ + k2
im)(1 − V B.Cent.f )2 + 2kf⊥kimV B.Cent.
f (2 − V B.Cent.f ). The central
region and outer matrix region in zone B in figure 9b can now be coupled todetermine the overall transverse thermal conductivity of zone B, kTB, using asimple series heat flow equation,
kTB = kTB.Cent.komVB
kTB.Cent.V Bom + kom(Vf + Vim)
, (3.5)
where V represents volume, i.e. V Bom is the volume of outer matrix material
within zone B. Consideration of heat flux through zones A and B using asimple parallel model yields the following expression for overall transverse thermalconductivity, kT:
kT = kTAVA + kTBVB, (3.6)
where VA and VB are volume fractions of zones A and B, respectively. Fora material with a single matrix, kom is removed from the derivation, andequation (3.6) simply becomes
kT = kTB.Cent.. (3.7)
(i) Principle damage mechanisms affecting transverse thermal conductivity
To predict the degradation of transverse thermal conductivity of a tow, it isnecessary to consider the initiation and growth of damage by the predominantmechanisms active during axial loading. These damage mechanisms must be
Proc. R. Soc. A (2009)
on June 15, 2018http://rspa.royalsocietypublishing.org/Downloaded from

Thermo-mechanical behaviour of CMC tows 2863
–1
distance from the free surface of the matrix on the left-hand side
0
1
x
/2no
rmal
ized
she
ar s
tres
s, T
Figure 10. Schematic diagram of the shear stress distribution along the fibre axis.
considered separately and then, if necessary, coupled to form a prediction of theoverall degradation. Mechanisms that involve pockets of air between adjacenttows, categorized as Class D porosity by Del Puglia et al. (2005), have not beenaddressed here, as they do not relate to tow behaviour, are stable and unlikely toproduce changes in transverse thermal conductivity with strain. Four inter-fibremicro-porosity damage mechanisms are considered here:
(i) crack front and wake debonding,(ii) spherical pores,(iii) shrinkage debonded cracks, and(iv) fibre failure and pullout.
All four of these strain-dependent damage mechanisms influence only the thermalconductivity of zone B, shown in figure 9b. The transverse thermal conductivityof zone A is assumed to be unaffected by strain. Hence, in subsequent sections,all thermal conductivities are calculated for zone B only.
The mechanism of crack front and wake debonding has been found toprincipally affect the transverse thermal conductance, and it will now beaddressed. Each of the remaining failure mechanisms is discussed in detail inappendix A.
Crack front and wake debonding damage precedes fibre failure and takesplace at both the matrix crack tip and, more significantly, in its wake. It isassumed to completely surround the fibre, thus preventing heat flow throughthat region. Wake debonding is triggered, similarly to shrinkage debonding, bythe interfacial shear stress between the inner matrix and fibre. As shown infigure 10, the maximum levels of shear stress occur at the locations of the matrixcracks, x = 0 and x = w; therefore, when the shear stresses at these locationsreach the critical level, wake debonding will propagate from x = 0 and x = wand move towards the centre (x = w/2) until saturation. This mechanism isthe strongest, and most prevalent, and will be assumed to control transversethermal conductivity. To quantify this, an assemblage of simple representativevolume elements or blocks (figure 11b) taken from a single tow (figure 11a)are analysed.
Proc. R. Soc. A (2009)
on June 15, 2018http://rspa.royalsocietypublishing.org/Downloaded from

2864 C. Tang et al.
(a)
(b)
heatflow
Figure 11. (a) Schematic representation of the division of the composite tow into blocks of lengthequal to the matrix crack spacing w and fibres denoted by solid ellipses and (b) representation ofa single conducting block.
(ii) Analysis of a fibre–matrix block between adjacent matrix cracks
The central region of zone B in figure 9 is shown schematically in figure 11. Thesolid ellipses denote cross sections of fibres passing through the tow. The cross-sectional arrangement of fibres in the tow is assumed constant along its length.The tow can be further broken down into a series of blocks, as shown in figure11a, where the length of each block is the matrix crack spacing w. Each fibrepasses through a series of blocks. A single block, shown in figure 11b, containsone fibre that will fail at an unknown damage level, ω. Fibres within a tow areassumed to be uniformly arranged into a number of layers, ψ , each containing anequal number of fibres, η. The number of matrix crack spacings, ϕ, is given by
ϕ = Gw
, (3.8)
where G is the total length of the parallel segments of one tow contained withina composite unit cell. The total number of blocks, Nblock, is therefore given by
Nblock = ηϕψ . (3.9)
The volume of air created by matrix cracking will not be considered in thisanalysis because the ratio between the matrix crack separation, 2U0, and thematrix crack spacing, w + 2U0, is less than 0.01 per cent, and therefore, thevolume of air created at matrix cracking is negligible.
(iii) Wake debonding and transverse thermal conductivity
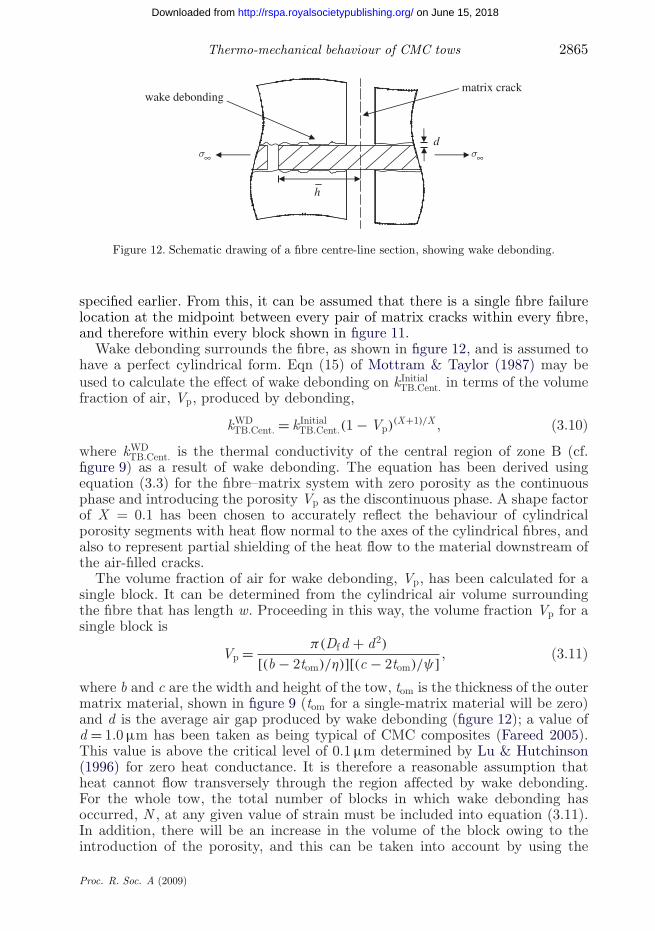
Wake debonding allows stresses to redistribute throughout the material andthus avoid high local stress concentrations. It is assumed to occur before fibrefailure and occupies a region from the matrix crack to the fibre failure location, h(figure 12). For a typical material, Jansson & Leckie (1992) have determined that2h ≈ w, and this has been confirmed by calculations using the material parameters
Proc. R. Soc. A (2009)
on June 15, 2018http://rspa.royalsocietypublishing.org/Downloaded from
Thermo-mechanical behaviour of CMC tows 2865
σ∞ σ∞
matrix crackwake debonding
d
h
Figure 12. Schematic drawing of a fibre centre-line section, showing wake debonding.
specified earlier. From this, it can be assumed that there is a single fibre failurelocation at the midpoint between every pair of matrix cracks within every fibre,and therefore within every block shown in figure 11.
Wake debonding surrounds the fibre, as shown in figure 12, and is assumed tohave a perfect cylindrical form. Eqn (15) of Mottram & Taylor (1987) may beused to calculate the effect of wake debonding on k Initial
TB.Cent. in terms of the volumefraction of air, Vp, produced by debonding,
kWDTB.Cent. = k Initial
TB.Cent.(1 − Vp)(X+1)/X , (3.10)
where kWDTB.Cent. is the thermal conductivity of the central region of zone B (cf.
figure 9) as a result of wake debonding. The equation has been derived usingequation (3.3) for the fibre–matrix system with zero porosity as the continuousphase and introducing the porosity Vp as the discontinuous phase. A shape factorof X = 0.1 has been chosen to accurately reflect the behaviour of cylindricalporosity segments with heat flow normal to the axes of the cylindrical fibres, andalso to represent partial shielding of the heat flow to the material downstream ofthe air-filled cracks.
The volume fraction of air for wake debonding, Vp, has been calculated for asingle block. It can be determined from the cylindrical air volume surroundingthe fibre that has length w. Proceeding in this way, the volume fraction Vp for asingle block is
Vp = π(Dfd + d2)
[(b − 2tom)/η)][(c − 2tom)/ψ] , (3.11)
where b and c are the width and height of the tow, tom is the thickness of the outermatrix material, shown in figure 9 (tom for a single-matrix material will be zero)and d is the average air gap produced by wake debonding (figure 12); a value ofd = 1.0 μm has been taken as being typical of CMC composites (Fareed 2005).This value is above the critical level of 0.1 μm determined by Lu & Hutchinson(1996) for zero heat conductance. It is therefore a reasonable assumption thatheat cannot flow transversely through the region affected by wake debonding.For the whole tow, the total number of blocks in which wake debonding hasoccurred, N , at any given value of strain must be included into equation (3.11).In addition, there will be an increase in the volume of the block owing to theintroduction of the porosity, and this can be taken into account by using the
Proc. R. Soc. A (2009)
on June 15, 2018http://rspa.royalsocietypublishing.org/Downloaded from

2866 C. Tang et al.
0
10
20
30
40
50
0.1 0.2 0.3 0.4 0.5 0.6
shea
r st
ress
τ(x
= 0
), M
Pa
normalized composite strain, λ∞
Figure 13. Interfacial fibre–matrix shear stress at x = 0 for the blocks that have not wake debonded.
equation Vp = Vp/(VB.Cent. + Vp). Equation (3.11) for a single block then becomesthe following for the entire tow:
Vp = Nπ(Dfd + d2)
ϕ(b − 2tom)(c − 2tom) + Nπ(Dfd + d2). (3.12)
A model, based upon the maximum interfacial shear stress, has been developedto calculate the total number of wake-debonded blocks, N . After matrix cracking,fibres carry the majority of the load; however, before wake debonding occurs, asmall amount of the load is transferred to the matrix via the interfacial shearstress. Therefore, as the load in the fibres increases, so does this shear stress,until a critical value is reached at the location of the matrix crack, x = 0 (cf.appendix B), and wake debonding takes place. It is therefore important to beable to calculate the maximum shear stress along the fibre–matrix interface atdifferent levels of strain. An equation for the variation of shear stress, τ , at x = 0in an individual block, before the inception of wake debonding, with compositestrain is derived in appendix A and given as
τ(x = 0) = ((Σ∞σff/EfVf(1 − ω)A) − (λ∞σff/EI))EfAfβ2w
πDf(βw tanh−1[βw/2] − 1). (3.13)
Figure 13 shows the variation of τ(x = 0) with normalized composite strain, λ∞,in blocks that have not wake debonded. Prior to matrix cracking, λ∞ ≤ 0.062,the shear stress is assumed to be zero. This shear stress can be used to calculatethe total number of wake-debonded blocks using a statistical approach similar tothat used for fibre failure in equation (2.4),
NNblock
= Nηϕψ
= 1 −[exp
{−
(τ
τc
)g}], (3.14)
where g is the Weibull distribution index for interfacial shear failure and τc is theaverage critical shear stress for wake debonding. Initial values of τc = 25 MPa andg = 4.5 have been arbitrarily used for the illustrative calculations presented here.
Proc. R. Soc. A (2009)
on June 15, 2018http://rspa.royalsocietypublishing.org/Downloaded from

Thermo-mechanical behaviour of CMC tows 2867
Substitution of equation (3.14) into equation (3.12) gives the volume fraction ofporosity, Vp, in terms of shear stress,
Vp =(
Φ
[1 − exp
{−
(τ
τc
)g}]−1
+ 1
)−1
, (3.15)
where the constant Φ = (b − 2tom)(c − 2tom)/ηψπ(Dfd + d2). The overalldegradation of thermal conductivity can then be calculated by substitution ofequation (3.15) into equation (3.10),
kWDTB.Cent. = k Initial
TB.Cent.
⎡⎣1 −
(Φ
[1 − exp
{−
(τ
τc
)g}]−1
+ 1
)−1⎤⎦
(X+1)/X
. (3.16)
It is now possible to calculate the degradation of the transverse thermalconductivity of the central region of zone B (cf. figure 9) owing to wake debonding.The degradation of thermal conductivity of the whole tow can be determined byreplacing the kTB.Cent. term in equation (3.5) with kWD
TB.Cent. and substitution intoequation (3.6); further substitutions from equations (3.13) and (3.16) yield thefollowing expression for a dual-matrix material :
kT
kInitialT
= (kTAVA/kInitialT ) + (komVBVB/kInitial
T VB.Cent.)
(V Bom/VB.Cent.) + {(kInitial
TB.Cent./kom) · [1 − (Φ[1 − exp{−[(Σ∞σff/EfVf(1 − ω)A
−λ∞σff/EI)Ψ ]g}]−1 + 1)−1](X+1)/X }−1
,
(3.17)
where Ψ = EfAfβ2w/τcπDf(βw tanh−1[βw/2] − 1). Substitution of equations
(3.13) and (3.16) into equation (3.7) yields the following expression for asingle-matrix material :
kT
k InitialT
=⎡⎣1 −
(Φ
[1 − exp
{−
[(Σ∞σff
EfVf(1 − ω)A− λ∞σff
EI
)Ψ
]g}]−1
+ 1
)−1⎤⎦
(X+1)/X
.
(3.18)
The results for the variation of normalized transverse thermal conductivity,kT/k Initial
T with normalized composite strain, λ∞, predicted in this way for adual-matrix material using equation (3.18), are shown in figure 14 for typicalmaterial properties given in previous sections and tom = 0.0247 mm, ϕ = 56, b =0.803 mm, c = 0.161 mm, g = 4.5 and d = 1 μm, with three values of τc. The effectof wake debonding, shown in figure 14, is small at low values of strain becauseof the relatively small number of blocks that contain wake debonding. Thesharp drop in thermal conductivity at a normalized strain of around λ∞ = 0.062is caused by cracking of the inner matrix. This causes an increase in shearstress (cf. figure 13), which, in turn, results in wake debonding occurring in theweakest blocks. The curve then continues at a relatively constant value, owing tocomparatively constant shear stresses. At a normalized strain of approximatelyλ∞ ≈ 0.3−0.5, figure 13 shows that there is a rapid rise in shear stress that causesthe majority of wake debonding to occur; this results in the significant drop inthermal conductivity shown in figure 14. The value of thermal conductivity then
Proc. R. Soc. A (2009)
on June 15, 2018http://rspa.royalsocietypublishing.org/Downloaded from

2868 C. Tang et al.
0.1 0.2 0.3 0.4 0.5 0.6
τc = 30 MPa
τc = 20 MPa
τc = 25 MPa
normalized composite strain, λ∞
0
0.2
0.4
0.6
0.8
1.0
norm
aliz
ed tr
ansv
erse
ther
mal
cond
uctiv
ity, k
T/k
TIniti
al
Figure 14. The effect of variation of critical shear stress, τc, on normalized transverse thermalconductivity for Weibull index g = 4.5 and wake debonding air gap d = 1 μm.
levels off as all of the blocks contain wake debonding, and the only availableheat flow paths are through matrix material (zones A and matrix section of B infigure 9b). This latter feature is responsible for the final plateau of figure 14.
(iv) Sensitivity of kT to model parameters for a dual-matrix material
In the model for degradation of transverse thermal conductivity presentedearlier, three parameters have been identified that control the shape of the curvefor normalized transverse thermal conductivity with normalized composite strain;these are: (i) the critical shear stress for wake debonding, τc, (ii) the Weibulldistribution index for the fibre–matrix interface, g, and (iii) the wake debondingair gap distance, d. Presented in the following is a sensitivity study for each ofthese parameters to establish their effect on the kT/k Initial
T − λ∞ curve.
Critical shear stress for wake debonding, τc
The effect on the degradation of transverse thermal conductivity owing tothe critical shear stress for wake debonding, τc, is shown in figure 14. It can beseen that, as τc decreases, there is a greater reduction in thermal conductivity atmatrix cracking (λ∞ ≈ 0.062). For lower values of τc, a greater number of blockswill fail by wake debonding according to the Weibull distribution, and an earlierdegradation of the transverse thermal conductivity will occur. The minimumvalue of transverse thermal conductivity (λ∞ ≥ 0.55) is not affected by τc, as it isdetermined by the outer matrix and the remaining intact inner matrix material.
Weibull distribution index, g
The effect on normalized transverse thermal conductivity owing to thevariation of the Weibull distribution index, g, is presented in figure 15 forτc = 25 MPa and d = 1 μm. As g increases, fewer blocks will wake debond atshear stresses that deviate from τc. Hence, for larger values of g, the thermal
Proc. R. Soc. A (2009)
on June 15, 2018http://rspa.royalsocietypublishing.org/Downloaded from

Thermo-mechanical behaviour of CMC tows 2869
1.0
0
0.2
0.4
0.6
0.8
0.1 0.2 0.3 0.4 0.5 0.6
g = 5.0
g = 4.5
g = 4.0
normalized composite strain, λ∞
norm
aliz
ed tr
ansv
erse
ther
mal
cond
uctiv
ity, k
T/k
TIniti
al
Figure 15. The effect of variation of Weibull distribution index, g, on normalized transverse thermalconductivity for critical shear stress for wake debonding τc = 25 MPa and wake debonding air gapd = 1 μm.
0
0.2
0.4
0.6
0.8
1.0
0.1 0.2 0.3 0.4 0.5 0.6
d = 0.5 μm
d = 1.5 μm
d = 1.0 μm
normalized composite strain, λ∞
norm
aliz
ed tr
ansv
erse
ther
mal
cond
uctiv
ity, k
T/k
TIniti
al
Figure 16. The effect of variation of wake debonding air gap, d, on normalized transverse thermalconductivity for critical shear stress for wake debonding τc = 25 MPa and Weibull index g = 4.5.
conductivity curve experiences a lower drop at matrix cracking, and a steeperdecrease in thermal conductivity, when the majority of blocks wake debond(λ∞ ≈ 0.5). This is because wake debonding occurs over a smaller strain rangethan that for smaller values of g.
Wake debonding air gap distance, d
The effect on normalized transverse thermal conductivity owing to thevariation of the average wake debonding air gap distance, d, is shown in figure 16for τc = 25 MPa and g = 4.5. The major changes are at matrix cracking and onceall blocks have wake debonded (0.3 ≤ λ∞ ≤ 0.5). The value of d determines thevolume of porosity present in a wake-debonded block; therefore, as d increases,
Proc. R. Soc. A (2009)
on June 15, 2018http://rspa.royalsocietypublishing.org/Downloaded from

2870 C. Tang et al.
there will be more porosity present and the value of thermal conductivity willbe lower. The shape of the curve is unaffected because d does not determinethe number of blocks that contain wake debonding at any given value ofnormalized strain.
It is evident from this study that the curve for normalized transverse thermalconductivity against normalized strain is dependent on all three parameters, andno single parameter dominates. It is, however, clear that d controls the finalvalue of the thermal conductivity. It can also be argued that g controls thesteepness of the curve when the majority of degradation is taking place and thatτc influences the level of strain at which the majority of degradation occurs. Allthree parameters have some effect on the level of degradation at matrix cracking.In order to fit this model to experimental data, it is important to consider thesimultaneous effect of all three parameters.
(v) Influence of multi-axial stressing
It is worth addressing the question of how the normalized transverse thermalconductivity, kT/k Initial
T , curves against normalized composite strain, λ∞, might beinfluenced by multi-axial loading. As discussed in §2a(iv), the most deleteriousstress components are likely to be transverse tension and shear, either parallelor perpendicular to the tow axis. It has been argued, in that section, thattheir effect would be to negate the wake-debonding mechanism and effectivelyintroduce cylindrical air gaps along the fibres. If this is correct, the gentledecays in kT/k Initial
T with λ∞ shown in figures 14–16 may be replaced by suddendrops of kT/k Initial
T at almost constant strain. Data available on woven CMCcomposites by Sheikh et al. (in press) indicate that this could be the operativemechanism. For 0/90 and plain weave CMC composites, this is observed to bethe case, but the 8-harness satin weave composite does not show this mechanism.Hence, the tow model would require appropriate enhancement for multi-axialloading.
4. Discussion and conclusions
A uni-directional model has been developed for assemblages of fibres or towscontained within matrices, which describes the uni-directional stress–strainresponse, the axial and transverse thermal conductivities and their dependencieson axial composite strain. The stress–strain model includes the statistics of fibrefailure and fibre pullout on the stress–strain response.
The approximate thermal model is based on one-dimensional heat flowassumptions.
Longitudinal or axial tow thermal conductivity is considered to be degradedpredominantly by fibre failure, and its variation with composite axial strain hasbeen predicted by the model.
Transverse tow heat flow is considered to be degraded by four possiblemechanisms: (i) wake debonding at matrix cracks and its growth with strain, (ii)growth of spherical pores associated with porosity created during manufacturing/processing on the interface between fibre and matrix, (iii) shrinkage debonding,and (iv) fibre failure and pullout.
Proc. R. Soc. A (2009)
on June 15, 2018http://rspa.royalsocietypublishing.org/Downloaded from

Thermo-mechanical behaviour of CMC tows 2871
Wake debonding is relatively dormant in the early stages of composite straining,but predominates as the majority of fibres fail in the region of peak compositestress. It is dominated by the statistical variation of the interfacial shearstress required to initiate the mechanism, here assumed to be described by aWeibull distribution. The shape of the curve of normalized transverse thermalconductivity against axial normalized composite strain is sensitive to the Weibullindex, g, interfacial failure shear stress, τc, and the size of the air gap associatedwith wake debonding, d.
Spherical pore and shrinkage debonding mechanisms do not propagatesufficiently to degrade the transverse tow thermal conductivity.
Fibre failure and pullout occur after and within the same region as wakedebonding and therefore its effect on transverse thermal conductivity is negated.
The model predicts the expected shape of curve for the variation ofnormalized transverse thermal conductivity with axial composite strain for auni-directional tow.
To validate the uni-directional tow model, it is necessary to comparepredictions with experimental results on uni-directional composites. Since suchexperimental data for CMCs are not usually available, it is necessary to usedata for woven composite laminates. For the latter situations, the tows are notstraight and are subjected to multi-axial loading. Hence, before the fidelity of themodel predictions can be assessed, it is necessary to extend the tow model tomulti-axial stress conditions. An approximate model (Tang et al. 2009) has beendeveloped for this purpose and shows encouraging results, and an orthotropicmulti-linear elastic model (Zhang & Hayhurst 2009) addresses the complexitiesof the interaction of several damage mechanisms.
Appendix A. Failure mechanisms potentially affecting transverse thermalconductivity
In §3b(i), four damage mechanisms were cited, but only that owing to crack frontand wake debonding was considered in detail. The remaining three mechanismsare now addressed.
Inter-fibre micro-porosity occurs within the inner matrix material betweenfibres within a tow. It is made up of a number of voids or spherical pores and ofcracks known as shrinkage debonding (Del Puglia et al. 2004a). It is clear from themicrographs of the DLR-XT composite obtained by Del Puglia et al. (2004a) thatinter-fibre micro-porosity is present in the virgin material as a result of processing.In order to cause a degradation of transverse thermal conductivity upon loadingof the composite owing to spherical pores and shrinkage debonding, it is necessaryfor them to propagate. To assess whether this is likely, it is necessary to examinemicrographs of the composite to determine the location, relative size and spatialdistribution of the porosity. Each mechanism is now addressed.
Spherical pores. Examination of micrographs of DLR-XT reveals sphericalpores, described as Class A1 porosity by Del Puglia et al. (2005), cf. themicrograph of a section perpendicular to fibres given in figure 17a, and theschematic of a fibre segment removed from between two adjacent matrix cracks,of spacing w, as shown in figure 17b. The spherical pores are adjacent to thefibres, randomly dispersed in the inner matrix and have diameter, q, which is
Proc. R. Soc. A (2009)
on June 15, 2018http://rspa.royalsocietypublishing.org/Downloaded from

2872 C. Tang et al.
A2 (b)
A1
(a)
Figure 17. (a) DLR-XT micrograph (Del Puglia et al. 2004a, 2005) and (b) schematic showinginter-fibre micro-porosity: A1, spherical pores; A2, shrinkage debonding.
a fraction of a micron. Propagation of spherical pores is strain controlled, andthe growth of the porosity will be determined by q = f (εim, q), where q is thechange in spherical pore size and εim is the strain within the inner matrix. Thestrain field, εim, is strongly constrained by the adjacent stiff fibres; this, coupledwith the small physical size of spherical pores, relative to the fibres, and theirlow concentration means that growth will be negligible. Hence, their effect on thedegradation of transverse thermal conductivity can be safely neglected.
Shrinkage debonding (Del Puglia et al. 2004a) occurs at the interface betweenthe inner matrix and fibres, as shown in figure 17. It has been termed ClassA2 porosity by Del Puglia et al. (2005), and observed from micrographs to berandomly dispersed along the interface, with varying crack lengths. The shapeof the thin shrinkage debonded interfacial cracks is typically circular/elliptical,with a characteristic dimension of approximately one-tenth of the fibre diameter.Propagation of shrinkage debonding occurs when the interfacial shear stressbetween the fibres and inner matrix reaches a critical level. When this levelis achieved, the crack extends along the interface and reduces the transversethermal conductivity accordingly. An expression can be derived (appendix B)for the shear stress at any position along the fibre–matrix interface between twomatrix cracks. This model is dependent upon the stress within the fibres andthe overall composite strain. Figure 10 shows that the shear stress significantlyreduces with distance along the fibre, x , to zero at x = w/2. An assessment ofthe effects of shrinkage debonding on transverse thermal conductivity has beencarried out based on the critical shear stress required to propagate an interfacialfibre–matrix crack.
Owing to the dilute concentration of shrinkage debonded cracks, thesurrounding strain field is close to that found in the absence of the cracks, andthe shrinkage debonded crack tip displacements are strongly constrained. Hence,the interfacial shear stress τ does not reach the critical value required for crackpropagation, even at the fibre–matrix interface near the matrix crack (x = 0),where the shear stresses are highest, cf. equation (B 12). Consequently, shrinkagedebonded cracks are unlikely to propagate, will have a minimal effect on theoverall transverse conductivity and can be neglected.
Fibre failure and subsequent pullout creates an air gap where the fibre has beenpulled out. This air gap is assumed to have zero conductivity and could, therefore,have an effect on transverse thermal conductivity. However, fibre pullout takes
Proc. R. Soc. A (2009)
on June 15, 2018http://rspa.royalsocietypublishing.org/Downloaded from
Thermo-mechanical behaviour of CMC tows 2873
Vf (1–w)A
σ∞Vf (1–w)A
σ∞
τ (x)
x
Figure 18. Schematic diagram showing a single block between two successive matrix cracks.
place after wake debonding has occurred, and since wake debonding is assumedto surround the fibre, it thus prevents heat flow through it. The effect of fibrepullout is therefore already taken into account through wake debonding, and canbe neglected.
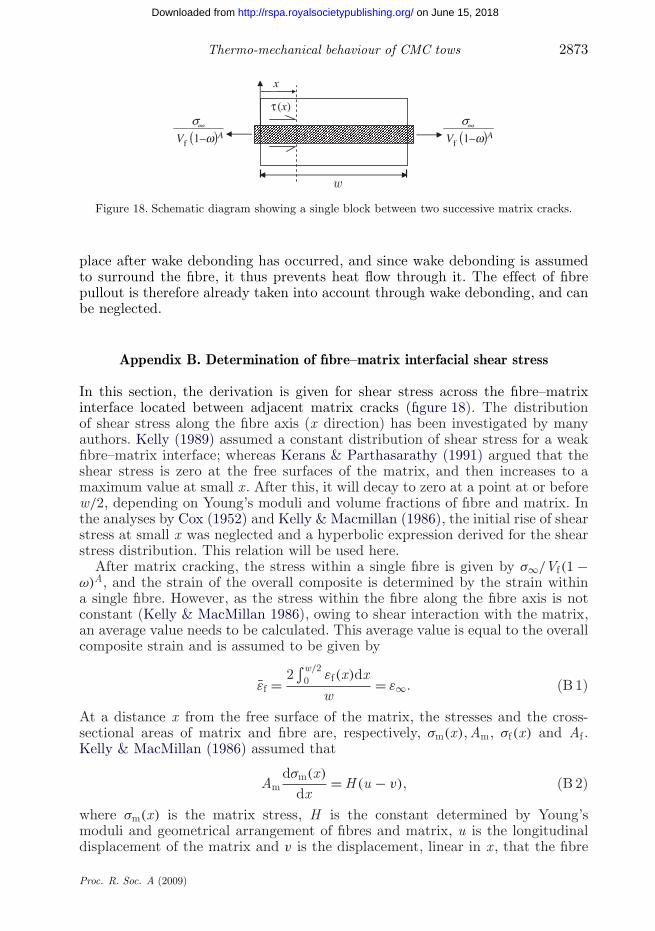
Appendix B. Determination of fibre–matrix interfacial shear stress
In this section, the derivation is given for shear stress across the fibre–matrixinterface located between adjacent matrix cracks (figure 18). The distributionof shear stress along the fibre axis (x direction) has been investigated by manyauthors. Kelly (1989) assumed a constant distribution of shear stress for a weakfibre–matrix interface; whereas Kerans & Parthasarathy (1991) argued that theshear stress is zero at the free surfaces of the matrix, and then increases to amaximum value at small x . After this, it will decay to zero at a point at or beforew/2, depending on Young’s moduli and volume fractions of fibre and matrix. Inthe analyses by Cox (1952) and Kelly & Macmillan (1986), the initial rise of shearstress at small x was neglected and a hyperbolic expression derived for the shearstress distribution. This relation will be used here.
After matrix cracking, the stress within a single fibre is given by σ∞/Vf(1 −ω)A, and the strain of the overall composite is determined by the strain withina single fibre. However, as the stress within the fibre along the fibre axis is notconstant (Kelly & MacMillan 1986), owing to shear interaction with the matrix,an average value needs to be calculated. This average value is equal to the overallcomposite strain and is assumed to be given by
εf = 2∫w/2
0 εf(x)dxw
= ε∞. (B 1)
At a distance x from the free surface of the matrix, the stresses and the cross-sectional areas of matrix and fibre are, respectively, σm(x), Am, σf(x) and Af .Kelly & MacMillan (1986) assumed that
Amdσm(x)
dx= H (u − v), (B 2)
where σm(x) is the matrix stress, H is the constant determined by Young’smoduli and geometrical arrangement of fibres and matrix, u is the longitudinaldisplacement of the matrix and v is the displacement, linear in x , that the fibre
Proc. R. Soc. A (2009)
on June 15, 2018http://rspa.royalsocietypublishing.org/Downloaded from

2874 C. Tang et al.
would undergo at the same point if the matrix were absent. For the matrix,
σm(x) = Emdudx
and e = dv
dx, (B 3)
where e is the uniform fibre strain in the absence of the matrix. Substitution ofequation (B 3) into the differentiated form of equation (B 2) gives
Amd2σm
dx2= H
(σm
Em− e
). (B 4)
Solution of this differentiated equation yields
σm(x) = Eme(
1 − cosh [β(w/2 − x)]cosh [β(w/2)]
), (B 5)
where β = √2πGf/(EmAf ln(2Rb/Df)), Gf is the shear modulus of the fibre, Af is
the fibre cross-sectional area within a block and Rb is the half height of a singleblock, as shown in figure 18. Typical values of Gf = 11.9 GPa and Rb = 7 μm havebeen used for the calculations presented here. As the stress within the matrix istransferred from the fibre via the shear stress, the force equilibrium equation ofthe matrix gives
Amdσm(x)
dx= πDfτ(x). (B 6)
Substitution of equation (B 6) into (B 5) gives the expression for the shear stress,
τ(x) = AmβEme sinh[β(w/2 − x)]πDf cosh[β(w/2)] ; (B 7)
this equation can be normalized as
T (x) = τ(x)
(AmβEme/πDf)= sinh[β(w/2 − x)]
cosh[β(w/2)] . (B 8)
Equation (B 8) is plotted in figure 10. The maximum shear stress occurs at thefree surfaces of the matrix. For the force equilibrium of the single block, thefollowing equation applies:
σ∞Af
Vf(1 − ω)A= σm(x)Am + σf(x)Af . (B 9)
Substitution of σf(x) by Efεf(x) and of σm(x) from equation (B 5) intoequation (B 9) gives an equation in terms of εf(x). Substitution of this equationinto equation (B 1), after integration, gives
ε∞ = σ∞EfVf(1 − ω)A
− EmeAm[βw − 2 tanh(βw/2)]EfAfβw
. (B 10)
Rearrangement of equation (B 10) yields the expression
Eme = ((σ∞/EfVf(1 − ω)A) − ε∞)EfAfβwAm(βw − tanh[βw/2]) . (B 11)
Proc. R. Soc. A (2009)
on June 15, 2018http://rspa.royalsocietypublishing.org/Downloaded from

Thermo-mechanical behaviour of CMC tows 2875
Substitution of equation (B 11) into equation (B 7) yields the maximum shearstress at x = 0,
τ(x = 0) = ((σ∞/EfVf(1 − ω)A) − ε∞)EfAfβ2w
πDf(βw tanh−1[βw/2] − 1). (B 12)
Equation (B 12) gives the variation of the maximum shear stress with the remotecomposite stress σ∞ and strain ε∞.
References
Ashby, M. F. & Jones, D. R. H. 2005 Engineering materials 1, ch. 16. Oxford, UK: Elsevier.Aveston, J., Cooper, G. A. & Kelly, A. 1971 Single and multiple fracture. In Proc. Conf. on the
Properties of Fibre Composites, National Physical Laboratory. Guildford, UK: I.P.C. Scienceand Technology Press.
Bruggeman, D. A. 1935 Berechnung verschiedener physikalische Konstanten von heterogenenSubstanzen. Ann Physik 24, 636–679. (doi:10.1002/andp.19354160705)
Budiansky, B. & O’Connell, R. J. 1976 Elastic moduli of a cracked solid. Int. J. Solids Struct. 12,81–97. (doi:10.1016/0020-7683(76)90044-5)
Clayton, W. A. 1971 Constituent and composite thermal conductivities of phenolic-carbon andphenolic-graphite ablators. In AIAA/ASME 12th Structures, Structural Dynamics and MaterialsConf., Anaheim, CA, USA. AIAA paper no. 71-380.
Cox, H. L. 1952 The elasticity and strength of paper and other fibrous mats. Br. J. Appl. Phys. 3,72. (doi:10.1088/0508-3443/3/3/302)
Cox, B. N. & Yang, Q. 2006 In quest of virtual tests for structural composites. Science 314,1102–1107. (doi:10.1126/science.1131624)
Cox, B. N., Carter, W. C. & Fleck, N. A. 1994 A binary model of textile composites: I. Formulation.Acta Metall. Mater. 42, 3463–3479. (doi:10.1016/0956-7151(94)90479-0)
Del Puglia, P. & Sheikh M. A. 2001 An overview of thermal transport models for composites. InProc. 30th Associazione Italiana per l’Analisi delle Sollecitazioni Conf., Alghero, Italy, pp. 687–696. Italy: Department of Ingegneria Meccanica, University of Cagliari.
Del Puglia, P., Sheikh, M. A. & Hayhurst, D. R. 2004a Classification and quantification of initialporosity in a CMC laminate. Compos. Part A Appl. Sci. Manuf. 35, 223–230. (doi:10.1016/j.compositesa.2003.09.026)
Del Puglia, P., Sheikh, M. A. & Hayhurst, D. R. 2004b Modelling the degradation of thermaltransport in a CMC material due to three difference classes of porosity. Model. Simul. Mater.Sci. Eng. 12, 357–372. (doi:10.1088/0965-0393/12/2/014)
Del Puglia, P., Sheikh, M. A., & Hayhurst, D. R. 2005 Thermal transport property prediction ofa CMC laminate from base material properties and manufacturing porosities. Proc. R. Soc. A461, 3575–3597. (doi:10.1098/rspa.2005.1511)
Evans, A.G. & Marshall, D. B. 1989 The mechanical performance of fibre reinforced ceramic matrixcomposites. In Proc. Int. Conf. on Materials and Engineering Design: the Next Decade, pp. 251–186. London, UK: The Institute of Materials.
Evans, A. G. & Naslain, R. 1995 High-temperature ceramic-matrix composites. Ceram. Trans. 57,381–388.
Fareed, A. S. 2005 Silicon carbide and oxide fibre reinforced alumina matrix composites fabricatedvia directed metal oxidation. In Handbook of ceramic composites, ch. 12 (ed. N. P. Bansal).Boston, MA: Kluwer Academic.
Gibson, R. F. 1994 Principals of composite material mechanics. New York, NY: McGraw-Hill.Hashin, Z. 1980 Failure criteria for uni-directional fibre composites. J. Appl. Mech. 47, 329–334.Hayhurst, D. R., Leckie, F. A. & Evans, A. G. 1991 Component design-based model for deformation
and rupture of tough fibre-reinforced ceramic matrix composites. Proc. R. Soc. Lond. A 434,369–381. (doi:10.1098/rspa.1991.0097)
Proc. R. Soc. A (2009)
on June 15, 2018http://rspa.royalsocietypublishing.org/Downloaded from

2876 C. Tang et al.
Hult, J. & Travnicek, L. 1983 Carrying capacity of fibre composites. J. Mech. Theor. Appl. 2,643–657.
Jansson, S. & Leckie, A. F. 1992 The mechanics of silicon carbide fibre-reinforced glass-matrixcomposites. Acta Metall. Mater. 140, 2967–2978. (doi:10.1016/0956-7151(92)90461-M)
Kelly, A. 1989 Concise encyclopaedia of composite materials, section on CMCs. Oxford, UK:Pergamon.
Kelly, A & MacMillan, N. H. 1986 Strong solids, 3rd edn. Oxford, UK: Clarendon Press.Kerans, R. J. & Parthasarathy, T. A. 1991 Theoretical analysis of the fiber pullout and pushout
tests. J. Am. Ceram. Soc. 74, 1585–1596. (doi:10.1111/j.1151-2916.1991.tb07144.x)Klett, J. W., Ervin, V. J. & Edie, D. D. 1999 Finite-element modelling of heat transfer in
carbon/carbon composites. Compos. Sci. Technol. 59, 593–607. (doi:10.1016/S0266-3538(98)00099-2)
Krenkel, W. 2005 Carbon fibre reinforced silicon carbide composites. In Handbook of ceramiccomposites, ch. 6 (ed. N. P. Bansal). Boston, MA: Kluwer Academic.
Lu, T. J. & Hutchinson, J. W. 1996 Effect of matrix cracking on the overall thermal conductivityof fibre-reinforced composites. In High-temperature structural materials (eds R.W. Cahn, A.G.Evans & M. McClean), pp. 177–192. London, UK: Chapman and Hall.
Marshall, D. B., Cox, B.N. & Evans, A.G. 1985 The mechanics of matrix cracking in brittle-matrixfibre composites. Acta Metall. 33, 2013–2021. (doi:10.1016/0001-6160(85)90124-5)
McGlockton, M. A., Cox, B. N. & McMeeking, R. M. 2003 A binary model of textile composites:III high failure strain and work of fracture in 3D weaves. Acta Metall. Mater. 51, 1573–1516.
Mottram, J. T. & Taylor, R. 1987 Thermal conductivity of fibre-phenolic resin composites. Part II:numerical evaluation. Compos. Sci. Technol. 29, 211–232. (doi:10.1016/0266-3538(87)90071-6)
Rayleigh, L. 1892 On the influence of obstacles arranged in rectangular order upon the propertiesof a medium. Phil. Mag. J. Sc. 34, 481–502.
Sheikh, M. A., Taylor, S. C., Hayhurst, D. R. & Taylor, R. 2001 Microstructural finite elementmodelling of a ceramic matrix composite to predict experimental measurements of its macrothermal properties. Model. Simul. Mater. Sci. Eng. 9, 7–23. (doi:10.1088/0965-0393/9/1/302)
Sheikh, M. A., Taylor, S. C., Hayhurst, D. R. & Taylor, R. In press. Experimental investigationof the effect of mechanical loading on thermal transport in ceramic matrix composites. J.Multiscale Model.
Tang, C., Blacklock, M. & Hayhurst, D. R. 2009 Stress–strain response and thermal conductivitydegradation of ceramic matrix composite fibre tows in 0◦–90◦ uni-directional and wovencomposites. Research report no. DMM.09.05, University of Manchester, UK.
Taylor, R. 2000 Carbon matrix composites. In Comprehensive composite materials (eds T.W. Chou,A. Kelly & R. Warren). Carbon, Ceramic and Cement Composites, vol. 4, pp. 387–426. Oxford,UK: Elsevier.
Taylor, R., Turner, S.P., Garner, K. & Jiang, X.X. 1993 Thermal conductivity of carbon fibres.High Temp. High Press. 25, 443–450.
Thouless, M. D. & Evans, A. G. 1988 Effects of pull-out on the mechanical properties of ceramic-matrix composites. Acta Metall. 36, 517–522. (doi:10.1016/0001-6160(88)90083-1)
Vavakin, A. S. & Salganik, R. K. 1975 Effective characteristics of non-homogeneous media withisolated non-homogeneities. Izv. SSSR Akad. Nauk Mekhanika Tverdogo Tela 10, 65–75.
Weibull, W. 1939 A statistical theory of strength of materials. Proc. R. Swedish Institute,Stockholm, 151, 1–14.
Whittaker, A. J. & Taylor, R. 1990 Thermal transport properties of carbon–carbon fibre compositesIII. Mathematical modelling. Proc. R. Soc. Lond. A 430, 199–211. (doi:10.1098/rspa.1990.0088)
Xu, J., Cox, B.N., McGlockton, M.A. & Carter, W.C. 1995 A binary model of textile composites:II. Elastic regime. Acta Metall. Mater. 43, 3511–3524. (doi:10.1016/0956-7151(95)00057-3)
Zhang, D. & Hayhurst, D. R. 2009 A finite element model to predict multi-axial stress strainresponse of ceramic matrix composites with strain induced damage. In 17th Int. Conf. onComposite Materials, Edinburgh, July 2009.
Proc. R. Soc. A (2009)
on June 15, 2018http://rspa.royalsocietypublishing.org/Downloaded from