theory and practice of titration herewith present to you our titration handbook. the focus has been...
TRANSCRIPT

Titration HandbookTHEORY AND PRACTICE OF TITRATION

Welcome to Xylem Analytics Germany!
Xylem Analytics Germany distributes a large number of high-quality analyzers and sensors through its numerous well-known brands. Our Mainz brand SI Analytics has emerged from the history of SCHOTT® AG and now has more than 80 years of experience in glass technology and the development of analyzers and sensors. Our products are manufactured with high standards of innovation and quality in Mainz, Germany. The electrodes, titrators and capillary viscometers will continue to be at home wherever precision and quality in analytical measurement technology is required.
Since 2011, SI Analytics has been part of the publicly traded company Xylem Inc., headquartered in Rye Brook, N.Y., USA. Xylem is a world leader in solving water related problems. In 2016, the German companies were finally merged to Xylem Analytics Germany and continue to represent the established brands at the known locations.
Dr. Robert Reining
Managing Director

We herewith present to you our Titration handbook. The focus has been consciously put on linking application information with our lab findings and making this accessible to you in a practical format.
If you have any questions about the very large field of titration, we look forward to helping you with words and deeds.
We at Xylem Analytics Germany in Mainz would be happy to keep on working successfully together with you in the future.
Xylem Analytics Germany
Sincerely, Robert Reining

CONTENTS
Introduction and definition
SECTION 1Basics
1.1 Definitions and foundations .................................................... 13
1.2 Titration reactions ....................................................................... 15Acid-base titration .................................................................................... 15
Precipitation titration, complexometric titration ................................ 16
Redox titration, charge transfer titration, chemical, visual ............... 17
Potentiometric ........................................................................................... 18
Biamperometric ........................................................................................ 20
Photometric, conductometric, thermometric ..................................... 22
1.3 Titration types .................................................................................23Direct titration, back titration .................................................................. 23
Indirect titration, substitution titration, phase transfer titration ..... 24
1.4 Overview of the used methods ..................................................24
SECTION 2 Volume measurement devices, manual and automatic titration
2.1 Volume measurement devices and standards ........................28
2.2 Volume measurement devices in the laboratory ....................30Pipettes and graduated pipettes .......................................................... 30
Piston-stroke pipettes .............................................................................. 33
Volumetric flasks, measuring cylinders, burettes ............................... 34
Piston burettes ........................................................................................... 36
2.3 Verification of the correct volume ..............................................38
2.4 Cleaning and care .........................................................................40
2.5 Manual titration ..............................................................................43
2.6 Comparison of manual and automatic titration ......................47

SECTION 3 Sample handling
Basics ........................................................................................................50
Direct volume .........................................................................................52
Direct weighed sample .......................................................................53
Aliquoting ...............................................................................................53
Weigh out small solid quantities ........................................................54
SECTION 4 Sensors and reagents
4.1 Overview of the sensors ...............................................................56
4.2 Electrolyte solutions ......................................................................61
4.3 Calibration of electrodes ..............................................................61
4.4 Reagents ..........................................................................................64Sodium hydroxide, hydrochloric acid .................................................. 64
Na2EDTA , AgNO3, Na2S2O3,, Ce(SO4)2, (NH4)2Fe2(SO4)2, KOH in ethanol or isopropyl, HClO4 in glacial acetic acid ............... 65
4.5 Titer determination ........................................................................66Titer determination of bases .................................................................. 68
Titer determination of acids ................................................................... 70
Titer determination of silver nitrate ...................................................... 72
Titer determination of perchloric acid ................................................. 74
Titer determination of thiosulphate ...................................................... 76
Titer determination of iodine ................................................................. 78

SECTION 5 Titration parameters and calculations
5.1 Overview .........................................................................................81
5.2 Control of the dosage ...................................................................82Linear titration ........................................................................................... 82
Dynamic titration ...................................................................................... 86
5.3 Response behavior of the electrode and speed ....................90
5.4 Definition of the titration end ......................................................94Titration interruption at maximum volume ......................................... 95
Titration interruption at a certain measured value ............................ 95
Titration interruption when recognizing an EQ ................................. 95
5.5 Evaluation of the titration .............................................................97
SECTION 6Applications
6.1 Acid-base titrations ..................................................................... 102Titration of citric acid in drinks .............................................................102
Titration of a strong acid .......................................................................104
Titration of phosphoric acid .................................................................106
Titration of Alk. 8.2 and Alk.4.3 ................................................................108
Titration of sodium carbonate .............................................................110
Determination of pharmaceutical bases as hydrochlorides with NaOH ...................................................................112
Determination of pharmaceutical bases with perchloric acid in glacial acetic acid.......................................................................114
Determination of the free fatty acids in vegetable oils (FFA) ........116
Determination of acids in oil (TAN, ASTM 664) ...............................118
Determination of bases in oil (TBN, ISO 3771) ................................121

6.2 Argentometric titrations ............................................................ 123Titration of salt in butter ........................................................................124
Titration of chloride in drinking water ................................................125
6.3 Potentiometric redox titrations ................................................ 127Iodine number for characterizing fats and oils .................................127
Determination of the vitamin C content with DCPIP ......................130
6.4 Dead Stop titrations ................................................................... 133Direct iodometric determination of vitamin C .................................134
Determination of the SO2 content in wine ........................................135
6.5 Complexometric titrations ........................................................ 137Calcium and magnesium in drinking water ......................................138
Total hardness in drinking water .........................................................140
6.6 Determination of molecular weights by titration ................. 142
6.7 Determination of pKs values ..................................................... 143
6.8 pH-Stat titrations ......................................................................... 146
6.9 Gran titrations .............................................................................. 148
SECTION 7 Photometric titrations
7.1 The OptiLine 6 ............................................................................. 153
7.2 Measurement principle ............................................................. 154
7.3 Error sources ................................................................................ 155Air bubbles ..............................................................................................155
Ambient light ...........................................................................................155
7.4 Applicators ................................................................................... 155Determination of the alkalinity Alk. 4.3 ................................................155
Photometric determination of acids in oils (TAN) ............................158
Determination of carboxyl end groups in PET .................................162

SECTION 8 Karl Fischer titration
8.1 The Karl Fischer reaction and reagents .................................. 165
8.2 The detection of the KF titration and titration curves.......... 169
8.3 Sample handling ......................................................................... 170
8.4 Coulometry .................................................................................. 172
SECTION 9Verification of the titration
9.1 Overview ...................................................................................... 175
9.2 Qualifications ............................................................................... 176
9.3 Validation ...................................................................................... 178
9.4 Verification and correctness of the titration .......................... 179
9.5. Measurement uncertainty ........................................................ 184
Bibliography


Authors
Dr.-Ing. Jens Hillerich
Dr. rer. nat. Jürgen Peters

11
Titration guide
Titration is one of the oldest methods for content determina-tion in chemistry.
In contrast to gravimetry, no sparingly soluble compounds are dried and weighed, but a reagent of known concentration is added to the dissolved sample until the chemical conversion is complete. For the definition of titration, there are a number of formulations that have changed over time. The IUPC (Compen-dium of chemical Technology) defines titration as:
Quantitative analysis method in which a sample of known com-position but unknown content is converted with a reagent of known concentration (also called standard solution) in a chemical reaction of known stoichiometry.
From the very precisely added volume of the reagent, the unknown content in the sample can be calculated on the basis of the calculation factors.
Titration finds broad use in chemical analysis. On the one hand, a titration can be per-formed very easily and quickly, on the other hand, the titration provides a very accurate mea-surement result after only a few minutes - under optimal conditions. A relative standard deviation of below one percent is normal. It is not without reason that numerous standards require titration as a method.
Even with a very common and proven method of analysis, there is a need for support. This guide builds on the basic principles of titration and addresses the user of potentiometric titration. Therefore, the basics of poten-tiometry is discussed with the Nernst equation. The "manual titration" is almost completely left out. A general overview of titration can be found in the classic standard work of titration, the Jander / Jahr [1].
INTRODUCTION AND DEFINITION

Titration guide
12 13
This guide requires chemical knowledge, e.g. the reading of reaction equations, knowledge of important technical terms, basic knowledge of working in the chemical laboratory, as well as the handling of devices such as scales, burettes, pipettes, electrodes and the safety regula-tions in the laboratory.
Titration is also called volumetry. Even when working with a pH electrode, the measurement unit of the titration remains the volume and not the pH value. The correctness of the volume is thus essential for every titration. Coulometry is an exception, which is a titration method, but which is not performed volumet-rically.
In the first step, this guide deals with the volume and its correct-ness. Thereafter, the focus is on the sample and its handling. Subsequently, the used reagents, electrodes and the titration parameters are dealt with in detail.
Furthermore, application areas are mentioned and various titra-tion methods are presented. The individual calculations always give rise to questions and are therefore explained and sum-marized with the most important formulas. Typical titrations with their titration curves and calcula-tions are presented by means of examples.
Evaluation and quality are more and more in the foreground. Therefore, the final chapter is devoted to the qualification of the devices, verification and validation of results, as well as measurement uncertainty.

Titration guide
12 13
SECTION 1
BASICS
1.1 Definitions and foundationsThe definition of titration is valid unchanged in its core: We need a stoichiometric reaction, a pre-cisely dosable, stable reagent and a detection of the end of the reaction end or a curve showing the course of the reaction.
The standard work for Volumetric Analysis [1] also falls back on these characteristics and defines:
The chemical reaction on which the titration is based must proceed rapidly, quantitatively and unam-biguously in the manner indicated by the reaction equation.
It must be possible to prepare a reagent solution of defined con-centration or to determine the concentration of the solution in a suitable way.
The endpoint of the titration must be clearly recognizable. It should coincide with the equivalence point at which the reagent amount equiv-alent to the substance amount of the searched substance was added or at least come very close to it.
This definition has to be extend-ed or limited nowadays: there are many reactions that do not take place stoichiometrically. In the Karl Fischer reaction, this has been discussed controversially for decades (1: 1 or 2: 1). With some reactions it is completely unclear how they actually take place. It is only certain that they run equally under the same conditions (e.g., the determi-nation of chondroitin sulphate). Validations are then performed by means of linearity tests with standards, which enable a quan-tification of the sample. There are also numerous applications that go beyond simple content determination. These include stability studies, long-term ex-tractions and monitoring of crystallizations (sometimes over months), determination of pKs values, pKb values and still fur-ther methods with very specific statements.

Titration guide
14 15
When validating a titration meth-od, the following aspects must be observed:
chemical reaction accurately adjusted reagent the sensor for detection.
The chemical reaction must be fast, clear and quantitative. An indication of whether a reaction is suitable for the titration is given by the law of mass action:
aA bB cC dD+ ↔ +
with the equilibrium constant K
c d a bK [C] [D] / [A] [B]= ∗ ∗
For the titrations, the reaction equilibrium should be on the right side of the reaction equa-tion, thus K >> 1.
After the reaction has been determined, particular attention must be paid in the laboratory to the exact dosage of the set reagent and the selection of a suitable sensor. The core function of a modern titrator is the exact dosage of the titrant. The stan-dard ISO 8655 [2] describes the requirements and check of the exact dosing.
The detection can be carried out by colour indicators or by means of electrochemical methods, which are be dealt with here in essence.
The predominant method is potentiometry using e.g. pH and redox sensors with indicator and reference electrodes, which can detect potentials according to the electrochemical series.
The Nernst equation is the basis of potentiometry. It describes this electrochemical potential at an electrode as a function of the activity of the ions in the solution.
ox
e Red
aRTln
z F aΕ = Ε°+
E Electrode potentialE° Standard electrode potentialR Universal or molar gas constant,
R = 8.31447 J mol−1 K−1 T absolute temperature in Kelvinze Number of electrons transferred
(also equivalence number)F Faraday constant, F = 96485.34 C mol−1 a Activity of the respective redox
partner

Titration guide
14 15
A pH electrode is used in most cases. In order to establish a comparability with previous results obtained manually by colour indicators, it is possible to titrate to a fixed pH value, which corresponds to a colour change. For such an endpoint titration (EP = endpoint) to a fixed pH value, a calibration of the electrode is required.
Other titrations are carried out to an equivalence point (EQ = Equivalence Point). Here, it depends only on the change of the potential or the pH value. The calibration of a pH electrode serves only for quality monitor-ing in this case.
The measured value of the titration is the volume. The cor-rectness of the volume must be verifiable for each consumption. Consumption at the EQ, EP or colour change thus indicates the equivalence of sample sub-stance and added reagent.
1.2 Titration reactionsAcid-base titrationIn acid-base or neutralization titration, acids are titrated with a base (or vice versa). The detec-tion of the equivalence point can take place by colour indicators or potentiometrically with a glass electrode. The reaction is the same for all acid/base titrations, water results from a proton and a hydroxide ion
2H OH H O+ −+ ↔
If several acids with different pKs values are contained in a solution, they show several equivalence points in a potentiometric ti-tration and can be determined next to each other if the alkalinity values are distinguished by at least 2 - 3 powers of ten.
2 3HX H O H O X+ −+ ↔ +
with
3s
c(H O ) c(X )K
c(HX)
+ −∗=

Titration guide
16 17
Precipitation titrationThe precipitation titration is based on the formation of hardly soluble salts of sample and re-agent. The solubility of salts can be described by the solubility product K.L For the dissociation of a salt MmXx in saturated solu-tion, the following applies:
x mm xM X mM xX+ −↔ +
with
( ) ( )m xx mLK c M c x+ −= ∗
If several ions are contained in a solution, which form products which are hardly soluble with dif-ferent solubility product with the reagent, they show several equiv-alence points in a potentiometric titration and can be determined next to each other if the KL values differ by at least 2 - 3 powers of ten.
A classic application of the pre-cipitation titration is the deter-mination of the halogenides (Cl-, Br- und I-) by means of AgNO3 solution or the determination of the silver content with a NaCl solution.
Complexometric titrationIn the complexometric titration, metal ions are titrated with a strong complexing agent. The equivalence point is detected by a colour indicator (also a com-plexing agent) or by ion-sensitive electrodes. For the formation of the complex from a divalent metal ion and probably the most commonly used 6-tooth complexing agent ethylene diamine tetra acetic acid (EDTA) the following applies:
2 4 2M EDTA [MEDTA]+ − −+ ↔
with
2
2 4c([MEDTA) )
Kc(M ) c(EDTA )
−
+ −=+
Divalent metal ions are deter-mined often during complexo-metric titration. The stability of these complexes depends on the pH value (a buffer must therefore be added to the sample if neces-sary). An important application for complexometric titration is e.g. the determination of water hardness in drinking water.

Titration guide
16 17
Redox titrationIn a redox titration, oxidizing components are titrated with a reducing agent, or vice versa. The oxidation states of the reactants and thus the redox potential of the sample change. The detection of the EQ can be carried out by colour change (of colour indicators or the sam-ple solution), potentiometrically with a redox electrode (usually a Pt electrode) or biamperomet-rically with a double platinum electrode.
M X M X+ −+ ↔ +
An important application for redox titration is e.g. the deter-mination of vitamin C in fruit juices or the Karl Fischer titra-tion.
Charge transfer titrationIn charge transfer titration, negative charges are titrated with positive charges (or vice versa) to a charge transfer neutral point. An important application for this is the characterization of pulp suspensions by polyelectro-lyte titration in paper manufac-ture.
Chemical / visual A classification of the titrations is also often carried out according to the type of detection of the titration end. The oldest type of equivalence point determi-nation is the chemical/ visual type. Hereby, the detection of the end or equivalence point is takes place by a colour change of the sample solution (or of the precipitate with precipitation titrations). This usually requires the addition of a colour indica-tor, but there are also reactions where the sample or titrant changes colour at the EQ. This type of EQ determination is mostly used in manual titrations.

Titration guide
18 19
PotentiometricWith the potentiometric titration, the determination of the end or equivalence point takes place by the chemical potential that is es-tablished at a suitable electrode.
This potential depends on the concentration of ions to which the electrode responds. If the electrode is "inert", that is, not sensitive to ions contained in the solution, the redox potential of the solution can be determined.The electrode potentials follow the Nernst eqution:
N 1 2U U lg a / a= ∗
The potential which adjusts itself at an individual electrode cannot be measured directly. All that can be measured is a voltage U as the difference between two electrode poten-tials in a closed circuit. In the example (Fig. 1), two electrodes made of the same metal are immersed in solutions of one of their salts.
The dependence of this voltage on the concentrations c1 and c2 or the ion activities a1 and a2 in the individual half-cells can be formulated according to the Nernst equation:
ca f c= ∗
a = activityfc = activity coefficient (dependent on concentration)c = concentration
By measuring the electrode potential, it is therefore not possible to determine a concen-tration directly with the Nernst equation, but only the ion activity. At very high dilution, the activity coefficient is about 1 and there-fore the activity is approximately equal to the concentration. Fig. 2 shows the course of a typical titration curve.

Fig. 1 Circuit in an electrochemical measurement cell [5]
Diaphragm
U
Conductor 1st order
a 1 < a 2
a 1 a 2
Conductor 2nd order
ml
mV
0 2.0 4.0 6.0 8.0 10.0 12.0 14.0
0.0
50.0
100.0
150.0
200.0
-50.0
mV/ml dmV/dml
144.8 mV14.34 ml
y-ax
is m
easu
rem
ent s
igna
l mV
valu
e
x-axis Titration volume in ml reagent addition
Fig. 2 mV titration curve of a chloride titration
Titration guide
18 19

Titration guide
20 21
BiamperometricBiamperometric or Dead Stop titrations can be carried out if reversible redox systems are formed or consumed in the course of the reaction. In this type of detection, a double plat-inum electrode is used which is polarized at a low voltage. If a reversible redox couple is pres-ent, a current flows between the electrodes. As long as is no re-versible redox couple is present, no current flows between the two electrodes.
Important examples for this are the Karl Fischer titration and iodometric titrations. The revers-ible redox system, which is used to detect the endpoint, is hereby:
2l 2e 2l− −+ ↔
Iodide is oxidized to iodine at the anode, while iodine is simultane-ously reduced to iodide at the cathode.
Fig. 3 shows a typical titration curve of an iodometric Dead Stop titrations:
As long as reducing agents are still present in the sample, added iodine is consumed immediately, in solution there is only iodide, no current flows. When all the reducing components have been consumed, iodine and iodide are present next to each other as a reversible redox pair, a current flows between the electrodes.
In contrast to iodometry, the current is not plotted versus the titration volume with the Karl Fischer titration, but the titration volume versus time. More information about the course of the reaction, as e.g. secondary reactions, can be obtained (see Fig. 4).

x-axis titration duration
s
ml
0 12.5 25.0 37.5 50.0 62.5 75.0 87.5 100.0 112.50.0
0.375
0.75
1.125
1.5
1.875
2.25
2.625
3.0
3.375
ml/s
y-ax
is w
ith K
F re
agen
t add
ition
Fig. 4 Karl Fischer titration curve
ml
µA
0 0.2 0.4 0.6 0.8 1.0 1.2 1.4
0.0
0.5
1.0
1.5
2.0
2.5
µA/ml
1.449 ml2.0 µA
x-axis titration volume in ml reagent addition
y-ax
is m
easu
rem
ent s
igna
l μA
valu
e
Fig. 3 Dead Stop titration curve
Titration guide
20 21

Titration guide
22 23
ConductometricIn the conductometric titration, the determination of the EQ takes place via changing the conductivity of the sample solution during the titration. The conductivity Κ of a sample solution depends on the ion mobility ui, the concentration ci and the ion charge zi:
κ = ∗∑ i i iConst u z c
ThermometricAll voluntarily running chemical reactions release energy that leads to a temperature increase. This temperature of the reaction solution is exploited in the thermometric titration for the determination of the EQ. It is determined with a sensitive temperature sensor. Typically, the temperature increases up to the EQ, in order to fall thereafter by addition of further (colder) titrant solution.
Photometric In a photometric titration, the colour change of an indicator is detected with an optical sensor (e.g., OptiLine 6). The basis for this is Lambert Beer's law, which describes the relationship between concentration, sample properties and absorption:
0lg = ε ∗ ∗l
lc l
l
I0: Intensity of the incident light beamIl: Intensity of the transmitted light
beamε: molar extinction coefficient
(dependent on wavelength)c: Concentrationl: Path of the light beam through the
sample
At the EQ, the colour indicator reacts with the titrant; the colour and thus also the extinction coefficient of the titrated solution change. The intensity of the light arriving at the sensor changes.

Titration guide
22 23
1.3 Titration typesTitrations can be carried out in different manners [1].
Direct titrationThe best known is the direct titration, in which the sample is titrated directly with a suitable standard solution. The amount of reagent consumed to the equivalence point (or endpoint) is the amount of substance to be determined.
Direct titrations also include the inverse titration, in which the reagent solution is presented and titrated with the sample. Reasons for inverse titration may be e.g. a better recognizability of the equivalence point, the stability of the reactants, or a greater reaction speed.
Back titrationIn the back titration, the sample is mixed with a defined amount of reagent A. Reagent A must be present in excess. After a reaction time, the excess is titrated with another reagent solution B. The difference between the added reagent solution A and reagent A still present after the reaction corresponds to the amount of the substance to be determined. Both reagent A and reagent B must be dosed exactly. Back titrations are e.g. used when the reaction speed between sample and reagent A is low, no suitable sensor is available, or the equivalence point can only be determined with difficulty.

Titration guide
24 25
11.4 Overview of the used methodsThe past 200 years offered suffi-cient time for the development of new titration methods. Several thousand methods or modifica-tions exist nowadays. Areas, in which titrations are carried out are:
Water and environmental analysis Food industry Chemical industry Pharmaceutical industry Coating and metal processing,
electroplating Oil industry
In food analytics, a number of products or contents are quantified in these products by means of titration according to § 64 LFGB (food requirement objects and feed code). The methods include the determi-nation of acids in drinks and other foods, the determination of the salt content, content of proteins and nitrogen functions, bases, oxidation components or oxidation protection and much more.
Indirect titrationIn the indirect titration, the sub-stance to be determined, which is contained in the sample in a non-titratable form, is converted into a titratable compound by a chemical reaction. A known example of an indirect titration is the determination of nitrogen according to Kjeldahl; non- titratable nitrogen compounds are converted to readily titratable ammonium borate.
Substitution titrationIn a substitution titration, a good titratable component is released from the substance to be deter-mined by addition of suitable substances in excess, which can be titrated directly.
Phase transfer titrationIn phase transfer titration, the de-tection of the EQ takes place in a different phase than the reaction. An application for this is e.g. the surfactant titration according to Epton.

Titration guide
24 25
An important area is the deter-mination of humidity or water content in food. The Karl Fischer titration is the method of choice here, as it is also comparatively selective in addition to a high accuracy. The water content in-fluences numerous properties, such as durability, processabili-ty, taste and much more.
In the environmental field, water analysis is of particular impor-tance. Titrations for waste water, surface water and seawater are added to the methods of drinking water analysis [1], [10].
In the chemical industry, various methods are used, which mainly serve to determine key Figures for production raw materials or finished products. Wastewater must also be examined. Numer-ous methods are recorded in standards. The ISO standards and also the ASTM regulations are used worldwide.
Pharmacy uses strictly regulated, consistent methods that are de-fined in pharmacopoeias. These are often content determinations of the pharmaceutically active substances. The humidity content is also determined by Karl Fischer titration.
The samples in electroplating are very challenging. They often contain high concentrations of strong acids and various metals. Titration is the most important method here and is often used directly in the production area.
Oil can also be titrated. This works in suitable solvents. Often, acids are determined in the oil to give a measure of the aging of the oil by oxidation and realization with air. Base numbers and water con-tent are also typically titrated.
Some of the most important methods are presented in the following.

Titration guide
26 27
Acid-base titrations are used widely. These are endpoint titrations to a fixed pH value. The endpoints are therefore often pH 7.0, pH 8.1 or pH 8.2. This depends on the type of acids and the comparative values de-termined in the past with colour indicators. A glass electrode is used for the pH measurement, which must be calibrated. For this, the buffers 4.01 pH and 6.87 pH are recommended. Due to possible problems with alkaline buffers (CO2 absorption, low durability), a correct two-point calibration without alkaline buffers is often more accurate than the more elaborate three-point calibration.
Further information on calibrat-ing the pH electrodes can be found in our pH guide.
A special method is the determi-nation of alkalinity in seawater. A multiple of the CO2 of the atmosphere is dissolved in seawater. The pH value of the sea drops, the temperature rises and thus less CO2 can be dissolved in the seawater.
The accurate CO2 content is determined by means of Gran titration, a method that can be easily automated with a sample changer.
With the frequent determination of chloride or "salt", a calibration of the electrode is not necessary. The titrant is silver nitrate and a silver or silver chloride electrode is used. However, the potentials may vary depending on the state of the electrode, concentration and sample matrix. This is why titration is performed here until an EQ is detected. It does not depend on the potential itself then, but on the potentialchange.
Another common titration type is iodometry. Here, a sample is usually mixed with an excess of iodine. The iodine oxidizes a part of a sample. The iodine which is not converted is then titrated with thiosulphate. This is a back titration, as both the reagent iodine (or a mixture of iodate with iodide) must be precisely dosed or weighed, as well as the back titration must be done with a well-defined concentration.

Titration guide
26 27
For drinking and mineral water, water hardness is an important parameter. Calcium und magne-sium are relevant with respect to health and are titrated with EDTA (Ethylene-Diamine-Tetra-Acetic- acid). For the detection, either a calcium ion-sensitive electrode (ISE) is used for the determi-nation of both parameters or a copper electrode for the deter-mination of the total hardness. Instead of the usual combination electrodes, separate measuring chains (ISE indicator electrode with separate reference elec-trode) are often used, which are somewhat more robust. The calcium electrode can directly detect the signal of Ca and Mg, while the copper electrode is required for the indication of copper EDTA to detect the total hardness.
In electroplating, many metals in the sample are also determined complexometrically. One often titrates with EDTA as titrant and the Cu-ISE as electrode. The detection takes place as complex displacement reaction by the addition of Cu-EDTA.
In pharmacy, many complex bases are titrated. The most important method is the titration
with perchloric acid in glacial acetic acid, in which the nitrogen functions are determined. As many bases are present as hydrochloride, an indirect determination is also possible. Free hydrochloric acid is added and the free HCl is first titrated with sodium hydroxide solution, then the HCl bound to the nitrogen. Two equivalence points result whose difference corresponds to the number of amine groups.
With a glass electrode, acid-base titration is possible even in black oil. The most important titration parameters in oils are, apart from the Karl Fischer titration for water determination, the TAN (Total Acid Number) and TBN (Total Base Number) determi-nations. The TAN is titrated in toluene/isopropanol with KOH in isopropanol. A glass electrode and a reference electrode with ground-joint diaphragm, often as a combination electrode is used as the electrode.
The examples should briefly show the range of the extent to which titration methods are used for quantification. A number of com-pleted application specifications can be found on our website.

Titration guide
28 29
SECTION 2
VOLUME MEASUREMENT DEVICES, MANUAL AND AUTOMATIC TITRATION
2.1 Volume measurement devices and standardsThe volume has a special importance in titration. It is the measured value of the titration and most samples are measured volumetrically with pipettes.
The analysis scale continues to be the basic instrument. The volume is attributed to the weight. All volume measurement devices have their nominal volume at 20°C (attention: the electrochemistry relates to 25°C). At other temperatures correc-tions of the volume must be applied. It should be noted, however, that the density for different solutions with different temperatures does not always behave identically.
=
weightVolume
with the units [ml]
density=
[ ]g
[ ]g[ml]
As a rule, volume vessels are checked with water. The water amount corresponding to the volume is weighed and divided by the density. (Motor piston) burettes are tested according to ISO 8655 part 6 (Gravimetric test with water) [2] . A factor Z is used hereby, the reciprocal of the density, corrected by the following factors:
Temperature Buoyancy corrections (scales
weights, weighed sample) Correction of the cubic expan-
sion coefficient of the glass Air humidity
The correct volume is then the weight of the water multiplied by the factor Z (Fig.5).

Fig. 5 Factor Z in dependence on temperature and air pressure
Temperature in °C
Air pressure in kPA (Z values in ml/g)
80.0 85.3 90.7 96.0 101.3 106.7
15.0 1.0018 1.0018 1.0019 1.0019 1.0020 1.0020
15.5 1.0018 1.0018 1.0019 1.0020 1.0020 1.0021
16.0 1.0019 1.0020 1.0020 1.0021 1.0021 1.0022
16.5 1.0020 1.0020 1.0021 1.0022 1.0022 1.0023
17.0 1.0021 1.0021 1.0022 1.0022 1.0023 1.0023
17.5 1.0022 1.0022 1.0023 1.0023 1.0024 1.0024
18.0 1.0022 1.0023 1.0024 1.0024 1.0025 1.0025
18.5 1.0023 1.0024 1.0025 1.0025 1.0026 1.0026
19.0 1.0024 1.0025 1.0025 1.0026 1.0027 1.0027
19.5 1.0025 1.0026 1.0026 1.0027 1.0028 1.0028
20.0 1.0026 1.0027 1.0027 1.0028 1.0029 1.0029
20.5 1.0027 1.0028 1.0028 1.0029 1.0030 1.0030
21.0 1.0028 1.0029 1.0030 1.0030 1.0031 1.0031
21.5 1.0030 1.0030 1.0031 1.0031 1.0032 1.0032
22.0 1.0031 1.0031 1.0032 1.0032 1.0033 1.0033
22.5 1.0032 1.0032 1.0033 1.0033 1.0034 1.0035
23.0 1.0033 1.0033 1.0034 1.0035 1.0035 1.0036
23.5 1.0034 1.0035 1.0035 1.0036 1.0036 1.0037
24.0 1.0035 1.0036 1.0036 1.0037 1.0038 1.0038
24.5 1.0037 1.0037 1.0038 1.0038 1.0039 1.0039
25.0 1.0038 1.0038 1.0039 1.0039 1.0040 1.0041
25.5 1.0039 1.0040 1.0040 1.0041 1.0041 1.0042
26.0 1.0040 1.0041 1.0042 1.0042 1.0043 1.0043
26.5 1.0042 1.0042 1.0043 1.0043 1.0044 1.0045
27.0 1.0043 1.0044 1.0044 1.0045 1.0045 1.0046
27.5 1.0046 1.0046 1.0047 1.0048 1.0048 1.0049
28.0 1.0046 1.0046 1.0047 1.0048 1.0048 1.0049
28.5 1.0047 1.0048 1.0048 1.0049 1.0050 1.0050
29.0 1.0049 1.0049 1.0050 1.0050 1.0051 1.0052
29.5 1.0050 1.0051 1.0051 1.0052 1.0052 1.0053
30.0 1.0052 1.0052 1.0053 1.0053 1.0054 1.0055
Titration guide
28 29

Titration guide
30 31
In the “Guideline for the volume determination in reference measurement procedures in medical reference laboratories” of the DAkkS (German accred-itation body), the standards of the individual volume measure-ment vessels are listed [3]:
Volumetric flasks (DIN EN ISO 1042, DIN 12664-1, DIN 12664-2)
Volumetric pipettes (DIN 12687, DIN 12688, DIN 12691, DIN 12690)
Graduated pipettes (DIN 12689, DIN 12695, DIN 12696, DIN 12 697, DIN 12 699)
Piston-stroke pipettes(DIN EN ISO 8655-2, DIN EN ISO 8655-6)
Piston burettes(DIN EN ISO 8655-3, DIN EN ISO 8655-6)
Diluters(DIN EN ISO 8655-4, DIN EN ISO 8655-6)
Dispensers(DIN EN ISO 8655-5, DIN EN ISO 8655-6)
2.2 Volume measurement devices in the laboratoryPipettes and graduated pipettesPipettes serve for measuring samples. One distinguishes between graduated pipettes and volumetric pipettes (Fig. 6). Preferably, volumetric pipettes with a volume greater than 5 ml are used due to the higher accuracy and easier handling. For smaller volumes, piston- stroke pipettes are preferably used. The size of the opening and the discharge time are optimized on water with its surface tension. If an organic solvent is used, this usually has a lower surface tension. However, this also effects a faster discharge in addition to smaller drops. If one drop is smaller than the opening and the surface tension is small, the solution will easily run out of the pipette without opening the Peleus ball.
Pipettes are filled up to the mark (using a pipetting aid such as the Peleus ball) and are read off at the lower meniscus (Fig. 7).

DIN
10ml
10
A
9
8
7
6
5
4
3
2
1
0
10ml
ISO 835
10
B
Fig. 6 Volumetric (A) and graduated pipette (B)
Meniscus
Partial line
Fig. 7 Meniscus
Titration guide
30 31

Fig. 8 Accuracy of a volumetric and of a graduated pipette
ml
± ml DIN 12 621 s 1 0.007 7-11 2 0.01 7-11 5 0.015 9-13 10 0.02 11-15 20 0.03 12-16 25 0.03 15-20 50 0.05 20-25
100 0.08 25-30
Content Error limit Color coding Elapsed time
blueorangewhitered
yellowbluered
yellow
Content ml
Error limit ± ml
Division ml
Color codingDIN 12 621 s
1 0.006 0.01 2-8 2 0.01 0.02 2-8 5 0.03 0.05 5-11 10 0.05 0.1 5-11 25 0.1 0.1 9-15
Graduated pipette
yellowblackred
orangewhite
Elapsed time
Titration guide
32 33
All pipettes must always be held vertically. The liquid is discharged on an obliquely held beaker on the side wall. The follow-up time must be observed. Fig. 8 gives an over-view of the accuracy of the measurement and volumetric pipettes.
Accordingly, graduated pipettes are used to measure liquids that are used as auxiliary reagents and that often require different volumes. For accurate volumetric measurements, that directly enter into a calculation, only volumetric pipettes are suitable.

Fig. 9 Piston-stroke pipette
Titration guide
32 33
Piston-stroke pipettesPiston-stroke pipettes up to 10 ml sample volume, preferably from 1 to 5 ml, are particularly safe and easy in its handling.
Piston-stroke pipettes (Fig. 9) can be equipped with a fixed or variable volume. Handling is usu-ally easier than with volumetric pipettes. The pipettes must be checked regularly according to ISO 8655 part 6 (such as also the motor piston burettes).

Titration guide
34 35
Volumetric flasksVolumetric flasks are used to pre-pare solutions. A certain amount is weighed and transferred quantitatively into the volumetric flask. In the titration, the follow-ing work steps are often carried out with a volumetric flask:
Preparation of comparison solutions and reagent addi-tions. A defined amount of a substance is weighed into a weighing boat and transferred quantitatively (e.g. with distilled water) to the volumetric flask by means of a funnel or rinsed.
Many solid samples are dissolved and transferred into the volumetric flask via a funnel. The unit of such samples is then weight/volume, e.g. mg/l or g/l.
It is filled up to the ring mark. As with the pipettes, the fill level is reached when the meniscus rests on the ring mark.
Measurement cylindersMeasuring cylinders are used to be able to add a defined amount of reagent quickly and accurately. They are not suitable for measuring a sample. In water analysis, 100 ml sample volumes are often used. But also for this, the volumetric pipette and not the measuring cylinder is recom-mended. As with the pipettes, the fill level is reached when the meniscus rests on the ring mark.
BurettesManual burettes (Fig.10) are still used for manual titration. In contrast to motor piston and bottle-top burettes, they have no digitaldisplay. Read-ing errors can easily lead to false results (Fig.11). The reagents must be protected more against disturbing influ-ences, as e.g. CO2, which can falsify the content of alkaline titrants. Some titrations, such as the Karl Fischer titration are virtually impossible with glass burettes.

9
8
7
6
5
4
3
2
1
0
9
8
7
6
5
4
3
2
1
0
9
8
7
6
5
4
3
2
1
0
9
8
7
6
5
4
3
2
1
0
Fig. 10 Glass burette and pellet burette
Fig. 11 Accuracy of a glass burette AS
ml
± ml
ml s
10 0.02 0.02 35-45 25 0.03 0.05 35-45 50 0.05 0.1 35-45
Glass burette ASContent Error limit Division Elapsed time
Titration guide
34 35

Fig. 12 Accuracy of motor piston burettes ISO 8655 part 3 [2]
Nominal volume
ml Maximum permissible systematic error
± % ± μla Maximum permissible random error
± %b μlc
≤ 1 0.6 6.0 0.1 1.0 2 0.5 10 0.1 2.0 5 0.3 15 0.1 5.0 10 0.2 20 0.07 7.0 20 0.2 40 0.07 14 25 0.2 50 0.07 17.5 50 0.2 100 0.05 25
100 0.2 200 0.03 30
Table 1 - Maximum permissible errors for motor-driven piston burettes
a Expressed as the deviation of the mean of a tenfold measurement from the nominal volume or from the selected volume, (see ISO 8655-6:202, 8.4). b Expressed as the coefficient of variation of a measurement (see ISO 8655-6:202, 8.5). c Expressed as the repeatability standard deviation of a tenfold measurement (see ISO 8655-6:202, 8.5).
Titration guide
36 37
Piston burettesPiston burettes offer the most accurate way to dose volumes from 1 to 100 ml. This can be done by means of a bottle-top burette (with or without motor) or as a motor piston burette. The accuracy depends on the cylinder volume, the length to diameter ratio, the motor and the transmis-sion. Thus, accuracy specifica-tions going beyond the specifi-cations of the ISO 8655 also exist (Fig. 12). The motor piston burette TITRONIC® 500 (Fig.13) exceeds for example the required stan-dard values.
Criteria for the selection of a motor piston burette could be the following:
Accuracy Automatic filling Automation Interfaces Exchangeable units Handling

Fig. 13 Motor piston burette TITRONIC® 500 with exchangable unit
Titration guide
36 37

Titration guide
38 39
2.3 Verification of the correct volumeThe verification of the volume correctness usually takes place according to ISO 8655 part 6 and is documented in a check table (Fig. 14).
10 doses each are carried out on an analytical balance at 10%, 50% and 100% of the cylinder volume with water (with defined purity). For these 30 dosages, the weighing results are multi-plied by a numerical factor Z (see Fig. 5).
The difference of the average value is compared to the displayed volume. The system-atic error is calculated from the difference. The "fluctuations" are calculated as the relative standard deviation and represent the random error.
The calculation formulas are:
( )
( )
i i
ii 1
s s 0
n2
ii 1
r
sr
0
V m
1V V
10
e 100 V V / V
V V
sn 1
Vscv 100
VV
n
=
=
= ⋅ Ζ
=
= −
−
=−
=
∑
∑
∗
∗
Vi Dosed individual volumemi Weight in [g] of this individual vol-
umeV̅ Average value of the same
10 volumeses Relative systematic error of the
individual measurementsr Random error as the standard devi-
ationcv Relative, random errorVs Target volumeV0 Nominal volume cylinder

Fig. 14 Test according to ISO 8655 Teil 6: here, the first 10 dosages of a 20 ml unit are given
No.
%
Cyl
inde
r (E
x)
Dis
play
edvo
lum
e
[ml]
Wei
ght
[g]
Cal
cula
ted
vo
lum
e
[ml]
Diff
eren
ce
(targ
et v
ol.-
actu
al v
olum
e)
[ml]
Syst
emat
ic
mea
sure
men
t
devi
atio
n[%
]
Varia
tion
co
effic
ient
[%
]
1
10
2.00
00
1.98
70
1.99
40
0.0
060
0.03
68
0.00
56
2 1.
9850
1.
9919
0
.008
1
3 1.
9950
2.
0020
-0
.002
0
4 1.
9820
1.
9889
0
.011
1
5 1.
9790
1.
9859
0
.014
1
6 1.
9850
1.
9919
0
.008
1
7 1.
9780
1.
9849
0
.015
1
8 1.
9940
2.
0010
-0
.001
0
9 1.
9900
1.
9970
0
.003
0
10
1.98
20
1.98
89
0.0
111
Titration guide
38 39

Titration guide
40 41
2.4 Cleaning and careAll piston burettes require a small but careful care effort. This shall be shown in detail using the example of motor piston burettes (Fig. 15). The care naturally also depends on the type and frequency of its use (Fig. 16).
An important element is the seal between the piston and the glass wall of the cylinder. If the sealing lips are leaking, the piston and/or the cylinder must be replaced.
At the latest when the space between the two lower sealing lips (Fig. 17) is filled with liquid, a replacement is absolutely necessary. If the dosing system is not used for more than two weeks, we recommend that the dosing attachment be emptied and cleaned. This applies in particular to the operating condi-tions cited under "High demand". Failure to do so may cause the piston or valve to leak and the titrator is damaged.

We recommend the following testand maintenance work High demand Normal demand
Simple cleaning:• External wiping of chemical splashes
Visual check:• Check for untightness in the area of the dosing system?• Is the piston tight?• Is the valve tight?• Titrating tip free?Basic cleaning of the dosing system:• Clean all parts of the dosing system individually.Technical check:• Check for air bubbles in the dosing system.• Visual check• Check electrical connectionsCheck of the volume according to ISO 8655:• Carry out basic cleaning• Check according to ISO 8655 part 6 or part 7
Always during use, when necessary
Weekly, and when restarting
Every three months
Half-yearly, and when restarting
Half-yearly
Always during use, when necessary
Monthly, and when restarting
When necessary
Half-yearly, and when restarting
Yearly
Fig. 15 Maintenance and check plant at piston burettes
High demand:Use of concentrated dissolutions, reagents and chemicals (> 0.5 mol/l); chemicals which attack glass such as fluorides, phosphates, alkaline solutions, solutions which tend to crystallize; FE(III) chloride solutions; oxidizing and corroding solutions such as iodine, potassium permanganate; Cerium(IV), Karl Fischer titrants, HCl; solutions with a viscosity > 5 mm2/s; use often, daily.
Normal demand: Use of for example solutions which do not attack glass, do not crystallize or do not corrode, reagents and chemicals (< 0.5 mol/l).
Fig. 16 Usage of burettes
Titration guide
40 41

Sealing lips
Fig. 17 There may not be any liquid between the sealing lips
Titration guide
42 43

Fig. 18 Manual titration with the sample solution in an Erlenmeyer flask and the reagent in a glass burette
9
8
7
6
5
4
3
2
1
0
Standard solution
Sample solution
Titration guide
42 43
2.5 Manual titrationThe manual titration can be carried out with simple glass burettes or with piston burettes. It still has its legitimacy when it comes to carrying out very few individual content determina-tions with minimal effort.
Manual titration (Fig.18) is still in- cluded in many older standards as prescribed methods. How-ever, the automated methods have prevailed today. They can be implemented analogously to the "old" methods, optimize and accelerate the processes.
In manual titration, an indicator is usually used that changes its colour at the EQ.

Fig. 19 Some examples of acid base indicators with pH indicator ranges, colour changeover and manufacture [16]
Indicator Indicator range Colour changeover Manufacture
Bromophenol blue 3.0 – 4.6 yellow-violet 0.1 g, ethanol (20%) Kongo red 3.0 – 5.2 blue-red 0.1 g, water Bromocresol green 3.1 – 4.4 red-yellow orange 0.04 g, water Bromocresol green 3.8 – 5.4 yellow-blue 0.1 g, ethanol (20%) 2.5 dinitrophenol 4.0 – 5.8 colorless yellow 0.05 – 1 g, ethanol (20%) Alizarin S 4.3 – 6.3 yellow-violet 0.1 g, water Methyl red 4.4 – 6.2 red-yellow 0.1 g, ethanol Litmus 5.0 – 8.0 red-blue 0.2 g, ethanol Bromocresol purple 5.2 – 6.8 yellow-purple 0.1 g, ethanol (20%) Bromophenol red 5.2 – 6.8 yellow-purple 0.1 g, ethanol (20%) Bromothymol blue 6.0 – 7.6 yellow-blue 0.1 g, ethanol (20%) Phenol red 6.4 – 8.2 yellow-red 0.1 g, ethanol (20%) Neutral red 6.8 – 8.0 red-yellow 0.1 g, ethanol (70%) Phenolphthalein 8.2 – 9.8 colorless-red 0.1 g, ethanol Thymolphthalein 9.3 – 10.5 colorless-blue 0.04 – 0.1 g, ethanol (50%)
Titration guide
44 45
Indicators exist for nearly all titrations. Acid-base, redox and metal indicators are the most common (Fig. 19, general over-view in [16]). In the acid titration with sodium hydroxide, phenol-phthalein is often used, which turns from colourless to pink at the endpoint (Fig. 20). In some titrations, the colour also chang-es by the titrant itself, so that no indicator has to be added, e.g. with potassium permanganate.
Colour indicators have some considerable disadvantages:
They are not suitable for heavily coloured samples
The colour changes are perceived subjectively
The colour changes are often only temporary or sluggish
The indicators change colour in a larger transition area and participate in the reaction.

Fig. 20 Acid titration with sodium hydroxide, with phenolphthalein as indicator; close before the EQ (A), at the EQ (B)
9
8
7
6
5
4
3
2
1
0
9
8
7
6
5
4
3
2
1
0
9
8
7
6
5
4
3
2
1
0
9
8
7
6
5
4
3
2
1
0
A B
Titration guide
44 45

Fig 21 Modern titrator TitroLine® with sample changer in use
Titration guide
46 47

Fig. 22 Comparison of manual and automatic titration
Manual titration Automatic titration
very fast fast
exact very exact
simple simple after implementation
versatile versatile
very many standards and regulations very many standards and regulations
reproducibility reproducibility, documentation
comparability correctness and comparability
automation capacity automation capacity
Titration guide
46 47
2.6 Comparison of manual and automatic titrationEven if manual titrations are still carried out today, the many advantages speak in favor of using an automatic titrator (Fig. 21).
In Fig. 22, the two application forms are compared. Manual titration is often faster. The dura-tion of the titration consists of the reaction duration and the setting of the sensor potential.
With manual titration, the sensor and thus its influence on the total titration time are elimi- nated. In slow reactions, too fast manual titration can lead to over- or under- findings. Thus, some redox reactions are so slow that they run at higher temperatures or that catalysts must be added. There is a risk here that the titration in manual determination is too fast and the chemical conversion cannot follow.

Titration guide
48 49
The automatic potentiometric titration works in a drift-controlled manner, that is, the progress of the reaction can be monitored by means of a sensor. With manual titration with indicator, one titrates until the colour changes. With the content calculation, exactly one point of the entire titration is thus used for the evaluation. There thus does not exist any possibility to get information about:
Reaction process Signal/noise ratio Behavior directly before and
after the endpoint Characteristics for an uncer-
tainty consideration Are there several endpoints?
With the potentiometric titration, the entire titration curve is avail-able and thus also evaluation criteria for the above points. In addition, several measurement points in the region of the equi- valence point are used for an equivalence point calculation.
With the endpoint titration, one also titrates to one point. The direct potentiometric implemen-tation of a manual titration is thus an endpoint titration to the point where the indicator changes colour. In contrast to manual titra-tion, a complete titration curve is also available here for evaluation.
In Fig. 23, the equivalence point is at pH 7.42. The colour change starts at pH 6.80, an endpoint titration would be ended at pH 7.00. However, as the titration curve is very steep, differences in consumption, which is in effect the measurement unit of the titration, are very low. For flat titration curves, in contrast, significant differences can occur. The three different detections (optical manual, EP titration and EQ titration) must therefore be regarded as (slightly) different methods.

Fig. 23 Changeover area and equivalence point with a suitable indicator
ml
pH
0 1.25 2.5 3.75 5.0 6.25 7.5 8.75 10.0 11.251.0
2.0
3.0
4.0
5.0
6.0
7.0
8.0
9.0
10.0
11.0
pH/ml dpH/dml
7.418 pH10.77 ml Changeover area neutral red
Titration guide
48 49

Titration guide
50 51
SECTION 3
SAMPLE HANDLING
3.1 BasicsSampling and homogenization are important prerequisites for achieving a "correct" result.
When transporting a sample, it cannot always be ensured that it will remain unchanged upon arrival. An example are samples that can absorb or release humidity. There are only a few packagings that are really absolutely impermeable to water vapor. Many plastic bottles are permeable to water vapor to a small extent. Temperature fluctuations and other influences of the transport should also be considered. For this reason, care must already be taken when sampling to see how it can be transported without changing.
In any case, a sample must first be brought into a homoge-neous, dissolved form in order to be titrated. This happens according to the scheme in Fig. 24. For this, it is import-ant to remove enough sample from the material, as it is not always ensured that the content of a sample is homogeneously distributed in a material. The following points should be observed:
Is there a sediment for liquid samples?
Is there a difference in concen-tration due to a temperature difference in the vessel?
Is it natural samples, which e.g. have a shell and an inner part?
Do the samples have a coating?
Does the surface absorb hu-midity?

Fig. 24 Processing of samples
Solid sample
• crushing • homogenizing • dissolving
Liquid sample
• dissolving • homogenizing
Gaseous sample
• absorbing in a solvent
Titration guide
50 51
Another issue is the release of the parameter to be determined. For example, the chloride con-tent in cheese is an important indicator of shelf life and taste. If there is not enough chloride in the cheese, it spoils. If there is too much salt in the cheese, it does not taste good. For the determination of the chloride content, a piece of cheese (about 0.5 to 1 g) may well be placed in a beaker and filled with water. But almost nothing happens. The cheese floats in the water and the salt stays in the cheese. Only with increased temperature and a homogenizer, the largely complete release of the salt succeeds.
A homogenizer can be used profitably in the sample prepa-ration of many samples. It can shred many food samples faster and ensure a fine distribution. The analysis components to be determined are released from the samples of water or solvent and are well distributed at the same time.

Fig. 25 Sample preparation for KF titration
Dissolving trials
Temperature
Polarity of the solvent
Duration
Methanol
Methanol and formamide
Methanol + chloroform
Polarity
Titration guide
52 53
With special titrations, a strategy must be developed in advance to ensure that the quantity to be determined is also obtained in a quantitative manner. Fig. 25 illustrates the procedure. In the case of water determination, e.g. according to Karl Fischer, an attempt is made to dissolve the sample completely. If this is not possible, the water of the sample must be evaporated in an oven or only the adhering water is determined. An attempt is made to change the duration of the dissolution process and the polarity of the solvent, or to increase the temperature. In order to change the polarity, one works with different sol-vents or mixtures.
3.2 Direct volumeIn most cases of general titration, a specific volume of the sample is pipetted directly into the titra-tion vessel. For volumes up to 5 ml, the piston-stroke pipette has proven itself. For volumes above 5 ml to 100 ml, the volu-metric pipette is the instrument of choice. Usually, 50 to 150 ml beakers are used as the titration vessel. The samples are then filled with solvent, usually water, until the titration tip and the electrode are immersed in the solution. At the electrode, the diaphragm must be covered with solvent.

Dissolving trials
Temperature
Polarity of the solvent
Duration
Methanol
Methanol and formamide
Methanol + chloroform
Polarity
Titration guide
52 53
3.3 Direct weighed sampleSoluble samples are weighed directly into the titration vessel. The direct weighed sample should be over 100 mg. Other-wise, the method as described in section 3.4 is recommended. The solid samples are also filled with solvent as described with the solutions.
3.4 AliquotingIt is not always possible to use a sample as a solid or liquid sample directly for a titration. Thus, a high content in a sample may require titration with a high concentration of titrant or effect high consumption. This can lead to high costs (e.g. with silver nitrate), to long titration times or to unfavorable handling (e.g. due to large volumes). The size of the sample vessels are often predetermined by the de-gree of automation and thus also the sample amounts are limited. In addition, the high accuracy of the motor piston burettes no longer requires high consump-tion in order to obtain a safe result. Samples with a high content are therefore often filled
in a volumetric flask to a certain volume in order to use a specific aliquot for the titration.
Example:5 ml of a highly concentrated sample are filled up to 100 ml in a volumetric flask. Of these, 20 ml are taken with a volumetric pipette for the determination.
The calculation formula for a result in [mol/l] without dilution step is:
Result [mol/l] = consumption [ml] x concentration of the titrant [mol/l] / sample volume [ml]
As the 5 ml sample is diluted to 100 ml, each ml of this dilution contains 0.05 ml of original sam-ple, thus 1.00 ml original sample for 20 ml dilution:
Result [mol/l] = consumption [ml] x concentration of the titrant [mol/l] / (volume aliquot [ml] x 5/100)

Fig. 26 Calculation of a partial amount (PA) with gravimetric manufacture of the solution
Example sodium chloride (salt) Symb. Description Example values Unit
(E) Weighted sample of the salt 5.8443 [g]
(W) Water is weighed in 95.000 [g]
(G) (G = E + W) total weight 100.844(3) [g]
(T) (T) weigh the partial amount to the titration 1.0000 [g]
PA The partial amount contains sodium chloride
sample part = T * E / (E + W) = 0.057953
= 5.8443 * 1.0000 / 100.8443
[g]
Titration guide
54 55
3.5 Weigh out small solid amountsSolid samples are often weighed directly into a beaker, dissolved or homogenized and titrated. The 4-digit analytical balance is the right instrument for this. Nevertheless, handling weighed samples less than 100 mg is dif-ficult and often involves large er-rors. This may be due to the scale or the handling of the sample, but also to the installation condi-tions of the balance in its place.
With many solid samples, the accuracy can be increased by one order of magnitude when operating with the procedure shown in (Fig. 26).
A larger amount of the sample (e.g., 5.8443 g NaCl) is weighed in, plus water in a larger amount (e.g. 95.000 g). A portion of this solution is removed and weighed again (e.g. 1.0000 g). The NaCl part can be calculated according to the following formula:
[ ]sample part gW
Τ∗Ε=Ε +

Fig. 27 Syringe with sample on analytical balance
Titration guide
54 55
In practice, the following pro-cedure has been proven to be successful:
The solution is drawn into a syringe, placed on an analytical balance and is tared (Fig.27). An arbitrary partial amount is added to the titration vessel from the syringe and the syringe is weighed back.
The direct weighed sample of NaCl with 0.0580 g would already have an uncertainty of +/- 0.0002 g through the balance. Handling errors and other influences are not yet included.

Platinum combination electrode (for all redox reactions)
Silver combination electrode (for the determination of e.g. chloride…)
pH combination electrode with platinum diaphragm (for all aqueous acid-base titrations)
Titration guide
56 57
SECTION 4
SENSORS AND REAGENTS
4.1 Overview of the sensorsThe following electrodes are part of the standard equipment of a titration laboratory:

Ion-sensitive electrodes (ISE), such as Ca electrode, Cu electrode, fluoride electrode as combination electrode or with a separate reference electrode (depending on the task and type of the sam-ples)
pH combination electrode with ground-joint diaphragm (with or-ganic electrolyte solutions for titration in organic solutions)
Platinum double electrode (for reversible redox reactions with dead stop detection)
Titration guide
56 57

Titration guide
58 59
Individual electrode potentials cannot be measured directly, but only the difference between two electrode potentials. Therefore, a combination of indicator and reference electrode must always be used. The potential of the reference electrode must not change during the titration. Either a combined measuring chain or separate indicator and reference electrodes can be used (see Fig. 28).
Details regarding the measuring chains are represented in detail in our pH guide [5].
Combination electrodes, i.e. combined electrodes contain-ing the indicator and reference electrodes, are usually used nowadays. In special cases, an indicator electrode is used together with a separate reference electrode. Separate measuring chains are often used with ISE electrodes, as their durability - depending on the application - of indicator and reference electrodes is different.
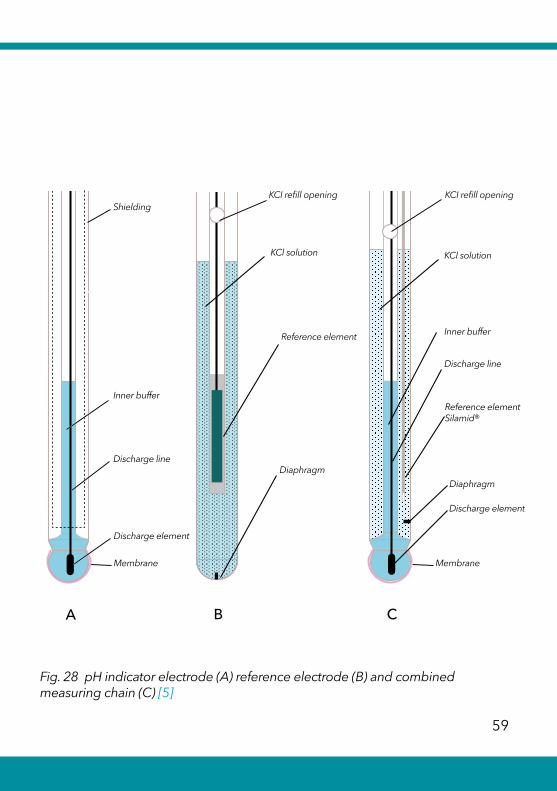
Fig. 28 pH indicator electrode (A) reference electrode (B) and combined measuring chain (C) [5]
Membrane
Shielding
Inner buffer
Discharge line
Discharge element
Diaphragm
Reference element
KCI refill opening
KCl solution
Discharge element
KCI refill opening
Inner buffer
Discharge line
Diaphragm
Reference elementSilamid®
KCl solution
Membrane
BA C
Titration guide
58 59

Fig. 29 Diaphragm types [5]
Type Resistance Discharge Application / Properties
Ceramic 1 kΩ 0,2 ml/d
Platinum 0,5 kΩ 1 ml/d
Ground joint 0,2 kΩ 3 ml/d
Annular gap 0,1 kΩ solid
electrolyte
Fibre 1 kΩ solid electrolyte
+ general application. robust,- juniversally, short response time, constant insensible against dirt and chemical reactions, tend to pollution/blockage
+ universal, fast setting, constant contamination-resistant, clean defined discharge channels, less diffusion tension- only clean chemically, not mechanically
+ Emulsion, pastes, purest water, easy cleaning, - discharge deviations due to different placement of the ground joint; loosening of the ground joint difficult with internal overpressure, filigree
+ Annular gap symmetrical, easy handling, resistant to contamination- sample can reach the reference system, cleaning of the reference system not possible
+ fast setting, easy handling,- sample can reach the reference system, cleaning of the reference system not possible
Titration guide
60 61
The conductive connection of the reference electrode is made via the diaphragm. In the case of electrodes with liquid electrolyte, a small amount of the reference electrolyte must always flow out here. The used diaphragms are shown in Fig. 29.
For titrations, electrodes with platinum diaphragms are mainly used. For applications in organic solvents, electrodes with a ground-joint diaphragm are recommended, as they are less prone to clogging due to the higher discharge.
When using a glass electrode as a reference electrode, it must be noted that the glass elec-trode must be connected to the high-impedance measuring input due to its high resistance, and not to the measuring input for the reference electrode. The titration curves change their direction.
Titration guide
60 61
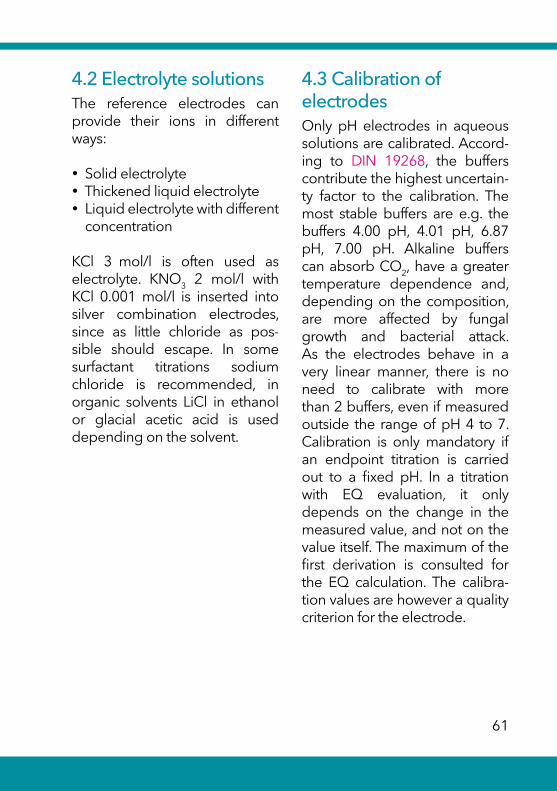
4.2 Electrolyte solutionsThe reference electrodes can provide their ions in different ways:
Solid electrolyte Thickened liquid electrolyte Liquid electrolyte with different
concentration
KCl 3 mol/l is often used as electrolyte. KNO3 2 mol/l with KCl 0.001 mol/l is inserted into silver combination electrodes, since as little chloride as pos-sible should escape. In some surfactant titrations sodium chloride is recommended, in organic solvents LiCl in ethanol or glacial acetic acid is used depending on the solvent.
4.3 Calibration of electrodesOnly pH electrodes in aqueous solutions are calibrated. Accord-ing to DIN 19268, the buffers contribute the highest uncertain-ty factor to the calibration. The most stable buffers are e.g. the buffers 4.00 pH, 4.01 pH, 6.87 pH, 7.00 pH. Alkaline buffers can absorb CO2, have a greater temperature dependence and, depending on the composition, are more affected by fungal growth and bacterial attack. As the electrodes behave in a very linear manner, there is no need to calibrate with more than 2 buffers, even if measured outside the range of pH 4 to 7. Calibration is only mandatory if an endpoint titration is carried out to a fixed pH. In a titration with EQ evaluation, it only depends on the change in the measured value, and not on the value itself. The maximum of the first derivation is consulted for the EQ calculation. The calibra-tion values are however a quality criterion for the electrode.

Titration guide
62 63
The slope and the zero point are calculated. Their limits depend on their own requi-rements of the measurement uncertainty. The following limits are widely used, within which an electrode is still considered to be trustworthy:
Slope > 95 % to 102 % Zero point pH 6.5 to pH 7.2
The slope of the electrode and the response time are often linked. A slow electrode also has a low slope. The response behavior is important for the titration. We recommend an exchange with a slope below 95%. Too slow electrodes can lead to errors: If the titration is carried out with an electrode which is too slow, a value that is too high is often found.
All other electrodes are checked by the titration of a standard and evaluation of the titration curve.
The criteria are:
(1) Is the content found again? (2) Is the EQ in the expected
potential range (Fig. 30 )? (3) Does the titration take longer
than normal? (4) Are the start and stop poten-
tials in the expected range (Fig. 30 and)?
(5) Does the first derivation have the usual height or the usual value at the maximum?
(6) Is the titration free from noise?
If one or even more of the criteria is not met, the electrode should be exchanged after a thorough error analysis.

Fig. 30 Criteria for evaluating the electrode quality
ml
mV
0 0.875 1.75 2.625 3.5 4.375 5.25 6.125 7.0 7.8750.0
50.0
100.0
150.0
200.0
250.0
300.0
mV/ml dmV/dml
196.3 mV6.77 ml
Titration guide
62 63

Titration guide
64 65
4.4 ReagentsThe most commonly used reagents are (sorted by the frequency of their applications):
NaOH, sodium hydroxide (for the determination of acids in aqueous systems)
HCl, hydrochloric acid (for the determination of bases, carbon-ates and bicarbonates in aque-ous systems)
Na2EDTA (for complexometric determinations)
HClO4, perchloric acid in glacial acetic acid (determination of bases in organic solvents)
When using the reagents, in addition to the safety regulations, some matters must be observed:
Sodium hydroxide
Sodium hydroxide is used in a concentration of 0.01 mol/l to 1 mol/l. The highly diluted solutions can absorb CO2 from the atmosphere and thus alter their content. They are used for very accurate titrations under inert gas. The reagent bottles with alkaline reagents are closed with CO2 absorption tubes. These contain soda lime, a mix-ture of solid NaOH and Ca(OH)2. This must be exchanged regu-larly. An indicator in soda lime indicates the exchange too late. Higher concentrations than 0.1 mol/l can attack the glass of the cylinder. Therefore, the tightness of the pistons must be specially observed.
Hydrochloric acid
Hydrochloric acid in concentra-tions up to 0.1 mol/l is easy to handle. It is corrosive in higher concentration and can cause damages in the titrator. It is recommended to remove the unit from the titrator when not in use.

Titration guide
64 65
Na2EDTA
Na2EDTA contains some NaOH. The same aspects apply as with sodium hydroxide Concentra-tions of 0.01 mol/l to 0.1 mol/l are common.
AgNO3
Silver nitrate can be used over a wide concentration range and is also very stable. Due to the high molecular weight and the easy solubility, a silver nitrate standard solution can be produced very accurately. Silver nitrate is sensi-tive to light and must be stored in dark bottles.
Na2S2O3
Sodium thiosulphate is a reduc-ing agent and is stabilized with commercially available titrants. If you make it yourself, the titer is only stable after some time.
Ce(SO4)2
Cerium sulphate is a strong oxidizer and must correspond-ingly be handled with care. It is corrosive.
(NH4)2Fe2(SO4)2
Ammonium iron (II) sulphate is a reducing agent. It is often stabi-lized with sulfuric acid and there-fore has a corrosive effect.
KOH in Ethanol or isopropanol
Potassium hydroxide in alcohol is a very strong base. The same aspects apply here as with sodium hydroxide.
HClO4 in glacial acetic acid
Perchloric acid in glacial acetic acid is a very strong acid. Perchloric acid is usually used with 0.1 mol/l. Solutions which are more diluted lead to flatter titration curves.

Titration guide
66 67
4.5 Titer determinationThe titration is an absolute method which is directly attrib-utable to the chemical conver-sion. The measured value is the volume of titrant that is convert-ed during the reaction. This as-sumes that the concentration of the titrant is actually correct. It is therefore always the first step of an application to determine its concentration accurately. If this is carried out with a certi-fied standard, the concentration can be traced back to a nation-al standard (original titer sub-stance) and its concentration can be determined accurately at the same time. The certified standards must be treated care-fully. They should be kept dry at 15 - 25 °C in their original sealed packaging. If necessary they must be dried before use (Fig. 31).
The titer is a dimensionless num-ber for correcting the indicated concentration. The titer is about 1.0.
WTiter
EQ c M=
∗ ∗
The real concentration of the titrant is often calculated during the titer determination:
real concentration TW
EQ M=
∗
In the software of the titration devices from SI Analytics®, the term “Titer“ describes the real concentration and not the dimensionless factor. We also use this term in the examples of titration applications in this guide.
[ ]T mol / l F2
( ) 1W
EQ B M F∗
=− ∗ ∗
T: Real concentration of the titrantW: Weighed sample standard /
sample in [g]EQ: Consumption titrantM: molar mass of the standardB: Blank value of the solventF1, F2: variable factors e.g. for the con-
version of units, stoichiometryc: Target concentration of the
titrant

Fig. 31 Standard titer substances and reference materials for the titration
Application Standard titer substance Formula
Molar mass [g/mol]
Drying
Acidimetry
sodium carbonate free of water Tris(hydroxyl-methyl-aminomethan (TRIS)
Na2CO3
C4H11N03
105.99
121.14
180 °C
105 °C
Alkalimetry
Benzoic acid
C7H602
C8H5K04
122.12
204.23
-
105 °C /3h
Argentometry
Sodium chloride
NaCl
58.443
110 °C
Karl Fischer titration
Di-sodium tartrateDi-hydrate
C4H4Na2O6*2H20
230.08
-
Complexometry
Calcium carbonate Zinc
CaCO3
Zn
100.09
65.37
105 °C
-
Oxidimetry Cerimetry
di-arsenic trioxide di-sodium oxalate Iron(II) ethylenediammonium sulfate potassium dichromate potassium iodate
As2O3
C2Na2O4
(CH2NH3)2 S04 *
FeSO4*4H20
K2Cr2O7
KI03
197.84
133.999
382.15
294.19
214.00
105 °C /3h
105 °C
-
105°C
150 °C / 180 °C
Potassium hydrogen phthalate
Titration guide
66 67

Titration guide
68 69
Titer determination of basesAlkalis can be adjusted with acids. Suitable acids are potassium hydrogen phthalate, benzoic acid, oxalic acid dihy-drate or amidosulfonic acid. In water or acetic acid as solvent, potassium hydrogen phthalate is recommended, in organic solu-tions, e.g. in the pharmaceutical sector, benzoic acid is usually used.
The reaction equation for the titer determination with potassi-um hydrogen phthalate is:
PhtKH + NaOH → Pht2- + H2O + Na+ + K+
Potassium hydrogen phthalate (Fig. 32) is only weakly dissociated in aqueous solution. The titration curve therefore increases initially, similar to acetic acid, to show a steep jump after a plateau. The pKs2 value is 5.41.
Instruction for the titer determi-nation of a 0.1 mol/l NaOH
Approximately 200 mg of potassium hydrogen phthal-ate are weighed into a 150 ml beaker with an analytical balance to four digits after the decimal point and are filled up with deionized carbonate-free water to approx. 100 ml. After complete dissolution, the titration is started to a pH 11 or up to an equivalence point. The equivalence point is evaluated. The consumption is approxi-mately 10 ml.
Handling of the standard
Drying: two hours at 120 °C Storage: Tightly closed in the original
packaging, protect from light and humidity, at room tem-perature (+15 - 25 ° C) Observe the minimum
usability

Fig. 32 Titer determination of an 0.1 mol/l NaOH with potassium hydrogen phthalate
ml
pH
0 1.25 2.5 3.75 5.0 6.25 7.5 8.75 10.03.5
4.375
5.25
6.125
7.0
7.875
8.75
9.625
10.5
pH/ml dpH/dml
8.568 pH10.13 ml
Titration guide
68 69
The following must be observed:
The slope of the pH electrode is > 95 % for the aqueous titration The NaOH solution in the
storage bottle must be protected against CO2 influence with soda lime All crystals of the standard
must be completely dissolved at the start of the titration
The following titration parameters are recommended:
Dynamic titration Normal (average) titration speed Dynamics: steep No damping End criterion 1 EQ with slope
value 700 mV/ml and pH 11
Calculation of the titer
[ ]T mol / l F2
( ) 1W
EQ B M F∗
=− ∗ ∗
T: real concentration of the titrant
W: Weighed sample standard / sample in [g]
EQ: Consumption titrant in [ml]B: Blank value of the solvent in [ml]M: 204,22 g/mol (molar mass of
potassium hydrogen phthalate)F1: 1F2: 1000 (conversion ml - L)

Titration guide
70 71
Titer determination of acidsAcids can be adjusted with bases. As a base, e.g. sodium carbonate and TRIS (tris(hy-droxymethyl)-aminomethane, or according to IUPAC 2-amino- 2-hydroxymethyl-propane-1.3- diol) are suitable. TRIS is recom- mended, as the handling is simpler and more secure.
The reaction equation for titer determination with TRIS is:
C(CH2OH)3NH2 + H3O+ →
C(CH2OH)3NH3+ + H2O
A falling titration curve (Fig. 33) results, which can be interrupted at the EQ or which can be counted back after overtitration of the EQ. The latter method is recommended if carbonates are expected.
Instruction for the titer determi-nation of a 0.1 mol/l HCl
Approx. 120 mg TRIS are weighed into a 150 ml beaker with an analytical balance to four digits after the decimal point, and filled with deionized, carbonate-free water to approx. 100 ml. After com-plete dissolution, the titration is started to a pH 2.5 or up to an equivalence point. The equi- valence point is evaluated. The consumption is approximately 10 ml.
Handling of the standard
Drying: 24 hours via desiccant in the
desiccator Storage: Tightly closed in the original
packaging, protect from light and humidity, at room temperature (+15 - 25 ° C) Observe the minimum
usability

Fig. 33 Titer determination of an 0.1 mol/l HCl with TRIS
ml
pH
0 1.0 2.0 3.0 4.0 5.0 6.0 7.0 8.0 9.02.625
3.5
4.375
5.25
6.125
7.0
7.875
8.75
9.625
pH/ml dpH/dml
8.76 ml4.857 pH
Titration guide
70 71
The following must be observed:
The slope of the pH electrode is > 95 % for the aqueous titration The added solvent must
be free from CO2 All crystals of the standard
must be completely dissolved at the start of the titration
The following titration parameters are recommended:
Dynamic titration Normal (average) titration
speed Dynamics: steep No damping End criterion 1 EQ with
slope value 700 mV/ml and pH 2.5
Calculation of the titer
[ ]T mol / l F2
( ) 1W
EQ B M F∗
=− ∗ ∗
T: Real concentration of the titrantW: Weighed sample standard /
sample in [g]EQ: Consumption titrant in [ml]B: Blank value of the solvent in [ml]M: 121.14 g/mol (molar mass of TRIS)F1: 1F2: 1000 (conversion ml - l)

Titration guide
72 73
Titer determination of silver nitrateSilver nitrate is often adjusted with NaCl. This is available as a secondary NIST standard. Although KCl would have a higher molecular weight, it is often not available in the neces-sary purity.
The reaction equation for the ti-ter determination with NaCl is:
Na+ + Cl- + Ag++ NO3- →
Na+ + NO3- + AgCl ↓
An increasing titration curve (Fig. 34) results, which can be interrupted at the EQ or which can be counted back after over-titration of the EQ. When a glass electrode is used as a reference, a falling titration curve results.
Instruction for the titer determi-nation of a 0.1 mol/L AgNO3
Approx. 58 mg of NaCl are accurately weighed into a 150 ml beaker to four digits after the decimal point using an analytical balance, filled with deionized water up to approx. 100 ml, and 2 ml of semi- concentrated HNO3 or H2SO4 are added. The equivalence point is evaluated. The consumption is approximately 10 ml. A white precipitation forms during titration.
Handling of the standard
Drying: at 110 °C 3 hours Storage: Tightly closed in
the original packaging, protect from light and humidity, at room temperature (+15 - 25 ° C). Observe the minimum
usability
The following must be observed:
The titration shall last between three and five minutes.

ml
mV
0 1.25 2.5 3.75 5.0 6.25 7.5 8.75 10.00.0
50.0
100.0
150.0
200.0
250.0
300.0
mV/ml dmV/dml
201.7 mV10.02 ml
Fig. 34 Titer determination of a silver nitrate solution with sodium chloride
Titration guide
72 73
The following titration parameters are recommended:
Dynamic titration Measuring speed: Measurement time 3 s Drift 10 mV/min Min time 3 s Max time 15 s Dynamics: steep No damping End criterion 1 EQ with
slope value 400 mV/ml
Calculation of the titer
[ ]T mol / l F2
( ) 1W
EQ B M F∗
=− ∗ ∗
T: Real concentration of the titrantW: Weighed sample standard /
sample in [g]EQ: Consumption titrant in [ml]B: Blank value of the solvent in [ml]M: 58.433 g/mol (molar mass of
NaCl)F1: 1F2: 1000 (conversion ml - l)

Titration guide
74 75
Titer determination of perchloric acidPerchloric acid is a very strong acid that can be used to titrate potassium hydrogen phthalate as the base in acetic acid.
The reaction equation for the titer determination with potassi-um hydrogen phthalate is:
PhtKH + HClO4 → PhtH2 + K+ + ClO4
-
The titration is performed as mV titration. It therefore increases and does not fall, as would be the case with a titration with acid in the pH range.
Instruction for the titer determi-nation of a 0.1 mol/l HClO4
Approximately 200 mg of potas-sium hydrogen phthalate (Fig. 35) are weighed into a 150 ml beaker with an analytical balance to four digits after the decimal point and are filled up with glacial acetic acid to approx. 80 - 100 ml. After complete dissolution, the titration is started up to an equiv-alence point. The equivalence point is evaluated. The consump-tion is approximately 10 ml.
Handling of the standard
Drying: two hours at 120 °C Storage: Tightly closed in the original
packaging, protect from light and humidity, at room tem-perature (+15 - 25 ° C). Observe the minimum
usability
The following must be observed:
All crystals of the standard must be completely dissolved at the start of the titration! LiCl in ethanol or in glacial
acetic acid should be used as electrolyte.

Fig. 35 Titer determination of a perchloric acid with potassium hydrogen phthalate
ml
mV
0 1.25 2.5 3.75 5.0 6.25 7.5 8.75 10.0350.0
375.0
400.0
425.0
450.0
475.0
500.0
525.0
550.0
575.0
mV/ml dmV/dml
540.2 mV9.94 ml
Titration guide
74 75
The following titration parameters are recommended:
Dynamic titration Measuring speed: Measurement time 2 s Drift 10 mV/min Min time 3 s Max time 15 s Dynamics: average average damping End criterion 1 EQ with
slope value 300 mV/ml
Calculation of the titer
[ ]T mol / l F2
( ) 1W
EQ B M F∗
=− ∗ ∗
T: Real concentration of the titrant
W: Weighed sample standard / sample in [g]
EQ: Consumption titrant in [ml]B: Blank value of the solvent in [ml]M: 20422 g/mol (molar mass of
potassium hydrogen phthalate)F1: 1F2: 1000 (conversion ml - l)

Titration guide
76 77
Titer determination of thiosulphateThiosulphate is usually adjust-ed with potassium iodate. This is available as a secondary NIST standard.
The reaction equation for the titer determination with KIO3 is:
5 I- + IO3- + 6 S2O3
2- + 6 H+ → 3 S4O6
2- + 3 H2O + 6 I-
A falling titration curve results (Fig.36), which can be interrupt-ed at the EQ or which can be counted back after overtitration of the EQ.
Instruction of a 0.1 mol/l thiosulphate solution
Approx. 50 mg KIO3 are weighed into a 150 ml beaker with an ana-lytical balance to four digits after the decimal point; approx. 1 g potassium iodide is added and filled with deionized water to ap-prox. 100 ml. 5 ml of approx. 5% HCl is added. The equivalence point is evaluated. The consump-tion is approximately 14 ml.
Handling of the standard:
Drying: at 150 °C 3 hours Storage: Tightly closed in the original
packaging, protect from light and humidity, at room tem-perature (+15 - 25 ° C) Observe the minimum
usability
The following must be observed:
A platinum combination elec-trode is used as electrode Potassium iodate and potassi-
um iodide react iodine in acid, with their oxidizing properties Sufficient acid must be present
in the solution The iodide must be present in a very high excess

Fig. 36 Titer determination of a Na2S2O3 solution
ml
mV
0 0.5 1.0 1.5 2.0 2.5 3.0 3.5 4.0 4.5150.0
225.0
300.0
375.0
450.0
mV/ml dmV/dml
4.67 ml312.3 mV
Titration guide
76 77
The following titration parameters are recommended:
Dynamic titration Measuring speed: Measurement time 2 s Drift 10 mV/min Min time 3 s Max time 15 s Dynamics: average No damping End criterion 1 EQ with
slope value 300 mV/ml
Calculation of the titer
[ ]T mol / l F2
( ) 1W
EQ B M F∗
=− ∗ ∗
T: Real concentration of the titrantW: Weighed sample standard /
sample in [g]EQ: Consumption titrant in [ml]B: Blank value of the solvent in [ml]M: 214.00 g/mol (molar mass of
potassium iodate)F1: 1 / 6 as stoichiometric factor from
the reaction equationF2: 1000 (conversion ml - l)

Titration guide
78 79
Titer determination of iodineThe titer of an iodine solution can be set directly with arsenic (III) oxide. However, this is not recommended due to the tox-icity of arsenic. Nowadays it is best to use an adjusted sodium thiosulphate solution, which is titrated with the iodine solution.
The reaction equation for the titer determination is:
I2 + 2 S2O32- → S4O6
2- + 2 I-
Instruction for the titer deter-mination: a 0.05 mol/l iodine solution
5 ml of a 0.1 mol/l sodium thio-sulphate solution is pipetted into a 150 ml beaker, filled with deionized water to approx. 100 ml and 5 ml of approx. 5% HCl is added.The titration can be carried out both as a potentiometric titration with a redox electrode and as a Dead Stop titration. The consumption is at approx. 5 ml (Fig. 37).

Fig. 37 Titer determination of an iodine solution (Dead Stop)
ml
µA
0 0.625 1.25 1.875 2.5 3.125 3.75 4.375 5.0
0.0
0.875
1.75
2.625
3.5
4.375
5.25
6.125
7.0
7.875
µA/ml
5.191 ml2.0 µA
Titration guide
78 79
The following titration parameters are recommended:
Dead Stop titration linear steps: 0.02 ml Pre-titration: none Dosing speed 20 % Titration direction:
increasing Measuring speed: fixed waiting time 1s Polarization voltage: 100 mV Delta endpoint: 1.0 µA Titration end: 2.0 µA Endpoint delay: 5 s
Calculation of the titer
[ ]( )
V F2T mol / l
EP B M F1∗
=− ∗ ∗
T: Real concentration of the titrantV: Volume of the Na2S2O3
- solution [ml]
EP: Consumption titrant in [ml]B: Blank value of the solvent in [ml]M: 1F1: 2 as stoichiometric factor from
the reaction equationF2: Concentration of the Na2S2O3
-
solution [mol/L]

Titration guide
80 81
Titration guide

Titration guide
80 81
SECTION 5
TITRATION PARAMETERS AND CALCULATIONS
5.1 OverviewTitration methods have to be adapted to the type of appli-cation and partly to the type of samples.
This adjustment requires the selection of the measured vari-able (and the associated sensor), the appropriate titrator or attach-ment with the associated reagent and the correct parameters in the titration device or the software. The selection of the measurand and the reagent can be found in the application description. The settings in the methods and the theory behind them shall be briefly described here. A titration is parameterized by five elements:
Control of the dosage Response behavior of the
electrode and speed Definition of the titration end Calculation(s) Documentation of the result.
The titration takes place in many individual steps. It is true that part of the titration volume can be added in one step or contin-uously. However, the part of the titration curve that is used for the calculation is created in de-fined steps as a list of data with consumption, measured value, time and possibly additional information. From these data, the endpoint or equivalence point is calculated with appropriate functions.
An important requirement is that the measured values are also reliable. This is achieved by monitoring the measured values and only taking them into a titra-tion curve when they are stable. From the calculated equivalence or endpoint, the result can then be calculated taking into account the weighed sample, titer and blank value in the correct unit.

Titration guide
82 83
5.2 Control of the dosageReagent addition can be done in titrators in three different ways:
Continuous addition Equidistant steps (Linear titration) Step size dependent on the
gradient of the titration curve (dynamic titration)
These can also be used in a com-bined manner. For example, it is possible to add continuously in order to then continue to titrate in a linear or dynamic manner.
The continuous addition has the advantage of a fast addition. Even if measurements can be generated during the addition, this does not mean that the re-action speed is set correctly or that the adjustment behavior of the sensor is taken into account. In practice, for most titrations, too much would clearly be found in this manner with fast continuous addition, but too little with a kinetically inhibited reaction.
Linear TitrationIn linear titration, the reagent is added in equal steps. Usually, it is waited after each step until the potential has adjusted or it can be assumed after a fixed waiting time that the potential is stable. A titration curve should not have too many but also not too few measuring points. Too few mea-surement points lead to a less accurate calculation, but also too many. This is due to the small potential change with small steps, resulting in less stable measured values and less accurate dosag-es. In addition, it is not always en-sured that small volumes actually arrive at the titration tip. As a rule of thumb, a linear titration should have 20 to 50 measured values and only exceed 100 measured values in special cases.
In Fig. 38 a/b, the influence of the smaller number of titration steps is shown.

Fig. 38 a Ca determination with EDTA linear with 126 (A) and 64 (B) measured values
A
B
0
50
100
150
200
250
300
350
400
450
500
-160
-140
-120
-100
-80
-60
-40
-20
0
20
40
60
0 2 4 6 8 10 12 14
mV
ml EDTA
Ca with EDTA linear 0.1 ml steps
dmVdmL
0
50
100
150
200
250
300
350
400
450
500
-160
-140
-120
-100
-80
-60
-40
-20
0
20
40
60
0 2 4 6 8 10 12 14
mV
ml EDTA
Ca with EDTA 0.2 ml steps
dmVdmL
Titration guide
82 83

C
D
Fig. 38 b Ca determination with EDTA linear with 26 (C) and 13 (D) measured values
0
5
10
15
20
25
30
35
40
45
50
-160
-140
-120
-100
-80
-60
-40
-20
0
20
40
60
0 2 4 6 8 10 12 14
mV
ml EDTA
Ca with EDTA 0.5 ml steps
dmVdmL
0
5
10
15
20
25
30
35
-160
-140
-120
-100
-80
-60
-40
-20
0
20
40
60
0 2 4 6 8 10 12 14
mV
ml EDTA
Ca with EDTA 1.0 ml steps
dmVdmL
Titration guide
84 85

Titration guide
84 85
A titration curve with 126 titration steps is clearly overloaded, 64 measuring points result in a per-fect titration curve (with many measuring points in the low ml range). At 26 measuring points, small changes of the distribut-ed first derivation can already be observed. At 13 measuring points, it may no longer be possi-ble to carry out a correct evalua-tion, as measuring points may be missing for the EQ calculation. With such a titration curve, it is recommended to select smaller titration steps in order to obtain a larger number of measuring points and a titration curve that can be evaluated in a better manner.
Application areas of linear titra-tion are e.g.:
titrations in organic solvents, titration of very small contents, conductivity titrations, photometric titrations µA titrations
It has important advantages:
more stable potentials result, as usually sufficient reagent is converted in order to achieve a significant potential change, disturbances of potentials only
have a small influence on the titration curve.
The disadvantages can be seen clearly:
too many measurement points in areas where little happens. only a few measurement
points in the EQ area.

Titration guide
86 87
Dynamic TitrationDynamic titration is the preferred form of reagent addition. It is used in most titrations according to the Nernst equation, for exam-ple:
Acid-base titrations in aque-ous and alcoholic solutions Chloride determinations Redox titrations
It has many advantages:
High accuracy Fast titration Only the number of data points
which is really necessary
It is not used when:
A connection according to the Nernst equation does not exist Stable potentials do not exist With very small contents Organic solvents are used
With dynamic titration, the step is calculated as a function of the slope of the titration curve.
This means that in the flat part of the curve large volume steps are dosed and in the steep part small steps.
Fig. 39 clearly shows what mat-ters: The titration shall be carried out quickly, but also very accu-rately with high resolution. Due to the high resolution, e.g. errors can be found in the titrant: The KOH in Fig. 40 is contaminated with carbonate. This is often not detected in a titration. For this, the titration in the steep part, but also only there, must be titrated with a particularly high resolution, so that both EQs are recognizable.
Fig. 39 shows the individual addition steps with dynamic titration. In the beginning, it is carefully started with small steps so that it is not over-titrated. Then a few large volume steps follow until just before the EQs. The EQ area is then titrated with small steps. Even if the distance of the steps in the jump area appears to be different, on the x-axis with the ml values, the volume steps are all equal to the smallest set step.

2.00
4.00
6.00
8.00
10.00
12.00
0 2 4 6 8 10 12 14 16
pH
ml HCl
KOH with HCl dynamic
Fig. 39 Representation of the measure values on the titration curve
Fig. 40 Titration curve of a carbonate-containing KOH dynamically titrated with HCl
0
500
1000
1500
2000
2500
0.00
2.00
4.00
6.00
8.00
10.00
12.00
14.00
0 2 4 6 8 10 12 14 16
pH
ml HCl
KOH with HCl dynamic
dmVdmL
0
500
1000
1500
2000
2500
0.00
2.00
4.00
6.00
8.00
10.00
12.00
14.00
9 9.5 10 10.5 11
pH
ml HCl
dmVdmL
Titration guide
86 87

Fig. 41 Function for calculating the step of the titration curve
0.00
0.05
0.10
0.15
0.20
0.25
0.30
0.35
0.40
0.45
0.50
0 100 200 300 400
Dos
ing
step
[ml]
Increase [dmV/dml]
Titration guide
88 89
The calculation of the step takes place on the basis of a hyper-bolic function:
b
a cStep size [ml]Gradient
= +
with "a", "b" and "c" as calculation factors, which are automatically determined from the titration curve.
This hyperbolic function is de-rived from the Nernst equation, which represents an "In" function. The derivation of the ln(x)- function is 1/x, which is behind this formula.
Fig. 41 shows that large steps are titrated with a small slope value and small steps with a large slope.

Fig. 42 Regulation area of the dynamics
0
500
1000
1500
2000
2500
2.00
4.00
6.00
8.00
10.00
12.00
8 8.5 9 9.5 10 10.5 11 11.5 12 12.5 13
dmVdmL
mL
pH
ml Gradient ml per step2.300 3 1.0003.300 4 1.0004.300 5 1.0005.300 6 1.0006.300 8 1.0007.300 11 1.0008.240 17 0.9408.796 28 0.5569.548 149 0.0449.580 179 0.0329.610 206 0.0309.632 244 0.0229.652 310 0.0209.672 413 0.020
Titration guide
88 89
Fig. 42 shows the regulation areas of the titration. Within the blue area, the step is reduced or increased again, in the orange area, the smallest step is dosed with a defined accuracy. The following entries are required for the parameterization:
Largest step in [ml] Smallest step in [ml] Gradient, until which the larg-
est step shall be dosed [dmV/dml] Gradient, from which the
smallest step shall be dosed [dmV/dml]
In the above example these are:
1.000 ml 0.020 ml 15 mV/ml 250 mV/ml

Titration guide
90 91
In order to obtain meaningful results, the settings "steep, average or weak jump" are usually sufficient. Steps that are too large steps can lead to over-titration, too small lead to potential differences and thus to strong noise of the curve. This reduces the accuracy of the titration. As a rule of thumb, approx. 5-10 % of the total titra-tion volume are suitable as the largest step, 2 % for the smallest step. Certain requirements for extra accuracy or speed may require different settings.
5.3 Response behavior of the electrode and speedThe adjustment of the step alone is not sufficient to control a titration curve. It must also be ensured that the "correct" stable measuring signal is applied to the electrode. In certain circum-stances measuring signal needs some time until stable values are adjusted. This time depends on various factors, such as type, age and condition of the electrode and the concentration of the material to be measured. In practice, therefore, the setting behavior of the electrode is observed and evaluated the course of the measured value per unit time. The change in the measured value per time is called drift (Fig. 43). The measurement unit is [mV/min].
Fig. 44 clearly shows that most of the titration time is used for accurate drift control in the area of the equivalence points. The graph shows a linear titration with the same step size, in order to avoid effects due to several small volume additions instead of one large addition.

Fig. 43 Measured value change per time
100
120
140
160
180
200
220
240
260
280
0 0.5 1 1.5 2 2.5
Mea
sure
d va
lue
[mV]
Time [s]
Drift as measured value per time
0
50
100
150
200
250
300
0
2
4
6
8
10
12
0 2 4 6 8 10 12
Titr
ation
dur
ation
[s]
pH
NaOH [ml]
pH curve
time curve
H3PO4 Titration curve and time behavior
Fig. 44 Titration curve (blue) and titration duration (green)
Titration guide
90 91

Fig. 45 Setting parameters for the drift (practical values)
Titration duration Minimum waiting time
t_min [s] Maximum drift time
t_max [s] Measurement time
t_p [s] [mV/min]
Fast 1 5 1 50 Average 2 15 2 20 Exact 5 20 2 10
Drift value
Titration guide
92 93
As parameters,
the minimum waiting time, the maximum waiting time, the window for the testing
time, the drift value,
can be set (Fig. 45).
The minimum waiting time must be waited for in any case, even if the drift within the testing time is already monitored during this time.
A minimum waiting time of 10 seconds is waited for in Fig. 46. Within the last five seconds (testing time), however, the drift is already determined and compared with the target value (Fig. 47). The window for the testing time will continue to move until the maximum drift time or drift value is reached. The value represents the gradient of the drift curve.
It is recommended to select the minimum time not too short, as an alternating system can build up. The current value is accepted very quickly, but causes the next value to take longer to adjust.
In some cases, it may be sensible to work with fixed waiting times instead of a drift-controlled waiting time; especially for applications that provide only a few stable measured values, low potential changes, or do not provide mV or pH values according to the Nernst equation (e.g. μA values, mS values, or temperatures). Fixed waiting times are usually set in the range of 5 - 30 seconds.

100
120
140
160
180
200
220
240
260
280
0 5 10 15 20 25
t_maxt_mint_p
Time = x[n]
Time [s]
Mea
sure
d va
lue
[mV]
Fig. 46 Setting the drift and the necessary parameters(description of the parameters, see Fig. 45)
100
120
140
160
180
200
220
240
260
280
0 5 10 15 20 25
t_maxt_mint_p
Time = x[n]
Time [s]
Mea
sure
d va
lue
[mV]
Fig. 47 Setting the drift with control time window(labeling see Fig. 45, parameter “Exact”)
Titration guide
92 93

Fig. 48 Criteria for ending the titration
0
500
1000
1500
2000
2500
2
3
4
5
6
7
8
9
10
11
12
0 1 2 3 4 5 6 7 8 9
Titr
ation
dur
ation
[s]
pH
NaOH 0.1 mol/l ml]
Titration curve and derivation Lidocaine HCl
pH value Derivation
EQ end
Value derivation
Measured value
ml end
Titration guide
94 95
5.4 Definition of the titration endWith a manual titration, the titrator stops as soon as the "manual button" is released. What if the user cannot be present for the entire time? This is often the case during titration.
In order to terminate an auto- matic titration, several criteria exist:
Titration up to: a maximum volume of the titrant a certain endpoint (pH or mV,
also µA or µS are possible) a certain duration
(pH Stat, KF titration) one or several EQs a calculated result a manual interruption
The essential criteria for stopping a titration are listed in Fig. 48.

Titration guide
94 95
Titration interruption at maximum volumeThis criterion should always be there, as beakers are limited in their volume. Usually 20 to 50 ml are used as an additional criterion. For some titrations with very small changes in potential (e.g. TAN) it can also be the only criterion.
Titration interruption at a certain measured valueIf it is not known how many equivalence points can be calculated, this criterion will be used. E.g. a maximum pH value is defined at which the titration stops. Then it can be decided in the calculation whether one or more EQs should be calculated. For EP titrations to a defined endpoint, the interruption criterion is the desired endpoint. This endpoint must be exceeded for a defined time (endpoint delay) or by a certain value.
Titration interruption when recognizing an EQ For titrations in which a clearly recognizable EQ is calculated, this is also the most sensible end criterion. An EQ is calculated as the maximum of the first and the zero point of the second derivation. It is therefore asso-ciated with the value of the first derivation. The first derivation must reach a certain (adjustable) value in order for the EQ to be accepted as such.

Fig. 49 pH stat titration with stat phase of 180 s
0
1
2
3
4
5
6
7
8
0
1
2
3
4
5
6
7
8
9
10
0 50 100 150 200 250
pHml NaOH
Duration [s]
pH-Stat
Consumption [ml] pH value
Titration guide
96 97
For some applications, other criteria exist for terminating the titration. During the pH Stat titration (the pH value is kept constant for a while), the duration of the titration is used as a crite-rion (Fig. 49). The total volume should always be a criterion, as the titration cell can also over-flow.
With the Karl Fischer titration, one titrates to one endpoint. A voltage is applied to the indi-cator double platinum electrode. A current flows if a reversible redox couple is present in the solution (iodine and iodide). The titration is stopped if this reaches the set end value.

Titration guide
96 97
5.5 Evaluation of the titrationDuring the titration, endpoints (EP) or equivalence points (EQs) are evaluated.
In a titration to an endpoint (EP), the titration is typically interrupt-ed at the point that would cor-respond to the colour change of an indicator. EP titrations are thus conventional methods that are primarily intended to provide good comparability. EPs are thus also the last point of a titration or partial titration. Titrations with several partial titrations with up to three endpoints exist.
An equivalence point (EQ) is determined based on a turning point of the titration curve. The maximum of the first derivation and the zero point of the sec-ond derivation are calculated for this. Typically, the turning point corresponds to the equivalent conversion of the reagent with the sample. With several turning points, however, it may happen that the actual equivalence point has not yet been reached when the curve "bends" for another EQ. In some cases corrections to the EQ are advantageous. Their complex calculation shall not be discussed here.
In practice, the EQs are almost always used to calculate the result. In order to calculate an EQ, it is over-titrated by a few ti-tration points and interpolated from the titration points around the EQ. The result is the more accurate the smaller the titration steps. If measuring points are missing after the EQ, it may be possible that a calculation is not possible. It is therefore import-ant to ensure that there are still enough measuring points for a calculation after an EQ (see Fig. 50). The calculated pH or mV val-ue of the EQ is of minor impor-tance for very steep curves. The slope of the titration curves can be very high, so that the changes of the pH value in the volume often have practically no effect. The volume is however used for the evaluation and calculation of the result.

Fig. 50 Interpolation of an EQ
0
200
400
600
800
1000
1200
1400
6
6.5
7
7.5
8
8.5
9
9.5
10
9.5 9.6 9.7 9.8 9.9 10 10.1
pH
dpH/dml
0
200
400
600
800
1000
1200
1400
4
5
6
7
8
9
10
0 2 4 6 8 10 12
pH
dpH/dml
Titration guide
98 99
If the correct EP or EQ is deter-mined, the desired result can be calculated from this.
Basically, only 2 types of formulas are used hereby: on the one hand, the calculation of the titer or the concentration of the titrant, and on the other hand the calculation of the concentration of a sample.
Formula for the titer
W F2Titer
EQ C M F1∗
=∗ ∗ ∗
Titer: Dimensionless number, for example 1.0
W: Weighed sample standard / sample [g]
EQ: Consumption titrant [ml]C: specified concentration of the titrant [mol/l]M: molar mass of the standard
[g/mol]F1: 1F2: 1000 (conversion ml - l)

Titration guide
98 99
Sometimes a blank value has to be included in the calculation of the result. Some solvents have a (small) self-consumption of titrant. This self-consumption is deducted from the EQ or EP, so that only the consumption of the sample contributes to the result in the calculation. Another type of blank value can be found in the back titration: The blank value is the consumption of the used reagent without sample. Here the consumption of EP or EQ is deducted from the blank value.
Formula for the content in % with blank value in the solvent
(EQ B) T M F1Content [%]
W F2− ∗ ∗ ∗
=∗
EQ: Consumption titrant [ml]B: Blank value of the solvent [ml]T: Exact concentration of the
titrant [mol/l]M: molar mass of the substance to
be determined [g/mol]W: Weighed sample standard /
sample [g]F1: 100 conversion in %F2: 1000 (conversion ml - l)
Formula for the content in % as back titration
(B EQ) T M F1Content [%]
W F2− ∗ ∗ ∗
=∗
B: Consumption during titration of the added reagent without sample [ml]
EQ: Consumption titrant [ml]T: Exact concentration of the titrant
[mol/l]M: molar mass of the substance to
be determined [g/mol]W: Weighed sample standard/
sample [g]F1: 100 conversion in %F2: 1000 (conversion ml - l)
The titration often has an "accu-racy" of four significant digits in total (regardless of whether before or after the decimal separator). However, all the individual components in the formula must also be defined with this number of digits, starting with the weighed sample through the molar weights to the consumption. To achieve higher accuracy, all numbers in the formula must always be defined with a higher number of digits.

Titration guide
100 101
Examples: Titer of silver nitrate with NaCl
The titer of a 0.1 mol/l silver nitrate solution shall be deter-mined with NaCl:
the molar mass of NaCl is 58.44 g/mol, the weighed sample W was
0.584 g, the consumption EQ was at
10.05 ml, with F1 = 1 and
F2 = 1000 (conversion ml - l), the following results:
0.0584 1000Titer
mol g10.05 58.44 1
l mol
∗=
∗ ∗
0.9943=
or the exact concentration used for most calculations T:
mol molT Titer 0.1 = ∗
[ ]0.0584 1000
g10.05 ml 58.44
mol
∗=
∗
mol0.0994 = l
l l
The 0.1 mol/l AgNO3 solution thus has a concentration of 0.0994 mol/l.
NaCl content in %
The NaCl content of a sample shall be determined with the above-mentioned standard solution:
the exact concentration is 00994 mol/l the molar mass of NaCl is
58.44 g/mol the weighed sample W was
1.12 g the consumption EQ was at
10.05 ml, with F1 = 1 and
F2 = 1000 (conversion ml - l), the following results:
Content [%] =
mol g10.05[ml] 0.0994 58.44 100%
l mol1.12[g] 1000
∗ ∗ ∗ ∗
5.21%=
In the example, the sample would have a sodium chloride content of 5.21%.

Titration guide
100 101
Examples from the application databaseFor many applications, applica-tion documents can be down-loaded from our homepage. Some applications shall be listed here as examples.
SECTION 6
APPLICATIONS

HH
H
H
O
O
O OOO
O OH
H
H
H
O
O
O OOO
O O
Fig. 51 Structural formula citric acid
Titration guide
102 103
6.1 Acid-base titrationsTitration of citric acid in drinksAlmost all drinks contain acids that are usually already contained in the raw fruit materials. They improve the taste and the durability. Acids are still added to some soft drinks. Citric acid (Fig. 51) is a tribasic acid, whose pKs values are very close together and therefore difficult to titrate individually. As drinks often also contain other acids, an endpoint titration to a pH of 8.2 (in some cases also 8.1, 8.3 or 8.5) is carried out in practice (Fig. 52).This corresponds to the change of phenolphthalein.
The manual titration with colour indicator is often difficult to carry out in contrast to the potentiometric titration due to the inherent colour of the drinks. The calculation is also carried out for other acids with the molecular weight of citric acid (192.13 g/mol).
One usually titrates with a NaOH 0.1 mol/l.
The following must be observed:
A titer determination takes place with potassium hydro-gen phthalate.
The sodium hydroxide must be protected with a CO2 absorption means. Soda lime is recommended.
The electrode must be calibrat-ed. The buffers pH 4.01 and pH 6.87 are recommended.

Abb. 52 Titration curve orange juice
ml
pH
0 1.5 3.0 4.5 6.0 7.5 9.0 10.5 12.03.125
3.75
4.375
5.0
5.625
6.25
6.875
7.5
8.125
8.75
pH/ml
pH 8.20012.12 ml
Titration guide
102 103
The following titration parameters are recommended:
Endpoint titration to pH 8.2 Dosing speed 40 % Linear step: 0.04 ml normal
(average) titration speed Delta value for the linear
end part: 1.2 Endpoint delay 5 s No damping
Formula for the acid value in g/l:
EP T M F1acidity [g / l]
V F2∗ ∗ ∗
=∗
EP: Consumption titrant [ml] to pH 8.2
T: Excact concentration of the titrant M: Molar mass of citric acid 192.13 g/molV: Volume sample [ml]F1: 1 F2: 3 (stoichiometric factor,
3-basic acid)

HO
HO
O
Fig. 53 Structural formula salicylic acid with proton of the carboxyl group
Titration guide
104 105
Titration of a strong acidMany applications contain strong, completely dissociat-ed acids such as HCl, H2SO4 or HNO3. These behave the same for the acid-base titration. Sulfuric acid e.g. behaves in aqueous solutions as a dibasic strong acid and it is thus difficult to distinguish it from "two" monobasic strong acids. Different organic acids as e.g. salicylic acid (Fig. 53), whose pKs value is approximately in the area of the 1st protons of phosphoric acid, behave like a strong acid during titra-tion. The titration usually takes place in a dynamic manner up to an EQ. With an endpoint titration, the indicator would depend on the type of acid.
The calculation is different, depending on the type of application (Fig. 54) and the sample weight (volume vs. mass). The result can be cal- culated as acid concentration mol/l, acid content g/kg, mg/g or g/l or mg/ml. For some applications it is sensible to indicate the acid content as base consumption/g sample, thus mg (NaOH)/g or mg (KOH)/g. One usually titrates with a NaOH 0.1 mol/l.
The following must be observed:
A titer determination takes place with potassium hydro-gen phthalate.
The sodium hydroxide must be protected with a CO2 absorption means. Soda lime is recommended.
The electrode can be calibrat-ed. Buffers pH 4.01 and pH 6.87 are recommended.
The calibration parameters serve as proof of the state of the pH electrode. The slope should be > 95 %.

Fig. 54 Titration curve salicylic acid
ml
pH
0 1.25 2.5 3.75 5.0 6.25 7.5 8.75 10.0 11.251.75
2.625
3.5
4.375
5.25
6.125
7.0
7.875
8.75
9.625
10.5
pH/ml dpH/dml
7.464 pH11.20 ml
Titration guide
104 105
The following titration parameters are recommended:
Dynamic titration Normal (average) titration
speed Dynamics: steep No damping End criterion 1 EQ with slope
value 700 mV/ml and pH 12 Dosing speed 100 %
Formula for the acid value in g/l:
(EQ B) T M F1Content [%]
W F2− ∗ ∗ ∗
=∗
EQ: Consumption titrant at the equivalence pointB: Blank value of the solventT: Exact concentration of the titrantM: Molar mass of salicylic acid
138.12 g/molW: Weighed sample [g]F1: 100 (conversion %)F2: 1000 conversion ml - l)

Titration guide
106 107
Titration of phosphoric acidThe phosphoric acid is a tribasic acid, of which only the first two protons can be titrated in aque-ous solutions. The third proton has such a high pKS value that the aqueous sodium hydroxide solution is not basic enough. Some methods are based on the fact that phosphates form compounds with heavy metal ions, in which the protons are then released in an equivalent amount. The direct titration with sodium hydroxide and the calculation of the content is described here as difference of the two EQs (Fig. 55). Strong acids do not interfere, but weak or multibasic ones such as e.g. citric acid.
One usually titrates with a NaOH 0.1 mol/l.
The following must be observed:
A titer determination takes place with potassium hydro-gen phthalate.
The sodium hydroxide must be protected with a CO2 absorption means. Soda lime is recommended.
The electrode can be calibrat-ed. Buffers pH 4.01 and pH 6.87 are recommended.
The calibration parameters serve as proof of the state of the pH electrode. The slope should be > 95 %.
The following titration parameters are recommended:
Dynamic titration Normal (average) titration
speed Dynamics: steep or average No damping End criterion 2 EQ with
slope value > 200 mV/ml Dosing speed 65 %

Fig. 55 Titration curve phosphorous acid with two EQs
0
100
200
300
400
500
600
2
3
4
5
6
7
8
9
10
0 2 4 6 8 10
dpH/dmlpH
NaOH [ml]mV dmV/dml
H3Po4 with NaOH 0.1 mol/l
Titration guide
106 107
Formula for the phosphoric acid in %:
(EQ2 EQ1) T M F1Content [%]
W F2− ∗ ∗ ∗
=∗
EQ1, EQ2: Consumption of titrant at the
respective equivalence pointT: Exact concentration of the titrantM: Molar mass of phosphoric acid 98.00
g/molF1: 100 (conversion %)W: Weighed sample [g]F2: 1000 (conversion ml - l)

Titration guide
108 109
Titration of Alk. 8.2 and Alk.S 4.3
The titration of the alkalinity (Alk.) is carried out with HCl and determines which pro-portions of carbonate and bicarbonate are contained in the water (Fig. 56). The alkalinity values are a measure of the temporary hardness of the water, which can be removed by boiling. Scale = lime precip-itates during boiling, the CO2 is boiled away. So that the results of manual titration can be compared with an indicator (phenolphthalein and methyl orange, often referred to as the p and m value), one titrates to endpoints (pH 8.2 and pH 4.3)[6]. The electrode must thus be calibrated.
The basis is the carbonate/hydro-gen carbonate system in water:
H2CO3 + H2O ↔ H3O+ + HCO3
-
HCO3- + H2O ↔ H3O
+ + CO32-
CO2 + H2O ↔ H2CO3
The endpoint at pH 8.2 corre-sponds approximately to the car-bonate content, the consump-tion between pH 8.2 and pH 4.3 to the hydrogen carbonate con-tent. One usually titrates with a HCl 0.1 mol/l.
The following must be observed:
A titer determination takes place with TRIS The electrode must be cali-
brated. Buffers pH 4.01 and 6.87 are recommended
The following titration parameters are recommended:
Titration to two endpoints pH
8.2 and pH 4.3 Normal (average) titration
Speed No damping Dosing speed 15 % Delta value for the linear end
part: 1.0 Endpoint delay 10 s Linear steps 0.02 ml

Fig. 56 Titration curve carbonate system with HCl on 2 EPs
ml
pH
0 0.75 1.5 2.25 3.0 3.75 4.5 5.25 6.03.5
4.375
5.25
6.125
7.0
7.875
8.75
9.625
10.5
11.375
pH/ml
1.92 mlpH 8.200
6.05 mlpH 4.300
Titration guide
108 109
Formula for the Alk.8.2:
8.21 1
[ / l]2
EP T M FAlk. mmol
V F∗ ∗ ∗
=∗
EP1: Consumption titrant [ml] to pH 8.2
T: Exact concentration of the titrantM: 1V: Volume sample [ml]F1: 1000 (conversion mol - mmol)F2: 1
Formula for the Alk.4.3:
4.31 1
[ / l]2
EP T M FAlk. mmol
V F∗ ∗ ∗
=∗
EP2: Consumption titrant [ml] to pH 4.3
T: Exact concentration of the titrantM: 1F1: 1000 (conversion mol - mmol)V: Volume sample [ml]F2: 1

Titration guide
110 111
Titration of sodium carbonateSodium carbonate is the sodium salt of carbon acid. It is titrated with hydrochloric acid. Sodium bicarbonate is formed in the first step, which is converted to carbonic acid in the second step (Fig. 57).
Na2CO3 + H3O+ ↔
H2O + Na++NaHCO3
NaHCO3 + H3O+ ↔
H2O + Na++H2CO3
One usually titrates with a HCl 0.1 mol/l.
The following must be observed:
A titer determination takes place with potassium hydro-gen phthalate.
The electrode can be calibrat-ed. Buffers pH 4.01 and pH 6.87 are recommended. The calibration parameters serve as proof of the state of the pH electrode. The slope should be > 95%.
The following titration parameters are recommended: Dynamic titration to two EQs Dynamics: flat Dosing speed 100% Normal (average)
titration speed No damping
With pure sodium carbonate it would be sufficient to calculate only one EQ. However, if free alkali is still present or more hydrogen carbonate through CO2 intake, the difference of the two EQs is often evaluated.

Fig. 57 Titration curve sodium carbonate with two EQs
ml
pH
0 0.875 1.75 2.625 3.5 4.375 5.25 6.125 7.0 7.8752.0
3.0
4.0
5.0
6.0
7.0
8.0
9.0
10.0
11.0
12.0
pH/ml dpH/dml
7.46 ml4.481 pH
8.346 pH3.75 ml
Titration guide
110 111
Formula for the carbonate in g/l
23
1 1[ / l]
2EQ T M F
CO gV F
− ∗ ∗ ∗=
∗
EQ1: Consumption titrant [ml] until the first equivalence point
T: Exact concentration of the titrantM: Molar weight of CO3
2- (60.01 g/mol)
V: Volume sample [ml]F1: 1F2: 1
Formula for the hydrogen carbonate in g/l
3( 2 1) 1
[ / l]2
EQ EQ T M FHCO g
V F− − ∗ ∗ ∗
=∗
EQ1: Consumption titrant [ml] until the first equivalence point
EQ2: Consumption titrant [ml] until the second equivalence point
T: Exact concentration of the titrantM: Molar weight of HCO3
-
(61.017 g/mol)V: Volume sample [ml]F1: 1F2: 1

Titration guide
112 113
Determination of pharmaceu-tical bases as hydrochlorides with NaOHPharmaceutical bases are usually titrated in acetic acid with per-chloric acid.
Another method is the determi-nation of the hydrochloride of the base. For this, the sample is mixed with an excess of HCl and titrated with NaOH. As the pKa values of free HCl and the hydrochloride differ significantly, one obtains two EQs whose difference corresponds to the hydrochloride of the base.
One example is the determina-tion of lidocaine as hydrochlo-ride. The titration is carried out in ethanol with aqueous NaOH (Fig. 58). The first jump corre-sponds to the excess amount of HCl (2 ml 0.1 mol/l). The difference between the two EQs corresponds to the hydro-chloride of the nitrogen base. PharmEur describes the method with the addition of 5 ml of 0.01 molar HCl (or in an even lower concentration).
The following titration parameters are recommended:
Dynamic titration to two equivalence points Normal (average)
titration speed weak damping Dynamics: steep Titration end: 2 EQs,
slope value flat
Formula for Lidocaine in %
(EQ2 EQ1) T M F1Lidocaine [%]
W F2− ∗ ∗ ∗
=∗
EQ1: Consumption titrant [ml] until the first equivalence point
EQ2: Consumption titrant [ml] until the second equivalence point
T: Exact concentration of the titrantM: Molar weight of lidocaine (234.34
g/mol)W: Weighed sample [g]F1: 0.1 (conversion l – ml and %)F2: 1

Fig. 58 Titration curve lidocaine hydrochloride
ml
mV
0 0.875 1.75 2.625 3.5 4.375 5.25 6.125 7.0 7.875
0.0
75.0
150.0
225.0
300.0
-75.0
-150.0
-225.0
mV/ml dmV/dml
8.16 ml-151.5 mV
244.2 mV0.44 ml
Titration guide
112 113

-
+
Cl
Na N
OCCl
O
H
Fig. 59 Diclofenac sodium
Titration guide
114 115
Determination of pharma-ceutical bases with perchloric acid in glacial acetic acidThe most common method for the determination of pharma- ceutical bases is the direct titration with perchloric acid in glacial acetic acid.
A titer determination of per-chloric acid is carried out with potassium hydrogen phthalate. A blank value of the glacial acetic acid should be deter-mined, even if the PharmEur does not require this. A pH electrode with a ground-joint diaphragm and a filling of LiCl in glacial acetic acid or ethanol is used as electrode. In our example, the titration of diclofenac sodium is shown. Approx. 0.250 g dichlophenac sodium are dissolved in approx. 30 ml glacial acetic acid (Fig. 59 and Fig. 60).
The following must be observed:
Determination of a blank value of the glacial acetic acid
Consideration of the humidity of the molecule
Humidity in glacial acetic acid or at the sample flattens the curve
As the jump is very clear, a dy-namic titration can be performed up to an equivalence point. A ml end criterion ensures that an overflow of the titration vessel is impossible.
The following titration parameters are recommended:
Dynamic titration, mV Dynamics: average Normal measurement speed average damping Titration end:1 EQ, slope
value 300 mV/ml

Fig. 60 Titration curve dichlorfenac sodium
ml
mV
0 0.875 1.75 2.625 3.5 4.375 5.25 6.125 7.0 7.875375.0
450.0
525.0
600.0
675.0
mV/ml dmV/dml
641.6 mV7.59 ml
Titration guide
114 115
Formula for diclofenac sodium in %
(EQ1 B) T M F1Lidocaine [%]
W F2− ∗ ∗ ∗
=∗
EQ1: Consumption titrant [ml] until the equivalence point
B: Blank value of the solventT: Exact concentration of the titrantM: Molar weight of dichlorfenac
sodium (318.1 g/mol)W: Weighed sample [g]F1: 0.1 (conversion l – ml and %) F2: 1

Fig. 61 Blank value solvent mixtures FFA
ml
mV
0 0.05 0.1 0.15 0.2 0.25 0.3
0.0
-22.5
-45.0
-67.5
-90.0
-112.5
-135.0
-157.5
-180.0
-202.5
mV/ml dmV/dml
0.05 ml-61.7 mV
Titration guide
116 117
Determination of the free fatty acids in vegetable oils (FFA)The determination of free fatty acids in unsaturated oils and fats is a measure of their freshness. The lower the content, the fresher the oils.
The titration is carried out with KOH in isopropanol or ethanol. Ethanol/diethyl ether 1:1 is used as the solvent. The blank value of the solvent mixture must be determined (Fig. 61). Both the titration of the blank value and of the sample are carried out in a linear manner. The titration of the blank value takes place with an end consumption of 0.3 ml and an step size of 0.01 ml or 0.02 ml.
A fixed waiting period of 15 s is suitable for the blank value. A pH electrode with a ground-joint diaphragm and a filling of LiCl in ethanol is used as electrode.
The following titration parameters are recommended:
Linear titration, mV Step size 0.05 ml Measuring speed: Measurement time 4 s Drift 10 mV/min Min time 7 s Max time 20 s strong damping Titration end: 1 EQ, slope
value flat

Fig. 62 Titration curves FFA in rapeseed oil
mV
0 0.375 0.75 1.125 1.5 1.875 2.25
0.0
50.0
-50.0
-100.0
-150.0
-200.0
mV/ml dmV/dml
1.81 ml-92.9 mV
Titration guide
116 117
Formula for FFA in mg KOH / g
(EQ1 B) T M F1FFA [mg KOH/g]
W F2− ∗ ∗ ∗
=∗
EQ1: Consumption titrant [ml] until the equivalence point
B: Blank value of the solventT: Exact concentration of the titrantM: Molar weight KOH (56.1 g/mol)W: Weighed sample [g]F1: 1F2: 1
The sample for FFA should be in the range of 0.2 - 1 mg KOH/g at 10 - 20 g and in the range of 1 - 10 mg KOH/g at 1 - 3 g.
In the example, the FFA is given as mg KOH/g. In other cases, however, the reference magni-tude is not the amount of KOH, but the molecular weight of the titrated oil, usually the oleic acid (molar weight 282 g/mol) is assumed:
Formula for FFA in % acid(EQ1 B) T M F1
FFA [%]W F2
− ∗ ∗ ∗=
∗
EQ1: Consumption titrant [ml] until the equivalence point
B: Blank value of the solventT: Exact concentration of the titrantM: Molar weight oleic acid
(282.46 g/mol)W: Weighed sample [g]F1: 0.1 (conversion l – ml and %)F2: 1
The adaptation of the amplifier to the titration in organic media is important. The adaptation of the damping has been proven to be efficient, which can be adjusted in the method parameters. The strongest damping is adjusted here (Fig. 62).

Titration guide
118 119
Determination of acids in oil (TAN, ASTM 664)The titration of acids in oils is one of the most difficult applications. A mixture of toluene (50%), isopropanol (49.5%) and water (0.5%) is often used as solvent. Titrant is KOH in isopropanol. The challenge for the pH elec-trode is the titration in a medium that contains hardly any protons or ions at all. In addition, the glass membrane is occupied by the oil, which additionally complicates an exchange [5].
A pH electrode with ground-joint diaphragm is used, with LiCl in ethanol as electrolyte. The electrode must be cleaned, conditioned and be re-adapted to the solvent after each titration. For this, the electrode is rinsed successively in different solvents:
1 minute in toluene or toluene/isopropanol 1 minute in water 1 minute in clean toluene/
isopropanol / water.
A titer determination is carried out with potassium hydrogen phthalate and the blank value of the solvent is determined. The blank value is performed as an EQ titration.
The titration of the blank value is carried out as a linear titration with steps size of 0.01 ml up to an EQ or a consumption of about 0.3 ml. One preferably titrates with a fixed waiting time of 10 to 20 s. At a higher consumption, the solvent mixture should be exchanged.
In some cases it is so small that no EQ can be detected. Then, one titrates with very small steps, e.g. 0.004 ml to the potential at which the EQ of the sample is found.

Fig. 63 Blank value titration TAN
ml
mV
0 0.0125 0.025 0.0375 0.05 0.0625 0.075 0.0875 0.1 0.1125
0.0
20.0
40.0
60.0
80.0
-20.0
mV/ml dmV/dml
0.07 ml13.0 mV
Titration guide
118 119
Fig. 63 shows a typical titration curve for the blank value of the solvent mixture. Here the BW is high enough to detect an EQ.
The TAN titration is carried out in a linear manner. The titration end is set to 4 to 6 ml or until an EQ is detected. The drift is often parameterized with a fixed waiting time of 15 s. This waiting time is adapted to the sample until a titration curve results, which enables a clear evaluation of the EQ.
Fig. 64 shows the titration curve of a used transformer oil. The EQ can be evaluated very well here. For different oils, the titration curve may be too shallow or too restless to detect an EQ. In this case, one has to titrate to an end potential. The potential which adjusts at the electrode in an aqueous buffer of pH 11 is used as the end potential.

Fig. 64 Titration curve TAN of an oil sample
ml
mV
0 0.375 0.75 1.125 1.5 1.875 2.25 2.625 3.0
0.0
50.0
100.0
150.0
-50.0
mV/ml dmV/dml
2.94 ml-34.2 mV
Titration guide
120 121
Formula for TAN in mg KOH / g
(EQ1 B) T M F1TAN [mg KOH/ g]
W F2− ∗ ∗ ∗
=∗
EQ1: Consumption titrant [ml] until the equivalence point
B: Blank value of the solventT: Exact concentration of the titrantM: Molar weight KOH (56.1 g/mol)W: Weighed sample [g]F1: 1F2: 1
The following titration parameters are recommended:
Linear titration, mV Step size 0.05 ml Measuring speed:
fixed waiting time 15 s or measurement time 4 s Drift 10 mVmin Min time 7 s Max time 20 s strong damping Titration end:
1 EQ, slope value flat

Titration guide
120 121
Determination of bases in oil (TBN, ISO 3771)The base number in oils, like TAN, is a sum parameter and is determined according to ASTM 2896 / ISO 3771.
A pH electrode with a ground-joint diaphragm and LiCl in glacial acetic acid is used as the electrolyte. If the base number of the sample is not too low, it is also possible to work with LiCl/ethanol. Many electrode adhesives are not resistant to acetic acid. The electrolyte LiCl in glacial acetic acid should therefore only be filled into electrodes that are intended for this purpose.
The solvent for the titration is acetic acid/chlorobenzene, the titrant is perchloric acid in gla-cial acetic acid. Potassium hy-drogen phthalate is used for the titer determination. The blank value of the solvent must be determined. The result is calculated as mg KOH needed to neutralize 1 g of sample. The consumption should not exceed 4-6 ml, the sample amount must be adjusted accordingly.
A rule of thumb for the sample amount is: g sample = 28 / ex-pected TBN. The TBN titration is carried out as a linear titration. The titration end is set to 4 to 6 ml or until an EQ is detected (Fig. 65). The step size should not be too small, e.g. 0.1 ml.
The titration is carried out as a mV titration either drift-controlled or with a fixed waiting time of 15 - 20 s.

Fig. 65 Titration curve TBN
ml
mV
0 0.5 1.0 1.5 2.0 2.5 3.0 3.5450.0
500.0
550.0
600.0
650.0
700.0
750.0
mV/ml dmV/dml
668.2 mV3.25 ml
Titration guide
122 123
The following titration parameters are recommended:
Linear titration, mV Step size 0.1 ml Measuring speed: Measurement time 4s Drift 10mV/min Min time 7s Max time 20s or fixed waiting time 15-20 s strong damping Titration end: 1 EQ, Slope value flat
Formula for TBN in mg KOH / g
(EQ1 B) T M F1TBN [mg KOH/ g]
W F2− ∗ ∗ ∗
=∗
EQ1: Consumption titrant [ml] until the equivalence point
B: Blank value of the solventT: Exact concentration of the titrantM: Molar weight KOH (56.1 g/mol)W: Weighed sample [g]F1: 1F2: 1

Titration guide
122 123
6.2 Argentometric titrationsArgentometric titrations are carried out with silver nitrate as titrant and silver electrodes. A combination electrode with silver indicator electrode and Ag/AgCl reference electrode is usually used. The reference electrolyte should contain as few chloride ions as possible: KNO3 2 mol/l with little KCl (0.001 mol/l) is recommended.
The reaction equation is as fol-lows:
AgNO3+NaCl → Na++ NO3
- +AgCl↓
For samples in which the pH is constant or also in organic solvents, a silver electrode can be used which has a glass elec-trode as the reference electrode. Due to its resistance, the glass electrode is connected to the indicator measuring input and the silver indicator electrode to the reference measuring input.
AgNO3 is used as titration solu-trion. The concentration can be 0.001 to 0.1 mol/l. The potential jump is more pronounced, the higher the concentration (Nernst law). As it is a precipitation titration, the formed precipitate can contaminate the electrode and disrupt the titration. This can be prevented by the addition of polyvinyl alcohol (1 ml of a 0.5% PVA solution). Such an addition is not necessary with very low contents. The titration must take place in an acid environment so that no silver hydroxide is formed. Diluted HNO3 is suitable for acidification.
The titration can be carried out with samples with chloride contents of a few ppm - 100%. Depending on the chloride content, the amount of sample should be adjusted:
Chloride content [%] weighed sample [g]
< 0.1 > 10 0.1 – 1 1 – 10 1 – 10 0.1 – 2 10 - 50 0.05 - 0.1 50 – 100 0.05

Titration guide
124 125
Titration of salt in butterFor food, sample preparation is important to capture all the chloride. Often the sample is crushed (also automatically with a homogenizer) or stirred in hot water.
Approximately 2-3 g of butter are weighed in, 100 ml of boil-ing water is added, 1 ml of HNO3 1 mol/l is added, the electrode and the titration tip are dipped into the solution and the titration is started. The titration is carried out up to an EQ (Fig. 66). It can be seen from the increasing titration curve that an Ag indicator electrode and an Ag/AgCl refer-ence electrode were used here. The result is calculated as % NaCl.
The following titration parameters are recommended:
Dynamic titration to an equivalence point Dynamics: steep Measuring speed: Measurement time 3 s Drift 10 mV/min Min time 3 s Max time 15 s no damping Titration end:
1 EQ, Slope value 400
Formula for sodium chloride in %
(EQ1 B) T M F1NaCl [%]
W F2− ∗ ∗ ∗
=∗
EQ1: Consumption titrant [ml] until the equivalence point
B: Blank value of the solventT: Exact concentration of the titrantM: Molar weight NaCl
(58.443 g/mol)W: Weighed sample [g]F1: 0.1 (conversion l – ml and %)F2: 1

Fig. 66 Titration curve chloride in butter
ml
mV
0 0.875 1.75 2.625 3.5 4.375 5.25 6.125 7.0
0.0
25.0
50.0
75.0
100.0
125.0
150.0
175.0
200.0
-25.0
mV/ml dmV/dml
141.8 mV7.25 ml
Titration guide
124 125
Titration of chloride in drinking waterUp to 250 mg/l of chloride may be contained in drinking water, thus significantly less than e.g. in butter. The titration is analogous to the titration of salt in butter, only the slope of the EQ has to be adjusted due to the flatter jump.
100 ml water is mixed with 1 ml HNO3 1 mol/l and the titration is started. The curve in Fig. 67 shows a falling titration, typical for a silver electrode with a glass reference electrode. The calcu-lation takes place as mg Cl/l.
The following titration parameters are recommended:
Dynamic titration to an equivalence point Dynamics: steep Measuring speed: Measurement time 3 s Drift 10 mV/min Min time 3 s Max time 15 s no damping Titration end: 1 EQ, gradient
value 150 mV/ml

Fig. 67 Titration curve chloride in drinking water
ml
mV
0 0.1 0.2 0.3 0.4 0.5 0.6 0.7 0.8
0.0
20.0
40.0
60.0
80.0
100.0
120.0
-20.0
-40.0
mV/ml dmV/dml
0.71 ml13.6 mV
Titration guide
126 127
Formula for chloride in mg/l
[ ](EQ1 B) T M F1
Cl mg / lV F2
−=
∗∗ ∗ ∗−
EQ1: Consumption titrant [ml] until the equivalence point
B: Blank value of the solventT: Exact concentration of the titrantM: Molar weight Cl- (35,45 g/mol)V: Volume sample [ml]F1: 1000 (conversion g – mg)F2: 1

Titration guide
126 127
6.3 Potentiometric redox titrationsIn redox titrations, oxidizable or reducible samples are titrated with oxidizing or reducing agents.
Titrations with oxidizing agents generally show increasing titra-tion curves falling with reducing agents. A titer determination of the titrant is recommended. The detection is performed with a combined platinum indicator electrode with an Ag/AgCl refer-ence electrode.
The titrations can be carried out as direct titration or as back titration.
In the back titration, e.g. an excess of oxidant is added and the reagent which is not convert-ed is back titrated with a reduc-ing agent. Even if back titration shows the errors of back and forth titration, benefits such as faster response and better detec-tion are clearly in the foreground.
Iodine number for character-izing fats and oilsIn the determination of the iodine number of an oil or fat, the oxidizable components and double bonds are determined. The more double bonds an oil contains, the higher the iodine number. The iodine number is defined as the amount of iodine that can be added to 100 grams of fat or oil.
One form of the determination takes place according to DIN 53241-1:1995-05 with Wijs reagent (organic solvent, acetic acid, iodine, iodine trichloride). In an upstream reaction, the iodine trichloride and iodine react to iodine monochloride. The reaction mixture must be anhydrous, otherwise the formed iodine monochloride will decompose to HCl, I2 and HI.
ICl3+ I2 → 3ICl
However, iodine monochloride in pure form is also available, so that one can also use a solution of iodine monochloride in glacial acetic acid (16.2 g / l).

Fig. 68 Titration curve blank value iodine number
ml
mV
0 5.0 10.0 15.0 20.0 25.0 30.0 35.0 40.0 45.0150.0
200.0
250.0
300.0
350.0
mV/ml dmV/dml
45.89 ml250.2 mV
Titration guide
128 129
The iodine monochloride reacts in an electrophilic addition to the double bond of the oil:
R1CH = CH - R2 + ICl → R1CHI - CHCl - R2
The excess iodine monochloride is converted with KI to I2:
ICl + Kl → I2 + KCl
The resulting I2 is then titrated with sodium thiosulphate in a 1:1 reaction:
I2 + 2 NA2S2O3 → 2 NaI + Na2S4O6
The iodine monochloride is dissolved in glacial acetic acid (16.2 g/l), the KI solution is aqueous (25 g/250 ml), magne-sium acetate (45 g/l glacial acetic acid) is used as catalyst.
The sample is weighed into a 200 ml Erlenmeyer flask, 20 ml of glacial acetic acid, 25 ml of iodine monochloride solution and 20 ml of magnesium acetate solution are added. The flask is closed, shaken, allowed to stand in the dark for 5 minutes and ti-trated after addition of 15 ml of KI solution and 50 ml of distilled water (Fig. 68).
A blank value titration is carried out under the same conditions. As it is a back titration, the consumption of the sample is subtracted from the blank value (Fig. 69).

Fig. 69 Titration curve iodine number of olive oil
ml
mV
0 5.0 10.0 15.0 20.0 25.0150.0
200.0
250.0
300.0
350.0
mV/ml dmV/dml
28.79 ml247.6 mV
Titration guide
128 129
The following titration para- meters are recommended for the titration and blank value determination:
Dynamic titration to an equivalence point Dynamics: average Measuring speed: Measurement time 3 s Drift 10 mV/min Min time 3 s Max time 15 s no damping Titration end:
1 EQ, slope value 350
Formula for iodine number in g(iodine/100g(sample)
(B EQ1) T M F1IZ
W F2− ∗ ∗ ∗
=∗
B: Consumption without sampleEQ1: Consumption titrant [ml] until the
equivalence pointT: Exact concentration of the titrantM: Molar weight I (126.9 g/mol)W: Weighed sample [g]F1: 0.1 (conversion l – ml and
reference to 100 g)F2: 1

+ 2H+ + 2e-
Cl
Cl
H
N
O O
H
H
H O
ClN
ClO
Fig. 70 Redox reaction DCPIP
Titration guide
130 131
Determination of the vitamin C content with DCPIPVitamin C is added to many drinks as an antioxidant and also specified with its content. Lots of natural vitamin C contain citrus fruits and their juices.
The titration of ascorbic acid = vitamin C is possible as a redox titration with DCPIP (di-chloro-phenol-indo-phenol) (Fig. 70). The ascorbic acid reduces the disodium DCPIP (Tillmann's reagent), a 1:1 reaction. As the redox potential drops during the titration and then increas-es again, a large step is initially dosed before the titration is continued in a linear manner. The blue DCPIP is decolourized during the titration.
As the DCPIP is not very stable, the titer is determined with freshly dissolved ascorbic acid in a first titration. Fig. 71 and 72 show the titration curve with calculations for the titer determi-nation and sample titration.
For the preparation of the DCPIP solution, 163.1 mg of DCPIP is added to 250 ml water and stirred at 50° C for 20 minutes. The solu-tion is then filtered, transferred to a 500 ml volumetric flask, 50 mg KHCO3 (for stabilization) added and filled up to 500 ml. For the titer determination, freshly pre-pared ascorbic acid solution is used: 50 mg of ascorbic acid is dissolved in water in a 100 ml volumetric flask, 10-20 ml of oxalic acid solution (100 g/l) is added and filled up to 100 ml.

Fig. 71 Titer determination of DCPIP with ascorbic acid
ml
mV
0 0.375 0.75 1.125 1.5 1.875 2.25 2.625 3.0260.0
280.0
300.0
320.0
mV/ml dmV/dml
294.7mV2.97ml
Titration guide
130 131
For the titer determination, 10 ml of oxalic acid solution (100 g/l), 15 ml of distilled water and 1 ml of sodium acetate solution (100 g/l) are placed in a beaker, 1 ml of the ascorbic acid solution is added and is titrated with the DCPIP solution.
The following titration parameters are recommended:
Linear titration to an equivalence point Step size: 0.05 ml Measuring speed: Measurement time 2 s Drift 40 mV/min Min time 5 s Max time 10 s Pre-titration 1.2 ml,
10s waiting time no damping Titration end: 1 EQ, slope
value 80

Fig. 72 Titration ascorbic acid in a drink
ml
mV
0 0.375 0.75 1.125 1.5 1.875 2.25 2.625 3.0250.0
260.0
270.0
280.0
290.0
300.0
310.0
mV/ml dmV/dml
292.3mV2.78ml
Titration guide
132 133
For the titration of a juice sample, 0.5 - 5 g of sample are mixed with 40 ml of oxalic acid solution (100 g/l) and 1 ml of sodium acetate solution (100 g/l). 40 ml water is added after 5 minutes and titrated with DCPIP (Fig. 72).
The following titration parameters are recommended:
Linear titration to an equivalence point Step size: 0.05 ml Measuring speed:
fixed waiting time 7 s no damping Titration end:
1 EQ, slope value 80
Formula for ascorbic acid mg/100g
(EQ1 B) T M F1Ascorbic acid [mg/100g]
W F2− ∗ ∗ ∗
=∗
EQ1: Consumption titrant [ml] until the equivalence point
B: Blank value of the solventT: Exact concentration of the titrantM: Molar mass of ascorbic acid
(176.12 g/mol)W: Weighed sample standard/sam-
pleF1: 100 (conversion l – ml, g - mg,
reference to 100 g)F2: 1

Fig. 73 Reversible redox reaction of iodine
+ -
2 I- I2
Indication
Titration guide
132 133
6.4 Dead Stop TitrationsThe Dead Stop titration can be used when reversible redox pairs occur. An important example is the titration with iodine. The detection with a double platinum electrode proceeds much faster than the potentiometric detection with a platinum redox electrode. At the endpoint of the titration, both iodine and iodide ions are present in the solution. Two anions of iodide migrate to the anode and release two electrons there. At the cathode, the iodine absorbs two electrons and reacts to form two iodide ions. With an applied (low) voltage (approx. 100 mV) a current flows, which is detect-ed (Fig. 73).

Titration guide
134 135
The following titration parameters are recommended:
Dead Stop Titration linear step: 0.02 ml Pre-titration: 0.1 ml Dosing speed: 20 % Titration direction:
increasing Measuring speed:
fixed waiting time 1 s Polarization voltage 100 mV Delta endpoint: 2.0 µA Titration end: 2.5 µA Endpoint delay: 5 s
Formula for ascorbic acid mg/l
( 1 ) 12
EP B T M FV F
− ∗ ∗ ∗∗
Ascorbic acid [mg/l] =
EP1: Consumption titrant [ml] until the endpoint
B: Blank value of the solventT: Exact concentration of the titrantM: Molar weight ascorbic acid
(176.12 g/mol)V: Volume sample [ml]F1: 1000 (conversion g – mg)F2: 1
Direct iodometric determina-tion of vitamin CThe iodometric titration of ascor-bic acid is usually performed as a Dead Stop titration. It is the usual titration for many drinks. As sulfite ions can also be present in drinks, they must be converted with glyoxal.
50 ml of sample and 2 ml of glyoxal solution (40% in water, adjusted to pH 7 with NaOH) are placed into a beaker. After 5 minutes, 5 ml of 25% sulfuric acid are added and titrated with 0.01 mol/l iodine solution. The content is calculated as acorbic acid mg / l.
In our example (Fig. 74), the ascorbic acid content of a fruit juice was determined. The iodo-metric determination offers - de-spite the lower selectivity - some advantages over the titration with DCPIP:
Iodine solutions are significant-ly more titer-stable than DCPIP solutions, additionally iodine standard solutions are available in various concentrations.

Fig. 74 Titration curve ascorbic acid with iodine
ml
µA
0 0.1 0.2 0.3 0.4 0.5 0.6 0.7 0.8 0.9
0.0
0.5
1.0
1.5
2.0
2.5
3.0
3.5
-0.5
µA/ml
0.909 ml3.0 µA
Titration guide
134 135
Determination of the SO2 content in wine Wine is protected from oxidation by adding SO2. Free and bound SO2 are therefore differentiated.
The free SO2 is determined by adding 3 ml sulfuric acid 10%, 30 mg Na2EDTA and 10 ml KI solution (5%) to the 50 ml sample in a beaker and titrating immediately with iodine. The total SO2 is determined by adding 8 ml 4 mol/l NaOH to a 50 ml sample and waiting 5 minutes. Then 10 ml of 10% sulfuric acid are added and titrat-ed immediately with iodine.
The titre of the iodine solution can be determined with thio-sulphate solution (Fig. 75). If additionally ascorbic acid is present in the sample, the sum of all reductones is titrated in this application. The ascorbic acid can be determined after the addition as described in the section "Direct iodometric deter-mination of vitamin C" according to the reaction of SO2 with glyoxal.

Fig. 75 Titration curve SO2 in wine
ml
µA
0 0.2 0.4 0.6 0.8 1.0 1.2 1.4 1.60.0
0.375
0.75
1.125
1.5
1.875
2.25
2.625
3.0
µA/ml
1.581 ml2.0 µA
Titration guide
136 137
The following titration parameters are recommended:
Linear step: 0.02 ml Pre-titration: none Dosing speed: 20 % Titration direction:
increasing Measuring speed:
fixed waiting time 1s Polarization voltage 100 mV Delta endpoint: 1.0 µA Titration end: 2.0 µA Endpoint delay: 5 s
Formula for SO2 in mg/l
2( 1 ) 1
SO [mg/ l]2
EQ B T M FV F
− ∗ ∗ ∗=
∗EP1: Consumption titrant [ml] until the
endpointB: Blank value of the solventT: Exact concentration of the titrantM: Molar weight SO2 (64.06 g/mol)V: Volume sample [ml]F1: 1000 (conversion g – mg)F2: 1

Titration guide
136 137
6.5 Complexometric titrationComplexometry enables the determination of numerous metal ions. Chelate complexes have higher stability than com-plexes with several smaller ligands for two reasons:
One molecule instead of several small ligands reacts with a central atom
(entropy effect) If a bond is free, the metal
central atom still remains bonded
Na2EDTA, di-sodium-ethylene- diamine-tetra acetic acid is often used. The stability of the com-plexes there depends on the pH. The higher the pH value, the more stable the complex. In acidic solution, the less dissociated acid provides less complexation possibilities. The pH dependence of the complex stability can be exploited during the titration. Stable complexes can still be titrated in acid, while less stable complexes require a high pH value.
At high pH values, the hydroxide formation is a competitive reaction. Work is often done in ammoniacal solutions.
The detection of the titration is carried out with ion-sensitive indicator electrodes (ISE) and a (usually separate) Ag/AgCl refer-ence electrode, preferably with a platinum diaphragm.

Titration guide
138 139
Calcium and magnesium in drinking waterIn drinking water, calcium and magnesium form the permanent hardness of the water as cations. The determination of water hard-ness is an important parameter of water chemistry. Calcium and magnesium can be determined next to each other with Na2EDTA and a calcium-sensitive electrode.
Two potential jumps occur during titration (Fig. 76). Their form can be influenced by the pH value and the addition of auxiliary complexing agents. At a very high pH value, the weaker Mg complex is also stable and the difference between the Ca and Mg complex in the potential is very low. This means that first the stronger Ca complex forms, but that the Mg jump follows soon.
The first derivation therefore shows only a flat first jump for the calcium. Only after the magnesium, if no other metals are present, comes a strong jump.
If the pH value decreases, the Mg complex becomes less stable and the Ca jump more pronounced. The first derivation shows to peaks of an approx-imately same height. If the pH value is too low, Mg can no longer be detected, but the Ca complex also becomes less stable, the potential jump will be flatter.
In practice, one titrates at a pH value of about pH 8-9. Acetyl- acetone and TRIS are added as auxiliary complexing agents.
In the titration of tap water, 100.00 ml of the sample are pipetted into a 150 ml beaker. 15 ml TRIS/acetylacetone buffer (20.4 g TRIS and 12 ml acetyl acetone to 1000 ml) are added and titrated with 0.05 mol/l EDTA.
A Ca-ISE indicator electrode and an Ag/AgCl reference electrode with a platinum diaphragm are used as electrodes.

Fig. 76 Titration curve drinking water
ml
mV
0 0,375 0,75 1,125 1,5 1,875 2,25 2,625 3,0 3,375
0,0
20,0
40,0
-20,0
-40,0
-60,0
-80,0
-100,0
mV/ml dmV/dml
3.18 ml-84.8 mV
-15.1 mV2.48 ml
Titration guide
138 139
The following titration parameters are recommended: Dynamic titration Dynamics: flat Dosing speed 100% Measuring speed: Measurement time 4 s Drift 5 mV/min Min time 5 s Max time 12 s no damping Titration end: 2 EQ, slope value 120
Formula for calcium oxide [mg/l](EQ1 B) T M F1
CaO [mg / l]V F2
− ∗ ∗ ∗=
∗
EQ1: Consumption titrant [ml] until the equivalence point
B: Blank value of the solventT: Exact concentration of the titrant
M: Molar mass of CaO (56.08 g/mol)
V: Volume sample [ml]F1: 1000 (conversion g – mg)F2: 1
Formula for magnesium oxide [mg/l]
(EQ1 EQ2) T M F1MgO [mg / l]
V F2− ∗ ∗ ∗
=∗
EQ1: Consumption titrant [ml] until the first equivalence point
EQ2: Consumption titrant [ml] until the second equivalence point
B: Blank value of the solventT: Exact concentration of the titrantM: Molar mass of MgO
(40.32 g/mol)V: Volume sample [ml]F1: 1000 (conversion g – mg)F2: 1

Titration guide
140 141
Total hardness in drinking waterIf the total hardness is to be determined, it often makes sense to have only one jump in the titration curve (Fig. 77). In this case, the sum of all metals is determined. A Cu-ISE indicator electrode (solid-state electrode) and an Ag/AgCl reference electrode with a platinum diaphragm is used as indicator electrode. So that all metals can be detect-ed, Cu(NH4)2EDTA 0.1mol/l is added as indicator. With very small contents (< 0.1 °dH), a blank value must be determined.
Almost all divalent metal ions can be titrated in the same manner. The water hardness is nowadays given mainly in mmol/l alkaline earth ions. From this it is easy to calculate the water hardness in other units such as °dH or °fH.
5 ml of ammonium chloride/am-monia buffer pH 10 are added to a 100 ml sample and 1 ml of indicator Cu(NH4)2EDTA 0.1 mol/l is added, then one titrates with Na2EDTA 0.05 mol/l.
The following titration parameters are recommended:
Dynamic titration Dynamics: flat Dosing speed 100% Measuring speed: Measurement time 4 s Drift 3 mV/min Min time 5 s Max time 12 s no damping Titration end: 1 EQ, slope
value 120 mV/ml
Formula for water hardness [mmol/l]
(EQ1 EQ2) T M F1Water hardness [mmol/ l]
V F2− ∗ ∗ ∗
=∗
EQ1: Consumption titrant [ml] until the equivalence point
B: Blank value of the solventT: Exact concentration of the
titrant [mol/l] M: 1V: Volume sample [ml]F1: 1000 conversion g – mgF2: 1

Fig. 77 Titration curve drinking water
ml
mV
0 0.1 0.2 0.3 0.4 0.5 0.6 0.7 0.8
0.0
20.0
40.0
60.0
80.0
100.0
120.0
-20.0
-40.0
mV/ml dmV/dml
0.71 ml13.6 mV
Titration guide
140 141

Titration guide
142 143
The formula indicates the acidity in % of a salicylic acid solution having a molecular weight of 138.12. However, if the content is known very accurately (because a pure compound is present), the molecular weight can becal-culated from the consumption:
2 [%]Molar mass [g/ mol]
1W FEQ T F∗ ∗
=∗ ∗
W: Volume[%]: Content in %EQ: Consumption titrant [ml] until the
equivalence pointT: Exact concentration of the titrant
[mol/l]F1: 0.1 (conversion l-ml and %)F2: 1
If a compound is thus prepared in pure form, its molecular weight can be determined in this manner. The most common application is certainly the deter- mination of the crystal water of a molecule, as the molecular weight changes significantly with crystal water.
6.6 Determination of molecular weights by titrationTitration is usually a method for the quantitative determination of known samples. The method can also be used for the deter-mination of substance sizes if the content of a sample is clearly and precisely known.
The simplest case is a reversal of the calculation formula for the determination of salicylic acid:
EQ T M F1Salicylic acid [%]
W F2∗ ∗ ∗
=∗
EQ: Consumption titrant [ml] until the equivalence point
T: Exact concentration of the titrant [mol/l]
M: Molar weight [g/mol]W: VolumeF1: 0.1 (conversion l-ml and %)F2: 1

Titration guide
142 143
6.7 Determination of pKs values
Further substance-specific para- meters can be determined from the titration curve: pKs value (acid strength), pKb value (base strength), complex stability constants, solubility products, stability constants and extraction equilibria.
As an example, a simple possibil-ity serves for the determination of the pKs value:
HAc + H2O ↔ H3O+ + Ac-
Here, the HAc acetic acid is an example of a monobasic acid which dissociates in water to a hydronium ion and acetate anion to a small extent. The concentration of water is consid-ered constant in diluted solutions and is included in the equilibri-um constant.
3[H O ] [ ][ ]s
AcK
HAc
+ −∗=
The negative logarithm of the equation is:
[ ]log
[ ]sAc
pK pHHAc
−
= −
At the point on the titration curve where HAc and acetate ions have the same concentration, the pH is equal to the pKs value:
pH = pKs
This point, the half neutralization point (HNP), can be read from the titration curve (Fig. 78).
In methods for determining the pKs value, the equivalence point is thus determined first. The pKs value is then determined from the titration curve suring the con-sumption EQ/2 ("y at x"). This is also possible with several jumps and EQs in a first approximation.

Fig. 78 Graphic representation of the pKs value from the HNP point
3
4
5
6
7
8
9
0 5 10 15 20 25
pH
ml NaOH
Acetic acid with sodium hydroxide
Titration degree = 1
Titration degree = ½
At titration graph 1/2: pKs = pH
Titration guide
144 145
However, the pKs values thus obtained are still subject to small errors. In order to accurately determine the pKs value of an acid, other factors must be considered, for example:
Electrode properties (Slope, zero point, deviation from
the theoretic behavior in acid and alkaline) The ion activities instead of the
concentrations Evaluation of a larger curve
area instead of an individual data point
Special software (for example Hyperquad) is used for the eval-uation.

Fig. 79 Graphic representation of the acid strength with pKs value as maximum
0
2
4
6
8
10
12
14
16
3 4 5 6 7 8 9 10
dml/dpH
pH
Profile acid strength acetic acid
Titration guide
144 145
An interesting variant is the rep-resentation of an acid profile. The pH value of a titration curve is plotted on the x-axis and the quotient dml/dpH on the y-axis, similar to the gradient of the titration curve, only transferred to the normal pH-y axis. The pKs value can be recognized as the maximum (Fig. 79).
The advantage of this represen-tation is evident in applications where several acids or acid centers are present in a molecule. In all cases, it is sensible to have more data points in the flat part of the titration. Dynamic titration is therefore unsuitable and linear titration is the method of choice.

Titration guide
146 147
6.8 pH Stat titrationspH Stat titrations can cover very different applications. Even an-alog potentials of other sensors can be kept constant.
Typical applications are:
Enzymatic titrations in which protons are released. Extraction reactions, e.g. of soil
samples from which alkaline acid components are released for 24 hours by an acid. Stability studies of e.g.
concrete at very low pH values, in order to get an idea of the corrosion behavior. Crystal growth, in which the
ions, which are removed by crystallization from the solu-tion, are supplied continuously in order to always obtain the same concentration. Neutrality reactions over a lon-
ger period of time.
In the pH Stat titration, one often works under nitrogen at an accu-rately set temperature to prevent the influence of CO2 from the air.
The titration is divided into phases; an setting phase in which the starting pH must first be reached, at which the reac-tion proceeds optimally and a Stat phase in which a defined pH value or measured value must be maintained (Fig. 81).
The following can be consulted as the result:
The total consumption [ml] The consumption of the Stat
phase without setting phase [ml] The gradient of the Stat phase
consumption per time [ml/s] or [mmol/s]
The duration of the stat phase starts when the pH value of the reaction is reached. Two different times can be set as time variable; the total duration of the titration and the interval for the docu-mentation. The total duration is the period during which the pH value is kept constant. The time interval defines the number of measurement points for the documentation. One also titrates between these intervals and the pH is kept constant.
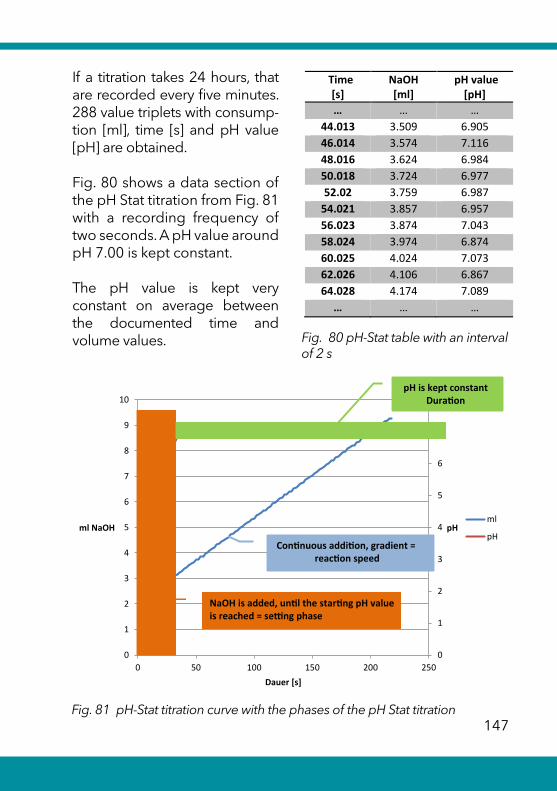
Fig. 81 pH-Stat titration curve with the phases of the pH Stat titration
0
1
2
3
4
5
6
7
8
0
1
2
3
4
5
6
7
8
9
10
0 50 100 150 200 250
pHml NaOH
Dauer [s]
ml
pH
pH is kept constantDuration
Continuous addition, gradient = reaction speed
NaOH is added, until the starting pH value is reached = setting phase
Fig. 80 pH-Stat table with an interval of 2 s
Time [s]
NaOH [ml]
pH value[pH]
… … … 44.013 3.509 6.905 46.014 3.574 7.116 48.016 3.624 6.984 50.018 3.724 6.977 52.02 3.759 6.987
54.021 3.857 6.957 56.023 3.874 7.043 58.024 3.974 6.874 60.025 4.024 7.073 62.026 4.106 6.867 64.028 4.174 7.089
… … …
Titration guide
146 147
If a titration takes 24 hours, that are recorded every five minutes. 288 value triplets with consump-tion [ml], time [s] and pH value [pH] are obtained.
Fig. 80 shows a data section of the pH Stat titration from Fig. 81 with a recording frequency of two seconds. A pH value around pH 7.00 is kept constant.
The pH value is kept very constant on average between the documented time and volume values.

Titration guide
148 149
6.9 Gran titrationsThe Gran titration is led back to two publications by Gunnar Gran [7], [8]. It is based on a lineariza-tion of titration curves.
The basis is the Nernst equation:0 ox
e red
aR TE E ln
z F a∗
= + ∗∗
E Electrode potentialE° Standard electrode potentialR Universal or molar gas constant
R = 8.314 J mol−1 K−1
T absolute temperature (=Temperature in Kelvin)
ze Number of electrons transferred (also equivalence number)
F Faraday constant, F = 96485.34 C mol−1
a Activity of the respective redox partner
The acid/base equilibrium is contained in the equation in a logarithmic form. An exponential notation thus leads to a linear-ization of the titration curve. Thus if, taking into account the volume correction, a titration of a base with a strong acid is cal-culated according to the formula
(Start volume+
titration volume) *10pH
(and the highest value is scaled to 1), the green straight line in Fig. 82 is obtained. The "Gran" values do not reach the value "0", but they become very small. If a straight line is now placed through the Gran function until just before the equivalence point, the Gran line will intersect the x-axis exactly at the equiva-lence point. The values can also be extrapolated linearly, the titration does not have to reach this point then. The advantage is of course that "later" distur-bances are not included.
Analogously, the excess of hydrochloric acid can be calcu-lated back to the last equivalence point with the Gran function, in that the pH value is used as a negative exponent in the Gran equation:
(Start volume+
titration volume) *10-pH
This Gran function can be seen as an orange function in Fig. 82. In order to detect no further bas-es or acids, the straight line area must not be placed too close to the equivalence point.

Fig. 82 Gran function at a titration of NaOH with HCl
0
0.2
0.4
0.6
0.8
1
1.2
2
4
6
8
10
12
0 10 20 30 40 50 60 70
Gra
n sc
aled
[pH]
HCl [ml]
pH Gran base 10^pH Gran acid 10^-pH
Titration guide
148 149
This opens up the possibility of a number of applications. Whenever the endpoint or equivalence point is disturbed by other effects, Gran titration is an alternative. Examples are:
Determination of the acid capacity in waters where other acids (humic acids, phosphates) than carbonic acid interfere with the usual endpoints.
Acid samples in which acid/base titrations falsify metals by hydroxide formation at the equivalence point.
The pH value of the equiv-alence point must not be reached because a subse-quent reaction is then no longer possible.

Titration guide
150 151
A widely used application is the determination of alkalinity in seawater [9].
The standards
ISO 22719:2008 [9] ASTM D3875 - 08 [10] ASTM D1067 - 06 [11] ASTM D513 - 06 [12]
describe methods for determin-ing the hydrogen carbonate or the alkalinity for various waters. Even in wooded areas, a simple endpoint titration is often not possible due to humic acids [13].
The determination of the alka-linity should be picked out here. The CO2 equilibrium has a large influence on our climate. A multiple of the CO2 content of the atmosphere is dissolved in seawater. If the pH value decreases and/or the tempera-ture increases, less CO2 dissolves in the seawater. The change of the pH value is called acidifica-tion. Instead of a pH value of 8.3, nowadays only a pH 8.1 is usually reached.
The titration is carried with HCl up to a value of pH 3.0 . For a range of pH 4.0 to 3.0, a Gran evaluation takes place.
In Fig. 83, the classic titration curve is shown in dark blue. The evaluation range of the Gran titration is marked with dark blue dots. The light blue first derivation shows how difficult it would be to calculate an equivalence point or endpoint. The Gran function is represent-ed in red and orange. For the evaluation range between pH 4 and 3, the Gran straight line is marked with red dots. The extrapolation of the Gran straight line with the x-axis gives the alkalinity.
The excess of hydrochloric acid is calculated back to the last EQ by means of the Gran evaluation. As a result, disturbances in the area of the EQ have no influence on the result.

Fig. 83 Gran titration of sea water
y = 1.7463x - 2.1402R² = 0.9998
0.000
0.100
0.200
0.300
0.400
0.500
0.600
0.700
0.800
0.900
1.000
3.00
4.00
5.00
6.00
7.00
8.00
0 0.2 0.4 0.6 0.8 1 1.2 1.4 1.6 1.8 2
Gra
n
pH
ml HCl
Alkalinty
pH values Selection Gran (^-pH) Gran (^pH)
Gran pH 3-4 Derivation Linear (Gran pH 3-4)
Titration guide
150 151

Titration guide
152 153
SECTION 7
PHOTOMETRIC TITRATIONS
Classic titrations usually work with an optical indicator, in order to display the end of a titration (also see section 2.5 “Manual titration”). Many standards there-fore still require the use of optical indicators nowadays. The use of a photometric sensor to detect the endpoint offers several advantages:
Objective evaluation of the colour change Possibility of method automa-
tion Low-maintenance sensor Inert against most solvents Simple operation Long lifetime
As optical indicators exist for almost all titration applications, a photometric sensor also has a correspondingly broad applica-tion range for:
Acid / base titrations in aque-ous and organic solvents Complexometric titrations Redox titrations Precipitation titrations
Tyical application examples for photometric sensors are:
Determination of chondroitin sulphate sodium according to Ph.Eur. and USP. Determination of carboxyl end
groups in PET according to ASTM D7409 TAN/TBN according to ASTM
D974 Titration of sulphate (indicator
thorin) Complexometric determina-
tion of the total hardness

Shaft diameter 12 mm Shaft length 132 mm Minimum immersion depth 25 mm Shaft material Titanium Cable Fixed cable Connections USB interface A, BNC interface, with BNC-DIN adapter Current supply via USB Measurement range 0 – 2000 mV Temperature range 0 – 50 °C pH range 0 – 14 Adjustable wavelengths 470, 520, 570, 590, 605, 625
Fig. 84 OptiLine 6 electrode, technical data
Titration guide
152 153
7.1 The OptiLine 6The OptiLine 6 electrode offers the possibility to select between six different wavelengths (Fig. 84). The shaft material shaft consists of titanium, whereby a maximum compatibility with the different solvents is ensured. Power is supplied through a USB inter-face, via which the measured values are also transmitted to the TitroLine titrator (digital sen-sor). The setting of the titration parameters, such as wavelength and intensity, is performed directly in the titration software. In addition, the sensor has an analog DIN/BNC interface, which allows you to connect the OptiLine to any titrator with a corresponding input.

Titration guide
154 155
7.2 Measurement principleDuring a photometric determi-nation, the change in intensity is measured, which is caused by the colour change of the indica-tor used. Due to the colour of the solution, the light emitted by the sensor is absorbed. The change in absorption that is caused by the colour change of the indica-tor, is measured as a change in intensity on the detector is used as a regulating parameter for the titration.
During a precipitation titration, either turbidity is generated during the titration, which reach-es its maximum at the end of the reaction or the occurrence of turbidity indicates the end of the reaction. In both cases, the turbidity causes a dispersion of the light emitted by the sensor, which in turn causes the change in intensity on the detector.
The wavelength should be selected so that the absorption difference between the start and the end of the titration is greatest. In order to determine the cor-rect wavelength, you could use a photometer to record a spec-trum at the start and at the end of the reaction. The maximum or minimum of the difference spec-trum shows the optimal wave-length for this determination. The wavelength closest to this wavelength can now be selected for the determination.

Titration guide
154 155
7.3 Error sourcesAir bubblesIn particular in aqueous media, air bubbles may form on the OptiLine. These lead to refractions of light, whereby no stable signal can be measured. Therefore, one should work with degassed water if possible. The degassing of the water can take place via a vacuum or boiling. Furthermore, the sensor should be aligned in such a manner that the optical range of the sensor points against the flow direction so that any air bubbles in the sample are removed.
Ambient lightAs optical electrodes are light dependent, in certain circum-stances, strong ambient light may interfere with the measure- ment leading to erroneous readings. As such, it is important to consider the location when performing photometric titra-tions.
7.4 ApplicationsDetermination of the alkalinity KS 4,3
A general description of the alkalinity can be found in the section "Titration of KS 8,2 and KS 4,3". The indication takes place by means of methyl orange (0.2 % in H2O).

Fig. 85 Titration curve of a photometric titer determination with 0.1 molar HCl
ml
mV
0 1.25 2.5 3.75 5.0 6.25 7.5 8.75 10.0980.0
1000.0
1020.0
1040.0
1060.0
1080.0
1100.0
1120.0
1140.0
mV/ml dmV/dml
10.00 ml1106.2 mV
Titration guide
156 157
a) Titer determinationApprox. 120 mg TRIS (Tris-(hy-droxylmethyl)aminomethane) are weighed in for the deter-mination of the titer. The deter-mination takes place at 520 nm (Fig. 85).
The following titration parameters are recommended:
Measured value: mV (E) Linear titration to an
equivalence point Linear step: 0.05 ml Measuring speed: Measurement time 3 s Drift 10 mV/min Min time 5 s Max time 12 s
Waiting time: 10 s Pre-titration: 8.5 ml Wavelength: 520 nm Titration end: 1 EQ slope value: steep Intensity: 30 % Smoothing: average
Formula for titer in mol/l
W F2cHCl [mol / l]
(EQ1 B) M F1∗
=− ∗ ∗
EQ1: Consumption titrant [ml] until the equivalence point
B: Blank value = 0 M: Molar weight of TRIS
(121.14 g/mol)W: Weighed sample TRIS [g]F1: 1F2: 1000 (conversion g – mg)

Fig. 86 Titration curve of a photometric Alk. 4.3 determination of drinking water
ml
mV
0 0.5 1.0 1.5 2.0 2.5 3.0 3.5 4.0900.0
950.0
1000.0
1050.0
1100.0
1150.0
1200.0
1250.0
1300.0
mV/ml dmV/dml
3.71 ml1084.8 mV
Titration guide
156 157
b) Sample measurementTo determine the alkalinity of drinking water, 100 ml of sample are placed in a 150 ml beaker. Depending on the alkalinity, the sample amount must be adjusted (Fig. 86).
The following titration parameters are recommended:
Measured value: mV (E) Linear titration to an
equivalence point Linear step: 0.05 ml Measuring speed: Measurement time 3 s Drift 10 mV/min Min time 5 s Max time 15 s
Pre-titration: none Wavelength: 520 nm no damping Titration end: 1EQ slope value: steep Intensity: 30 % Smoothing: average
Formula for KS 4.3 mmol/l
[ ]s4,3(EQ1 B) T M F1
K mmol / lV F2
− ∗ ∗ ∗=
∗
EQ1: Consumption titrant [ml] until the equivalence point
B: Blank value = 0 T: Exact concentration of the titrant
[mol/l] M: Molar weight = 1V: ml presentationF1: 10F2: 0.01

Titration guide
158 159
Photometric determination of acids in oils (TAN)A description of the optical in-dication of the acid titration in oils can be found in the ASTM D974. 0.05 mol/l KOH in ethanol is used as titrant. The solvent consists of a mixture of 500 ml of toluene, 495 ml of isopropanol and 5 ml of dist. water. Indicator is p-naphtholbenzein (1% solu-tion, dissolved in the solvent).
a) Titer determinationThe determination of the titer is carried out in the aqueous at a wavelength of 520 nm by means of potassium hydrogen phthalate and phenolphthalein as an indicator. Approx. 50 mg of potassium hydrogen phthalate are weighed in and after the dissolving, 50 µl is added (Fig. 87).
The following titration parameters are recommended: Measured value: mV (E) Linear titration to an
equivalence point No damping Linear step: 0.05 ml Measuring speed: Measurement time 3 s Drift 10 mV/min Min time 5 s Max time 12 s Waiting time: 10 s Pre-titration: 4 ml Wavelength: 520 nm Titration end: 1 EQ Slope value: steep Intensity: 30 % Smoothing: average
Formula for titer in mol/l
W F2cKOH [mol / l]
(EQ1 B) M F1∗
=− ∗ ∗
EQ1: Consumption titrant [ml] until the equivalence point
B: Blank value = 0 M: Molar weight of potassium hy-
drogen phthalate (204.22 g/mol)
W: Weighed sample potassium hydrogen phthalate [g]
F1: 1F2: 1000 (conversion g – mg)

Fig. 87 Titration curve photometric titer determination 0.05 molar KOH
ml
mV
0 0.625 1.25 1.875 2.5 3.125 3.75 4.375 5.0 5.625150.0
300.0
450.0
600.0
750.0
900.0
1050.0
1200.0
mV/ml dmV/dml
5.26 ml821.2 mV
Titration guide
158 159

Fig. 88 Titration curve of a photometric blank value determination of a solvent mixture (toluene/IPA/water)
ml
mV
0 0.05 0.1 0.15 0.21000.0
1200.0
1400.0
1600.0
1800.0
2000.0
mV/ml dmV/dml
0.10 ml1491.1 mV
Titration guide
160 161
b) Blank value of the solventTo 100 ml of the solvent, 0.05 ml of indicator is added and the titration is carried out. The measurement is carried out at 625 nm (Fig. 88).
The following titration parameters are recommended:
Measured value: mV (E) Linear titration to an
equivalence point Linear step: 0.02 ml Measuring speed: Measurement time 4 s Drift 20 mV/min Min time 10 s Max time 40 s
Wavelength: 625 nm No damping Titration end: 0.3 ml max.
dosing volume Intensity: average Smoothing: average
Formula for blank value
Blank value [ml] = EQ1
EQ1: Consumption titrant [ml] until the equivalence point

Fig. 89 Titration curve of a photometric TAN determination of an insulating oil
ml
mV
0 0.1 0.2 0.3 0.4 0.5 0.6 0.7 0.8 0.91200.0
1300.0
1400.0
1500.0
1600.0
1700.0
1800.0
1900.0
2000.0
mV/ml dmV/dml
0.53 ml1702.8 mV
Titration guide
160 161
c) Sample measurementThe weighing in of the sample depends on the acid number of the oil. The sample is dissolved in 100 ml of the solvent (Fig. 89).
The following titrationparame-ters are recommended:
Measured value: mV (E) Linear titration to an
equivalence point No damping Linear step: 0.04 ml Measuring speed: Measurement time 4 s Drift 20 mV/min Min time 10 s Max time 40 s
Wavelength: 625 nm Titration end: 1 EQ Slope value: steep Intensity: average Smoothing: average
Formula for FFA in mg KOH
(EQ1 B) T M F1TAN [mg KOH / g]
W F2− ∗ ∗ ∗
=∗
EQ1: Consumption titrant [ml] until the equivalence point
B: Blank value of the solventT: exact concentration of the
titrant [mol/l] M: Molar weight KOH (56.1 g/mol)W: Weighing in the sample [g]F1: 1F2: 1
Titration guide
162 163
Determination of carboxyl end groups in PETThe determination of carboxyl end groups in PET pellets (polyethyleneterephthalate) is described in the ASTM D 7409. Bromophenol blue (0.5% in ethanol) is used as indicator, 0.05 molar ethanolic KOH as titrant. A blank value determina-tion of the solvent is carried out (Fig. 90).
Approx. 1 g of the pellets are weighed in for the determina-tion. 20 g o-cresol is added to the sample. The sample is boiled under reflux until it has completely dissolved. An adjust-ment of the sample and solvent amount is necessary if e.g. pre-cipitations result. After cooling, the mixture is mixed with 35 ml of chloroform. For the indication 0.04 ml bromophenol blue are added (Fig. 91).
a) Titer determinationThe titer determination can be determined photometrically, as described in the part "Determi-nation of the alkalinity KS 4,3".
b) Blank value of the solventFor the determination of the blank value, the solvent is treated as described above, but no sample is added. The blank value is boiled under reflux just as long as the sample needed to dissolve. The titration is carried out after adding the indicator (0.04 ml).
The following titration parame-ters are recommended:
Measured value: mV (E) Linear titration to an
equivalence point Linear step: 0.004 ml Measuring speed:
fixed waiting time: 20 s Wavelength: 605 nm Titration end: 0.1 ml max. dos-
ing volume Intensity: 50 % Smoothing: high
Formula for blank valueBlank value [ml] = EQ1
EQ1: Consumption titrant [ml] until the equivalence point

Fig. 90 Titration curve of a photometric blank value determination of a solventmixture (o cresol/chloroform)
ml
mV
0 0.01 0.02 0.03 0.04 0.05 0.06 0.07 0.08 0.09500.0
550.0
600.0
650.0
700.0
750.0
800.0
850.0
900.0
mV/ml dmV/dml
0.02 ml813.1 mV
Titration guide
162 163

Fig. 91 Titration curve of a photometric carboxyl end group determination of PET pellets
ml
mV
0 0.125 0.25 0.375 0.5 0.625 0.75 0.875 1.0 1.125375.0
450.0
525.0
600.0
675.0
750.0
825.0
900.0
975.0
mV/ml dmV/dml
0.54 ml620.7 mV
Titration guide
164 165
c) Sample measurementThe implementation of the mea-surement is described in the general method part.
The following titration parame-ters are recommended:
Measured value mV (E) Linear titration to an
equivalence point no damping Linear step: 0.1 ml Measuring speed:
fixed waiting time: 20 s Wavelength: 605 nm Titration end: 1 EQ Slope value flat Intensity: 50 % Smoothing: high
Formula for R-COOH in mmol/kg
(EQ1 B) T M F1R COOH [mml/kg]−
W F2− ∗ ∗ ∗
=∗
EQ1: Consumption titrant [ml] until the equivalence point
B: Blank value of the solventT: exact concentration of the
titrant [mol/l] M: Molar weight = 1W: Weighing in the sample [g]F1: 1F2: 1000 (conversion g – mg)

Titration guide
164 165
8.1 The Karl Fischer reaction and reagentsThe Karl Fischer titration serves to determine the water content of a sample. It has the advantage of faster determination compared to the drying method and is also more selective. The exact mech-anism of the Karl Fischer reaction has been controversial for a long time. Even the stoichiometry of the reaction was not clear for a long time. In principle, a titration would not be possible therewith. In more recent times, there have been some investigations of the mechanism, which have resulted in the following reaction equa-tion:
ROH + SO2 + R´N → [R´NH]SO3R
H2O + l2 + [R´NH]SO3R + 2 R´N →
[R´NH]SO4R + 2 [R´NH]
Wherein:
ROH An alcohol, e.g. methanol, ethanol, ethylene glycol mono-ethyl ether
R´N A base, e.g. imidazole (previously often pyridine)
The oxygen of the sulphate ester comes from the water molecule. The examinations of the mech-anism show a change of the stoichiometry when working in other solvents. The addition of other solvents should therefore not exceed 50 % by volume. In addition to water, four compo-nents (an alcohol, sulfur dioxide, a base, iodine) participate in the reaction; these must be present so that the reaction takes place.
With the classic KF titration, all components are offered as a combined reagent and are avail-able in sufficient stability with suitable bases and alcohols. In addition, 2-component reagents are also offered nowadays, in which the solvent component contains an alcohol, a base and SO2.
SECTION 8
KARL FISCHER TITRATION
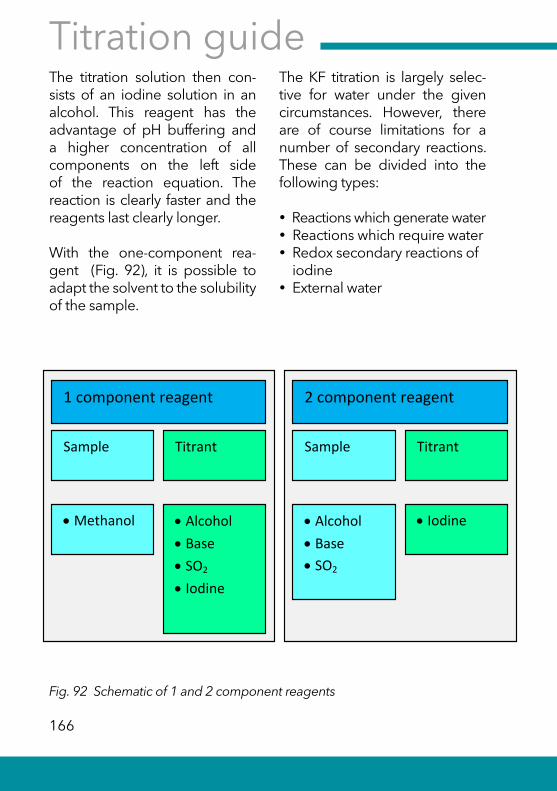
Fig. 92 Schematic of 1 and 2 component reagents
1 component reagent
Sample
• Methanol
Titrant
• Alcohol • Base • SO2 • Iodine
2 component reagent
Sample
• Alcohol • Base • SO2
Titrant
• Iodine
Titration guide
166 167
The titration solution then con-sists of an iodine solution in an alcohol. This reagent has the advantage of pH buffering and a higher concentration of all components on the left side of the reaction equation. The reaction is clearly faster and the reagents last clearly longer.
With the one-component rea- gent (Fig. 92), it is possible to adapt the solvent to the solubility of the sample.
The KF titration is largely selec-tive for water under the given circumstances. However, there are of course limitations for a number of secondary reactions. These can be divided into the following types:
Reactions which generate water Reactions which require water Redox secondary reactions of
iodine External water

Titration guide
166 167
The best known water-producing reaction is the formation of acetals or ketals. The alcohol necessary for the reaction and used as a solvent reacts with carbonyl groups (C = O) while forming water. This water is also detected by the titration. The titration does not seem to stop. A high permanent “drift” results.
However, acetal or ketal forma-tion can be avoided by using special reagents for aldehydes and ketones. A second possibil-ity is the mode of operation with reduced temperature. One works at temperatures below 0 o C. The ionic KF reaction proceeds in a virtually unaffected manner, while the acetal and ketal forma-tion is significantly slowed down. The lower temperature limit is determined by the viscosity of the solvent and the crystallization of secondary components.
Aldehydes can also form a bisul-phate addition with SO2 under certain conditions. This reaction should be largely suppressed with a correctly set pH value. This reaction also requires water and could pretend in this way a water content that is too low.
Further reactions with water formation are the reaction of carbonyls with amines to form Schiff's bases, the formation of enamines and the esterification of acids with the alcohol of the solvent. The risk is reduced when using methanol-free solvents.
External water is the most com-mon error source in KF titration. It can reach the titration cell through various possibilities. First, the solvent or the presenta-tion component must of course be dry-titrated. This procedure is called conditioning. If External water still gets into the titration cell, this is assigned to the sample as External water. External water reaches the titra-tion cell in the following man-ners:

Fig. 93 Dependence of the reaction speed from the pH value
Reaction speedk
pH value5.5 7.5
Slow area
KF areaProhibited area
Titration guide
168 169
The titration cell is not tight. Foreign particles can for exam-ple hang between the ground joints. Another possibility is defective O-rings on the screw connections of the titration cell.
While the titration cell is opened to add the sample, air humidity enters. The septum for the addition of
liquid samples is leaking and worn. The molecular sieve in the
drying tube for pressure equal-ization is used up and must be dried. Humid air is present in the
pump system. The air for adding the solvent must also be dried with the molecular sieve.
The KF titration is strongly pH- dependent (Fig. 93). At values below 5.5 pH, the reaction speed slows by up to a factor of 1000.
Secondary reactions can occur in the alkaline range. But this also implies that in the KF titration of acids, bases must be added and in the titration of bases (e.g., amines), acids must be added.
Acidic samples: add imidazole or methyl imidazole
Alkaline samples: add benzoic acid oder salicylic acid

Fig. 94 KF titration curve
0
0.5
1
1.5
2
2.5
3
0 20 40 60 80 100 120
Cons
umpti
on [m
l]
Titration duration [s]
Steep increase, fast reaction
Flat curve, parallel to the x-axis
Bend which is not too acute
Titration guide
168 169
8.2 The detection of the KF titration and titration curvesThe KF titration uses a double platinum electrode for detection, to which a voltage of 20-200 mV is applied. The titration is titrated with an iodine solution. The iodine reacts directly to iodide in the KF reaction. No current can flow at the double platinum electrode of the detection sys-tem. However, as soon as the first drop of an iodine solution is present in excess, a reversible redox system of iodine and iodide is present. A current flows, which is measured and indicates the end of the titration.
However, the current curve does not give any information about the course of the reaction. There-fore, a representation is usually chosen in which the time is plotted on the x-axis and the consumption on the y-axis. First, the reagent is added quickly and a steep increase results. Then, one titrates slower and more carefully, because the titrator de-tects the approaching endpoint. The smaller reagent additions make the titration curve increas-ingly flatter until no more reagent is added and the titration runs parallel to the x-axis (Fig. 94).

Fig. 95 Titration curve with secondary reaction
0
0.1
0.2
0.3
0.4
0.5
0.6
0.7
0.8
0.9
0 20 40 60 80 100 120 140 160 180
Time [s]
Cons
umpti
on [m
l]
Titration guide
170 171
If a secondary reaction is present during the titration, e.g. because ketones are present and two moles of water are formed per mole of ketal, a continuous in-crease can be seen, the drift does not go down and the titration does not stop when there is no time limit. Fig. 95 shows an exam-ple for a titration with secondary titrations.
8.3 Sample handlingThe samples must be com-pletely dissolved for the safe total determination of the water content. Not all samples dis-solve in methanol or the solvent component of the 2-component reagent. In these cases, the one-component reagent is pre-ferred and the methanol is treat-ed with a solubility enhancer. For polar samples, formamide is often used. For non-polar samples chloroform, xylene or long-chain alcohols are used.

Fig. 96 Dissolving trials with the KF titration
Dissolving trials
Temperature
Polarity of the solvent
Duration
Methanol
Methanol and formamide
Methanol + chloroform
Polarity
Titration guide
170 171
The possibilities are often limit-ed by the water content and the type of the sample. Thus, ex-ternal extraction is unsuitable if the water content of the sample is significantly lower than the water content of the solvent.
For some samples, however, a drying oven is required for sample preparation. An exam-ple are plastic samples that are virtually insoluble, at least not in a solvent that is suitable for KF titration. However, the oven can only be used to a limited extent if the samples decompose before they release the water or if volatile components outgas and condense in the colder part of the oven.
Even a sample that does not release the water immediately would show a continuous in-crease. Different ways exist to optimize the water release:
Adaptation of the solvent, where possible (Fig. 96) Heating of the solution (to
approx. 50 °C) by means of a heatble magnetic stirrer, or a double jacket vessel and a water bath External sample preparation/
extraction Use of a homogenizer Use of a KF oven

Fig. 97 Comparison KF coulometry and volumetry
I22 I- I2
KF reaction From KF reagent
2 I- I2
Indication Iodine dosing Iodine generation
COULOMETRY VOLUMETRY
- -
+
+
Titration guide
172 173
8.4 The coulometryThe volumetric reagent addition is preferably replaced by coulo-metrically generated iodine with low water contents.
Coulometry is based on the same chemical reaction, but the iodine is not dosed by a burette but generated in situ at the anode of a generator electrode by oxidation of iodide (Fig. 97).
At the cathode, hydrogen is generated by reduction. The amount of iodine generated is calculated from the titrator according to Coulomb's law:
M Qm
z F∗
=∗
m mass of the water to be determined
M molar massQ measured charge amountz valencyF Faraday constant
(96,485.3 Coulomb/Mol)

Fig. 98 Workflows for the coulometric/volumetric KF titration
Switch on titrator
Carry out the first filling
Fill the solvent into the titration cell
Condition the solvent
Start the method
Start the titration
Weighing in and designation
The titration is running
The results are issued
Pump off the solvent
VolumetricKF titration
Fill the solvent into the titration cell
Condition the solvent
Start the titration
Place the sample into the titration vessel
Weighing in and designation
The titration is running
The results are issued
nexttitration
Coulometric KF titration
nexttitration
Switch on titrator
Place the sample into the titration vessel
Titration guide
172 173
Coulometry is an absolute method; a titer determination is not necessary and also not possible. KF volumetry and coulometry are the same except for the iodine addition (Fig. 98). Nowadays, a generator elec-trode is mostly used, which dis-penses with a diaphragm.
Only with very small amounts of water, difficult samples and very high demands of the accuracy, electrodes with diaphragms are used. Then suitable reagents are available for the cathode chamber.

Fig. 99 Comparison use of coulometric and volumetric KF titration
Coulometry Volumetry
Wassergehalt und Probenmenge
• kleine Wassergehalte • kleine Probenmengen
• mittlere und große Wassergehalte • Angepasste Probenmengen
• • •
• solid • liquid
Probezugabe und Vorbereitung
• mit Spritze direkt • • • f
• Feststoffe direkt • Probenzerkleinerung mit • Homogenisierer • Arbeiten mit erhöhter Temperatur • mit Spritze direkt
Operation • very fast • very simple
• fast • simple
Arbeitsbereich • μg Bereich • 10 μg bis 5 mg Wasser
• mg Bereich • 200 μg bis 50 μg Wasser
Correctness • very good for small water amounts > 400 μg
• very good for water amounts> 5 mg water (+/- 0.5% currenttiter determination necessary)
Reproduzierbarkeit > 400 μg Wasser, typischer RSD ca. 1%
> 5 mg Wasser, typischer RSD ca. 1%
Water content andsample amount
• small water contents • small sample amounts
• medium and large water contents • adapted sample amounts
• • •
• •
Sample additionand preparation
• direct with the syringe • • •
• solids direct • • •
• •
• •
Working range • μg range • 10 μg to 5 mg water
• mg range • 200 μg to 50 mg water
•
water (+/- 0.5%)
•
Reproducibility > 400 μg water,typical RSA approx. 1%
> 5 mg water,
Property
typical RSA approx. 1%
Sample typesliquidgaseous (e.g. oven)fixed samples with oven
gas introduction with ovenexternal extractionheat out solid samples in the oven
sample crushing with homogenizerwork with increased temperature with syringe directly
Titration guide
174 175
In a direct comparison, the cou-lometric KF titration is simpler, as there is automatically condi-tioned in the background, so the titration cell is kept dry. With volumetric titration, condition-ing is added, which is necessary for each sample prior to titration (Fig. 98 and 99).
Both methods complement each other and one can rarely be com-pletely replaced by the other. Coulometry has its advantages in the ease of operation and the determination of very small amounts of water, while volume-try can be used far more flexibly.

Titration guide
174 175
9.1 OverviewAn important prerequisite for the correctness of titrations is the correctness of the concentration of the titrant. The titration is an absolute method, that is, the con-sumption is directly attributable to the chemical conversion.
As many titrants cannot be weighed in directly or their concentration does not always remain the same, the current content must be checked and documented again and again. This happens by means of the titer determination of the titrant.
Usually secondary reference materials according to NIST are used nowadays. These are pro-vided by the manufacturer with a certificate of the exact content, uncertainty and durability. All titrations whose titers have been set with such a standard can be traced back to NIST. Titer deter-minations are described in detail in section 4.
In principle, all devices and meth-ods must be validated in the laboratory so that traceability can be guaranteed.
Definition of the validation according to (DIN EN ISO 8402, 1994):
"Confirmation by examining and providing an objective evidence that the special requirements for a special, intended use are ful-filled... Verifiable information based on facts obtained by observation, measurement, test or in another manner."
For the validation, a comparison between the requirements and their fulfillment must always un-derlie according to ISO 8402. This is verified with the execu-tion of a validation process.
SECTION 9
VERIFICATION OF THE TITRATION

Titration guide
176 177
9.2 QualificationsThe qualification of a titrator happens essentially by check-ing its correct volume (the mea-surement unit of the titration) according to ISO 8655. For use in the laboratory, however, the device additionally has to be qualified by a series of process-es (Fig. 100). IQ and OQ can usually be carried out by the manufacturer.
After the qualification, the device can be used in the laboratory for the routine. An additional valida-tion is necessary for the methods. This takes place with the same scheme for all analysis methods and is described in detail in the literature [14, 15] for many methods.

Fig. 100 Qualifications of a titration measurement place
Qualification
Installation qualification (IQ)
Performance qualification (PQ)
Description What has to be done? Aids/documentation
Operational qualification (OQ)
Design qualification (DQ)
Maintenance qualification (MQ)
The DQ specifies the functional and operational qualifications of an instrument.
The IQ ensures that an instrument in the delivery state corresponds to the specifications of the order. It also documents the installation of the selected work environment.
Within the scope of the OQ, it is verified that an instrument in the selected work environment functions in correspondence with the operational specifications.
The PQ verifies that an instrument continuously delivers the performance according the specifications during normal use.
The MQ describes and documents the necessary maintenance.
● Describe the usage purpose● Select the instrument● Evaluate the manufacturer
● Check delivery scope● Set up● Start up● Carry out a test
● System suitability test● e.g. linearity with standard● Determination of the standard deviation● Calibration● Training
● Adapt analysis methods● Validate the methods
● Cleaning and care● Re-qualifying● Maintenance● Titer checks
● Manuals, operating instruc-tions
● Standards and quality guidelines
● Conformity guidelines● Manufacturer documents
● Operating instructions● Device support● Support of the manufacturer● IQ document
● OQ forms● Standards● Certificates● Training certificates
● Log book● Application support● Seminars● Standards● SOPs
● Maintenance contracts● Technical customer service● Test means monitoring
Titration guide
176 177

Fig. 101 Validation elements according to USP
Characteristic Category I (Content
determination)
Category II (Limit check)
Category II (Quant.
determination)
Category III (Quant.
determination)
Precision + - + +
Correctness + (+) + +
Verification limit - + - +
Determination limit - - + +
Selectivity + + + +
Range + (+) + +
Linearity + - + +
Robustness + + + +
Regulations of the USP XXII for validation: • Category I: Main components • Category II: Secondary products • Category III: Performance parameters (substance release)
Titration guide
178 179
9.3 ValidationThe extent of the validation depends on how much of a product is contained in a sample and how the influence of the sample matrix is. Fig. 101 repro-duces the validation scheme according to USP (United States Pharmacopoeia). In practice, the focus is on precision and linear-ity, as they give characteristics such as area, determination and detection limit.

Titration guide
178 179
9.4 Check of the correctness of a titrationIt shall be shown at an example that the small additional effort of a linearity test compared to a simple multiple determination provides a great number of infor-mation.
A relative standard deviation (RSD) of almost 12% is the result (Fig. 102, a). The linearity now shows that a negative con-sumption of 0.3 ml results from a 0.00 ml sample. This indicates a defective sample amount.
The used pipette was examined according to ISO 8655 and the found volume error was insert-ed into the data as correction. At 0.2%, the RSD is in the expect-ed order of magnitude after the correction. The linearity shows a correlation coefficient of 1,000. The straight line passes (almost) through the zero point (Fig. 103).

Fig. 103 Linearity after the correction of the volume error
y = 6.01x + 0.0055R² = 1
0
1
2
3
4
5
6
0 0.2 0.4 0.6 0.8 1
ml sample ml result “content”0.142 0.8558 6.0270.342 2.0596 6.0220.542 3.2748 6.0420.742 4.4574 6.007
Mean 6.025SD 0.014RSD 0.238
ml
sample mass
Fig. 102 Linearity of the titration results shows a serious error
y = 6.01x - 0.3431R² = 1
0
1
2
3
4
5
6
0 0.2 0.4 0.6 0.8 1
ml sample ml result “content”0.2 0.8558 4.2790.4 2.0596 5.1490.6 3.2748 5.4580.8 4.4574 5.572
Mean 5.114SD 0.585RSD 11.436
ml
sample mass
Titration guide
180 181

Fig. 104 Result of a titer determination
No. Weighted sample [g] Consumption [ml] Titer NaOH1 0.1189 5.8445 1.00602 0.1576 7.7489 1.00573 0.2090 10.2722 1.00614 0.2578 12.6710 1.00615 0.3045 14.9631 1.0063
MW titer 1.0060SD titer 0.0002RSD titer 0.0218
Titer determination NaOH 0.1 mol/l
Fig. 105 Linearity representation of the titer determination
y = 49.128x + 0.005
R² = 1.000
-2
0
2
4
6
8
10
12
14
16
0.0 0.1 0.1 0.2 0.2 0.3 0.3 0.4
Cons
umpti
on [m
l]
Weighted sample [g]
Linearity
Titration guide
180 181
For a simplified validation, only a few characteristics have to be checked and only a few titrations are required. In the example (Fig. 104 and 105), five titrations are performed, the average value and the relative standard deviation RSD are calculated.
The curves are analysed and the results are represented in a graph:
x-axis = sample amount y-axis = consumption.
The RSD is very low at 0.02 %. For a titer determination, values up to approx. 0.5% would be routinely accepted. The average value is also exactly where you expect it.

Titration guide
182 183
The titration curve is a very important element for the evaluation of the titration result (Fig. 106).
The criteria are as follows:
Calm titration curve without “dents” and “fluctuations“ Steep 1st derivation Even form of the derivation Only one peak, no secondary
peaks
If the titration curves are correct, the linearity is examined.
The characteristics are as follows:
Correlation coefficient better than 0.99(9) Interface with the y-axis (x = 0)
smaller than a drop of titrant (0.05 ml) The factor of the slope is exam-
ined if necessary
Some parameters such as the correctness have not been examined. This could be checked by adding a standard that can be recovered at 100%.
It is important that sample preparation is taken into account in the various titrations. It is not permissible to take several partial amounts of a prepared sample.
Fig. 107 shows an example of a validation of a KF coulometer. A volume test is not possible due to a lack of burette, but the linear-ity test can also prove the correct function of the device here. By means of the linearity test and a reference substance, the correct-ness of the water determination is verified according to specified criteria.

Fig. 106 Exemplary curve of a titer determination
ml
pH
0 1.25 2.5 3.75 5.0 6.25 7.5 8.75 10.03.5
4.375
5.25
6.125
7.0
7.875
8.75
9.625
10.5
11.375
pH/ml dpH/dml
8.568 pH10.13 ml
Fig. 107 Check of a KF titrator with the help of a linearity test
Temperature: 22.7°C
Specified value 1.000 [mg/g]
No. Sample Weight [g] Result [µg] Found [%]1 0.2153 214.9 99.82 0.2879 288.8 100.33 0.3684 371.0 100.74 0.4269 427.1 100.0
Mean 100.220RSD 0.241
Linearity
Wat
er [µ
g]
y = 1005.6x - 1.0075R2 = 0.9998
0.0
100.0
200.0
300.0
400.0
500.0
600.0
700.0
800.0
0 0.1 0.2 0.3 0.4 0.5 0.6 0.7 0.8
Weight [g]
4
Test protocol of manufacturer test TL KF Trace
KF Reagent:Hydranal Coulomat AD, Fluka Analytical No. 34810LOT SZ BA 0760, Date of Prod. Mar.2010, Exp. Date Feb. 2015
Hydranal Coulomat CG, Fluka Analytical No. 34840LOT SZ BA 014 A, Date of Prod. Jan.2011, Exp. Date Dez. 2015
Reference Material:Hydranal Water Standard 1.0 , Fluka Analytical No. 34849LOT SZ E 93380, Date of Prod. Mar. 2010, Exp. Date Nov. 201
Titration guide
182 183

Fig. 108 Cause-effect diagram of a titration
Volume
Uncertainty chlorideUncertainty sodium
mass NaCl
Repeatability
Weighing
Volume
Temperature
Mass NaCl
Concentration
Titration speed
Deviation EQ turning point
Repeatability
Electrode properties
Titration parameter
temperature
Volume expansioncylinder
Volume expansionwater
weighing
purity NaCl
gross weight
empty weight
Repeatability
Linearity
Sensitivity
Titration guide
184 185
9.5 Measurement uncer-taintyToday, the accuracy of a method is no longer specified, but the uncertainty "u" is estimated. For this, a method is examined by means of a cause-effect diagram (Fig. 108) for all parameters that have an influence on the calculated result. In the titration, all factors are evaluated that are directly or indirectly contained in the calculation formula.
The variables are quantified and converted into equal measuring units. Then the relative errors can be plotted as shown in Fig. 109. The uncertainty "u" of a titer determination then essentially depends on the correctness of the volume.
The uncertainty is multiplied by a factor k = 2 and added as an expanded uncertainty to an analysis value, such as e.g. can be seen on the certificates of the reference materials.

Fig. 109 The uncertainties of a titration in comparison according to GUM [15]
0.02
0.04
0.06
0.08
0.10
0.12
c(NaO
H)
Repe
atab
ility
m(KHP)
P(KH
P)
M(KHP)
V(T)
u(y.x
i) (m
mol
-1)
0.00
Des
crip
tion
Valu
eSt
anda
rdun
cert
aint
yRe
lativ
e st
anda
rdU
ncer
tain
ty u
(x)/
xre
p Re
peat
abili
ty1
0.00
05
0.00
05
mKH
P W
eigh
t of K
HP
0.38
88 g
0.
0001
3 g
0.00
033
PKH
P
Purit
y of
KH
Ps1
0.00
029
0.00
029
MKH
P M
olar
mas
s of
KH
P20
4.22
12 g
mol
-1
0.00
38 g
mol
-1
0.00
0019
V
T Vo
lum
e of
the
NaO
H d
urin
g KH
P tit
ratio
n18
.64
ml
0.01
3 m
l 0.
0007
Hig
hest
unc
erta
inty
Resu
lt
Titration guide
184 185

Titration guide
186 187
BIBLIOGRAPHY[1] Schulze, Simon, Martens-Menzel, Jander Jahr “Maßanalyse: Theorie und Praxis der Titration mit chemischen und physikalischen Indikationen”, Walter de Gruyter, Berlin/Boston, 18. Auflage, 2012
[2] DIN EN ISO 8655-3:2002-12 Volumenmessgeräte mit Hubkolben — Teil 3: Kolbenbüretten (ISO 8655-3:2002)
[3] PTB-Mitteilungen 112 (2002) Heft 2, S. 139-149
[4] Gernand, K. Steckenreuter, G. Wieland „Greater analytical accuracy through gravimetric determination of quantity“, Fresenius Z. Anal. Chem. (1989) 334:534-539
[5] pH-Fibel, SI Analytics 2014
[6] DIN 38409-H7 Summarische Wirkungs- und Stoffgrößen (Gruppe H) — Teil 7: Bestimmung der Säure- und Basenkapazität
[7] Gran, G. Determination of the Equivalence Point in Potentiometric Titrations, Acta Chimica Scandinavica (1950) S. 559-577
[8] Gran, G. (1952) Determination of the equivalence point in potentiometric titrations — Part II, Analyst, 77, 661-671
[9] ISO 22 719 First Edition, 2008-03-15, Water quality — Determination of total alkalinity in sea water using high precision potentiometric titration [10] ASTM D3875 - 08 Standard Test Method for Alkalinity in Brackish Water, Seawater, and Brines
[11] ASTM D1067 - 06 Standard Test Methods for Acidity or Alkalinity of Water

Titration guide
186 187
[12] ASTM D513 - 06 Standard Test Methods for Total and Dissolved Carbon Dioxide in Water
[13] Handbuch Forstliche Analytik (4. Ergänzung 2009), C 2.1.1-3
[14] S. Kromidas, Handbuch Validierung in der Analytik, 2014 Wiley-VCH Verlag, ISBN-13: 978-3527329380
[15] ISO/IEC Guide 98-3:2008: Uncertainty of measurement — Part 3: Guide to the expression of uncertainty in measurement [16] Küster, Thiel, Ruland, „Rechentafeln für die Chemische Analytik“, Gruyter; Auflage: 105., aktualis. A. (16. Oktober 2002)

We express our core competence, namely the production of analyti-cal instruments, with the name SI Analytics. SI also stands for the main products of our brand: sensors and instruments.
As part of the history of SCHOTT® AG, SI Analytics has more than 80 years experience in glass technology and in the development of analytical equipment. As always, our products are manufactured in Mainz with a high level of innovation and quality.
Proven quality - for decades.
An independent company in Mainz for over 50 years now and former subsidiary of SCHOTT® AG we are true to our tradition and continue to manufacture in accordance with the customs of Mainz glass makers.
Our electrodes, titrators and capillary viscometers will continue to be the right tools in any application where expertise in analytical mea-surement technology is required.
In 2011 SI Analytics became part of the listed company Xylem Inc., headquartered in Rye Brook / N.Y., USA. Xylem is a leading interna-tional provider of water solutions. 2016 SI Anayltics became part of the newly established company Xylem Analytics Germany, which is producing at several German sites.

We are Xylem Analytics Germany
Xylem is comprised of several businesses - Water Solutions, Applied Water Systems, Sensus and Analytics. The following brands under Xylem Analytics and their sites are, like SI Analytics, part of Xylem Analytics Germany.
WTW• Spectrometers• Electrodes• pH meterswww.wtw.com
ebro• Oil quality measuring instruments• Precision thermometer• Temperature, pressure and
humidity data loggerwww.ebro.com

Xylem |ˈzīləm|
1) The tissue in plants that brings water upward from the roots;
2) a leading global water technology company.
We’re a global team unified in a common purpose: creating advanced technology solutions to the world’s water challenges. Developing new technologies that will improve the way water is used, conserved, and re-used in the future is central to our work. Our products and services move, treat, analyze, monitor and return water to the environment, in public utility, industrial, residential and commercial building services settings. Xylem also provides a leading portfolio of smart metering, network technologies and advanced analytics solutions for water, electric and gas utilities. In more than 150 countries, we have strong, long-standing relationships with customers who know us for our powerful combination of leading product brands and applications expertise with a strong focus on developing comprehensive, sustainable solutions.
For more information on how Xylem can help you, go to www.xyleminc.com
Xylem Analytics Sales GmbH & Co. KGSI Analytics Hattenbergstr. 10 55122 MainzGermany
Phone: +49.(0)6131.66.5111 Fax: +49.(0)6131.66.5001 E-Mail: [email protected]: www.si-analytics.com
SI Analytics is a trademark of Xylem Inc. or one of its subsidiaries.
© 2018 Xylem, Inc. 980 092US Version 03/2018
presented by