the xiv - ualberta.ca
TRANSCRIPT


The XIVth “Edwin W. Roedder”
Pan-American Current
Research on Fluid Inclusions
Conference
Conveners
Michael P. Smith and Gary G. Gray
Abstracts with Program
Edited by
András Fall
June 12-14, 2018
Rice University, Houston, Texas, U.S.A.


Pan-American Current Research on Fluid Inclusions Rice University, Houston, Texas, U.S.A., June 12-14, 2018, Abstract Volume
1
We are happy to welcome everyone to the 14th Pan-American Current Research
on Fluid Inclusions Conference, held for the first time at Rice University, in Houston,
Texas…The energy capital of the world. It is no accident that this year’s program
will highlight applications of fluid inclusions for the exploration, development, and
production of hydrocarbon resources. We also have a full slate of presentations
on advances in analytical techniques, melt inclusions, ore deposits, plus a few
talks that range from ancient atmosphere inclusions in ice cores to direct samples
of aqueous fluids in the early solar system! Our post-meeting field trip will venture
down to South Texas to see active drilling in the Eagle Ford ‘shale’ unconventional
oil play.
We would like to thank the many entities that have made this meeting possible.
Rice University and the Department of Earth, Environmental, and Space sciences
in particular for their sponsorship of this meeting for granting us access to their
excellent facilities. We’d also like to thank our principal co-sponsor, Advanced
Hydrocarbon Stratigraphy, in Tulsa, OK, Thanks also to Core Labs for sponsoring
the post-meeting field trip, and to McCrone Microscopes and Accessories, and
AWL Mud Logging for their support. PACROFI (and sister act ECROFI) is a unique
and entirely volunteer organization. We invite everyone who is interested in the
future of PACROFI to come and provide their input at the business meeting on
Wednesday night at the conference banquet. Thanks to everyone for your
participation in the meeting.
The Organizing Committee,
PACROFI XIV, June 2018
ON THE COVER: Photomicrograph of an oil inclusion trapped in doubly-terminated quartz crystal
from Belochistan, Pakistan, shown under combined transmitted and UV-fluorescent lights. This
inclusion is exceptionally large, approximately 1500 microns in largest dimension. Multiple phases
are visible, including a large gas bubble, blue-fluorescent oil, and dark “blebs” of asphaltene
precipitate. The API gravity of this oil determined from quantitative fluorescence spectroscopy is
approximately 41.4±3.9 °API. Courtesy of Steve Becker.

Pan-American Current Research on Fluid Inclusions Rice University, Houston, Texas, U.S.A., June 12-14, 2018, Abstract Volume
2
The PACROFI 14 organizing committee would like to thank the following persons
and sponsoring companies for their support for the meeting:
Keynote Speakers:
Bob Burruss USGS (retired)
Pilar Lecumberri-Sanchez University of Alberta
Dan Marshall Simon Fraser University
Jacques Pironon Université de Lorraine
Ed Waddington University of Washington
Jim Webster American Museum of Natural History
Zoltán Zajacz University of Toronto
Mike Zolensky NASA Johnson Space Center
Sponsors:
The McCrone Group
AWL Services
Core Labs
Advanced Hydrocarbon Stratigraphy
Department of Earth, Environmental and Planetary Sciences, Rice University
Organizing and Scientific Committee:
Mike Smith Advanced Hydrocarbon Stratigraphy
Gary Gray Rice University
Steve Becker ExxonMobil URC
Ash Bigge Consultant
Katrina Cox CoreLabs
András Fall The University of Texas at Austin
Janet Haggerty University of Tulsa
Don Hall Schlumberger, FIT
Cyn-Ty Lee Rice University
Zhaoqi Li University of Kansas, CGG
Gordon MacLeod Chesapeake Energy
Bob Pottorf ExxonMobil URC (retired)
Jinny Sisson University of Houston
Dennis Smith ExxonMobil URC (retired)
Mike Sterner Schlumberger, FIT

Pan-American Current Research on Fluid Inclusions Rice University, Houston, Texas, U.S.A., June 12-14, 2018, Abstract Volume
3
We would like to thank the following companies and organizations for their
gracious support for our conference:

Pan-American Current Research on Fluid Inclusions Rice University, Houston, Texas, U.S.A., June 12-14, 2018, Abstract Volume
4

Pan-American Current Research on Fluid Inclusions Rice University, Houston, Texas, U.S.A., June 12-14, 2018, Abstract Volume
5

Pan-American Current Research on Fluid Inclusions Rice University, Houston, Texas, U.S.A., June 12-14, 2018, Abstract Volume
6

Pan-American Current Research on Fluid Inclusions Rice University, Houston, Texas, U.S.A., June 12-14, 2018, Abstract Volume
7

Pan-American Current Research on Fluid Inclusions Rice University, Houston, Texas, U.S.A., June 12-14, 2018, Abstract Volume
8

Pan-American Current Research on Fluid Inclusions Rice University, Houston, Texas, U.S.A., June 12-14, 2018, Abstract Volume
9
PACROFI 14, 2018
(* – not presented)
7:00-9:00 pm Registration – Keith-Wiess Geological Labs
Main meeting venue is at Sewall Hall, Room 301
7:00-8:30 Registration – Sewall Hall 301
8:30 Welcome and Intro
Session 1: Sedimentary and Petroleum Inclusions
Session Chair: Bob Pottorf
8:40 Jacques PIRONON
Hydrocarbon inclusions: the story
9:20 Stephen P. BECKER
Fluid inclusion tools in petroleum systems analysis
9:50 Erich de Zoeten, Robert H. GOLDSTEIN
Open system diagenesis in unconventional reservoirs of the
Midland Basin, Howard County, Texas
10:20 Break
Session Chair: Bob Burruss
10:40 Michael P. SMITH
Rock volatiles stratigraphy: A tool for petroleum exploration and
production
11:20 Zhaoqi LI, Robert H. Goldstein, Evan Franseen
Application of fluid inclusions to study low-temperature
diagenesis in Miocene carbonates, La Molata, SE Spain

Pan-American Current Research on Fluid Inclusions Rice University, Houston, Texas, U.S.A., June 12-14, 2018, Abstract Volume
10
11:40 András FALL, Robert J. Bodnar
Constraining the history of fluid events using the fluid inclusion
assemblage (FIA) method for collecting, displaying and
interpreting microthermometric data
*[(Guangxi OU, Min Zhang, Tieguan Wang, Di Wu, Qiong Li, Jian Ma
Characteristics and significance of fluid inclusions in the
Longmaxi Shale in the Jiaoshiba area, Eastern Sichuan Basin)]
12:10 Lunch
Session Chair: Jacques Pironon
1:20 Robert C. BURRUSS
Quantitative Raman spectroscopy of single
phase hydrocarbon gas-rich fluid inclusions
2:00 Julien BOURDET, Claudio Delle Piane, Chen Qiu, Martin Frenz
Investigation of monophasic water inclusions in
quartz cement: An example from the Triassic Lesueur Sandstone
aquifer, Perth Basin, Australia
2:20 Eszter SENDULA, Benjamin C. Gill, J. Donald Rimstidt, Tim K.
Lowenstein, Javier García-Veigas, Robert J. Bodnar
Redox evolution of seawater in the Late-Permian Zechstein Basin:
implications from redox-sensitive trace elements in fluid inclusions
in halite
*[(Min ZHANG, Guangxi Ou
Application of fluid inclusions to study shale hydrocarbon: A case
study of Shaxin Well #2 on the southwestern margin of the
Paleogene Qaidam Basin, northwest China)]
2:40 Volker LÜDERS, Johannes Schoenherr, Marta Sośnicka
Origin of CO2-rich Zechstein-2-Carbonate-hosted gas reservoirs in
the Lower Saxony Basin, NW Germany
3:00 Break
Session Chair: Steve Becker
3:20 Sandra SILJESTRÖM, Robert Pottorf, Sebastien Dreyfus, Stephen P.
Becker
Determination of source rock facies of oils
trapped in single inclusions by ToF-SIMS

Pan-American Current Research on Fluid Inclusions Rice University, Houston, Texas, U.S.A., June 12-14, 2018, Abstract Volume
11
3:40 Alexy ELIAS BAHNAN, J. Pecqueur, J. Pironon, C. Carpentier, E.C.
Gaucher, S. Calassou, A. Virgone
Diagenesis and fluid-rock interactions in the Upper Lacq
carbonate petroleum reservoir, Southwestern France
4:00 Marta SOŚNICKA, Volker Lüders
Fluid inclusion evidence for methane-dominated
thermochemical sulfate reduction in the North German Basin
4:20 Julien BOURDET, Richard Kempton
Attributes of petroleum inclusion assemblages for unravelling
charge history
4:40 Edwin D. WADDINGTON
Fluid inclusions in ice
5:30 Icebreaker + Poster presentations
- Keith-Wiess Geological Labs
Session 2: Theoretical/Analytical/Experimental Advances
Session Chair: András Fall
9:00 Zoltán ZAJACZ, Alexandra Tsay, Nuur Ghazali
The fate of sulfur at the magmatic-hydrothermal
transition in the porphyry ore-forming environment
9:40 Guillaume Barré, Raymond MICHELS, Laurent Truche, Valérie Burklé-
Vitzthum, Catherine Lorgeoux
Geochemistry alive: How natural fluid inclusions and capillary
reactors help unravel sulfur reactivity during Thermochemical
Sulfate Reduction
10:00 Hector M. LAMADRID, Zoltán Zajacz
Rates of serpentinization in pyroxene micro-
reactors

Pan-American Current Research on Fluid Inclusions Rice University, Houston, Texas, U.S.A., June 12-14, 2018, Abstract Volume
12
10:20 Break
Session Chair: Martin Appold
10:40 Dan Marshall, Brandon Boucher, Chris McFarlane
On the use of LA-ICP-MS spectrometry chemical mapping to
identify the relative timing of healed mineral fractures and
contained fluid inclusion assemblages
*[(Matthew STEELE-MACINNIS, Kyle T. Ashley, Drew W. Barkoff
Mineral inclusion thermobarometry: A new
approach to estimate the temperatures and pressures of
hydrothermal ore formation)]
11:00 D. Matthew SUBLETT Jr., Hector. M. Lamadrid, Matthew Steele-
MacInnis, Georg Spiekermann, Robert J. Bodnar
N2, CO2, and CH4 fugacities determined for gas mixtures from 10-
500 bars at 22 °C using Raman spectroscopy
11:20 Yury I. KLYUKIN, Robert J. Bodnar
P-T paths of H2O-NaCl fluid inclusions during heating to the
homogenization temperature
11:40 Discussion
*[(Matthew STEELE-MACINNIS
A model for composition and density of H2O-NaCl-CO2 fluid
inclusions)]
12:00 Lunch
Session 3: Melts/Magmas/Volcanoes
Session Chair: Dan Marshall
1:30 Jim WEBSTER
Reassessing Cl in melt inclusions: New insights on
magma and magmatic fluid geochemistry based on Cl solubility
in silicate melts
2:10 Celestine N. MERCER, Kathryn E. Watts, Albert H. Hofstra, Zoltán
Zajacz, Matthew A. Coble
Metal and volatile budget of rhyolite magmas
coincident with Nevada’s world-class Carlin-type gold deposits

Pan-American Current Research on Fluid Inclusions Rice University, Houston, Texas, U.S.A., June 12-14, 2018, Abstract Volume
13
2:30 Tibor Guzmics, Márta BERKESI, Ralf Milke, Csaba Szabó
A new approach to understand
natrocarbonatite formation based on melt and fluid inclusions
from the Kerimasi volcano, Tanzania
2:50 Lowell R. MOORE, Esteban Gazel, Robert J. Bodnar
The volatile budget of Haleakala (Maui): New insights from melt
inclusions
3:10 Break
Session Chair: Zoltán Zajacz
3:30 Megan E. NEWCOMBE, Alexander S. Lloyd, David Ferguson, Anna
Barth, Erik Hauri, Terry A. Plank
The melt inclusion record of the final countdown
to eruptions
3:50 Michael ZOLENSKY, Queenie H.-S. Chan, Yoko Kebukawa, Robert J.
Bodnar, Marc Fries
Fluid inclusions in Astromaterials: Direct samples
of early solar system aqueous fluids
4:30 Philip E. BROWN
31 years of PACROFI
6:00-9:00 Conference Dinner
- The Café at The Museum of Fine Arts
Session 4: Fluid Inclusions in Ore Deposits
Session Chair: Julien Bourdet
9:00 Adam C. SIMON, Jaayke Knipping, Martin Reich, Fernando Barra,
Artur P. Deditius, Laura Bilenke, Tristan Childress1
A magmatic flotation model that genetically links
iron oxide–apatite (IOA) and iron oxide–copper–gold (IOCG)
deposits

Pan-American Current Research on Fluid Inclusions Rice University, Houston, Texas, U.S.A., June 12-14, 2018, Abstract Volume
14
*[(Pilar LECUMBERRI-SANCHEZ, Christoph A. Heinrich, Markus Wälle,
Marta Codeço, Phillip Weis, Marta Sośnicka, Filipe Pinto
Genetic relationship between mineral
paragenesis, fluid chemistry and fluid source in a tungsten vein
deposit: Panasqueira)]
9:40 John RIDLEY
Different modes of fluid phase separation in a single hydrothermal
fluid?
10:00 Martin S. APPOLD, Emalyn R. Glastetter
Determination of sulfur concentration in fluid inclusions through
SEM-EDS analysis of fluid inclusion decrepitates: Application to the
Illinois-Kentucky Mississippi Valley-type district
10:20 Wyatt M. BAIN, Matthew Steele-MacInnis, Frank K. Mazdab, Erin
Marsh
Aqueous brines and carbonate melts represented by inclusions in
apatite from the Buena Vista iron–oxide apatite deposit, Nevada
10:40 Break
Session Chair: Bob Bodnar
11:00 Adam SIMON
Basaltic underplating and the evolution of redox gradients in
systems: implications for porphyry deposits
*[(Pilar LECUMBERRI-SANCHEZ, M. Bouabdellah, O. Zemri
Fluid inclusion characteristics at the El Hammam REE-rich fluorite
deposit)]
11:20 Dan MARSHALL, Gaston Giuliani, Lara L. Loughrey
Stable isotope disequilibrium in zoned emeralds
precipitated from two phase fluids at chemical equilibrium?
12:00 Discussions and Business Meeting
12:30 Meeting Adjourned; Field trip departs to West Texas

Pan-American Current Research on Fluid Inclusions Rice University, Houston, Texas, U.S.A., June 12-14, 2018, Abstract Volume
15
Presented Tuesday at the Icebreaker, then posted for the rest of
the meeting in Sewall Hall 301
Hanna L. Brooks, Matthew STEELE-MACINNIS
A new model for the solubility of common rock-forming minerals
in saline aqueous fluids up to 1100 °C and 20 kbar
Michael H. DECINDIS, Matthew Steele-MacInnis
Low-temperature phase equilibria of saline aqueous systems
containing carbonate, bicarbonate and other anions
Hunter R. EDWARDS, D. Matthew Sublett Jr., Robert J Bodnar
An investigation of the phase behavior and composition of the
surface and crust of Titan using Synthetic Fluid Inclusions
combined with Raman spectroscopy
Stephanie R. FORSTNER, Stephen E. Laubach, András Fall
Evolution of deformation in the Buck Mountain Fault damage
zone, Cambrian Flathead Sandstone, Teton Range, WY
Jordan JENSEN, Paulo Coutinho, Oscar Laurent, Jon Spencer, Matthew Steele-
MacInnis
Microthermometric and LA-ICP-MS measurements of hematite-
hosted fluid inclusions reveal the temperature and composition of
ore-forming fluids, Buckskin-Rawhide Mountains, western Arizona,
USA
Jan Braly KIHLE, Jørn Harald Hurum, Lene Liebe
Liquid hydrocarbons in intracellular mineral precipitates in the
vertebrae of a Jurassic marine reptile – animal or petroleum
origin?
Sarah E. SMITH-SCHMITZ, Martin S. Appold
Determination of F concentrations in ore-stage MVT fluids through
SEM-EDS analysis of fluid inclusion decrepitates
Heather M. VANDERGRIFT, Robert J. Bodnar Maxim Gavrilenko, Michael
Krawczynski
Analysis of water content in melts (silicate glass) using Raman
spectroscopy
Qiqi WANG, Stephen E. Laubach, András Fall
Unraveling the history of ultra-deep fractures in sedimentary
basins

Pan-American Current Research on Fluid Inclusions Rice University, Houston, Texas, U.S.A., June 12-14, 2018, Abstract Volume
16

Pan-American Current Research on Fluid Inclusions Rice University, Houston, Texas, U.S.A., June 12-14, 2018, Abstract Volume
17

Pan-American Current Research on Fluid Inclusions Rice University, Houston, Texas, U.S.A., June 12-14, 2018, Abstract Volume
18

Pan-American Current Research on Fluid Inclusions Rice University, Houston, Texas, U.S.A., June 12-14, 2018, Abstract Volume
19
Determination of sulfur concentration in fluid inclusions through SEM-
EDS analysis of fluid inclusion decrepitates: Application to the
Illinois-Kentucky Mississippi Valley-type district Martin S. APPOLD, Emalyn R. GLASTETTER Department of Geological Sciences, University of Missouri, Columbia, Missouri, U.S.A. E-mail: [email protected]
Sulfur plays a fundamental role in the precipitation of Mississippi Valley-type (MVT) ore deposits but its concentration in MVT ore fluids is not well known. In order to determine the mechanism of precipitation of base metal sulfide minerals in MVT deposits, whether anomalously sulfur-rich fluids are needed to form MVT ore deposits, and how much time is needed to form MVT ore deposits, the sulfur content of MVT ore fluids must be known.
Sulfide minerals in MVT deposits have long been considered to precipitate according to one or more of the following general precipitation mechanisms: (1) Mixing of a metal-rich, sulfide-poor fluid with a metal-poor, sulfide-rich fluid, (2) reduction of sulfate in a fluid rich in metals, (3) cooling, pH increase, or dilution of a fluid carrying both metals and sulfide at relatively low concentrations. By characterizing the spatial and temporal variation of ore fluid sulfur concentration in a MVT deposit, the operating precipitation mechanism should be identifiable. This can potentially be accomplished by determining sulfur concentration in fluid inclusions hosted by non-sulfide minerals from various locations and paragenetic stages in a MVT deposit.
The Illinois-Kentucky district is a favorable site in which to test this approach because the district contains numerous distinct stages of fluorite that precede, overlap, and post-date sulfide minerals in the paragenetic
sequence (Fig. 1). Thus, if fluid inclusions throughout the fluorite paragenesis and throughout the district were consistently found to have low sulfur concentrations, then this would suggest that base metals and sulfide were transported together in solution and precipitated due to local cooling, pH change, or dilution. Cooling and dilution are both allowed, though not definitely identified, by previously published microthermometry data (Pelch et al., 2015 and references therein). If both high-sulfur and low-sulfur populations of fluid inclusions were found, then this would point to either the mixing or sulfate reduction precipitation mechanisms. These two precipitation mechanisms could be distinguished from one another by using Raman spectroscopy to determine whether the sulfur was in the form of sulfate or sulfide.
Figure 1. Paragenetic sequence of bedding
replacement MVT mineralization in the
Illinois-Kentucky district (after Richardson and
Pinckney, 1984 and Hall and Friedman, 1963).

Pan-American Current Research on Fluid Inclusions Rice University, Houston, Texas, U.S.A., June 12-14, 2018, Abstract Volume
20
Sulfur is an element whose concentration is difficult to quantify reliably using LA-ICP-MS, a technique that
has been used successfully for in situ measurement of concentration of many other elements in fluid inclusions.
However, SEM-EDS analysis of evaporative solute mounds formed by fluid inclusion decrepitation is a promising
alternative for measuring sulfur and has begun to be used in the present study. In order to calibrate the SEM-EDS
signal, six standard ore solutions were prepared to allow actual sulfur concentrations in fluid inclusions to be
determined from sulfur concentrations in evaporative solute mounds measured by SEM-EDS. These standard
solutions contain known concentrations of sulfur of 10, 50, 100, 500, 1000, and 5000 ppm, and the major element
(Na, Ca, K, Mg, Cl) composition of the Illinois-Kentucky ore fluid inclusions based on the LA-ICP-MS study of Pelch et
al. (2015). Droplets of standard solutions were placed onto clean polished fluorite samples and allowed to
evaporate, generating solute mounds. Solute mounds were analyzed using SEM-EDS under the same conditions
used for the natural samples, creating a calibration relationship that allowed for the S/Cl ratio in the fluid inclusions
from natural samples to be calculated from the measured S/Cl ratio of standard ore solutions. Compositional
analysis of evaporative solute mounds is being carried out using a Sigma 500 VP SEM in the Department of Geological
Sciences at the University of Missouri—Columbia. Tests so far show the detection limit for sulfur in fluid inclusions
to be between 10 and 50 ppm.
To date, fluid inclusions from two early fluorite stages (P1 and Y2 fluorite) from the Cave-in-Rock subdistrict
have been analyzed. Fluid inclusion sulfur concentration in P1 fluorite was found to be about 40 ppm and in Y2
fluorite to be about 110 ppm. These sulfur concentrations lie within the range typical of sedimentary brines (Hanor,
1998). Over the pH range of 4 to 5.5 typical of MVT ore-forming brines, these sulfur concentrations, if in the form
of sulfide, could coexist in solution with up to 10’s of ppm Zn. Thus, a regional sedimentary brine that delivered
sulfur and base metals to the Illinois-Kentucky district would have been a relatively fertile ore fluid. However, work
by Kenderes and Appold (2017) suggests that sulfide mineralization in the Illinois-Kentucky district formed at very
low pH values between 0 and 1, based on the high F concentration in sphalerite-hosted fluid inclusions, though these
low pH values would have been localized to sites where magmatic HF was being titrated into the regional
sedimentary brine system via faults. One way to overcome the greatly increased solubility of sulfide minerals at
such low pH is to increase the concentration of aqueous sulfide in the ore fluid. This is a hypothesis that will be
tested in future work by analyzing fluid inclusions from later fluorite stages that paragenetically overlap sulfide
minerals.
REFERENCES
Hall W. E. and Friedman I. (1963) Composition of fluid inclusions, Cave-in-Rock fluorite district, Illinois, and Upper
Mississippi Valley zinc-lead district: Economic Geology 58, 886–911.
Hanor, J. S. (1998) Geochemistry and origin of metal-rich brines in sedimentary basins, in, Pongratz, J. and
McGoldrick, P. (eds.) Basins, fluids and Zn-Pb ores: University of Tasmania, Centre for Ore Deposit Research
(CODES), Special Publication 2.
Kenderes, S. M., Appold, M. S. (2017) Fluorine concentrations of ore fluids in the Illinois-Kentucky district: Evidence
from SEM-EDS analyses of fluid inclusion decrepitates: Geochimica et Cosmochimica Acta 210, 132-151.
Pelch, M. A., Appold, M. S., Emsbo, P., Bodnar, R. J. (2015) Constraints from fluid inclusion compositions on the origin
of Mississippi Valley-type mineralization in the Illinois-Kentucky district: Economic Geology 110, 787–808.
Richardson, C. K. and Pinckney, D. M. (1984) The chemical and thermal evolution of the fluids in the Cave-in-Rock
fluorspar district, Illinois: mineralogy, paragenesis, and fluid inclusions: Economic Geology 79, 1833–1856.

Pan-American Current Research on Fluid Inclusions Rice University, Houston, Texas, U.S.A., June 12-14, 2018, Abstract Volume
21
Aqueous brines and carbonate melts represented by Inclusions in
apatite from the Buena Vista iron-oxide apatite deposit, Nevada Wyatt M. BAIN1, Matthew STEELE-MACINNIS1, Frank K. MAZDAB2, Erin MARSH3 1Department of Earth & Atmospheric Sciences, University of Alberta, Edmonton, Alberta, Canada 2Department of Geosciences, University of Arizona, Tucson, Arizona, U.S.A. 3U.S. Geologic Survey, Denver, Colorado, U.S.A. Email: [email protected]
Genetic models for iron-oxide-apatite (IOA) deposits span a spectrum between magmatic and hydrothermal end
members. Magmatic models typically involve the immiscible formation of an Fe-oxide phosphate magma from a
silicate melt of felsic to intermediate (or, less commonly, mafic) affinity (Nyström and Henriquez, 1994) and
subsequent formation of voluminous Ca-Na alteration by hydrothermal fluids of magmatic or basinal origin (Tornos
et al., 2017; Harlov et al., 2016; Westhues et al., 2016; Chen et al 2010). In contrast, hydrothermal models of IOA
formation involve the formation of Ca-Na alteration and Fe mobilization by hydrothermal fluids of magmatic, basinal,
or metamorphic origin which have equilibrated with Fe-rich magmas or leached Fe from country rocks (Johnson and
Barton, 2000; Hunt et al., 2007; Richards and Mumin, 2013).
The Buena Vista deposit (Pershing County, Nevada) has been reported as an example of hydrothermal IOA
mineralization. This IOA deposit is associated with gabbros which intruded late-Triassic to early-Jurassic basalts,
carbonates, and evaporities during mid-Jurassic back-arc extension. Johnson and Barton (2000) interpreted the IOA
mineralization in this deposit as being related to amagmatic fluids of basinal affinity. This interpretation is based on
cross-cutting relationships between ores and altered lithologies, petrographic observation of brine-rich fluid
inclusions, and mass-balance constraints between altered rocks and magnetite ores.
Here we present petrographic observations, microthermometry, Raman analyses, EDS maps, and laser
ablation ICPMS data from apatite and clinochlore-hosted fluid inclusions from massive magnetite (+apatite) ore
(magnetite ore) and carbonate (+apatite) vein (carbonate veins) assemblages in the Buena Vista deposit. Magnetite
ore and carbonate vein assemblages host abundant aqueous brines which form coeval assemblages with
polycrystalline inclusions composed of carbonate (calcite or siderite), Fe- and Ti-oxides, and variable amounts of Si-
and Al- rich phases (± H2O) (Figure 1). Primary and secondary aqueous inclusions from magnetite ores and carbonate
veins are primarily halite-bearing, show consistent microthermometric behavior (first ice melting observed from -60
to -45°C, vapor dissolution from 90 to 140°C, and homogenization by halite melting at ~245-285°C) and have salinities
from 36-38 wt% NaCl equivalent. During heating, polycrystalline inclusions showed onset of melting at ~400°C and
were mostly molten at ~800°C. Residual phases present above 850°C did not appear to melt with further heating
and included red or opaque granules, which were interpreted as hematite plus an unidentified translucent phase.
Laser ablation IPCMS analysis showed that aqueous brine inclusions are dominated by Na-K-Ca, similar to
fluids reported in other IOA environments. Brines associated with the magnetite ores are strongly depleted in Fe
and K and are compositionally similar to basinal fluids (Yardley, 2005), while brines associated with carbonate veins
are relatively enriched in K, Fe, and B, suggesting a magmatic affinity. Polycrystalline inclusions contain abundant Fe,
Al, and Mg, with lesser K, Ti, V, Mn, and Cu. This correlates well with EDS maps which show discrete Fe, Al, and Ti
phases in breached polycrystalline inclusions. In addition, ICPMS analysis showed that major element ratios within
temporally related inclusion groups show little variability and have not been altered by post-entrapment water loss
or ion diffusion.
Coeval assemblages of polycrystalline inclusions and aqueous brines, such as those reported in porphyry
systems, are commonly interpreted to represent the coexistence of immiscible fluid phases (melt and aqueous fluid).
Similarly, the coexistence of brine and carbonate-dominated polycrystalline inclusions in the Buena Vista system
indicates that an aqueous brine and a carbonate liquid coexisted immiscibly during the formation of magnetite ores
and carbonate veins. The primary implication of these results is therefore that Buena Vista – previously interpreted
as a hydrothermal end-member of IOA formation – is actually a hybrid magmatic-hydrothermal system wherein
carbonate melts coexisted with aqueous brines. Furthermore, data presented here indicate that Fe, Al and other

Pan-American Current Research on Fluid Inclusions Rice University, Houston, Texas, U.S.A., June 12-14, 2018, Abstract Volume
22
nominally insoluble elements were partitioned into the carbonate liquid rather than the coexisting brine. This
suggests that the carbonate liquid might have played an important role in promoting element mobility during the
formation of both the magnetite-apatite and carbonate-vein assemblages.
REFERENCES
Chen, H. et al. (2010) The Marcona magnetite deposit, Ica, south-central Peru: A product of hydrous, iron oxide-rich
melts? Econ. Geol. 105, 1441-1456.
Harlov, D.E. (2016) Mineralogy, chemistry, and fluid-aided evolution of the Pea Ridge Fe oxide-(Y+REE) deposit,
Southeast Missouri, USA, Econ. Geol. 111, 1963-1984.
Hunt, J.A. et al. (2007) A review of iron oxide copper-gold deposits, with focus on the Wernecke breccias, Yukon,
Canada, as an example of a non-magmatic end member and implications for IOCG genesis and classification, Exp and
Mining Geol. 16, 209-232.
Johnson, D.A., Barton, M.D. (2000) Time-space development of an external brine-dominated, igneous-driven
hydrothermal system; Humboldt mafic complex, western Nevada. Soc of Econ Geol Guidebook Series. 32, 127-144
NystrÖm, J.O., Henriquez, F. (1994) Magmatic features of iron ores of the Kiruna type in Chile and Sweden: Ore
textures and magnetite geochemistry, Econ. Geol. 89, 820-839.
Richards, J.P., Mumin, A.H. (2013) Magmatic-hydrothermal processes within an evolving Earth: Iron oxide-copper-
gold and porphyry Cu Mo Au deposits, Geology. 41, 767–770.
Tornos, F. et al. (2017) The magmatic to magmatic-hydrothermal evolution of the El Laco deposit (Chile) and Its
implications for the genesis of magnetite-apatite deposits, Econ. Geol. 112, 1595-1628
Westhues, A. et al. (2016) New Constraints on the timing of host-rock emplacement, hydrothermal alteration and
iron oxide-apatite mineralization in the Kiruna district, Norrbotten, Sweden, Econ. Geol. 111, 1595-1618
Yardley, B.W. (2005) Metal concentrations in crustal fluids and their relationship to ore formation, Econ. Geol. 100,
613–632.
Figure 1. a) Raman spectra for carbonate and Fe-oxides from an apatite-hosted polycrystalline inclusion (PI)
shown in the corresponding photomicrograph. Note the coexisting brine fluid inclusion (FI) in the bottom
right side of the photomicrograph. b) Backscatter electron image of a breached polycrystalline inclusion
showing a hematite crystal and carbonate adhered to the margins of the inclusion.

Pan-American Current Research on Fluid Inclusions Rice University, Houston, Texas, U.S.A., June 12-14, 2018, Abstract Volume
23
Geochemistry alive: How natural fluid inclusions and capillary reactors
help unravel sulfur reactivity during Thermochemical Sulfate
Reduction Guillaume BARRÉ1, Raymond MICHELS1, Laurent TRUCHE2, Valérie BURKLÉ-VITZTHUM3, Catherine LORGEOUX1 1GeoRessources Lab, CNRS, Université de Lorraine, Nancy, France 2ISTerre, Grenoble, France 3LRGP CNRS, ENSIC, Université de Lorraine, France
E-mail: [email protected]
Sulfur chemistry plays an important role in geochemical processes. Indeed, depending on physico-chemical
conditions the various oxidations states of sulfur (from S-II to S+VI) lead to great variety of minerals, aqueous species
as well as organic compounds. Sulfur chemistry is thus implied in major geological cycles and involved in the
formation of ore and evolution of hydrocarbons deposits. Among the many possible chemical reactions,
thermochemical sulfate reduction (TSR) has attracted specific attention. A general reaction for TSR may be written
as:
SO42- + 1.33 CH2 + 0.66 H2O = H2S + 1.33 CO2 + 2 OH-
This process implies mineral as well as organic matter and triggers complex reaction mechanisms in both the
aqueous and the organic phases.
A major difficulty to study TSR in natural fluids is to collect solid, aqueous, organic, gaseous phases in
equilibrium at geological pressure-temperature. This is why TSR is seldom studied in situ of geological settings.
Laboratory experimentation is thus the most common approach and most published data deal with post-
experimentation fluid compositions. The actual sulfur reactivity and speciation within natural fluid compositions and
at geological temperature and pressure is therefore not commonly investigated.
In order to study organic-mineral reactivity during TSR and understand the chemical mechanisms involved,
we developed a strategy using natural fluid inclusions, capillary reactors as well as gold cell reactors. Natural fluid
inclusions were collected in the French Alps (evaporites deposits of the Carnian “Nappe des Gypses” formation
located in the Arc Valley). Experiments of TSR were conducted in capillary reactors while sulfur reactivity in the
organic phase was studied using gold cell reactors as to complete geochemical information. Analyses were
performed by Raman spectroscopy, FTIR, GC-MS. Objective was to document as precisely as possible the speciation
and reactive pathways of sulfur in the aqueous, gaseous and organic phases.
Natural fluid inclusions from the “Nappe des Gypses” formation hosted in quartz, albite, fluorite revealed
the presence of a two liquid-gas system composed of NaCl, CaCl2, SO42-
, S8, H2S, CO2, N2±CH4, traces of hydrocarbons
with sometimes the presence of solids (native sulfur and halite). Salinities range from 26 to 60 wt% eq NaCl with a
mean at 31wt%eq NaCl. Homogenization temperatures range from 98°C to 355°C depending on their trapping
conditions during the Alpine exhumation.
The study of sulfur speciation within the fluid inclusions at 25°C reveals mainly the presence of SO42- as well
as S8 in the aqueous phase and H2S in the gas phase. The study under progressive heating above 100°C evidenced
the presence of significant amounts of the metastable S3- radical ion species in the aqueous phase within a fluid at
typical P-T conditions of TSR. While this species had been identified in previous experimental work this is the first
evidence of the importance of this radical ion in a natural geological fluid.

Pan-American Current Research on Fluid Inclusions Rice University, Houston, Texas, U.S.A., June 12-14, 2018, Abstract Volume
24
Figure 1. Red spectrum: First detection of the S3
- radical ion in the aqueous phase of natural fluid inclusions hosting
TSR reactants and products. Blue and green spectra: study of sulfur speciation partitioned between aqueous and
organic phases during TSR experimentation in silica capillary reactor.
Silica capillary reactors were loaded with either S8 + Na2SO4 or Na2S2O3 aqueous solution in the presence of
octane and heated at temperatures ranging between 200 and 350°C. Estimated pressure was about 200 bars. Each
phase present in the capillary was monitored using Raman and FTIR as to identify reacting species. During heating,
S8 is in equilibrium between octane and aqueous phase until all is disproportionated into SO42- and H2S. H2S as
reaction product was detected in water, octane and gas. The S3- radical was detected in the aqueous phase only and
quantified.
The detection of polysulfides as well as the S3- radical ion at significant concentrations during heating in the
aqueous phase is strong evidence of the role of sulfur at intermediate valence during TSR. Yet, S3- was not detected
in the octane phase. In order to identify octane sulfurization reactions in the organic phase, we conducted pyrolysis
studies of octane in the presence of H2S (the most abundant sulfur species detected in the organic phase) using gold
cell reactors. Post-run analysis allowed to identify the formation of sulfur bearing hydrocarbon species. These results
lead to propose reaction mechanisms of formation specific to the organic phase.
While the study of alpine fluid inclusions evidenced the importance of the S3- radical ion in the TSR reaction
of natural geological fluids at specific P-T conditions, the use of capillary reactors allowed to investigate the 3 phases
water-hydrocarbon-gas system during heating. The nature, concentration and phase distribution of chemical species
could therefore be constrained. Specific study of the reactivity of the octane phase in the presence of H2S brought
an independent view on the organic reactivity. Main conclusions from our work show that sulfur reactivity during
TSR necessitates to investigate the aqueous, hydrocarbon and gas phases during experimentation in which the
nature and distribution of major reacting species may be monitored. Specific reaction pathways have been identified
in the aqueous and hydrocarbon phases which involved different reaction mechanisms with specific sulfur species.
Efforts still need to be developed as to conceal the reaction formalisms as to describe the reactivity of the whole
system and eventually access kinetic modeling.

Pan-American Current Research on Fluid Inclusions Rice University, Houston, Texas, U.S.A., June 12-14, 2018, Abstract Volume
25
Fluid inclusion tools in petroleum systems analysis Stephen P. BECKER ExxonMobil Upstream Research Company, Houston, Texas, U.S.A. E-mail: [email protected]
A petroleum system is a linked group of play elements
comprising a mature source rock, migration pathway,
reservoir, trap, seal, and the temporal and spatial
distribution of these elements that allow for the
accumulation of hydrocarbons in the subsurface (Magoon
and Dow, 1994). Successful exploration for economic
quantities of hydrocarbons requires adequate
understanding of the risk that one or more of these play
elements is insufficient and/or mistimed. As such, we
dedicate significant effort, both pre- and post-drill to de-
risk play elements based on available data and/or
conceptual models, which are integrated to make
business decisions on acreage acquisition and/or future
well location.
Because fluid inclusions provide a unique
opportunity to study the composition and distribution of
fresh, uncontaminated hydrocarbons in a petroleum
system over time, they are an important tool we use to
help de-risk hydrocarbon systems. At ExxonMobil, we
employ a workflow that begins with rapid and cheap
screening of samples for the likely presence of hydrocarbon inclusions beginning with the Fluid Inclusion Volatiles
(FIV) mass spectrometry technique. More than simply telling us that hydrocarbons inclusions are or aren’t present
in any given sample, we screen cuttings and/or core in depth profile to produce a pseudo-well log of paleo-
hydrocarbon migration and relative sealing capacity (Fig. 1). Generally, we observe that intensity of FIV response
scales with robustness of a hydrocarbon system, and
distribution of hydrocarbon components that
directionally scales with hydrocarbon composition.
Beyond the FIV technique, we often proceed
with optical fluid inclusion petrography and
microthermometry to identify fluid inclusion
assemblages (Goldstein and Reynolds, 1994) that are
relevant to the types of problems we want to solve. In a
“dry” hole, did hydrocarbons ever move through these
rocks? What is the likelihood of oil vs. gas? What was the
maximum burial temperature? What is the composition
of hydrocarbons? Has the composition changed over
time? Is it possible that hydrocarbons have been
significantly altered?
Towards answering compositional questions,
we maintain the ability to conduct microanalysis of the
PVTX properties of hydrocarbon inclusions (Fig. 2). This
includes spectroscopic methods such as fluorescence
and/or Raman, and confocal laser scanning microscopy
Figure 1. Fluid Inclusion Volatiles data, Conaghan 5-
1 well, Oregon Basin field, Bighorn Basin, Wyoming
Figure 2. Oil inclusion in quartz, Belochistan, Pakistan

Pan-American Current Research on Fluid Inclusions Rice University, Houston, Texas, U.S.A., June 12-14, 2018, Abstract Volume
26
(e.g. Aplin et al., 1999; Tseng and Pottorf, 2002). Ultimately, in characterizing the composition and phase behavior
of hydrocarbon inclusions, we can place this in a relative timing framework from the petrography, and then constrain
absolute timing with a calibrated basin model.
Compared to academic studies, our workflow isn’t fundamentally that different from how typical fluid inclusion studies are conducted. However, the short scale of time and large scale of money involved in petroleum exploration necessitates rigorous QA/QC and fact-based interpretation of our data, and also integrate with many independent indicators of petroleum systems play element risk.
REFERENCES
Aplin, A.C., Macleod, G., Larter, S.R., Pedersen, K.S., Sorensen, H., and Booth, T. (1999) Combined use of Confocal
Laser Scanning Microscopy and PVT simulation for estimating the composition and physical properties of
petroleum in fluid inclusions, Marine and Petroleum Geology, 16, 97-110.
Goldstein, R.H. and Reynolds, T.J. (1994) Systematics of fluid inclusions in diagenetic minerals, SEPM Short Course
31, 199p.
Magoon, L.B. and Down, W.G. (1994) The Petroleum System – From Source to Trap, AAPG Memoir 60, 665p.
Tseng, H. and Pottorf, R.J. (2002) Fluid inclusion constraints on petroleum PVT and compositional history of the
Greater Alwyn—South Brent petroleum system, northern North Sea, Marine and Petroleum Geology, 19, 797-809.

Pan-American Current Research on Fluid Inclusions Rice University, Houston, Texas, U.S.A., June 12-14, 2018, Abstract Volume
27
Invited – Investigation of the monophasic water inclusions in quartz
cement: An example from the Triassic Lesueur Sandstone aquifer,
Perth Basin, Australia Julien BOURDET 1, Claudio DELLE PIANE1, Chen QIU2, Martin FRENZ2 1CSIRO Energy, Bentley, Western Australia, Australia 2Institute of Applied Physics, University of Bern, Bern, Switzerland E-mail: [email protected]
The Middle to Late Triassic Lesueur Sandstone in the southern part of the Perth Basin, Western Australia, is constituted by fluvial to shallow marine siliciclastic units currently being evaluated as a possible target for geosequestration of CO2. The Lesueur Sandstone can be differentiated into a 700m thick sand, siltstone and claystone unit, the Yalgorup Mbr (Upper Lesueur) and a 1500 m thick sandstone dominated unit, the Wonnerup Member (Lower Lesueur). The CO2 containment strategy relies on dissolution and residual trapping mechanisms within the Lesueur Sandstone as the primary mechanism and the effectiveness of the Yalgorup Mbr and overlying Eneabba Formation (Lower Jurassic) to act as a secondary barrier for mobile CO2 (Stalker et al., 2013).
The upper section of the Wonnerup Mbr is dominated by quartzo-feldspathic sandstones showing good reservoir quality and permeability. Petrographic analysis of deeper section indicate a significant effect of diagenesis on reservoir quality. Porosity and permeability are strongly reduced with increasing depth via precipitation of pore occluding clay minerals and deposition of quartz overgrowth. Understanding the quartz cementation mechanism in different part of the reservoir unit is critical for injection, storage capacity and plume movement prediction in this semi-open aquifer. Moreover, an exhumation of the area of at least 1 km has been evaluated based on wireline logging sonic transit time-depth trends analysed across the basin (Olierook and Timms, 2016). The fluid inclusion data in quartz overgrowths are also expected to improve the understanding of the burial history of the formations. To this end, quartz cementation was investigated using petrographic and fluid inclusions techniques in sandstone samples from both the Wonnerup and the Yalgorup Mbrs, from four wells (Harvey-1, Harvey-2, Harvey-3 and Harvey-4) located on the structural high known as the Harvey Ridge and one well (Pinjarra-1) located 40 km north where the Lesueur Sandstone is deeply buried.
Initial observations indicated that in many cases, the water inclusions trapped in quartz cements were monophasic at room temperature (Figure 1) and even cooling treatments failed to nucleate bubbles in order to derive temperature using microthermometric methods. Therefore, an amplified femtosecond laser system (Coherent) at University of Bern (Switzerland) was used to stimulate vapour bubble nucleation in the metastable liquid state of the inclusions by means of single ultrashort laser pulses allowing for measurements of homogenisation temperatures. For a detailed description of the setup we refer to Krüger et al. (2007). The samples from Pinjarra-1 were not investigated using this technique. Salinities were measured using Raman spectroscopy technique. No dissolved gas was detected using Raman spectroscopy, dissolved in the water or in the bubble of a limited number of inclusions.
Homogenisation temperatures (TH) of 39°C to 115°C were measured in samples from Harvey 1-4. Temperature histograms for the samples from the Yalgorup and the Wonnerup Mbrs are presented in Figure 2. The histograms are skewed toward higher temperature commensurate with sample depth. The shallowest samples indicate, after pressure correction, that the quartz cementation process
Figure 1. Monophasic water inclusions at quartz-
overgrowth boundary from a sandstone sample. Harvey-2
well at 1245.15 mRT.

Pan-American Current Research on Fluid Inclusions Rice University, Houston, Texas, U.S.A., June 12-14, 2018, Abstract Volume
28
started below 50°C. The deeper samples present higher minimum temperatures. In the deep samples from Pinjarra-1, where monophasic water inclusions were not detected or investigated carefully, those low temperatures are absent of the histogram. Assuming that quartz cementation started for all samples at a fixed temperature of about 50°C and continued with burial, these results suggest that the lowest TH water inclusions re-equilibrated with increasing temperature during burial. The resulting fluid inclusion dataset can then not be used for deriving the temperature of initiation of quartz cementation.
Figure 2 shows temperature windows of expected TH for water inclusion entrapment at current sample depths and with an additional burial of 1200 m. The TH lower than this interval indicate cementation at shallower depth. Most TH values can be reconciled with this uplift history. The minimum TH value in each cases seems to carry a geological meaning, either in term of initiation of quartz cementation (shallow samples) or equilibrium to current conditions (deep samples).However, most samples have some water inclusions with higher TH values. These water inclusions can either have been generated by overheating and stretching low TH inclusions, or they can be a marker of fast fluid circulation from deeper fluids, facilitated by deformation and faulting episode.
Salinities ranged between <5,000 ppm to 70,000ppm with a bimodal histogram at 15,000-25,000 ppm and 35,000-45,000 ppm. The salinity values are consistent with the formation water being derived from connate water in fluvial to shallow marine paleo-environments. A TH versus salinity cross-plot shows that most of the data generated can be contained in a restricted interval of temperature and salinity. The anomalous high TH values appear as a broad cluster of data points outside this restricted interval, sitting at higher temperature values. This cluster does not show trends and therefore does not seem to be consistent with a deep fluid source. These fluid inclusions are likely to have been generated by overheating and stretching low TH inclusions.
Overall, the use of femto-second laser system to stimulate vapour bubble nucleation in monophasic inclusions allowing for the measurements of their homogenisation temperatures revealed to be successful. It also provided clues about how to interpret fluid inclusion data for understanding quartz cementation and burial history.
REFERENCES
Krüger, Y. et al. (2007) Femtosecond lasers in fluid-inclusion analysis: overcoming metastable phase states. European Journal of Mineralogy, 19(5), 693-706. Olierook, H.K.H., Timms N.E. (2016) Quantifying multiple Permian-Recent exhumation events during the break-up of eastern Gondwana: Sonic transit time analysis of the central and southern Perth Basin. Basin Research 28, 796-826. Stalker, L. et al. (2013) SouthWest Hub: a carbon capture and storage project. Aust. J. Earth Sci. 60, 45-58.
Figure 2. TH histograms of water inclusion
in quartz cements in sandstone from
shallow to deep samples from Harvey-1, 2,
3, 4 and Pinjarra-1. The TH window is
calculated assuming H2O-NaCl fluid
devoid of dissolved gas.

Pan-American Current Research on Fluid Inclusions Rice University, Houston, Texas, U.S.A., June 12-14, 2018, Abstract Volume
29
Attributes of petroleum inclusion assemblages for unravelling charge
history Julien BOURDET, Richard KEMPTON CSIRO Energy, Bentley, Western Australia, Australia E-mail: [email protected]
A diversity of fluid inclusion techniques are established in the petroleum industry that involve measuring their abundance, fluorescence, PVT properties and geochemistry to constrain the state of the fluid, its composition, density, trapping temperature and pressure or gas saturation. This contributes to understanding basin-scale migration-accumulation processes. Because they trap paleo fluids fluid inclusions offer unique insights into the filling of petroleum reservoirs. There is untapped potential for expanding the range of techniques or new interpretations
of fluid inclusion data to make them more widely applied. Fluid inclusion techniques are a small part of the large data sets used in petroleum exploration and to be accepted the interpretations must be precise and accurate.
The GOI™ (Grains containing Oil Inclusions) technique (Eadington et al., 1996) is used widely to detect paleo-oil zone or evidence for oil migration in currently oil-, gas- or water- saturated reservoirs. A difference between the depth and or attitude of fluid contacts is revealing of processes that operate during the preservation time of oil in reservoirs including displacement of oil by gas and leakage of oil through the seal (Lisk and Eadington, 1994; Lisk et al., 1997; Kempton et al., 2011). In addition to documenting the abundance of oil inclusions the GOI workflow documents selected attributes of oil inclusion assemblages (Figure 1) such as the petrographic superposition sequence, variance in the proportion of vapor, variability of the fluorescence color of the oil, in datasets that reveal correlation and covariance between attributes that are useful for interpretation.
More recently, petrographic, experimental and spectroscopic studies of the attributes of oil inclusion assemblages (Bourdet et al., 2012, 2014) demonstrated some of the variance in the appearance of oil inclusion assemblages is a consequence of in-reservoir fluid interactions. The known but controversial empirical relationship between UV-fluorescence colors of oil with its composition was used to calculate equations to derive the degree API of the oil as well of their saturates-aromatics-resins-asphaltene fractions. FT-IR spectra were used to measure and assess the variability of the CH2/CH3 ratio and methane content in different zones of a reservoir. Experiments were conducted in silica capillary capsules to reproduce some of the natural variance due to interaction of residual oil with gas.
These attribute and spectroscopic data show that in-reservoir fluid interactions contribute significant variance in the appearance of oil inclusion assemblages. It is necessary to separate the in-reservoir fluid interactions from
Figure 1: Example of oil inclusion assemblage
trapped at the quartz overgrowth boundary. This
assemblage presents variability of the attributes
such as the vapor-phase size and of the
fluorescence color of the oil. It results from the
heterogeneous trapping of a residual oil and gas
in a gas zone within a same oil inclusion
assemblage.

Pan-American Current Research on Fluid Inclusions Rice University, Houston, Texas, U.S.A., June 12-14, 2018, Abstract Volume
30
those due to generation-migration processes to enable accurate understanding of petroleum systems at the basin scale.
REFERENCES
Bourdet, J. et al. (2014) Evidence for a paleo-oil column and alteration of residual oil in a gas-condensate field:
integrated oil inclusion and experimental results, Geochimica et Cosmochimica Acta, 142, pp. 362-385.
Bourdet, J. et al. (2012) Chemical changes of fluid inclusion oil trapped during the evolution of an oil reservoir: Jabiru-
1A case study (Timor Sea, Australia). Marine and Petroleum Geology, 36, 118-139.
Eadington, P.J. et al. (1996). Identifying oil well sites. United States Patent No. 5543616.
Lisk, M., Eadington, P.J. (1994) Oil migration in the Cartier Trough, Vulcan Sub-basin. In P. G. Purcell, & R. R. Purcell
(Eds.), The Sedimentary Basins of Western Australia. Perth, WA: Proceedings of the Petroleum Exploration Society
of Australia, pp. 301–312.
Lisk, M. et al. (1997) Gas displacement: an important control on oil and gas distribution in the Timor Sea? The
Australian Petroleum Production and Exploration Association Journal 37, 259–271.
Kempton, R.H. et al. (2011) Detection of Paleo-Oil Columns in the offshore northern Perth Basin: Extension of the
effective Permo-Triassic Charge System. The APPEA Journal 51, 377–396.

Pan-American Current Research on Fluid Inclusions Rice University, Houston, Texas, U.S.A., June 12-14, 2018, Abstract Volume
31
A new model for the solubility of common rock-forming minerals in
saline aqueous fluids up to 1100 °C and 20 kbar Hanna L. BROOKS, Matthew STEELE-MACINNIS
University of Alberta, Dept. of Earth and Atmospheric Sciences, Edmonton, Alberta, Canada
E-mail: [email protected]
Quantifying and predicting the dissolution of minerals in complex (multicomponent) aqueous fluids across wide ranges of P-T space is critical for interpreting geologic processes that involve water-rock interactions in the Earth’s crust and upper mantle. Transport of heat and materials as well as chemical reactions in geologic systems are driven and controlled by fluids. Natural geologic fluids are commonly rich in non-electrolyte (e.g. CO2, CH4, N2), and electrolyte solutes (e.g. Na+, K+, Fe2+, Cl-) (Galvez et al., 2015). High salinities strongly affect activity-composition relationships in thermodynamic modeling, and mixing high salt contents with gas-rich fluids (i.e., containing CO2 and other volatiles) expands the pressure-temperature limits of fluid phase immiscibility (Bowers and Helgeson, 1983) which partitions solutes and affects mineral stability relations. Here, we define a new thermodynamic model for mineral solubility in saline aqueous fluids. The model is based on the coupling of two previous models: one for the solubility of minerals in pure H2O fluids as function of temperature and pressure (Dolejš and Manning, 2010), with the additional effects of fluid composition (salinity) modeled in part based on Akinfiev and Diamond (2009), with some additional modifications.
Specifically, the new model adopts the approach of Akinfiev and Diamond (2009) to incorporate the effect of reduced H2O activity in saline brines for reactions that involve hydration, and also adds new expressions for the equilibrium constants of reactions involving explicit sodium and/or chloride species. As such, the generic model is applicable to the solubility of minerals that dissolve as hydrous species, sodium and/or chloride species, and combinations thereof. The model has been calibrated against experimentally determined solubilities for six common rock-forming minerals – quartz, calcite, corundum, fluorapatite, fluorite, and rutile – in H2O-NaCl solutions at temperatures up to 1100 °C and pressures up to 20 kbar. Data and trends observed in experimental measurements are well reproduced by our model predictions. In the case of pure H2O fluids (zero salinity), the model is implicitly equivalent to the Dolejš and Manning (2010) model. The accuracy of the model is within both experimental uncertainties and accuracy ranges of the two models on which it is built.
Examining solubility (T-x) diagrams for each mineral show that, in general, increasing salinity, temperature, and/or pressure in the system leads to a corresponding increase in solubility (i.e. Figure 1). However, in-depth examination of these diagrams illustrates that the effect is dependent on temperature, pressure, the formation of solutes, and the electrostatic behavior of the solution (i.e. salting-in and salting-out). Which of these variables dominates varies as a function of mineral properties and P-T-x conditions. Coupling multiple mineral solubility curves together allowed examination of the potential impact of an aqueous fluid at specific P-T-x
Figure 1. T-x diagram illustrating the effect of temperature and salinity on calcite solubility in H2O±NaCl fluids at 10 kbar. A clear salting-in behavior is visible, with solubility increases progressively with increasing salinity. Retrograde solubility trends are seen at pure H2O conditions and grading to prograde trends by ~20 wt.% NaCl salinity.

Pan-American Current Research on Fluid Inclusions Rice University, Houston, Texas, U.S.A., June 12-14, 2018, Abstract Volume
32
conditions on the solubility of common minerals (Figure 2). Depending on salt concentration, the identity of the most soluble mineral fluctuates; salting-in and salt-out behaviors were both noted depending on mineral type and P-T conditions.
Application of this new mineral solubility model to natural systems provides an increased capacity for understanding the impacts of fluid migration within the crust and upper mantle. This model encompasses H2O±NaCl fluids in a wide range of scientifically and societally important geologic settings (e.g. hydrothermal porphyries, sedimentary basins, and subduction zones). Due to the “simple” nature of the model, extrapolation and interpolation of data is possible with a high degree of accuracy over an extremely wide range of crustal to upper-mantle pressures and temperatures, and a large range of brine concentrations. This thermodynamic model, accounting for dissolution reactions in multi-component fluids over an extreme range of P-T-x conditions, will allow for robust modeling of reactions and mass transport in natural systems (i.e. sedimentary basins, subduction zones, hydrothermal ore deposits).
REFERENCES
Akinfiev, N.N., Diamond, L.W. (2009) A simple predictive model of quartz solubility in water–salt–CO2 systems at temperatures up to 1000°C and pressures up to 1000 MPa, Geochimica et Cosmochimica Acta 73, 1597-1608.
Bowers, T.S., Helgeson, H.C. (1983) Calculation of the thermodynamic and geochemical consequences of nonideal mixing in the system H2O-CO2-NaCl on phase relations in geologic systems: Equation of state for H2O-CO2-NaCl fluids at high pressures and temperatures, Geochimica et Cosmochimica Acta 47, 1247-1275.
Dolejš, D., Manning, C.E. (2010) Thermodynamic model for mineral solubility in aqueous fluids: theory, calibration and application to model fluid‐flow systems, Geofluids 10, 20-40.
Galvez, M.E. et al. (2015) The solubility of rocks in metamorphic fluids: A model for rock-dominated conditions to upper mantle pressure and temperature, Earth and Planetary Science Letters 430, 486-498.
Figure 2. Mineral solubility in H2O-NaCl fluids at
800°C and 10 kbar. Density model predictions are
shown with continuous curves; solid where well
constrained with experimental data and dashed
where extrapolated. Symbols indicate experimental
data at the specified conditions, colored to match
the mineral dissolving.

Pan-American Current Research on Fluid Inclusions Rice University, Houston, Texas, U.S.A., June 12-14, 2018, Abstract Volume
33
31 Years of PACROFI Philip E. BROWN Department of Geoscience, University of Wisconsin-Madison, Madison, Wisconsin, U.S.A. E-mail: [email protected]
The idea for PACROFI was hatched by Ed Roedder and Dave Norman in April 1985 while attending the 8th European Current Research on Fluid Inclusions meeting in Germany. As explained by Dave Norman, “…later that year an ad hoc committee was formed consisting of E. Roedder, R.J. Bodnar, P.E. Brown, A.R. Campbell and D. Norman. We first decided to determine the interest in forming an American group (ACROFI). A brochure was sent to about 1400 people and, much to our surprise, over 250 replied.” (GCA, 1988). As shown in the chart below the first meeting in January 1987 was a big success and the biennial tradition was born. ACROFI was quickly renamed PACROFI to be inclusive of the entire hemisphere and except for 3 meetings that did not come off for various reasons here we are 31 years later gathering for the XIV th edition. Nearly 850 abstracts have been submitted to the previous XIII meetings, roughly 2/3 oral and 1/3 posters.
Attendees have come from 36 (+?) countries (Argentina, Austria, Australia, Brazil, Canada, Chile, China, France, Germany, Hungary, India, Iran, Ireland, Israel, Italy, Japan, Mexico, Netherlands, New Zealand, Norway, Poland, Portugal, Romania, Russia, South Africa, South Korea, Spain, Sweden, Switzerland, Taiwan, Tajikistan, Turkey,
ACROFI/
PACROFI Year Location Main Organizers # People # Abst # Oral # Posters Dinner/Banquet
I 1987New Mexico Tech:
Macey Center
Dave Norman
Andy Campbell140 65 45 20 On site - Macey Center
II 1989
Virginia Tech:
Donaldson-Brown
Conf Center
Bob Bodnar
Many Students>100 60 45 15
On site - Donaldson-
Brown Conf Center
III 1990U. Toronto: on
campus
Ed Spooner
Colin Bray>100 81 51 30 Ontario Science Center
IV 1992
U.C. Riverside: Lake
Arrowhead Conf
Center
Michael McKibben
Isabel Montanez
Don Hall
108 95 51 44 On site
V 1994
Instituto de
Investigaciones
Electricas:
Cuernavaca, Mexico
Georgina Izquierdo
Tawn Albinson85 48 37 On site
VI 1996U. Wisc-Madison:
Dept of Geoscience
Phil Brown
Steffen Hagemann~80 70 44 26
Spring Green - Frank
Lloyd Wright Restaurant
VII 1998UNLV Campus:
Marjorie Barrick
Museum
Jean Cline
Dave Vanko69 48 21 Lake Mead Cruise
VIII 2002 HalifaxDan Kontak
Alan Anderson61 38 23 Harbour Queen I
IX 2008USGS Reston
National Center
Sean Brennan
Harvey Belkin64 41 23
Top of the Town,
Arlington
X 2010 UNLV: on campusAdam Simon
Jean Cline47 30 17 Walking Box Ranch
XI 2012 U. Windsor, OntarioIan Samson
Joel Gagnon52 35 17
Sprucewood Shores
Estate Winery
XII 2014USGS; Col State:
Pingree Park
John Ridley
Al Hofstra48 39 25 14 On site - Pingree Park
XIII 2016U. Missouri: on
campus
Martin Appold
Kevin Shelton
Peter Nabelek
72 57 36 21 Les Bourgeois Vineyard
XIV 2018 Rice U.Mike Smith
Gary Gray

Pan-American Current Research on Fluid Inclusions Rice University, Houston, Texas, U.S.A., June 12-14, 2018, Abstract Volume
34
Ukraine, United Kingdom, USA, Uzbekistan). Prior to the fall of the wall, meeting organizers received abstracts from scientists in the USSR but the authors were generally unable to actually attend. This problem also regularly stymied the attendance of authors from China.
The 500+ oral presentations can be roughly grouped into the following “Topics”: Ore Deposits 28%, Methods/Techniques/Experiments 24%, Metamorphic/Igneous/Melt 16%, Sedimentary/Petroleum 12%, and Geothermal 6%. (9% of the total oral presentations came from the Cuernavaca meeting but the abstract volume doesn’t include a schedule.) The first 4 topics have been utilized in the table of contents of essentially all the meetings. Geothermal fluid inclusions were a common topic during the 1990s but are rarely seen in the last 15 years. Inclusions in metamorphic rocks were a common topic in the first 4-5 meetings but Melt inclusions are much more common as a subject of study in the last 20 years. Obviously, the techniques and technology changes that have changed the whole spread of the geosciences have dramatically affected fluid inclusion research as well.
Workshops have been a regular part of the meetings: At ACROFI I for example there were opportunities to learn about Raman Spectroscopy, Fluid Inclusions in Sedimentary/Petroleum Environments, and Inclusions in Mineral Exploration. In Toronto (1990) there was a Phase Equilibria workshop with several presentations.
Posters have been an integral part of all the meetings and many models have been used to effectively incorporate them into the heart of the meetings: have them up the whole meeting, have them clustered temporally and spatially with oral sessions on the same topics, and the tried and true poster session with “refreshments” either late in the afternoon or in the evening after dinner. PACROFI X set aside a half hour for 2-3-minute Poster Introductions immediately preceding the poster session. PACROFI IV and XII effectively used a modified Gordon Research Conference timetable with 2-4 hours of free time in the afternoons with the posters or oral sessions scheduled for the evenings.
Sponsorship has been quite varied through the years with Linkham Scientific, Horiba Scientific, and The McCrone Group, having contributed regularly. Various Petroleum (Exxon, Texaco, Amoco, Chevron) and Mining (Barrick, Homestake, Doe Run) companies have contributed to specific meetings. The USGS, NSF, and various professional societies (MSA, SEG, Geochemical Society, MAC) have made critical contributions to support speaker travel, reduced student fees, and abstract volume printing. And none of these meetings would have been possible without the support of the home academic institutions of the organizers providing meeting space and generally reduced costs for housing.
Field trips before or after the meetings have been a regular feature and have added greatly to the experiences of participants especially visitors from the other hemisphere. The conference Dinners/Banquets have provided some very special venues and lasting memories. Evening activities have generally remained under control although a couple of hot tub/pool events at PACROFI IV and V were ‘interesting’.
Two of the original organizers of this important series of meetings have passed on. Ed Roedder, the true ‘father’ of fluid inclusions in at least the western hemisphere died in 2006 after an incredible career mainly at the USGS. Dave Norman died unexpectedly in Africa in 2008 after having submitted several abstracts with students for the Reston meeting.
Abstract volumes for all of the previous XIII meetings will be available for examination during the meeting and I look forward to hearing other stories and recollections from the past helping to set the stage for future advances in this fascinating field.
REFERENCES
GCA Vol 52, pp. 959-1076 (1988) Pan-American Current Research on Fluid Inclusions.
GCA Vol 54, pp. 493-713 (1990) Current Research on Fluid Inclusions: PACROFI II.
GCA Vol 56, pp. 1-302 (1992) Current Research on Fluid Inclusions: PACROFI III.
Chemical Geology Vol 154, pp. 1-301 (1999) Pan-American Current Research on Fluid Inclusions VI

Pan-American Current Research on Fluid Inclusions Rice University, Houston, Texas, U.S.A., June 12-14, 2018, Abstract Volume
35
Keynote – Quantitative Raman spectroscopy of single phase
hydrocarbon gas-rich fluid inclusions Robert C. BURRUSS U. S. Geological Survey, Reston, Virginia, U.S.A. (retired)
E-mail: [email protected]
For a number of years I have used Raman spectroscopy to quantify the composition of gas-rich hydrocarbon
inclusions (HCFI) in the Appalachian basin for comparison with produced gases. Molecular compositions can be
calculated in the system CH4-C2H6-C3H8-C4H10-CO2-N2 although some components may not be above detection limits
in many inclusions. Initial comparison with produced gases shows that HCFI are richer in C2+ hydrocarbons and CO2
than produced gases. To eliminate the possibility that this difference is an analytical artifact, I have re-evaluated
data acquisition routines, integration methods, and measured relative Raman scattering cross-sections (RRSC) up to
20 MPa in standard gas mixtures. To detect components at < 2 mol %, Raman bands of C2H6-C3H8-C4H10-CO2-N2 must
be collected with long acquisition times and the highest spectral dispersion on the detector so that small peaks are
well defined. C4H10 is the most difficult to detect and quantify because it is the least abundant of the hydrocarbons
in this system and the peaks overlap with a weak band in the quartz host. With careful baseline correction, either
manual or algorithm driven integrations give comparable results. In some cases, the baseline of the CO2 Fermi diad
may be affected by the presence of the polynuclear aromatic (“graphitic”) D band.
Relative Raman scattering cross-sections of gases in the literature are for gases at about atmospheric
pressure and show some variation between publications. To test whether these variations are significant and
whether there are variations in the RRSC at high pressure, I measured spectra on two standard gas mixtures at
pressures up to 20 MPa in a high pressure optical cell. The results were reasonably consistent with published values
with no variation with pressure. Therefore, molecular compositions of gas-rich HCFI can be reliably calculated from
Raman spectra.
In addition to composition, it is possible to calculate the density of the CH4-rich gas from the well calibrated
shift of the 1 band (~2915 cm-1) with density for pure CH4. Combined with molecular composition, the density
should allow calculation of the PVT properties of the trapped fluid. However some caution is required because we
know from work on CH4-CO2 mixtures that additional components in the gas can affect the correlation of methane
peak position with the density of pure methane. These effects become significant when the methane content drops
below 90 mol %. Based on experiments at CSIRO with Julien Bourdet on the system CH4-C6H14 in which CH4 peak
position was measured for both the coexisting liquid and vapor phases, it appears that the peak position shifts with
the density of mixture, such that the methane peak position is inconsistent with the calibration for pure methane.
The shift in the CH4 peak position with hydrocarbon fluid composition and density needs to be studied further to
establish the accuracy with which PVT properties of gas-rich HCFI can be calculated from Raman spectra.
It is clear that Raman spectroscopy can be used to calculate the molecular composition and density of CH4-
rich HCFI. Extending this approach to HCFI with compositions of condensates and oils has been impossible due to
the overwhelming intensity of fluorescence of aromatic components in these fluids. Based on my experience to
date, I believe it is unlikely that any Raman spectroscopic method will be successful in measuring the molecular
composition of gases in fluorescent HCFI.

Pan-American Current Research on Fluid Inclusions Rice University, Houston, Texas, U.S.A., June 12-14, 2018, Abstract Volume
36

Pan-American Current Research on Fluid Inclusions Rice University, Houston, Texas, U.S.A., June 12-14, 2018, Abstract Volume
37
Low-temperature phase equilibria of saline aqueous systems
containing carbonate, bicarbonate and other anions Michael H. DECINDIS1,2, Matthew STEELE-MACINNIS1
1Deptartment of Earth & Atmospheric Sciences, University of Alberta, Edmonton, Alberta, Canada 2Department of Soil, Water, and Environmental Science, University of Arizona, Tucson, Arizona, U.S.A.
Email: [email protected] Fluids in many geologic settings, ranging from sedimentary basins to magmatic-hydrothermal environments, are saline brines. Therefore, methods to determine salt concentrations in fluid inclusions are needed to interpret the record of fluids based on fluid inclusions. Several methods can be used for this purpose, and the main tool is microthermometry. Laser-ablation (LA) ICPMS analysis has revolutionized this field and allows quantification of major and trace elements in inclusions, but it is very challenging to apply to the analysis of anions in fluid inclusions. As such, analysis of data from LA-ICPMS generally assumes that chloride is the only anion present in an inclusion. However, we know that other anions may be present and, in some settings, these other anions can comprise a major portion of the composition. Sulfate, carbonate and bicarbonate are some of the key suspects, but others (hydroxide, fluoride, nitrate) may also be present in certain settings.
This study explores the low-temperature phase relations in systems containing anions other than chloride. Pitzer’s ion interaction model (Pitzer, 1973) allows modeling the solid-liquid equilibria of saline aqueous systems over a range of temperature-pressure conditions and up to high liquid salinities. Steele-MacInnis et al. (2016) described the application of Pitzer’s model to construct theoretical solidus-liquidus phase diagrams for different aqueous salt systems in the system H2O-Na-K-Ca-Mg-Fe-Cl. Walter et al. (2017) extended this analysis to sulfate-bearing fluids. Here, we extend this analysis to model the solidus-liquidus phase relations of a variety of other saline systems, particularly considering the additional anions bicarbonate and carbonate, although others are also tested for reconnaissance. We present new phase diagrams for binary water-salt systems as well as ternary and higher-order phase diagrams to explore the phase relations in
liquids containing multiple anions. Intersection of the ice liquidus and salt liquidus lines constrains the eutectic point of each system. Applications of these models will assist in interpreting the nuances of microthermometric properties of multi-component inclusions, particularly for those with exotic compositions such as in granitic pegmatites and in fluids related to evaporates. REFERENCES
Pitzer, K.S. (1973) Thermodynamics of electrolytes. I. Theoretical basis and general equations. J. Physical Chemistry 77, 268-277.
Steele-MacInnis et al. (2016) Application of Low Temperature Thermometric Data for Interpreting Multicomponent Fluid Inclusion Composition. Earth-Science Reviews 159 14-35.
Walter, B.F. et al. (2017) Sulfate brines in fluid inclusions of hydrothermal veins: Compositional determinations in the system H2O-Na-Ca-Cl-SO4. Geochim Cosmochim Acta 209 184-203.
Figure 1. Liquidus diagram for H2O-NaHCO3
-5
-4
-3
-2
-1
0
1
0 1 2 3
Tem
pe
ratu
re (
C)
Wt % NaHCO3
ice
Nahcolite

Pan-American Current Research on Fluid Inclusions Rice University, Houston, Texas, U.S.A., June 12-14, 2018, Abstract Volume
38

Pan-American Current Research on Fluid Inclusions Rice University, Houston, Texas, U.S.A., June 12-14, 2018, Abstract Volume
39
Open system diagenesis in unconventional reservoirs of the Midland
Basin, Howard County, Texas Erich de ZOETEN and Robert H. GOLDSTEIN Kansas Interdisciplinary Carbonates Consortium, Department of Geology, University of Kansas, Lawrence, Kansas, U.S.A.
E-mail: [email protected]
Diagenetic alteration commonly controls reservoir quality in carbonates. Diagenetic alteration in basinal systems, with abundant fine-grained deposits, has been proposed to be relatively closed to new fluids and, therefore, relatively simple and predictable (Mazzullo and Harris, 1992; Mazzullo, 1994). Alternatively, open-system hydrothermal fluid flow in carbonates has been shown to be an important mechanism for creating reservoir porosity in conventional reservoirs (e.g. Hiemstra and Goldstein, 2015). This study evaluates the diagenetic history of the Wolfcamp A stratigraphic unit near the toe-of-slope in the eastern Midland Basin. The findings show that the Midland Basin fluid and thermal history was an open one, with reflux of residual evaporite brines during burial, and hydrothermal fluid flow during and after Laramide fracturing. This late stage of fracturing and hydrothermal fluid flow was important in localizing reservoir quality and thermal maturity. This finding should lead to new strategies for localizing the best reservoirs in the Permian Basin and other unconventional plays. Fluid inclusion, petrographic, and isotopic data are key in recognizing the complex history of fluid flow that controls the thermal history and diagenesis of this unconventional reservoir.
Transmitted-light microscopy, UV, cathodoluminescence, and SEM-EDS microscopy, as well as δ18O, δ13C, 87Sr/86Sr, and fluid inclusion analyses are used to evaluate the history of fluid flow and thermal history as a means of determining controls on reservoir quality. The diagenetic history is divided into three stages: Early Stage, near the sediment-water interface; Burial Stage, during burial and before tectonic fracturing; and Fracturing Stage, with the onset of tectonic fracturing and overlapping with late events of hydrocarbon migration (Figure 1).
For the Burial Stage, Calcite Cement 2 δ18O values lead to calculated precipitation temperature of about 73 °C. The 87Sr/86Sr value is 0.707714, slightly more radiogenic than Mid - Late Permian (Guadalupian – Ochoan) seawater. Calcite Cement 3 reduced most of the remaining porosity in mud-poor packstones. Its Th values are 68 – 83 °C; Tm ice data indicate a high salinity fluid from 17.4 – 18.5 wt% NaCl eq. Calculated δ18Owater of 6.4 – 9.6‰ is consistent with a residual evaporite brine generated in the Leonardian and Guadalupian, that refluxed downward into the Wolfcamp A (Figure 2). Anhydrite cement yields fluid inclusion data indicating precipitation at low temperature (< 50 °C) from a brine of 17.4 – 26.8 wt% NaCl eq. A potential explanation is that anhydrite precipitated during active reflux of highly evaporated late Ochoan seawater. This hypothesis is supported by a 87Sr/86Sr value of 0.707491. The timing would have had to have been during the late Ochoan, or soon after in the Triassic, because the reflux of low-temperature brines penetrated a rock that had already been heated to 68 – 83 °C during burial (Figure 2).
The Fracturing Stage began with brittle failure of the rock to form planar, consistent aperture fractures. The Laramide orogeny and Basin and Range deformation are the only known post-Permian tectonic events capable of causing extensive fracturing. Calcite cement 5 yields Th of 68 – 93 °C and Tm ice salinity of 21.5 – 25.0 wt% NaCl eq. δ18Owater was 6.5 – 10.2‰ (Figure 2). Calcite cement 6 precipitated from a hot (Th of 130 – 160 °C) high salinity (22.8 – 25.4 wt% NaCl eq) fluid. A separate gas phase was present during precipitation. For quartz cement 2, fluid inclusion Th indicate precipitation at 76 – 113 °C, and Tm ice indicate a brine of 22.5 – 27.0 wt% NaCl eq. Temperature for the
Figure 1. Paragenesis of Wolfcamp A, Midland Basin.

Pan-American Current Research on Fluid Inclusions Rice University, Houston, Texas, U.S.A., June 12-14, 2018, Abstract Volume
40
quartz cement fluctuated through time, and a correlation between Th and Tm ice indicates events of fluid mixing between a lower temperature (~75 °C), higher salinity (~26.5 wt% NaCl eq) fluid and a higher temperature (~105°C), lower salinity (~23 wt% NaCl eq) fluid. Following a dissolution event and oil migration, baroque dolomite cement 2 precipitated. Temperature of precipitation calculated from δ18Ocement was somewhere between 125 – 181 °C. The 87Sr/86Sr (0.707633) is relatively non-radiogenic. Later, calcite cement 8 precipitated at a temperature of 113 – 151 °C, calculated from δ18Ocement.
These data indicate that during the Burial Stage (Permian to Cretaceous), Permian evaporated seawater refluxed and displaced Leonardian connate water. Thermal conditions were at those predicted from burial history, or lower during times of active reflux. During the Fracturing Stage, Laramide (latest Cretaceous to Eocene) and later tectonism led to hydrothermal fluid flow, with northward migration of fluids out of the Val Verde Basin. This system would have been driven by hydraulic head in uplifted areas to the south. Hydrothermal fluids yielded localized thermal maturity, oil migration, and porosity in the Wolfcamp A, important for localization of the best reservoirs.
On the basis of observations made in this study of the Wolfcamp A in the eastern Midland Basin, predicting reservoir properties in unconventional reservoirs in the Midland Basin, and other distal foreland settings, must incorporate an open and thermally dynamic model, not a closed fluid system model in which thermal history is governed by burial history alone. The burial stage was dominated by vein-opening and calcite and anhydrite cementation. Fluid temperatures were consistent with those at and close to burial at the end of the Permian and also record some low temperatures consistent with active reflux from the surface. Fluid salinities increased to values consistent with Ochoan reflux of residual evaporite brines. Although facies had relatively low permeability, active and open fluid flow, caused by reflux from the surface, had a major impact on diagenesis and thermal structure. After fracturing from the Laramide orogeny, open-system diagenesis began once again and resulted in tectonically valved hydrothermal fluid flow. This resulted in late moldic dissolution, oil migration and generation, as well as calcite, quartz, and dolomite cementation. Based on burial history and Sr isotope values, the hydrothermal fluid flow was advective in nature, long distance, and came from the Val Verde Basin, not from basement or deeper parts of the Midland Basin. This study is consistent with others in the southern US Midcontinent and Delaware Basin. All show evidence of long-distance fluid migration of hydrothermal fluids from distant foreland areas, but the Midland Basin study shows the impact of open system reflux and hydrothermal fluid flow on unconventional reservoirs, traditionally hypothesized to act as closed systems to fluids.
REFERENCES Hiemstra, E.J. and Goldstein, R.H., 2015, Repeated injection of hydrothermal fluids into downdip carbonates: a
diagenetic and stratigraphic mechanism for localization of reservoir porosity, Indian Basin Field, New Mexico, USA:
Geological Society, London, Special Publications 406, no. 1, p. 141-177.
Mazzullo, S. J. and Harris, P.M., 1992, Mesogenetic dissolution: Its role in porosity development in carbonate
reservoirs: AAPG Bulletin, v. 76, p. 607-620.
Mazzullo, S. J., 1994, Lithification and porosity evolution in Permian periplatform limestones, Midland Basin, Texas:
Carbonates and Evaporites, v. 9, p. 151-171.
Figure 2. Summary of fluid inclusion and geochemical data from Wolfcamp A, Midland Basin

Pan-American Current Research on Fluid Inclusions Rice University, Houston, Texas, U.S.A., June 12-14, 2018, Abstract Volume
41
An Investigation of the phase behavior and composition of the surface
and crust of Titan using Synthetic Fluid Inclusions combined with
Raman spectroscopy Hunter R. EDWARDS, D. Matthew SUBLETT, Robert J. BODNAR Fluids Research Laboratory, Department of Geosciences, Virginia Tech, Blacksburg, Virginia, U.S.A.
E-mail: [email protected]
Our knowledge of the physical and chemical properties of planetary bodies in the solar system is based mainly on studies of meteorites and data returned to Earth from orbiters and rovers. Accordingly, the Cassini mission (1997-2017) collected data in the Saturnian system, and the Huygens probe provided the first direct investigation of the composition of the atmosphere and surface of Titan (Niemann et al., 2005; Niemann et al., 2010). While these data provide information concerning the composition of planetary bodies, they do not provide details concerning the phase state at various locations on the surface and in the crust or mantle of these bodies. Here, we simulate the phase behavior of the Titan surface and crust using synthetic fluid inclusions (SFI) with Titan-like composition, combined with Raman spectroscopy.
Titan has an atmosphere that is rich in N2 and CH4, a surface composed of CH4, C2H6, C2H2, C2N2, and CO2 (Dalton, 2010; Niemann et al., 2005; Niemann et al., 2010), and a clathrate and ice crust (Fortes et al., 2007; Grindrod et al., 2008). The interior of Titan consists of a global (NH4)2SO4 ocean, an ice VI shell, and a hydrated silicate core (Tobie et al., 2005; Fortes et al., 2007; Grindrod et al., 2008; Fortes, 2012; Sohl et al., 2014) (see Figure 1). Additionally, the surface temperatures on Titan ranges from -203°C to -73°C (Dalton, 2012). Using these data, SFI were created to replicate the compositions of the atmosphere, surface and crust on Titan.
The CH4-CO2-N2-H2O system was utilized because it is compositionally analogous to the surface and subsurface of Titan. Using the procedure from Sterner and Bodnar (1984), SFI were created by mixing CH3COONH4, NiO, and H2O, following the method outlined by Chou et al. (1990). This mixture was added to a platinum capsule containing a thermally-fractured, inclusion-free, Brazilian quartz core. The capsule was then welded and placed in a cold-seal pressure vessel and brought to experimental conditions of 600°C and 2 kbar. At these conditions the following reaction occurs:
CH3COONH4(s) + 1.5 NiO(s) CH4(g) + CO2(g)+ 0.5 N2(g)+ 1.5 H2O(l) + 1.5 Ni(s) (Chou et al., 1990) At the experimental conditions, the fractured quartz core anneals and traps fluid inclusions with calculated
compositions of 10.3 mol % CH4 and CO2, 74.2 mol % H2O, and 5.2 mol % N2. Every covalently-bonded molecule has a given vibrational energy that gives rise to a specific vibrational
band (peak) in the Raman spectrum (Figure 2). The relative proportions of the different species can be estimated from the areas under the peaks using the Placzek equation. This method was used to determine relative abundances of CH4, CO2, and N2 in the mixture.
A Raman microprobe and a TMS 92 Linkam stage are used to collect spectra of SFI at low temperatures. At room temperature, a liquid and vapor phase are present in the SFI. The fluid phase at room temperature is mostly H2O and the vapor phase at room temperature contains CH4, CO2, and N2. As the inclusion is cooled to -190°C, a
Figure 1. Cross section of Titan, with geothermal gradients
in red, showing the interior structure of Titan. Modified
from Sohl et al., 2014.

Pan-American Current Research on Fluid Inclusions Rice University, Houston, Texas, U.S.A., June 12-14, 2018, Abstract Volume
42
temperature that is analogous to the surface of Titan, clathrates form. At -50°C spectra were collected of the vapor and clathrate phases. The vapor phase contains CH4, N2, and lower proportions of CO2 compared to room temperature. Further, at this temperature CO2 clathrate is present. At -190°C the clathrates that form near the vapor bubble contain abundant CH4, N2, and CO2, but only CO2 clathrate is detected further from the vapor bubble. Raman spectra of the vapor phase were collected at -190°C, however no CH4, N2, or CO2 are detected at this temperature. It is likely that these molecules are present within the vapor bubble, but at levels too low to be detected by Raman, with most of these species contained in clathrates. This study is continuing, with the goal to determine the phase behavior and composition at temperatures that are within the range of temperatures present on the surface of Titan.
Understanding the phase behavior for Titan provides useful information that can allow for a better understanding for the composition of Saturnian and Jovian satellites, as well as the formation and evolution of planetary bodies in the outer solar system.
REFERENCES
Chou, I. M. et al. (1990) High-density volatiles in the system C-O-H-N for the calibration of a laser Raman microprobe,
Geochim. Cosmochim. Acta 54, 535-543.
Dalton, J. B. (2010) Spectroscopy of Icy Moon Surface Materials, Space Sci. Rev. 153, 219-247.
Fortes, A. D. et al. (2007) Ammonium Sulfate on Titan: Possible origin and role in cryovolcanism, Icarus 188, 139-153.
Fortes, A. D. (2012) Titan’s internal structure and the evolutionary consequences, Planet. Space Sci. 60, 10-17.
Grindrod, P. M. et al. (2008) The long-term stability of a possible aqueous ammonium sulfate ocean inside Titan,
Icarus 197, 137-151.
Niemann, H. B. et al. (2005) The Abundances of constituents of Titan’s atmosphere from the GCMS instrument on
the Huygens probe, Nature 438, 779-784.
Niemann, H. B. et al. (2010) Compositions of Titan’s lower atmosphere and simple surface volatiles as measured by
the Cassini Huygens probe gas chromatograph mass spectrometer experiment, J. Geophys. Res. 115, 1-22.
Sohl, F. et al. (2014) Structural and tidal models of Titan and inferences on cryovolcanism, J. Geophys. Res. Planets
119, 1013-1036.
Tobie, G. et al. (2005) Titan’s internal structure inferred from a coupled thermal-orbital model, Icarus 175, 496-502.
Sterner, S. M. and Bodnar, R. J. (1984) Synthetic Fluid Inclusions in natural quartz I. Compositional types synthesized
and applications to experimental geochemistry, Geochim. Cosmochim. Acta 48, 2659-2668.
Figure 2. When the incident photon contacts
the molecule, the molecule vibrates and
scatters light from the photon. The light is
either scattered elastically (Rayleigh
scattering) or inelastically (Raman scattering).
A “fingerprint” for the molecule scattering
the photons is provided by the inelastic
scattered light, which is proportional to the
vibrational energy for that molecule. Image
provided by www.hamamatsu.com.

Pan-American Current Research on Fluid Inclusions Rice University, Houston, Texas, U.S.A., June 12-14, 2018, Abstract Volume
43
Diagenesis and fluid-rock interactions in the Upper Lacq carbonate
petroleum reservoir (Southwestern France) Alexy ELIAS BAHNAN1, J. PECQUEUR, J. PIRONON1, C. CARPENTIER1, E. C. GAUCHER2, S. CALASSOU2, A. VIRGONE2 1CNRS-CREGU, GeoRessources Lab, Université de Lorraine, Nancy, France 2TOTAL, CSTJF, Pau, France E-mail: [email protected]
Fluids circulating in foreland basins can have strong impacts on petroleum systems and reservoir properties. This applies to the Upper Cretaceous Lacq reservoir of the Aquitaine Basin in southwestern France located north of the Pyrenean Mountains. In this area, dolomitic reservoirs were considered for a long time the result of an early dolomitization process in a context of shallow evaporitic carbonate platforms. However, a recent revisiting of the geodynamic model of the Pyrenean and South Aquitaine domain involving Early Cretaceous hyperextension with mantle exhumation led to suppose the impact of deeply sourced hydrothermal fluids on the diagenesis of reservoirs (Jammes et al., 2010, 2009; Lagabrielle et al., 2010; Vacherat et al., 2016; Salardon et al., 2017; Corre et al., 2018). The targeted 650m-deep oil reservoir is part of a salt-core anticline located in a complex area marked by hyper - extension during Early Cretaceous and compression during Late Cretaceous and Paleogene Pyrenean orogeny (Vacherat et al., 2014, 2016). Productive reservoirs include fractured Coniacian - Campanian limestones and dolomites unconformably overlying Albian-Cenomanian reefs while seals are provided by Upper Senonian marls and Paleocene shales (Biteau, 2006). However, little is known about the nature, origin and timing of fluid circulation in the basin. Aims of this work are to (1) revisit and reconstruct the diagenetic history of the Lacq field, (2) test the impact of fluid-rock interactions and thermochemical sulphate reduction (TSR) on reservoir properties and (3) link the involved fluids to the geodynamic history of the basin.
Petrographic observations on core samples from the Lacq reservoir reveal a paragenetic sequence of 19 phases. Bacterial activity in the eogenetic realm is represented by micrite coatings and framboidal pyrites produced by bacterial sulphate reduction (BSR). These phases are cross-cut by silica-rich microfractures that feed cm-scale chert nodules. Fluctuations in redox conditions are witnessed by the cathodoluminescence of zoned dog-tooth early calcites that hint towards changes in iron contents. These changes in redox states mark the transition to the mesogenetic realm. Minor phases of ferroan calcites indicate a dominance of reducing conditions. The main diagenetic modifications are recorded by pervasive dolomitization episodes that resulted in planar porphyrotropic (P), euhedral (E) and subhedral (S) dolomites. These phases were later affected by brecciation and fracturing coupled with saddle dolomite cementation. A minor phase of talc replaced some of the matrix and saddle dolomites. These episodes occurred before the maximum burial as bedding-parallel stylolites cut across all the dolomite phases. The stylolites are then reopened and infilled by non-ferroan blocky calcite cements with abundant oil and aqueous inclusions. Return to oxidizing conditions is suggested by the non-luminescent behavior of these calcite. The main pulse of oil migration continued till after the calcite cements and stopped before the precipitation of the final sulphate and sulphide phases.
δ18O and δ13C isotopes were obtained from the dolomitized host rocks, i.e. matrix dolomites, saddle dolomites and the final blocky calcite phases. δ13C of the host rocks are in the range of +2.49‰ to +3.23‰ PDB and δ18O between -2.25‰ to -7.00‰ PDB. Saddle dolomites show a similar range of δ13C with values between +0.51‰ to +2.83‰ PDB but a more depleted δ18O range of -8.21 to -9.09 ‰ PDB. Blocky calcites are slightly more depleted with a δ13C range of -1.48 to +1.53‰ PDB while δ18O vary between -10.38 and -12.38‰ PDB. Host rocks precipitating in equilibrium with Upper Cretaceous seawater have a δ13C range of +1 to +3‰ PDB and a δ18O range of -2.5 to -4.7‰ PDB. The δ13C of the studied phases are within the same range to that of Upper Cretaceous seawater. The more depleted δ13C of the blocky calcites is likely due to contamination by oil inclusions and the input of δ13C from the organic hydrocarbons. δ18O data show a negative trend with increasing depletion from the host rocks to the saddle dolomites then to the blocky calcites.
Microthermometry data were obtained from fluid inclusions (FIs) in matrix dolomites, saddle dolomites and calcite phases. FIs in matrix dolomites have a Th mode range of 80-90°C and salinities of 0-6 eq. wt% NaCl. Higher Th mode of 140°C and salinities of 2-10 eq. wt% NaCl are recorded in the saddle dolomites, while blocky calcites have colder FIs with a Th mode of 80°C and salinities of 0-3 eq. wt% NaCl. Oil inclusions in blocky calcites have Th values

Pan-American Current Research on Fluid Inclusions Rice University, Houston, Texas, U.S.A., June 12-14, 2018, Abstract Volume
44
between 56 and 63°C. The first approximation the data set shows is a gradual increase in temperature from the matrix dolomite to the saddle dolomite phases before cooling with the blocky calcites. Salinities however are relatively low with a very similar range among the studied phases. Raman spectroscopy on the gas phase of fluid inclusions in blocky calcites indicates that the only detectable gas is H2O vapor.
Using the fractionation curves of Friedman and O'Neil (1977) and the fractionation equation between dolomite and water (Horita, 2014), the fluids precipitating the matrix dolomite have δ18O values plotting in the domain of formation waters that were buffered by the host rocks. Similarly, saddle dolomite precipitated from fluids whose δ18O is also in agreement with formation fluids but at higher temperatures and close to the domain of magmatic waters. Using the fractionation equation between calcite and water (O’Neil, 1969), parent fluids of the blocky calcite have a δ18O value indicative of a mixture between formation and meteoric fluids.
This preliminary data set indicates that fluids participating in the diagenesis of Upper Lacq carbonate petroleum reservoir were involved in high rates of fluid-rock interactions leading to the buffering of the δ13C signature. Depletion of the δ18O isotope is linked to thermal fractionation during burial diagenesis at elevated temperatures. Analyses of fluid origins reveal that the matrix dolomites are sourced from formation fluids whose salinities were probably lowered by dilution with water from clay dehydration reactions. The same reasoning applies to saddle dolomites but with higher temperature. These results are not in agreement with an early dolomitization model but rather suggest the impact of hot hydrothermal fluids. Fluids precipitating blocky calcites could be a mixture between formation and meteoric fluids that percolated downward and retained the δ13C of the host rocks upon buffering. The presence of oil inclusions next to aqueous inclusions in calcites can be explained by co-existence of mixed fluids and hydrocarbons during crystallization.
However, to better constrain the salinities and origin of cement phases, more microthermometry and Raman measurement are needed. LA-ICPMS will also be utilized to observe changes in the chemistry of fluids across different cement phases. Confocal laser scanning microscopy is necessary to reveal trapping pressure conditions of hydrocarbons. To understand sulfur sources and the possible involvement of TSR reactions in the diagenesis, multiple sulfur isotope measurements on anhydrite and pyrite will be performed.
REFERENCES
Biteau, J-J. et al. (2006). The Aquitaine Basin. Petroleum Geosciences 12(3), pp. 247-273.
Corre, B. et al. (2018). Fluid circulations in response to mantle exhumation at the passive margin setting in the north
Pyrenean zone, France. Mineral. Petrol. 0, 1–24
Freidman, I., O’Neil, J. R. (1977). Compilation of stable isotope fractionation factors of geochemical interest. In M. Fleischer (Ed.), Data of Geochemistry (Sixth Ed., Washington) 440.
Horita, J. (2014). Oxygen and carbon isotope fractionation in the system dolomite–water–CO2 to elevated temperatures. Geochimica et Cosmochimica Acta, 129, 111–124.
Jammes, S. et al. (2009). Tectonosedimentary evolution related to extreme crustal thinning ahead of a propagating ocean: Example of the western Pyrenees. Tectonics 28
Jammes, S. et al. (2010). Extreme crustal thinning in the Bay of Biscay and the Western Pyrenees: From observations to modeling. Geochemistry, Geophys. Geosystems 11.
Lagabrielle, Y. et al. (2010). Mantle exhumation, crustal denudation, and gravity tectonics during Cretaceous rifting in the Pyrenean realm (SW Europe): Insights from the geological setting of the lherzolite bodies. Tectonics 29
O’Neil, J. R., et al. (1969). Oxygen Isotope Fractionation in Divalent Metal Carbonates. J. of Chem. Phys. 51, 5547–5558.
Salardon, R. et al. (2017). Interactions between tectonics and fluid circulations in an inverted hyper-extended basin: Example of mesozoic carbonate rocks of the western North Pyrenean Zone (Chaînons Béarnais, France). Mar. Pet. Geol. 80, 563–586.
Vacherat, A. et al. (2014). Thermal imprint of rift-related processes in orogens as recorded in the Pyrenees. Earth Planet. Sci. Lett. 408, 296–306.
Vacherat, A. et al. (2016). Rift-to-collision transition recorded by tectonothermal evolution of the northern Pyrenees. Tectonics 35, 907–933.

Pan-American Current Research on Fluid Inclusions Rice University, Houston, Texas, U.S.A., June 12-14, 2018, Abstract Volume
45
Constraining the history of fluid events using the fluid inclusion
assemblage (FIA) method for collecting, displaying and interpreting
microthermometric data András FALL1, Robert J. BODNAR2 1Bureau of Economic Geology, Jackson School of Geosciences, The University of Texas at Austin, Austin, Texas, U.S.A. 2Fluids Research Laboratory, Department of Geosciences, Virginia Tech, Blacksburg, Virginia, U.S.A. E-mail: [email protected]
Fluid inclusion microthermometric data provide information on the Pressure-Temperature-Composition (PTX) fluid history associated with geological processes. However, microthermometric data can be used to infer the original trapping conditions only if the inclusions obey Roedder's Rules (Bodnar, 2003), the assumptions stating that the inclusion trapped a single, homogeneous fluid, nothing is added to or lost from the inclusion after trapping, and the inclusion is isochoric. The only way to test these rules is by obtaining the data from Fluid Inclusion Assemblages (FIA), that represent the finest (shortest time duration) geologic event that can be constrained using fluid inclusions (Diamond, 1990; Goldstein and Reynolds, 1994; Bodnar, 2003). Homogenization temperature (Th) data obtained from fluid inclusions is often used to reconstruct temperature history of a geologic event. The precision with which fluid inclusions constrain the temperatures of a fluid events depends on the precision with which the temperature of an FIA can be determined. Though the methodology for the rigorous collection of fluid inclusion data has been accepted for many years, acceptable ranges in data for individual FIAs in various geologic environments has not be scientifically defined. The goal of this study is to determine ranges in Th for well characterized FIAs from different geologic environments. This approach allows researchers to test the quality and reliability of fluid inclusion data, to maximize the amount of information that can be extracted from those data, and place rigorous constraints on fluid evolution and P-T history of geologic systems.
Th variations within FIAs depend on many factors that vary within different geological environments, and in order to determine minimum and acceptable temperature ranges for FIAs formed in different environments we investigated FIAs in several geologic environments, including sedimentary, metamorphic, and magmatic hydrothermal systems. The samples analyzed in this study include FIAs from quartz cement bridges in natural fractures from tight-gas sandstones of the Piceance Basin, Colorado (Fall et al., 2015), fluorite from the Cave-in-Rock fluorspar district in southern Illinois, (Richardson and Pinckney, 1984), sphalerite from the Creede, Colorado, Ag-Pb-Zn-Cu epithermal vein deposit (Roedder, 1974), quartz from the Marble Canyon Pegmatite, California, hydrothermal quartz in veins from the Bingham porphyry Cu-Au-Mo deposit, Utah (Roedder, 1971; Landtwing et al., 2005)
Figure 1. Box and whisker plots showing the range in Th within
individual FIAs sorted according to geologic environment. Shown are
the complete range in observed Th ranges, the 25th and 75th
percentiles of the ranges and the median range for a given
environment. Position along the X-axis is arbitrary and is arranged
approximately according to the scatter in observed Th range.

Pan-American Current Research on Fluid Inclusions Rice University, Houston, Texas, U.S.A., June 12-14, 2018, Abstract Volume
46
and the Copper Creek, Arizona, porphyry copper system, and quartz veins from the Meguma orogenic gold deposit in Nova-Scotia, Canada (Kontak et al., 2001). Th variation within individual FIAs range from 0 to 6 °C in the Piceance Basin, from 1 to 9 °C in fluorites from Cave-In-Rock, from 0 to 6 °C in the Creede sphalerite, from 3 to 75 °C in quartz from Copper Creek and Bingham deposits, from 3 to 28 °C in quartz from the Marble Canyon pegmatite, and from 6 to 125 °C in quartz from the Meguma metamorphic terrane (Fig. 1). Data from this study were combined with literature data reported from well-characterized FIAs in the various environments to assess the achievable ranges in Th for individual FIAs (Figure 2). We will also show examples that illustrate the precision with which the temperature of a geologic event can be constrained when data are obtained from FIAs that can be placed into a well-defined structural-diagenetic.
REFERENCES
Diamond, L.W., (1990) Fluid inclusions evidence for P-V-T-X evolution if
hydrothermal solutions in late-alpin egold-quartz veins at Brusson, Val
D’Ayas, Northwest Italian Alps. Am. J. Sci. 290, 912-958.
Goldstein, R.H., Reynolds, T.J. (1994) Systematics of fluid inclusions in
diagenetic minerals: SEPM Short Course 31, 199 p.
Bodnar, R.J. (2003) Introduction to fluid inclusions, in: Samson, I.,
Anderson, A., Marshall, D. (Eds.), Fluid Inclusions: Analysis and
Interpretation. Mineral. Assoc. Can. Short Course 32, 81-99.
Fall, A., Eichhubl, P., Bodnar, R.J., Laubach, S.E., Davis, J.S. (2015) Natural
hydraulic fracturing of tight-gas sandstone reservoirs, Piceance Basin,
Colorado. Geol. Soc. A Bull. 127, 61–75.
Kontak, D.J., Horne, R.J., Smith, P.K., 2001. Meguma gold deposits, Nova
Scotia: overview of past work with implications for future work. The
Gangue, Geol. Assoc. Can., Min. Dep. Div. Newslett. 71, 1-9.
Landtwing, M.R., Pettke, T., Halter, W.E., Heinrich, C.A., Redmond, P.B.,
Einaudi, M.T., Kunze, K., 2005. Copper deposition during quartz
dissolution by cooling magmatic-hydrothermal fluids: the Bingham
porphyry. Earth Planet. Sci. Lett. 235, 229-243.
Richardson, C.K., Pinckney, D.M., 1984. The chemical and thermal evolution
of the fluids in the Cave-in-Rock fluorspar District, Illinois: mineralogy,
paragenesis, and fluid inclusions. Econ. Geol. 79, 1833-1856.
Roedder, E., 1971. Fluid inclusion studies on the porphyry-type ore deposits
at Bingham, Utah, Butte, Montana, and Climax, Colorado. Econ. Geol. 66,
98-120.
Roedder, E., 1974. Changes in ore fluid with time, from fluid inclusion
studies at Creede, Colorado. 4th Inter. Assoc. Gen. Ore Dep. (IAGOD)
Symp., Varna, Bulgaria, Proceed. 2, 179-185.
Figure 2. The log of the total range in Th within individual FIAs from
tight-gas basins, MVT-, epithermal-, porphyry-, and orogenic gold
deposits obtained in this study and reported in the literature.

Pan-American Current Research on Fluid Inclusions Rice University, Houston, Texas, U.S.A., June 12-14, 2018, Abstract Volume
47
Evolution of deformation in the Buck Mountain Fault damage zone,
Cambrian Flathead Sandstone, Teton Range, Wyoming Stephanie R. FORSTNER, Stephen E. LAUBACH, András FALL Bureau of Economic Geology, Jackson School of Geosciences, The University of Texas at Austin, Austin, Texas, U.S.A. E-mail: [email protected]
The Teton Range is a normal fault block that contains older reverse faults (Love et al., 1992). Although generally considered to be Late Cretaceous to early Tertiary structures, the timing, kinematic style, and history of these faults is conjectural. Faults include the Forellen Peak Fault to the north, the Buck Mountain Reverse Fault (BMRF) to the west and south, and the Teton normal fault to the east (Love et al., 1992). The BMRF is rooted in Precambrian crystalline rocks and dips steeply to the east about 60°. The fractured Cambrian Flathead sandstone, an orthoquartzite (90%+ quartz), rests nonconformably on the Precambrian. Its stratigraphic position and relative isotropic mineralogy make the Flathead an ideal horizon for studying brittle deformation.
Oriented Flathead hand samples were collected from the footwall of the BMRF along a partially overturned syncline (Figure 1). Continuous SEM-Cathodoluminescence (SEM-CL) scanlines of these samples allow for a systematic kinematic analysis of the cemented opening-mode fractures. We quantify attributes such as; geometry, spacing, orientation, and cross-cutting relationships. In isotropic rock, mode-I fractures primarily propagate along the plane perpendicular to Shmin; therefore, microfractures can be used to indicate paleostress trajectories, strain, and relative fracture timing (Anders et al., 2014; Hooker et al. 2018). Since fracture cements appear synkinematic, we’ve determined the temperatures, pressures, and fluid compositions present during fracturing by conducting a high-resolution fluid inclusion assemblage (FIA) petrographic and microthermometric analysis. Our kinematic and geochemical analysis of diagenetic damage zone features provides spatial and temporal constraints on the conditions present during fracture development, the evolution of the local tectonics, and paleohydrology.
Steeply dipping fractures strike WNW, NW, and NE (Figure 1). In general, opening-mode fracture strain increases towards the fault and is highest near the fold axis. The strain calculation does not include the WNW and NE opening-mode fractures, prevalent nearest to the BMRF, which have undergone shear displacement. Fractures have opening displacements ranging from ~0.5 µm to 3 mm. A few NW fractures contain quartz bridges and have preserved porosity. SEM-CL images of diagenetic cements reveal alternating light and dark luminescing textures; overgrowths are syntaxial and zoned whereas fractures contain wall-parallel crack-seal and wall-perpendicular fibrous textures, an indication of synkinematic cementation (Lander & Laubach, 2015). Fracture cements luminesce different colors under Color-SEM-CL, suggesting variation in fluid source and composition (Figure 2). Quartz overgrowths are crosscut by fractures and, therefore, formed early. The relative evolution of each brittle deformation period is supported by cross-cutting relationships and FIAs which reveal; WNW fractures formed first, followed by NW fractures, and lastly NE fractures.
The fluids present during overgrowth and fracture cementation are preserved in primary two-phase aqueous FIAs. Initial ice melting temperatures suggest cements precipitated from a H2O-NaCl-CaCl2(±MgCl2)-type
Figure 1: Flathead Sandstone syncline and fault at Kit Lake (43.716, -110.832). Sample locations, length-weighted fracture strike rose diagrams, and calculated total microfracture strain.

Pan-American Current Research on Fluid Inclusions Rice University, Houston, Texas, U.S.A., June 12-14, 2018, Abstract Volume
48
fluid; however, only TmICE was observed. Therefore, we calculated salinity (expressed as wt% NaCl equivalent) assuming a H2O-NaCl fluid model (Steele-MacInnis et al., 2012). Within petrographic context, minimum trapping temperatures (Th) and salinity provide temporal geochemical trends of deformation (Figure 3). Quartz overgrowths; Th: 135-209°C and salinity: 4 to 7.5 wt.%. WNW-fractures; Th: 140-170°C and salinity: 2.0-6.9 wt.%. NW fractures; Th: 136-160°C and salinity: 11.7-13.5 wt.%. NE fractures; Th: 110-191°C and salinity: 4.8-5.1 wt.%. On average, Th ranges by 16.5°C within a single FIA.
Diagenetic cements precipitated from a wide range of fluid conditions. However, we can begin to temporally constrain fracture kinematics and fluid conditions present during diagenesis. Temperatures in quartz overgrowths show a heating trend which is compatible with progressive burial to maximum burial conditions. Cross-cutting relations and temperatures in fractures show a general cooling trend and suggest brittle deformation occurred after maximum burial, probably during uplift. Assuming fractures formed during tectonic shortening, orientations and cross-cutting relations suggest SHmax rotated from WNW to NW and finally to NE.
ACKNOWLEDGEMENTS
We are grateful to Grand Teton National Park for permission to sample under National Park Service permits GRTE-2014-SCI-0021 and GRTE-2017-SCI-0072.
REFERENCES
Anders, M.H., Laubach, S.E., Scholz, C.H., 2014, Microfractures: a review. J. Struct. Geol. 69B, 377-394.
Hooker, J.N., Laubach, S.E., Marrett, R., 2018, Microfracture spacing distributions and the evolution of fracture
patterns in sandstones, J. Struct. Geol. 108, 66-79.
Lander R.H., Laubach, S.E., 2015, Insights into rates of fracture growth and sealing from a model for quartz
cementation in fractured sandstones. Geol. Soc. Amer. Bull. 127(3-4), 516-538.
Love, J.D., Reed, J.C., Christiansen, A.C., 1992, Geologic map of Grand Teton National Park, Teton County, Wyoming;
1:62,500, USGS.
Steele-MacInnis, M., Lecumberri-Sanchez, P., & Bodnar, R.J., 2012, HokieFlincs H2O-NaCl: A Microsoft Excel
spreadsheet for interpreting microthermometric data from fluid inclusions based on the PVTX properties of H2O-
NaCl, Comp. Geosci. 49, 334-337.
Figure 2: Color-SEM-CL images of WNW, NW, and NE striking fractures in sample ST-03-1A. G-grain; P-porosity; O-quartz overgrowth; F-fracture.
Figure 3: Fluid inclusion assemblage microthermometry results from quartz overgrowths and fractures. Cross-cutting relationships support the relative sequence (timing) of each diagenetic feature.

Pan-American Current Research on Fluid Inclusions Rice University, Houston, Texas, U.S.A., June 12-14, 2018, Abstract Volume
49
Invited – A new approach to understand natrocarbonatite formation
based on melt and fluid inclusions from the Kerimasi volcano,
Tanzania Tibor GUZMICS1, Márta BERKESI1, Ralf MILKE2, Csaba SZABÓ1
1Lithosphere Fluid Research Lab, Eötvös Loránd University, Budapest, Hungary 2Institute of Geological Sciences, Freie Universität, Berlin, Germany
E-mail: [email protected]
The origin and evolution of natrocarbonatites at Oldoinyo Lengai volcano in East Africa has been the subject of debates for many years among petrologists, and there are still many questions left unanswered. A possible model for the formation of natrocarbonatite is by fractionation of calcite+apatite from a Ca-rich carbonate melt. However, no calciocarbonatite rocks have been found at Oldoinyo Lengai. A different model relates the formation of natrocarbonatites from a condensed fluid phase without the presence and contribution of any carbonate melt. In order to understand the genesis of this system we analyzed melt and fluid inclusion (MI and FI) from nephelinite, as these inclusions are the only direct means to study the carbonate melt and the fluid condensate potentially responsible for the formation of natrocarbonatites.
The Kerimasi volcano is located adjacent to Oldoinyo Lengai, where the nepheline phenocrysts from a nephelinite rock used in our study were collected from. The MI and FI occur along growth zones in nepheline, supporting their primary origin. Microthermometry and furnace experiments of the MI show entrapment temperature at ~850 °C. MI and FI petrography of the quenched material revealed the co-existence of an immiscible silicate melt, carbonate melt, and a fluid phase at this temperature, showing the typical appearance of heterogeneous entrapment (e.g., wide range in the volume percentages of the three phases in the inclusions). As a consideration, composition of the three immiscible phases was estimated in our samples to see which one(s) could be the precursor of natrocarbonatite. Exposed silicate glasses and carbonate melts have been analyzed by electron microprobe. Concentrations of H2O and CO3 have been calculated based on their Raman spectra. The FI have been analyzed by Raman spectroscopy combined with heating experiments. We also carried out FIB-SEM-EDS analyses on a previously Raman-imaged FI. It is noteworthy to mention that none of the observed phases is dominated by H2O, even though many studies suggest that a H2O-rich environment is essential to attain natrocarbonatite composition. However, the carbonate melt is highly enriched in fluorine; both the silicate glass and the CO2-rich fluid contain significant amount of F. Fluorine could possibly be a key factor in understanding the carbonatite volcanism as the presence of this element suppresses the calcite liquidus, and maintains the carbonate melt in a liquid state near the eruption temperature of Na-carbonatites. This is supported by the lack of primary calcite in the rock. If so, then calcite fractionation cannot be responsible to reach natrocarbonatite composition in our samples. However, the carbonate melt alone is not a natrocarbonatitic melt.
The FI contains CO2 vapor, natrite and nahcolite, as observed by detailed Raman spectroscopic imaging (Fig. 1). The natrite and nahcolite are assumed to be the result of fluid condensation. In addition, nahcolite is thought to be formed via sub-solidus chemical reaction of Na2CO3 (natrite) + H2O + CO2 = 2NaHCO3 (nahcolite) at < 120 °C during cooling. This was
Figure 1. Raman-image of a nephelinite-coexisting fluid inclusion
quenched from 850 oC. Natritess – natrite solid solution.

Pan-American Current Research on Fluid Inclusions Rice University, Houston, Texas, U.S.A., June 12-14, 2018, Abstract Volume
50
demonstrated by heating experiments on FI observed with Raman spectroscopy, where nahcolite dissociated < 200 °C, resulting in formation of natrite and CO2+H2O vapor phase within the FI. Upon further heating, natrite crystals melt forming a liquid phase, suggested by the rapid increase of the FWHM (Full Width at Half Maximum) of the highest intensity Raman band at around 1078 cm-1.
FIB-SEM-EDS analyses combined with Raman spectroscopy-based imaging of fluid condensates show an alkaline composition much like that of natrocarbonatites. Based on the composition of the MI and FI it is unlikely that the natrocarbonatite magma is originated from either the fluid or the carbonate melt equilibrated with nephelinite. We presume that once CO2 and H2O outgassing takes place, the carbonate melt subsequently became miscible with a natrite-rich liquid. Therefore, the formation of the natrocarbonatite is likely due to the hybrid mixing of the degassed fluid and carbonate melt “endmembers”. REFERENCES
de Moore et al. (2013) Volatile-rich silicate melts from Oldoinyo Lengai volcano (Tanzania): Implications for carbonatite genesis and eruptive behavior, Earth Planet. Sci. Let., 361, 379-390.
Jago, Gittins. (1991) The role of fluorine in carbonatite magma evolution, Nature, 349, 56-58. Nielsen, Veksler. (2002) Is natrocarbonatite a cognate fluid condensate? Contrib. Mineral. Petrol., 142, 425-435. Weidendorfer et al. (2017) A common origin of carbonatite magmas, Geology, 45, 507-510.

Pan-American Current Research on Fluid Inclusions Rice University, Houston, Texas, U.S.A., June 12-14, 2018, Abstract Volume
51
Microthermometric and LA-ICP-MS measurements of hematite-hosted
fluid inclusions reveal the temperature and composition of ore-
forming fluids, Buckskin-Rawhide Mountains, western Arizona, USA Jordan JENSEN1, Paulo COUTINHO1, Oscar LAURENT2, Jon SPENCER1, Matthew STEELE-MACINNIS3 1Department of Geosciences, University of Arizona, Tucson, Arizona, U.S.A. 2Institute for Geochemistry and Petrology, ETH, Zürich, Switzerland 3Deptartment of Earth & Atmospheric Sciences, University of Alberta, Edmonton, Alberta, Canada E-mail: [email protected] The Buckskin-Rawhide detachment system in western Arizona, USA, hosts voluminous deposits of Fe and Mn oxides, including specular hematite. The presence of minor Cu and Fe sulfides suggests that mineralization occurred along redox interface that separated shallow, oxidizing fluids from deeper-seated, reducing fluids. Rapid exhumation along the main detachment fault during the Miocene likely provided the reducing, metal-bearing fluids a pathway for ascent toward more oxidizing conditions above (Spencer and Welty, 1986; Evenson et al., 2014). Wilkins et al. (1986) estimated that these fluids were ~225-325 °C. These temperature estimates were provided by microthermometry of quartz-hosted fluid inclusions, which are assumed to be coeval with nearby specular hematite mineralization. However, this assumption is not always valid, considering that quartz-hosted fluid inclusions can easily be modified by later recrystallization events (Lüders, 2016). In this contribution, we constrain the temperature and salinity of the Fe-bearing parent fluids by directly analyzing fluid inclusions hosted within hematite using infrared light (Fig. 1). Additionally, we use laser ablation inductively coupled plasma mass spectrometry (LA-ICP-MS) of hematite-hosted fluid inclusions to quantify the composition of Fe-bearing fluids. Hematite-hosted fluid inclusions yield minimum trapping temperatures of 284 °C to 315 °C, which overlap with homogenization temperatures from quartz-hosted fluid inclusions, implying that quartz and hematite mineralized concurrently. Hematite-hosted fluid inclusions indicate that mineralizing fluids were moderately saline, which is broadly consistent with microthermometric data from quartz-hosted fluid inclusions. Major solutes include Na, K, and Cl, with minor amounts of Cu, Zn, Sr, and Rb. Overall, these data provide the first quantitative estimate of ore-forming fluids that mobilized through the Buckskin-Rawhide detachment system. REFERENCES
Evenson, N.S., Reiners, P.W., Spencer, J.E., and Shuster, D.L., 2014, Hematite and Mn oxide (U-Th)/He dates from the Buckskin-Rawhide detachment system, Western Arizona: Gaining insights into hematite (U-Th)/He system: American Journal of Science, v. 314, p. 1373–1435, doi: 10.2475/10.2014.01.
Lüders, V., 2016, Contribution of infrared microscopy to studies of fluid inclusions hosted in some opaque ore minerals: possibilities, limitations, and perspectives: Mineralium Deposita, v. 91, p. 1462–1468, doi: 10.1007/s00126-016-0694-4.
Spencer, J.E., and Welty, J.W., 1986, Possible controls of base- and precious- metal mineralization associated with Tertiary detachment faults in the lower Colorado River trough, Arizona and California (USA).: Geology, v. 14, p. 195–198, doi: 10.1130/0091-7613(1986)14<195:PCOBAP>2.0.CO;2.
Figure 1. Infrared light photomicrograph of two-
phase fluid inclusions within Buckskin-Rawhide
hematite.

Pan-American Current Research on Fluid Inclusions Rice University, Houston, Texas, U.S.A., June 12-14, 2018, Abstract Volume
52
Wilkins, J., Beane, R. E., and Heidrick, T. L., 1986, Mineralization related to detachment faults: a model, in Beatty, B.,
and Wilkinson, P. A. K., editors, Frontiers in geology and ore deposits of Arizona and the southwest: Arizona
Geological Society Digest, v. 16, p. 108–117.

Pan-American Current Research on Fluid Inclusions Rice University, Houston, Texas, U.S.A., June 12-14, 2018, Abstract Volume
53
Liquid hydrocarbons in intracellular mineral precipitates in the
vertebrae of a Jurassic marine reptile – animal or petroleum origin? Jan Braly KIHLE1, Jørn Harald HURUM2, Lene LIEBE2 1Institute for Energy Technology, Kjeller, Norway 2Natural History Museum, University of Oslo, Oslo, Norway
E-mail: [email protected]
Two samples of a vertebra and a jawbone from two specimens of the Upper Jurassic carnivorous marine reptile Pliosaurus funkei from Spitsbergen have been described with respect to findings of fluorescing inclusions of liquid hydrocarbons (HCFI) hosted in mineral precipitates representing a former primary skeletal porosity (Fig. 1). Analyses were undertaken to elucidate potential animal and/or petroleum derivation(s) of the fluid(s) and possibly the timing of infilling with respect to the burial history of the hosting Pliosaurus. The HCFI temperature of homogenization ranges from 47 to 117°C. The earliest trapped fluids are primary aqueous inclusions occurring in calcite and barite close to the boundary to the skeletal matrix, followed by (or pene-contemporaneously with) isolated, bluish-fluorescing, primary petroleum inclusions in vicinity of the aqueous fluid inclusions in barite. These inclusions homogenize at the highest measured temperatures. Subsequently trapped hydrocarbons homogenize at lower temperatures as their density increases. Such observations of decreasing API (increasing density) with decreasing temperature may be related to secondary changes in migrated petroleum during earlier documented uplift at Spitsbergen. Biomarkers reflect a depositional condition for the Upper Jurassic shales, i.e., the source rock expelling petroleum was potentially the rock occurring just below the Pliosaurus-bearing strata. In addition to inclusions validating a petroleum origin, a few low-viscosity, reddish-brown colored inclusions, not likely to represent a bituminous liquid, are observed, potentially of an animal origin.
Figure 1. Representative images (white light and 365 nm UV) of samples and inclusions observed within.

Pan-American Current Research on Fluid Inclusions Rice University, Houston, Texas, U.S.A., June 12-14, 2018, Abstract Volume
54
Figure 2. GC FID chromatograms of the extracted Pliosaurus fluid and two reference hydrocarbon fluids, including an UV micrograph of the skeletal porosity of a present-day leatherback turtle.
The combined applications of micro-thermometry and fluorescence spectroscopy on liquid hydrocarbons discovered as fluid inclusions trapped in Calcite and Barite crystals of the reptile backbone reveals a continuous lowering of minimum trapping temperature conditions as entrapment of denser petroleum progresses, indicative of a prolonged uplift scenario. The fluid composition of the most prominent type of trapped petroleum (TYPE 2) is indicative of an Upper Jurassic source rock buried to a maximum of 2300-2500 m depth. The presence of the Phytane biomarker in this GC chromatogram (Fig. 2) however exclude a marine origin of the TYPE 2 hydrocarbons, since this biomarker originates from chlorophyllic precursors only.
The presence of a few anomalous hydrocarbon fluid inclusions TYPE 3 differing from commonly occurring TYPE 1 or TYPE 2 petroleum inclusions may nevertheless contain remnants of an animal origin. A careful preparative isolation of fluid inclusion chips containing TYPE 3 inclusions should be made, to be followed by controlled fluid inclusion decrepitation directly into a GC-MS. Chromatograms and biomarker analysis of TYPE 3 fluid inclusions may subsequently be compared to the signatures of leatherback turtles, the closest living relative to the Pliosaurs, bearing in mind that biomarkers are de-functionalized and not identical to what is found in living matter. An absence of the biomarker Phytane in the TYPE 3 GC-MS chromatograph would hence point towards the fact that these anomalous inclusions represent the oldest oil or fat from an animal origin yet known to man.
REFERENCES
Coghlan, A. (2009) Fossil of ‘ultimate predator’ unearthed in Arctic.
https://www.newscientist.com/article/dn16785-fossil-of-ultimate-predator-unearthed-in-arctic
Knutsen, E.M., Druckenmiller, P.S. & Hurum, J.H. (2012) A new species of Pliosaurus (Sauropterygia: Plesiosauria) from the Middle Volgian of central Spitsbergen, Norway. Norwegian Journal of Geology, Vol 92, pp. 235-258.

Pan-American Current Research on Fluid Inclusions Rice University, Houston, Texas, U.S.A., June 12-14, 2018, Abstract Volume
55
P-T paths of H2O-NaCl fluid inclusions during heating to the
homogenization temperature Yury I KLYUKIN, Robert J. BODNAR Fluids Research Laboratory, Department of Geosciences, Virginia Tech, Blacksburg, Virginia, U.S.A.
E-mail: [email protected]
One of the fundamental properties of fluid inclusions (FI) is the homogenization temperature (TH). The homogenization temperature represents the minimum temperature of trapping of fluid inclusions, and also represents the starting PT point of the isochore (line of constant density or volume) corresponding to the FI density. While the PT path followed by the FI following homogenization is straightforward and is constrained to lie along the isochore, some confusion exists concerning the PT path followed by the FI during heating from ambient temperature to TH. Because FI represent constant volume, constant composition systems, the PT path followed by the FI during heating to the homogenization temperature may be constrained based on mass balance calculations involving the PVTX properties of the appropriate fluid system, as described by Bodnar (1983). Here, we describe the path followed by FI represented by the system H2O-NaCl.
The bulk density of the FI (ρBLK) is calculated at the homogenization temperature (TH) and the pressure on liquid + vapor curve (PL+V) corresponding to the salinity of the FI (XBLK). The total mass of H2O plus NaCl in a FI (mBLK) of unit volume is then defined as mBLK=ρBLK·VBLK (eq. 1), where VBLK represents the unit volume of the FI. The mass fraction of NaCl in the FI (XBLK) is calculated from the known salinity as is defined as mNaCl=mBLK· XBLK (eq. 2). At temperatures, TX, below TH, the FI contains a low salinity vapor phase and a higher salinity liquid phase with masses mV and mL, respectively, and salinities XV an XL for each phase. The bulk mass of the FI can be expressed as mBLK = mL + mV (eq. 3), while the mass of NaCl in the FI is defined as mNaCl = mL·XL + mV·XV, (eq. 4). The mass of the liquid phase can be expressed from Eq. 4 as mL = (mNaCl - (mBLK - mL)·XV) / XL (eq. 5), where (mBLK - mL) represents the substitution of mV = mBLK - mL (eq. 6) from eq. 3. After rearrangement, the mass of the liquid phase can be calculated according to: mL = (mNaCl - mBLK ·XV) / (XL - XV) (eq. 7). The mass of the vapor phase then can be calculated from eq.6.
The volume of the FI, VBLK, remains constant and can be calculated according to: VBLK = mL / ρL + mV / ρV (eq. 8), where ρL and ρV are the density of liquid and vapor phases, evaluated at temperature Tx, the salinity of XL and XV and pressure in FI Px. To maintain a constant volume, VBLK, at all temperatures TX<TH, the pressure Px must be less than the pressure on the liquid-vapor curve for the FI bulk salinity, PL+V, calculated at each temperature, TX, and salinity, XBLK. At each temperature, TX, the pressure, Px, is decreased incrementally, starting at the pressure on the liquid-vapor coexistence curve. At each new pressure, Px, the salinities and densities of the liquid and vapor phases are calculated, and this information is used to estimate VBLK at each pressure, Px, until the appropriate pressure at which the salinities and densities of the coexisting liquid and vapor phases satisfy the mass balance constraints described above.
The approach described above is illustrated using an example FI with 10 wt. % NaCl salinity, with TH of 350 °C and unit volume, VBLK, of 1 cm3 (Note that the actual volume assumed for the FI does not affect the results). Properties of H2O-NaCl fluid phases, calculated using the SoWat model of Driesner (2007) and Driesner & Heinrich (2007), were combined in an MS Excel VBA macro (Klyukin et. al, in prep). The Tx range for the model varies from 101°C to TH, due to the 1 bar lower pressure limit of the SoWat model.
The liquid + vapor curve for 10 wt. % NaCl is shown in Fig. 1A, with homogenization temperature TH and isochore for the FI shown by the dashed line labeled ρFI. At pressures below the L+V curve, two phases exist in equilibrium. The difference Px-PL+V, defined as LV pressure decrement, is shown in Fig. 1B. The decrease in the size of the bubble in the FI with each degree of temperature change is larger at higher temperatures, as shown by the relative change in bubble volume with temperature (Fig. 1C). The vapor phase salinity, XV, increases with increasing temperature, while the salinity of liquid phase, XL, reaches a maximum at about 300 °C and then asymptotically approaches 10 wt. % NaCl as the mass of fluid in the vapor phase approaches zero at low temperatures (Fig. 1D). The absolute masses of the liquid (mL) and vapor (mV) phases show opposite trends, with an inflection point at ~300 °C (Fig. 1E). Figures 1F and 1G show variations in density and volume for both phases in the FI at various temperatures.

Pan-American Current Research on Fluid Inclusions Rice University, Houston, Texas, U.S.A., June 12-14, 2018, Abstract Volume
56
REFERENCES
Bodnar, R. J. (1983). A method of calculating fluid inclusion volumes based on vapor bubble diameters and P-V-T-X
properties of inclusion fluids, Economic Geology, 78(3), 535-542.
Driesner, T. (2007). The system H2O-NaCl. II. Correlations for molar volume, enthalpy, and isobaric heat capacity
from 0 to 1000 °C, 1 to 5000 bar, and 0 to 1 X-NaCl, Geochimica et Cosmochimica Acta, 71(20), 4902-4919.
Driesner, T., & Heinrich, C. A. (2007). The system H2O-NaCl. I. Correlation formulae for phase relations in
temperature-pressure-composition space from 0 to 1000 °C, 0 to 5000 bar, and 0 to 1 XNaCl, Geochimica et
Cosmochimica Acta, 71(20), 4880-4901.
Figure 1. Variations in liquid (L) and vapor (V) phases of a fluid inclusion as a function of temperature for an
inclusion that homogenizes to the liquid phase at 350 °C and has a salinity of 10 wt. % NaCl. A) L+V phase
diagram for 10 wt. % NaCl, indicating homogenization point (Th) and isochore (ρFI) of the FI. Grey area
indicates PT region where only L+V phases can coexist in equilibrium. B) difference between pressure in FI
(PX) and pressure on the L+V curve at that same temperature; C) volume percent vapor in FI; salinity (D),
mass (E), density (F) and volume (G) of L and V phases at temperatures Tx≤TH.

Pan-American Current Research on Fluid Inclusions Rice University, Houston, Texas, U.S.A., June 12-14, 2018, Abstract Volume
57
Invited – Rates of serpentinization in pyroxene micro-reactors Hector LAMADRID, Zoltán ZAJACZ Department of Earth Sciences, University of Toronto, Toronto, Ontario, Canada E-mail: [email protected]
Serpentinization is a critical geologic process that occurs when ultramafic minerals (mantle rocks) interact with aqueous fluids. The chemical and petrological processes that accompany serpentinization and the interactions between the ocean and the oceanic lithosphere have become some of the most important subjects in the scientific literature, and are key to understand the physical, chemical and biological evolution of the Earth’s system (Kelley et al. 2001). They are also central to current origin of life hypotheses (Martin et al. 2008), as well as the search for microbial life on the icy moons of Jupiter and Saturn (Vance et al. 2016).
Despite the pivotal role that serpentinization plays in a number of geological and biological processes, few experimental studies have attempted to determine the rates of serpentinization reactions, and the rates that have been reported diverge widely (McCollom et al. 2016). Moreover, the specifics on how the environmental factors (like temperature, fluid composition, fO2, salinities, etc.) control the serpentinization reactions of olivine are not completely understood, and in the case of pyroxene almost nonexistent. Recent studies on rates of serpentinization using a novel in situ experimental technique using micro-reactors (Lamadrid, 2016; Lamadrid et al. 2017; Lamadrid et al., in prep.) have shown that the serpentinization reaction of olivine is sensitive to the fluid composition and salinity and even small increases in salinity and addition of Mg2+and CO2 to the fluid slows down the reaction by several orders of magnitude.
Here we show partial results on the application of the micro-reactor technique on gem quality enstatite crystals as a function of temperature and salinity using piston cylinder experiments to trap synthetic fluid inclusions (SFI).
The micro-reactors are synthetic fluid inclusions (SFI) used to monitor the hydration reaction (hydrolysis) of ultramafic minerals by measuring changes in the internal composition of the fluid. The experimental technique uses two steps. First, we trapped SFI with aqueous fluids with different salinities (H2O-NaCl 3.5 and 10 wt% eq. NaCl) in pyroxene at elevated P-T where the minerals were in equilibrium with the fluids. The P-T selected to trap the SFI (12 to 5 Kbar at 1000 ºC) was such that the internal pressure of the inclusion at the serpentinization temperature of pyroxene (200 to 450 ºC) would be ~500 bars. Then, after detailed petrographic investigation, wafers of the crystals were set at temperatures allowing serpentinization of pyroxene and monitored every 5 to 20 days. After a few days of reaction time, small clusters of secondary minerals (serpentine + talc ± magnetite) formed inside the SFI (Figure 1). Reaction progress was monitored by low temperature microthermometry measuring the changes in the salinity of the SFI as a proxy of the amount of H2O consumed by the reaction enstatite + H2O = serpentine + talc.
Figure 1. Photomicrograph of SFI in pyroxene before (A)
and after (B) 10 days of the serpentinization experiment.
The reaction products inside the inclusions are
serpentine (brown-green), talc (white) and magnetite
(black).

Pan-American Current Research on Fluid Inclusions Rice University, Houston, Texas, U.S.A., June 12-14, 2018, Abstract Volume
58
Preliminary results show that the serpentinization rates of pyroxene are faster than those of olivine at higher temperatures (300-400 ºC) where serpentinization of olivine becomes sluggish. The maximum rates obtained at 400 ºC which represents an offset of 150 ºC with the maximum serpentinization rates of olivine (Figure 2). The micro-reactor technique used in this study is a powerful tool to monitor fluid-rock reactions in situ and in real time and can be applied to a wide variety of host minerals, reaction products, temperatures and different starting fluid compositions.
REFERENCES
Kelley D. et al. (2001) An off-axis hydrothermal vent field near the Mid-Atlantic Ridge at 30 degrees N. Nature 412, 145–149.
Martin W. et al. (2008) Hydrothermal vents and the origin of life. Nat Rev Microbiol 6, 805. Vance S. D. et al. (2016) Geophysical controls of chemical disequilibria in Europa. Geophys Res Lett 43, 4871–4879. McCollom et al. (2016) Temperature trends for reaction rates, hydrogen generation, and partitioning of iron during
experimental serpentinization of olivine. Geochim Cosmochim Acta 181, 175–200. Lamadrid H.M. (2016) Published Ph.D. Dissertation, Virginia Tech. Lamadrie H.M. et al. (2017) Effect of water activity on rates of serpentinization of olivine. Nat Commun. 8, 16107. Lamadrid H.M. et al. Effect of temperature and fluid composition on rates of serpentinization of olivine. In
preparation.
Figure 2. Comparison of the serpentinization rates of olivine with the
preliminary results of this study (light green).

Pan-American Current Research on Fluid Inclusions Rice University, Houston, Texas, U.S.A., June 12-14, 2018, Abstract Volume
59
Keynote – Genetic relationship between mineral paragenesis, fluid
chemistry and fluid source in a tungsten vein deposit: Panasqueira Pilar LECUMBERRI-SANCHEZ1, Christoph A. HEINRICH2, Markus WÄLLE2,3, Marta CODEÇO4, Phillip WEIS4, Marta SOŚNICKA4, Filipe PINTO5 1Deptartment of Earth & Atmospheric Sciences, University of Alberta, Edmonton, Alberta, Canada 2Institute fur Geochemie und Petrologie, ETH Zurich, Switzerland 3Earth Sciences Department, Memorial University of Newfoundland, Canada 4Inorganic and Isotope Geochemistry, GFZ German Research Centre for Geosciences, Potsdam (Germany) 5Institute of Earth Sciences (ICT), Pole of University of Porto, Portugal
E-mail: [email protected]
Panasqueira is a world-class tungsten-vein deposit. Several paragenetic stages have been proposed (Polya et al., 2000) including two pre-ore stages (crack-seal quartz-seam, and muscovite selvages); and four ore stages (main oxide-silicate stage, main sulfide stage, pyrrhotite alteration stage, and late carbonate stage). In this study, compositions of the mineralizing fluids at Panasqueira have been determined through combination of detailed petrography, microthermometric measurements and LA-ICP-MS analyses. We have identified the fluids related to several mineralizing stages in the system.
Three fluid generations recorded in pseudo-secondary to secondary fluid inclusions have been identified at Panasqueira and their chemical composition has been characterized. The first fluid generation identified in quartz and wolframite consists of CO2-bearing fluid inclusions with homogenization temperatures ranging between 260 and 320 °C and salinities between 5 and 8 eq. wt% NaCl. Petrographic constraints indicate that this first generation (1) is paragenetically related to the main oxide-silicate stage. This stage (1) was likely trapped under high pressures and lithostatic conditions. Two lower-temperature CO2-absent fluid generations (2a and 2b) have been identified in quartz and are represented by secondary fluid inclusions postdating the main oxide-silicate stage. Generation (2a) consists of high-salinity (20-30 eq. wt% NaCl) fluids with homogenization temperatures ranging between 180°C and 250°C. Generation (2b) consists of low-salinity (<2 wt %) low homogenization temperature (100-150°C) fluid inclusions. Conclusive petrographic evidence of the relationship between these two late-stage fluid generations and specific late mineral stages are scarce. However, fluid compositions suggest that generation (2a) is related to the main sulfide stage and generation (2b) is related to the late carbonate stage.
The fluids at Panasqueira show a PTX evolution from an early magmatic-like chemical signature in good agreement with isotopic data (Codeço et al., 2017) to a signature that seems to indicate an influx of non-magmatic fluids at least in the latest stages of mineralization (late carbonate stage). REFERENCES
Codeço, M. et al. (2017) Chemical and boron isotopic composition of hydrothermal tourmaline from the Panasqueira
W-Sn-Cu deposit, Portugal, Chemical Geology 468, 1-16
Polya, D.A. et al. (2000) Evolution and paragenetic context of low δD hydrothermal fluids from the Panasqueira W-
Sn deposit, Portugal: New evidence from microthermometric, stable isotope, noble gas and halogen analyses of
primary fluid inclusions, Geochimica et Cosmochimica Acta 64, 3357-3371.

Pan-American Current Research on Fluid Inclusions Rice University, Houston, Texas, U.S.A., June 12-14, 2018, Abstract Volume
60

Pan-American Current Research on Fluid Inclusions Rice University, Houston, Texas, U.S.A., June 12-14, 2018, Abstract Volume
61
Fluid inclusion characteristics at the El Hammam REE-rich fluorite
deposit Pilar LECUMBERRI-SANCHEZ1, M. BOUABDELLAH2, O. ZEMRI2 1Deptartment of Earth & Atmospheric Sciences, University of Alberta, Edmonton, Alberta, Canada 2Department of Geosciences, Mohammed Premier University, Oujda, Morocco
E-mail: [email protected] Low-temperature (100–160 °C) hydrocarbon-bearing brines mobilize REE at concentrations up to several thousand ppm total rare earth elements (ΣREE) at El Hammam, Morocco. The major element chemistry (Na, Ca, Mg) and temperature of the fluids in this system are consistent with those of oil field brines. In contrast, REE concentrations in the fluid suggest a significant element input from a magmatic source. Spatially related lamprophyres predating the formation of El Hammam share a similar trace element signature. Therefore, hydrocarbon-bearing basinal brines seem to have leached some of these elements through fluid–rock interaction from the lamprophyres, supporting the ability of oil-field brines to mobilize not only base metals (as in Mississippi Valley Type [MVT] deposits), but also rare earth elements.
The stability constants of REE aqueous complex at temperatures of 100–160 °C, the chemistry of oil-field brines worldwide, and the partitioning behavior of REE between fluorite and water at El Hammam indicate that acetate (± carbonate and fluoride) are likely to be major contributors to REE mobilization in these settings. The direct implications of the low temperature transport of REE by oil-bearing brines is that, in systems where these kind of fluids occur, the REE signature observed may not reflect the source of the fluid as much as a combination of fluid source and fluid-rock interaction. In addition, oil-field brines can efficiently scavenge, transport, and deposit REE leading to anomalously high accumulations such as the El Hammam fluorite deposit and may also contribute to REE mobilization and concentration in other systems.

Pan-American Current Research on Fluid Inclusions Rice University, Houston, Texas, U.S.A., June 12-14, 2018, Abstract Volume
62

Pan-American Current Research on Fluid Inclusions Rice University, Houston, Texas, U.S.A., June 12-14, 2018, Abstract Volume
63
Application of fluid inclusions to study low-temperature diagenesis in
Miocene carbonates, La Molata, SE Spain Zhaoqi LI1,2, Robert GOLDSTEIN2, Evan FRANSEEN2,3 1CGG, Houston, Texas, U.S.A. 2Department of Geology, the University of Kansas, Lawrence, Kansas, U.S.A. 3Kansas Geological Survey, Lawrence, Kansas, U.S.A. E-mail: [email protected]
Carbonate rocks are susceptible to diagenetic alterations, which could significantly modify the pore system and rock properties. As carbonate platforms commonly aggrade into shallow water, early influx of meteoric fluids is to be expected. The introduction of meteoric waters into carbonate systems can from two distinct diagenetic low-temperature environments, including mixing-zone and freshwater environments. This study investigated the diagenetic effect on porosity and permeability in an Upper Miocene carbonates in SE Spain, by integrating petrography, core analysis, fluid inclusions, and stable isotopes of carbon and oxygen.
Mixing of fluids from freshwater and seawater has been proposed as one of the mechanisms for dolomitization since previous studies of low-temperature dolomites (Hanshaw et al. 1971; Land 1973). After their initial work, many researchers invoked mixing-zone dolomitization model to explain dolostones that lack evaporates association (e.g., Land et al. 1975; Humphrey 1988). Criticisms of this model, however, have continued since the 1980s (Machel and Mountjoy 1986). Reexamination of some of the classic examples of mixing-zone dolomite have shown that they did not form in mixing zones, but either formed from seawater followed by partial alteration (recrystallization) in freshwater, or resulted from hydrothermal fluids (Land 1991; Machel and Burton 1994). In addition, numerous studies have shown that modern and ancient mixing zones lack pervasive dolomite. In light of these studies, many have suggested that the mixing-zone dolomitization model should no longer be considered viable. This study proposed a new model of dolomitization from mixing by ascending freshwater with mesohaline marine waters. In Study area, dolomitization occurred at the end of the Miocene, but before Pliocene deposition. Dolomite occurs as replacement and cement; both have well-preserved CL zonations. Fluid inclusion Tm ice values range from -0.2 to -2.3 °C (Fig. 1), indicating fluid
mixing of freshwater and evaporated seawater. 18O
and 13C are characterized by positive covariation,
with +0.9 to +6.0‰ VPDB for 18O, and -4.5 to +3.0‰
VPDB for 13C. Lower stratigraphic units are more
depleted in 18O and 13C compared to upper stratigraphic units. 87Sr/86Sr values (0.70866 to 0.70904) range from less than to greater than that of late Miocene seawater values. All data are consistent with injection of freshwater into the carbonates from below. Upward flow of meteoric waters, driven by hydraulic head from the hinterland, creates fluid mixing and leads to loss of pressure and degassing of CO2. This ascending freshwater-mesohaline mixing is responsible for dolomitization at La Molata, and may be applicable to Miocene dolomitization around the western Mediterranean. The model can also be applied to carbonate systems adjacent to paleotopographic highs, where freshwater discharges into slightly evaporated seawater.
After dolomitization, long periods of subaerial exposure have resulted in extensive calcite cementation. While modern carbonate sediments typically have high porosity values of 40 to 70% (Enos and Sawatsky, 1981), ancient carbonate rocks commonly only have a few percent porosity (Choquette and Pray, 1970). Though porosity could be reduced from mechanical compaction during burial, many studies have shown that reduction of porosity and permeability can be attributable to early meteoric cementation (e.g., Goldstein, 1988; Moss and Tucker, 1995). Few studies, however, provide quantitative data on the controls that determine where meteoric calcite cementation
Figure 1. Frequency histogram showing distribution of Tm-ice measurements of primary fluid inclusions in dolomite. Tm-ice below -1.9° indicates evaporation, and above -1.9° indicates involvement of freshwater.

Pan-American Current Research on Fluid Inclusions Rice University, Houston, Texas, U.S.A., June 12-14, 2018, Abstract Volume
64
is important, and what effect it has on porosity and permeability. The second purpose of this work is to investigate calcite cementation in study area. This study shows the carbonate succession has an upper and a lower zone of extensive calcite cementation; each zone boundary cuts across the stratigraphy. Cement textures suggest phreatic conditions. Cement in each of the two zones has a unique cathodoluminescence signature. Cement in the upper cemented
zone has two meteoric calcite lines with 18O at -5.1 ‰ and -5.8 ‰ VPDB, whereas
the lower cemented zone is at -6.7‰ VPDB. 13C for both are predominantly negative values, ranging from -10 to +2 ‰ PDB, suggestive of soil-gas. Measurements of Tm ice in primary fluid inclusions yield a mode of 0.0 °C in both zones, indicating calcite cementation from fresh water (Fig. 2). The upper cemented zone pre-dated the lower cemented zone on the basis of known relative sea-level history. These two zones are associated with the positions of two different paleo-water tables of different ages that formed during relative sea-level fall and erosional downcutting of the landscape during the Plio-Pleistocene. Meteoric calcite cementation reduced porosity and permeability, but measured values are inconsistent with simple filling of open pore space. There are different relationships between percent calcite cement and porosity/permeability for each lithofacies. Distribution of cements may be predictable on the basis of known sea-level history. The cementation can be incorporated into subsurface geomodels by defining surfaces that separate cemented zones from uncemented zones, and applying lithofacies specific relationships between cementation, porosity and permeability.
REFERENCES
Choquette, P.W., and Pray, L.C., 1970, Geologic nomenclature and classification of porosity in sedimentary
carbonates: AAPG bulletin, v. 54, p. 207-250.
Enos, P., and Sawatsky, L., 1981, Pore networks in Holocene carbonate sediments: Journal of Sedimentary Research,
v. 51, p. 961-985.
Goldstein, R.H., 1988, Cement stratigraphy of Pennsylvanian Holder Formation, Sacramento Mountains, New
Mexico: AAPG Bull, v. 72, p. 425-438.
Hanshaw, B.B., Back, W., and Deike, R.G., 1971, A geochemical hypothesis for dolomitization by ground water:
Economic Geology, v. 66, p. 710-724.
Humphrey, J.D., 1988, Late Pleistocene mixing zone dolomitization, southeastern Barbados, West Indies:
Sedimentology, v. 35, p. 327-348.
Land, L., 1991, Dolomitization of the Hope Gate Formation (north Jamaica) by seawater: reassessment of mixing-
zone dolomite, in Taylor, H.P., O’Neil, J.R., and Kaplan, I.R., eds., Stable Isotope Geochemistry: A Tribute to Samuel
Epstein: The Geochemical Society (London), Special Publication 3, p. 121-130.
Land, L., Salem, M., and Morrow, D., 1975, Paleohydrology of ancient dolomites: geochemical evidence: American
Association of Petroleum Geologists Bulletin, v. 59, p. 1602-1625.
Land, L.S., 1973, Holocene meteoric dolomitization of Pleistocene limestones, North Jamaica: Sedimentology, v. 20,
p. 411-424.
Machel, H.G., and Burton, E.A., 1994, Golden Grove dolomite, Barbados; origin from modified seawater: Journal of
Sedimentary Research, v. A64, p. 741-751.
Machel, H.G., and Mountjoy, E.W., 1986, Chemistry and environments of dolomitization - a reappraisal: Earth-
Science Reviews, v. 23, p. 175-222.
MOSS, S., and TUCKER, M.E., 1995, Diagenesis of Barremian-Aptian platform carbonates (the Urgonian Limestone
Formation of SE France): near-surface and shallow-burial diagenesis: Sedimentology, v. 42, p. 853-874.
Figure 2. Frequency histogram showing distribution of Tm-ice measurements of primary fluid inclusions in calcite cements.

Pan-American Current Research on Fluid Inclusions Rice University, Houston, Texas, U.S.A., June 12-14, 2018, Abstract Volume
65
Origin of CO2-rich Zechstein-2-Carbonate-hosted gas reservoirs in the
Lower Saxony Basin, NW Germany Volker LÜDERS1, Johannes SCHOENHERR2, Marta SOŚNICKA1
1 GFZ German Research Centre for Geosciences, Potsdam, Germany 2ExxonMobil Production Deutschland GmbH, Hannover, Germany
E-mail: [email protected]
Uneconomically high CO2 contents (up to nearly 100%) have been encountered by some exploration wells in the southern Zechstein-2-Carbonate (Ca2) fairway of the LSB. This part of the LSB is characterized by unusual high maturity of organic matter and Upper Carboniferous coals suggesting an abnormal high paleo heat-flow. The origin of high heat-flow during the Jurassic/Early Cretaceous has given rise for much debate during the past decades and is still discussed controversy. Several authors favor intrusions of deep-seated magmatic bodies (Bramsche-, Vlotho-, Uchte Massif, etc.) of Lower Cretaceous age in order to explain the thermal overprint of organic matter which differs significantly in Ro values (up to 6%) from similar facies in other parts of the LSB (e.g. Stadler and Teichmüller 1971). In this context, a magmatic origin of CO2 in some reservoirs the Uchte study area was discussed. Quite contrary numeric modeling relates high maturation to a model that invokes deep burial from the Upper Jurassic to Lower Cretaceous followed by inversion and subsequent erosion of a thick sediment column during the Late Cretaceous through Tertiary. However, there is a considerable uncertainty how thick the eroded column really was. Numeric modeling (e.g. Petmecky et al. 1999; Bruns et al. 2015) suggests several thousand meters of erosion in the central part of the LSB. Following this idea, Fischer et al. (2006) proposed a model for the formation of high CO2 Zechstein-2 carbonate gas reservoirs that proposes pressure-induced CO2 release from Ca2 reservoir rocks during stages of deep burial and mixing with early organic-derived CO2. However, as pointed out by Brown (1999) decarbonation of carbonates (excluding calcite) requires temperatures >300°C and even higher temperatures for thermal decomposition of calcite in the absence of aluminosilicates.
The aim of this study was to trace the origin of CO2 in the so-called “CO2 province” in the southern Zechstein-2 carbonate (Ca2) fairway in of the Lower Saxony Basin (LSB) and to attempt predicting the migration pathways and the occurrence of high CO2 accumulations in so far undrilled Ca2 reservoir blocks. This was done by the combination of studies of fluid inclusion hosted in fracture-fill mineralization and structural analyses.
For this purpose, more than 370 fracture-fill mineralization (quartz, fluorite, carbonates, anhydrite) hosted by Devonian, Upper Carboniferous strata or Zechstein carbonate were sampled from 54 wells and inspected for fluid inclusion inventory. Besides highly-saline aqueous 2-phase (L+V) and 3-phase (L+V+H) many samples also contain differently composed gaseous inclusions. CO2-rich inclusions are abundant in fracture filling calcite hosted by Devonian limestone. CH4-CO2-(N2) inclusions (locally with CO2 content of more than 80 mol%) are common in quartz and carbonate fracture fillings within the Upper Carboniferous strata. Gaseous inclusions in fracture filling minerals hosted by Ca2 carbonate are highly variable in composition; besides pure or nearly pure CO2 inclusions that were trapped under high P-T conditions (Fig. 1), complex mixtures of CO2, CH4, H2S and ± N2 are very frequent in many studied samples. These gas mixtures were trapped in inclusions at lower P conditions compared to CO2-rich inclusions (Fig. 1). Secondary trails of CH4-rich inclusions are indicative for a late migration of methane that locally significantly increased the quality of reservoir gas from formerly CO2-rich to CH4-dominated.
Fluid inclusion studies and REE distribution in fluorite have shown that CO2 ascended along with hydrothermal fluids through faults into the reservoirs at temperatures between 200 °C and up to 315 °C and at near-lithostatic pressures, presumably liberated in phases of co-seismic ruptures and fault failure by shear in the context of tectonic inversion during the Late Cretaceous.
Integration of these data with core re-orientation techniques shows that most mineralized vein fillings that host CO2-rich fluid inclusions have a dominant NE-SW strike direction. This is parallel to the maximum (horizontal) stress orientation during the inversion phase, which allowed rapid and focused fluid flow along opening mode I direction. Those structural data has then been up-scaled from core to seismic interpretation, which showed that only very few NE striking far-reaching faults are actually connecting the ultra-deep Devonian through the Carboniferous with the Ca2 reservoir. The migration model is that large volumes of CO2, together with hydrothermal fluids were ascending along the NE-striking faults until these fluids have been laterally injecting into the first available

Pan-American Current Research on Fluid Inclusions Rice University, Houston, Texas, U.S.A., June 12-14, 2018, Abstract Volume
66
permeable rock unit, which is a seismically definable downthrown (hanging wall) fault block of the Ca2 reservoir –similar to the concept of Mississippi-Valley-Type deposits. All existing high CO2 content wells are located within such downthrown blocks, which are bounded by at least one of the NE-striking fault conduits and top-sealed by overlying Zechstein evaporites.
The results of studies of carbon isotopic compositions of reservoir and fluid inclusion gases as well as δ13C values of fracture-fill carbonates suggest an inorganic origin of CO2 in Zechstein Ca2 reservoirs in the LSB. Proportions of TSR-derived CO2 cannot be excluded but do not account for high CO2 content in the reservoir gas since CO2-rich gaseous inclusions are also present in fracture filling minerals hosted by Palaeozoic rocks. A magmatic origin of fluids and/or CO2 is unlikely in the light of the results of δD and δ18O isotopic composition of fluid inclusion waters, noble gases ratios and δ13C isotopic compositions of fluid inclusion gases. We conclude that decarbonation of deeply buried massive Devonian limestone is the most likely source for high CO2 content in some Ca2 reservoirs in the LSB.
REFERENCES
Brown A.A. (1999) Distinguishing mantle CO2 from decarbonation CO2 in high CO2 gases. AAPG Hedberg Research
Conference “Natural gas formation and occurrence”, Durango, Colorado, p. Abstract.
Bruns B. et al. (2013) Petroleum system evolution in the inverted Lower Saxony Basin, northwest Germany: A 3D
basin modeling study. Geofluids 13, 246-271.
Fischer M. et al. (2006) Origins of CO2 in Permian carbonate reservoir rocks (Zechstein, Ca2) of the NW-German Basin
(Lower Saxony). Chem. Geol. 227, 184-213.
Petmecky S. et al. (1999) High thermal maturity in the Lower Saxony Basin: inversion or deep burial? Tectonophysics
304, 317-344.
Stadler G., Teichmüller M. (1971) Zusammenfassender Überblick über die Entwicklung des Bramscher Massivs und
des Niedersächsischen Tektogens. Fortschr. Geol. Rheinland und Westfalen 18, 547-564.
Figure 1. P-T diagram showing isochores of gaseous inclusions hosted in fracture-fill carbonate and
fluorite in Zechstein Ca2 carbonate from 2 wells located close to each other in the Uchte area. The colored
fields show the P-T conditions of entrapment of cogenetic aqueous 2.phase and gaseous fluid inclusions
derived from homogenization temperatures or crossing isochores of aqueous and gaseous inclusions.

Pan-American Current Research on Fluid Inclusions Rice University, Houston, Texas, U.S.A., June 12-14, 2018, Abstract Volume
67
Keynote – Stable isotope disequilibrium in zoned emerald precipitated
from a two-phase fluid at chemical equilibrium? Daniel D. MARSHALL1, Gaston GIULIANI2, Lara L. LOUGHREY3 1Earth Sciences, Simon Fraser University, Burnaby, Canada 2Centre national de la recherche scientifique, Nancy, France 3Teck Resources Limited, Vancouver, Canada
E-mail: [email protected]
This study concentrates on zoned emerald samples from two emerald occurrences: the Emmaville-Torrington deposit in Australia and the Byrud emerald deposit near Eidsvoll in Norway. Both deposits (Loughrey et al., 2012; 2013) are the more common igneous-related emerald deposit (Groat et al., 2014). The emeralds are zoned (Fig. 1) and display alternating bands of emerald green and clear growth zones within individual crystals at the millimeter scale. The zoning is seen optically but can also be observed via other imaging techniques such as backscattered electron, cathodoluminescence (CL), and chemically via electron microprobe or LA-ICP-MS analyses. Additionally, there is a correlation between the prevalence of a population of primary vapor-rich fluid inclusions within the optically clear (CL-dark) growth zones and a second population of primary highly-saline three-phase (liquid+vapor+halite) fluid inclusions in the colored (CL-bright) growth zones.
The two fluid inclusion populations appear to represent conjugate sets of a boiling system with the three-phase highly saline fluid inclusions having relatively high-salinities at NaCl saturation or greater. This population undergoes total homogenization into the liquid and probably represents fluids trapped in the liquid system of a two-phase (boiling) system. The vapor-rich population of fluid inclusions comprise a dilute aqueous fluid with average salinities of a few mass percent NaCl equivalent. These inclusions homogenize into the vapor phase at higher temperatures. Both fluid inclusion populations exist as secondary and pseudosecondary inclusions with the highly-saline population being more abundant.
The correlation of color versus clear growth zones corresponding to highly-salinity liquid-dominant and vapor-dominant low-salinity primary fluid inclusions, respectively, indicates that the color banding within the Emmaville-Torrington and Byrud emerald is related to emerald precipitation in the liquid or vapor portion of a boiling fluid system.
Chemical traverses parallel to growth zones via LA-ICP-MS and electron microprobe indicates similar compositions along growth zones. Traverses perpendicular to growth zones yields consistent correlation between CL light production with respect to Cr and V concentrations. Stable isotope traverses perpendicular to growth zones do not show consistent δ18O with respect to chemistry or Cl emission. This would indicate that isotopic equilibrium occurs at a slower rate than chemical equilibrium in the examined samples.
REFERENCES
Groat, L. et al. (2008) Emerald deposits and occurrences: A review. 2008, Ore Geol. Revs. 34, 87-112.
Loughrey, L. et al. (2012) Pressure-temperature-fluid constraints for the Emmaville-Torrington emerald deposit, New
South Wales, Australia: fluid inclusion and stable isotope studies, Central Eur. J. Earth Sci., 4, 287-299.
Loughrey, L. et al. (2013) Boiling as a mechanism for colour zonations observed at the Byrud emerald deposit,
Eidsvoll, Norway: fluid inclusion and stable isotope and Ar-Ar studies, Geofluids, 13, 542-558.
Figure 1. Cathodoluminescence (CL) image of a zoned
emerald crystal from the Byrud deposit, Norway.

Pan-American Current Research on Fluid Inclusions Rice University, Houston, Texas, U.S.A., June 12-14, 2018, Abstract Volume
68

Pan-American Current Research on Fluid Inclusions Rice University, Houston, Texas, U.S.A., June 12-14, 2018, Abstract Volume
69
Invited – Metal and volatile budgets of rhyolite magmas coincident
with Nevada’s world-class Carlin-type gold deposits Celestine N. MERCER1, Kathryn E. WATTS2, Albert H. HOFSTRA1, Zoltán ZAJACZ3, Matthew A. COBLE4 1U.S. Geological Survey, Denver, Colorado, U.S.A. 2U.S. Geological Survey, Menlo Park, California, U.S.A. 3Department of Earth Sciences, University of Toronto, Toronto, Ontario, Canada 4Stanford University, Stanford, California, U.S.A.
E-mail: [email protected] Nevada’s Carlin-type gold deposits (USA) collectively represent the second largest Au endowment on Earth. With historic production and reserves of >6000 tons, mining of these deposits dominates Au production in the United States and accounts for ~9% of world production [1]. These deposits formed over a relatively short interval of time (42-34 Ma) coinciding with profuse magmatism that swept southwestward across Nevada [2]. Magmatism was initiated by a shift from compressional, flat-slab subduction to extensional tectonism due to foundering of the Farallon slab and upwelling of asthenospheric mantle into subduction-metasomatized subcontinental lithosphere [2]. Carlin-type Au deposits are structurally and stratigraphically controlled sediment-hosted ore bodies characterized by enrichments in Au, As, Sb, Hg, Tl, (Te, and W), high ratios of Au/Cu (~0.1-10) and Au/Ag (~10), and a paucity of Ag and base metals (e.g., Cu, Pb, Zn, Ni; e.g., [3]).
Despite over 50 years of mining and research, finding a smoking gun to unify the current models proposed for these deposits remains elusive because the source of heat, fluids, and metals is still debated. The magmatic-hydrothermal model suggests that nearby intrusions provided heat and exsolved S- and Au-bearing fluids from parental magmas with high initial Au/Cu ratios [e.g., 4, 5, 6]. The metamorphic model favors lower crustal metamorphic fluids that ascended along basement-penetrating extensional faults and scavenged Au from pre-enriched metasediments [e.g., 1]. The sedimentary-source model suggests that meteoric fluids driven by extension-generated heat and permeability leached Au from pre-enriched sediments [e.g., 7, 8, 9]. Economically important Au deposits with similarities to Carlin-type deposits are located in the West Qinling belt and Dian-Qian-Gui area of southern China [e.g., 10]. Given that the various conceptual models will lead exploration geologists to different geologic environments in search of new Au discoveries, the debate about the origin of Carlin-type Au deposits is beyond merely academic.
We present high-sensitivity, high-spatial resolution microanalyses of silicate and sulfide melt inclusions, providing the first direct evidence of the pre-eruptive metal (Au, As, Sb, Tl, Te, W, Cu, Mo, Ag, Pb, An, Sn, Co, Ni) and volatile (H2O, CO2, S, F, Cl) budgets of magmas coincident in time and space with Carlin-type Au deposits. Data were acquired using SHRIMP-RG ion microprobe and laser ablation mass spectrometry, FTIR spectroscopy, electron beam microscopy. Melt inclusions provide the best measure of Au and Cu budgets (among other metals) in parental magmas compared to whole rock analysis because metals like Au and Cu partition into the magmatic fluid phase upon rock solidification [e.g., 11, 12]. The melt inclusion data we present provide “snapshots” of pre-eruptive magma compositions at shallow crustal levels (≤~5 km depth). Using these data, we test the hypothesis that Eocene felsic magmas in the shallow crust had high Au/Cu ratios and could have contributed S- or metals critical to the formation of Carlin-type Au deposits.
Our sample suite includes pre-, syn-, and post-mineralization porphyritic intrusions and tuffs (42-34 Ma) in close proximity (~0-5 km) to known Carlin-type Au
50 µm
Figure 1. Photomicrograph of quartz-hosted,
variably crystalline silicate melt inclusions from
the Beast dike (Carlin Trend).

Pan-American Current Research on Fluid Inclusions Rice University, Houston, Texas, U.S.A., June 12-14, 2018, Abstract Volume
70
districts in the Carlin (Beast, Genesis), Battle Mountain-Eureka (Cortez Hills Complex, Archimedes/Ruby Hill), and Alligator Ridge (Galaxy/Horseshoe/Saga) trends, and the newly recognized Long Canyon trend.
Silicate melt inclusions are rhyolite to high-silica rhyolite (~8-17 wt% Al2O3, ~4-11 wt% Na2O+K2O, ASI~0.9-1.4) and overlap with the most evolved Eocene igneous whole rock samples from the region. They span a range in (1) tectonic affinity (volcanic-arc to within-plate), (2) temperature (~670-770°C), (3) volatile contents (up to 4.3 wt% H2O, 950 ppm CO2, 490 ppm Li, 140 ppm S, 2.3 wt% F, and 1920 ppm Cl), (4) oxidation state (fO2 dominantly ~NNO-2.0 to NNO+1.5, with the two most arc-like samples ranging from NNO+2 to NNO+4), (5) eruptive volume (dikes to ignimbrites), (6) degree of melt fractionation (Rb/Sr~0.6-70, Eu/Eu*~0.02-1.2, Nb/Nbo~1.1-6.0), (7) degassing style (ascent-driven vs. crystallization-driven), and (8) degree of marine sediment contamination (subduction and/or crustal; (La/Sm)CN~1-11). The broad diversity amongst the rhyolites in our suite reflects their evolution within the dynamic tectonic setting of north central Nevada during the Eocene epoch. Carlin-type metal concentrations are low to moderate in silicate melts (≤~3-280 ppb Au, ~0.5-22 ppm As, ~0.2-2.2 ppm Sb, ≤~0.2-6.3 ppm Tl, ≤~16-44 ppb Te, ~0.5-7.3 ppm W), while base metal and other potential ore-forming metal concentrations range from low to high (≤~0.05-1.0 ppm Ag, ≤~0.1-9 ppm Mo, ≤~0.1-40 ppm Cu, ~1-80 ppm Pb, ~10-150 ppm Zn, ~4-17 ppm Ni, ~0.2-2.3 ppm Co, ~0.6-25 ppm Sn). Pyrrhotite melt inclusions in one sample contain homogeneous and low Au concentrations (0.9 ppm) and more heterogeneous concentrations of other metals (100-30,000 ppm Cu, 5-8,000 ppm As, 200-4,000 ppm Ni, 0-100 ppm Sb, 0-20 ppm Te). Electron microprobe analyses of pyrrhotite indicate molar Fe/S ratios of 0.84-0.89, corresponding to NFeS=0.91-0.95, and log fS2= 0 to -3 at magmatic temperatures of 800-850 °C.
Melt inclusions have notably lower Au/Cu (~≤0.0005-0.1), Au/Ag (~0.05-5), and Au/Tl (~0.001-0.3) ratios than do high-grade Carlin-type ore samples, however, to effectively evaluate the true mineralization potential of these magmas, we must consider (1) the effect of magmatic sulfide saturation on the metal budget of silicate melts and (2) the efficiency of metal removal from a silicate melt during fluid exsolution. We will present results from modeling of hypothetical exsolved fluid compositions [e.g., 13], taking as many of the relevant magmatic physiochemical variables into account as possible (e.g., alumina saturation index, alkalinity, salinity, S contents, Cl/H2O, fO2, temperature, pressure, and the presence or absence of suspended magmatic sulfides).
REFERENCES
[1] Cline J.S. et al. (2005) Carlin-type gold deposits in Nevada: critical geologic characteristics and viable models. Econ. Geol., 451–484.
[2] Best M.G. et al. (2016) Slab-rollback ignimbrite flareups in the southern Great Basin and other Cenozoic American arcs: A distinct style of arc volcanism. Geosphere 12, 1097–1135.
[3] Hofstra A.H., Cline J.S. (2000) Characteristics and models for Carlin-type Au deposits, Rev. Econ. Geol., 163-220. [4] Kesler S.E. et al. (2005) Evidence for a magmatic origin for Carlin-type gold deposits: isotopic composition of sulfur
in the Betze-Post-Screamer Deposit, Nevada, USA. Miner Deposita 40, 127–136. [5] Muntean J.L. et al. (2011) Magmatic--hydrothermal origin of Nevada's Carlin-type gold deposits. Nature 4, 1–6. [6] Large S.J.E. et al. (2016) Trace elements in fluid inclusions of sediment-hosted gold deposits indicate a magmatic-
hydrothermal origin of the Carlin ore trend. Geology, 1–6. [7] Ilchik R.P., Barton M.D. (1997) An amagmatic origin of Carlin-type gold deposits. Econ. Geol., 269-288. [8] Emsbo P. et al. (2006) The giant Carlin gold province: a protracted interplay of orogenic, basinal, and
hydrothermal processes above a lithospheric boundary. Miner. Deposita 41, 517–525. [9] Large R.R. et al. (2011) A carbonaceous sedimentary source-rock model for Carlin-type and orogenic gold
deposits. Economic Geology, 331-358. [10] Hofstra A.H., Christensen O.D. (2002) Comparison of Carlin-type Au deposits in the United States, China, and
Indonesia: implications for genetic models and exploration, USGS Open File Report, 1-94. [11] Heinrich C.A. (2006) How Fast Does Gold Trickle Out of Volcanoes? Science 314, 263–264. [12] Zajacz Z. et al. (2017) The partitioning of Cu, Au and Mo between liquid and vapor at magmatic temperatures
and its implications for the genesis of magmatic-hydrothermal ore deposits. Geochim. Cosmo. Acta 207, 81–101. [13] Zajacz Z. et al. (2010) Alkali metals control the release of gold from volatile-rich magmas. EPSL 297, 50–56.

Pan-American Current Research on Fluid Inclusions Rice University, Houston, Texas, U.S.A., June 12-14, 2018, Abstract Volume
71
The volatile budget of Haleakala (Maui): new insights from melt
inclusions Lowell R. MOORE1, Esteban GAZEL2, Robert J. BODNAR1 1Fluids Research Laboratory, Department of Geosciences, Virginia Tech, Blacksburg, Virginia, U.S.A. 2Department of Earth and Atmospheric Sciences, Cornell University, Ithaca, New York, U.S.A.
E-mail: [email protected]
Volcanic activity in the Hawaiian Islands evolves through a sequence of volcanic stages that include 1) a low-volume, alkaline pre-shield stage, 2) a high-volume, tholeiitic shield stage, 3) a low-volume, alkaline post-shield or “capping” stage, and 4) a very low volume, alkaline rejuvenated or “post-erosional” stage (Clague & Sherrod, 2014). While the shield stage has been thoroughly studied, the transition from post-shield to rejuvenated stage is poorly understood – especially regarding the relationship between mantle source composition and magma volatile budgets. Haleakala (Maui) represents the end of the post-shield stage, and it is an ideal location to study this enigmatic transition in volcanic behavior. To determine the pre-eruptive volatile content of the melt and estimate the volatile content of the melting source material, we sampled glassy melt inclusions from Haleakala.
Fresh tephra samples were collected from basaltic cinder cones at the summit of Haleakala, and lava samples were collected from the periphery of the island. Bulk lava and tephra compositions were determined using X-ray fluorescence (XRF) and laser ablation inductively coupled plasma mass spectrometry (LA-ICP-MS). Olivine crystals containing glassy melt inclusions (MI) were removed from the tephra samples and polished to expose the glass without breaching shrinkage bubbles. The amount of CO2 contained in vapor bubbles was estimated using Raman spectroscopy. MI glasses were analyzed using secondary ion mass spectrometry (SIMS) and electron probe microanalysis (EPMA). Petrolog3 and MELTS software were used to correct MI compositions for Fe-loss and post-entrapment crystallization (PEC) and to determine the conditions and extent of fractional crystallization of melts trapped by MI. The volatile solubility model of Iacono-Marziano et al. (2015) was used to calculate volatile-melt saturation pressures.
MI contain approximately 0.5 to 1 wt% of both CO2 and H2O, which corresponds to trapping pressures of up to 8-9 kbar. This amount is consistent with the amount predicted for ~10 kbar saturation pressures estimated for pyroxene phenocrysts erupted from Kula volcanics (Hammer et al., 2016) given ~1.5 kbar of uncertainty associated with both pressure estimates and suggests that the MI trapped melts that were volatile-undersaturated. MI and whole rock major element compositions are mutually consistent with fractional crystallization trends originating from the composition of the most MgO-rich inclusion and 50-100 bar/°C decompression from 10 kbar to 500 bar, followed by isobaric crystallization (Fig. 2). Observed olivine host compositions (Fo 86-73) compared with MELTS models (Fig. 2a) indicate that melts experienced ~20-60% crystallization before inclusions were trapped (Fig 2a inset).
To determine the extent of volatile loss to degassing before melt inclusions were trapped, relative concentrations of variably soluble volatile elements in MI were compared (Figure 2b). Our results indicate negligible loss of Cl and F, moderate loss of S and H2O, and major loss of CO2 to degassing. After correcting for PEC, CO2 exsolution into fluid bubbles, and fractional crystallization, primary melts supplying Haleakala contain approximately 0.15 wt% S, 0.7 wt% H2O, and 0.7 wt% CO2. However, because it is not clear whether any of the melt inclusions analyzed in this study were trapped before CO2 began to degas, the CO2 concentration of the primary melt that we report represents a minimum estimate.
We used a batch melting approach to estimate the volatile content of the melting source material associated with Haleakala. Compared to the shield stage, post-shield-stage magmas are generated from a lower degree of partial melting as a result of their relative distance from the center of the hot spot. Estimated melt fractions for post-shield volcanism vary from ~1-3 % depending on the composition of the source material, which is consistent with whole rock trace element concentrations obtained in this study. Using the maximum melt fraction (3%) and a batch melting calculation, melts from Haleakala could be derived from a source material containing 45 ppm S, 210 ppm H2O, and 210 ppm CO2. Source volatile concentrations could be lower if the melt fraction is lower, and the CO2 concentration of the source may be higher if some unknown amount of CO2 was lost to degassing before the MI were trapped.

Pan-American Current Research on Fluid Inclusions Rice University, Houston, Texas, U.S.A., June 12-14, 2018, Abstract Volume
72
REFERENCES
Clague, D.A., Sherrod, D.R. (2014) Growth and Degradation of Hawaiian Volcanoes, U.S. Geological Survey
Professional Paper 1801, 97-146.
Sobolev, A.V., Hofmann, A.W., Sobolev, S.V., Nikogosian, I.K. (2005) An olivine-free mantle source of Hawaiian shield
basalts, Nature, 434, 590-597.
Iacono-Marziano, G., Morizet, Y., Le Trong, E., Gaillard, F. (2012) New experimental data and semi-empirical
parameterization of H2O–CO2 solubility in mafic melts, Geochimica et Cosmochimica Acta, 97, 1-23.
Hammer, J., Jacob, S., Welsch, B., Hellebrand, E., Sinton, J. (2016) Clinopyroxene in postshield Haleakala ankaramite:
1. Efficacy of thermobarometry, Contrib. Min. Pet., 171:7.
Figure 1. Whole rock (a) and melt inclusion (b) compositions compared with MELTS models. Dashed circles
indicate parental melt compositions from the most MgO-rich inclusion analyzed and a Kilauea primary melt
composition calculated by Sobolev et al. (2005). Haleakala shield and post-shield whole rock compositions from
Georoc database (http://georoc.mpch-mainz.gwdg.de/georoc/) are shown for comparison.
Figure 2. (a) Volatile-melt saturation pressures and MI host compositions compared with MELTS model results.
Inset shows remaining melt fraction during fractional crystallization. (b) MI volatile concentrations with linear
regression of presumably undegassed volatile concentrations indicating fractional crystallization. Light-colored
symbols indicate MI glass compositions not corrected to include CO2 exsolved into bubbles.

Pan-American Current Research on Fluid Inclusions Rice University, Houston, Texas, U.S.A., June 12-14, 2018, Abstract Volume
73
Invited – The melt inclusion record of the countdown to eruptions Megan E. NEWCOMBE1, Alexander S. LLOYD1, David FERGUSON2, Anna BARTH1, Erik HAURI3, Terry A. PLANK1 1Lamont-Doherty Earth Observatory of Columbia University, Palisades, New York, U.S.A. 2University of Leeds, Leeds, U.K. 3Department of Terrestrial Magnetism, Carnegie Institution of Washington, DC, U.S.A.
E-mail: [email protected]
Olivine-hosted melt inclusions are valuable petrologic tools. They are traditionally exploited for their ability to shield small quantities of magma from the myriad of crustal processes (e.g. degassing, crystallization, magma mixing, assimilation) that act to obscure the compositions of primary melts feeding a given magmatic system. It is widely acknowledged that the compositions of olivine-hosted melt inclusions can be altered from the original trapped melt composition via post-entrapment processes such as diffusive re-equilibration, post-entrapment crystallization and vapor bubble formation. Recent studies have found that some of these post-entrapment processes operate on short timescales (seconds to hours) and reflect the rapid and extreme physical and chemical changes that the melt inclusions experience during the final stages of magma ascent, eruption, and deposition. Chemical zonation inside olivine-hosted melt inclusions and across their olivine hosts leaves a record of syneruptive conditions in the volcanic conduit. Characterization of this chemical zonation can be used to constrain the nature and timing of conduit processes.
We have constrained syneruptive pressure-temperature-time (P-T-t) paths of olivine-hosted melt inclusions and their host magmas using a combination of short-timescale cooling and decompression chronometers. Recent work has shown that the thermal histories of crystals in the last few seconds to hours of eruption can be constrained using concentration gradients of MgO inside olivine-hosted melt inclusions, produced in response to syneruptive cooling and crystallization of olivine on the inclusion walls (Newcombe et al. 2014). We have applied this technique to the study of melt inclusions erupted by arc and ocean island volcanoes, including the subplinean 1974 eruption of Fuego volcano; the 1977 fire-fountain eruption of Seguam volcano; and three eruptions of Kilauea volcano (episode 1 of the 1959 Kilauea Iki fire-fountain eruption, the Keanakāko’i basal reticulate of the 1500 CE vigorous fire-fountain eruption, and the Keanakāko’I layer 6 deposit of the 1650 CE subplinean eruption).
Of the eruptions studied so far, melt inclusions from the 1959 Kilauea Iki fire fountain eruption record the highest syneruptive cooling rates (~103–104 °C/hr) and the shortest cooling durations (~100–101 s). The largest melt inclusions (radii up to 170 μm) from the Kilauea and Seguam fire fountain eruptions exhibit long plateaus of approximately constant MgO across their centers, suggestive of ascent through the conduit at an approximately constant temperature (or a period of shallow magma stalling) prior to fragmentation. Melt inclusions from Fuego record the lowest cooling rates (~102–103 °C/hr) and longest cooling durations (~102–103 s) of the studied eruptions.
The average cooling rates of melt inclusions from the studied eruptions are negatively correlated with magma decompression rates (as determined from volatile gradients in melt embayments). Division of our calculated cooling rates by decompression rates for each eruption allows us to estimate the amount of cooling as a function of magma decompression. Our estimate of ~30 °C/kbar for Fuego is consistent with adiabatic ascent of a magma containing ~60 vol. % vapor. The high cooling rates inferred for Seguam and Kilauea Iki are consistent with air quenching over 10s of seconds upon fragmentation and eruption. Preliminary results of this approach are in agreement with thermodynamic models that show that the dominant driver of cooling in the conduit is adiabatic expansion of a vapor phase. A corollary of these models is that, in order to drive syneruptive cooling, the magma must ascend rapidly enough to prevent significant melt-vapor separation. REFERENCE
Newcombe ME, Fabbrizio A, Zhang Y, Ma C, Le Voyer M, Guan Y, Eiler JM, Saal AE, Stolper EM (2014) Chemical zonation in olivine-hosted melt inclusions. Contributions to Mineralogy and Petrology 168 (1):1-26. doi:10.1007/s00410-014-1030-6

Pan-American Current Research on Fluid Inclusions Rice University, Houston, Texas, U.S.A., June 12-14, 2018, Abstract Volume
74

Pan-American Current Research on Fluid Inclusions Rice University, Houston, Texas, U.S.A., June 12-14, 2018, Abstract Volume
75
Characteristics and significance of fluid inclusions in the Longmaxi
Shale in the Jiaoshiba area, Eastern Sichuan Basin, China Guangxi OU1,2, Min ZHANG1,2, Tieguan WANG2, Di WU1, Qiong LI1, Jian MA2 1 CNNC Beijing Research Institute of Uranium Geology, Beijing, China
2 College of Geosciences, China University of Petroleum, Beijing, China
E-mail: [email protected]
The Jiaoshiba shale gas field is located in the Fuling National Shale Gas Demonstration Zone. It is part of the Jiaoshiba
structure in the southeast of eastern Sichuan fold belt and to the west of the Qiyueshan fault belt, which is a special
positive structural unit in the Wanxian Synclinorium. Different from the NE-trending or near NS-trending narrow and
high-dipping anticlines in two sides, the Jiaoshiba structure controlled by NE-trending and SW-trending faults is a
broad box-shaped faulted anticline with NE-trending axial, which is divided by fault uplift, fault depression and
Qiyueshan fault. The main body of Jiaoshiba structure was weakly deformed with uniform upper and lower structure
that is characterized by box-like faulted anticline with gentle and wide top, small dip angle, and dipping wings.
Most Palaeozoic can be found in the Jiaoshiba structure without Devonian and only Huanglong Formation
in the carboniferous, while the Middle-Triassic Jialingjiang Formation is exposed. The black and gray black marine
shale primarily occurs at the lower section of Lower Silurian Longmaxi Formation with stable thickness of 89-102m
and type I and II1 kerogen. Vitrinite reflectance (Ro) indicates high-over high mature shale. Pressure coefficients
from over 100 wells range from 1.0 to 1.55, while values of main structure unit is in a range of 1.30 to 1.55, indicating
the occurrence of overpressure in shale reservoir. Longmaxi shale in the JYB-5 and JYA-4 wells is interbeded with
argillaceous siltstone of 2~5cm, where high-angel and wide (3~5mm) fracture commonly occurs with calcite and
quartz fill.
Microscopic observation of fluid inclusions shows that considerable methane-rich fluid inclusions occur in
the quartz particles and quartz-calcite veins in the thin siltstone interlayer, coexisting with brine inclusions with
hydrocarbon. The hydrocarbon inclusions are generally gray and dark gray, while brine inclusions with hydrocarbon
are colorless or gray. Methane-rich fluid inclusions are commonly distributed in zonal or linear pattern in the
microfracture across quartz grains and enlarged edges, while they are mostly distributed in group and belt in the
quartz-calcite veins.
Microthermometry analyses indicate that brine inclusions with hydrocarbon from Longmaxi shale in the
Jiaoshiba area have homogenization temperatures (Th) ranging from 100 to 220°C. Specifically, Th of inclusions in the
microfractures varies from 100 to 170 ℃ with peak value of 130-140 °C and 160-170 °C, indicating two episodes of
gas accumulation, while the Th of inclusions in the quartz-calcite veins is 130-220 °C with peak value of 180-200 °C,
representing temperature of shale gas being destroyed during tectonic activities.
A large number of experiments from home and abroad proved that Laser Raman shift (wave number) of
methane inclusions positively correlated with temperature under certain pressure, whereas, it negatively correlated
with pressure under certain temperature. Fluid inclusions identified from argillaceous siltstone in the JYA-4 well and
JYB-5 well are commonly methane-saturated inclusions. Fluid inclusion petrography and Laser Raman microprobe
analyses further evidence that fluid inclusions are dominated by methane-saturated inclusions, which provides
qualified samples to restore pressure.
This study measured the Laser Raman shift (wave number) of methane-saturated inclusions under different
trapping temperature based on the variation of the Laser Raman shift with temperature and pressure, which can be
used to calculate methane density. Consequently, the internal pressure of these inclusions was determined using
the equations from Duan et al (1992) and homogenization pressures with value ranging from 54 to 75 MPa.
Rb-Sr isotopic dating and K-Ar isotopic dating were used to identify enrichment period of Longmaxi shale
gas. Rb-Sr isotopic dating indicates the hydrocarbon generation and expulsion in the siltstone occurred during Early-
Middle Jurassic (187.8±8.9Ma), while it was 189-191 Ma determined by K-Ar isotopic dating, which agree well with

Pan-American Current Research on Fluid Inclusions Rice University, Houston, Texas, U.S.A., June 12-14, 2018, Abstract Volume
76
each other. We therefore conclude that gas accumulating in the Longmaxi thin siltstone interlayers was mainly
during Early- Middle Jurassic.
Parameters of fluid inclusions, including homogenization temperature, component, pressure, etc., are
important to investigate hydrocarbon enrichment. This study employed thermal-burial-history to analyze the
geological significance of these data and dating data. The temperature plotted in the thermal-burial-history indicates
the gas filling in the Longmaxi reservoir mainly occurred during Early-Middle Jurassic, which is consistent with the
conclusion of isotopic dating. Corresponding pressure coefficient of Longmaxi shale determined by the internal
pressure of fluid inclusions (54-75MPa) and burial depth (4250-4800m) was 1.27-1.56, suggesting overpressured
shale during hydrocarbon generation and expulsion. Drilling data confirmed the occurrence of overpressure in the
Longmaxi shale with pressure coefficient of 1.30-1.558[11]. Previous study suggested that overpressure was a good
indicator of preservation condition. Therefore, the high pressure coefficient during gas enrichment period (Early-
Middle Jurassic) indicated good preservation condition for Longmaxi shale gas in the Jiaoshiba area. Meanwhile,
overpressure fluid contributed to the pores preservation in shale reservoir. Therefore, high-quality source rocks,
reservoirs, preservation condition and high gas saturation make the Longmaxi shale in the Jiaoshiba area potential
gas reservoir.
Conclusions:
(1)Fluid inclusion petrography and microthermometry analyses suggest that the peak temperatures of coeval
aqueous inclusions in the argillaceous siltstone are 130-140 °C, 160-170 °C, representing two episodes of gas
accumulation. And the homogenization temperatures of brine inclusions with hydrocarbon in the quartz-calcite
veins are corresponding temperature during the gas loss from initial gas reservoir.
(2)Hydrocarbon inclusions can be widely found in the Longmaxi shale, which were primarily methane-saturated
inclusions. The fluid pressure determined by the methane-saturated inclusions with the Laser Raman microprobe
analyses was about 54-75 MPa during the shale gas enrichment.
(3)Rb-Sr isotopic dating and K-Ar isotopic dating with fluid inclusions in the siltstone interlayer shows that peak
period of gas filling in the Longamxi shale was Early-Middle Jurassic, which matches well with the time derived from
burial and thermal history.
(4)The pressure coefficients of Longmaxi shale in the Jiaoshiba area were 1.27-1.56, 1.63-2.18 and 1.30- 1.55,
respectively, during the early stage (Early-Middle Jurassic), middle stage (Yanshan- himalayan period) and later stage
(present), indicating the occurrence of overpressure and thereby high-quality source rock and favorable preservation
conditions. Therefore, high-quality source reservoir cap assemblage and high gas saturation make the Longmaxi
shale in the Jiaoshiba area potential gas reservoir.

Pan-American Current Research on Fluid Inclusions Rice University, Houston, Texas, U.S.A., June 12-14, 2018, Abstract Volume
77
Keynote – Hydrocarbon inclusions: the story Jacques PIRONON CNRS-CREGU, GeoRessources Lab, Université de Lorraine, Nancy, France
E-mail: [email protected]
Fluid inclusions, located inside diagenetic minerals, are the precious witnesses of paleo-fluids when they are unchanged in volume and composition with time. The hydrocarbon inclusions are proxies of temperature and pressure and they act as efficient tools for basin modelling, geodynamical reconstruction and then for oil & gas prospection. Hydrocarbon inclusions are tracked in very old sedimentary basins as the witnesses of the beginning of life. They are also frequently described in Mississippi Valley Type deposits, in metamorphic and in hydrothermal environments where they constitute indices of sediment contaminations. But hydrocarbon inclusions are also the witnesses of the modern history of mineralogy.
Déodat Guy Sylvain Tancrède de GRATET de DOLOMIEU was probably the first how revealed the existence of hydrocarbon inclusions in minerals. He published in 1792 in the Journal of Physics in France one page of contribution (Figure 1) that was in fact the extract of a letter received from his friend, Felice Fontana, Director of the Cabinets of Physics and Natural History in Florence since 1766. F. Montana described two quartz crystals containing small cavities filled by a yellowish fluid. He opened some of them and smelt the typical odor of liquid bitumen which burned on contact with a flame. These crystals belonged to Dr. Giovanni Targioni Tozzetti, physician and naturalist, who was in charge in 1763 of the catalogue of the natural specimens housed in the Galleria Imperiale in Florence.
The hydrocarbon inclusions were at the heart of the first discoveries of fluid inclusions in minerals. It is not a surprise to find traces of hydrocarbon inclusions in the remarkable papers of the first mineralogists who were fascinated by impurities in gems. Sir David Brewster in Edinburgh (1826) described liquid inclusions in topaz crystals from Brazil, Scotland, and Australia, in quartz crystals from Quebec (Figure 2), and in amethysts from Russia. He described the volumetric changes of the fluid phases with temperature and discussed about the fluid chemistry using the measurement of the refractive indices. He described three main fluid phases in inclusions. He assigned the two first to gas and water and the third to a new phase he did not characterized. In 1850, J.D. Dana reinterpreted Brewster descriptions suggesting the presence of water, liquid CO2 and possibly another kind of liquid he named “brewsterlinite” or “cryptoline”. Van Nordenskjöld (1886) suggested this other kind of liquid was hydrocarbon.
The first use of UV-fluorescence to detect the presence of hydrocarbon inclusions is assigned to C. L. Reese (1898) who observed inclusions in quartz. The fluorescence technique has been generalized and some authors used it to approximate the fluid density (Bodnar, 1990) or to detect palaeo Oil-Water contacts (Eadington et al., 1996). It was necessary to wait the middle of the twentieth century to re-discover the hydrocarbon inclusions with the development of new techniques. The works of W. Wahler (1955) were the archetype of the transition between the nineteen and the twentieth century. He used the refractive index technique after calibration with artificial inclusions created by sealing silica microcapillaries. He decrepitated the inclusions by heating and measured the escaped fluid by fractional combustion and/or by condensation, by spectrographic photographs, and quantitatively by measurement of pressure differences. R. C. Murray in 1957 acquired the first complete analysis of an individual hydrocarbon inclusion by mass spectrometry on
Figure 1. The first scientific publication about
hydrocarbon inclusions by D. de Dolomieu in
Journal de Physique (1792).
Figure 2. Quartz of Quebec
(Canada). Top: decrepitation
of inclusions producing dark
droplets described by D.
Brewster in 1826. Bottom:
Photomicrograph of a fluid
inclusion containing gas
condensate analyzed by FT-IR
(Pironon et al., 2001)

Pan-American Current Research on Fluid Inclusions Rice University, Houston, Texas, U.S.A., June 12-14, 2018, Abstract Volume
78
a 2 mm cavity in a quartz crystal from the Mississipian Rundle formation in Alberta (Canada). This remarkable analysis, not reproduced to date, showed a composition of gas condensate with an extremely high accuracy. Mass spectrometry was intensively used after for bulk analysis of hydrocarbon inclusions after crystal heating or crushing (several references in George et al., 2012). A widespread screening technique called the fluid inclusion stratigraphy was applied to cleaned core chips or cuttings that are crushed using pneumatic rams (Smith, 1994, Barclay et al., 2000). Dereppe et al. (1994) applied 1H NMR technique to around 1 cm3 of isolated natural and synthetic crystals and demonstrated it was possible to differentiate and quantify CH4, water and hydrocarbons. The development of computers was probably responsible for the development of techniques applied to individual inclusions. It was the case of FT-IR applied to hydrocarbon inclusions of more than 10 µm in size (Pironon et al., 2001), of Confocal Scanning Laser Spectroscopy (Pironon et al., 1998) and X-Ray tomography (Richard et al., 2017) to reconstruct in 3D the volume of tiny inclusions. ToF-SIMS combining 3D and chemical analysis was applied by Siljeström et al. (2010) whereas Volk et al. (2010) and Demange et al. (2011) developed laser ablation coupled with GC-MS and ICP-MS respectively. REFERENCES
Barclay S.A., Worden R.H., Parnell J., Hall D.L., Sterner S.M. (2000) Assessment of fluid contacts and compartmentalization in sandstone reservoirs using fluid inclusions: an example from the Magnus oil field, North Sea. American Association of Petroleum Geologists Bulletin, 84, 489 - 504.
Bodnar, R.J. (1990) Petroleum migration in the Miocene Monterey Formation, California, U.S.A. : Constraints from fluid-inclusion studies. Mineralogical Magazine, 54, 295-304.
Brewster D. (1826) On the refractive power of the two new fluids in minerals, with additional observations on the nature and properties of these substances. Royal Soc. Edinburgh Trans., vol. 10, 407-427.
Dana J. D. (1850) System of Mineralogy 3rd edn, p. 559 De Dolomieu D. (1792) Sur de l’huile de pétrole dans le cristal de roche et les fluides élastiques tirés du quartz.
Observations sur la Physique, v. 42, 318-319 Demange C., Banks D, Boiron MC, Dubessy J., Michels R. (2011) LA-ICP-MS analysis of trace metals in hydrocarbon
fluid inclusions associated with ore deposits. ECROFI-XXI Leoben, Austria, 9–11 August, Abstracts, p. 60 Dereppe J. M., Pironon J., Moreau C. (1994) Characterization of the composition of fluid inclusion in minerals by 1H
NMR. The American Mineralogist, 79, 712-718. Eadington P., Cadman S., Fellows M. (1996) Late Tertiary fluid migration in the Timor Sea. A key control on thermal
and diagenetic histories? APEA Journal, 36, 399-427. George S. C., Volk H. and Dutkiewicz A. (2012) Chapter 30. Mass Spectrometry Techniques for Analysis of Oil and Gas
Trapped in Fluid Inclusions. In Mass Spectrometry Handbook, Mike S. Lee Editor. 647-673. Murray R. C. (1957) Hydrocarbon fluid inclusions in quartz [Alberta]. AAPG Bulletin, 41, 950-952 Pironon J., Canals M., Dubessy J., Walgenwitz F., Laplace-Builhe C. (1998) Volumetric reconstruction of individual oil
inclusion by confocal scanning laser microscopy. European Journal of Mineralogy, 10, 1143-1150. Pironon J., Thiery R., Ayt Ougougdal M., Beaudoin G., Walgenwitz F. (2001) FT-IR measurements of petroleum fluid
inclusions: methane, n-alkanes and carbon dioxide quantitative analysis. Geofluids, 1, 2-10. Reese C. L. (1898) Petroleum inclusion in quartz crystals. J. Am. Chem. Soc., 20, 795–797. Richard A., Morlot C., Penteley S., Giuliani G., Dyja-Person V., Pignatelli I., Beaudoin N., Legros H., Sterpenich J.,
Pironon J. (2017) Advances in 3D imaging and volumetric reconstruction of fluid inclusions by high resolution X-ray computed tomography. ECROFI meeting, Nancy, France, 23-29 June.
Siljeström S., Lausmaa J., Sjövall P., Broman C., Thiel V., Hode T. (2010) Analysis of hopanes and steranes in single oil-bearing fluid inclusions using time-of-flight secondary ion mass spectrometry (ToF-SIMS). Geobiology, 8, 37–44.
Smith M. (1994) Inclusion composition mapping of Earth's subsurface using collective fluid inclusion volatile compositions. US patent #5,328,849, 25 p.
Volk H., Fuentes D., Fuerbach A., Miese C., Koehler W., Bärsch N., Barcikowski S. (2010) First on-line analysis of petroleum from single inclusion using ultrafast laser ablation. Organic Geochemistry, 41, 74–77.
Von Nordenskjöld N. (1886) Vorläufige Mitteilungen über erneuerte Untersuchungen der Flüssigkeitseinschlüsse im brasilianischen Topas. N Jahrb Mineral I:242.
Wahler W. (1956) Über die in Kristallen eingeschlossenen Flüssigkeiten und Gase. Geochimica et Cosmochimica Acta, 9, 105-135.

Pan-American Current Research on Fluid Inclusions Rice University, Houston, Texas, U.S.A., June 12-14, 2018, Abstract Volume
79
Different modes of fluid phase separation in a single hydrothermal
fluid? John RIDLEY Department of Geosciences, Colorado State University, Fort Collins, Colorado, U.S.A.
E-mail: [email protected]
Figure 1 shows how a low- to moderate salinity aqueous fluid
that includes a minor component of carbonic gas (CO2, CH4)
can undergo phase separation at magmatic or near
magmatic temperatures and at ‘mesothermal’
temperatures. Although our knowledge from experimental
data and their extrapolation to equations of state of phase
relations and vapour-liquid equilibrium in this generic three-
component system is far from complete, it is apparent that
the products of phase separation in the two scenarios will be
very different. At near-magmatic temperatures, tie lines
across the two-phase field join high and low salinity fluids,
whereas at mesothermal temperatures in contrast the two
fluids are high and low XCO2, but with little difference in
aqueous phase salinity.
If we assume hydrothermal fluid flow is broadly
upwards, a low-salinity aquo-carbonic fluid most likely
enters the two-phase field at high temperatures through
pressure drop, whereas loss of temperature and/or pressure
may cause phase separation at mesothermal temperatures.
Following the arguments and constructions of Ramboz et al
(1982), we determine that at high temperatures a high-
salinity brine would condense from the mixed fluid with little
change in XCO2 of the dominant fluid, whereas at
mesothermal temperatures progressive temperature or
pressure drop would cause a gas-rich fluid with XCO2 between
about 0.5 – 1.0 to exsolve and the dominant fluid would
evolve to lower XCO2 with little change in salinity.
These principles are applied to understanding
relations between and implications of multiple fluid types in
the mid-Cretaceous gold deposits of the Tintina Gold
Province (TGP) of interior Alaska and adjacent Yukon
Territory. The deposits in the Province include: Intrusion
Related Gold Deposits (IRGD’s) which comprise sheeted
quartz vein sets in and around cupolas of
penecontemporaneous granitic intrusions (Fort Knox, Scheelite Dome), and; ‘orogenic’ gold quartz veins in brittle-
ductile to ductile shear zones in metamorphic rocks, along the contacts between metamorphic rocks and intrusions,
or within intrusions (Pogo, Estes Dome). A magmatic-hydrothermal fluid source is universally proposed for the
IRGD’s, whereas a metamorphic fluid source is implied for the ‘orogenic’ deposits in metamorphic host rocks, and
the origins of the fluids in the shear zones spatially associated with intrusions are debated. All deposits are however
chemically and mineralogically similar, all apparently formed within a restricted time period of a few million years,
and veins contain similar types of fluid inclusions
Figure 1. Two-phase field and tie lines (long
dashes) across the solvus in the system H2O-CO2-
NaCl at different temperatures and 1 kbar, after
Duan et al (1995). Solvi for the two-phase systems
are shown on prism faces; consolute curve as
dashed line. A low-salinity aqueous fluid with
minor CO2 may fall in the two-phase field at near
magmatic temperatures and at mesothermal
temperatures, but will separate into markedly
different end-members at these P-T conditions.

Pan-American Current Research on Fluid Inclusions Rice University, Houston, Texas, U.S.A., June 12-14, 2018, Abstract Volume
80
Low-salinity aquo-carbonic fluids are dominant as interpreted primary or pseudosecondary fluid inclusions
at essentially all the gold deposits. The composition of the fluid inclusions of this type varies somewhat systematically
across the different settings, and what additional fluid inclusion types are recorded also varies. The aquo-carbonic
fluids in shear-zone hosted deposits that formed at relatively low temperatures and pressures have lower XCO2 at
similar XNaCl and are in many cases two-phase (LH2O-VCO2) rather than three-phase (LH2O-LCO2-VCO2). Carbonic-rich aquo-
carbonic fluids are almost universally recorded except in some higher-temperature vein deposits. Saline fluids, with
or without a carbonic vapor phase, are recorded in some IRGD’s (not Fort Knox), and in a few shear-zone hosted
deposits that are in or near to granitic intrusions. Based on co-existence in fluid-inclusion assemblages, both low-
and high XCO2 fluid pairs and pairs of high salinity fluids and low-salinity carbonic fluids have been invoked as
immiscible fluid pairs at different deposits (e.g. McCoy et al., 1997; Baker and Lang, 2001).
In view of the tie-lines across the solvus in the H2O-CO2-NaCl system at different temperatures, both
proposals for immiscible fluid pairs can be valid. We do not need to invoke either different ‘source’ fluid, or variable
source composition with variable pressure of formation (Baker and Lang, 2001). Rather, we can explain the range of
fluid types in the veins as being results of different P-T pathways of a single low-salinity aquo-carbonic fluid derived
from a source at magmatic or near magmatic temperatures at a few kilobars pressure, in a similar fashion as
proposed for fluid variability in porphyry-epithermal ore systems by Heinrich (2007). Fluid that rises through the
crust with little loss of temperature may intersect the solvus at near magmatic temperatures and exsolve a brine.
Fluids that thermally equilibrate with wallrock on migration would meet the solvus only at mesothermal
temperatures. On reaching the solvus, these latter fluids would progressively lose CO2 to a vapor phase on
progressive migration upwards through the crust.
REFERENCES
Baker, T. and Lang, J. R. (2001) Fluid inclusion characteristics of intrusion-related gold mineralization, Tombstone-
Tungsten magmatic belt, Yukon Territory, Canada. Mineralium Deposita 36, 563-582.
Duan, Z., Møller, N. and Weare, J. H. (1995) Equation of state for NaCl-H2O-CO2 system: Prediction of phase equilibria
and volumetric properties. Geochimica et Cosmochimica Acta 59, 2869-2882.
Heinrich, C. A. (2007) Fluid-fluid interactions in magmatic-hydrothermal ore formation. Reviews in Mineralogy and
Geochemistry 65, 363-387.
McCoy, D., Newberry, R. J., Layer, P., DiMarchi, J. J., Bakke, A., Masterman, J. S. and Minehane, D. L. (1997) Plutonic-
related gold deposits of interior Alaska. Economic Geology Monograph 9, 191-241.
Ramboz, C., Pichavant, M. and Weisbrod, A. (1982) Fluid immiscibility in natural processes: use and misuse of fluid
inclusion data II. Interpretation of fluid inclusion data in terms of immiscibility. Chemical Geology 37, 29-48.

Pan-American Current Research on Fluid Inclusions Rice University, Houston, Texas, U.S.A., June 12-14, 2018, Abstract Volume
81
Redox evolution of seawater in the Late-Permian Zechstein Basin:
implications from redox-sensitive trace elements in fluid inclusions in
halite Eszter SENDULA1, Benjamin C. GILL1, J. Donald RIMSTIDT1, Tim K. LOWENSTEIN2, Javier GARCÍA-VEIGAS3, Robert J. BODNAR1 1Fluids Research Laboratory, Department of Geosciences, Virginia Tech, Blacksburg, Virginia, U.S.A. 2Department of Geological Sciences and Environmental Studies, Binghamton University, New York, U.S.A. 3Scientific and Technological Centers, University of Barcelona, Spain
E-mail: [email protected]
Oceanic Anoxic Events (OAE) are thought to be partly responsible for mass extinction events and subsequent slow recovery of marine ecosystems during Earth’s history (Bond & Grasby, 2017). Minor and trace elements that show variations of valence state, isotope fractionation and solubility as a function of redox conditions are extensively used as paleoredox proxies. The concentrations of trace elements in sedimentary rocks are indirect indicators of the redox state of seawater at the time of deposition, but can be subject to changes due to post-depositional remobilization during diagenesis (Tribovillard et al., 2006). However, analysis of primary fluid inclusions in evaporite minerals (e.g. gypsum, halite) can provide direct information about the chemical composition of evaporating seawater and have been used to document changes in major ion concentration of paleo-seawater during the Phanerozoic Eon (Lowenstein et al., 2014).
The goal of this study is to develop a methodology to quantify ratios of minor and trace elements (Rb, Sr, Mo, Ba, Li, B, V, U, Fe, Mn, Se, Cr, Cu) in paleo-seawater based on Laser Ablation Inductively Coupled Plasma Mass Spectrometer (LA-ICP-MS) analysis of primary fluid inclusions in marine halites, and evaluate whether the element ratios may be related to redox conditions. The samples used to develop and test the methodology are from Przyborów IG3 borehole (N51°47′59.27″–E15°46′16.27″) from the Polish sector of the European Southern Permian Basin, and contain halite samples from all four major Zechstein evaporate cycles (PZ1 to PZ4). Previous studies of primary fluid inclusions from these halite samples by García-Vegias et al. (2011) suggests that the major-ion chemistry of the seawater changed from sulfate-rich brines, similar in composition to modern evaporated seawater, to sulfate-depleted (calcium-rich) brines during the latest Permian. This change coincides with a drop in δ34S and was interpreted to be the result of overturn of anoxic sulfidic deep-waters that coincides with the Permian–Triassic mass extinction event. Since iron and manganese are more soluble in water under reducing conditions than under oxidizing conditions, and uranium, molybdenum and vanadium behave in the opposite manner, we expect to see changes in measured redox-sensitive trace element ratios Fe/U, Mn/U, Fe/V, Mn/V, Fe/Mo, Mn/Mo and Mn/Fe as a function of change in redox conditions.
Major, minor, and redox sensitive trace elements of 25-100 µm single fluid inclusions were measured using LA-ICP-MS at Virginia Tech. The selected fluid inclusions are in primary growth zones of halite, contain only a single phase (brine) and have negative crystal shapes. Note that the results and interpretations presented below assume that the trace elements being analyzed behave conservatively and that ratios in seawater are little affected by earlier precipitation of carbonate and gypsum. However, to our knowledge, experimental studies to confirm this assumption have not been undertaken and important future work will attempt to determine the behavior of redox sensitive elements during seawater evaporation.
Our preliminary data show significantly higher ratios of Fe/U, Mn/U, Fe/V, Mn/V, Fe/Mo and Mn/Mo in halite samples with sulfate-depleted (calcium-rich) brines in the PZ2 and lower PZ3 cycles compared to samples with sulfate-rich brines in the PZ1, upper PZ3 and PZ4 cycles (Figure 1.). We observe increasing ratios against Mn at the upper, overall more oxidized, sulfate-rich part of the section at 1170-1100 m depth. This can be explained by a gradual shift to relatively more reducing water compositions within the redox range where iron is still sequestered in a solid phase as ferric iron (Fe3+). This is consistent with the increasing Mn/Fe ratios, relatively constant Fe/U, Fe/V and Fe/U ratios and decreasing concentration of sulfate in this part of the section. The overall trends support the previous interpretation of a transition from relatively oxic to anoxic conditions (Ca-rich zone) and then back to relatively oxic conditions (upper SO4-rich zone) concluded by García-Vegias et al. (2011).

Pan-American Current Research on Fluid Inclusions Rice University, Houston, Texas, U.S.A., June 12-14, 2018, Abstract Volume
82
REFERENCES
Bond, D.P.G., Grasby, S.E. (2017) On the causes of mass extinctions, Palaeogeography Palaeoclimatology
Palaeoecology 478, 3-29.
García-Veigas, J. et al. (2011) Zechstein saline brines in Poland, evidence of overturned anoxic ocean during the Late
Permian mass extinction event, Chemical Geology 290 (3-4), 189-201.
Lowenstein, T.K. et al. (2014) 8.21 - The geologic history of seawater, In: Turekian, K.K. (Ed.) Treatise on Geochemistry
(Second Edition), (Elsevier, Oxford) 569-622.
Tribovillard, N. et al. (2006) Trace metals as paleoredox and paleoproductivity proxies: An update, Chemical Geology
232, 12-32.
Figure 1. Trace element ratios in primary fluid inclusions in Late-Permian halite from the Polish sector of the
European Southern Permian Basin. The increase in element ratios in the part of the section, which is
characterized by sulfate-depleted (calcium-rich) major ion chemistry (shaded), is in agreement with the
previous interpretation of a redox change in the basin to a more reducing environment.

Pan-American Current Research on Fluid Inclusions Rice University, Houston, Texas, U.S.A., June 12-14, 2018, Abstract Volume
83
Invited – Determination of source rock facies of oils trapped in single
inclusions by ToF-SIMS Sandra SILJESTRÖM1, Robert POTTORF2, Sebastien DREYFUS2, Stephen P. BECKER2 1Department of Materials and Chemistry, RISE Research Institutes of Sweden, Stockholm, Sweden 2ExxonMobil Upstream Research Company, Houston, texas, U.S.A.
E-mail: [email protected]
Fluid inclusions are micron‐scale fluid‐filled cavities in rock, which record movement of past to present‐day fluids (oil, gas, and water) through the rocks. By mechanical crushing followed by solvent or thermal extraction ‐ gas chromatograph–mass spectrometer (GC‐MS), detailed molecular and isotopic data of petroleum inclusions can been obtained, however, the crushing process does not for discriminate between geochemical signatures of different fluid inclusion generations within same rock. It has been shown that, time‐of‐flight secondary ion mass spectrometry (ToF‐SIMS) may be used to detect biomarkers in single inclusions (Siljeström et al. 2009, Siljeström et al., 2010). However, the interpretation of the ToF‐SIMS spectra and application to single hydrocarbon inclusions molecular geochemistry remains challenging due to the lack of reference data on oils. To overcome this issue, well characterized oils from different source facies, thermal maturity and biodegradation level were analysed by ToF‐SIMS and used to calibrate the instrument.
Results show that the ratio of dibenzothiophene to phenanthrene (DBT/Phen) compounds may be used as a hydrocarbon source facies indicator. This ratio successfully discriminates oils sourced from organic matter deposited in marine carbonate environment from oils generated from marine clastic source rocks. Additionally, the calculated ToF‐SIMS ratios also show a linear relationship with the same ratios calculated from GC‐MS data.
In addition to the DBT/Phen ration, results have also been obtained from the phenanthrene ratio for the determination of maturity of oils. The results show that the ratio has to be calibrated separately for oils from different rock facies but then a linear relationship can found between the ratio and increasing maturity
To validate the DBT/Phen ratios for the analysis of single oil inclusions by ToF‐SIMS, synthetic inclusions were formed in a KCl saturated solution using one of the oil from the marine clastic calibration suite. The DBT/Phen ratio was then calculated from ToF‐SIMS spectra of the marine clastic oil trapped in the synthetic fluid inclusions and compared to the ratios of the calibration oil suites. Ratios obtained from standard inclusions are similar to the ones calculated for the marine clastic oil suite demonstrating that Phen/DBT ratio can be used on hydrocarbon inclusions, down to a size of 7 µm, without significant matrix effects, and therefore, the calibration suite may be used to characterize the source facies of oils trapped in fluid inclusions. Using these result the origin of oils trapped in natural inclusions within the Elk Basin Field, Big Horn Basin, WY, USA and other locations were determined. REFERENCES
Siljeström, S., Lausmaa, J., Sjövall, P., Broman, C., Thiel, V., Hode, T. (2010) Analysis of hopanes and steranes in single
oil-bearing fluid inclusions using time-of-flight secondary ion mass spectrometry (ToF-SIMS). Geobiology 8, 37–44.
Siljeström, S., Hode, T., Lausmaa, J., Sjövall, P., Thiel V. (2009) Detection of organic biomarkers in crude oils using
ToF-SIMS. Organic Geochemistry 40, 135-143.

Pan-American Current Research on Fluid Inclusions Rice University, Houston, Texas, U.S.A., June 12-14, 2018, Abstract Volume
84
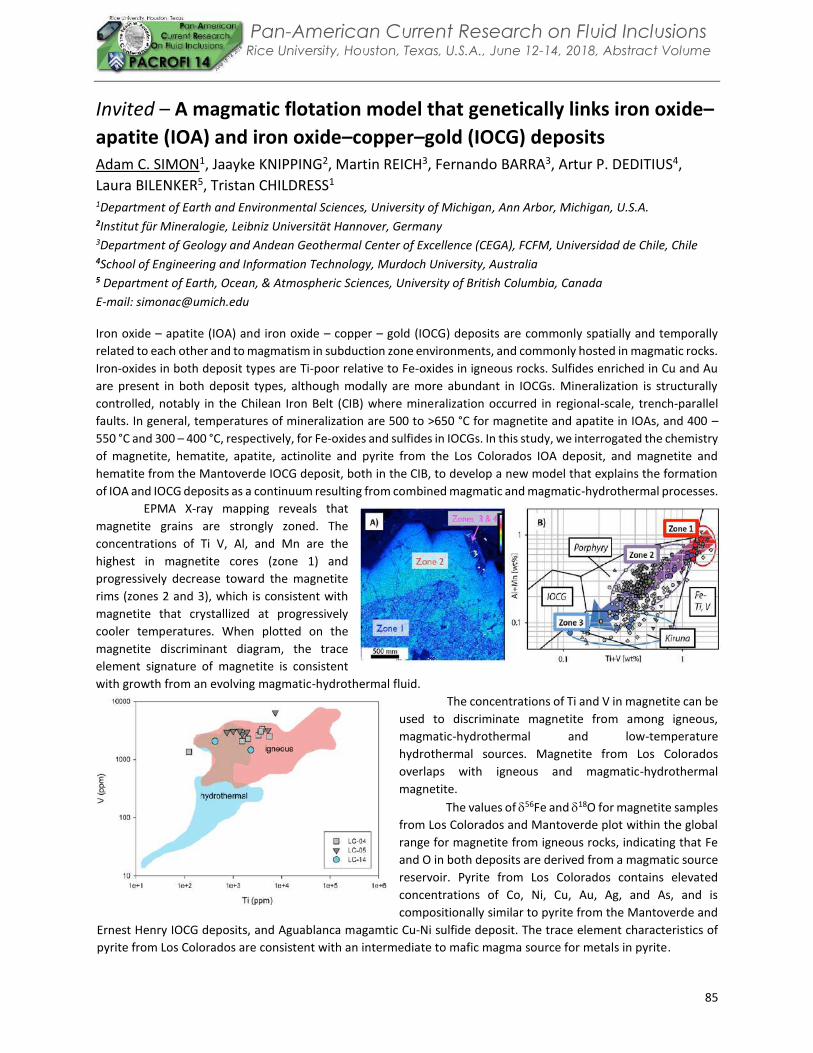
Pan-American Current Research on Fluid Inclusions Rice University, Houston, Texas, U.S.A., June 12-14, 2018, Abstract Volume
85
Invited – A magmatic flotation model that genetically links iron oxide–
apatite (IOA) and iron oxide–copper–gold (IOCG) deposits Adam C. SIMON1, Jaayke KNIPPING2, Martin REICH3, Fernando BARRA3, Artur P. DEDITIUS4,
Laura BILENKER5, Tristan CHILDRESS1 1Department of Earth and Environmental Sciences, University of Michigan, Ann Arbor, Michigan, U.S.A. 2Institut für Mineralogie, Leibniz Universität Hannover, Germany
3Department of Geology and Andean Geothermal Center of Excellence (CEGA), FCFM, Universidad de Chile, Chile
4School of Engineering and Information Technology, Murdoch University, Australia
5 Department of Earth, Ocean, & Atmospheric Sciences, University of British Columbia, Canada
E-mail: [email protected]
Iron oxide – apatite (IOA) and iron oxide – copper – gold (IOCG) deposits are commonly spatially and temporally
related to each other and to magmatism in subduction zone environments, and commonly hosted in magmatic rocks.
Iron-oxides in both deposit types are Ti-poor relative to Fe-oxides in igneous rocks. Sulfides enriched in Cu and Au
are present in both deposit types, although modally are more abundant in IOCGs. Mineralization is structurally
controlled, notably in the Chilean Iron Belt (CIB) where mineralization occurred in regional-scale, trench-parallel
faults. In general, temperatures of mineralization are 500 to >650 °C for magnetite and apatite in IOAs, and 400 –
550 °C and 300 – 400 °C, respectively, for Fe-oxides and sulfides in IOCGs. In this study, we interrogated the chemistry
of magnetite, hematite, apatite, actinolite and pyrite from the Los Colorados IOA deposit, and magnetite and
hematite from the Mantoverde IOCG deposit, both in the CIB, to develop a new model that explains the formation
of IOA and IOCG deposits as a continuum resulting from combined magmatic and magmatic-hydrothermal processes.
EPMA X-ray mapping reveals that
magnetite grains are strongly zoned. The
concentrations of Ti V, Al, and Mn are the
highest in magnetite cores (zone 1) and
progressively decrease toward the magnetite
rims (zones 2 and 3), which is consistent with
magnetite that crystallized at progressively
cooler temperatures. When plotted on the
magnetite discriminant diagram, the trace
element signature of magnetite is consistent
with growth from an evolving magmatic-hydrothermal fluid.
The concentrations of Ti and V in magnetite can be
used to discriminate magnetite from among igneous,
magmatic-hydrothermal and low-temperature
hydrothermal sources. Magnetite from Los Colorados
overlaps with igneous and magmatic-hydrothermal
magnetite.
The values of 56Fe and 18O for magnetite samples
from Los Colorados and Mantoverde plot within the global
range for magnetite from igneous rocks, indicating that Fe
and O in both deposits are derived from a magmatic source
reservoir. Pyrite from Los Colorados contains elevated
concentrations of Co, Ni, Cu, Au, Ag, and As, and is
compositionally similar to pyrite from the Mantoverde and
Ernest Henry IOCG deposits, and Aguablanca magamtic Cu-Ni sulfide deposit. The trace element characteristics of
pyrite from Los Colorados are consistent with an intermediate to mafic magma source for metals in pyrite.

Pan-American Current Research on Fluid Inclusions Rice University, Houston, Texas, U.S.A., June 12-14, 2018, Abstract Volume
86
∆18actinolite-magnetite from Los Colorados is 4.10‰, which yields a calculated minimum formation temperature
of 630 °C. The D values of magnetite (-53.5 ±1.5‰) and actinolite (-59.3 ±1.7‰) indicate a mantle source for H.
Apatite grains from Los Colorados are zoned with respect to halogens and water. The highest F concentrations are
in grain cores, and systematically the Cl/F ratio increases toward grain boundaries. Chlorine is also enriched proximal
to cracks. The highest F concentrations overlap F-rich apatite crystallized from silicate melt, and the highest Cl
concentrations overlap apatite crystallized from magmatic-hydrothermal fluid. Halite-saturated fluid inclusions are
present in zone 2 rims of magnetite grains from Los
Colorados. The inclusions are small, typically <5μm, and
indicate that magnetite zone 2 grew in equilibrium with a
brine. The concentrations of [Al + Mn] vs. [Ti + V] in
magnetite from Los Colorados and Mantoverde are
consistent with magnetite crystallization from a cooling
magmatic-hydrothermal fluid in both deposits.
These data led to the development of the
following new genetic model that explains IOA and IOCG
deposits as a single continuum that forms by a
combination of magmatic and magmatic-hydrothermal
processes:
1) Magnetite and apatite microlites crystallize as near-
liquidus phases in oxidized, intermediate-mafic
silicate melts. Magmatic magnetite will be enriched in
trace elements such as Ti, V, Mn and Al. Magmatic apatite will be enriched in F, and have a high F/Cl ratio.
2) During magma decompression, magnetite and apatite surfaces promote nucleation of gas bubbles from the
silicate melt, and bubbles nucleate on the surface of these crystals (demonstrated experimentally). As volatile
exsolution proceeds during decompression, the bubbles coalesce and sweep up magnetite and apatite
microlites, forming a crystal-fluid suspension. The bulk density of the fluid suspension is less than the density of
the surrounding magma as long as the suspension contains ≤37 vol% microlites, and the suspension will ascend
buoyantly via channels that develop as the magma solidifies.
3) Chlorine, S, P and metals (Cu, Au, Co, Ni) partition efficiently from the silicate melt to the fluid. Experiments
show that the fluid will have a high Co/Ni ratio. The magmatic-hydrothermal fluid chemistry will be dominated
by FeCl2, KCl and NaCl. Experiments indicate that at 800 C and 140 MPa the fluid contains ~6 wt% Na, ~11 wt%
K and ~7 wt% Fe. Model calculations indicate that as the fluid ascends and decompresses, the concentrations
of Na and K increase, whereas Fe decreases. Thus, during ascent, magnetite microlites continue to grow,
sourcing Fe from the decompressing and cooling magmatic-hydrothermal fluid. Likewise, apatite continues to
grow, becoming more Cl-rich as it grows from the magmatic-hydrothermal brine. This is consistent with the
presence of brine inclusions and decreasing concentrations of Ti, V, Mn and Al in magnetite zone 2, and
increasing core-to-rim Cl/F ratios of apatite at Los Colorados. Increasing Na and K concentrations of the brine
during decompression reduce the potential for sodic and potassic alteration, neither of which is observed at Los
Colorados.
4) During ascent along pre-existing structurally enhanced dilatant zones that act as conduits (e.g., faults, fractures
zones, brecciated host rocks, volcanic feeder zones, caldera systems, etc.), magnetite and apatite will reach
neutral buoyancy and drop out of the fluid suspension to form a magnetite-apatite ore body that is concordant
with the fault, and depending on the local porosity and permeability of the host rock, the fluid suspension may
percolate laterally into the host rock forming disseminated mineralization, which is commonly observed in IOAs.
5) The fluid that cools at this level of neutral buoyancy can precipitate sulfides, notably pyrite that will scavenge
metals from the fluid, resulting in pyrite with a high Co/Ni ratio.
6) For a rapidly ascending fluid, a significant amount of the suspension will continue to ascend. As the fluid evolves
to lower pressure and temperature, it precipitates magnetite (and hematite if the fluid becomes oxidized) and
sulfides to form an IOCG deposit.

Pan-American Current Research on Fluid Inclusions Rice University, Houston, Texas, U.S.A., June 12-14, 2018, Abstract Volume
87
Rock volatiles stratigraphy: A tool for petroleum exploration and
production Michael P. SMITH Advanced Hydrocarbon Stratigraphy, Inc, 2931 W21st, Tulsa, OK 74107, USA
E-mail: ahstrat.aol.com
Amazing as it may seem, there is considerable uncertainty as to the nature of the rocks and fluids drilled by oil and gas wells, even today in 2018. Well logs can be misleading. Many of today’s pay zones are considered low visibility. This is especially a problem in sediments bearing fresh non-saline water. Also in this era of low oil prices, many wells are not logged to save money. This is particularly true in horizontal wells, as they are more expensive, difficult, and time consuming to log. Tool loss is also a higher risk in horizontal wells, and the cost of replacing expensive logging tools falls on the company drilling the well, and usually not on the well logging company.
The low cost alternative to well logs is to analyze drilling mud and cuttings, free drilling by-products, to determine the location of pay zones, the nature of the product, and the quality of the reservoir. The desire to do this is not new. Although this was difficult to realize in the past, it is even more difficult today with PDC (poly-crystalline diamond compact) bits that result in cuttings fragments often less than 1 millimeter in diameter.
I invented Fluid Inclusion Stratigraphy (FIS), now available through Schlumberger, and Fluid Inclusion Volatiles (FIV), now a proprietary ExxonMobil technology, to allow rapid, large scale mapping of Fluid Inclusions in cuttings as a way of gaining otherwise unavailable insights into petroleum systems.
Although these technologies have proven valuable in reducing exploration and production risks, they have not proven successful in mapping present day pay zones. It is my experience that petroleum inclusions tend to form more in water dominated sediments than in zones of high oil or gas saturation. Also, some oil fields occur in young clastic sediments, at relatively shallow depths, in tectonically quiet basins, such as offshore Gulf of Mexico, where oil inclusions are not to be found. And the advent of widespread PDC bit drilling, with often sub-millimeter sized cuttings particles, and often disrupts whatever inclusions were originally present in the cuttings samples.
Further, I designed the FIS and FIV analytical processes to analyze volatiles only from fluid inclusions. Other sources of volatiles are removed from the samples by a combination of heating and vacuum extraction. This is particularly important for cuttings from wells drilled using Oil Based Mud (OBM). Otherwise the OBM signal overwhelms the FI signal. Any non-inclusion volatiles that survive these treatments are characterized before inclusion volatiles are introduced to the mass spectrometer, and are mathematically subtracted during data reduction.
However, mapping present day pay zones using cuttings requires analyzing today’s pore fluids, instead of discarding them via heat and vacuum and mathematically subtracting them from the result.
I have developed a gentle extraction and analyses technology called Rock Volatiles Stratigraphy (RVStratsm,
patents pending) aimed at analyzing all the volatiles in a cuttings sample. By design, this technology is not limited to Fluid Inclusions, but analyzes all extractable volatiles in a sample.
I am presenting this technology at PACROFI in part because it is an outgrowth of my work on analyzing FI volatiles, and in part because it has become obvious to me that mapping petroleum inclusions does not map pay zones.
RVStratsm analyzes volatiles in petroleum inclusions, but it also analyzes volatiles in cracks, tight pores, as well absorbed and adsorbed volatiles. To accomplish my goals I built a Cryo Trap Mass Spectrometer (CT/MS) system. Volatiles are extracted from each individual sample at two pressures, 50 and 5 millibars and frozen onto liquid nitrogen (LN2) traps, and analyzed by allowing the frozen volatiles to sublimate an enter the mass spectrometer according to their sublimation points under high vacuum. This provides a measure of compound separation and quantitation similar to that obtained in GC/MS systems. However, the CT/MS system is non-selective. All compounds that can be extracted and frozen are analyzed.
Examples of RVStratsm logs from PDC cuttings from 4 horizontal wells are shown on the next page. They show responses indicative of: oil filled fractures; changes in rock properties; faulting; pay zone identification. These and other examples will be discussed in detail.

Pan-American Current Research on Fluid Inclusions Rice University, Houston, Texas, U.S.A., June 12-14, 2018, Abstract Volume
88
Oil Filled Fracture Identification Example Rock Properties Identification Example
Fault Identification Example Pay Zone Identification Example

Pan-American Current Research on Fluid Inclusions Rice University, Houston, Texas, U.S.A., June 12-14, 2018, Abstract Volume
89
Determination of F concentrations in ore-stage MVT fluids through
SEM-EDS analysis of fluid inclusion decrepitates Sarah E. SMITH-SCHMITZ, Martin S. APPOLD Department of Geological Sciences, University of Missouri, Columbia, Missouri, U.S.A.
E-mail: [email protected]
Most Mississippi Valley-type (MVT) deposits consist principally of sulfide minerals with negligible to moderate quantities of fluorite (Leach and Taylor, 2009). However, some MVT districts, such as the Illinois-Kentucky district, are fluorite-dominant, suggesting different chemical conditions for mineralization. One hypothesis is that fluorite-dominant MVT deposits formed from anomalously F-rich fluids compared to typical sedimentary brines and MVT ore fluids. A corresponding hypothesis is that the fluids that formed fluorite-dominant MVT deposits derived their F from local coeval magma bodies. Support for these hypotheses comes from Kenderes and Appold (2017), who found F concentrations ranging from 680 to 4300 ppm in sphalerite-hosted fluid inclusions from the Illinois-Kentucky district, which is closely associated temporally with local ultramafic magmatism. In contrast, Kenderes and Appold (2017) found fluid inclusions from the fluorite-poor Tri-State district, which has no known relationship to contemporaneous magmatism, to contain undetectable concentrations of F, i.e. less ~100 ppm. However, in order to have more confidence in these hypotheses, ore fluid F concentrations from more MVT deposits, both magmatic and amagmatic, must be determined. The purpose of the present study is to carry out such a survey.
Five MVT districts with variable fluorite:sulfide abundances and from diverse geologic settings have been
selected for the present study (Fig. 1). Hansonburg, New Mexico is a rift-associated fluorite-dominant district that resembles the Illinois-Kentucky district. Sweetwater, Tennessee is a fluorite-dominant district that has no known genetic association with contemporaneous igneous activity. The Central Kentucky and Central Tennessee districts have moderate fluorite:sulfide mineral ratios. The Viburnum trend of the Southeast Missouri district is sulfide-dominant and contains negligible fluorite (Roeder et al. 1968; Kyle, 1976; Anderson et al. 1982; Misra et al., 1989; Voss et al., 1989).
Samples of sphalerite have been selected for fluid inclusion analysis from the Central Tennessee, Central Kentucky, Sweetwater, and Viburnum trend districts. Drusy quartz that paragenetically overlaps fluorite
Figure 1. Map showing locations of MVT districts included in this study, other major MVT districts, and major geologic features: Tri-State district (1), Northern Arkansas district (2), Viburnum Trend, Missouri district (4), Illinois-Kentucky district (5), Central Tennessee district (6), Central Kentucky district (7), East Tennessee district (8), Sweetwater Tennessee district (9), and Hansonburg, New Mexico district (10). Modified from Pelch et al. (2015).

Pan-American Current Research on Fluid Inclusions Rice University, Houston, Texas, U.S.A., June 12-14, 2018, Abstract Volume
90
mineralization has been selected for the Hansonburg district, as sphalerite predates fluorite mineralization in this deposit. Doubly polished thin sections of the samples have been examined petrographically to identify primary fluid inclusion assemblages. Microthermometry of the primary fluid inclusion assemblages has been performed on chips made from the thin sections. The chips will be thermally decrepitated and the resulting solute mounds (Fig. 2) will be analyzed using an SEM equipped with dual, co-planer EDS detectors. The element concentrations measured in the decrepitate mounds will be converted to mass ratios relative to chloride (F/Cl ratios).
Instrument and mineral specific calibrations curves, necessary to convert the measured F/Cl ratios to fluid inclusion fluoride concentrations, have been produced using a series of model ore fluid standards with average major element MVT ore fluid composition (Wenz et al. 2012) and dissolved fluorine concentrations from 10 to 2000 ppm. Salinities derived from microthermometry data and district specific reported chlorine concentrations will be used with the F/Cl calibration curves to determine absolute fluid inclusion fluorine concentrations and by implication, ore fluid fluorine concentrations for the districts.
The predicted ore fluid F concentrations from the MVT districts in this study, in addition to those reported by Kenderes and Appold (2017), will be considered in relation to the relative abundance of fluorite and coeval igneous rocks in the MVT districts. The results should help clarify to what degree ore fluid F concentration and coeval magmatism control fluorite abundance in MVT deposits.
REFERENCES
Kenderes S.M. and Appold M.S. (2017) Fluorine concentrations of ore fluids in the Illinois-Kentucky district: evidence from SEM-EDS analysis of fluid inclusion decrepitates, Geochim. Cosmochim. Acta 210, 2017, 132–151.
Kyle, J. R. (1976) Brecciation, alteration, and mineralization in the Central Tennessee zinc district. Econ. Geol. 71, 892-903.
Leach, D. L. and Taylor, R. D. (2009) Mississippi Valley-type lead-zinc deposit model. US Geological Survey Open-File Report, 1213.
Misra, K. C., Kopp, O. C., Paris, T. A., and Linkous, M. A. (1989). Mississippi Valley-type fluorite-barite-sphalerite mineralization in the Sweetwater district, Tennesse. Carbonates and Evaporites 4, 211.
Pelch, M. A., Appold, M. S., Emsbo, P., & Bodnar, R. J. (2015). Constraints from Fluid Inclusion Compositions on the Origin of Mississippi Valley-Type Mineralization in the Illinois-Kentucky District. Economic Geology, 110, 3, 787-808.
Roedder, E., Heyl, A. V., & Creel, J. P. (1968). Environment of ore deposition at the Mex-Tex deposits, Hansonburg district, New Mexico, from studies of fluid inclusions. Economic Geology, 63, 336-348.
Voss R. L., Hagni R. D. and Gregg J. M. (1989) Sequential deposition of zoned dolomite and its relationship to sulfide mineral paragenetic sequence in the Viburnum Trend, southeast Missouri eds. S. J. Mazzullo and J. M. Gregg. Carbonates and Evaporites 4, 195–209.
Wenz, Z. J., Appold, M. S., Shelton, K. L., & Tesfaye, S. (2012). Geochemistry of Mississippi Valley–type mineralizing fluids of the Ozark Plateau: A regional synthesis. American Journal of Science, 312, 1, 22-80.
Figure 2. Back scattered electron image of a fluid inclusion decrepitate mound from sample CTEW1BM4-1, Central Tennessee.

Pan-American Current Research on Fluid Inclusions Rice University, Houston, Texas, U.S.A., June 12-14, 2018, Abstract Volume
91
Fluid inclusion evidence for methane-dominated thermochemical
sulfate reduction in the North German Basin Marta SOŚNICKA, Volker LÜDERS GFZ, German Research Centre for Geosciences, Potsdam, Germany
E-mail: [email protected]
Hydrogen sulfide (H2S) is a common non-hydrocarbon gas in natural evaporate-hosted reservoirs. It can be produced by thermal decomposition of sulfur-bearing organic matter in kerogens, thermal cracking of sulfur-containing crude oil or by biotic/abiotic redox reactions between sulfate and hydrocarbons (e.g. Orr, 1977). In low-temperature sedimentary environments (T<80°C) bacterial sulfate reduction (BSR) is the principle H2S-forming reaction. BSR causes large sulfur isotope fractionation between sulfate and sulfide (Δ34S sulfate-H2S), of up to -72‰, averaging -51‰ in natural systems (e.g. Rudnicki et al., 2001). At temperatures above 80°C most sulfate-reducing bacteria cease metabolism and at temperatures ≥120°C thermochemical sulfate reduction (TSR) is the major process generating H2S in deep subsurface reservoirs (e.g. Worden and Smalley, 1996; Machel, 2001). During TSR, hydrocarbons react with dissolved sulfate producing, e.g. H2S, CO2, elemental sulfur and water (e.g. Krooss et al. 2008). Fractionation between sulfate and sulfide (Δ34S sulfate-H2S) due to TSR strongly depends on temperature but is less intense compared to BSR (e.g. Seal, 2006). During the past 20 years many studies have been performed for a better understanding of this abiotic alteration process. Although much is understood about TSR, there is still some debate about e.g. reacting hydrocarbons. It has been shown that higher hydrocarbons react faster during TSR than methane, however, in deep dry gas reservoirs
CH4 is the dominant reacting hydrocarbon (Cai et al., 2004).
In the North German Basin natural dry gases with high concentrations of hydrogen sulfide (5-35%) occur in deep Zechstein-2-Carbonate (Ca2) gas reservoir in the so-called “H2S Province”. The latter is situated in the northern part of the Lower Saxony Basin (LSB) and adjacent Pompeckj Block (PB), in the southern part of the Zechstein Basin. The LSB and PB significantly differ in burial history and structural evolution (Bruns et al., 2013). High H2S content in this part of the North German Basin is considered to be derived by TSR (Krooss et al., 2008).
For this study core samples of fracture-fill mineralization hosted by Ca2 carbonate were collected from boreholes drilled in the northern part of the LSB and adjacent PB. The studied samples host abundant gas-rich inclusions that contain complex C-O-H-S±N-mixtures (Figure 1) and co-genetically trapped aqueous two-phase brine inclusions. The latter show homogenization temperatures between 150 and 160°C. Gas-rich inclusions in fluorite yield low-pressure
Figure 1. C-O-H-S±N-bearing gas inclusions hosted in
fluorite.
Figure 2. C isotopic compositions of fluid inclusion
gases in Zechstein and Upper Carboniferous
reservoirs. Samples plotting above the dashed trend
line are largely fractionated due to TSR, whereas
samples plotting below the line show low or no H2S
content.

Pan-American Current Research on Fluid Inclusions Rice University, Houston, Texas, U.S.A., June 12-14, 2018, Abstract Volume
92
conditions suggesting that fluid entrapment was likely related to final stages of basin inversion in the Late Cretaceous/Tertiary. The presence of fluid inclusions containing CH4 and H2S provides the possibility to examine whether methane participated in the H2S-producing reactions, i.e. TSR, since it has been shown that in deep dry gas reservoirs similar to the Zechstein Ca2 reservoir, CH4 is the dominant reacting hydrocarbon (Cai et al., 2004). Therefore, the δ13C isotopic compositions of CH4 and CO2 of fluid inclusion gases were analyzed using a crush (bulk) technique described in detail by Plessen and Lüders (2012). Besides samples from Ca2 boreholes, samples of fracture-filling quartz hosted by Upper Carboniferous strata from tight gas reservoirs were analyzed for comparison. Gas-rich inclusions in quartz fracture-fillings are derived from mature Upper Carboniferous coal seams and contain CH4-CO2±N2 mixtures but no H2S.
The results show that the carbon isotopic signatures of methane from C-O-H-S±N inclusions in Zechstein-hosted fluorites are shifted towards less negative δ13C(CH4) values compared to H2S-free gas inclusions in fracture-filling quartz hosted by Upper Carboniferous strata (Figure 2). Moreover, there is a positive correlation between the H2S content in the inclusions and an increase in δ13C of methane (Figure 3). The observed shift of δ13C(CH4) values of fluid inclusion gases strongly supports the idea that CH4 was the (dominant?) reacting hydrocarbon in deep Ca2 dry gas reservoirs. Reaction between sulfate and CH4 led to 13C enrichment in the latter and thus to less negative δ13C values in the residual CH4 gas pool. Only with one exception there is no correlation between increasing δ13C(CH4) values and decreasing δ13C(CO2) values suggesting that CO2 in fluid inclusions (and reservoir) gas is not solely derived by TSR reaction (Figure 2).
REFERENCES
Bruns, B., di Primio, R., Berner, U., Littke, R. (2013) Petroleum system evolution in the inverted Lower Saxony Basin,
northwest Germany: a 3D basin modeling study. Geofluids 13, 246–271.
Cai, C., Xie, Z., Worden, R.H., Hu, G., Wang, L., He, H. (2004) Methane-dominated thermochemical sulphate reduction
in the Triassic Feixianguan Formation East Sichuan Basin, China: towards prediction of fatal H2S concentrations.
Mar Petrol Geol 21, 1265–1279.
Krooss, B.M., Plessen, B., Machel, H.G., Lüders, V., Littke, R. (2008) Origin and distribution of non-hydrocarbon gases,
in: Littke, R., Bayer, U., Gajewski, D., Nelskamp, S. (Eds.), Dynamics of Complex Intracontinental Basins. The Central
European Basin System. Springer, Berlin, pp. 433–458.
Machel, H.G. (2001) Bacterial and thermodynamic sulfate reduction in diagenetic settings - old and new insights.
Sediment Geol 140, 143–175.
Orr, W.L. (1977) Geologic and geochemical controls on the distribution of hydrogen sulfide in natural gas, in: Campos,
R., Goni, J. (Eds.), Advances in Organic Geochemistry. Enadisma, Madrid, Spain, pp. 571–597.
Plessen, B., Lüders, V. (2012) Simultaneous measurements of gas isotopic compositions of fluid inclusion gases (N2,
CH4, CO2) using continuous‐flow isotope ratio mass spectrometry. Rapid Commun Mass Sp 26, 1157–1161.
Rudnicki, M.D., Elderfield, H., Spiro, B, 2001. Fractionation of sulfur isotopes during bacterial sulfate reduction in
deep ocean sediments at elevated temperatures. Geochim Cosmochim Ac 65, 777-789.
Seal, R.R. (2006) Sulfur Isotope Geochemistry of Sulfide Minerals. Rev Mineral Geochem, 61, 633–677
Worden, R.H., Smalley, P.C. (1996) H2S-producing reactions in deep carbonate gas reservoirs: Khuff Formation, Abu
Dhabi. Chem Geol 133, 157–171.
Figure 3. Shift of δ13C values of CH4 with increasing H2S
content in fluid inclusions.

Pan-American Current Research on Fluid Inclusions Rice University, Houston, Texas, U.S.A., June 12-14, 2018, Abstract Volume
93
Invited – Mineral inclusion thermobarometry: A new approach to
estimate the temperatures and pressures of hydrothermal ore
formation Matthew STEELE-MACINNIS1, Kyle T. ASHLEY2, Drew W. BARKOFF3 1Deptartment of Earth & Atmospheric Sciences, University of Alberta, Edmonton, Alberta, Canada 2Department of Geology and Environmental Science, University of Pittsburgh, Pittsburgh, Pennsylvanian, U.S.A. 3Department of Geoscience, University of Nevada Las Vegas, Las Vegas, Nevada, U.S.A. E-mail: [email protected] Pressure and depth of hydrothermal mineralization are important variables in determining the size, geometry and alteration style of mineral deposits. However, pressures of hydrothermal systems are commonly only loosely constrained, because traditional methods of thermobarometry have certain shortcomings when applied to hydrothermal veins and metasomatic rocks. An alternative and complementary approach, which shows promising agreement with paleodepths estimated from structural reconstruction and stratigraphy, involves Raman spectroscopic analysis of pressurized mineral inclusions, coupled with elastic modeling to restore the inclusions to entrapment temperature and pressure (Ashley et al., 2014). While this approach has recently become increasingly popular in the study of metamorphic terranes, few studies have applied this method to hydrothermal rocks. The approach has been previously tested at one hydrothermal skarn by Barkoff et al. (2017). Here we present additional testing of the technique, showing promising results at multiple hydrothermal skarns of the Yerington district, NV.
The conceptual model for this approach is as follows: mineral inclusions within rigid host minerals are prevented from relaxing to ambient pressure owing to the mechanical constraints imposed by the surrounding host. This leads to some level of retained, or residual, pressure within the inclusion. The magnitude of retained pressure is indicated by the shift in the pressure-sensitive Raman peak position of the inclusion phase (Fig. 1; from Barkoff et al., 2017). Therefore, through Raman spectroscopy we constrain the peak shift relative to the peak position of a standard (at ambient pressure), and use this peak shift to estimate the retained pressure. We then apply an elastic model to calculate the pressure-temperature locus that satisfies mechanical equilibrium between inclusion and surroundings – that is, conditions at which internal and external pressure are equal. This approach allows us to estimate the conditions at which the inclusion was enclosed by the surrounding host.
The results by Barkoff et al. (2017) showed that, whereas mineral inclusions trapped in high-pressure metamorphic terranes commonly show positive retained pressures, mineral
inclusions trapped in relatively high-temperature, low-pressure hydrothermal settings may show negative (i.e., tensile) internal pressures. Nevertheless, the results by Barkoff et al. (2017) indicated that these negative pressures could be reliably used to estimate formation temperature and pressure, with results comparing favorably with previous estimates.
To test this method in the context of hydrothermal mineral deposits, we apply this approach at three skarns in the Ludwig area, Nevada (from shallowest to deepest): Casting Copper, Douglas Hill, and Hill 5923. Garnets at Casting Copper are andradite-rich and inclusions in garnet are predominantly apatite. At both of the deeper skarns,
Figure 1. Raman peak shift of apatite inclusion in garnet
from Casting Copper skarn, compared to the (1-atm)
standard apatite peak position measured using an
inclusion exposed to the surface by polishing. From
Barkoff et al. (2017).

Pan-American Current Research on Fluid Inclusions Rice University, Houston, Texas, U.S.A., June 12-14, 2018, Abstract Volume
94
garnets are andradite-grossular solid solutions, and host inclusions of apatite as well as quartz (Fig. 2), and calcite (at Douglas Hill). The occurrence of two or three different mineral inclusions together in the same garnet hosts at Douglas Hill and Hill 5923 enabled us to compare results obtained from multiple inclusion-host pairs, and combining the results obtained from multiple inclusion phases permits independent evaluation of both pressure and temperature simultaneously.
Raman spectroscopy shows that at ambient conditions, all three inclusion phases at all three skarns are under tension (negative pressures), and the magnitude of tension varies with pressure and temperature of formation. In particular, we note higher magnitudes of tension within inclusions hosted in garnet from the higher-temperature skarns. Magnitude of tension also differs between apatite, quartz and calcite inclusions from one locality, according to the different elastic properties of these three inclusion phases.
Based on our elastic modeling calculations, at inferred trapping temperatures of 400, 450 °C and 500 °C, respectively, pressure estimates based on apatite and calcite inclusions from all three deposits are in good agreement with stratigraphic paleodepth estimates. Quartz inclusions consistently yield higher pressures, compared to the other two inclusion phases. The intersections of results calculated using multiple inclusion phases simultaneously provides a reasonable independent match with both formation temperature and pressure, without requiring prior knowledge of the formation temperatures, although once again results that include quartz inclusions are somewhat higher, compared to the results based on intersections of apatite+calcite inclusions. These results generally reaffirm that Raman spectroscopy of mineral inclusions, combined with elastic modeling, is a promising method for thermobarometry of hydrothermal rocks, but suggest that apatite and calcite inclusions are better candidates whereas quartz is somewhat less clear. This latter result is broadly consistent with our previous findings for higher-pressure metamorphic rocks, which suggested that quartz inclusions tend to yield pressures higher than expected (Ashley et al., 2016) – likely because of as yet unaccounted for issues with regard to stress anisotropy within quartz inclusions.
In summary, although questions remain especially with regard to quartz inclusions, overall the results are encouraging, and apatite and calcite inclusions seem especially promising for thermobarometry of hydrothermal rocks. The next steps will be to apply this method to other, less well characterized skarns and other types of hydrothermal systems as well.
REFERENCES
Ashley, K.T. et al. (2014) Geothermobarometric history of subduction recorded by quartz inclusions in garnet,
Geochem, Geophys, Geosyst 15, 350-360.
Barkoff, D.W. et al. (2017) Pressures of skarn mineralization at Casting Copper, Nevada, USA, based on apatite
inclusions in garnet, Geology 45, 947-950.
Ashley, K.T. et al. (2016) Quartz-in-garnet inclusion barometry under fire: Reducing uncertainty from model
estimates, Geology 44, 699-702.
Figure 2. A quartz inclusion hosted in garnet from the
Hill 5923 skarn.

Pan-American Current Research on Fluid Inclusions Rice University, Houston, Texas, U.S.A., June 12-14, 2018, Abstract Volume
95
A model for composition and density of H2O-NaCl-CO2 fluid inclusions Matthew STEELE-MACINNIS Department of Earth & Atmospheric Sciences, University of Alberta, Edmonton, Alberta, Canada E-mail: [email protected]
Fluid inclusions approximated by the system H2O-NaCl-CO2 are common in a wide variety of geologic settings. Therefore, tools to interpret the physico-chemical properties of these fluids from analytical data are needed. Several existing computer packages are widely used to interpret properties of such fluid inclusions, especially the Flincor/MacFlincor packages (Brown, 1989; Brown and Hagemann, 1995) and the CLATHRATES package (Bakker, 1997). Both have advantages and disadvantages. The main drawbacks of Flincor/MacFlincor are that these packages have not been updated in recent years and that they are now difficult to compile and run on modern PCs. The main drawback of CLATHRATES is that the programs must be re-executed for each individual inclusion, microthermometric (or other) data must be entered manually, and output data must be extracted from the resulting text files one-by-one, rendering interpretation and compilation of large datasets prohibitively time consuming. Both programs also incorporated some approximations and simplifications in the solver approach that, while generally not major issues, are worth revisiting in light of modern computational power and equations of state that permit full treatment of mass balance and isochoricity without simplifications.
This study presents a generic approach to determine these properties of H2O-NaCl-CO2 inclusions, based on petrographic, microthermometic and/or Raman spectroscopic data, invoking constraints of mass balance and conservation of bulk molar volume. The algorithm is implemented using a combination of new correlation equations and existing equations of state. The approach is deliberately generic, accepting a range of possible input data types according to the observed petrographic, microthermometric and/or microanalytical properties of individual inclusions. Specifically, the approach can handle input data of the following types: 1) Tm,clath ≤ Th,CO2; 2) Tm,clath > Th,CO2; 3) Tm,clath ≥ Tm,ice; and 4) Tm,clath & Pm,clath (Fall et al., 2011). For each type of input data, an additional constraint is provided either by the volume fraction of the carbonic portion (at any temperature, most commonly at room T), or the total homogenization temperature. In each case, the procedure used in the calculation is based on simultaneously solving for the bulk composition and bulk density that satisfies phase equilibrium constraints at each observed phase change temperature (±pressure). As such, mass balance and isochoricity are explicitly maintained in the numerical method. The current implementation is valid for inclusions with salinity from zero to 24.2 wt% NaCl, and CO2 concentration from 1.85 to 99.8 mol% CO2 (relative to CO2+H2O).
The computer program is written in Visual Basic for Applications in Microsoft Excel. As such, the program allows fast calculation of large datasets that can be entered in spreadsheet format (output data are also written out in the same spreadsheet), with each row in the sheet corresponding to one inclusion. The program includes a main module for computing composition, density and isochore based on the input data of the various types outlined above. The program also includes tools for reconstructing and plotting phase boundaries (solvus lines) and isochore contour plots for a given composition. In addition, the program includes tools to calculate and plot the pressure-temperature trajectories of the inclusion during heating, to help visualize the observed microthermometric properties according to the phase diagram in pressure-temperature space. The program is available from the author upon request.
REFERENCES
Bakker, R. J. (1997) Clathrates: computer programs to calculate fluid inclusion V-X properties using clathrate melting
temperatures. Comp Geosci 23, 1-18.
Brown, P. E. (1989) FLINCOR: A microcomputer program for the reduction and investigation of fluid inclusion data.
Am Mineral 74, 1390-1393.
Brown, P. E., Hagemann, S. G. (1995) Macflincor and its application to fluids in Archean lode-gold deposits. Geochim
Cosmochim Acta 59, 3943-3952.
Fall, A. et al. (2011) Combined microthermometric and Raman spectroscopic technique to determine the salinity of
H2O-CO2-NaCl fluid inclusions based on clathrate melting. Geochim Cosmochim Acta 75, 951-964.

Pan-American Current Research on Fluid Inclusions Rice University, Houston, Texas, U.S.A., June 12-14, 2018, Abstract Volume
96

Pan-American Current Research on Fluid Inclusions Rice University, Houston, Texas, U.S.A., June 12-14, 2018, Abstract Volume
97
N2, CO2, and CH4 fugacities determined for gas mixtures from 10-500
bars at 22 °C using Raman spectroscopy D. Matthew SUBLETT Jr.1, Hector M. LAMADRID2, Matthew STEELE-MACINNIS3, Georg
SPIEKERMANN4, Robert J. BODNAR1 1Fluids Research Laboratory, Department of Geosciences, Virginia Tech, Blacksburg, Virginia, U.S.A. 2Department of Earth Sciences, University of Toronto, Toronto, Ontario, Canada 3Department of Earth & Atmospheric Sciences, University of Alberta, Edmonton, Alberta, Canada 4Institut für Erd- und Umweltwissenschaften, Universität Potsdam, Potsdam, Germany
E-mail: [email protected]
An ideal gas is one that assumes the individual gas molecules occupy no volume and do not interact with other gas
particles. The partial pressures of individual gas components within an ideal gas mixture are related to the total
pressure and mole fractions of the components according to:
𝑃𝑖 = 𝑋𝑖 · 𝑃 [1]
where Pi is the partial pressure of component i, Xi is the mole fraction of component i, and P is the total pressure
exerted on the gas mixture. In an ideal gas mixture, the sum of the partial pressures of each component is equal to
the total pressure. At low pressures, many common gases can be approximated as ideal gases because there is
sufficient space between molecules such that attractive and repulsive forces are adequately weakened and may be
ignored in thermodynamic calculations. Thus, determining the mixing behavior of gases at low pressures is relatively
simple. However, as pressure increases the individual molecules move closer together and the attractive or repulsive
forces between molecules become too strong to reasonably be ignored. There is a new “effective” partial pressure
for each component described as the fugacity of the gas components. The fugacity of a gas takes into account the
non-ideality of the gas by scaling the partial pressure calculated in equation 1 by a dimensionless quantity known as
the fugacity coefficient. The fugacity coefficient is equal to one for an ideal gas, and as such, the partial pressure and
the fugacity of an ideal gas are equivalent. However, the fugacity coefficient deviates from one for a non-ideal gas.
Calculations involving the fugacity of non-ideal gas mixtures can be tedious as it is time consuming to determine
fugacities from experimental data, requiring volumetric measurements of the gas at several PTX conditions and the
derivation of an equation of state that relates the volume of the gas as a function of PTX. A single measurement of
the volume at one PTX condition is not sufficient to determine an equation of state. Lamadrid et al. (2017b) recently
described a new method of determining the fugacity of N2, CH4, and CO2 gases in mixtures utilizing Raman
spectroscopy. This study extends this method to gas compositions of 25% N2, 25% CO2, and 50% CH4 and 15% N2,
60% CO2, and 25% CH4, as well as the use of molecular dynamics modeling to better understand the molecular
interactions responsible for the non-ideality of the mixtures.
Raman spectra were collected from 10-500 bars at 25°C for the aforementioned gas mixtures. The spectra
were converted to Raman pressures using pure gas calibration data for CO2, CH4, and N2 determined using results
from Lamadrid et al. (2017a), Fall et al. (2011), and Lin et al. (2007), and this study. Pressures determined from the
Raman spectra do not correspond to the partial pressures of the individual gases determined from equation 1 (see
Figure 1), nor do the sum of these pressures equate to the total pressure. The pressure determined from the Raman
spectra can be used to determine the fugacity of the components using the following relationship from Lamadrid et
al. (2017b):
𝑓𝑖 = 𝑃𝑖 ·𝑓𝜈
𝑃𝜈 [2]
where fi is the fugacity of component i, Pi is the partial pressure, fν is the fugacity determined by the Redlich-Kwong
equation of state for the pure gas component using the Raman pressure, and Pν is the Raman pressure. Fugacities

Pan-American Current Research on Fluid Inclusions Rice University, Houston, Texas, U.S.A., June 12-14, 2018, Abstract Volume
98
calculated from equation 2 are in good agreement with fugacities predicted using the Redlich-Kwong equation of
state applied to the mixture (see Figure 2). Thus, utilizing Raman spectroscopy, the fugacity of CO2, CH4, and N2 can
be determined easily over a range of PTX conditions. The method may also be applied to determine fugacities of
gases at elevated temperatures by conducting in situ Raman analyses using a high temperature and pressure cell.
Finally, this method may be used to approximate the internal pressure of fluid inclusions containing CO2, CH4, and
N2 by calculating fugacities using both the Redlich-Kwong equation of state and equation 2 for a range of pressures
and determining where the two fugacity values are equivalent for all three gases.
REFERENCES
Fall, A. et al. (2011) Combined microthermometric and Raman spectroscopic technique to determine the salinity of
H2O–CO2–NaCl fluid inclusions based on clathrate melting, Geochim. Cosmochim. Acta 75, 951-964.
Lamadrid, H. M. et al. (2017a) Reassessment of the Raman CO2 densimeter, Chem. Geol. 450, 210-222.
Lamadrid, H. M. et al. (2017b) Relationship between Raman spectral features and fugacity in mixtures of gases, J. of
Raman Spectroc. 49, 1-13.
Lin, F. et al. (2007) Experimental determination of the Raman CH4 symmetric stretching (ν1) band position from 1–
650 bar and 0.3–22 °C: Application to fluid inclusion studies, Geochim. Cosmochim. Acta 71, 3746-3756.
Figure 1. Comparison of the partial pressures of each
component predicted using eq. 1 vs the Raman
pressures of each component calculated using the
Raman peak position for the 25% N2, 25% CO2, and
50% CH4 mixture
Figure 2. Comparison of the fugacities of each
component calculated using equation 2 vs the
fugacities predicted using the Redlich-Kwong EOS for
the 25% N2, 25% CO2, and 50% CH4 mixture

Pan-American Current Research on Fluid Inclusions Rice University, Houston, Texas, U.S.A., June 12-14, 2018, Abstract Volume
99
Analysis of Water Content in Melts (Silicate Glass) Using Raman
Spectroscopy Heather M. VANDERGRIFT1, Robert J. BODNAR1 Maxim GAVRILENKO2, Michael KRAWCZYNSKI3
1Fluids Research Laboratory, Department of Geosciences, Virginia Tech, Blacksburg, Virginia, U.S.A. 2Department of Geological Sciences & Engineering, University of Nevada, Reno, Nevada, U.S.A. 3Department of Earth and Planetary Sciences, Washington University in St. Louis, St. Louis, Missouri, U.S.A.
E-mail: [email protected]
Recent years have seen significant research advances and interest related to the concentration of volatiles in natural silicate melts. This interest has been driven by the knowledge that volatile contents of magmas play an important role in the style of volcanic eruptions. This information is being applied in studies of melt inclusions from historical eruptions to compare eruption explosivity with volatile contents of melts in order to develop predictive models for future eruptions.
Various techniques have been used to determine the volatile contents of melt inclusions, including differences from EMPA analysis, FTIR, SIMS, and Raman spectroscopy. Each of these techniques offers advantages and disadvantages. While EMPA difference results tell us that additional components (elements) not accounted for in the list of elements being detected are present, it is not possible to identify the missing components. FTIR provides highly precise data for H2O and CO2 in silicate glasses, but requires fairly large melt inclusions that must be exposed on both the top and bottom of the thin section. SIMS provides reliable data for H2O, CO2, F, Cl and S, but is expensive to use and facilities are limited. Raman provides excellent spatial resolution and has been used to determine H2O contents of glass, but has relatively poor detection limits compared to FTIR and SIMS.
Here we describe the results of Raman analysis of the H2O contents of experimentally produced silicate glasses. The H2O contents had been determined previously by EMPA difference. Each sample was gently polished with a 0.3-micron alumina grit before being analyzed by Raman spectroscopy to remove the carbon coating from EMPA. Analyses were done using a 541 nm laser, a 600 grooves/mm diffraction grating, 400 micron hole, 150 micron slit, and 3 collections of 300 s each using the 100x objective and with the spectrometer centered at 3325 cm-1. To calibrate the measurements and test for reproducibility, three standard glass samples containing 4.61, 5.86 and 8.08 wt% H2O were analyzed (Fig. 1). Two separate spots were analyzed on each standard focused to a depth 0.3 microns below the surface. The area under the H2O band in the Raman spectrum was determined using an 8th order polynomial base-line correction and Gaussian peak fitting. The average area determined for the two measured spots was calculated and used to determine the H2O content of the unknown following the method described by Thomas (2000). Accordingly, the ratio of the peak areas of the standard (Fig. 2) and unknown is proportional to the ratio of the H2O content of the standard and the unknown.
The preliminary results show that the H2O content estimated using the method described by Thomas (2000) is consistent with H2O contents determined by EMPA difference. For example, the H2O content of unknown F087 3.3 wt.% from EMPA difference, and the Raman value is 3.1 wt%. The H2O content of unknown F104 is 10.1 wt% and the Raman-determined value is 9.2 wt%. In general, the difference between the EMPA value and Raman value is less than 10%.

Pan-American Current Research on Fluid Inclusions Rice University, Houston, Texas, U.S.A., June 12-14, 2018, Abstract Volume
100
REFERENCES
Thomas, R. (2000) Determination of water contents of granite melt inclusions by confocal laser Raman microprobe
spectroscopy, American Mineralogist 85, 868-872.
0
1
2
3
4
5
6
7
8
9
0 2 4 6 8 10 12
wt%
wat
er
Peak Area
Wt% vs Peak Area
4.61
5.86
8.08
F085
F105
F088
2 000
3 000
4 000
5 000
6 000
7 000
8 000
9 000
10 000
11 000
12 000
13 000
14 000
15 000
16 000
17 000
18 000
19 000
Inte
nsi
ty
2 700 2 800 2 900 3 000 3 100 3 200 3 300 3 400 3 500 3 600 3 700 3 800 3 900 (a.u.)
Figure 1. Relationship between peak area (standards included) and weight percent
water based on Raman analysis.
Figure 2. Spectrum of standard glass containing 4.61 wt% water.

Pan-American Current Research on Fluid Inclusions Rice University, Houston, Texas, U.S.A., June 12-14, 2018, Abstract Volume
101
Keynote – Fluid inclusions in ice Edwin D. WADDINGTON Earth and Space Sciences, University of Washington, Seattle, Washington, U.S.A.
E-mail: [email protected]
Polar ice sheets in Greenland and Antarctica, mountain glaciers, and sea ice on the Arctic and Southern Ocean are
major reservoirs of ice on Earth. All three ice reservoirs contain fluid inclusions, but their contents, formation
processes, and geophysical importance differ markedly. In the interiors of the Greenland and Antarctic ice sheets,
the inclusions contain air and water vapor. In mountain glaciers, which are often at their pressure-melting
temperature, the inclusions can be 1% of the volume, and can contain air, water, water vapor, or all three. In sea
ice, the fluid in the inclusions is usually brine and vapor. In comparison with other rocks, ice bodies are chemically
simple systems in which solid, liquid, and vapor are predominantly one chemical species, H2O. However, this
simplicity can be illusory, because even at -55oC at South Pole, ice is still at 85% of its melting temperature, and this
relative warmth means that the vapor phase continually affects inclusions through sublimation and deposition.
Ice cores from the polar ice sheets have provided climate histories going back 800,000 years (EPICA, 2004),
and a search is underway now for million-year-old ice in East Antarctica. The temperature history at a site can be
found from stable isotopes (D or 18O of H2O) in the ice, and air trapped in bubbles provides the only surviving
samples of Earth’s atmosphere in the past. Firn is the intermediate stage between snow and glacier ice, as
accumulating snow compacts under its own weight. However, the process can take centuries to millennia, during
which air in the firn can still mix with the free atmosphere, so correlating paleotemperatures to greenhouse gases
such as CO2 and CH4 requires accurate calculation of the age difference between the air and the ice that holds it.
That difference (age) is estimated with firn-compaction models. Most models since Herron and Langway (1980)
are based on the Robin (1958) hypothesis - each decrease in porosity is proportional to the increase in overburden
stress. This is an inherently steady-state assumption, and most models are empirically tuned using measured depth-
density profiles, mean-annual temperatures, and accumulation rates, all of which are assumed to be steady.
Recent efforts, e.g. Arthern et al. (2010), use more physics in the firn-consolidation equations, following
concepts developed in hot-powder pressing of ceramics and metals. The effective viscosity or strength of firn
depends on the evolving microstructural properties of the ice-air aggregate, such as specific surface area, and
distributions of grain size, neck area, and coordination number. Evolution equations for microstructural properties
as functions of overburden stress, temperature, and the current microstructural state can now be tested with -CT
Figure 1. Left – Firn consolidation and occlusion of air bubbles.
Air is in bubbles is always younger than the ice that traps it.
The difference is called age.
Right – Bubbly ice recovered in a shallow ice core. Credit:
Lonnie Thompson, The Ohio State University.

Pan-American Current Research on Fluid Inclusions Rice University, Houston, Texas, U.S.A., June 12-14, 2018, Abstract Volume
102
scans of firn cores (e.g. Figure 2) that track those properties with increasing age under a
range of climate conditions. When an effective viscosity can be computed at each stage,
a transient continuum compaction equation can be solved for firn density. New
estimates of age in ice cores refined in this way should contribute to improved
interpretations of paleoclimate states. Evolution of intrinsic permeability can also be
inferred.
Isotopic analysis of air in bubbles, (Sowers et al., 1992), also informs us about
past climate and about age. Firn is a huge diffusion column, and heavy isotopes such as 40Ar, and 15N in N2 gravitationally settle and concentrate at the bottom, where bubbles
are trapped. In a steady climate, deviations from atmospheric values indicate the depth
of the diffusive column, and that depth in turn contains information about temperature
and snow accumulation rate at the time. When climate changes abruptly, heavy
isotopes move toward colder depths, enhancing or counter-acting the gravitational
settling. The effects can be separated because 40Ar diffuses more slowly than 15N. Since
the atmosphere is globally well-mixed, correlating trace-gas concentrations also allows
new ice cores to be dated (WAIS, 2015).
Sea ice forms from freezing seawater in the polar oceans. With seawater at -2oC, and the
air at -32oC above e.g. a 10 cm layer of growing ice, temperature gradients can exceed
300oC m-1. During the freezing process, salt is excluded from the ice lattice, causing a
salinity gradient under the thickening ice. Because heat diffuses in the water faster than
salt, a layer of super-cooled water ~10 cm thick forms under the ice, which grows by
sending fingers or platelets into the super-cooled water, rather than by advancing as a
planar front (as lake ice would). The fingers trap seawater in pockets in the growing ice,
forming brine inclusions. The freezing point of a brine inclusion must match the
temperature of the surrounding ice. When the ice cools, the brine is too dilute, and
water freezes onto the walls of the inclusions, raising the salinity and shrinking the
inclusions. When the ice warms, so ice melts off the walls, diluting the brine and enlarging
the inclusions. Enlarged brine pockets can join up, forming vertical brine channels, which
ultimately drain the brine back into the ocean below. The vertical channels make the sea
ice mechanically anisotropic and weak for horizontal shear, which is important for ship
operations and pack-ice forecasts. Cores reveal texture and strength, and can sample
microbial activity in the brine channels.
REFERENCES
Arthern, R. J., D.G. Vaughan, A.M. Rankin, R. Mulvaney, E.R. Thomas (2010). In situ measurements of Antarctic snow compaction compared with predictions of models. JGR. 115, F03011. https://doi.org/10.1029/2009JF001306.
WAIS-Divide Project Members. (2015) Precise interhemispheric phasing of abrupt climate change during the last ice age. Nature, 520, 661-665.
Dadic, R., P.C. Mullen, M. Schneebeli, R.E. Brandt, and S.G. Warren (2013) Effects of bubbles, cracks, and volcanic tephra on the spectral albedo of bare ice near the Transantarctic Mountains: Implications for sea glaciers on
Snowball Earth. JGR Earth Surface 118(3). doi:10.1002/jgrf.20098. EPICA Community Members, (2004) Eight glacial cycles from an Antarctic ice core. Nature 429: 623-628. Herron, M. and C.C. Langway (1980) Firn densification: an empirical model. J. Glaciol. 25(93), 373-385. Lundin, J.M.D., and 13 others. (2017) Firn Model Inter-Comparison Experiment (FirnMICE). J. Glaciol. 63, 401-422.
Robin, G. de Q. (1958). Glaciology III: Seismic shooting and related investigations, Norwegian-British-Swedish Antarctic Expedition, 1949-52. Scientific Results 5, 134. Oslo: Norsk Polarinstitutt.
Sowers, T., M. Bender, D. Raynaud, and Y.S. Korotkevich (1992) δ15N of N2 in air trapped in polar ice: a tracer of gas transport in the firn and a possible constraint on ice age–gas age differences. JGR 97, 15683–15697.
Figure 2. -CT image of
firn near close-off
density. From Dadic et
al. (2015).
T=-5oC
T=-2oC
T=-15oC
Figure 3. Brine pockets
and channels enlarge as
temperature increasees.

Pan-American Current Research on Fluid Inclusions Rice University, Houston, Texas, U.S.A., June 12-14, 2018, Abstract Volume
103
Unraveling the history of ultra-deep fractures in sedimentary basins Qiqi WANG, Stephen E. LAUBACH, András FALL Bureau of Economic Geology, Jackson School of Geosciences, The University of Texas at Austin, Austin, Texas, U.S.A.
E-mail: [email protected]
In the past half-decade unprecedented opportunities have arisen for extracting information about the origin and persistence of fracture porosity from fracture samples. Even in largely open fractures, localized cement deposits and fluid inclusion assemblages accumulated during fracture growth provide unique records of fluid composition and temperature. With burial history or cement accumulation models these records can yield evidence of the timing and rate of fracture formation.
Here we unravel the history of fracture in the ultra-deep Lower Cretaceous Frontier Formation sandstones using core samples from two wells in the Madden field, Wyoming (Figure 1). The Madden structure is an east-west trending anticline discovered in the 1960s (Brown and Shannon, 1989). The Big Horn 2-3 was an early deep delineation well. In 1992, shortly after retrieving the core we describe, the Big Horn 3-36 well blew out and caught fire; subsequently gas was produced at a rate of about 5 MMcfd, testifying to the efficacy of open fractures as fluid conduits in these low porosity sandstones.
Our samples are from depths of 6240 to 6244 m. Frontier sandstones are dominantly litharenites to sublitharenites, with average composition of 64% quartz, 6% feldspar, and 30% lithics, although more quartz-rich facies are locally present. Opening-mode fractures are aligned at a high angle to beds and thus have steep dips. Fractures are lined and locally bridged with quartz deposits (Figure 2). Overall apertures of the fractures we mapped are 400-700 µm. As in other moderately-deeply buried sedimentary rocks, isolated bridges of cement deposited during fracture opening in otherwise open fractures have rod or pillar-like shapes that are typically oriented normal to, and connect opposite, opening-mode walls.
Bridges contain wall-rock fragments and cement arranged in crack-seal texture that records repeated cracking and local cement accumulation along fractures within the bridges as well as zoned, non-crack seal quartz. Each crack-seal increment,
called a ‘gap deposit’ to distinguish them from the overall fracture of which they form a part, is typically marked by a fluid inclusion assemblage trapped along the gap deposit centerline (Figure 2).
Gap deposit thicknesses normal to fracture walls in more shallowly buried sandstones typically range from less than 1 µm to more than 1 mm, but commonly are less than 20 µm (avg. ca. 10 µm)(Laubach et al., 2004). But gap sizes in our deep samples are wider, with many in the range of 40 µm. Cross-cutting relations documented by mapping cement textures, allows the relative time sequence of fluid inclusion assemblages to be documented. Quartz deposits that span between fracture walls are separated by porous fractures having thin quartz lining (rinds) or these areas or residual void space may be filled with calcite.
Preliminary fluid inclusion results show that FIAs record a wide range of temperatures from about 140°C to 260°C or more, and have a fairly narrow salinity range that is mostly less than 2 wt% NaCl. The high temperature of fracture formation likely accounts for the wide sizes of quartz gap deposits, since temperature is a main control on spanning potential (Lander and Laubach, 2015). Assuming measured temperatures reflect burial depths, for typical Rocky Mountain region burial histories for the Frontier Formation (i.e. Laubach et al., 2016), our FIA results imply that fractures grew over tens of millions of years. Although further analysis is needed, both wells may contain a
Figure 1. Location of deep ‘Bighorn’ BH 3-36 and 2-3 cores in Wyoming. RI, SW and BRF are other core locations (shallower depths) and OR, MG, and OM are outcrop locations of fractured Frontier Formation being compared with subsurface data.

Pan-American Current Research on Fluid Inclusions Rice University, Houston, Texas, U.S.A., June 12-14, 2018, Abstract Volume
104
temperature gap (ca. 170-210°C) that could mark a hiatus in fracture growth. A hiatus in fracture widening was documented in fractures from the Frontier Formation in the Green River Basin from depths of 4538 to 4547 m (Laubach et al., 2016).
Fracture mineralogy and textures were documented using transmitted light petrography and cathodoluminescence (CL) imaging obtained with a Zeiss Sigma High Vacuum Field Emission SEM with an Oxford X-Max 50 Silicon drift detector (SDD) and a Gatan MonoCL4 system specifically configured for large-area mosaic SE, BSE, EDS, and CL imaging. The SEM was operated at 12–15 kV and at large sample currents for panchromatic and color CL imaging. For microthermometry we used a USGS-style gas flow heating/freezing stage mounted on an Olympus microscope equipped with a 40× objective (N.A.=0.55) and 15× oculars.
In agreement with previous results from other sandstones (e.g., Fall et al., 2015) our results show that fractures in sandstones can grow over long time periods and retain porosity at great depth (>6 km) and high temperature (>170°C) for tens of millions of years.
ACKNOWLEDGEMENTS
Research supported by grant DE-FG02-03ER15430 from Chemical Sciences, Geosciences and Biosciences Division, Office of Basic Energy Sciences, Office of Science, U.S. Department of Energy, and by the Fracture Research and Application Consortium.
REFERENCES
Brown, R.G., Shannon, L.T. (1989) The #2-3 Bighorn: an ultra-deep confirmation well on the Madden anticline. Gas Resources of Wyoming. 40th Annual Field Conf., Wyo. Geol. Assoc. Guidebook, 181-187.
Fall, A., Eichhubl, P., Bodnar, R. J., Laubach, S.E., Davis, J.S. (2015) Natural
hydraulic fracturing of tight-gas sandstone reservoirs, Piceance Basin,
Colorado. Geol. Soc. Am. Bull. 127(1-2), 61-75.
Lander R.H., Laubach, S.E. (2015) Insights into rates of fracture growth and sealing
from a model for quartz cementation in fractured sandstones. Geol. Soc. Amer.
Bull. 127(3-4), 516-538.
Laubach, S.E., Fall, A., Copley, L.K., Marrett, R., Wilkins, S. (2016) Fracture porosity
creation and persistence in a basement-involved Laramide fold, Upper
Cretaceous Frontier Formation, Green River Basin, U.S.A. Geol. Mag. 153 (5/6),
887-910.
Laubach, S., Lander, R., Bonnell, L., Olson, J., Reed, R. (2004) Opening histories of
fractures in sandstone. In Cosgrove, J.W., Engelder, T., eds., The initiation,
propagation, and arrest of joints and other fractures, Geol. Soc. London Sp. Pub.
231, 1-9.
Figure 2. SEM-CL (a), (b) and map (c) of edge of bridge deposits showing crack-seal texture. Gd; Gdw-cx gap deposits and crosscutting relations. Lq, non-crack seal quartz. FIA locations marked by blue color in(c). Numbers indicate sequence of gaps and overgrowths.

Pan-American Current Research on Fluid Inclusions Rice University, Houston, Texas, U.S.A., June 12-14, 2018, Abstract Volume
105
Keynote – Reassessing Cl in melt inclusions: new insights on magma
and magmatic fluid geochemistry based on Cl solubility in silicate
melts Jim WEBSTER Department of Earth & Planetary Sciences, American Museum of Natural History, New York, New York, U.S.A.
E-mail: [email protected]
Identifying pulses of fluid-saturated magma, both intrusive and eruptive, is essential for understanding a host of magmatic-hydrothermal processes (Wallace et al., 1995). Accurate interpretation of buoyancy-driven fluid ascent and fluid accumulation at apices of plutons; component exchange between hydrothermal fluid, melt, and minerals; the deposition of granite-related magmatic-hydrothermal mineralization; and/or the explosive fragmentation and eruption of volatile-enriched melts requires unambiguous recognition of the presence of exsolved magmatic fluids. Research on magmatic Cl has proven useful for understanding degassing, melt evolution, and other igneous processes. Magmatic Cl behavior varies strongly with its solubility in melt, and Cl solubility and its partitioning between melts and fluids vary with the Cl content of the system, melt composition, pressure, and the abundance of oxidized magmatic sulfur; temperature has a lesser influence. Given these solubility relationships and that they differ from those with the other primary, COHS magmatic volatiles, Cl can provide unique insights on magma evolution and fluid exsolution when understood in the context of its solubility in melts.
Some publications on magmatic Cl include ambiguous references to “high” versus “low” Cl in melt inclusions and the magmas they represent. Equivocal characterizations like these hinder the interpretation of volatile behavior during magma evolution because they describe relative rather than absolute concentrations. This is particularly problematic for Cl because its solubility in melt and its partitioning between melts, minerals, and fluids vary so strongly with melt composition and magmatic Cl contents. Consequently, a few studies have applied experimentally determined Cl solubility limits to Cl contents of melt inclusions (Webster et al., 2015) and in matrix glasses (Balcone-Boissard et al., 2016) to track hydrosaline liquid or brine exsolution in felsic magmas. Most other studies, however, do not account for the fundamental control of melt composition on Cl dissolution in silicate melts and coexisting fluids. Chlorine solubility is determined experimentally with silicate melts that are saturated in brine ± vapor, and modeled Cl solubilities represent maximum values that are fixed in the melt due to thermodynamic equilibrium with a hydrosaline liquid or brine (with or without a coexisting aqueous or aqueous-carbonic vapor phase) at a fixed pressure, temperature, and melt composition.
This study presents a new method of interpreting melt Cl concentrations that are normalized to their Cl solubilities. We apply the method to the Cl concentrations of > 5000 mafic to felsic melt inclusions (MI) and matrix glasses (MG) (Figure 1), but we focus on Cl in approximately 3800 dacitic to rhyolitic MI and MG (Figure 2) representing 68 felsic igneous systems to elucidate the behavior of Cl during magmatic, magmatic-hydrothermal, degassing, and mineralizing processes. Most of these glasses are metaluminous and rhyolitic, but the compositions range from sub-alkaline dacites to alkaline trachytes and pantellerites and comendites and also include alkali-poor to alkali-enriched rhyolites. Tectonically, most glasses come from eruptive systems including volatile-enriched
Figure 1. Measured Cl concentrations normalized to Cl solubilities (calculated for
50 MPa) for > 5000 basaltic to rhyolitic melt inclusions and matrix glasses as a
function of melt evolution expressed as the Larsen index = [(SiO2/3)+(K2O) -
(CaO)-(Mg)-(FeO) wt.% basis].

Pan-American Current Research on Fluid Inclusions Rice University, Houston, Texas, U.S.A., June 12-14, 2018, Abstract Volume
106
subduction-related magmas, back-arc basins, and continental rhyolitic systems. Other MI represent hot-spot related oceanic granites; rift-related granites; tin-mineralized porphyritic granites; and other Cu-, W-, Mo-, Ag-, base metal-, ± Nb-mineralized porphyritic granites.
The influence of decreasing pressure, associated with magma ascent-driven decompression, on Cl solubility in brine- ± vapor-saturated melts is interpreted for these 68 felsic magmas. The modeled Cl solubilities in melt decrease and, hence, the solubility-normalized Cl ratios (i.e., measured Cl contents/modeled Cl solubilities) increase, with reduced pressure. Comparison (Figure 2) of the solubility-normalized Cl ratios of the MI and MG with the horizontal line that represents solubility-normalized Cl ratios of unity identifies the pressure at which the felsic melt was saturated in brine ± vapor. For example, glasses from 2 systems overlap with and 4 others lie above the line indicating saturation in brine at mid-crustal pressures equal to or greater than 600 MPa, respectively. Moreover, Cl in glasses from 10 additional systems are consistent with saturation in brine at near-surface pressures of 20 MPa.
One can also model the effects of fractional crystallization, magma mixing, degassing, and/or brine assimilation on Cl behavior at fluid-absent or fluid-saturated conditions and compare the modeled results with MI and MG from each magmatic system (Figure 2). The solubility-normalized Cl concentrations of felsic MI and MG show a variety of trends as well as fluctuating ranges in dispersion or scatter in the data when plotted relative to the
Larsen index. Steep, near-vertical curves in the (measured Cl in melt/modeled 200-MPa solubility of Cl in melt), for systems exhibiting minimal scatter, express fluid-absent magma crystallization. Other such positive relationships reflect assimilation of brine. Conversely, negative slopes in these evolution curves express the variable sequestration of Cl by vapor and/or brine, as magma evolves via fractional crystallization.
This method also supports the calculation of accurate Cl contents of magmatic vapor, of an integrated assemblage of vapor + brine, or of brines that are geologically relevant to high-silica felsic magmas at pressures near 200 MPa and evolving as closed systems. We have arbitrarily modeled Cl in masses of ca. 0.2, 2, and 4 grams of magmatic fluid. With 0.2 grams (in 99.8 grams of melt so the fluid/melt ratio is 2.0 x 10⁻³), the estimated Cl concentrations of the fluids (i.e.,
vapor, brine or integrated vapor plus brine) range from 0.3 to nearly 70 wt.%. This very wide range in Cl contents decreases significantly with increasing fluid mass (i.e., with increasing crystallization and melt evolution). For instance, the fluid(s) contain 0.3 to ≤ 18 wt.% Cl with 2 grams of fluid, and the modeled fluids contain only 0.3 to 11 wt.% Cl when the mass of fluid increases to 4 grams (for a fluid/melt ratio of 4 x 10⁻²).
This approach offers great promise for modeling fluid exsolution and estimating Cl concentrations of magmatic fluids and coexisting melts during Cl exchange processes, but significantly more experimental data on Cl solubilities in melts and on Cl partitioning between melts and fluids are required for mid- to shallow-crustal pressure conditions, in addition to these extant constraints for 200 MPa. Also, the dramatic influence of oxidized magmatic sulfur on Cl partitioning must be better determined.
REFERENCES
Wallace, P. (2005) Volatiles in subduction zone magmas: concentrations and fluxes based on melt inclusion data,
Journal of Volcanology and Geothermal Research 140, 217-240.
Webster, J.D. et al. (2015) Experimental and modeled chlorine solubilities in aluminosilicate melts at 1 to 7000 bars,
American Mineralogist 100, 522-535.
Balcone-Boissard, H. et al. (2016) Chlorine as a geobarometer for alkaline magmas: evidence from a systematic study
of the eruptions of Mount Somma-Vesuvius, Nature DOI:10.1038/srep21726.
Figure 2. Measured Cl concentrations normalized to modeled Cl
solubilities (calculated for > 3800 felsic melt inclusions and matrix
glasses at 200 MPa) as a function of the Larsen differentiation index
applied to processes of magma evolution and fluid exsolution.

Pan-American Current Research on Fluid Inclusions Rice University, Houston, Texas, U.S.A., June 12-14, 2018, Abstract Volume
107
Keynote – The fate of sulfur at the magmatic-hydrothermal transition
in the porphyry ore-forming environment Zoltán ZAJACZ, Alexandra TSAY, Nuur GHAZALI Department of Earth Sciences, University of Toronto, Toronto, Ontario, Canada
E-mail: [email protected]
Porphyry-type Cu (±Au, Mo) ore deposits are even larger positive anomalies for sulfur in the Earth’s crust than they are for Cu. Their ore metal and sulfur budget is thought to be derived from aqueous fluids released from associated large upper crustal magma reservoirs. Sulfur plays multiple roles in the genesis of these deposits: 1) it acts as a ligand to form complexes with certain ore metals in high temperature fluids; 2) it facilitates the precipitation of sulfide ore minerals and 3) it is a key to the acid rock alteration typically occurring at higher levels in porphyry systems (i.e. sericitic and advanced argillic alteration zones). Porphyry deposits most commonly occur in association with relatively oxidized, hydrous magmas and much of the S is thought to enter the hydrothermal system as magmatic SO2 (e.g. Sillitoe 2010 and references therein). The SO2 disproportionates to H2S and H2SO4 at lower temperature. The such-formed H2S may react with dissolved metal chloride complexes to form ore metal sulfides, whereas the H2SO4 will cause acid alteration and the precipitation of hydrothermal sulfates (e.g. anhydrite and alunite). Most of the S is stored in the form of anhydrite in porphyry ore deposits and much of the anhydrite occurs in the higher-temperature potassic alteration zone (e.g. Gustafson and Hunt, 1975), which lacks acid alteration suggesting that the origin of anhydrite here cannot be explained by the disproportionation of magmatic SO2. As most of the ore metal endowment of porphyry deposits is concentrated in the potassic alteration zone, it is critical to understand the mechanism of anhydrite and sulfide precipitation in this zone because it may help us answer key open questions in porphyry ore genesis, such as the significance of S and metal donation from mafic magmas and the relative significance of vapor and brine phases in ore mineral precipitation.
Recent studies have proposed various new mechanisms to explain the formation of anhydrite in porphyry deposits, including direct H2SO4 transfer from the magma to the hydrothermal system and chemisorption of magmatic SO2 by Ca-rich minerals in the host rock (Binder and Keppler, 2011; Henley et al., 2015; Mavrogenes and Blundy, 2017). However, both of these would still induce strong acid alteration of the host rock and thus are at odds with the presence of anhydrite in the potassic alteration zone. Similarly, the proposition of Blundy et al. (2015) of deep mafic-magma sourced SO2 interacting with metal-rich brines accumulated at shallower levels to produce ore metal sulfides involves the production of abundant HCl and thus would result in acid alteration.
We hypothesized that anhydrite component can directly dissolve into high-temperature brines and may precipitate later on simply due to cooling without involving reaction with the host rock. To test this hypothesis, we conducted experiments to 1) assess the solubility anhydrite in magmatic fluids as a function of fluid salinity, temperature and pressure; and 2) test if oxidizing conditions may allow the partitioning of sulfur into the brine phase during vapor-brine separation. For these purposes, experiments were conducted in rapid-quench Molybdenum-Hafnium Carbide pressure vessel assemblies in the P-T range of 120 – 240 MPa and 600 – 900 oC. The fluid phase(s) were trapped in the form of synthetic fluid inclusions (SFI) at run P-T in quartz fractured in situ during the experiment after the attainment of equilibrium. Most anhydrite solubility experiments were conducted at P=240 MPa confining pressure to allow free variation of fluid salinity without intersecting the vapor-brine immiscibility field. Experiments
aiming to determine the brine/vapor partition coefficients of S (/b v
SD ) were mostly conducted at P=130 MPa and
T=900 oC and followed the methodology developed by Zajacz et al. (2017). Vapor and brine salinities are around 4 and 60 wt% NaCl equivalent at these conditions, respectively. Particular attention was paid to testing the effect of
fO2 and thus the oxidation state of S on /b v
SD . The concentration of S and other major and trace elements in the SFI
were determined by Laser Ablation Inductively Coupled Plasma Mass Spectrometry (LA-ICP-MS) at the University of Toronto. The analytical procedure optimized for quantitative sulfur analysis involved the use of an in house-built low-S background ablation cell and the measurement of 34S.
The results show that the solubility of anhydrite exponentially increases with fluid salinity (Fig. 1) and reaches very high values in high salinity supercritical fluids and also in sub-critical brines with similar salt concentration. At the same time, the solubility of anhydrite in brines is highly temperature dependent and drops by

Pan-American Current Research on Fluid Inclusions Rice University, Houston, Texas, U.S.A., June 12-14, 2018, Abstract Volume
108
about a factor of 5 as T decreases from 900 oC to 600 oC. On the other hand, the brine/vapor partitioning experiments showed that while S does show a strong preference for the vapor phase at reducing conditions where S is dominantly in 2- oxidation state, this behavior drastically changes with
increasing fO2. The value of /b v
SD increased from
about 0.2 to 0.9 with fO2 increasing from one log unit below to 1.8 log unit above the Ni-NiO buffer. Note that the fO2 of most porphyry Cu systems is around or above the latter value. The addition of significant HCl to the bulk fluid (HCl/total Cl = 0.25) did not cause a statistically significant change in
/b v
SD at either oxidizing or reducing conditions.
Keeping in mind that many magmas associated with porphyry ore deposits are anhydrite saturated, our results suggest that primary magmatic brines could carry a significant amount of dissolved anhydrite component, which would rapidly precipitate upon cooling, explaining the presence of anhydrite in the potassic alteration zone. Even if the input magmatic fluids are in the single phase field and have low to moderate salinities as observed in some porphyry systems, still a significant amount of S would partition into the brine phase upon the commonly seen brine condensation during the decompression of ascending magmatic fluids. Subsequent cooling of these brines would also facilitate anhydrite precipitation without causing acid alteration. One may question if most of the S is present as sulfate species in these high-T brines, how do ore metal sulfides precipitate from them? The most likely explanation is electron exchange between Fe and S in the fluid phase. Primary magmatic fluids contain high concentrations of iron in the form of dissolved Fe(II)Cl2. Upon cooling, Fe could donate electrons to S, yielding Fe3+ and S2-. Commonly occurring potassic alteration zone minerals such as magnetite, biotite and even K-feldspar can serve as an Fe3+ sink, while the production of S2- facilitates the precipitation of chalcopyrite and bornite. The reactions involved in sulfide precipitation produce much smaller amount of acid species than alternative mechanisms. REFERENCES
Binder, B. and Keppler, H. (2011) The oxidation state of sulfur in magmatic fluids. Earth Planet. Sci. Lett. 301, 190-198.
Gustafson, L.B. and Hunt, J.P. (1975) The porphyry copper deposit at El Salvador, Chile. Econ. Geol. and 70, 857-912. Sillitoe, R.H. (2010) Porphyry Copper Systems. Econ. Geol. 105, 3-41. Zajacz, Z. et al. (2017) The partitioning of Cu, Au and Mo between liquid and vapor at magmatic temperatures and
its implications for the genesis of magmatic-hydrothermal ore deposits. Geochim. Cosmochim. Acta 207, 81-101. Henley R.W. et al. (2015) Porphyry copper deposit formation by sub-volcanic sulfur dioxide flux and chemisorption.
Nature Geoscience, 8, 210-215. Mavrogenes J. and Blundy J. (2017) Crustal sequestration of magmatic sulfur dioxide. Geology, 45, 211-214. Blundy J. et al. (2015) Generation of porphyry copper deposits by gas-brine reaction in volcanic arcs. Nature
Geoscience, 8, 235-240.
Figure 1. The solubility of anhydrite as a function of fluid salinity at T=800 oC and P=240 MPa. Uncertainties are reported at 1σ; S/Cl molar ratios in the fluid are shown in label.
Pan-American Current Research on Fluid Inclusions Rice University, Houston, Texas, U.S.A., June 12-14, 2018, Abstract Volume
109
Application of fluid inclusions to study shale hydrocarbon – a case
study of Shaxin Well #2 on the southwestern margin of the Paleogene
Qaidam Basin, northwest China Min ZHANG, Guangxi OU Beijing Research Institute of Uranium Geology, Beijing 100029, China
E-mail: [email protected]
Using inclusion petrography, the fluorescence characteristics of inclusions, and a microscopic temperature analysis, we combined the characteristics of tectonic activity and the evolution of hydrocarbon source rocks to comprehensively study the accumulation periods of Paleogene shale hydrocarbon reservoirs in Shaxin Well #2 on the southwestern margin of the Qaidam Basin. Due to the special property of general diagenesis of fine minerals in shale, for this study, we selected the interlayer of siltstone and fine sandstone in shale hydrocarbon reservoirs as the subject of analysis. The comprehensive studies indicate that this shale oil-gas reservoir experienced two periods of oil-gas filling processes: the first period occurred in late Miocene (N1) sedimentation, when the organic matter for the hydrocarbon source rocks were in the middle of its low-maturity stage; there is a lack of a vertical grooming system, and the accumulation scale is small. The second period occurred in late Pliocene (N2) sedimentation and continues today; this period was accompanied by massive tectonic movement during the late Himalayan period. The type of mature hydrocarbons in the deep hydrocarbon source rocks migrated along the fault network to the sandstone reservoirs, accumulated, and became reservoirs. The scale of hydrocarbons was relatively large during this period and is also the most important hydrocarbon accumulation process in the area.
REFERENCES
Bodnar, R.J. (1990) Petroleum migration in the Miocene Monterey Formation, California, USA: constraints from
fluid-inclusion studies. Mineral. Mag. 54: 295-304.
McLimans, R.K. (1987) The application of fluid inclusions to migration of oil and diagenesis in petroleum reservoirs.
App. Geochem. 2: 585-603
Ou, G.X., Li L.Q., Sun, Y.M. (2006) Theory and application of the fluid inclusion research on the sedimentary basins.
Bull. Min. Petrol. Geochem. 25, 1-11.
Tao, S.Z. (2006) Sequence of diagenetic authigenic mineral: the basis of timing the inclusions formation in
sedimentary rock. Petrol. Explor. Dev. 33, 154-160.
Yin, C.M., Zhang, B.Q. (2005) Petroleum resource status and development strategy in Qaidam Basin. Eng. Sci. 7, 78-
82.

Pan-American Current Research on Fluid Inclusions Rice University, Houston, Texas, U.S.A., June 12-14, 2018, Abstract Volume
110

Pan-American Current Research on Fluid Inclusions Rice University, Houston, Texas, U.S.A., June 12-14, 2018, Abstract Volume
111
Keynote – Fluid inclusions in Astromaterials: Direct samples of early
solar system aqueous fluids Michael ZOLENSKY1, Queenie H.-S. CHAN2, Yoko KEBUKAWA3, Robert J. BODNAR4, Marc FRIES1 1Aatromaterials Research and Exploration Science, NASA Johnson Space Center, Houston, Texas, U.S.A. 2School of Physical Sciences, Open University, Milton Keynes, U.K. 3Division of Materials Science and Chemical Engineering, Yokohama National University, Yokohama, Japan 4Fluids Research Lab, Department of Geosciences, Virginia Tech, Blacksburg, Virginia, U.S.A. E-mail: [email protected]
Introduction We have become increasingly aware of the fundamental importance of water, and aqueous
alteration, on primitive solar-system bodies (Zolensky et al., 2008). All classes of astromaterials studied show some degree of interaction with aqueous fluids. We have direct observations of cryovolcanism of several small solar system bodies (e.g. Saturnian and Jovian moons) (Lellouch et al., 2002), and indirect evidence for this process on the moons Europa, Titan, Ganymede, and Miranda, and the Kuiper Belt object Charon (Cook et al., 2007), and so are certain of the continuing and widespread importance of aqueous processes across the solar system. Nevertheless, we are still lacking fundamental information such as the location and timing of the aqueous alteration and the detailed nature of the aqueous fluid itself.
Fluid Inclusions in Meteoritic Halite Two thermally-metamorphosed ordinary chondrite regolith breccias (Monahans 1998, hereafter simply “Monahans” (H5) and Zag (H3-6)) were found by us to contain fluid inclusion-bearing halite (NaCl) crystals (Zolensky et al. 1999, 2000) dated by K-Ar, Rb-Sr and I-Xe systematics to be ~4.5 billion years old (Zolensky et al., 1999, 2000; Whitby et al., 2000; Bogard et al., 2001), and thus the trapped aqueous fluids and solids are at least as ancient. Heating/freezing studies of the aqueous fluid inclusions in Monahans halites Zolensky et al., 1999) demonstrated that they were trapped near 25°C, and their continued presence in the halite grains requires that their incorporation into the H chondrite asteroid occurred after that body’s metamorphism ended, since heating would have caused fluids to exit the halite (Zolensky et al., 1999). The initial results of our O and H isotopic measurements on Monahans and Zag halite brine inclusions (Yurimoto et al., 2014) can be explained by simple model mixing asteroidal and cometary water.
These halites also contain solids with a wide mineralogy, including abundant organics which we have been investigating by FTIR, µ-L2MS, Raman spectroscopy, STXM-XANES, NanoSIMS, and UPLC-FD/QToF-MS (Kebukawa et al., 2014; Chan et al., 2018). These organics show a wide chemical variation, representing organic precursors, intermediates and reaction products that possibly include life’s precursor molecules. The halite crystals exhibit a diverse organic content that includes a mixture of C- and N-bearing materials comprising macromolecular carbon exhibiting a wide range of structural order, non-conjugated aromatic molecules, imine, nitrile and/or imidazole compounds, and amino acids. The solids and organics contain excesses of neutron-rich isotopes of H, O, N and Cr, requiring a very cold formation location. The enrichment in 15N reflect sources of interstellar 15N such as ammonia and amino acids. Our study reveals that the halite parent body, possibly a trans-neptunian object injected into the inner solar system by giant planet migration and becoming a C, P or D class asteroid (Vokrouhlický et al., 2016), shows evidence for a complex combination of biologically- and prebiologically-relevant molecules.
Locating Fluid Inclusions In Other Astromaterials The presence of fluid inclusions in the rather fragile halite crystals in Monahans and Zag suggested that fluids must have also been preserved in other meteoritic minerals, such as carbonates and silicates. This is supported by the discovery of decrepitated fluid inclusions in the nakhlites, appearing as dark trails through augite grains (Bridges et al., 2000). Therefore, we have been carefully examining newly-prepared thin sections of CM and CI chondrites for fluid inclusions, locating potential aqueous fluid inclusions in Ivuna (CI), Murray (CM2), Mighei (CM2), Sayama (CM2), ALH 84029 (CM2), Tagish Lake (C2) and LON 94101 (CM2), and Sutter's Mill (C2) in carbonate, sulfide, olivine and enstatite crystals (Fig. 1). Optical, SEM and synchrotron X-ray computed tomography imaging indicate that calcite and sulfides in Sutter's Mill have abundant, though very small, fluid inclusions (Tsuchiyama et al., 2014; Zolensky et al., 2017). The success of this survey demonstrates that we can expect to find aqueous fluid inclusions in numerous, varied meteorites. These inclusions had not been previously detected because they are very small (none larger than a few micrometers), and because of the high potential for creating spurious fluid inclusions during standard sample preparation procedures.

Pan-American Current Research on Fluid Inclusions Rice University, Houston, Texas, U.S.A., June 12-14, 2018, Abstract Volume
112
Implications It is well recognized that aqueous fluids, especially brines, were important in the early Solar System. Such fluids are probably present today below the surfaces of the icy moons Europa and Callisto (Hartogh et al., 2011). Brown and Hand (2013) proposed that NaCl and KCl dominate the non-ice component of the leading hemisphere of Europa, and that the most abundant salts in Europa ocean brines are chlorides. Samples of ancient, inner solar system water have survived in the form of aqueous fluid inclusions in chondrites and, probably, other classes of meteorites. Meteoritic fluid inclusions thus offer a unique opportunity to study early Solar System brines in the laboratory. Inclusion by inclusion analyses of the trapped fluids in carefully‐selected samples will, in the immediate future, provide detailed information on the evolution of aqueous fluids as they interacted with anhydrous solid materials, and the evolution of prebiotic organic compounds. Thus, real data can replace calculated fluid compositions in thermochemical calculations of the evolution of water and aqueous reactions in comets, asteroids, moons and the terrestrial planets (Zolotov, 2008). Analysis of the organics that accompany these brine samples will shed important new light on the origin of life.
REFERENCES
Bogard et al. (2001) Meteoritics & Planetary Science 36, 107-122.
Bridges et al. (2000) Lunar and Planetary Institute Science Conference XXXI, Abstract #1590.
Brown and Hand (2013) The Astronomical Journal 145, 110-117.
Chan et al. (2018) Science Advances 4 (p.eaao3521).
Cook et al. (2007) The Astrophysical Journal 663, 1406-1419.
Hartogh et al. (2011) Nature 478, 218-220.
Kebukawa et al. (2014) Abstracts, 77th Annual Meeting of the Meteoritical Society.
Lellouch et al. (2002) Nature 421, 45-47.
Tsuchiyama et al. (2014) Abstracts, 77th Annual Meeting of the Meteoritical Society.
Vokrouhlický et al. (2016) The Astronomical Journal 152:39, 1-20.
Whitby et al. (2000) Science 288, 1819-1821.
Yurimoto et al. (2014) Geochemical Journal 48, 1-12.
Zolensky et al. (1999) Science 285, 1377-1379.
Zolensky et al. (2000) Lunar and Planetary Science XXXI, The Lunar and Planetary Institute.
Zolensky et al. (2008) In Oxygen in the Solar System, MSA Revs. in Mineralogy and Geochemistry 68, pp. 429-462.
Zolensky et al. (2017) In The Origin, History and Role of Water in the Evolution of the Inner Solar System,
Philosophical Transactions of the Royal Society A. 375, Article 20150386.
Zolotov (2008) Lunar and Planetary Institute Science Conference XXXIX, Abstract 2349.
Figure 1. Two phase fluid
inclusions in estraterrestrial
calcite. (a) Primary fluid inclusion
in the Murray CM2 chondrite at
low mag. (circle). (b) Same
Murray inclusion at high mag. (c)
Primary fluid inclusion in the
Tagish Lake C2 chondrite at low
mag. (circle). (d) Same inclusion
at high mag. (e) Secondary fluid
inclusions in Tagish Lake. (f)
Primary fluid inclusion in the
Ivuna CI chondrite at low mag.
(red circle). (b) Same Ivuna
inclusion at high mag.

Pan-American Current Research on Fluid Inclusions Rice University, Houston, Texas, U.S.A., June 12-14, 2018, Abstract Volume
113
# Name Affiliation E-mail address
1 Martin Appold University of Missouri, USA [email protected]
2 Wyatt Bain University of Alberta, Canada [email protected]
3 Stephen Becker ExxonMobil, USA [email protected]
4 Mitchell Bennett USGS, USA [email protected]
5 Márta Berkesi Eötvös University Budapest, Hungary [email protected]
6 Bob Bodnar Virginia Tech, USA [email protected]
7 Julien Bourdet CSIRO Energy, Australia [email protected]
8 Rosmer Brito Smith ExxonMobil, USA [email protected]
9 Philip Brown University of Wisconsin, USA [email protected]
10 Taras Bryndzia Shell, USA [email protected]
11 Bob Burruss USGS (retired), USA [email protected]
12 Kristina Butler The University of Texas at Austin, USA [email protected]
13 Lauren Cassel Devon Energy, USA [email protected]
14 Katrina Cox Core Labs, USA [email protected]
15 Michael Decindis University of Arizona, USA [email protected]
16 Tim Diggs Aramco Services, USA [email protected]
17 Dom Druke Independence Resources, USA [email protected]
18 Vanessa Dyja-Person H-Expertise Services, USA [email protected]
19 Hunter Edwards Virginia Tech, USA [email protected]
20 Alexy Elias-Bahnan Université de Lorraine, France [email protected]
21 András Fall The University of Texas at Austin, USA [email protected]
22 Regina Ferreira Denver, Colorado, USA [email protected]
23 Stephanie Forstner The University of Texas at Austin, USA [email protected]
24 Benedek Gál ConocoPhillips, USA [email protected]
25 Bob Goldstein University of Kansas, USA [email protected]
26 Gary Gray Rice University, USA [email protected]
27 Tibor Guzmics Eötvös University Budapest, Hungary [email protected]
28 Janet Haggerty University of Tulsa, USA [email protected]
29 Jordan Jensen University of Arizona, USA [email protected]
30 Sona Joseph ExxonMobil, USA [email protected]
31 Jan Braly Kihle Institute for Energy Technology, Norway [email protected]
32 Yury Klyukin Virginia Tech, USA [email protected]
33 Hector Lamadrid University of Toronto, Canada [email protected]
34 Pilar Lecumberri-Sanchez University of Alberta, Canada [email protected]
35 Cin-Ty Lee Rice University, USA [email protected]
36 Zhaoqi Li CGG Houston, USA [email protected]
37 Fang Lin Chevron, USA [email protected]
38 Volker Lüders GFZ Potsdam, Germany [email protected]

Pan-American Current Research on Fluid Inclusions Rice University, Houston, Texas, U.S.A., June 12-14, 2018, Abstract Volume
114
39 Gordon MacLeod Chesapeake, USA [email protected]
40 Dan Marshall Simon Fraser University, Canada [email protected]
41 Oscar Martínez Zárate Université de Lorraine, France [email protected]
42 Celestine Mercer USGS, USA [email protected]
43 Raymond Michels Georesources-CREGU, France [email protected]
44 Madison Miller University of Louisiana, USA [email protected]
45 Lowell R Moore Virginia Tech, USA [email protected]
46 Megan Newcombe Columbia University, USA [email protected]
47 Guangxi Ou Research Institute of Uranium Geology, China [email protected]
48 Jacques Pironon Université de Lorraine, France [email protected]
49 Zsófia Poros ConocoPhillips, USA [email protected]
50 Bob Pottorf ExxonMobil (Retired), USA [email protected]
51 Jim Reynolds Fluid Inc, USA [email protected]
52 John Ridley Colorado State Univeristy, USA [email protected]
53 Eszter Sendula Virginia Tech, USA [email protected]
54 Sandra Siljeström RISE Research Institutes of Sweden [email protected]
55 Adam Simon University of Michigan, USA [email protected]
56 Jinny Sisson University of Houston, USA [email protected]
57 Christopher Smith University of Arizona, USA [email protected]
58 Dennis Smith AHS, USA [email protected]
59 Mike Smith AHS, USA [email protected]
60 Sarah Smith University of Missouri [email protected]
61 Timothy Smith AHS, USA [email protected]
62 Marta Sośnicka GFZ Potsdam, Germany [email protected]
63 John Stainforth Shell [email protected]
64 Matthew Steele-MacInnis University of Alberta [email protected]
65 Cole Stringer AHS, USA [email protected]
66 Shelley Stringer AHS, USA [email protected]
67 Matt Sublett Jr Virginia Tech, USA [email protected]
68 Laura Taylor University of Houston, USA [email protected]
69 Heather Vandergrift Virginia Tech, USA [email protected]
70 Esra Inan Villegas Shell, USA [email protected]
71 Ed Waddington University of Washington, USA [email protected]
72 David T Wang ExxonMobil, USA [email protected]
73 Qiqi Wang The University of Texas at Austin, USA [email protected]
74 Matt Wasson ConocoPhillips, USA [email protected]
75 Jim Webster American Museum of Natural History, USA [email protected]
76 Zoltán Zajacz University of Toronto, Canada [email protected]
77 Min Zhang China University of Petroleum, China [email protected]
78 Michael Zolensky NASA Johnson Space Center, USA [email protected]

Pan-American Current Research on Fluid Inclusions Rice University, Houston, Texas, U.S.A., June 12-14, 2018, Abstract Volume
115

Pan-American Current Research on Fluid Inclusions Rice University, Houston, Texas, U.S.A., June 12-14, 2018, Abstract Volume
116

Pan-American Current Research on Fluid Inclusions Rice University, Houston, Texas, U.S.A., June 12-14, 2018, Abstract Volume
117

Pan-American Current Research on Fluid Inclusions Rice University, Houston, Texas, U.S.A., June 12-14, 2018, Abstract Volume
118

Pan-American Current Research on Fluid Inclusions Rice University, Houston, Texas, U.S.A., June 12-14, 2018, Abstract Volume
119

Pan-American Current Research on Fluid Inclusions Rice University, Houston, Texas, U.S.A., June 12-14, 2018, Abstract Volume
120