the women of the wework collective, and their …...2 the women of the wework collective, and their...
TRANSCRIPT
THE WOMEN OF THE
WEWORK COLLECTIVE,
AND THEIR HOUSEHOLDS Baseline Survey Report
WaterSHED July 2016
i
Table of Contents Introduction ......................................................................................................................................1
The women of the WEwork Collective, and their households ..............................................................2
Individual Characteristics .......................................................................................................................... 2
Household characteristics ......................................................................................................................... 5
Comparing the women to their husbands ................................................................................................ 5
Decision-making in the household ......................................................................................................7
Household wealth and well-being ......................................................................................................9
Housing conditions.................................................................................................................................... 9
Household assets and wealth ................................................................................................................... 9
WASH situation of the households ........................................................................................................... 9
Political and Civic Participation ......................................................................................................... 11
Economic Activities .......................................................................................................................... 12
Work for a wage/salary ........................................................................................................................... 12
Household-run businesses ...................................................................................................................... 15
Self-efficacy and Cognitive Abilities .................................................................................................. 17
Self-efficacy ............................................................................................................................................. 17
Cognitive Abilities ................................................................................................................................... 17
Professional Networks ..................................................................................................................... 19
Conclusions and Recommendations.................................................................................................. 20
1
Introduction WaterSHED has developed a training and mentorship network of women, called “the WEwork Collective”,
in which dynamic skills training is combined with peer mentorship. Since it is a proof-of-concept, it is key
to understand the changes in participants over time. Surveys of the participating women are being
conducted at baseline, mid-line and end-line and focus on general socio-economic circumstances,
economic activities, household decision-making, self-efficacy, cognitive capacity, and their professional
networks. We expect to see greatest change in these areas.
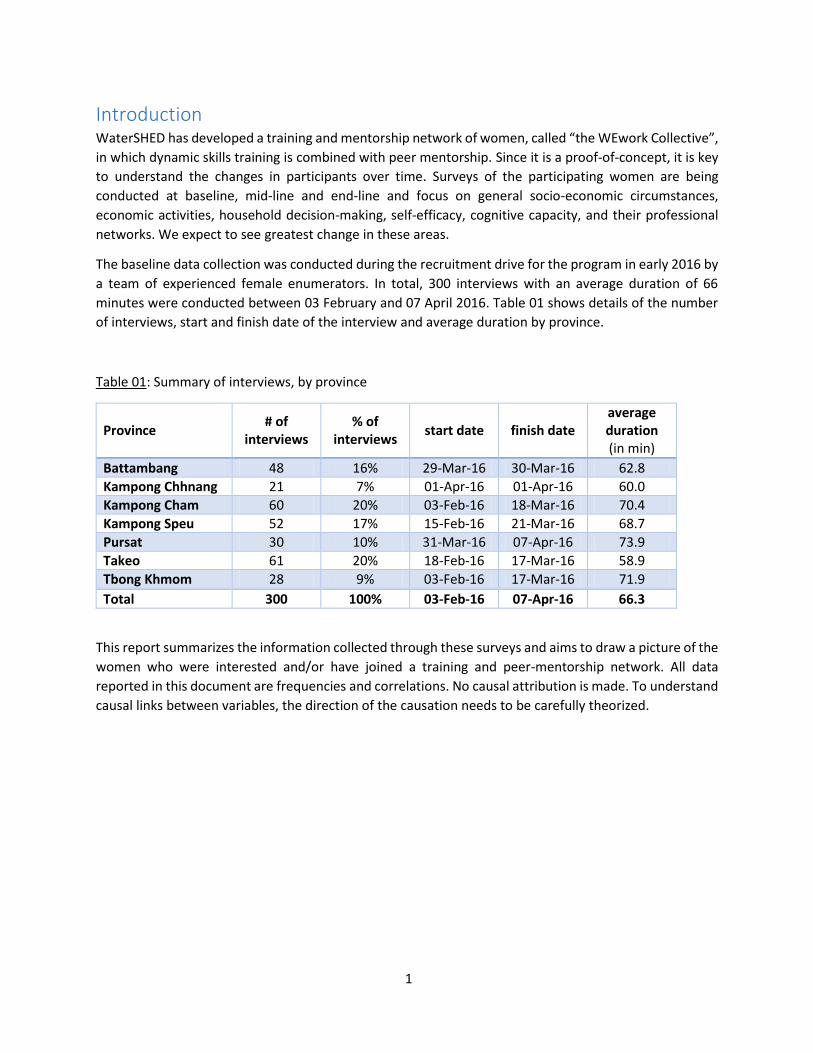
The baseline data collection was conducted during the recruitment drive for the program in early 2016 by
a team of experienced female enumerators. In total, 300 interviews with an average duration of 66
minutes were conducted between 03 February and 07 April 2016. Table 01 shows details of the number
of interviews, start and finish date of the interview and average duration by province.
Table 01: Summary of interviews, by province
Province # of
interviews % of
interviews start date finish date
average duration (in min)
Battambang 48 16% 29-Mar-16 30-Mar-16 62.8
Kampong Chhnang 21 7% 01-Apr-16 01-Apr-16 60.0
Kampong Cham 60 20% 03-Feb-16 18-Mar-16 70.4
Kampong Speu 52 17% 15-Feb-16 21-Mar-16 68.7
Pursat 30 10% 31-Mar-16 07-Apr-16 73.9
Takeo 61 20% 18-Feb-16 17-Mar-16 58.9
Tbong Khmom 28 9% 03-Feb-16 17-Mar-16 71.9
Total 300 100% 03-Feb-16 07-Apr-16 66.3
This report summarizes the information collected through these surveys and aims to draw a picture of the
women who were interested and/or have joined a training and peer-mentorship network. All data
reported in this document are frequencies and correlations. No causal attribution is made. To understand
causal links between variables, the direction of the causation needs to be carefully theorized.
2
The women of the WEwork Collective, and their households In total 300 women applied to join the WEwork Collective. Table 02 gives an overview of basic descriptive
statistics of characteristics of these women1.
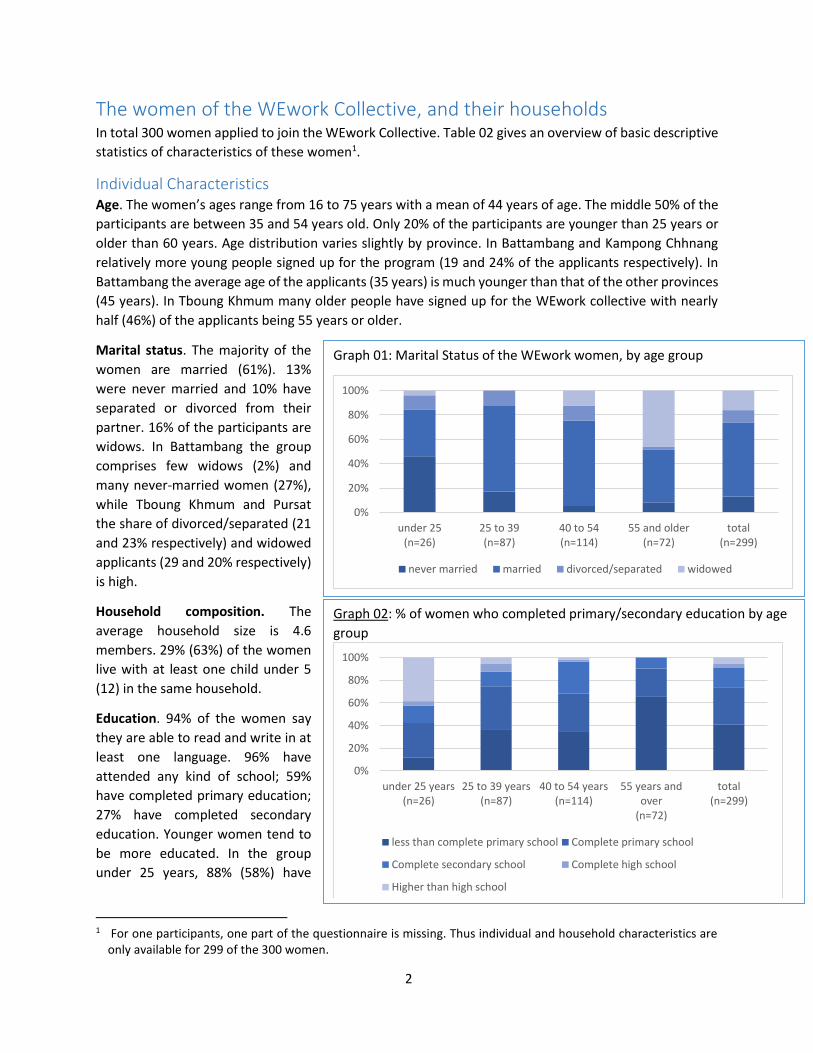
Individual Characteristics Age. The women’s ages range from 16 to 75 years with a mean of 44 years of age. The middle 50% of the
participants are between 35 and 54 years old. Only 20% of the participants are younger than 25 years or
older than 60 years. Age distribution varies slightly by province. In Battambang and Kampong Chhnang
relatively more young people signed up for the program (19 and 24% of the applicants respectively). In
Battambang the average age of the applicants (35 years) is much younger than that of the other provinces
(45 years). In Tboung Khmum many older people have signed up for the WEwork collective with nearly
half (46%) of the applicants being 55 years or older.
Marital status. The majority of the
women are married (61%). 13%
were never married and 10% have
separated or divorced from their
partner. 16% of the participants are
widows. In Battambang the group
comprises few widows (2%) and
many never-married women (27%),
while Tboung Khmum and Pursat
the share of divorced/separated (21
and 23% respectively) and widowed
applicants (29 and 20% respectively)
is high.
Household composition. The
average household size is 4.6
members. 29% (63%) of the women
live with at least one child under 5
(12) in the same household.
Education. 94% of the women say
they are able to read and write in at
least one language. 96% have
attended any kind of school; 59%
have completed primary education;
27% have completed secondary
education. Younger women tend to
be more educated. In the group
under 25 years, 88% (58%) have
1 For one participants, one part of the questionnaire is missing. Thus individual and household characteristics are
only available for 299 of the 300 women.
Graph 01: Marital Status of the WEwork women, by age group
0%
20%
40%
60%
80%
100%
under 25(n=26)
25 to 39(n=87)
40 to 54(n=114)
55 and older(n=72)
total(n=299)
never married married divorced/separated widowed
Graph 02: % of women who completed primary/secondary education by age
group
0%
20%
40%
60%
80%
100%
under 25 years(n=26)
25 to 39 years(n=87)
40 to 54 years(n=114)
55 years andover
(n=72)
total(n=299)
less than complete primary school Complete primary school
Complete secondary school Complete high school
Higher than high school
3
completed primary (secondary) education. The rate among all other age groups is much lower (see Graph
02).
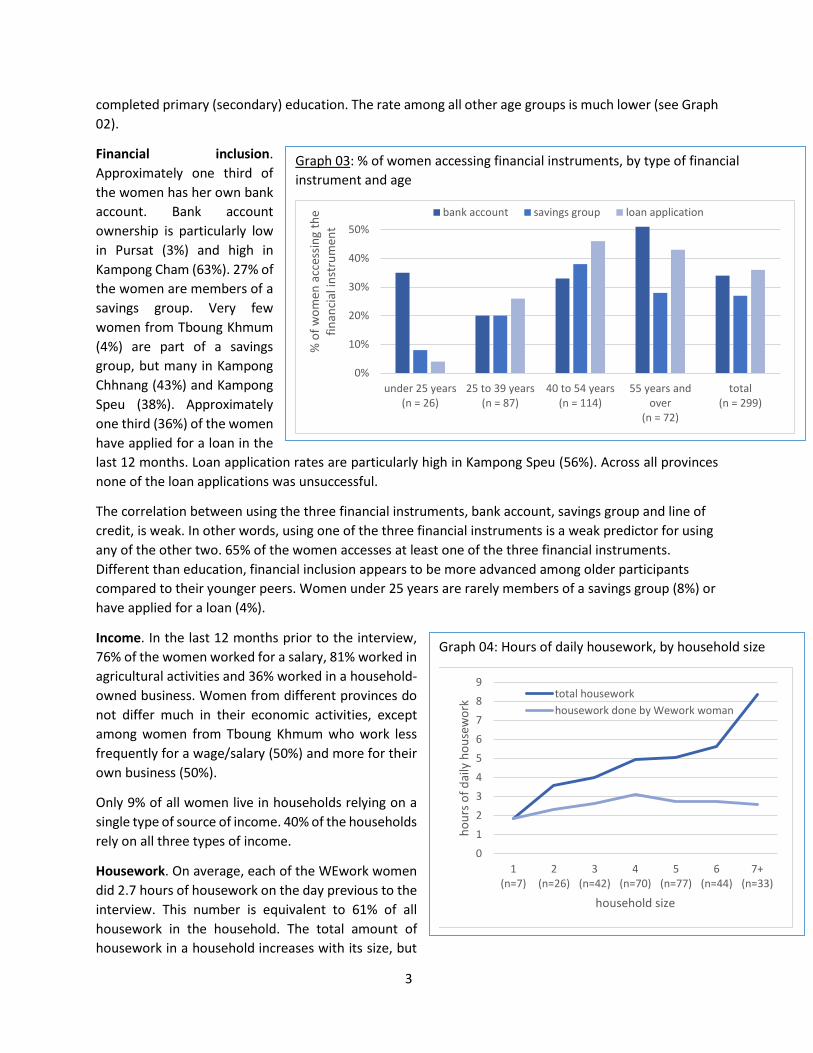
Financial inclusion.
Approximately one third of
the women has her own bank
account. Bank account
ownership is particularly low
in Pursat (3%) and high in
Kampong Cham (63%). 27% of
the women are members of a
savings group. Very few
women from Tboung Khmum
(4%) are part of a savings
group, but many in Kampong
Chhnang (43%) and Kampong
Speu (38%). Approximately
one third (36%) of the women
have applied for a loan in the
last 12 months. Loan application rates are particularly high in Kampong Speu (56%). Across all provinces
none of the loan applications was unsuccessful.
The correlation between using the three financial instruments, bank account, savings group and line of
credit, is weak. In other words, using one of the three financial instruments is a weak predictor for using
any of the other two. 65% of the women accesses at least one of the three financial instruments.
Different than education, financial inclusion appears to be more advanced among older participants
compared to their younger peers. Women under 25 years are rarely members of a savings group (8%) or
have applied for a loan (4%).
Income. In the last 12 months prior to the interview,
76% of the women worked for a salary, 81% worked in
agricultural activities and 36% worked in a household-
owned business. Women from different provinces do
not differ much in their economic activities, except
among women from Tboung Khmum who work less
frequently for a wage/salary (50%) and more for their
own business (50%).
Only 9% of all women live in households relying on a
single type of source of income. 40% of the households
rely on all three types of income.
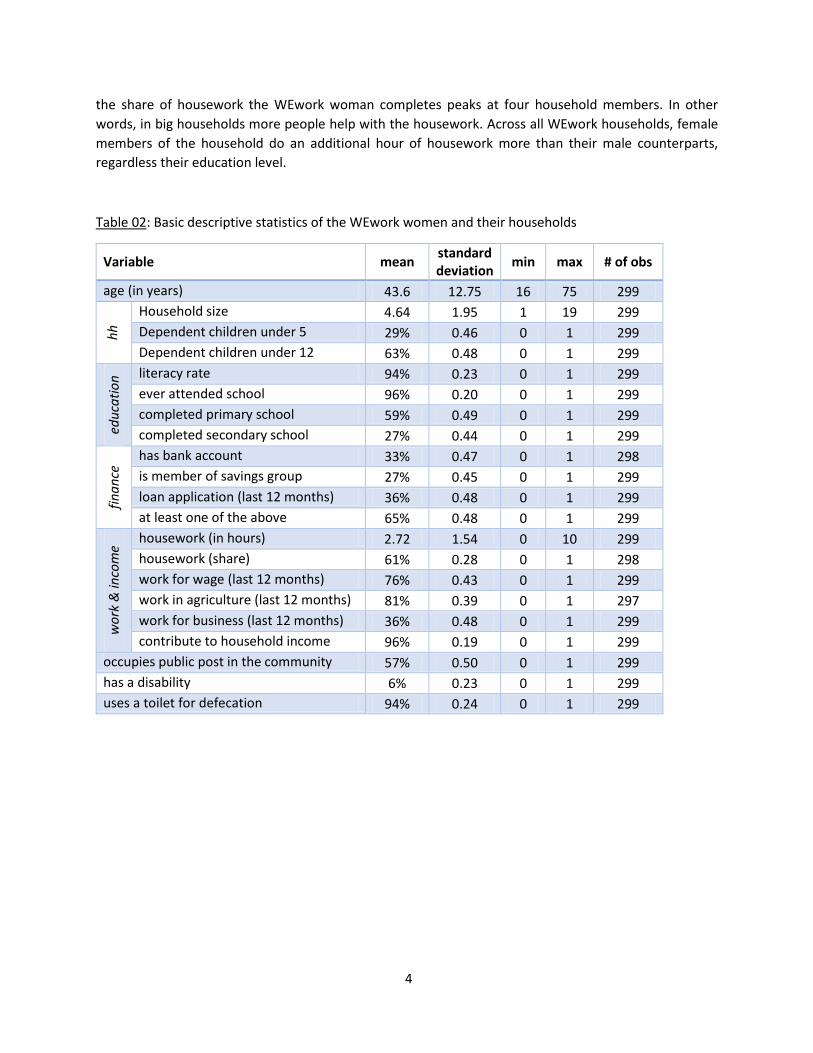
Housework. On average, each of the WEwork women
did 2.7 hours of housework on the day previous to the
interview. This number is equivalent to 61% of all
housework in the household. The total amount of
housework in a household increases with its size, but
Graph 03: % of women accessing financial instruments, by type of financial
instrument and age
0%
10%
20%
30%
40%
50%
under 25 years(n = 26)
25 to 39 years(n = 87)
40 to 54 years(n = 114)
55 years andover
(n = 72)
total(n = 299)
% o
f w
om
en a
cces
sin
g th
e fi
nan
cial
inst
rum
ent
bank account savings group loan application
Graph 04: Hours of daily housework, by household size
0
1
2
3
4
5
6
7
8
9
1(n=7)
2(n=26)
3(n=42)
4(n=70)
5(n=77)
6(n=44)
7+(n=33)
ho
urs
of
dai
ly h
ou
sew
ork
household size
total housework
housework done by Wework woman
4
the share of housework the WEwork woman completes peaks at four household members. In other
words, in big households more people help with the housework. Across all WEwork households, female
members of the household do an additional hour of housework more than their male counterparts,
regardless their education level.
Table 02: Basic descriptive statistics of the WEwork women and their households
Variable mean standard deviation
min max # of obs
age (in years) 43.6 12.75 16 75 299
hh
Household size 4.64 1.95 1 19 299
Dependent children under 5 29% 0.46 0 1 299
Dependent children under 12 63% 0.48 0 1 299
edu
cati
on
literacy rate 94% 0.23 0 1 299
ever attended school 96% 0.20 0 1 299
completed primary school 59% 0.49 0 1 299
completed secondary school 27% 0.44 0 1 299
fin
an
ce has bank account 33% 0.47 0 1 298
is member of savings group 27% 0.45 0 1 299
loan application (last 12 months) 36% 0.48 0 1 299
at least one of the above 65% 0.48 0 1 299
wo
rk &
inco
me
housework (in hours) 2.72 1.54 0 10 299
housework (share) 61% 0.28 0 1 298
work for wage (last 12 months) 76% 0.43 0 1 299
work in agriculture (last 12 months) 81% 0.39 0 1 297
work for business (last 12 months) 36% 0.48 0 1 299
contribute to household income 96% 0.19 0 1 299
occupies public post in the community 57% 0.50 0 1 299
has a disability 6% 0.23 0 1 299
uses a toilet for defecation 94% 0.24 0 1 299
5
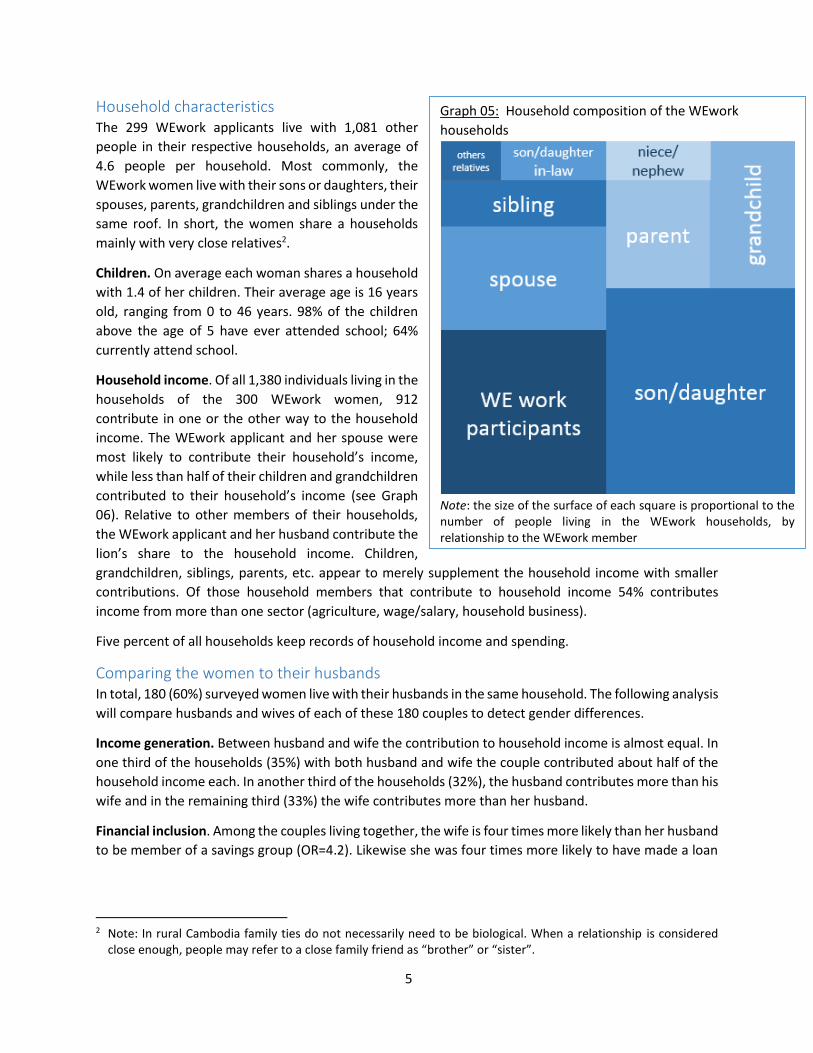
Household characteristics The 299 WEwork applicants live with 1,081 other
people in their respective households, an average of
4.6 people per household. Most commonly, the
WEwork women live with their sons or daughters, their
spouses, parents, grandchildren and siblings under the
same roof. In short, the women share a households
mainly with very close relatives2.
Children. On average each woman shares a household
with 1.4 of her children. Their average age is 16 years
old, ranging from 0 to 46 years. 98% of the children
above the age of 5 have ever attended school; 64%
currently attend school.
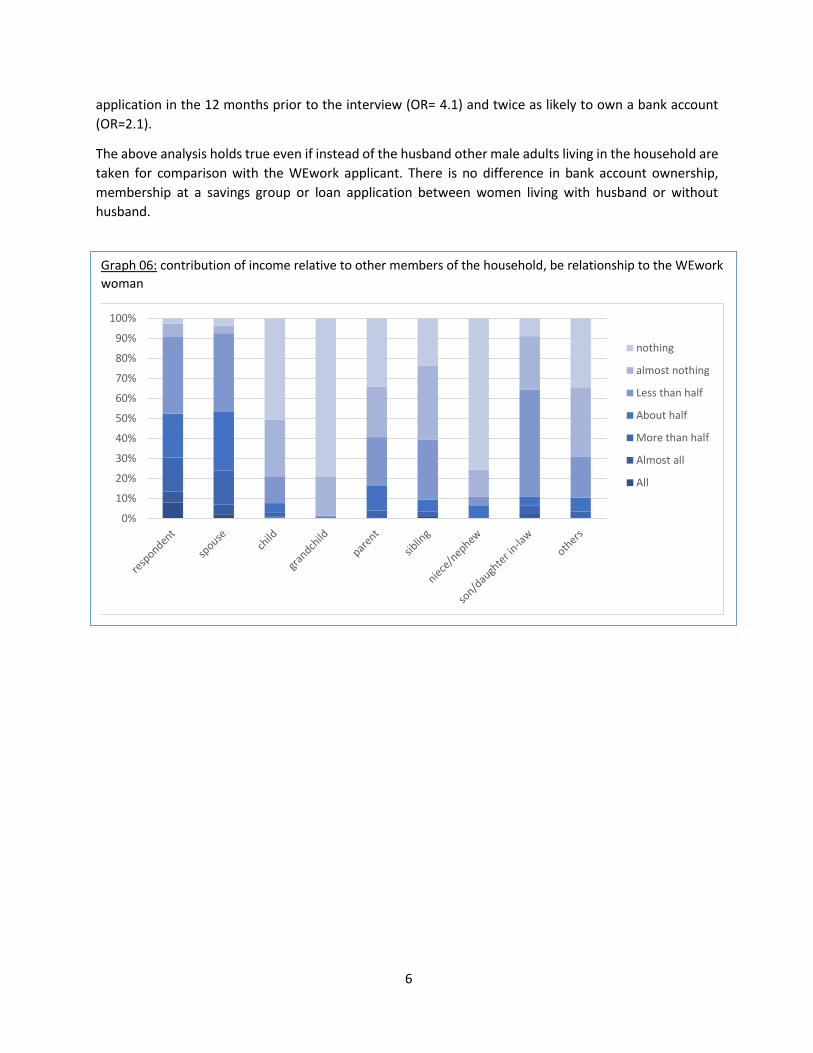
Household income. Of all 1,380 individuals living in the
households of the 300 WEwork women, 912
contribute in one or the other way to the household
income. The WEwork applicant and her spouse were
most likely to contribute their household’s income,
while less than half of their children and grandchildren
contributed to their household’s income (see Graph
06). Relative to other members of their households,
the WEwork applicant and her husband contribute the
lion’s share to the household income. Children,
grandchildren, siblings, parents, etc. appear to merely supplement the household income with smaller
contributions. Of those household members that contribute to household income 54% contributes
income from more than one sector (agriculture, wage/salary, household business).
Five percent of all households keep records of household income and spending.
Comparing the women to their husbands In total, 180 (60%) surveyed women live with their husbands in the same household. The following analysis
will compare husbands and wives of each of these 180 couples to detect gender differences.
Income generation. Between husband and wife the contribution to household income is almost equal. In
one third of the households (35%) with both husband and wife the couple contributed about half of the
household income each. In another third of the households (32%), the husband contributes more than his
wife and in the remaining third (33%) the wife contributes more than her husband.
Financial inclusion. Among the couples living together, the wife is four times more likely than her husband
to be member of a savings group (OR=4.2). Likewise she was four times more likely to have made a loan
2 Note: In rural Cambodia family ties do not necessarily need to be biological. When a relationship is considered
close enough, people may refer to a close family friend as “brother” or “sister”.
Graph 05: Household composition of the WEwork
households
Note: the size of the surface of each square is proportional to the number of people living in the WEwork households, by relationship to the WEwork member
6
application in the 12 months prior to the interview (OR= 4.1) and twice as likely to own a bank account
(OR=2.1).
The above analysis holds true even if instead of the husband other male adults living in the household are
taken for comparison with the WEwork applicant. There is no difference in bank account ownership,
membership at a savings group or loan application between women living with husband or without
husband.
Graph 06: contribution of income relative to other members of the household, be relationship to the WEwork
woman
0%
10%
20%
30%
40%
50%
60%
70%
80%
90%
100%
nothing
almost nothing
Less than half
About half
More than half
Almost all
All
7
Decision-making in the household The survey asked about 15 specified decisions that the household had to make in the last 12 months, and
whether the WEwork woman was involved in the decision-making process (a lot, a little, not at all), who
took the final decision and whether this decision was aligned with her preferences. In total, the 300
households included in the data collection made 2,064 of these decisions in the past 12 months which is
equivalent to 6.9 decisions per household. Table 03 summarizes the data about household decision-
making.
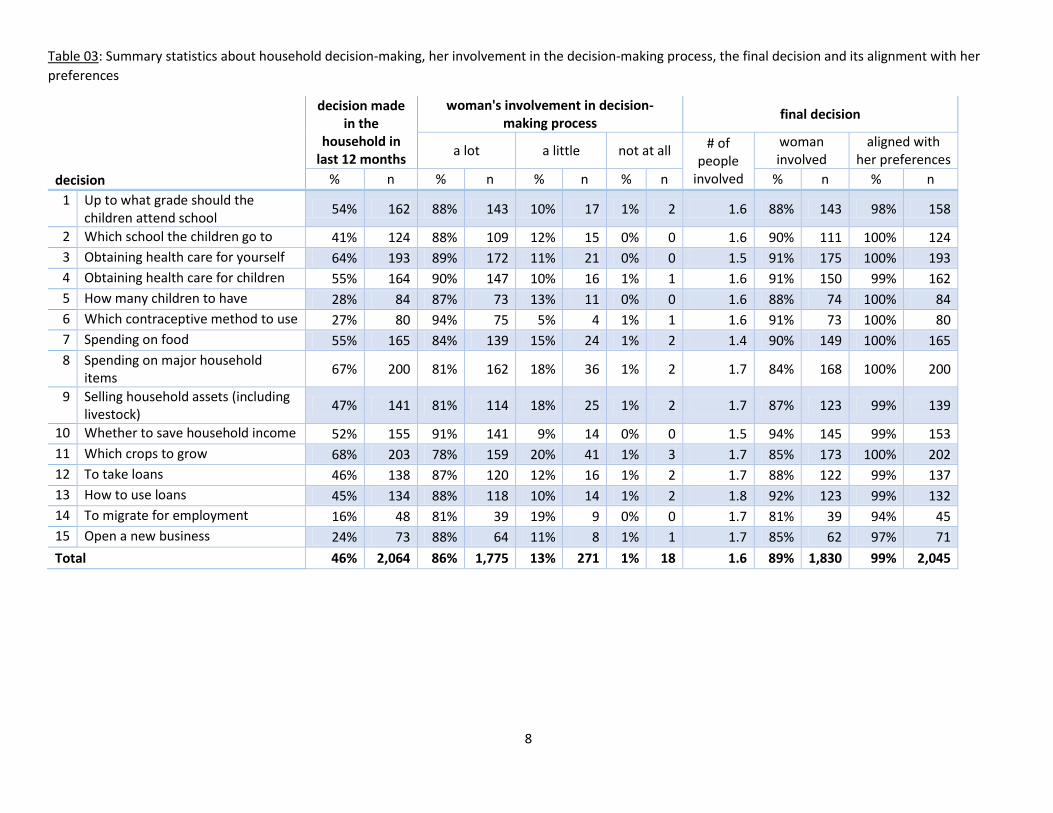
Women are involved. Women were involved in 86% of the decision-making processes and in 89% of the
decisions she participated in making the final decision. The women were most involved in decisions about
obtaining healthcare for the children (90%), which contraception method to use (94%) and whether the
household should save its income (91%). They were least involved in decisions about which crops to grow
(78%), whether to migrate for work, spending on major household assets and selling household assets
(81% each).
Decisions align with women’s preferences. The women expressed that 99% of the decisions made were
aligned with their preferences. Only decisions about migration for employment (94%) and opening a new
business (97%) aligned slightly less with her preferences.
Final decisions involve others. Decisions appear to be made in a quite collaborative manner. Across all
provinces and all decisions probed in this survey, 1.6 people were involved in making the final decision.
44% of the decisions involved only one person in the final decision. The WEwork applicant made 36% of
the final decisions by herself. She most often decided on her own about spending on food (52%), obtaining
health care for herself (47%) and whether to save household income (46%). She is least likely to make
decisions related to income generation (to migrate for employment, 23%; which crops to grow, 27%; open
a business, 27%) by herself.
8
Table 03: Summary statistics about household decision-making, her involvement in the decision-making process, the final decision and its alignment with her
preferences
decision
decision made in the
household in last 12 months
woman's involvement in decision-making process
final decision
a lot a little not at all # of
people involved
woman involved
aligned with her preferences
% n % n % n % n % n % n
1 Up to what grade should the children attend school
54% 162 88% 143 10% 17 1% 2 1.6 88% 143 98% 158
2 Which school the children go to 41% 124 88% 109 12% 15 0% 0 1.6 90% 111 100% 124
3 Obtaining health care for yourself 64% 193 89% 172 11% 21 0% 0 1.5 91% 175 100% 193
4 Obtaining health care for children 55% 164 90% 147 10% 16 1% 1 1.6 91% 150 99% 162
5 How many children to have 28% 84 87% 73 13% 11 0% 0 1.6 88% 74 100% 84
6 Which contraceptive method to use 27% 80 94% 75 5% 4 1% 1 1.6 91% 73 100% 80
7 Spending on food 55% 165 84% 139 15% 24 1% 2 1.4 90% 149 100% 165
8 Spending on major household items
67% 200 81% 162 18% 36 1% 2 1.7 84% 168 100% 200
9 Selling household assets (including livestock)
47% 141 81% 114 18% 25 1% 2 1.7 87% 123 99% 139
10 Whether to save household income 52% 155 91% 141 9% 14 0% 0 1.5 94% 145 99% 153
11 Which crops to grow 68% 203 78% 159 20% 41 1% 3 1.7 85% 173 100% 202
12 To take loans 46% 138 87% 120 12% 16 1% 2 1.7 88% 122 99% 137
13 How to use loans 45% 134 88% 118 10% 14 1% 2 1.8 92% 123 99% 132
14 To migrate for employment 16% 48 81% 39 19% 9 0% 0 1.7 81% 39 94% 45
15 Open a new business 24% 73 88% 64 11% 8 1% 1 1.7 85% 62 97% 71
Total 46% 2,064 86% 1,775 13% 271 1% 18 1.6 89% 1,830 99% 2,045
9
Household wealth and well-being The next two sections will take a closer look at household wealth, housing conditions, household assets
and the household’s water, sanitation and hygiene (WASH) situation.
Housing conditions Most WEwork applicants live in acceptable housing conditions.
97% have a roof over their head made of clay or concrete tiles or
iron sheets; 94% of the households set their foot on concrete,
wooden or tiled floor. Only 4% live in houses with a mud floor. The
outer walls of the dwelling are mainly made of wood (70%) or stone
(6%). Other wall materials include iron sheets (13%) and thatch
(4%).
Household assets and wealth The questionnaire includes questions of ownership and functionality of a series of 25 household items,
ranging from charcoal stove to motorbike and toilet. A principal component analysis was used to
summarize the household assets and create an index of wealth. According to this analysis, strong
indicators for household wealth is ownership of the following items: gas stove, fan, motorbike, mattress,
water pump, television, mobile phone, connection to an electricity grid, and no solar panels3. Participants
in Takeo and Tboung Khmum score particularly high on this index meaning that households in this area
are relatively more wealthy compared to other participants; applicants from Kampong Cham and Pursat
particularly low. Separate and divorced women are less wealthy than women of any other marital status.
During the interview respondents were asked to compare their household’s wealth with that of others4.
The index of household wealth described above correlates very closely with the perceived household
wealth. This might also indicate that whether a household is considered doing well or not is largely defined
through its household assets in the eyes of local rural population.
WASH situation of the households Sanitation. Of all people living in the WEwork households, 92% use a latrine for defecation regularly; 8%
of the household members defecate outside and 1% use a diaper. Out of the 300 households surveyed
267 (89%) households own a functioning pour-flush toilet. Three additional households own a dry-pit
latrine, but all three were not functional the day of the interview.
3 A possible explanation for this is that the connection to a public or private electricity grid is the stronger indicator
for wealth compared. Ownership of solar panels correlated negatively with being connected to an electricity grid (p < 0.001). Only 6% of the households with connection to an electricity grid own solar panels, while 40% of the households without connection to an electricity grid own solar panels. Thus, solar panels appear to be a make-shift solution until the household is connected to an electricity grid.
4 Exact question: Compared to other households, this household is … much worse off/ … a little worse off/ … about average/ … a little better off/ … much better off.
10
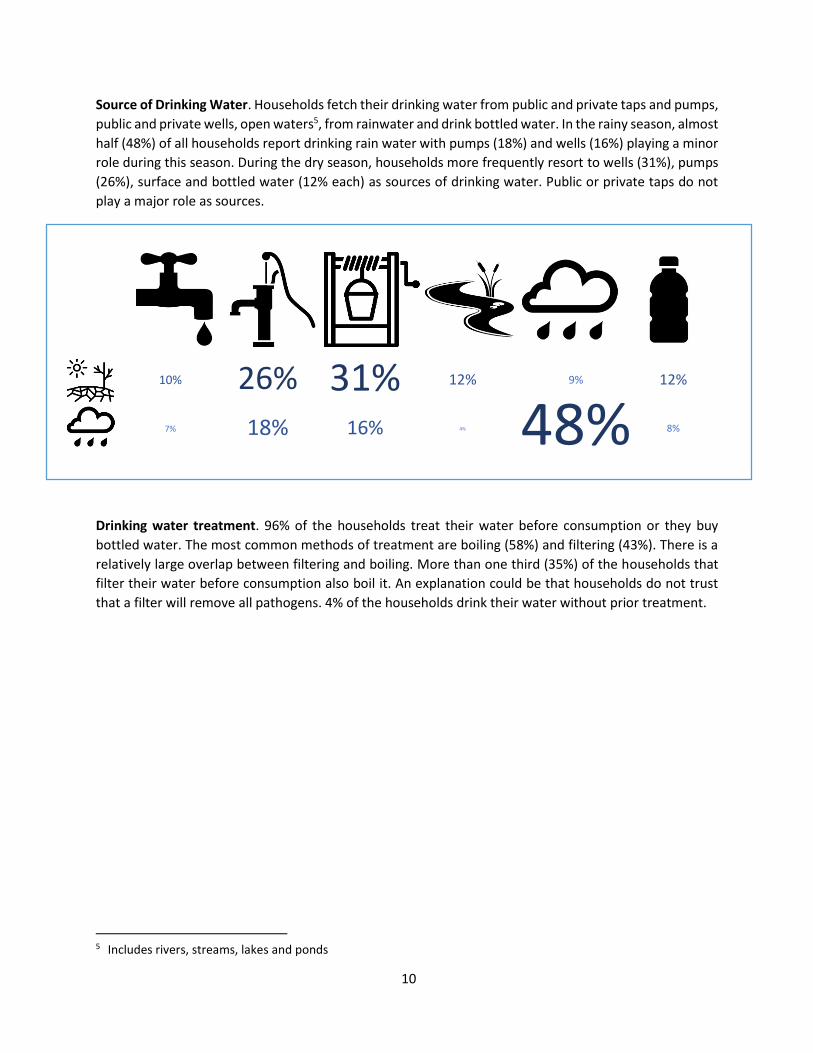
Source of Drinking Water. Households fetch their drinking water from public and private taps and pumps,
public and private wells, open waters5, from rainwater and drink bottled water. In the rainy season, almost
half (48%) of all households report drinking rain water with pumps (18%) and wells (16%) playing a minor
role during this season. During the dry season, households more frequently resort to wells (31%), pumps
(26%), surface and bottled water (12% each) as sources of drinking water. Public or private taps do not
play a major role as sources.
10% 26% 31% 12% 9% 12%
7% 18% 16% 4% 48% 8%
Drinking water treatment. 96% of the households treat their water before consumption or they buy
bottled water. The most common methods of treatment are boiling (58%) and filtering (43%). There is a
relatively large overlap between filtering and boiling. More than one third (35%) of the households that
filter their water before consumption also boil it. An explanation could be that households do not trust
that a filter will remove all pathogens. 4% of the households drink their water without prior treatment.
5 Includes rivers, streams, lakes and ponds
11
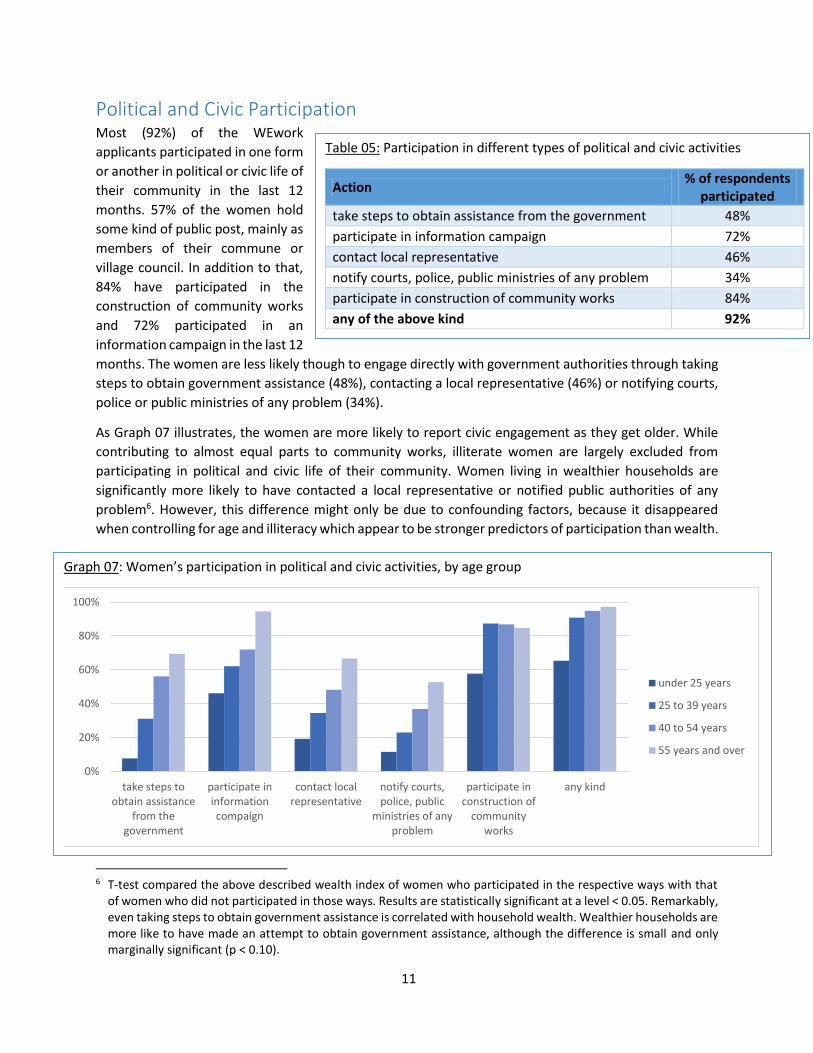
Political and Civic Participation Most (92%) of the WEwork
applicants participated in one form
or another in political or civic life of
their community in the last 12
months. 57% of the women hold
some kind of public post, mainly as
members of their commune or
village council. In addition to that,
84% have participated in the
construction of community works
and 72% participated in an
information campaign in the last 12
months. The women are less likely though to engage directly with government authorities through taking
steps to obtain government assistance (48%), contacting a local representative (46%) or notifying courts,
police or public ministries of any problem (34%).
As Graph 07 illustrates, the women are more likely to report civic engagement as they get older. While
contributing to almost equal parts to community works, illiterate women are largely excluded from
participating in political and civic life of their community. Women living in wealthier households are
significantly more likely to have contacted a local representative or notified public authorities of any
problem6. However, this difference might only be due to confounding factors, because it disappeared
when controlling for age and illiteracy which appear to be stronger predictors of participation than wealth.
6 T-test compared the above described wealth index of women who participated in the respective ways with that
of women who did not participated in those ways. Results are statistically significant at a level < 0.05. Remarkably, even taking steps to obtain government assistance is correlated with household wealth. Wealthier households are more like to have made an attempt to obtain government assistance, although the difference is small and only marginally significant (p < 0.10).
Table 05: Participation in different types of political and civic activities
Action % of respondents
participated
take steps to obtain assistance from the government 48%
participate in information campaign 72%
contact local representative 46%
notify courts, police, public ministries of any problem 34%
participate in construction of community works 84%
any of the above kind 92%
Graph 07: Women’s participation in political and civic activities, by age group
0%
20%
40%
60%
80%
100%
take steps toobtain assistance
from thegovernment
participate ininformationcompaign
contact localrepresentative
notify courts,police, public
ministries of anyproblem
participate inconstruction of
communityworks
any kind
under 25 years
25 to 39 years
40 to 54 years
55 years and over
12
Economic Activities As briefly described above, the WEwork women and their households engage in a diverse range of income
generating activities. The following section will look more closely at salaried employment and household-
owned businesses.
Work for a wage/salary Work for a wage or salary in this section refers to the twelve months prior to the interview. In 40
households none of its members works for a wage or salary. In total, members of the remaining 260
households worked in 677 jobs for a wage or salary.
The survey collected information about all income-earning employment activities of all household
members, including (1) the number of hours worked per month in each employment, (2) remuneration
per time interval, (3) total annual remuneration in kind, and (4) employment characteristics. From this
information, the following variables were calculated which are used as main indicators in the following
analysis:
Yearly wage: Sum of all remunerations from work for a wage/salary in the 12 months prior to the
interview
Total days worked: calculated as equivalent of 8-hour working days (total hours worked in the
previous 12 months divided by 8)
Daily wage equivalent: Yearly wage divided by the total number of days worked over the same
period of time
The WEwork women’s employment. Of the 300 women, 226 (75%) worked in at least one form of
employment. 99 (33%) of the WEwork women worked in more than one job. In comparison to other
members in their household they are more likely to be employed and more likely to have worked in more
than one position.
Time dedicated to work. On average, women worked 3.9 hours per day in one job. Other members of the
household worked on average 7.3 hours per day in a given employment. In other words, women worked
predominantly in part-time jobs, while other members of the household worked full-time. Women
worked an equivalent of 90 full 8-hour workdays in the 12 months prior to the interview. Other members
of her household worked on average 198 full 8-hour working days.
Remuneration. The WEwork women earned on average 832 USD from wage labor in the year prior to the
interview, ranging from 25 to 3,696 USD. Other members of their household earned an average of 1,226
USD in the past 12 months, ranging from 0 to 7,800 USD. For each full 8-hour working day, women earned
on average 18 USD, other members of her household 10 USD. In other words, she works less than other
members of her household, but is more efficient in generating income with her economic activities.
Approximately 45% of all employments include some kind of in kind payments. On average these
payments have a value of 175 USD per year. There is no difference in the likelihood that women receive
in kind remuneration compared to men, but women’s in kind remuneration is much lower than that of
13
their husbands (110 USD and 242 USD per year respectively). The most common kinds of in kind payment
were transportation (46%) and meals (43%)7.
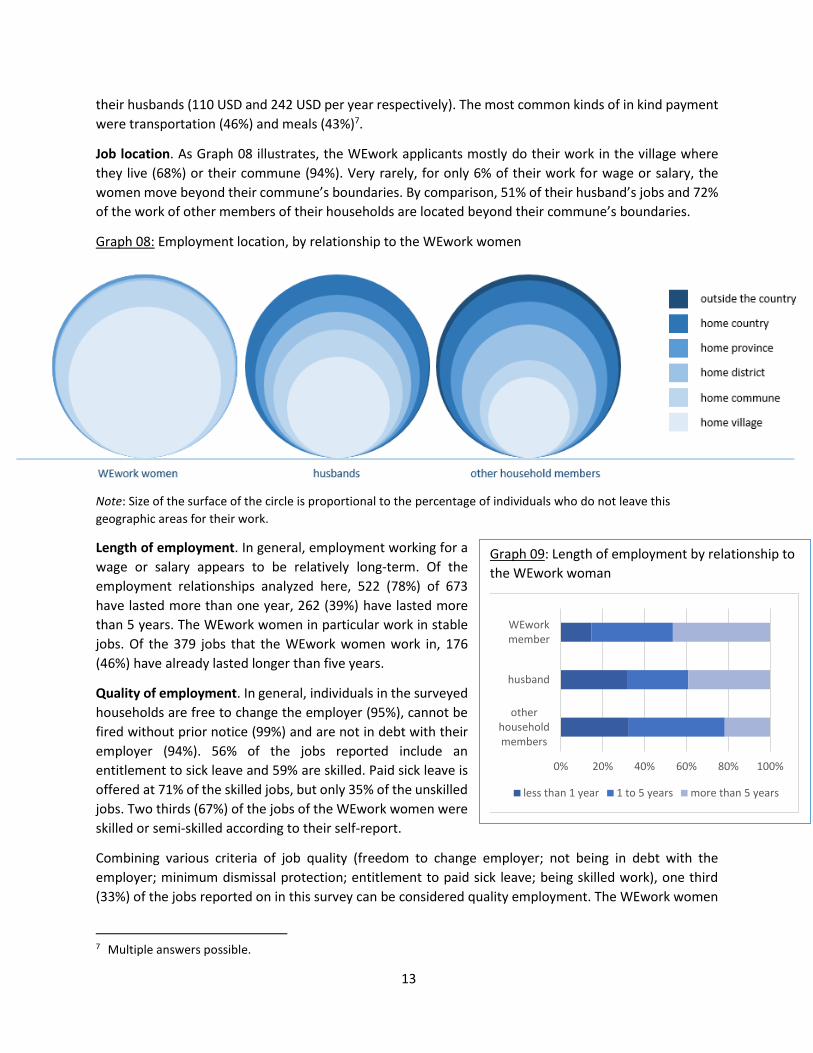
Job location. As Graph 08 illustrates, the WEwork applicants mostly do their work in the village where
they live (68%) or their commune (94%). Very rarely, for only 6% of their work for wage or salary, the
women move beyond their commune’s boundaries. By comparison, 51% of their husband’s jobs and 72%
of the work of other members of their households are located beyond their commune’s boundaries.
Graph 08: Employment location, by relationship to the WEwork women
Note: Size of the surface of the circle is proportional to the percentage of individuals who do not leave this
geographic areas for their work.
Length of employment. In general, employment working for a
wage or salary appears to be relatively long-term. Of the
employment relationships analyzed here, 522 (78%) of 673
have lasted more than one year, 262 (39%) have lasted more
than 5 years. The WEwork women in particular work in stable
jobs. Of the 379 jobs that the WEwork women work in, 176
(46%) have already lasted longer than five years.
Quality of employment. In general, individuals in the surveyed
households are free to change the employer (95%), cannot be
fired without prior notice (99%) and are not in debt with their
employer (94%). 56% of the jobs reported include an
entitlement to sick leave and 59% are skilled. Paid sick leave is
offered at 71% of the skilled jobs, but only 35% of the unskilled
jobs. Two thirds (67%) of the jobs of the WEwork women were
skilled or semi-skilled according to their self-report.
Combining various criteria of job quality (freedom to change employer; not being in debt with the
employer; minimum dismissal protection; entitlement to paid sick leave; being skilled work), one third
(33%) of the jobs reported on in this survey can be considered quality employment. The WEwork women
7 Multiple answers possible.
Graph 09: Length of employment by relationship to
the WEwork woman
0% 20% 40% 60% 80% 100%
otherhouseholdmembers
husband
WEworkmember
less than 1 year 1 to 5 years more than 5 years
14
disproportionately work in quality employment compared to other members in their households: 42% of
their work for wage or salary fulfills all the criteria mentioned above.
However, the quality of employment is related to a higher daily income only for the women’s husbands
or other members of the household, not for the women themselves. The same applies to the length of
employment. For the women’s husbands, daily wages increase with the length of employment, but not
the WEwork women. The single best predictor of a higher daily wage/salary is paid sick leave.
Employment and other socio-demographic factors. About a third of the daily wage and days worked
depends on unobserved household characteristics. In other words, the household someone lives in plays
a significant role in determining how much this person earns per day worked and how many days per year
s/he works. The survey suggest that part of these household characteristics are household size and the
presence of children under five.
The employment data was overlaid with a number of other socio-demographic factors, including gender,
education, literacy, household size, presence of young children in the households, marital status, financial
inclusion, etc. Large and significant correlations are described below.
Housework and Employment. Housework is a large confounding factor for the time she spends at work,
explaining about 9% of the variance in time dedicated to employment across individuals and 16% of the
variance among individuals within the same household. Every additional hour of daily housework is
associated with 30 days less remunerated work per year, controlling for differences between households8.
The association between gender and time worked seemed to be entirely mitigated by the time dedicated
to housework. However, the association between housework and time spent at work is slightly
counterbalanced by a good education (complete secondary school or higher).
Daily income is negatively correlated with the total days worked, but positively associated with the hours
spent on housework9. Further analysis shows clearly an economically inefficient allocation in household
resources regarding earning income from work for a wage or salary. In short, while women have a higher
income potential (higher daily wage/salary)10, they work fewer days and do more unpaid housework.
Income and financial inclusion. The strongest predictor of a high daily wage/salary appears to be financial
inclusion. People who own a bank account, are members of a savings group or have made a loan
application in the last 12 months report a daily wage/salary doubling that of financially excluded people
8 Fixed-effects linear regression model: β = -30.53, p < 0.0001, n = 500 9 r = -0.31 (p < 0.001) and r = 0.12 (p = 0.008) respectively 10 The survey does not allow causal attribution regarding why women appear to earn a higher daily rate for their
remunerated work than men. However, there are a few clues from this survey and additional qualitative interviews that allow the development of a few hypotheses. First, many women do part-time work and get paid, for example, for attending village and commune meetings or to hold village workshops by NGOs or government. Per hour these activities earn them more income than a full-time position, but by their nature these jobs cannot be full-time positions. Second, women might only chose remunerated work which allows them to earn income relatively efficiently, as choosing a job is a trade-off between earning income and housework and care duties. Third, her family’s support for her economic activities might be higher if her income generation is more efficient, thus a lack of family support might prevent her from doing work for a lower daily remuneration. Fourth, because of her restricted mobility for work, she might not have access to a wide range of jobs in a competitive labor market, but rather concentrates her remunerated work on selling non-interchangeable knowledge and influence over people in her village.
15
(19 USD and 9 USD respectively, p < 0.0001). Especially loan applications and bank account ownership
drive this correlation. While financial inclusion and efficient working seem to go hand in hand, the
direction of this relationship is unclear.
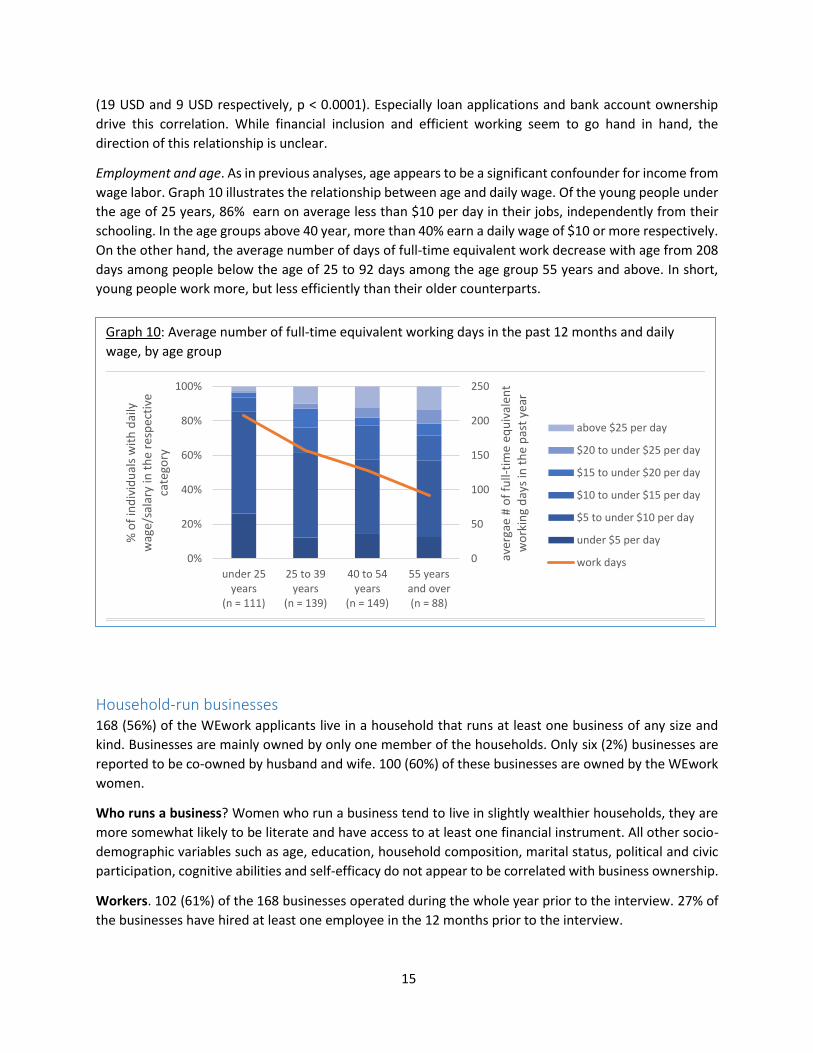
Employment and age. As in previous analyses, age appears to be a significant confounder for income from
wage labor. Graph 10 illustrates the relationship between age and daily wage. Of the young people under
the age of 25 years, 86% earn on average less than $10 per day in their jobs, independently from their
schooling. In the age groups above 40 year, more than 40% earn a daily wage of $10 or more respectively.
On the other hand, the average number of days of full-time equivalent work decrease with age from 208
days among people below the age of 25 to 92 days among the age group 55 years and above. In short,
young people work more, but less efficiently than their older counterparts.
Household-run businesses 168 (56%) of the WEwork applicants live in a household that runs at least one business of any size and
kind. Businesses are mainly owned by only one member of the households. Only six (2%) businesses are
reported to be co-owned by husband and wife. 100 (60%) of these businesses are owned by the WEwork
women.
Who runs a business? Women who run a business tend to live in slightly wealthier households, they are
more somewhat likely to be literate and have access to at least one financial instrument. All other socio-
demographic variables such as age, education, household composition, marital status, political and civic
participation, cognitive abilities and self-efficacy do not appear to be correlated with business ownership.
Workers. 102 (61%) of the 168 businesses operated during the whole year prior to the interview. 27% of
the businesses have hired at least one employee in the 12 months prior to the interview.
Graph 10: Average number of full-time equivalent working days in the past 12 months and daily
wage, by age group
0
50
100
150
200
250
0%
20%
40%
60%
80%
100%
under 25years
(n = 111)
25 to 39years
(n = 139)
40 to 54years
(n = 149)
55 yearsand over(n = 88)
aver
gae
# o
f fu
ll-ti
me
equ
ival
ent
wo
rkin
g d
ays
in t
he
pas
t ye
ar
% o
f in
div
idu
als
wit
h d
aily
w
age/
sala
ry in
th
e re
spec
tive
ca
tego
ry
above $25 per day
$20 to under $25 per day
$15 to under $20 per day
$10 to under $15 per day
$5 to under $10 per day
under $5 per day
work days
0
50
100
150
200
250
0%10%20%30%40%50%60%70%80%90%
100%
under 25years
(n = 111)
25 to 39years
(n = 139)
40 to 54years
(n = 149)
55 yearsand over(n = 88)
aver
gae
# o
f fu
ll-ti
me
equ
ival
ent
wo
rkin
g d
ays
in t
he
pas
t ye
ar
% o
f in
div
idu
als
wit
h d
aily
w
age/
sala
ry in
th
e re
spec
tive
ca
tego
ry
Chart Title
above $25 per day
$20 to under $25 per day
$15 to under $20 per day
$10 to under $15 per day
$5 to under $10 per day
under $5 per day
work days
16
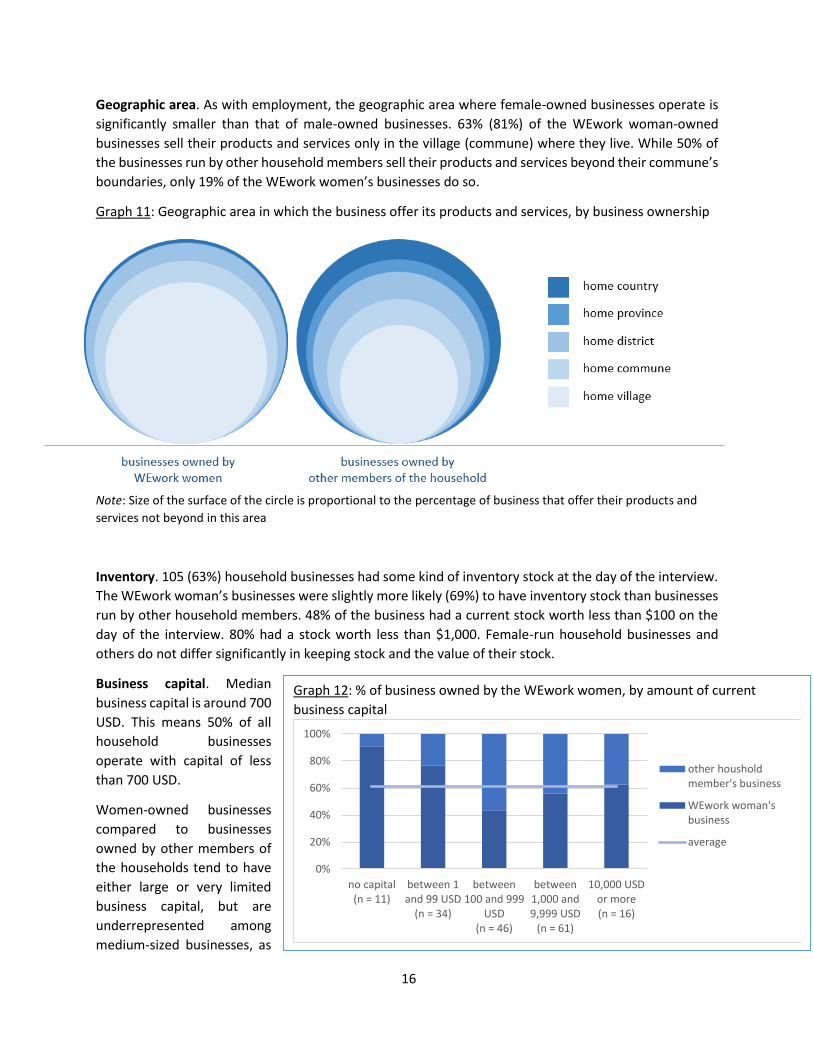
Geographic area. As with employment, the geographic area where female-owned businesses operate is
significantly smaller than that of male-owned businesses. 63% (81%) of the WEwork woman-owned
businesses sell their products and services only in the village (commune) where they live. While 50% of
the businesses run by other household members sell their products and services beyond their commune’s
boundaries, only 19% of the WEwork women’s businesses do so.
Graph 11: Geographic area in which the business offer its products and services, by business ownership
Note: Size of the surface of the circle is proportional to the percentage of business that offer their products and
services not beyond in this area
Inventory. 105 (63%) household businesses had some kind of inventory stock at the day of the interview.
The WEwork woman’s businesses were slightly more likely (69%) to have inventory stock than businesses
run by other household members. 48% of the business had a current stock worth less than $100 on the
day of the interview. 80% had a stock worth less than $1,000. Female-run household businesses and
others do not differ significantly in keeping stock and the value of their stock.
Business capital. Median
business capital is around 700
USD. This means 50% of all
household businesses
operate with capital of less
than 700 USD.
Women-owned businesses
compared to businesses
owned by other members of
the households tend to have
either large or very limited
business capital, but are
underrepresented among
medium-sized businesses, as
Graph 12: % of business owned by the WEwork women, by amount of current
business capital
0%
20%
40%
60%
80%
100%
no capital(n = 11)
between 1and 99 USD
(n = 34)
between100 and 999
USD(n = 46)
between1,000 and9,999 USD
(n = 61)
10,000 USDor more(n = 16)
other housholdmember's business
WEwork woman'sbusiness
average

17
Graph 12 illustrates. Eleven household businesses operate entirely without business capital, 10 of which
are owned by the WEwork women.
As with business ownership, no socio-demographic factor seems to be significantly related to the size of
the business, measured as the size of the business capital.
Bookkeeping. Ten percent of the household businesses have a bookkeeping system. For roughly 43% of
the business the WEwork women knew with certainty how much profit the business made in the month
previous to the interview. For another 25% of the businesses the women were not even able to guess the
business profits.
Decision-making. In total, this survey collected data on 221 decisions households made related to their
household businesses in the past 12 months, including 136 decisions about businesses owned by the
WEwork women. Compared to her high involvement in household-related decision-making, she is less
involved in decision-making about businesses, even it is concerns her own business. In only 55% of the
decisions relating to her own business she was involved a lot. As comparison, she was involved a lot in
86% of household decision-making. In decision-making about household businesses that are not her own,
she is even less involved.
Self-efficacy and Cognitive Abilities
Self-efficacy Self-efficacy of the WEwork women was measured using the Generalize Self-Efficacy Scale (GSE)11. To
generate the scale, the respondents are asked a series of 10 questions about their perceived self-efficacy.
High scores on the GSE means high self-efficacy and are found to correlate with emotions such as
optimism and work satisfaction, low scores correlate with depression, stress, health complaints and
anxiety. Scores range from 10 to 40 on the GSE. The mean score from various international survey was
found to be 29.
The WEwork women reported an average score of 33 on the GSE. Only one respondent was unable to
complete all of the questions. Among the WEwork women, high scores on the GSE correlate with
household wealth12 and the woman’s individual income from wage labor13, a good level of education14
and older age15.
Cognitive Abilities The cognitive ability of the WEwork applicants was tested using three short cognitive tasks. First,
respondents were asked “You are participating in a race. You overtake the person in second place. What
11 Further information about the GSE are described elsewhere: http://userpage.fu-berlin.de/~health/faq_gse.pdf 12 r = 0.11, p = 0.051 13 R = 0.17, p = 0.013, n = 226 14 T-test comparing women without complete secondary education with those that completed secondary education,
p = 0.025, n = 298 15 r = 0.27, p < 0.0001, n = 298
18
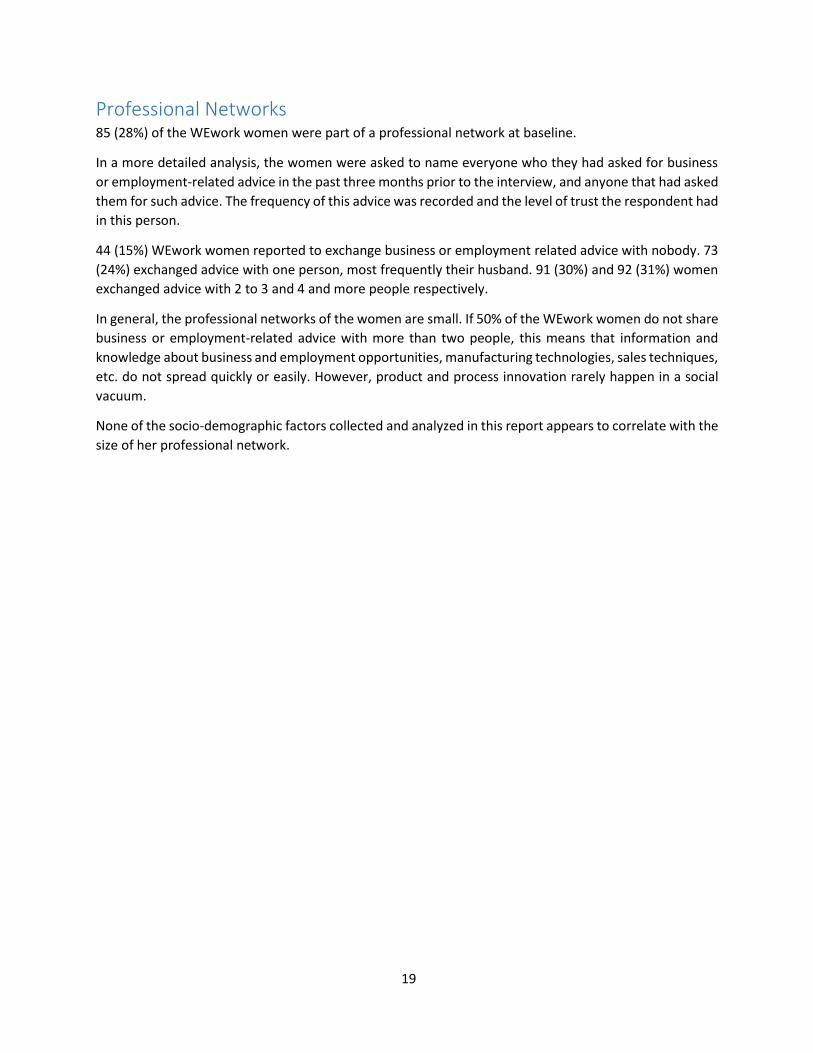
position are you in?” 27% of the women were able to solve this
question correctly. Second, respondents were given a card with a
series of nine arrows pointing in different directions. The
respondents were asked to read out loud the direction in which the
arrow points from left to right, and then from right to left. They were timed by the enumerator while
completing this task. If the respondent made a mistake, she had to start again from the beginning. Six
women were unable to complete this task.
Reading from left to right required the women an average of 12.0 seconds; reading from right to left an
average of 10.8 seconds.
After completing these tasks, the women were asked to self-evaluate who well they performed in these
tasks compared to other women who applied for the program. 19 (6%) women though they did worse
than the average, 228 (76%) estimated they performed about average and 52 (18%) thought they did
better than the average.
Objective vs. subjective performance. Respondents are grouped into three groups according to their
performance in the cognitive tests. The “high performance” group includes all individuals who answered
the first question right and scored among the top quartile in both arrow reading tasks. The “low
performance” group includes all individuals how answered the first question wrong and scored among
the bottom quartile in both arrow reading tasks. The “average performance” group consists of all who
scored in the middle 50% of the arrow reading task, but answered the race questions wrong. 182 of the
300 women fall into one of these categories.
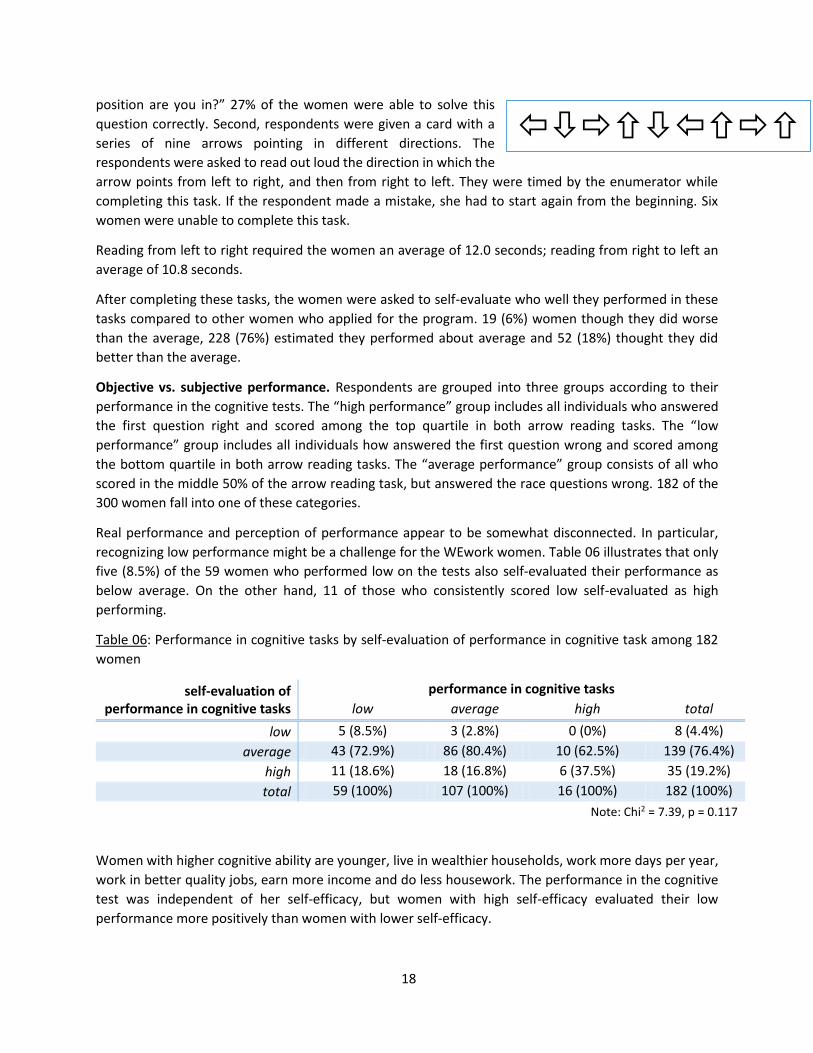
Real performance and perception of performance appear to be somewhat disconnected. In particular,
recognizing low performance might be a challenge for the WEwork women. Table 06 illustrates that only
five (8.5%) of the 59 women who performed low on the tests also self-evaluated their performance as
below average. On the other hand, 11 of those who consistently scored low self-evaluated as high
performing.
Table 06: Performance in cognitive tasks by self-evaluation of performance in cognitive task among 182
women
self-evaluation of performance in cognitive tasks
performance in cognitive tasks
low average high total
low 5 (8.5%) 3 (2.8%) 0 (0%) 8 (4.4%)
average 43 (72.9%) 86 (80.4%) 10 (62.5%) 139 (76.4%)
high 11 (18.6%) 18 (16.8%) 6 (37.5%) 35 (19.2%)
total 59 (100%) 107 (100%) 16 (100%) 182 (100%)
Note: Chi2 = 7.39, p = 0.117
Women with higher cognitive ability are younger, live in wealthier households, work more days per year,
work in better quality jobs, earn more income and do less housework. The performance in the cognitive
test was independent of her self-efficacy, but women with high self-efficacy evaluated their low
performance more positively than women with lower self-efficacy.
19
Professional Networks 85 (28%) of the WEwork women were part of a professional network at baseline.
In a more detailed analysis, the women were asked to name everyone who they had asked for business
or employment-related advice in the past three months prior to the interview, and anyone that had asked
them for such advice. The frequency of this advice was recorded and the level of trust the respondent had
in this person.
44 (15%) WEwork women reported to exchange business or employment related advice with nobody. 73
(24%) exchanged advice with one person, most frequently their husband. 91 (30%) and 92 (31%) women
exchanged advice with 2 to 3 and 4 and more people respectively.
In general, the professional networks of the women are small. If 50% of the WEwork women do not share
business or employment-related advice with more than two people, this means that information and
knowledge about business and employment opportunities, manufacturing technologies, sales techniques,
etc. do not spread quickly or easily. However, product and process innovation rarely happen in a social
vacuum.
None of the socio-demographic factors collected and analyzed in this report appears to correlate with the
size of her professional network.
20
Conclusions and Recommendations Most WEwork women live in relatively safe living and housing conditions, generate a reasonable income
from a diverse range of activities and are engaged in their community and household. There are several
important conclusions from this baseline data analysis which influence further project development and
research.
Diverse range of participants. The WEwork participants’ age spans from 16 to 75. Considering the diverse
range educational backgrounds, life experience and future potential, it will be of particular importance
for the WEwork collective to accommodate this diversity and leverage the strengths of each woman to
contribute to the collective outcome.
Civic engagement is high. Most women participate in the political or civic life of their community in one
way of the other. More than half of the women occupy a public post in their village or commune. In these
positions the women are perfectly placed to influence their peers to make a positive change.
Good household WASH situation. Most households use a latrine and treat their drinking water before
consumption. In rural Cambodia where open defecation rates are still around 50%, this means that the
women lead by example in their community on WASH related matters.
Burden of unpaid house and care work. Women do significantly more unpaid housework and care for
young and elderly people in the household. The amount of housework she does correlates negatively with
the time she spends working for a wage/salary and adds on top of her time commitment in a running
household business. Considering that her income potential might be just as high, if not higher, than that
of other people in her household, the WEwork collective should consider working with key members of
the household to understand income opportunities for women and resource allocation of households
better.
Limited mobility. For both business and employment activities, women tend to be confined mainly to
their village or commune boundaries. Very rarely does their economic activity reach beyond. While being
deeply rooted in the community is positive to prevent a “brain drain” from rural to urban area, the limited
mobility is a strongly limiting factor for the growth and breadth of her economic activities, which needs
to be addressed.
Women earn higher daily income than men. Although the difference is quite pronounced, it is unclear
why women earn more income per day worked. A few hypotheses were formulated, but further research
is needed to explore her income potential, especially considering her very limited mobility.
Household bookkeeping is a rarity. Very few households report having a bookkeeping system to keep
track of household income and expenses. This is a key area the WEwork training gears its efforts towards.
Unpredictable business ownership. There appears to be no socio-economic factors that alone or in
combination can predict women’s business ownership. On the one hand, this means that anyone can be
a business owner, but also it speaks little to nothing about the motivators, barriers and success factors for
women setting up businesses in rural Cambodia. Thus, more in-depth research is needed to explore why
some women set up businesses while others do not.
Weak business-related decision-making power. Compared to household decision-making, women are
less involved in business-related decision-making, including decisions about their own businesses. A

21
central task of the WEwork collective is to help women to be able to actively engage in these decision-
making processes.
Small professional networks. Professional networks among the WEwork women are very small. This
means information and innovation spread slowly. Extending the professional networks of these women is
a central objective of the WEwork collective.