the weekly dig november 6, 2015 - amazon web...
TRANSCRIPT
The Weekly Dig – November 6, 2015 Haywood Mining Team
Member of the Canadian Investor Protection Fund Please see page 41 for Analyst Certification, Important Information
and Legal Disclaimers, page 44 for Risk Profile Definitions, and pages 42 to 51 for Disclosures, Rating Structure, and notes.
Gold Falls below $1,100 Level as Fed Earmarks December Rate Hike
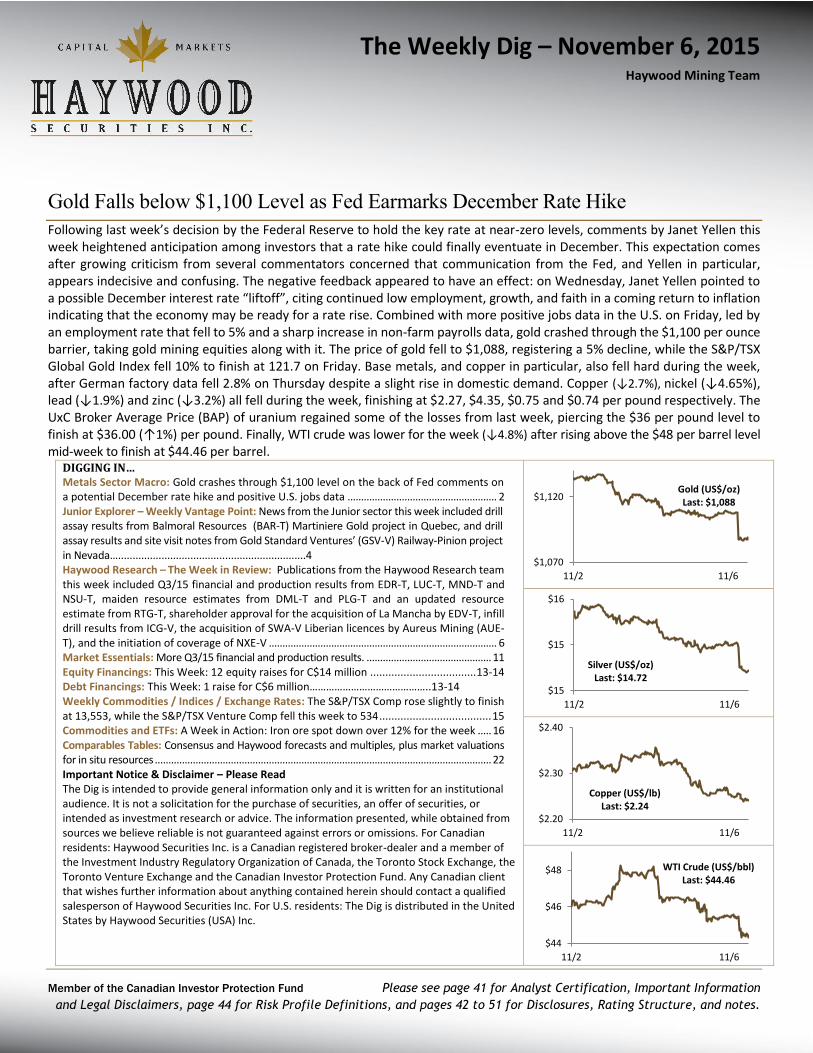
Following last week’s decision by the Federal Reserve to hold the key rate at near-zero levels, comments by Janet Yellen this week heightened anticipation among investors that a rate hike could finally eventuate in December. This expectation comes after growing criticism from several commentators concerned that communication from the Fed, and Yellen in particular, appears indecisive and confusing. The negative feedback appeared to have an effect: on Wednesday, Janet Yellen pointed to a possible December interest rate “liftoff”, citing continued low employment, growth, and faith in a coming return to inflation indicating that the economy may be ready for a rate rise. Combined with more positive jobs data in the U.S. on Friday, led by an employment rate that fell to 5% and a sharp increase in non-farm payrolls data, gold crashed through the $1,100 per ounce barrier, taking gold mining equities along with it. The price of gold fell to $1,088, registering a 5% decline, while the S&P/TSX Global Gold Index fell 10% to finish at 121.7 on Friday. Base metals, and copper in particular, also fell hard during the week, after German factory data fell 2.8% on Thursday despite a slight rise in domestic demand. Copper (↓2.7%), nickel (↓4.65%), lead (↓1.9%) and zinc (↓3.2%) all fell during the week, finishing at $2.27, $4.35, $0.75 and $0.74 per pound respectively. The UxC Broker Average Price (BAP) of uranium regained some of the losses from last week, piercing the $36 per pound level to finish at $36.00 (↑1%) per pound. Finally, WTI crude was lower for the week (↓4.8%) after rising above the $48 per barrel level mid-week to finish at $44.46 per barrel.
DIGGING IN… Metals Sector Macro: Gold crashes through $1,100 level on the back of Fed comments on a potential December rate hike and positive U.S. jobs data ....................................................... 2 Junior Explorer – Weekly Vantage Point: News from the Junior sector this week included drill assay results from Balmoral Resources (BAR-T) Martiniere Gold project in Quebec, and drill assay results and site visit notes from Gold Standard Ventures’ (GSV-V) Railway-Pinion project in Nevada….................................................................4 Haywood Research – The Week in Review: Publications from the Haywood Research team this week included Q3/15 financial and production results from EDR-T, LUC-T, MND-T and NSU-T, maiden resource estimates from DML-T and PLG-T and an updated resource estimate from RTG-T, shareholder approval for the acquisition of La Mancha by EDV-T, infill drill results from ICG-V, the acquisition of SWA-V Liberian licences by Aureus Mining (AUE-T), and the initiation of coverage of NXE-V .................................................................................... 6 Market Essentials: More Q3/15 financial and production results. .............................................. 11 Equity Financings: This Week: 12 equity raises for C$14 million ................................... 13-14 Debt Financings: This Week: 1 raise for C$6 million……………………………………..13-14 Weekly Commodities / Indices / Exchange Rates: The S&P/TSX Comp rose slightly to finish at 13,553, while the S&P/TSX Venture Comp fell this week to 534 ..................................... 15 Commodities and ETFs: A Week in Action: Iron ore spot down over 12% for the week ..... 16 Comparables Tables: Consensus and Haywood forecasts and multiples, plus market valuations for in situ resources ............................................................................................................................ 22 Important Notice & Disclaimer – Please Read The Dig is intended to provide general information only and it is written for an institutional audience. It is not a solicitation for the purchase of securities, an offer of securities, or intended as investment research or advice. The information presented, while obtained from sources we believe reliable is not guaranteed against errors or omissions. For Canadian residents: Haywood Securities Inc. is a Canadian registered broker-dealer and a member of the Investment Industry Regulatory Organization of Canada, the Toronto Stock Exchange, the Toronto Venture Exchange and the Canadian Investor Protection Fund. Any Canadian client that wishes further information about anything contained herein should contact a qualified salesperson of Haywood Securities Inc. For U.S. residents: The Dig is distributed in the United States by Haywood Securities (USA) Inc.
$1,070
$1,120
11/2 11/6
Gold (US$/oz)Last: $1,088
$15
$15
$16
11/2 11/6
Silver (US$/oz)Last: $14.72
$2.20
$2.30
$2.40
11/2 11/6
Copper (US$/lb)Last: $2.24
$44
$46
$48
11/2 11/6
WTI Crude (US$/bbl)Last: $44.46

The Weekly Dig 11/6/15
Haywood Mining [email protected] Page 2
Metals Sector Macro
Macroeconomic News
United States: Following last week’s decision by the Federal Reserve to hold the key rate at near-zero levels, comments by Janet Yellen this week heightened anticipation among investors that a rate hike could finally eventuate in December. This expectation comes after growing criticism from several commentators concerned that communication from the Fed, and Yellen in particular, appears indecisive, and that communication from the Fed is confusing. According to a survey by the CNBC, approximately 60% said the Fed is paying too much attention to extreme market swings in setting appropriate monetary policy, up from 43% last month. The negative feedback appeared to have an effect: on Wednesday, Janet Yellen pointed to a possible December interest rate “liftoff”, with continued low employment, growth, and faith in a coming return to inflation indicating that the economy may be ready for a rate rise. The result was higher bond yields and a collapse in the price of gold, falling 5% during the week to finish at $1,088 per ounce, crashing through the $1,100 barrier. The week started with the release of Purchasing Managers’ Index (PMI) data from the Institute for Supply Management (ISM) and Markit. While readings from both institutions remained above the 50 level, ISM fell slightly to 50.1 from September’s reading of 50.2. By comparison, Markit’s reading was higher for October at 54.1, a 1.0-point gain on September’s figure of 53.1, the discrepancy possibly reflecting the uncertainty surrounding the state of the U.S. economic recovery. The following day, factory orders were shown to be down in September by 1.0%, following the revised 2.7% figure registered for August. Together, the lower PMI and factory data coincide with the continued strength of the U.S. dollar, putting further pressure on the country’s manufacturing sector. Despite the lower manufacturing figures, the U.S. trade balance narrowed more than expected to $40.81 billion in September from $48.02 billion in August as exports edged up 1.6%, and imports fell 1.8%. Mortgage Bankers Association (MBA) mortgage applications declined by a seasonally adjusted 0.8% for the week ending October 30, following the 3.4% drop of the previous week. The average contract interest rate for 30-year fixed-rate mortgages with conforming loan balances inched up to a 1-month high of 4.01% from 3.98% in the previous week. Meanwhile, on the jobs front, initial jobless application for the week ending October 31 increased 16,000 to a seasonally adjusted 276,000, representing the largest weekly increase since February 2015. The 4-week moving average of claims, considered a better measure of labour market trends as it strips out week-to-week volatility, rose 3,500 to 262,750 last week. Jobs data released on Friday was positive, headed by the price of gold falling below the $1,100 per ounce level; change in non-farm payrolls came in at 271,000, the biggest gain for the year, and exceeding all estimates from economists which predicted a 185,000 gain. Concurrently, the employment rate fell to 5%.
Canada: In further signs that the Canadian economy continues to struggle, Canada’s manufacturing sector slumped to a fresh low in October, as heightened economic uncertainty and stubbornly low oil prices led to a sharp deterioration in business conditions. The RBC Canadian Manufacturing Purchasing Managers’ Index, a measure of manufacturing business conditions, fell to a seasonally adjusted 48.0 last month from 48.6 in September. A reading below 50 indicates a slowdown in the rate of growth. On Friday, jobs data exceeded expectations, with the unemployment rate coming in a 7.0% instead of the expected 7.1%, while the net change in employment was up 44,400, well ahead of the 10,000 expected.
China: Factory activity in China decreased at a slower pace in October, with the Caixin China Manufacturing Managers’ Index rising to 48.3 in October from 47.2 in September, indicating that stimulus measures introduced earlier this year may be starting to have a positive effect. The reading suggests the shrinkage in factory activity may be slowing, although it marked the eighth straight month of contraction. Meanwhile, China’s Premier Li Keqiang stated that annual growth should be no less than 6.5% in the next 5 years to realize the goal of doubling 2010 gross domestic product and per-capita income by 2020.
Australia: As expected, the Reserve Bank of Australia left its prime interest rate unchanged at 2%, despite speculation that a rate cut was on the cards after several banks increased lending rates. Speaking at a

The Weekly Dig 11/6/15
Haywood Mining [email protected] Page 3
conference in Melbourne, Reserve Bank governor Glen Stevens defended the RBA’s decision not to compensate consumers for recent mortgage rate hikes, saying the economy doesn’t need the boost.

The Weekly Dig 11/6/15
Haywood Mining [email protected] Page 4
Junior Explorer: Weekly Vantage Point
News from the Junior sector this week included drill assay results from Balmoral Resources’ (BAR-T) Martiniere gold property in Quebec and Gold Standard Ventures’ (GSV-V) Railway-Pinion gold project in Nevada.
Mining Flashes Other News
Balmoral Resources Ltd. (BAR-T) Gold Standard Ventures Corp. (GSV-V)
No other news for the week
Mining Flashes
Balmoral Resources Ltd. (BAR-T, $0.46) – Drilling Highlights Extension Potential of the Bug Lake Gold Trend
Mick Carew, [email protected]
Drilling confirms gold mineralization along Lac du Doigt fault – Balmoral released drill assay results from its summer/fall 2015 exploration program at the Company ’s 100% owned Martiniere property in Quebec. In addition to infill and expansion drilling along the Bug Lake Trend, exploration drilling also confirmed the presence of gold mineralization along the Lac du Doigt fault zone, an east-west-trending structure situated to the north of the Bug Lake Trend. Hole MDX-15-48 was drilled approximately 185 metres to the east of hole MDX-14-46 (3.64 metres grading 3.27 g/t gold) and returned three intervals of associated gold mineralization: an upper quartz-tourmaline vein zone (0.61 metres grading 4.43 g/t gold from 125.97 metres) and two lower porphyry-hosted zones (porphyry 1: 8.05 metres grading 1.08 g/t gold from 237.95 metres, including 1.43 metres grading 5.16 g/t gold; and porphyry 2: 35.25 metres grading 0.32 g/t gold from 265.45 metres). Importantly, the 2.30-kilometre extent of the Lac du Doigt fault zone from hole MDX-15-48 to the northern end of the Bug Lake Gold Trend remains untested, as well as along strike to the west of hole MDX-15-46. Further drilling is required to determine the continuity of gold mineralization along the Lac du Doigt fault zone, and the relationship between this new zone and the Bug Lake Gold Trend to the east.
See Haywood Securities for the full report
Gold Standard Ventures Corp. (GSV-V, $0.56) – Dark Star Yields High-Grade Gold – Confirms Site-Visit Take-Aways
Mick Carew, [email protected]
Dark Star oxide deposit set to expand – Gold Standard Ventures released drill assay results from its Dark Star oxide gold deposit on its 100% owned and controlled Railway-Pinion project in Nevada’s Carlin Trend. Four of the five drill holes returned gold assays above the cut-off grade of the National Instrument 43-101 compliant resource estimate completed by APEX Geosciences Ltd., released on March 3, 2015 (23.11 million tonnes grading 0.51 g/t gold at a 0.14 g/t gold cut-off). Of particular interest was hole DS15-10, which intersected a new gold zone that is significantly thicker and higher grade than any results returned from Dark Star to date. DS15-10 was drilled approximately 510 metres north of the Dark Star maiden resource, where no historical drilling has been completed.
See Haywood Securities for the full report

The Weekly Dig 11/6/15
Haywood Mining [email protected] Page 5
Performance of Companies Included in Junior X and Notable News Flow
Source: Capital IQ and Haywood Securities
Key Catalysts for Companies Featured in the Last Junior Exploration Report
Source: Haywood Securities
Close
Price Market Capitalization
Cash at Quarter
End Weekly Performance QTD Performance
QTD Performance
vs. TSXV Index
Company Ticker (C$) (C$M) (C$M)
Junior Exploration Names
Balmoral Resources Ltd TSX:BAR 0.45 52.39 9.72 (10.1)% (11.0)% (13.9)%
Barsele Minerals Corp. TSXV:BME 0.13 13.94 0.70 0 NA NA
Calibre Mining Corp. TSXV:CXB 0.08 16.72 2.06 (5.9)% (20.0)% (22.9)%
Columbus Gold Corp. TSXV:CGT 0.44 62.33 4.85 (7.4)% 14.5% 11.6%
Gold Standard Ventures Corp TSXV:GSV 0.56 98.98 17.93 9.8% 9.8% 6.9%
Kennady Diamonds Inc. TSXV:KDI 2.75 128.99 3.37 (7.7)% (8.9)% (11.8)%
Marathon Gold Corporation TSX:MOZ 0.19 16.71 3.46 (5.0)% (7.3)% (10.2)%
NGEx Resources Inc. TSX:NGQ 0.50 93.86 7.53 0 (7.4)% (10.3)%
North American Nickel Inc. TSXV:NAN 0.13 0.00 1.24 (13.3)% (3.7)% (6.6)%
Plateau Uranium Inc. TSXV:PLU 0.28 10.97 2.28 (14.1)% (14.1)% (16.9)%
Reservoir M inerals Inc. TSXV:RMC 4.40 215.28 10.38 (1.1)% 3.5% 0.7%
TerraX Minerals Inc. TSXV:TXR 0.33 22.25 6.15 3.1% (10.8)% (13.7)%
Tinka Resources Ltd. TSXV:TK 0.17 24.72 9.01 0 (17.5)% (20.4)%
Other Companies in the News
No other company news for the week
Company Ticker Catalysts
Junior Exploration Names
Balmoral Resources Ltd TSX:BAR • Assay results from summer/fall drilling program
• NI 43-101 compliant resource estimate for Martiniere - Q2/16
• NI 43-101 compliant resource estimate for Martiniere -Q1/16
Barsele M inerals Corp. TSXV:BME • Mobilization of 3-rig drill program underway - results expected from October
2015Calibre M ining Corp. TSXV:CXB • Exploration results from B2Gold joint venture
• Details on drill program from Centerra joint venture program - starting Q4/15
Columbus Gold Corp. TSXV:CGT • Paul Isnard Project:
Infill drill results - through H1/16
Updated resource estimate - H2/16
FS - Q4/16
• Eastside Project:
Metallurgical results - 2016
Drill results - through 2016
Gold Standard Ventures Corp TSXV:GSV • Bottle-roll metallurgical test results - end Q4/15 - start Q1/16
• Budget of $2.08 million - drilling at Pinion and Dark Star and 5 holes at North
Bullion
Kennady Diamonds Inc. TSXV:KDI • Kelvin:
• Maiden resource estimate - Q4/15
• Bulk Sample results (caustic fusion) from Kelvin North Lobe, Faraday 2 qand
Faraday 1 - Q4/15
• Start of bulk-sample collection on Kelvin and Faraday
Marathon Gold Corporation TSX:MOZ • 10,000 to 12,000 metre drill program
• Updated resource estimate - Q4/15
• PEA - estimated late 2016
NGEx Resources Inc. TSX:NGQ • Updated Los Helados/Josemaria PEA expected H1/16
• Regional exploration results (drilling)
North American Nickel Inc. TSXV:NAN Remaining drill results from Maniitsoz exploration program (Spotty Hill, Imiak Hill
and other regional targets_ - H2/15
Orex Minerals Inc. TSXV:REX • Coneto:Maiden resource from JV partner (Fresnillo PLC) and plan for 2016
exploration program
• Sandra Escobar: Initial exploration program to be mobilized in mid-October with
drill program expected to commence by end 2015
Plateau Uranium Inc. TSXV:PLU • Updated PEA integrating consolidated resources (Q4/15)
• Results of further metallurgical testwork, and exploration results (2015-2016)
Reservoir M inerals Inc. TSXV:RMC • Timok exploration results (JV ground) - H2/15
• Timok exploration results (100%-owned ground) - H2/15
• Completion of Timok scoping study - Q1/16
TerraX Minerals Inc. TSXV:TXR • Drill assay results - Q4/15 and throughout 2016
Tinka Resources Ltd. TSXV:TK •Ayawilca exploration results from ~$4 million (~10,000 metre) 2015 drill program
(2 rigs) - H2/15

The Weekly Dig 11/6/15
Haywood Mining [email protected] Page 6
Haywood Research: The Week in Review
Publications from the Haywood Research team for the week included the following:
A maiden resource estimate at Gryphon from Denison Mines Corp. (DML-T)
Q3/15 financial and production results from Eldorado Gold Corporation (EDR-T)
Shareholder approval for the acquisition of La Mancha from Endeavour Mining Corp. (EDV-T)
Infill drill results from Integra Gold Corp. (ICG-V)
Q3/15 financial and production results from Lucara Diamond Corp. (LUC-T)
Q3/15 financial and production results from Mandalay Resources Corp. (MND-T)
Q3/15 production results from Nevsun Resources Ltd. (NSU-T)
The initiation of formal coverage of NexGen Energy Ltd. (NXE-V)
A maiden resource estimate from Pilot Gold’s (PLG-T) Kinsley Mountain Project
An updated resources estimate from RTG Mining Inc. (RTG-T)
The acquisition of Samara’s (SWA-V) Liberian licences by Aureus Mining Inc. (AUE-T)
Radar Flashes
Denison Mines Corp. (DML-T, $0.51; DNN-US, US$0.39) – Maiden Resource Estimate at Gryphon Zone of 43 Mlb of U3O8 Beats Our Expectations
Colin Healey, [email protected]
Maiden Resource at Gryphon propels Wheeler River project – With the addition of the Gryphon Zone estimate, total resources at the Wheeler River project now stand at 114.3 million pounds (Mlb) (1.0 Mt grading 5.1%, all categories, 100% basis), including 70.2 Mlb of U3O8 (0.17 Mt grading 19.1%) in the indicated category at the Phoenix deposit. With this announcement, the Wheeler River project could be considered the largest undeveloped uranium project in the Athabasca Basin under a co-development scenario that includes the Phoenix and Gryphon Zones. Denison has studied the potential for this concept and will formalize it under a Preliminary Economic Assessment (PEA) in H1/1.
The Gryphon resource reduces risk in the Wheeler River development assumption – The Gryphon Zone resource is important to the Wheeler River project, and in our view, validates the potential for development and exploitation of Gryphon ahead of initial development of the Phoenix Zone. The basement-hosted Gryphon deposit should be less complex to develop than Phoenix, and could provide initial production and associated cash-flow support for Phoenix development, which is expected to require freezing to gain access to the high-grade ore. We believe the forthcoming H1/16 PEA studying this development concept will demonstrate its viability. The combined size and grade of the initial resource at Gryphon, which comes in ahead of our expectations, reduces uncerta inty in the co-development potential of Gryphon and Phoenix.
See Haywood Securities for the full report
Eldorado Gold Corporation (ELD-T, $4.57) – Q3/15 Results…Overall a Decent Quarter
Kerry Smith, Peng, [email protected], Ardem Keshishian, [email protected]

The Weekly Dig 11/6/15
Haywood Mining [email protected] Page 7
Q3/15 CFPS…a slight miss on a lower gold price – Eldorado reported Q3/15 cash flow from operations (before W/C changes) of US$43.4 million, or US$0.06 per share, which was modestly below consensus and Haywood estimates of US$0.07 per share. Eldorado is relatively unleveraged, with US$456 million of working capital and US$600 million of long-term debt, and is well funded to complete its growth projects at Skouries and Olympias.
But production up and cash costs down – In Q3/15, Eldorado produced 183,226 ounces of gold, up 1% from Q2/15 production of 181,160 ounces, and sold 182,124 ounces, versus 170,056 ounces in Q2/15, at an average gold price of US$1,132/oz. Total cash cost and all-in sustaining cost (AISC) averaged US$609/oz, down 1% quarter on quarter (QoQ), and US$835/oz, down 7% QoQ, respectively. We assumed production of 180,000 ounces at a total cash cost of US$610/oz for Q3/15.
See Haywood Securities for the full report
Endeavour Mining Corp. (EDV-T, $0.64) – Continuing to Grow the Company with Approval of La Mancha Deal
Tara Hassan, [email protected], Danny [email protected]
Last night Endeavour held a special meeting of shareholders where shareholders voted on the following:
The issuance of 177 million new shares to La Mancha, representing 30% of Endeavour's pro -forma share capital
The consolidation of shares on a 1 new for 10 old basis (1 for 10 reverse split)
93.4% of votes cast voted in favor the share issuance, and 96.5% of votes cast voted in favor of the share consolidation. Both items require a simple majority of votes cast (50% + 1 share), and have thus satisfied the shareholder approval requirement.
See Haywood Securities for the full report
Integra Gold Corp. (ICG-V, $0.35) – Parallel Zone Infill Drilling Update
Kerry Smith, Peng, [email protected], Ardem Keshishian, [email protected]
Parallel Zone infill drilling results in line – On Tuesday morning, Integra released results from 9 drill holes, with 12 drill holes pending, from the Parallel Zone. Altogether, the Company has completed 26 holes for a total of 5,578 metres in 2015 in this zone. The Parallel Zone infill and depth-extension drill program is using a 20- to 25-metre drill-spacing pattern, while also collecting additional core samples for the Phase IV metallurgical testing program at Parallel. Drilling at Parallel is now finished for this year, and results will be incorporated into an updated resource expected in H1/16. The current indicated resource at Parallel is 143,000 ounces grading 9.6 g/t gold, plus inferred of 74,000 ounces at 15.0 g/t. This zone is the second largest behind the Triangle Zone, accounting for 18% of the overall indicated resource.
See Haywood Securities for the full report
Lucara Diamond Corp. (LUC-T, $1.70) – Q3/15 Results Beat Expectations on Revenue and Costs
Geordie Mark, [email protected], Ben [email protected]
Q3/15 Financials: Lucara reported operating cash flow (before changes in working capital) of US$52 million or US$0.14/sh on revenues of US$91 million and EBITDA of US$67 million. Actual results came in ahead of Haywood estimates of US$47 million or US$0.01/sh in cash flow on revenues of US$87 million and EBITDA

The Weekly Dig 11/6/15
Haywood Mining [email protected] Page 8
of US$60 million. Higher reported OCF was driven by lower costs and diamond higher sales. Diamond sales for the quarter totaled 84 kct (vs. production of 101 kct) at an average price of US$1,081/ct.
Q3/15 Operations: Lucara reported production of 101 kct diamonds at a cash cost (exclusive of royalties) of US$130/ct assuming direct operating costs of US$29/t processed. Diamond recoveries were 18% higher than our estimate of 85 kct due to 10% higher grades and 7% greater throughput. Operating costs beat our estimate of US$36/t, and resulted in operating costs (inclusive of royalties) of US$238/ct (Hay. Est. US$356/ct). We note that Lucara is guiding for costs at the low end of US$33 - 36/t processed. In Q3/15, 160 special stones (>10.8 ct) were recovered at an average size of 33.49 ct with the largest being a 336 ct stone current under tender. Large diamonds (+10.8 ct) recovered in Q4 are on average 5 carats larger than those recovered in Q3/15.
See Haywood Securities for the full report
Mandalay Resources Corp. (MND-T, $0.78) – In-Line Q3/15 Results Overshadowed by Tempered 2016 Estimates
Cerro Bayo - Production of 632 koz Ag & 5.3 koz Au at a cash cost of US$8.31/oz Ag (net Au) and site all-in cost of US$15.18/oz Ag. Cerro Bayo is anticipated to deliver higher head grades as production from Delia SE commences.
Costerfield - Production of 10.9 koz Au and 964 t Sb or 16.8 koz AuEq at a cash cost of US$553/oz AuEq and site all-in cost of US$763/oz AuEq. For Q4/15, Costerfield is anticipated to maintain current cost & volume performance.
Björkdal - Production of 9.8 koz Au at a cash cost of US$934/oz and site all-in cost of US$1,110/oz. Björkdal is anticipated to deliver improved grades which should drive a commensurate reduction in cash costs as the higher-grade mine plan is implemented in the coming quarters.
See Haywood Securities for the full report
Nevsun Resources Ltd. (NSU-T, $3.91) – Bisha Continues to Generate Cash; We Are Cautious Re Upper End of 2015E Guidance
Stefan Ioannou, [email protected], Jenny [email protected]
Q3/15 copper production from Nevsun’s 60% owned Bisha mine in Eritrea totalled 32.5 Mlb at an average total cash cost of ~US$1.69/lb sold net of credits (including royalties; 100% basis), similar to Q2/15 production of 32.4 Mlb at ~US$1.63/lb despite a lower average copper head grade of 3.8% (as expected; vs 4.2% in Q2/15). Lower grade (and poorer metallurgical performance reflecting intermittent mill downtime) was offset by higher throughput.
Nevsun’s 2015E copper production guidance (140 Mlb to 150 Mlb in concentrate) was/is underpinned in part by anticipated higher mill throughput of ~6,600 tonnes per day (tpd) through H2/15 (vs ~4,900 tpd and ~4,714 tpd in Q1/15 and Q2/15 respectively). That said, Q3/15 throughput of 485 kilotonnes (kt) equates to ~5,272 tpd. Hence, we plan to monitor throughput, in the context of 2015E guidance, closely through Q4/15. Nevsun is confident Bisha’s mill has capacity (in excess) to handle +6,600 tpd. Nevertheless, we have now modestly reduced 2015E copper production in our model to reflect the lower end of Nevsun’s guidance; namely, 140 Mlb in concentrate. As a result, our estimate of 2015E attributable cash flow per share (CFPS) has decreased to US$0.32 (from US$0.35) at Haywood’s 2015E copper price of US$2.65/lb. However, we note our formal valuation (target price) remains based on a n estimate of 2016 forward net asset value (NAV).
See Haywood Securities for the full report

The Weekly Dig 11/6/15
Haywood Mining [email protected] Page 9
NexGen Energy Ltd. (NXE-V, $0.72) – NexGen on Target with Arrow
Stefan Ioannou, [email protected], Jenny [email protected]
NexGen - The Premier Global Uranium Pure Exploration Play: We believe NexGen is peerless in the Athabasca Basin and globally as the only company with the potential to deliver a world-class high-grade maiden uranium resource in H1/16. We estimate that NexGen has visibility on more than 120 million pounds (Mlb) U3O8 at the Arrow Zone, and we expect the maiden National Instrument 43-101 resource estimate to delineate between 100 and 120 Mlb U3O8, with real growth potential.
Making the Grade: Drilling at Arrow Zone has enjoyed a > 90% hit rate for uranium mineralization, but perhaps more importantly, has intersected some of the most uranium-rich grade x thickness (GT) intervals ever reported globally. Hole AR-15-44b delivered a total composite GT of 853.55 metres, with highlight intervals of 20 metres grading 20.68% U3O8, within 56.5 metres grading 11.55% U3O8. NexGen has delivered the type of headline-smashing grades we have come to expect from the Athabasca Basin and has grown Arrow to a uranium-mineralized footprint spanning 645 metres by 235 metres, from 100 to 920 metres depth.
See Haywood Securities for the full report
Pilot Gold Inc. (PLG-T, $0.39) – Maiden Resource at Kinsley Mountain Demonstrates Potential
Tara Hassan, [email protected], Danny [email protected]
This morning Pilot Gold announced a maiden resource estimate for their Kinsley Mountain project in eastern Nevada. The estimate is based on results from 77,097 metres of historical drilling in 1,158 holes, and 59,852 metres drilled in 222 holes by Pilot Gold, and defines a significant high grade zone at the Western Flank (284 Koz at 6.04 g/t) along with near-surface oxide ounces.
Pilot believes that there remains significant potential for resource expansion due to widespread alteration, prospective geology and the fact that over 80% of property is untested and a large number of untested targets have attributes similar to the Western Flank Zone.
See Haywood Securities for the full report
RTG Mining Inc. (RTG-T, $0.50) – Updated Mabilo Resource Estimate Considerably Increases Indicated Ounces
Tara Hassan, [email protected], Danny [email protected]
Last night RTG an updated mineral resource estimate for the Company's Mabilo Project located in the Philippines. The update increases contained gold ounces in all categories by 7% to 763,000 ounces, and increases gold equivalent contained ounces in all categories by 8%. The most notable change, however, is the significant increase in the Indicated resource classification, which increase by 52% on a tonnage basis and by 40% on contained ounces (Au and AuEq). The average gold grade (all categories) declined by 3%, and the average silver grade decreased by 9%. In the oxide portion of the resource, total tonnage decreased by 3%, average gold grade decreased by 2%, and average gold-equivalent grade increased by 1%.
Since the maiden mineral resource estimate was announced on November 24, 2014, RTG has focused on better defining the copper-gold-magnetite skarn to provide further confidence in the Mineral Resource that will be incorporated into the feasibility study on the primary operation. The updated resource estimate contains sufficient resources to justify a Feasibility Study with a 10 year mine life. The study is currently being finalized and expected to be delivered late this quarter or early in 2016.
See Haywood Securities for the full report
The Weekly Dig 11/6/15
Haywood Mining [email protected] Page 10
Sarama Resources Ltd. (SWA-V, $0.08) – Aureus Acquires Sarama’s Liberian Licences
Tara Hassan, [email protected], Danny [email protected]
On Tuesday morning, Sarama announced that it has entered into a legally binding agreement with Aureus Mining (AUE-T; not rated), whereby Aureus will purchase three of Sarama ’s Liberian mineral exploration licences for total consideration of 2.6 million Aureus common shares (~$0.9 million).
The licences are contiguous to Aureus’ Bea Mountain Mining Licence, and are adjacent to Aureus’ New Liberty gold mine, which poured first gold in May 2015 and is currently in the commissioning phase, with commercial production expected to be declared in January 2016.
Sarama conducted a US$1.8 million exploration program over the licence areas that led to the identification of a 15-kilometre-long gold-in-soil anomaly. In 2014, Sarama conducted a 1,600-metre drill program (15 holes) targeting the Bangoma, Saanor, and Bomafo prospects, with mineralization intersected in all but one of the drill holes. All three prospects are located in the Cape Mount Permit.
See Haywood Securities for the full report
Other Reports
The Ore Deposits Guide – Zinc Deposits
Stefan Ioannou, [email protected], Kerry Smith, MBA, [email protected], Mick Carew, [email protected], Jenny [email protected], Ardem [email protected]
Highlights:
Zinc’s primary use is in the production of galvanized steel, accounting for ~50% of the metal’s demand today. Hence, zinc’s fundamentals remain largely underpinned by the automotive sector and infrastructure development, and emerging market considerations (namely China and India) are key to the metal’s long-term outlook (see Appendix II). Global economic uncertainty and lofty/volatile zinc inventory data have prompted the metal’s price to decline by ~31% to ~US$0.76/lb currently over the past ~6 month, echoing moves across the entire commodity sector. However, the zinc market continues to face a considerable medium-term (+2016) supply issue, as there are arguably no new large advanced-stage development projects poised to replace production capacity lost from a number of mature mine closures. Mine closures/reductions since 2013 have removed (or will) ~4.5 billion pounds of annual zinc production from the market, equivalent to ~15% of global supply, outpacing foreseeable zinc mine additions. The impact of this anticipated shortfall stands to be amplified by projected growth in global zinc demand, currently estimated at ~4% per annum.
See Haywood Securities for the full report

The Weekly Dig 11/6/15
Haywood Mining [email protected] Page 11
Market Essentials
Companies in the News
Turquoise Hill Resources Ltd. (TRQ-T) announced its Q3/15 financial and production results (all figures in US$), with net attributable income coming in at $21.2 million, or $0.01 per share, compared to the net loss of $94 million ($0.05 per share) reported for Q3/14; the net loss in Q3/14 was attributed to a $227.3 million non-cash impairment charge on reclassification of SouthGobi assets held for sale. Operating cash flows before interest and taxes in Q3'15 were $171.7 million compared with $256.3 million in Q3'14, reflecting continued production and delivery cost improvements and effective working capital management, offset by the impact of lower commodity prices on sales revenue. AISC for Q3/15 were $1.52 per pound copper, compared to $1.26 per pound copper for Q2/15 (no figures for Q3/14 available). At Oyu Tolgoi, Q3/15 mine production was at record levels while concentrate produced and contained copper was on par with Q2'15 despite the planned concentrator shutdown in July. During Q3/15, mined production increased 8.5% over Q2/15 due to shorter hauling routes and ongoing productivity initiatives. Copper in concentrates for Q3/15 increased 1.3% due to higher head grades. Gold in concentrates for the quarter decreased 48.3% over Q2/15 due to slower than anticipated access to gold-rich ore.
Osisko Mining Royalties Ltd. (OR-T) announced Q3/15 financial results, with net earnings for the quarter coming in at $9.8 million ($0.10 per share), compared with $5.8 million ($0.12 per share) in Q3/14. Total revenue was $11.7 million from the sale of gold and silver ounces from the 5% net smelter return (NSR) royalty received from the Canadian Malartic mine (owned by Agnico Eagle Mines and Yamana Gold), compared with $9.6 million in Q3/14. The Company announced a dividend for the quarter of $0.03 per share.
Richmont Mines Inc. (RIC-T) announced Q3/15 financial and production results (all figures in C$), with quarterly revenue coming in at $34.1 million, or net earnings per share of $0.06, from 23,478 ounces of gold produced from the Company’s Cornerstone Island Gold operation in Ontario. These amounts were in line with total revenue from the same period last year ($34.2 million), and net earnings per share of $0.09, from 24,300 ounces of gold produced. All-in sustaining cost for Q3/15 was slightly higher ($1,311 per ounce) compared with Q3/14 ($1,074).
Argonaut Gold Inc. (AR-T) announced its Q3/15 financial and production results (all figures in US$), with revenue coming in at $32.1 million, slightly lower than the $37.3 million in Q3/14, which translated into a net loss of $11.2 million, or $0.07 per share, compared to the $1.8 million loss ($0.01 per share) in Q3/14. We note that this includes a non-cash impairment charge of $6.7 million related to work-in-process inventory at the El Castillo mine for the third quarter valuing inventory @ $1,114 per oz. AISC were lower in Q3/15, at $922 per ounce, compared to Q3/15, at $1,009 per ounce. The Company has a cash balance of $43.7 million, unchanged from the previous quarter.
Timmins Gold Corp. (TMM-T) announced its Q3/15 financial and production results (all figures in US$). The Company reported a total impairment of mineral properties, plant and equipment and other assets of $226.5 million during the period, resulting in a loss from operations of $230.2 million, compared to earnings from operations of $3.9 million in Q3/14. Loss and total comprehensive loss was $180.7 million or $0.63 per share, compared earnings and total comprehensive income to $1.6 million or $0.01 per share during Q3/14. The Company's cash cost per ounce on a by-product basis was $1,026 (all-in sustaining cash cost per ounce on a by-product basis - $1,105), compared to $856 (all-in sustaining cash cost per ounce on a by-product basis - $994) during Q3 2014. This increase in cash costs is due to the higher amount of waste tonnes being costed to inventory due to the higher strip areas within the open pit operations being mined

The Weekly Dig 11/6/15
Haywood Mining [email protected] Page 12
during the current quarter. The Company's cash position of $10.4 million at September 30, 2015 improved in October 2015 by a C$6.0 million private placement of common shares and warrants with Goldcorp Inc. and by sales of 8,178 ounces of gold. The Company has a $10.2 million loan facility maturing on December 31, 2015, and the Company is negotiating with the lender to extend the maturity date over fiscal 2016.
Also this week, Timmins announced it closed the acquisition of the process plant and infrastructure for the Ana Paula Project in Mexico from a Mexican subsidiary of Goldcorp Inc. (G-T) for a total purchase price of $8.0 million in a cash and share deal.
Discovery Ventures Inc. (DVN-V) announced that it was granted a permit from the B.C. Ministry of Energy and Mines to remove a bulk sample of up to 10,000 tonnes of ore from the Company’s flagship property, the Willa project, near Silverton, British Columbia. The program is intended to investigate the metallurgical properties of the deposit, test extractive methods, and test mill equipment at the Company’s Max Mill processing facility at Trout Lake, British Columbia.
Mergers and Acquisitions
Santa Cruz Silver Mining Ltd. (SCZ-V) announced it has entered into a definitive agreement with Minera Contracuña I, S.A. de C.V. and Vetalinda Compania Minera, S.A. de C.V. (together “Contracuña”), whereby Santa Cruz has the right for 30 years to explore, mine, and operate Contracuna’s Veta Grande and Minillas silver-gold-zinc-lead mineral properties that cover approximately 1,100 hectares within the State of Zacatecas, in central Mexico. Highlights of the deal include access to additional mineralized feed for the Rosario mine milling facility, a 500 tpd operational mill, and access to one of Mexico’s most prolific silver, lead, zinc, and copper regions. As part of the deal, Santa Cruz will make initial $200,000 and $300,000 payments on finalization and registration of the agreement, which will see Santa Cruz operate the properties on a 60%/40% net profits interest (NPI) basis. In the event the price of silver is greater than US$22.00 per ounce, the NPI changes to 55%/45%
Skeena Resources Ltd. (SKE-V) announced that it has completed its previously announced acquisition of a 100% interest in the GJ property from owners Teck Resources Ltd. (TCK.B-T) and NGEx Resources Inc. (NGQ-T). Skeena acquired the property in exchange for $500,000 in cash and 12.9 million Skeena common shares valued at $1 million at a price of $0.077 per share at closing, $1.5 million worth of Skeena shares before the second and fifth anniversary of closing, and a $4 million cash payment within 45 days of the commencement of commercial production on the GJ property. The main GJ property claim block is subject to a 2% NSR royalty for Teck and NGEx, of which 50% can be purchased for $2 million in cash. The GJ property is composed of 80 mineral claims totalling 37,508 hectares and is located adjacent to the eastern boundary of Skeena’s Spectrum project in the Golden Triangle of northwest British Columbia.
Silver Wheaton Corp. (SLW-T) announced that it has acquired a silver stream from Glencore’s (GLEN-LON) Antamina mine in Peru for $900 million, plus ongoing payments of 20% of spot price per silver ounce delivered. The stream purchased by Silver Wheaton represents an amount equal to 33.75% of the Antamina silver production until the delivery of 140 million ounces of silver, and 22.5% of silver production thereafter for the life of the mine at a fixed 100% payable rate. Subsequent to the closing of this acquisition, Silver Wheaton’s estimated proven and probable silver reserves increased by 75 million ounces, measured and indicated silver resources increased by 56 million ounces, and inferred silver resources increased by 126 million ounces.
Oban Mining Corporation (OBM-T) announced two agreements this week, the first announcement on Thursday saw Oban acquire 7 million shares of ValGold Resources Inc. (VAL-V) at a price of $0.01 per share for total consideration of $70,000. According to Oban, the purchase

The Weekly Dig 11/6/15
Haywood Mining [email protected] Page 13
was made for investment purposes, and the Company has no current intention of increasing its ownership of, or control or direction over, additional securities of ValGold. On Friday, Oban announced an agreement to acquire all issued and outstanding shares of Northern Gold (NGM-V) in exchange for 4 million common shares of Oban. Post-agreement, Northern Gold shareholders will hold approximately 6.8% of Oban. Northern Gold hold a number of prospective mineral properties within its Golden Bear Project in the Larder Lake Mining Division in northeastern Ontario.
TomaGold Corp. (LOT-V) announced that it has renegotiated an agreement with IAMGOLD Corp. (IAG-NYSE) for the sale of the Monster Lake project to IAMGOLD. Under the terms of the new agreement, IAMGOLD will acquire a 50% interest in the Monster Lake project, which comprises the Monster Lake, Winchester and Lac-a-l'Eau-Jaune properties, in exchange for a $3.22 million cash payment to TomaGold, which will be paid at the closing of the transaction. IAMGOLD will also have an option to acquire an additional 25% interest by spending $10 million on exploration work over a 7-year period, with a minimum of $500,000 to be spent each year. The effective starting date for the exploration work commitment will be January 1, 2015.
Financings
Wellgreen Platinum Ltd. (WG-V) announced that it has entered into definitive agreements with Resource Capital Fund VIL.P and Australind Limited for a financial package of US$8.73 million (C$11.4 million), which consists of a C$3.3 million equity private placement and the sale of a 1.0% net smelter return royalty on future production from the Wellgreen property for C$8.1 million. The private placement will comprise the issuance of 13.06 million common shares at C$0.25 per share, plus a warrant priced at C$0.40 per share exercisable for a period of 36 months. With these agreements in place, the Company has initiated the second phase of its 2015 exploration drill program at Wellgreen and expects to undertake a comprehensive metallurgical testing program starting in Q1/16.
Silvercrest Metals Inc. (SIL-V) announced a private placement of up to C$2.25 million comprising 15 million shares at C$0.15 per share, plus one-half of one purchase warrant priced at C$0.20 per share, exercisable for 2 years. Proceeds from the private placement will complement the Company’s current cash of C$5.1 million and be used for general corporate purposes.

The Weekly Dig 11/6/15
Haywood Mining [email protected] Page 14
Completed Equity Financings 2013 to Date (C$ million and average transaction size)
Source: Capital IQ
Announced Equity/Debt Raisings and Streaming Deals for the Week (> $500,000)
Source: Capital IQ and Haywood Securities
$0
$10
$20
$30
$40
$50
$60
$70
$80
$0
$2,000
$4,000
$6,000
$8,000
$10,000
Jan
-13
Feb
-13
Mar
-13
Ap
r-1
3
May
-13
Jun
-13
Jul-
13
Au
g-1
3
Sep
-13
Oct
-13
No
v-1
3
De
c-1
3
Jan
-14
Feb
-14
Mar
-14
Ap
r-1
4
May
-14
Jun
-14
Jul-
14
Au
g-1
4
Sep
-14
Oct
-14
No
v-1
4
De
c-1
4
Jan
-15
Feb
-15
Mar
-15
Ap
r-1
5
May
-15
Jun
-15
Jul-
15
Au
g-1
5
Sep
-15
Oct
-15
No
v-1
5
Ave
rage
Siz
e (
C$
Mill
ion
)
Val
ue
(C
$ M
illio
n)
Monthly ($millions)
Cumulative ($millions)
Average Size ($millions)
Date Company Ticker Value Price 20 Day VWAP
Prem /
Disc Details
Equity Raisings
5-Nov-15 Maritime Resources Corp. (TSXV:MAE)TSXV:MAE
C$1.5 M $0.14 $0.15 (5.5)%10M sh at C$0.14/sh plus ½ warr at $C0.20/sh for 2 years plus royalty units at
C$0.01/sh
5-Nov-15 Silver Spruce Resources Inc. (TSXV:SSE) TSXV:SSE C$1.0 M $0.08 $0.08 (4)% 13.3M sh at C$0.075/sh plus ½ warr at $C0.10/sh for 2 years
5-Nov-15 Secova Metals Corp. (TSXV:SEK) TSXV:SEK C$1.0 M $0.08 $0.05 48% 10M FT sh at C$0.075/sh and 4M sh at C$0.05/sh
5-Nov-15 Arizona Mining Inc. (TSX:AZ) TSX:AZ C$0.7 M $0.35 $0.29 20% 2M sh at C$0.35/sh plus warr at C$0.45/sh for 5 years
4-Nov-15 Wellgreen Platinum Ltd. (TSX:WG) TSX:WG C$3.3 M $0.25 $0.22 12% 13M sh at C$0.25/sh plus warr at C$0.4 for 3 years
4-Nov-15 Ultra Lithium Inc (TSXV:ULI)TSXV:ULI
C$0.9 M $0.05 $0.07 (30)% 8.97M sh at C$0.05/sh and 8.6M sh at C$0.025/sh plus warr at C$0.1 for 1 years
2-Nov-15 Minemakers Limited (ASX:MAK) ASX:MAK C$2.9 M $0.11 $0.11 4% 28.2M sh at A$0.11/sh
2-Nov-15 Corex Gold Corp. (TSXV:CGE) TSXV:CGE C$1.0 M $0.05 $0.05 (2)% 20M sh at C$0.05/sh ½ plus warr at C$0.15 for 2 years
2-Nov-15 Canstar Resources, Inc. (TSXV:ROX) TSXV:ROX C$0.8 M $0.08 $0.06 26% 9.37M FT sh at C$0.08/sh plus warr at C$0.10 (1st yr) and C$0.175 (2nd yr)
2-Nov-15 Emerita Resources Corp. (TSXV:EMO) TSXV:EMO C$0.5 M $0.07 $0.06 25% 7.1M sh at C$0.07/sh plus warr at C$0.14/sh for 2 years
Debt Raisings2-Nov-15 Excellon Resources Inc. (TSX:EXN) TSX:EXN C$6.0 M $0.50 $0.37 36% C$6M at 3.75% from conv deb at C$0.5/deb plus warr at C$0.5/deb
Premium/discount based on closing price one day prior to announcement
Premium/discount based on common shares (where applicable) or quoted security
E = equity; D = Debt; sh = shares; FT = flow through; warr = warrant

The Weekly Dig 11/6/15
Haywood Mining [email protected] Page 15
Weekly Commodities / Indices / Exchange Rates
Metal and Currency Prices for the Week
Source: Haywood Securities
13,400
13,600
13,800
11/2 11/6
S&P/TSX Composite IndexLast: 13,553
120
140
11/2 11/6
S&P/TSX Global Gold IndexLast: 121.8
17,700
17,900
11/2 11/6
Dow Jones Industrial AverageLast: 17,910
530
540
550
11/2 11/6
S&P/TSX Venture Comp IndexLast: 534
75
85
11/2 11/6
S&P/TSX Global Base Metals IndexLast: 76.15
2,080
2,130
11/2 11/6
S&P 500 IndexLast: 2,099
Name Close 1Wk Δ % 5 Day Trend 52W H/L 1W H/L
Gold Spot 1,089 (53.15) (4.88)% 1,308 1,142
US$/oz 1,077 1,089
Silver Spot 14.76 (0.79) (5.32)% 18.49 15.55
US$/oz 13.98 14.76
Platinum Spot 942 (43.13) (4.58)% 1,289 985
US$/oz 893 942
Palladium Spot 620 (56.50) (9.11)% 833 677
US$/oz 521 607
Copper Future 2.27 (0.06) (2.72)% 3.08 2.33
US$/lb 2.21 2.27
Nickel Spot 4.35 (0.20) (4.65)% 7.74 4.58
US$/lb 4.22 4.35
Lead Spot 0.75 (0.01) (1.91)% 0.97 0.76
US$/lb 0.73 0.75
Zinc Spot 0.74 (0.02) (3.24)% 1.10 0.77
US$/lb 0.72 0.74
Aluminum Spot 0.68 0.03 4.08% 0.95 0.68
US$/lb 0.65 0.66
Iron Ore Spot 47 (5.95) (12.72)% 140 79
US$/t 78 78
Newcastle Coal 52 (0.45) (0.86)% 67 54
US$/t 52 52
CAAP Coal 42 0.14 0.33% 53 42
US$/t 41 42
Uranium Spot 36.00 0.60 1.67% 46 36
US$/lb 35 35
WTI 44 (2.13) (4.79)% 80 48
US$/bbl 39 44
Brent 48 (2.01) (4.23)% 89 51
US$/bbl 44 48
Henry Hub 2.35 0.03 1.23% 4.11 2.36
US$/MMBtu 2.19 2.25
ENER
GY
BA
SE M
ETA
LSP
REC
IOU
S M
ETA
LS
Name Close 1Wk Δ % 5 Day Trend 52W H/L 1W H/L
TSX 13,553 24 0.18% 15,525 13,710
12,705 13,529
TSXV 534 (7.75) (1.45)% 793 542
509 534
Canadian Dollar 1.33 0.02 1.60% 1.35 1.33
1.12 1.31
Euro 1.07 (0.03) (2.46)% 1.26 1.10
1.05 1.07
China Renminbi 6.35 0.04 0.57% 6.45 6.35
6.11 6.32
Mexican Peso 16.81 0.31 1.83% 17.34 16.81
13.50 16.40
Peruvian New Sol 3.31 0.03 0.78% 3.32 3.31
2.91 3.28
S. African Rand 14.16 0.34 2.38% 14.27 14.16
10.91 13.74
Australian Dollar 0.70 (0.01) (1.26)% 0.88 0.72
0.69 0.70
Japanese Yen 123.2 2.56 2.08% 125.9 123.2
113.9 120.6
Chilean Peso 700 8.15 1.17% 710 700
585 689
British Pound 1.51 (0.04) (2.51)% 1.59 1.54
1.46 1.51
Swiss Franc 1.01 0.02 1.79% 1.02 1.01
0.74 0.99
Norwegian Krone 8.66 0.17 1.99% 8.69 8.66
6.72 8.49
Turkish Lira 2.92 0.00 0.12% 3.08 2.92
2.20 2.82
Indian Rupee 65.76 0.50 0.76% 66.89 65.76
61.30 65.27
EXC
HA
NG
E R
ATE
SIN
DIC
IES

The Weekly Dig 11/6/15
Haywood Mining [email protected] Page 16
Commodities and ETFS: A Week in Action
Gold - 1-Year US$/oz (left) and Total ETF Holdings (right)
Spot: Loss (-4.7%) for the week
ETF Holdings: 48,737,962 ounces, down 847,638 ounces for the week
Silver - 1-Year US$/oz (left) and Total ETF Holdings (right)
Spot: Loss (-5.0%) for the week
ETF Holdings: 605,813,433 ounces, down 4,402,591 ounces for the week
Platinum - 1-Year US$/oz (left) and Total ETF Holdings (right)
Spot: Loss (-4.4%) for the week
ETF Holdings: 2,469,215 ounces, down 154,389 ounces for the week
Palladium - 1-Year US$/oz (left) and Total ETF Holdings (right)
Spot: Loss (-8.3%) for the week
ETF Holdings: 2,488,016 ounces, down 186,763 ounces for the week
Copper - 1-Year US$/lb (left) and LME Inventory (right)
Futures: Loss (-2.7%) for the week
LME Copper: 266,100 tonnes, down 1,675 tonnes for the week
Nickel - 1-Year US$/lb (left) and LME Inventory (right)
Spot: Loss (-4.4%) for the week
LME Nickel: 424,188 tonnes, down 1,842 tonnes for the week
$1,000
$1,100
$1,200
$1,300
$1,400
No
v-14
Dec
-14
Jan
-15
Feb
-15
Mar
-15
Ap
r-1
5
May
-15
Jun
-15
Jul-
15
Au
g-1
5
Sep
-15
Oct
-15
No
v-15
Gold ($/oz)
Price
100D MA
48
49
50
51
52
53
54
55
56
No
v-14
Dec
-14
Jan
-15
Feb
-15
Mar
-15
Ap
r-1
5
May
-15
Jun
-15
Jul-
15
Au
g-1
5
Sep
-15
Oct
-15
Gold ETF Holdings (Moz)
$14.00
$17.00
$20.00
No
v-14
Dec
-14
Jan
-15
Feb
-15
Mar
-15
Ap
r-1
5
May
-15
Jun
-15
Jul-
15
Au
g-1
5
Sep
-15
Oct
-15
No
v-15
Silver ($/oz)
Price
100D MA
600
610
620
630
640
650
No
v-14
Dec
-14
Jan
-15
Feb
-15
Mar
-15
Ap
r-1
5
May
-15
Jun
-15
Jul-
15
Au
g-1
5
Sep
-15
Oct
-15
Silver ETF Holdings (Moz)
$900
$1,000
$1,100
$1,200
$1,300
$1,400
$1,500
No
v-14
Dec
-14
Jan
-15
Feb
-15
Mar
-15
Ap
r-1
5
May
-15
Jun
-15
Jul-
15
Au
g-1
5
Sep
-15
Oct
-15
No
v-15
Platinum ($/oz)
Price
100D MA
2.4
2.5
2.5
2.6
2.6
2.7
2.7
2.8
2.8
2.9
2.9
No
v-14
Dec
-14
Jan
-15
Feb
-15
Mar
-15
Ap
r-1
5
May
-15
Jun
-15
Jul-
15
Au
g-1
5
Sep
-15
Oct
-15
Platinum ETF Holdings (Moz)
$530
$580
$630
$680
$730
$780
$830
$880
No
v-14
Dec
-14
Jan
-15
Feb
-15
Mar
-15
Ap
r-1
5
May
-15
Jun
-15
Jul-
15
Au
g-1
5
Sep
-15
Oct
-15
No
v-15
Palladium ($/oz)
Price
100D MA
2.4
2.5
2.6
2.7
2.8
2.9
3.0
3.1
3.2
No
v-14
Dec
-14
Jan
-15
Feb
-15
Mar
-15
Ap
r-1
5
May
-15
Jun
-15
Jul-
15
Au
g-1
5
Sep
-15
Oct
-15
Palladium ETF Holdings (Moz)
$2.20
$2.30
$2.40
$2.50
$2.60
$2.70
$2.80
$2.90
$3.00
$3.10
$3.20
No
v-14
Dec
-14
Jan
-15
Feb
-15
Mar
-15
Ap
r-1
5
May
-15
Jun
-15
Jul-
15
Au
g-1
5
Sep
-15
Oct
-15
No
v-15
Copper ($/lb)
Price
100D MA
130,000
180,000
230,000
280,000
330,000
380,000
No
v-14
Dec
-14
Jan
-15
Feb
-15
Mar
-15
Ap
r-1
5
May
-15
Jun
-15
Jul-
15
Au
g-1
5
Sep
-15
Oct
-15
No
v-15
LME Copper Inventories (t)
$4.00
$4.50
$5.00
$5.50
$6.00
$6.50
$7.00
$7.50
$8.00
$8.50
No
v-14
Dec
-14
Jan
-15
Feb
-15
Mar
-15
Ap
r-1
5
May
-15
Jun
-15
Jul-
15
Au
g-1
5
Sep
-15
Oct
-15
No
v-15
Nickel ($/lb)
Price
100D MA
360,000
380,000
400,000
420,000
440,000
460,000
480,000
No
v-14
Dec
-14
Jan
-15
Feb
-15
Mar
-15
Ap
r-1
5
May
-15
Jun
-15
Jul-
15
Au
g-1
5
Sep
-15
Oct
-15
No
v-15
LME Nickel Inventories (t)
The Weekly Dig 11/6/15
Haywood Mining [email protected] Page 17
Lead - 1-Year US$/lb (left) and LME Inventory (right)
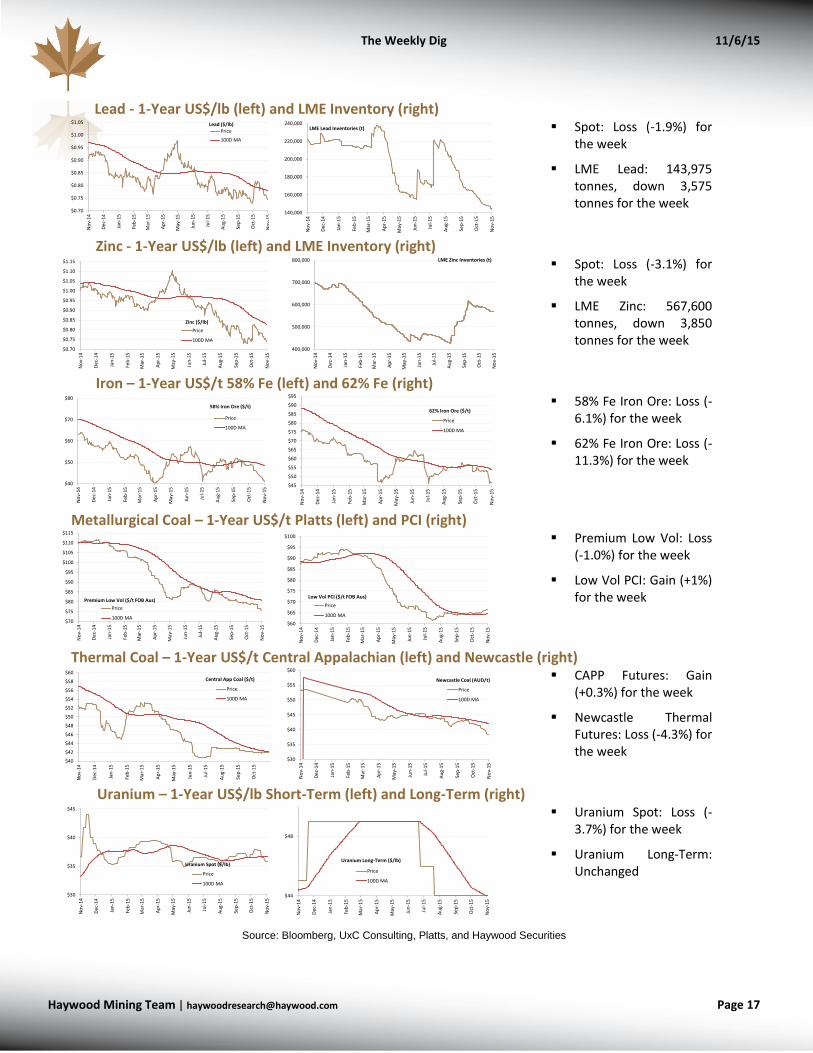
Spot: Loss (-1.9%) for the week
LME Lead: 143,975 tonnes, down 3,575 tonnes for the week
Zinc - 1-Year US$/lb (left) and LME Inventory (right)
Spot: Loss (-3.1%) for the week
LME Zinc: 567,600 tonnes, down 3,850 tonnes for the week
Iron – 1-Year US$/t 58% Fe (left) and 62% Fe (right)
58% Fe Iron Ore: Loss (-6.1%) for the week
62% Fe Iron Ore: Loss (-11.3%) for the week
Metallurgical Coal – 1-Year US$/t Platts (left) and PCI (right)
Premium Low Vol: Loss (-1.0%) for the week
Low Vol PCI: Gain (+1%) for the week
Thermal Coal – 1-Year US$/t Central Appalachian (left) and Newcastle (right)
CAPP Futures: Gain (+0.3%) for the week
Newcastle Thermal Futures: Loss (-4.3%) for the week
Uranium – 1-Year US$/lb Short-Term (left) and Long-Term (right)
Uranium Spot: Loss (-3.7%) for the week
Uranium Long-Term: Unchanged
Source: Bloomberg, UxC Consulting, Platts, and Haywood Securities
$0.70
$0.75
$0.80
$0.85
$0.90
$0.95
$1.00
$1.05
No
v-14
Dec
-14
Jan
-15
Feb
-15
Mar
-15
Ap
r-1
5
May
-15
Jun
-15
Jul-
15
Au
g-1
5
Sep
-15
Oct
-15
No
v-15
Lead ($/lb)Price
100D MA
140,000
160,000
180,000
200,000
220,000
240,000
No
v-14
Dec
-14
Jan
-15
Feb
-15
Mar
-15
Ap
r-1
5
May
-15
Jun
-15
Jul-
15
Au
g-1
5
Sep
-15
Oct
-15
No
v-15
LME Lead Inventories (t)
$0.70
$0.75
$0.80
$0.85
$0.90
$0.95
$1.00
$1.05
$1.10
$1.15
No
v-14
Dec
-14
Jan
-15
Feb
-15
Mar
-15
Ap
r-1
5
May
-15
Jun
-15
Jul-
15
Au
g-1
5
Sep
-15
Oct
-15
No
v-15
Zinc ($/lb)
Price
100D MA
400,000
500,000
600,000
700,000
800,000
No
v-14
Dec
-14
Jan
-15
Feb
-15
Mar
-15
Ap
r-1
5
May
-15
Jun
-15
Jul-
15
Au
g-1
5
Sep
-15
Oct
-15
No
v-15
LME Zinc Inventories (t)
$40
$50
$60
$70
$80
No
v-14
Dec
-14
Jan
-15
Feb
-15
Mar
-15
Ap
r-1
5
May
-15
Jun
-15
Jul-
15
Au
g-1
5
Sep
-15
Oct
-15
No
v-15
58% Iron Ore ($/t)
Price
100D MA
$45
$50
$55
$60
$65
$70
$75
$80
$85
$90
$95
No
v-14
Dec
-14
Jan
-15
Feb
-15
Mar
-15
Ap
r-1
5
May
-15
Jun
-15
Jul-
15
Au
g-1
5
Sep
-15
Oct
-15
No
v-15
62% Iron Ore ($/t)
Price
100D MA
$70
$75
$80
$85
$90
$95
$100
$105
$110
$115
No
v-14
Dec
-14
Jan
-15
Feb
-15
Mar
-15
Ap
r-1
5
May
-15
Jun
-15
Jul-
15
Au
g-1
5
Sep
-15
Oct
-15
No
v-15
Premium Low Vol ($/t FOB Aus)
Price
100D MA$60
$65
$70
$75
$80
$85
$90
$95
$100
No
v-14
Dec
-14
Jan
-15
Feb
-15
Mar
-15
Ap
r-1
5
May
-15
Jun
-15
Jul-
15
Au
g-1
5
Sep
-15
Oct
-15
No
v-15
Low Vol PCI ($/t FOB Aus)
Price
100D MA
$40
$42
$44
$46
$48
$50
$52
$54
$56
$58
$60
No
v-14
Dec
-14
Jan
-15
Feb
-15
Mar
-15
Ap
r-1
5
May
-15
Jun
-15
Jul-
15
Au
g-1
5
Sep
-15
Oct
-15
Central App Coal ($/t)
Price
100D MA
$30
$35
$40
$45
$50
$55
$60
No
v-14
Dec
-14
Jan
-15
Feb
-15
Mar
-15
Ap
r-1
5
May
-15
Jun
-15
Jul-
15
Au
g-1
5
Sep
-15
Oct
-15
No
v-15
Newcastle Coal (AUD/t)
Price
100D MA
$30
$35
$40
$45
No
v-1
4
Dec
-14
Jan
-15
Feb
-15
Mar
-15
Ap
r-1
5
May
-15
Jun
-15
Jul-
15
Au
g-1
5
Sep
-15
Oct
-15
No
v-1
5
Uranium Spot ($/lb)
Price
100D MA
$44
$48
No
v-14
Dec
-14
Jan
-15
Feb
-15
Mar
-15
Ap
r-1
5
May
-15
Jun
-15
Jul-
15
Au
g-1
5
Sep
-15
Oct
-15
No
v-15
Uranium Long-Term ($/lb)
Price
100D MA
The Weekly Dig 11/6/15
Haywood Mining [email protected] Page 18
Equities: Weekly Performances
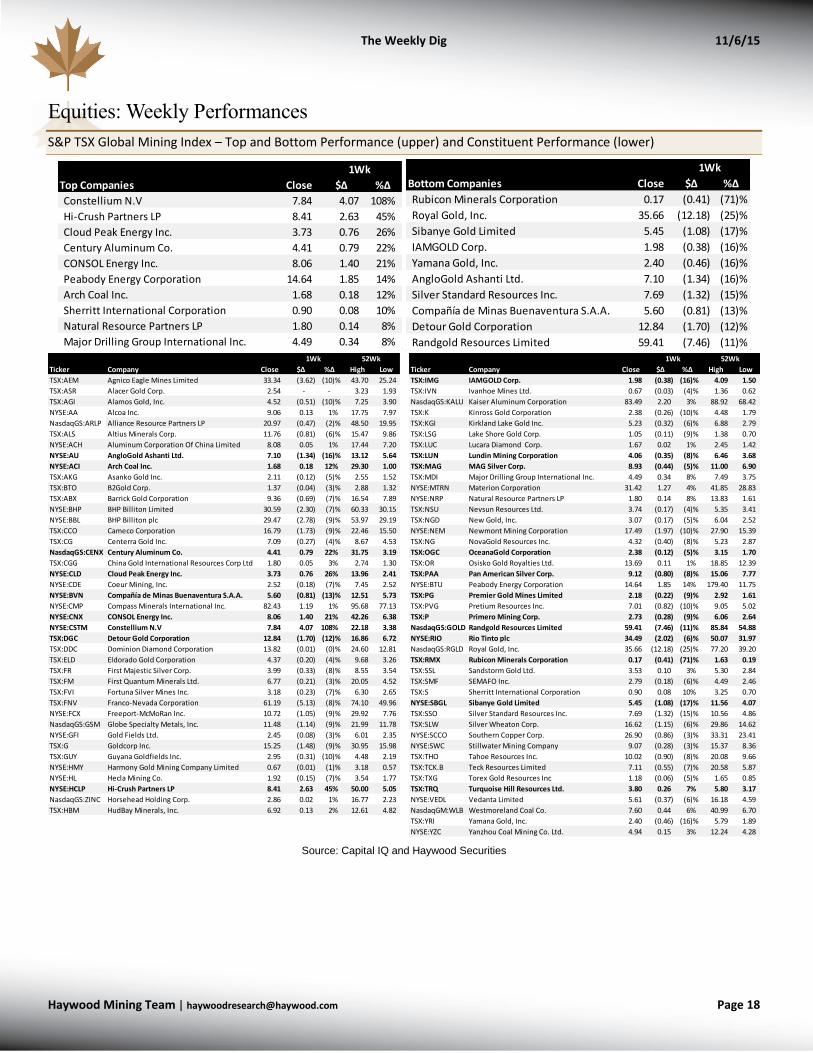
S&P TSX Global Mining Index – Top and Bottom Performance (upper) and Constituent Performance (lower)
Source: Capital IQ and Haywood Securities
Top Companies Close $∆ %∆
Constellium N.V 7.84 4.07 108%
Hi-Crush Partners LP 8.41 2.63 45%
Cloud Peak Energy Inc. 3.73 0.76 26%
Century Aluminum Co. 4.41 0.79 22%
CONSOL Energy Inc. 8.06 1.40 21%
Peabody Energy Corporation 14.64 1.85 14%
Arch Coal Inc. 1.68 0.18 12%
Sherritt International Corporation 0.90 0.08 10%
Natural Resource Partners LP 1.80 0.14 8%
Major Drilling Group International Inc. 4.49 0.34 8%
1WkBottom Companies Close $∆ %∆
Rubicon Minerals Corporation 0.17 (0.41) (71)%
Royal Gold, Inc. 35.66 (12.18) (25)%
Sibanye Gold Limited 5.45 (1.08) (17)%
IAMGOLD Corp. 1.98 (0.38) (16)%
Yamana Gold, Inc. 2.40 (0.46) (16)%
AngloGold Ashanti Ltd. 7.10 (1.34) (16)%
Silver Standard Resources Inc. 7.69 (1.32) (15)%
Compañía de Minas Buenaventura S.A.A. 5.60 (0.81) (13)%
Detour Gold Corporation 12.84 (1.70) (12)%
Randgold Resources Limited 59.41 (7.46) (11)%
1Wk
Ticker Company Close $∆ %∆ High Low Ticker Company Close $∆ %∆ High Low
TSX:AEM Agnico Eagle Mines Limited 33.34 (3.62) (10)% 43.70 25.24 TSX:IMG IAMGOLD Corp. 1.98 (0.38) (16)% 4.09 1.50
TSX:ASR Alacer Gold Corp. 2.54 - - 3.23 1.93 TSX:IVN Ivanhoe Mines Ltd. 0.67 (0.03) (4)% 1.36 0.62
TSX:AGI Alamos Gold, Inc. 4.52 (0.51) (10)% 7.25 3.90 NasdaqGS:KALU Kaiser Aluminum Corporation 83.49 2.20 3% 88.92 68.42
NYSE:AA Alcoa Inc. 9.06 0.13 1% 17.75 7.97 TSX:K Kinross Gold Corporation 2.38 (0.26) (10)% 4.48 1.79
NasdaqGS:ARLP Alliance Resource Partners LP 20.97 (0.47) (2)% 48.50 19.95 TSX:KGI Kirkland Lake Gold Inc. 5.23 (0.32) (6)% 6.88 2.79
TSX:ALS Altius Minerals Corp. 11.76 (0.81) (6)% 15.47 9.86 TSX:LSG Lake Shore Gold Corp. 1.05 (0.11) (9)% 1.38 0.70
NYSE:ACH Aluminum Corporation Of China Limited 8.08 0.05 1% 17.44 7.20 TSX:LUC Lucara Diamond Corp. 1.67 0.02 1% 2.45 1.42
NYSE:AU AngloGold Ashanti Ltd. 7.10 (1.34) (16)% 13.12 5.64 TSX:LUN Lundin Mining Corporation 4.06 (0.35) (8)% 6.46 3.68
NYSE:ACI Arch Coal Inc. 1.68 0.18 12% 29.30 1.00 TSX:MAG MAG Silver Corp. 8.93 (0.44) (5)% 11.00 6.90
TSX:AKG Asanko Gold Inc. 2.11 (0.12) (5)% 2.55 1.52 TSX:MDI Major Drilling Group International Inc. 4.49 0.34 8% 7.49 3.75
TSX:BTO B2Gold Corp. 1.37 (0.04) (3)% 2.88 1.32 NYSE:MTRN Materion Corporation 31.42 1.27 4% 41.85 28.83
TSX:ABX Barrick Gold Corporation 9.36 (0.69) (7)% 16.54 7.89 NYSE:NRP Natural Resource Partners LP 1.80 0.14 8% 13.83 1.61
NYSE:BHP BHP Billiton Limited 30.59 (2.30) (7)% 60.33 30.15 TSX:NSU Nevsun Resources Ltd. 3.74 (0.17) (4)% 5.35 3.41
NYSE:BBL BHP Billiton plc 29.47 (2.78) (9)% 53.97 29.19 TSX:NGD New Gold, Inc. 3.07 (0.17) (5)% 6.04 2.52
TSX:CCO Cameco Corporation 16.79 (1.73) (9)% 22.46 15.50 NYSE:NEM Newmont Mining Corporation 17.49 (1.97) (10)% 27.90 15.39
TSX:CG Centerra Gold Inc. 7.09 (0.27) (4)% 8.67 4.53 TSX:NG NovaGold Resources Inc. 4.32 (0.40) (8)% 5.23 2.87
NasdaqGS:CENX Century Aluminum Co. 4.41 0.79 22% 31.75 3.19 TSX:OGC OceanaGold Corporation 2.38 (0.12) (5)% 3.15 1.70
TSX:CGG China Gold International Resources Corp Ltd 1.80 0.05 3% 2.74 1.30 TSX:OR Osisko Gold Royalties Ltd. 13.69 0.11 1% 18.85 12.39
NYSE:CLD Cloud Peak Energy Inc. 3.73 0.76 26% 13.96 2.41 TSX:PAA Pan American Silver Corp. 9.12 (0.80) (8)% 15.06 7.77
NYSE:CDE Coeur Mining, Inc. 2.52 (0.18) (7)% 7.45 2.52 NYSE:BTU Peabody Energy Corporation 14.64 1.85 14% 179.40 11.75
NYSE:BVN Compañía de Minas Buenaventura S.A.A. 5.60 (0.81) (13)% 12.51 5.73 TSX:PG Premier Gold Mines Limited 2.18 (0.22) (9)% 2.92 1.61
NYSE:CMP Compass Minerals International Inc. 82.43 1.19 1% 95.68 77.13 TSX:PVG Pretium Resources Inc. 7.01 (0.82) (10)% 9.05 5.02
NYSE:CNX CONSOL Energy Inc. 8.06 1.40 21% 42.26 6.38 TSX:P Primero Mining Corp. 2.73 (0.28) (9)% 6.06 2.64
NYSE:CSTM Constellium N.V 7.84 4.07 108% 22.18 3.38 NasdaqGS:GOLD Randgold Resources Limited 59.41 (7.46) (11)% 85.84 54.88
TSX:DGC Detour Gold Corporation 12.84 (1.70) (12)% 16.86 6.72 NYSE:RIO Rio Tinto plc 34.49 (2.02) (6)% 50.07 31.97
TSX:DDC Dominion Diamond Corporation 13.82 (0.01) (0)% 24.60 12.81 NasdaqGS:RGLD Royal Gold, Inc. 35.66 (12.18) (25)% 77.20 39.20
TSX:ELD Eldorado Gold Corporation 4.37 (0.20) (4)% 9.68 3.26 TSX:RMX Rubicon Minerals Corporation 0.17 (0.41) (71)% 1.63 0.19
TSX:FR First Majestic Silver Corp. 3.99 (0.33) (8)% 8.55 3.54 TSX:SSL Sandstorm Gold Ltd. 3.53 0.10 3% 5.30 2.84
TSX:FM First Quantum Minerals Ltd. 6.77 (0.21) (3)% 20.05 4.52 TSX:SMF SEMAFO Inc. 2.79 (0.18) (6)% 4.49 2.46
TSX:FVI Fortuna Silver Mines Inc. 3.18 (0.23) (7)% 6.30 2.65 TSX:S Sherritt International Corporation 0.90 0.08 10% 3.25 0.70
TSX:FNV Franco-Nevada Corporation 61.19 (5.13) (8)% 74.10 49.96 NYSE:SBGL Sibanye Gold Limited 5.45 (1.08) (17)% 11.56 4.07
NYSE:FCX Freeport-McMoRan Inc. 10.72 (1.05) (9)% 29.92 7.76 TSX:SSO Silver Standard Resources Inc. 7.69 (1.32) (15)% 10.56 4.86
NasdaqGS:GSM Globe Specialty Metals, Inc. 11.48 (1.14) (9)% 21.99 11.78 TSX:SLW Silver Wheaton Corp. 16.62 (1.15) (6)% 29.86 14.62
NYSE:GFI Gold Fields Ltd. 2.45 (0.08) (3)% 6.01 2.35 NYSE:SCCO Southern Copper Corp. 26.90 (0.86) (3)% 33.31 23.41
TSX:G Goldcorp Inc. 15.25 (1.48) (9)% 30.95 15.98 NYSE:SWC Stillwater Mining Company 9.07 (0.28) (3)% 15.37 8.36
TSX:GUY Guyana Goldfields Inc. 2.95 (0.31) (10)% 4.48 2.19 TSX:THO Tahoe Resources Inc. 10.02 (0.90) (8)% 20.08 9.66
NYSE:HMY Harmony Gold Mining Company Limited 0.67 (0.01) (1)% 3.18 0.57 TSX:TCK.B Teck Resources Limited 7.11 (0.55) (7)% 20.58 5.87
NYSE:HL Hecla Mining Co. 1.92 (0.15) (7)% 3.54 1.77 TSX:TXG Torex Gold Resources Inc 1.18 (0.06) (5)% 1.65 0.85
NYSE:HCLP Hi-Crush Partners LP 8.41 2.63 45% 50.00 5.05 TSX:TRQ Turquoise Hill Resources Ltd. 3.80 0.26 7% 5.80 3.17
NasdaqGS:ZINC Horsehead Holding Corp. 2.86 0.02 1% 16.77 2.23 NYSE:VEDL Vedanta Limited 5.61 (0.37) (6)% 16.18 4.59
TSX:HBM HudBay Minerals, Inc. 6.92 0.13 2% 12.61 4.82 NasdaqGM:WLB Westmoreland Coal Co. 7.60 0.44 6% 40.99 6.70
TSX:YRI Yamana Gold, Inc. 2.40 (0.46) (16)% 5.79 1.89
NYSE:YZC Yanzhou Coal Mining Co. Ltd. 4.94 0.15 3% 12.24 4.28
52Wk1Wk 52Wk 1Wk

The Weekly Dig 11/6/15
Haywood Mining [email protected] Page 19
Upcoming Macroeconomic News
Source: Bloomberg
Date Event Period Survey Prior
Relevance
(%) Date Event Period Survey Prior
Relevance
(%)
United States Canada
11/09/2015 Labor Market Conditions Index Oct -- 0 8 11/09/2015 Housing Starts Oct -- 230.7k 80
11/09/2015 MBA Mortgage Foreclosures 3Q -- 2.09% 23 11/09/2015 Bloomberg Nanos Confidence 6-Nov -- 57.9 2
11/09/2015 Mortgage Delinquencies 3Q -- 5.30% 32 11/12/2015 New Housing Price Index MoM Sep -- 0.30% 66
11/10/2015 NFIB Small Business Optimism Oct 96.4 96.1 62 11/12/2015 New Housing Price Index YoY Sep -- 1.30% 15
11/10/2015 Import Price Index MoM Oct -0.10% -0.10% 78 11/13/2015 Teranet/National Bank HPI YoY Oct -- 5.60% 22
11/10/2015 Import Price Index YoY Oct -9.30% -10.70% 34 11/13/2015 Teranet/National Bank HP Index Oct -- 177.09 12
11/10/2015 Wholesale Inventories MoM Sep 0.00% 0.10% 81 11/13/2015 Teranet/National Bank HPI MoM Oct -- 0.60% 24
11/10/2015 Wholesale Trade Sales MoM Sep 0.10% -1.00% 9 11/13/2015 Bloomberg Nov. Canada Economic 0
11/11/2015 MBA Mortgage Applications 6-Nov -- -0.80% 92
11/12/2015 Initial Jobless Claims 7-Nov 270k 276k 98
11/12/2015 Continuing Claims 31-Oct 2110k 2163k 69
11/12/2015 Bloomberg Consumer Comfort 8-Nov -- 41.1 65
11/12/2015 JOLTS Job Openings Sep 5370 5370 21
11/12/2015 Monthly Budget Statement Oct -$130.0b -- 76
11/13/2015 Retail Sales Advance MoM Oct 0.30% 0.10% 91
11/13/2015 Retail Sales Ex Auto MoM Oct 0.40% -0.30% 64
11/13/2015 Retail Sales Ex Auto and Gas Oct 0.40% 0.00% 61
11/13/2015 Retail Sales Control Group Oct 0.40% -0.10% 15
11/13/2015 PPI Final Demand MoM Oct 0.20% -0.50% 86
11/13/2015 PPI Ex Food and Energy MoM Oct 0.10% -0.30% 68
11/13/2015 PPI Ex Food, Energy, Trade MoM Oct -- -0.30% 5
11/13/2015 PPI Final Demand YoY Oct -1.20% -1.10% 69
11/13/2015 PPI Ex Food and Energy YoY Oct 0.50% 0.80% 67
11/13/2015 PPI Ex Food, Energy, Trade YoY Oct -- 0.50% 3
11/13/2015 Bloomberg Nov. United States 0
11/13/2015 Business Inventories Sep 0.00% 0.00% 39
11/13/2015 U. of Mich. Sentiment Nov P 91.5 90 94
11/13/2015 U. of Mich. Current Conditions Nov P -- 102.3 6
11/13/2015 U. of Mich. Expectations Nov P -- 82.1 6
11/13/2015 U. of Mich. 1 Yr Inflation Nov P -- 2.70% 4
11/13/2015 U. of Mich. 5-10 Yr Inflation Nov P -- 2.50% 7
11/06/2015 Change in Household Employment Oct -- -- 21

The Weekly Dig 11/6/15
Haywood Mining [email protected] Page 20
Comparables Tables
Precious Metals Comparables – Consensus Estimates
Source: Capital IQ and Haywood Securities
Shares Market Working Enterprise
Company Symbol Price O/S Capitalization Cash Capital Debt Value 2015E 2016E Number of
(millions) (millions) (millions) (millions) (millions) (millions) CFPS CFPS Estimates 2015E 2016E 2015E 2016E 2015E 2016E
Senior Precious Metals Producers
Agnico Eagle Mines Limited TSX:AEM C$ 33.43 217.4 US$ 5,464 US$ 240 US$ 653 US$ 1,203 US$ 6,014 US$ 3.09 US$ 3.12 16 8.1x 8.1x 8.9x 8.9x 7.8x 7.8x
AngloGold Ashanti Ltd. NYSE:AU C$ 9.17 405.2 US$ 2,792 US$ 461 US$ 1,528 US$ 3,651 US$ 4,915 US$ 2.57 US$ 2.64 7 2.7x 2.6x 4.7x 4.6x 4.0x 4.1x
Barrick Gold Corporation TSX:ABX C$ 9.38 1164.8 US$ 8,214 US$ 3,317 US$ 5,114 US$ 11,283 US$ 14,383 US$ 2.08 US$ 2.04 11 3.4x 3.5x 5.9x 6.1x 4.3x 4.2x
Compañía de Minas Buenaventura S.A.A. NYSE:BVN C$ 7.41 254.2 US$ 1,416 US$ 115 US$ 8 - US$ 1,408 US$ 0.52 US$ 0.77 2 10.7x 7.2x 10.7x 7.2x 3.7x 3.5x
Eldorado Gold Corporation TSX:ELD C$ 4.33 715.7 US$ 2,330 US$ 405 US$ 456 US$ 589 US$ 2,462 US$ 0.30 US$ 0.40 13 10.8x 8.1x 11.4x 8.6x 8.2x 7.6x
Fresnillo PLC LSE:FRES C$ 14.17 736.9 US$ 7,852 US$ 476 US$ 1,079 US$ 797 US$ 7,570 US$ 0.60 US$ 0.75 4 17.7x 14.3x 17.1x 13.7x 13.2x 9.2x
Gold Fields Ltd. NYSE:GFI C$ 3.23 777.3 US$ 1,889 US$ 415 US$ 386 US$ 1,817 US$ 3,319 US$ 0.76 US$ 0.98 6 3.2x 2.5x 5.6x 4.3x 3.8x 3.4x
Goldcorp Inc. TSX:G C$ 15.34 830.0 US$ 9,572 US$ 330 US$ 470 US$ 2,522 US$ 11,624 US$ 1.68 US$ 2.00 14 6.9x 5.8x 8.3x 7.0x 6.4x 6.3x
Kinross Gold Corporation TSX:K C$ 2.36 1146.4 US$ 2,034 US$ 1,118 US$ 2,017 US$ 1,987 US$ 2,004 US$ 0.65 US$ 0.71 15 2.7x 2.5x 2.7x 2.5x 2.5x 2.4x
Newcrest Mining Limited ASX:NCM C$ 11.18 765.8 US$ 6,436 US$ 199 US$ 555 US$ 3,093 US$ 8,974 US$ 1.21 US$ 1.18 6 7.0x 7.1x 9.7x 10.0x 7.8x 7.4x
Newmont Mining Corporation NYSE:NEM C$ 23.33 529.1 US$ 9,281 US$ 2,989 US$ 3,504 US$ 6,085 US$ 11,862 US$ 4.36 US$ 3.67 10 4.0x 4.8x 5.1x 6.1x 4.0x 4.6x
Randgold Resources Limited LSE:RRS C$ 79.61 93.2 US$ 5,579 US$ 169 US$ 389 US$ 3 US$ 5,193 US$ 3.56 US$ 4.84 6 16.8x 12.4x 15.6x 11.5x 13.2x 10.3x
Yamana Gold, Inc. TSX:YRI C$ 2.40 946.6 US$ 1,708 US$ 249 US$ 186 US$ 1,862 US$ 3,384 US$ 0.47 US$ 0.64 13 3.9x 2.8x 7.6x 5.6x 5.5x 4.9x
Group Average - Senior Producers 7.5x 6.3x 8.7x 7.4x 6.5x 5.8x
Group Average - Senior Producers (excluding high/low) 7.0x 5.9x 8.5x 7.3x 6.2x 5.7x
Intermediate Precious Metals Producers
Acacia Mining plc LSE:ACA C$ 3.42 410.1 US$ 1,054 US$ 287 US$ 439 - US$ 615 US$ 0.43 US$ 0.70 10 6.0x 3.7x 3.5x 2.2x 3.3x 2.0x
Alacer Gold Corp. TSX:ASR C$ 2.51 291.0 US$ 549 US$ 369 US$ 420 - US$ 129 US$ 0.39 US$ 0.22 9 4.8x 8.4x 1.1x 2.0x 1.1x 1.9x
Alamos Gold Inc. TSX:AGI C$ 4.51 255.5 US$ 866 US$ 403 US$ 494 US$ 313 US$ 685 US$ 0.37 US$ 0.64 11 9.1x 5.3x 7.2x 4.2x 8.5x 3.9x
B2Gold Corp. TSX:BTO C$ 1.37 926.7 US$ 954 US$ 110 US$ 137 US$ 396 US$ 1,214 US$ 0.18 US$ 0.24 13 5.8x 4.4x 7.4x 5.6x 7.2x 5.3x
Centamin Plc LSE:CEY C$ 1.24 1146.1 US$ 1,069 US$ 175 US$ 293 - US$ 776 US$ 0.16 US$ 0.19 6 6.0x 5.0x 4.3x 3.6x 4.4x 3.8x
Centerra Gold Inc. TSX:CG C$ 7.06 236.7 US$ 1,256 US$ 537 US$ 725 - US$ 531 US$ 1.40 US$ 0.97 3 3.8x 5.4x 1.6x 2.3x 1.7x 2.0x
Detour Gold Corporation TSX:DGC C$ 12.80 170.7 US$ 1,643 US$ 133 US$ 189 US$ 425 US$ 1,878 US$ 0.90 US$ 1.31 14 10.7x 7.4x 12.2x 8.4x 12.2x 7.9x
Dundee Precious Metals Inc. TSX:DPM C$ 1.63 140.6 US$ 172 US$ 17 US$ 49 US$ 134 US$ 257 US$ 0.50 US$ 0.53 3 2.4x 2.3x 3.6x 3.4x 3.4x 3.2x
Harmony Gold Mining Company Limited NYSE:HMY C$ 0.93 435.1 US$ 305 US$ 108 US$ 124 US$ 299 US$ 479 US$ 0.18 US$ 0.24 5 4.0x 2.9x 6.2x 4.5x 4.3x 2.6x
Hecla Mining Co. NYSE:HL C$ 2.54 378.1 US$ 722 US$ 174 US$ 166 US$ 501 US$ 1,058 US$ 0.20 US$ 0.33 5 9.3x 5.8x 13.7x 8.5x 10.8x 7.1x
IAMGOLD Corp. TSX:IMG C$ 1.97 391.4 US$ 580 US$ 633 US$ 807 US$ 628 US$ 401 US$ 0.36 US$ 0.44 13 4.1x 3.4x 2.8x 2.3x 2.2x 2.0x
New Gold, Inc. TSX:NGD C$ 3.08 509.2 US$ 1,179 US$ 385 US$ 778 US$ 787 US$ 1,188 US$ 0.49 US$ 0.49 13 4.7x 4.7x 4.8x 4.8x 4.8x 4.2x
Nord Gold N.V. LSE:NORD C$ 3.73 371.2 US$ 1,041 US$ 399 US$ 620 US$ 939 US$ 1,360 US$ 1.23 US$ 0.77 2 2.3x 3.7x 3.0x 4.8x 2.6x 3.3x
SEMAFO Inc. TSX:SMF C$ 2.80 294.3 US$ 619 US$ 131 US$ 145 US$ 59 US$ 534 US$ 0.46 US$ 0.42 13 4.6x 5.0x 4.0x 4.3x 3.5x 3.8x
Group Average - Intermediate Producers 5.5x 4.8x 5.4x 4.3x 5.0x 3.8x
Group Average - Intermediate Producers (excluding high/low) 5.4x 4.7x 5.1x 4.2x 4.7x 3.6x
Junior Precious Metals Producers
Argonaut Gold Inc. TSX:AR C$ 1.26 155.3 US$ 147 US$ 43.7 US$ 101.3 US$ 1.6 US$ 47.4 US$ 0.28 US$ 0.31 5 3.4x 3.0x 1.1x 1.0x 1.4x 0.9x
ATNA Resources Ltd. TSX:ATN C$ 0.06 209.8 US$ 9 US$ 1.1 US$ (10.7) US$ 0.8 US$ 20.2 - - 0 - - - - - -
Endeavour Mining Corporation TSX:EDV C$ 0.61 413.8 US$ 190 US$ 52.7 US$ 52.4 US$ 264.6 US$ 402.0 US$ 0.34 US$ 0.26 6 1.4x 1.8x 2.9x 3.8x 2.1x 1.8x
Golden Star Resources, Ltd. TSX:GSC C$ 0.27 259.9 US$ 53 US$ 27.7 US$ (88.6) US$ 90.1 US$ 231.5 (US$ 0.07) (US$ 0.08) 3 - - - - - 61.3x
Highland Gold Mining Ltd. AIM:HGM C$ 1.06 325.2 US$ 260 US$ 39.8 US$ 33.2 US$ 194.0 US$ 420.6 US$ 0.32 US$ 0.35 2 2.5x 2.3x 4.1x 3.7x 3.2x 2.9x
Kirkland Lake Gold Inc. TSX:KGI C$ 5.22 80.7 US$ 317 US$ 62.3 US$ 59.6 US$ 83.5 US$ 340.6 US$ 0.83 US$ 0.84 8 4.7x 4.7x 5.1x 5.0x 6.1x 4.1x
Lake Shore Gold Corp. TSX:LSG C$ 1.04 456.3 US$ 357 US$ 65.1 US$ 51.8 US$ 68.5 US$ 373.5 US$ 0.17 US$ 0.19 7 4.7x 4.2x 4.9x 4.4x 4.9x 4.2x
Luna Gold Corp. TSX:LGC C$ 0.05 274.6 US$ 10 US$ 13.6 US$ 20.0 US$ 42.8 US$ 33.2 US$ 0.03 (US$ 0.01) 1 1.3x - 4.0x - - -
McEwen Mining Inc. TSX:MUX C$ 1.07 300.5 US$ 242 US$ 31.8 US$ 30.0 US$ 0.0 US$ 211.8 - - 0 - - - - - -
Newmarket Gold Inc. TSX:NMI C$ 1.48 300.5 US$ 334 US$ 37.2 US$ 22.6 US$ 0.0 US$ 311.7 US$ 0.58 US$ 0.61 5 1.9x 1.8x 1.8x 1.7x 3.3x 3.3x
OceanaGold Corporation ASX:OGC C$ 2.45 602.9 US$ 1,111 US$ 45.9 US$ 72.1 US$ 77.8 US$ 1,116.8 US$ 0.55 US$ 0.37 11 3.4x 5.0x 3.4x 5.0x 3.2x 3.3x
Primero Mining Corp. TSX:P C$ 2.70 162.5 US$ 330 US$ 43.1 US$ 18.2 US$ 63.5 US$ 375.2 US$ 0.49 US$ 0.70 12 4.1x 2.9x 4.7x 3.3x 3.7x 2.9x
Perseus Mining Limited TSX:PRU C$ 0.33 529.3 US$ 129 US$ 79.8 US$ 136.7 US$ 0.0 US$ (7.4) US$ 0.11 US$ 0.09 2 2.2x 2.6x - - - -
Richmont Mines Inc. TSX:RIC C$ 3.88 58.1 US$ 169 US$ 57.1 US$ 50.2 US$ 4.4 US$ 123.5 US$ 0.43 US$ 0.50 5 6.8x 5.9x 5.0x 4.3x 4.9x 3.9x
Teranga Gold Corporation TSX:TGZ C$ 0.50 392.0 US$ 147 US$ 29.9 US$ 30.3 US$ 13.2 US$ 130.3 US$ 0.16 US$ 0.19 8 2.3x 2.0x 2.1x 1.8x 1.5x 1.3x
Timmins Gold Corp. TSX:TMM C$ 0.21 315.3 US$ 50 US$ 10.4 US$ (6.1) US$ 0.1 US$ 56.0 US$ 0.03 US$ 0.07 7 5.6x 2.4x 6.3x 2.7x - 2.6x
Group Average - Junior Producers 3.4x 3.2x 3.8x 3.3x 3.4x 7.7x
Group Average - Junior Producers (excluding high/low) 3.1x 2.5x 3.2x 1.7x 2.5x 2.8x
All data sourced from Capital IQ
P/CF Ratio EV/CF Ratio EV/EBITDA Ratio

The Weekly Dig 11/6/15
Haywood Mining [email protected] Page 21
Other Precious Metals Comparables – Consensus Estimates
Source: Capital IQ and Haywood Securities
Shares Market Working Enterprise
Company Symbol Price O/S Capitalization Cash Capital Debt Value 2015E 2016E Number of
(millions) (millions) (millions) (millions) (millions) (millions) CFPS CFPS Estimates 2015E 2016E 2015E 2016E 2015E 2016E
PGM Producers
Impala Platinum Holdings Ltd. JSE:IMP C$ 3.42 709.6 US$ 1,823 US$ 214 US$ 638 US$ 493 US$ 1,679 US$ 0.23 US$ 0.47 4 11.4x 5.5x 10.5x 5.1x 6.3x 7.3x
Lonmin plc LSE:LMI C$ 0.33 586.9 US$ 144 US$ 60 US$ 622 US$ 262 (US$ 216) US$ 0.09 US$ 0.20 6 2.8x 1.2x - - - -
Stillwater Mining Company NYSE:SWC C$ 12.06 121.0 US$ 1,097 US$ 460 US$ 553 US$ 255 US$ 799 US$ 0.76 US$ 1.02 2 11.9x 8.9x 8.7x 6.5x 7.2x 5.4x
North American Palladium Ltd. TSX:PDL C$ 4.00 58.1 US$ 175 US$ 12 US$ 26 - US$ 149 - - 0 - - - - - -
Group Average - PGM Producers 8.7x 5.2x 9.6x 5.8x 6.7x 6.4x
Group Average - PGM Producers (excluding high/low) 11.4x 5.5x 8.7x 5.1x 6.3x 5.4x
Silver Producers
Aurcana Corporation TSXV:AUN C$ 0.15 84.6 US$ 10 US$ 0 (US$ 20) US$ 19 US$ 49 - - 0 - - - - - -
Coeur Mining, Inc. NYSE:CDE C$ 3.38 137.0 US$ 348 US$ 206 US$ 347 US$ 528 US$ 529 US$ 0.58 US$ 0.73 4 4.4x 3.5x 6.7x 5.3x 5.4x 5.2x
Endeavour Silver Corp. TSX:EDR C$ 1.91 102.0 US$ 146 US$ 24 US$ 20 - US$ 126 US$ 0.35 US$ 0.30 5 4.1x 4.8x 3.5x 4.1x 3.1x 3.6x
First Majestic Silver Corp. TSX:FR C$ 3.96 155.5 US$ 463 US$ 40 (US$ 1) US$ 18 US$ 481 US$ 0.45 US$ 0.67 6 6.6x 4.4x 6.9x 4.6x 8.9x 6.1x
Fortuna Silver Mines Inc. TSX:FVI C$ 3.15 129.1 US$ 306 US$ 110 US$ 122 US$ 39 US$ 223 US$ 0.22 US$ 0.33 7 10.6x 7.1x 7.7x 5.2x 4.3x 3.6x
Hecla Mining Co. NYSE:HL C$ 2.54 378.1 US$ 722 US$ 174 US$ 166 US$ 501 US$ 1,058 US$ 0.20 US$ 0.33 5 9.3x 5.8x 13.7x 8.5x 10.8x 7.1x
Mandalay Resources Corp. TSX:MND C$ 0.76 410.4 US$ 234 US$ 50 US$ 25 US$ 2 US$ 212 US$ 0.15 US$ 0.15 5 3.8x 3.7x 3.4x 3.4x 3.2x 2.8x
Pan American Silver Corp. TSX:PAA C$ 9.20 151.7 US$ 1,049 US$ 275 US$ 470 US$ 21 US$ 600 US$ 0.38 US$ 0.75 5 18.1x 9.2x 10.4x 5.3x 6.4x 6.1x
Silver Standard Resources Inc. TSX:SSO C$ 7.53 80.8 US$ 457 US$ 308 US$ 373 US$ 205 US$ 289 US$ 0.81 US$ 0.79 6 7.0x 7.2x 4.4x 4.5x 3.1x 4.5x
Silvercorp Metals Inc. TSX:SVM C$ 0.94 170.4 US$ 120 US$ 75 US$ 44 - US$ 76 US$ 0.28 US$ 0.13 2 2.5x 5.4x 1.6x 3.4x 2.4x 4.1x
Tahoe Resources Inc. TSX:THO C$ 9.99 227.1 US$ 1,706 US$ 112 US$ 89 - US$ 1,617 US$ 0.80 US$ 1.03 11 9.4x 7.3x 8.9x 6.9x 8.1x 5.7x
Group Average - Silver Producers 7.6x 5.8x 6.7x 5.1x 5.6x 4.9x
Group Average - Silver Producers (excluding high/low) 6.9x 5.7x 6.5x 4.9x 5.3x 4.9x
Diamond Producers
Dominion Diamond Corporation NYSE:DDC C$ 13.79 85.2 US$ 884 US$ 344 US$ 695 US$ 23 US$ 212 US$ 3.72 US$ 1.83 4 2.8x 5.7x 0.7x 1.4x 0.6x 0.8x
Lucara Diamond Corp. TSX:LUC C$ 1.67 379.6 US$ 477 US$ 123 US$ 139 - US$ 338 US$ 0.24 US$ 0.22 5 5.3x 5.6x 3.8x 4.0x 2.4x 2.5x
Group Average - Diamond Producers 4.1x 5.6x 2.2x 2.7x 1.5x 1.7x
Royalty Companies
Anglo Pacific Group plc LSE:APF C$ 1.47 169.0 US$ 187 US$ 6 US$ 3 US$ 4 US$ 189 US$ 0.06 US$ 0.09 5 18.6x 11.9x 18.8x 12.0x 20.7x 11.9x
(Invalid Identifier) (Invalid Identifier)(Invalid Identifier)(Invalid Identifier) #VALUE! (Invalid Identifier) #VALUE! (Invalid Identifier) #VALUE! (Invalid Identifier)(Invalid Identifier)(Invalid Identifier) #VALUE! #VALUE! #VALUE! #VALUE! #VALUE! #VALUE!
Franco-Nevada Corporation TSX:FNV C$ 61.52 156.8 US$ 7,254 US$ 611 US$ 688 - US$ 6,566 US$ 1.97 US$ 2.18 11 23.5x 21.2x 21.3x 19.2x 19.4x 17.1x
(Invalid Identifier) (Invalid Identifier)(Invalid Identifier)(Invalid Identifier) #VALUE! (Invalid Identifier) #VALUE! (Invalid Identifier) #VALUE! (Invalid Identifier)(Invalid Identifier)(Invalid Identifier) #VALUE! #VALUE! #VALUE! #VALUE! #VALUE! #VALUE!
Osisko Gold Royalties Ltd. TSX:OR C$ 13.54 94.4 US$ 961 US$ 229 US$ 223 - US$ 738 US$ 0.30 US$ 0.38 5 33.9x 26.5x 26.0x 20.4x 47.5x 22.9x
Royal Gold, Inc. US:RGLD C$ 47.23 65.3 US$ 2,317 US$ 104 US$ 125 US$ 675 US$ 2,867 US$ 2.63 US$ 3.44 9 13.5x 10.3x 16.7x 12.8x 13.2x 9.3x
Sandstorm Gold Ltd. TSX:SSL C$ 3.56 127.0 US$ 340 US$ 52 US$ 52 - US$ 288 US$ 0.28 US$ 0.30 8 9.6x 8.9x 8.1x 7.5x 8.5x 7.8x
Silver Wheaton Corp. US:RGLD C$ 16.67 404.5 US$ 5,069 US$ 81 US$ 67 US$ 647 US$ 5,649 US$ 2.63 US$ 3.44 10 4.8x 3.6x 5.3x 4.1x 13.5x 10.0x
Group Average - Royalty Companies 17.3x 13.8x 16.0x 12.7x 20.4x 13.2x
Group Average - Royalty Companies (excluding high/low) #VALUE! #VALUE! #VALUE! #VALUE! #VALUE! #VALUE!
All data sourced from Capital IQ
P/CF Ratio EV/CF Ratio EV/EBITDA Ratio

The Weekly Dig 11/6/15
Haywood Mining [email protected] Page 22
Base Metals Comparables – Consensus Estimates
Shares Market Working Enterprise
Company Symbol Price O/S Capitalization Cash Capital Debt Value 2015E 2016E Number of
(millions) (millions) (millions) (millions) (millions) (millions) CFPS CFPS Estimates 2015E 2016E 2015E 2016E 2015E 2016E
Large-Cap Base Metals Producers
Anglo American plc LSE:AAL C$ 10.53 1401.8 US$ 11,101 US$ 7,033 US$ 11,169 US$ 18,125 US$ 18,057 US$ 3.09 US$ 3.15 8 2.6x 2.5x 4.2x 4.1x 3.4x 3.6x
Antofagasta plc LSE:ANTO C$ 10.31 985.9 US$ 7,645 US$ 3,220 US$ 2,775 US$ 1,976 US$ 6,846 US$ 0.94 US$ 1.03 8 8.2x 7.5x 7.4x 6.7x 5.4x 4.3x
BHP Billiton Limited ASX:BHP C$ 21.24 5321.3 US$ 84,961 US$ 6,806 US$ 3,516 US$ 28,649 US$ 110,094 US$ 3.06 US$ 2.61 6 5.2x 6.1x 6.8x 7.9x 4.7x 7.3x
First Quantum Minerals Ltd. TSX:FM C$ 6.86 689.0 US$ 3,553 US$ 289 US$ 1,639 US$ 5,503 US$ 7,417 US$ 1.05 US$ 1.60 17 4.9x 3.2x 10.3x 6.7x 10.1x 5.6x
Freeport-McMoRan Inc. NYSE:FCX C$ 14.30 1100.0 US$ 11,825 US$ 338 US$ 3,328 US$ 19,792 US$ 28,289 US$ 2.97 US$ 4.70 3 3.6x 2.3x 8.7x 5.5x 6.3x 4.1x
Glencore Plc LSE:GLEN C$ 2.32 14394.7 US$ 25,134 US$ 3,223 US$ 5,756 US$ 38,643 US$ 58,021 US$ 0.70 US$ 0.57 9 2.5x 3.1x 5.8x 7.1x 6.6x 6.7x
KGHM Polska Miedz Spólka Akcyjna WSE:KGH C$ 29.98 200.0 US$ 4,508 US$ 230 US$ 250 US$ 1,031 US$ 5,290 US$ 5.56 US$ 4.56 3 4.1x 4.9x 4.8x 5.8x 4.2x 4.5x
Rio T into plc LSE:RIO C$ 45.75 1806.5 US$ 62,132 US$ 11,550 US$ 6,292 US$ 20,672 US$ 76,512 US$ 5.18 US$ 5.15 12 6.6x 6.7x 8.2x 8.2x 5.9x 6.3x
Teck Resources Limited TSX:TCK.B C$ 7.17 576.2 US$ 3,123 US$ 1,110 US$ 1,883 US$ 6,901 US$ 8,141 US$ 2.30 US$ 2.37 17 2.3x 2.3x 6.1x 6.0x 5.0x 5.3x
Vale S.A. NYSE:VALE C$ 5.51 0.0 - US$ 4,583 US$ 7,483 US$ 28,640 US$ 21,157 US$ 0.98 US$ 1.15 10 4.2x 3.6x - - 2.9x 2.7x
Group Average - Large-Cap Producers 4.4x 4.2x 6.9x 6.5x 5.4x 5.0x
Group Average - Large-Cap Producers (excluding high/low) 4.2x 4.1x 6.5x 6.2x 5.2x 5.0x
Mid Tier Base Metals Producers
Capstone Mining Corp. TSX:CS C$ 0.59 382.0 US$ 168 US$ 109 US$ 173 US$ 324 US$ 318 US$ 0.19 US$ 0.32 17 2.3x 1.4x 4.4x 2.6x 4.1x 2.1x
Cliffs Natural Resources Inc. NYSE:CLF C$ 4.19 153.4 US$ 483 US$ 270 US$ 406 US$ 2,722 US$ 2,799 US$ 2.32 US$ 1.20 1 1.4x 2.6x 7.9x 15.2x 10.1x 10.1x
HudBay Minerals, Inc. TSX:HBM C$ 6.99 235.2 US$ 1,236 US$ 88 US$ 59 US$ 910 US$ 2,087 US$ 0.71 US$ 1.35 10 7.4x 3.9x 12.4x 6.6x 7.9x 4.4x
Imperial Metals Corp. TSX:III C$ 8.05 81.7 US$ 495 US$ 14 (US$ 59) US$ 646 US$ 1,200 (US$ 0.02) US$ 1.09 5 - 5.6x - 13.5x 19.8x 7.3x
KAZ Minerals plc LSE:KAZ C$ 2.01 446.1 US$ 674 US$ 1,460 US$ 1,133 US$ 2,805 US$ 2,346 US$ 0.12 US$ 0.36 5 13.1x 4.2x 45.7x 14.6x 17.3x 9.2x
Lundin Mining Corporation TSX:LUN C$ 4.08 719.6 US$ 2,207 US$ 550 US$ 661 US$ 983 US$ 2,529 US$ 0.90 US$ 0.83 18 3.4x 3.7x 3.9x 4.2x 3.5x 3.8x
MMG Limited HKSE:1208 C$ 0.30 5290.1 US$ 1,174 US$ 636 US$ 772 US$ 8,863 US$ 9,265 US$ 0.12 US$ 0.23 1 1.9x 1.0x 14.9x 7.7x 14.3x 6.2x
Nevsun Resources Ltd. TSX:NSU C$ 3.73 199.8 US$ 560 US$ 434 US$ 489 - US$ 71 US$ 0.49 US$ 0.32 7 5.7x 8.9x 0.7x 1.1x 0.6x 0.5x
Nyrstar NV ENXTBR:NYR C$ 2.20 327.5 US$ 541 US$ 310 (US$ 376) US$ 505 US$ 1,422 US$ 0.22 US$ 0.83 4 7.5x 2.0x 19.7x 5.2x 4.7x 3.2x
OZ Minerals Limited ASX:OZL C$ 4.27 303.5 US$ 973 US$ 315 US$ 467 - US$ 506 US$ 1.02 US$ 0.84 6 3.1x 3.8x 1.6x 2.0x 1.7x 1.8x
Sherritt International Corporation TSX:S C$ 0.90 293.9 US$ 199 US$ 279 US$ 464 US$ 1,552 US$ 1,287 US$ 0.19 US$ 0.28 4 3.5x 2.4x 22.6x 15.5x 10.8x 6.1x
Turquoise Hill Resources Ltd. TSX:TRQ C$ 3.81 2012.3 US$ 5,764 US$ 1,310 US$ 1,447 US$ 14 US$ 4,331 US$ 0.32 US$ 0.11 6 8.9x 25.2x 6.7x 18.9x 6.9x 14.0x
Vedanta Resources plc LSE:VED C$ 9.58 276.0 US$ 1,987 US$ 8,917 US$ 1,375 US$ 11,228 US$ 11,840 US$ 6.26 US$ 8.51 6 1.1x 0.8x 6.8x 5.0x 3.1x 4.6x
Western Areas Limited ASX:WSA C$ 2.35 233.4 US$ 412 US$ 150 US$ 51 - US$ 361 US$ 0.38 US$ 0.40 6 4.6x 4.4x 4.1x 3.9x 3.3x 3.4x
Group Average - Mid Tier Producers 4.9x 5.0x 11.7x 8.3x 7.7x 5.5x
Group Average - Mid Tier Producers (excluding high/low) 4.2x 3.7x 8.8x 8.0x 7.3x 5.2x
Small Cap Base Metals Producers
Amerigo Resources Ltd. TSX:ARG C$ 0.30 173.6 US$ 39 US$ 10 US$ 6 US$ 52 US$ 84 (US$ 0.02) US$ 0.23 US$ 2.00 - 1.0x - 2.1x - 2.6x
Copper Mountain Mining Corporation TSX:CUM C$ 0.55 118.8 US$ 49 US$ 18 US$ 13 US$ 280 US$ 316 US$ 0.28 US$ 0.39 11 1.5x 1.1x 9.5x 6.8x 6.7x 4.8x
Taseko Mines Ltd. TSX:TKO C$ 0.59 221.8 US$ 98 US$ 61 US$ 39 US$ 206 US$ 265 US$ 0.14 US$ 0.21 9 3.1x 2.2x 8.5x 5.8x 7.3x 5.2x
Thompson Creek Metals Company Inc. TSX:TCM C$ 0.61 221.2 US$ 101 US$ 211 US$ 191 US$ 831 US$ 742 US$ 0.17 US$ 0.36 9 2.7x 1.3x 19.4x 9.4x 6.0x 4.7x
Trevali Mining Corporation TSX:TV C$ 0.50 324.7 US$ 124 US$ 20 US$ 29 US$ 54 US$ 150 US$ 0.05 US$ 0.18 4 6.9x 2.1x 8.5x 2.5x 9.3x 2.1x
Group Average - Small Cap Producers 3.6x 1.5x 11.5x 5.3x 7.3x 3.9x
Group Average - Small Cap Producers (excluding high/low) 2.4x 1.5x 8.8x 5.1x 6.6x 4.0x
All data sourced from Capital IQ
P/CF Ratio EV/CF Ratio EV/EBITDA Ratio

The Weekly Dig 11/6/15
Haywood Mining [email protected] Page 23
Iron Comparables – Consensus Estimates
Bloomberg Shares Market Daily Enterprise
Company (T icker) Share Price
Consensus
Target
Implied
Return β
Outstanding
(millions)
Capitalization
(millions)
Volume
(millions)
Weekly
Liquidity WACC
Debt
(millions)
Value
(millions) 2015 2016 2017 2015 2016 2017 2015 2016 2017 2015 2016 2017
Diversified Mining Houses
VALE SA (VALE3-BZ) R$ 15.67 R$ 22.63 44.4% 0.97 3,217 R$ 76,888 7.3 1.0% 19.1% R$ 76,517 R$ 182,246 3.83 4.29 5.95 4.1x 3.7x 2.6x 18.6x 7.7x 6.6x 6.2x 4.9x
BHP BILLITON (BHP-AU) A$ 22.70 A$ 27.39 20.7% 1.32 3,212 A$ 116,913 11.4 1.8% 9.5% A$ 31,170 A$ 112,524 4.54 3.46 3.60 5.0x 6.6x 6.3x 11.6x 29.3x 17.4x 4.7x 7.2x 6.3x
RIO TINTO (RIO-AU) A$ 50.80 A$ 57.45 13.1% 1.09 424 A$ 89,019 2.6 2.7% 7.4% A$ 25,248 A$ 84,875 7.36 7.06 8.04 6.9x 7.2x 6.3x 13.9x 16.0x 12.5x 6.6x 7.0x 6.2x
Group Average - Diversifed Mining Avg. -> 5.3x 5.8x 5.1x 12.7x 21.3x 12.5x 6.0x 6.8x 5.8x
Producers
KUMBA IRON (KIO-SJE) ZAR 5,831 ZAR 8,700 49.2% 1.42 322 ZAR 18,781 1.1 1.9% 10.8% ZAR 9,593 ZAR 31,167 3469 2184 3139 1.7x 2.7x 1.9x 4.7x 7.9x 6.1x 2.6x 3.8x 3.1x
FORTESCUE METALS (FMG-AU) A$ 2.23 A$ 2.15 (3.5)% 1.48 3,114 A$ 6,944 25.7 4.3% 6.3% A$ 9,569 A$ 12,091 0.59 0.68 0.65 3.8x 3.3x 3.4x 14.8x 13.9x 20.3x 5.0x 4.9x 5.1x
CLIFFS NATURAL (CLF-US) US$ 3.15 US$ 2.94 (6.8)% 1.27 153 US$ 483 5.0 17.6% 3.9% US$ 3,059 US$ 3,914 0.74 0.97 1.44 4.3x 3.2x 2.2x 13.4x 14.1x 12.3x
MMX MINERACAO (MMXM3-BRZ) R$ 0.29 0.50 162 R$ 47 0.3 0.6% 18.9% R$ 99 R$ 165
FERREXPO PLC (FXPO-LSE) GBp 32 GBp 53.58 66.1% 1.11 589 GBp 190 0.8 0.9% 4.8% GBp 1,305 GBp 942 21.66 12.93 11.09 1.5x 2.5x 2.9x 2.7x 6.0x 5.3x 3.6x 4.7x 5.3x
MOUNT GIBSON (MGX-AU) A$ 0.23 A$ 0.24 4.3% 0.59 1,091 A$ 251 2.8 1.3% 6.7% A$ 3 A$ 163 (0.05) (0.05) (0.04)
GRANGE RESOURCES (GRR-AU) A$ 0.12 A$ 0.10 (13.0)% 0.91 1,157 A$ 133 0.7 0.6% 8.4% A$ 1 A$(2) 0.07 0.03 0.02 1.7x 4.1x 5.2x 3.4x 7.7x 12.8xNORTHERN IRON (NFE-AU) A$ 0.01 0.55 484 A$ 4 0.4 0.2% 2.9% A$ 66 A$ 80
BC IRON (BCI-AU) A$ 0.27 A$ 0.35 30.9% 1.53 196 A$ 53 0.7 0.9% 12.0% A$ 6 A$(8) 0.01 0.09 0.03 27.0x 3.1x 9.0x 0.2x
Group Average - Producers Avg. -> 2.6x 3.2x 3.1x 6.4x 8.9x 11.1x 6.1x 6.9x 6.5x
Advanced Development / Exploration (Select Group)
SUNDANCE RESOURCES (SDL-AU) A$ 0.02 0.92 3,110 A$ 51.3 3.0 0.4% 6.1% A$ 38 A$ 91
NEW MILLENNIUM (NML-T) C$ 0.07 C$ 0.10 53.8% 0.70 181 C$ 11.8 0.1 0.1% 8.1% C$ 0 C$(8) (0.02) (0.01) 1.2x 0.9x
ALDERON IRON (ADV-T) C$ 0.15 C$ 0.23 51.1% 1.74 132 C$ 19.8 0.0 0.2% 11.9% C$ 19 C$ 73 (0.07) (0.02) (0.04)
ZANAGA IRON (ZIOC-LSE) GBp 3 1.06 279 GBp 7.1 0.1 0.5% 10.0% GBp 0 GBp 1
CENTURY IRON (FER-T) C$ 0.25 0.29 99 C$ 24.7 0.0 0.0% 4.4% C$ 0 C$ 15
CHAMPION IRON (CIA-T) C$ 0.19 198 C$ 37.7 0.1 0.3% 9.2% C$ 0 C$ 34 (0.01) (0.02) (0.03)
ADRIANA RESOURCES (ADI-V) C$ 0.10 1.10 158 C$ 15.0 0.1 0.1% 11.7% C$ 0 C$(28)
IMX RESOURCES (IXR-AU) A$ 0.01 0.80 1,159 A$ 8.1 4.9 1.2% 8.2% A$ 0 A$ 11
BLACK IRON (BKI-T) C$ 0.03 (0.16) 161 C$ 4.8 0.3 0.1% 0.2% C$ 0 C$(5) (0.02) (0.07) (0.07) 0.7x 0.5x 0.5x
OCEANIC IRON (FEO-T) C$ 0.08 (0.93) 35 C$ 2.8 0.0 0.0% -6.4% C$ 0 C$ 1
MACARTHUR MINERALS (MMS-T) C$ 0.03 2.02 82 C$ 2.0 0.1 0.2% 7.3% C$ 0 C$ 0
Group Average - Developers / Explorers Avg. -> 0.9x 0.7x 0.5x
All data sourced from Bloomberg
EV/EBITDAP/EPSCFPS (LoC) P/CFPS

The Weekly Dig 11/6/15
Haywood Mining [email protected] Page 24
Uranium Comparables – Consensus Estimates
Bloomberg Shares Market Daily Enterprise
Company (T icker)
Share
Price
Consensus
Target
Implied
Return β
Outst.
(millions)
Capitalization
(millions)
Volume
(millions)
Weekly
Liquidity
Value
(millions)
Resource
(M lb)
USD
EV/lb
Resource 2015 2016 2017 2015 2016 2017 2015 2016 2017 2015 2016 2017
CAMECO CORP (CCO-T) C$ 16.97 C$ 23.95 41.1% 1.10 396 C$ 6,717 1.66 2.4% C$ 8,145 996.1 $6.15 1.20 2.01 2.20 14.1x 8.4x 7.7x 0.83 1.26 1.40 20.5x 13.4x 12.1x
PALADIN ENERGY (PDN-AU) A$ 0.26 A$ 0.31 21.4% 0.92 1,712 A$ 437 0.34 0.2% A$ 623 510.5 $0.92 (0.00) 0.03 0.05 9.4x 4.7x (0.01) 0.02 0.04 15.9x 6.5x
ENERGY RESOURCES (ERA-AU) C$ 0.38 C$ 0.06 (84)% 0.90 518 C$ 194 0.47 0.2% C$ -106 473.0 ($0.16) (0.01) 0.09 0.12 4.2x 3.2x (0.17) (0.00) 0.02 20.8x
ENERGY FUELS (EFR-T) C$ 3.74 C$ 9.91 165.0% 1.30 45 C$ 169 0.06 0.5% C$ 145 134.0 $0.81 0.67 0.18 5.6x 21.1x (0.26) (0.58)
UR-ENERGY INC (URE-T) C$ 0.72 C$ 2.10 191.7% 0.86 130 C$ 94 0.04 0.2% C$ 93 29.9 $2.34 0.02 0.03 0.04 45.0x 21.2x 18.5x (0.03) 0.01 90.0x
URANIUM ENERGY (UEC-AMEX) US$ 1.10 US$ 2.63 139.4% 0.96 99 US$ 109 0.70 2.4% US$ 118 89.3 $1.32 (0.20) (0.20) (0.02)
Group Average - Producers $1.90 29.6x 9.8x 11.0x 20.5x 39.8x 13.2x
DEEP YELLOW (DYL-AU) A$ 0.01 0.61 1,918 A$ 19 0.78 0.5% A$ 15 106.0 $0.10
DENISON MINES (DML-T) US$ 0.55 US$ 1.51 173.9% 1.47 518 US$ 285 1.12 1.1% US$ 191 204.3 $0.70 (0.03) (0.03) (0.01) (0.04) (0.03) (0.02)
FORSYS METALS (FSY-T) C$ 0.16 0.02 135 C$ 21 0.01 0.0% C$ 21 125.0 $0.13
UR-ENERGY INC (URE-T) C$ 0.72 C$ 2.10 191.7%
MEGA URANIUM (MGA-T) C$ 0.07 1.53 282 C$ 19 0.36 0.6% C$ 18 43.1 $0.32
LARAMIDE RESOURCES (LAM-T) C$ 0.15 C$ 0.60 300.0% 0.78 85 C$ 13 0.10 0.3% C$ 11 62.3 $0.14 (0.03) (0.03)
BANNERMAN RESOURCES (BMN-AU) A$ 0.04 0.66 388 A$ 16 0.22 0.2% A$ 22 169.6 $0.09
PLATEAU URANIUM (PLU-V) C$ 0.28 1.58 41 C$ 11 0.03 0.6% C$ 6 124.0 $0.04
TORO ENERGY (TOE-AU) A$ 0.07 A$ 0.09 28.6% 0.19 2,004 A$ 140 0.76 0.2% A$ 136 96.0 $1.00
ALLIANCE RESOURCES (AGS-AU) A$ 0.03 0.55 417 A$ 13 1.79 2.2% A$ 12 17.8 $0.49
PENINSULA ENERGY (PEN-AU) C$ 1.18 C$ 1.97 67.4% 0.80 174 C$ 205 0.23 0.5% C$ 176 110.6 $1.12
Group Average - Developers $0.44
FISSION URANIUM (FCU-T) C$ 0.61 C$ 1.94 217.3% 1.45 386 C$ 236 1.24 1.1% C$ 211 108.3 $1.46 (0.02) (0.01) (0.02) (0.01)
FISSION 3.0 (FUU-V) C$ 0.06 5.84 178 C$ 11 0.22 0.7% C$ 6
NEXGEN ENERGY (NXE-V) C$ 0.73 C$ 2.30 215.1% 0.8 254 C$ 185 1.28 2.1% C$ 158 (0.01) (0.01) (0.01) (0.01)
KIVALLIQ ENERGY (KIV-V) C$ 0.08 C$ 0.20 166.7% 0.82 217 C$ 16 0.12 0.1% C$ 14 20.0 $0.35 (0.01) (0.01) (0.01) (0.01)
AZINCOURT URANIUM (AAZ-V) C$ 0.06 0.51 10 C$ 1 0.01 0.3% C$ 0
ANATOLIA ENERGY (AEK-AU) A$ 0.06 0.77 312 A$ 19 0.53 A$ 14
URACAN RESOURCES (URC-V) C$ 0.01 0.77 72 C$ 0 0.08 0.2% C$ 0 44.0 $0.01
INVENTORY FUNDS
URANIUM PARTICIPATION (U-T) C$ 5.18 C$ 6.78 31.0% 0.54 117 C$ 604 0.23 0.9% C$ 590 (0.05) -
All data sourced from Bloomberg
PR
OD
UC
ER
SD
EV
ELO
PE
RS
EX
PLO
RE
RS
P/EPSCFPS (LoC) P/CFPS EPS (LoC)

The Weekly Dig 11/6/15
Haywood Mining [email protected] Page 25
Coal Comparables – Consensus Estimates
Large Cap USA Bloomberg Shares Market Daily Enterprise
Company (T icker) Share Price
Consensus
Target
Implied
Return β
Outstanding
(millions)
Capitalization
(millions)
Volume
(millions)
Weekly
Liquidity WACC
Debt
(millions)
Value
(millions) 2015 2016 2017 2015 2016 2017 2015 2016 2017 2015 2016 2017
Large Cap USA
ARCH COAL (ACI-US) US$ 1.66 US$ 2.80 68.7% (0.61) 21 US$ 35 3.6 64.3% 4.4% US$ 5,160 US$ 4,492 (5.83) (2.31) 0.41 4.1x 16.4x 18.3x 17.4x
PEABODY ENERGY (BTU-US) US$ 14.59 US$ 21.34 46.3% 0.69 19 US$ 271 1.2 41.9% 4.0% US$ 5,987 US$ 6,238 (19.60) 2.85 16.73 5.1x 0.9x 12.2x 10.2x 8.3x
CONSOL ENERGY (CNX-US) US$ 8.21 US$ 15.55 89.4% 1.18 229 US$ 1,881 8.0 28.4% 5.3% US$ 3,297 US$ 5,695 2.72 3.02 3.83 3.0x 2.7x 2.1x 78.9x 17.3x 7.3x 6.5x 5.5x
WALTER ENERGY (WLT-US) US$ 0.05 US$ 0.05 0.0% 1.05 81 US$ 4 0.5 3.4% 1.3% US$ 3,136 US$ 2,763
CLOUD PEAK (CLD-US) US$ 3.71 US$ 4.43 19.4% 1.41 61 US$ 227 2.1 16.8% 5.4% US$ 571 US$ 596 0.71 0.82 1.25 5.2x 4.5x 3.0x 5.1x 6.2x 6.5x
Group Average - Large Cap USA Avg. -> 4.1x 4.1x 2.5x 78.9x 17.3x 10.3x 10.3x 9.4x
Limitied Partnerships
ALLIANCE RESOURCE (ARLP-US) US$ 20.77 US$ 31.20 50.2% 0.79 74 US$ 1,541 0.3 1.7% 6.0% US$ 838 US$ 2,476 9.75 10.21 10.72 2.1x 2.0x 1.9x 6.8x 7.6x 10.1x 3.3x 3.5x 3.9x
NATURAL RESOURCE (NRP-US) US$ 1.76 US$ 2.25 27.8% 0.63 122 US$ 215 0.5 2.9% 4.4% US$ 1,475 US$ 1,618 1.60 1.70 1.85 1.1x 1.0x 1.0x 2.8x 2.8x 2.4x 5.9x 5.7x 5.5x
Group Average - Limited Partnerships Avg. -> 1.6x 1.5x 1.4x 4.8x 5.2x 6.3x 4.6x 4.6x 4.7x
Large Cap Non-North America
NEW HOPE (NHC-AU) A$ 1.92 A$ 1.99 3.5% 0.79 831 A$ 1,596 0.3 0.0% 8.1% A$ 0 A$ 530 0.12 0.15 0.16 15.5x 12.5x 11.8x 28.7x 23.4x 23.7x 4.9x 3.7x 3.3x
WHITEHAVEN COAL (WHC-AU) A$ 1.07 A$ 1.25 17.6% 1.25 1,026 A$ 1,093 4.4 1.1% 8.0% A$ 1,038 A$ 2,030 0.13 0.19 0.27 8.2x 5.5x 4.0x 27.3x 14.8x 8.1x 8.3x 7.1x 5.5x
BANPU PUBLIC (BANPU-SET) ฿ 20.90 ฿ 26.33 26.0% 1.31 2,582 ฿ 53,961 13.5 3.3% 6.0% ฿ 106,669 ฿ 159,129 4.96 4.96 5.58 4.2x 4.2x 3.7x 24.2x 13.5x 10.7x 10.8x 10.4x 10.0x
CHINA COAL (1898-HK) HK$ 3.56 HK$ 2.96 (16.8)% 1.09 4,107 HK$ 90,233 24.5 1.6% 5.7% HK$ 94,708 HK$ 172,057 0.37 0.49 0.64 7.9x 5.9x 4.6x 22.9x 19.6x 16.9x
CHINA SHENHUA (1088-HK) HK$ 13.10 HK$ 17.98 37.3% 1.13 3,399 HK$ 365,921 20.3 3.0% 7.1% HK$ 95,370 HK$ 402,219 2.54 2.79 2.92 4.2x 3.8x 3.7x 9.1x 8.9x 8.0x 6.2x 6.1x 5.7x
COAL OF (CZA-AU) A$ 0.05 A$ 0.12 116.7% (0.56) 1,927 A$ 104 0.0 0.0% -1.0% A$ 0 A$ 56
YANZHOU COAL (1171-HK) HK$ 3.92 HK$ 3.46 (11.7)% 1.58 1,958 HK$ 43,872 12.1 2.9% 3.8% HK$ 63,506 HK$ 77,115 0.91 0.95 1.00 3.5x 3.4x 3.2x 14.9x 15.4x 12.0x
Group Average - Large Cap Non-North-America Avg. -> 7.5x 6.3x 5.6x 20.0x 14.0x 10.2x 8.0x 10.1x 8.9x
Developer/Explorers
COMPLIANCE ENERGY (CEC-V) C$ 0.06 1.19 8 C$ 0.5 0.0 0.6% 12.1%
FORTUNE MINERALS (FT -T) C$ 0.03 0.24 227 C$ 6.8 0.2 0.6% 1.1% C$ 55 C$ 72
JAMESON RESOURCES (JAL-AU) A$ 0.04 0.65 209 A$ 7.7 0.0 0.0% 6.0% A$ 0 A$ 7
Group Average - Developers / Explorers Avg. ->
Allied Industry
SEDGMAN LTD (SDM-AU) A$ 0.80 A$ 0.98 21.9% 0.74 227 A$ 182 0.1 0.3% 7.7% A$ 2 A$ 73 0.10 0.11 0.11 7.8x 7.2x 7.5x 9.6x 8.8x 8.8x 2.2x 2.1x 2.1x
Group Average - Allied Industry Avg. -> 7.8x 7.2x 7.5x 9.6x 8.8x 8.8x 2.2x 2.1x 2.1x
Sundry Companies
ADARO ENERGY (ADRO-JKSE) ¥ 620 ¥ 758 22.3% 1.41 31,986 ¥ 19,831,296 50.0 0.5% 9.7% ¥ 1,881 ¥ 2,825 0.01 0.01 0.01 3.5x 3.8x 3.8x 7.5x 9.0x 9.0x 4.6x 5.1x 4.9x
BUMI RESOURCES (BUMI-JKSE) ¥ 50 ¥ 50 0.0% 1.35 36,627 ¥ 1,831,351 92.5 0.4% 16.2% ¥ 4,276 ¥ 4,077 0.00 0.00 0.00 23.2x 21.5x 18.3x
NEYVELI LIGNITE (NEYVELILIG-NSEI) रू 80.60 रू 110.00 36.5% 1.02 1,678 रू 135,223 0.2 0.1% 10.4% रू 66,013 रू 168,121
SOUTHGOBI RESOURCES (SGQ-T) C$ 0.36 0.49 246 C$ 87 0.0 0.0% 4.6% C$ 95 C$ 171
TAMBANG BATUBARA (PTBA-JKSE) ¥ 7,475 ¥ 7,912 5.8% 1.11 2,304 ¥ 17,223,386 3.4 0.5% 9.6% ¥ 2,255,416 ¥ 15,440,500 743.98 800.88 778.33 10.0x 9.3x 9.6x 10.3x 10.1x 9.5x 7.3x 7.4x 6.8x
Group Average - Sundry Companies Avg. -> 6.8x 6.5x 6.7x 8.9x 9.5x 9.3x 11.7x 11.3x 10.0x
All data sourced from Bloomberg
EV/EBITDAP/EPSCFPS (LoC) P/CFPS

The Weekly Dig 11/6/15
Haywood Mining [email protected] Page 26
Senior/Intermediate Gold Producers – EV/oz Comparables
Agnico Eagle Mines Limited NYSE:AEM US $5,464 US $653 US $6,455 52.5 1.91 57.8 2.10 91% 20.0 2.40 21.3 2.56 94% 32.5 1.70 36.5 1.90 89% 50% US $123 US $112
AngloGold Ashanti Ltd. JSE:ANG US $2,792 US $1,528 US $5,617 232.1 1.19 265.2 1.36 88% 54.9 0.72 63.0 0.83 87% 168.1 1.48 193.0 1.70 87% 35% US $24 US $21
B2Gold Corp. TSX:BTO US $954 US $137 US $1,242 26.8 0.66 39.5 0.97 68% 12.5 1.24 12.5 1.24 100% 14.3 0.47 27.0 0.88 53% 66% US $46 US $31
Barrick Gold Corporation TSX:ABX US $8,214 US $5,114 US $19,897 209.6 0.95 294.5 1.33 71% 100.6 1.11 137.5 1.52 73% 109.1 0.84 157.0 1.20 69% 28% US $95 US $68
Compañía de Minas Buenaventura S.A.A. NYSE:BVN US $1,416 US $8 US $2,105 19.4 0.22 76.9 0.89 25% 9.0 0.23 31.7 0.83 28% 7.5 0.18 42.3 1.02 18% 47% US $108 US $27
Detour Gold Corporation TSX:DGC US $1,643 US $189 US $1,936 20.6 1.03 20.6 1.03 100% 15.0 1.01 15.0 1.01 100% 5.7 1.07 5.7 1.07 100% 13% US $94 US $94
Eldorado Gold Corporation TSX:ELD US $2,330 US $456 US $2,817 44.8 0.86 58.7 1.13 76% 24.4 1.18 31.8 1.53 77% 18.3 0.59 24.8 0.81 74% 66% US $63 US $48
Gold Fields Ltd. JSE:GFI US $1,889 US $386 US $3,258 111.2 2.36 125.9 2.67 88% 48.2 2.91 49.5 2.99 97% 28.1 1.09 41.5 1.60 68% 66% US $29 US $26
Goldcorp Inc. TSX:G US $9,572 US $470 US $12,175 119.1 0.69 196.5 1.14 61% 49.9 0.80 86.3 1.39 58% 69.2 0.63 110.1 1.00 63% 39% US $102 US $62
Harmony Gold Mining Company Limited JSE:HAR US $305 US $121 US $491 88.9 1.18 115.7 1.54 77% 30.2 0.81 42.9 1.15 70% 58.7 1.55 72.9 1.93 81% 39% US $6 US $4
IAMGOLD Corp. TSX:IMG US $580 US $807 US $620 32.4 1.29 32.4 1.29 100% 9.8 1.35 9.8 1.35 100% 22.6 1.26 22.6 1.26 100% 38% US $19 US $19
Kinross Gold Corporation TSX:K US $2,034 US $2,017 US $2,933 63.4 0.71 69.4 0.78 91% 34.4 0.72 38.0 0.79 91% 28.9 0.71 31.3 0.77 92% 18% US $46 US $42
New Gold, Inc. TSX:NGD US $1,179 US $778 US $1,584 28.9 0.66 43.9 1.01 66% 17.0 0.72 23.8 1.01 71% 11.9 0.59 20.2 1.01 59% 32% US $55 US $36
Newmont Mining Corporation NYSE:NEM US $9,281 US $3,504 US $15,668 149.7 0.82 201.2 1.10 74% 86.1 0.96 102.2 1.14 84% 60.2 0.69 95.6 1.09 63% 34% US $105 US $78
Randgold Resources Limited LSE:RRS US $5,579 US $389 US $5,624 28.3 3.19 28.3 3.19 100% 15.2 3.57 15.2 3.57 100% 13.1 2.85 13.1 2.85 100% 52% US $199 US $199
Tahoe Resources Inc. TSX:THO US $1,706 US $89 US $1,650 8.2 0.38 21.1 0.97 39% 3.3 0.43 10.5 1.38 31% 1.9 0.23 6.6 0.80 28% 92% US $201 US $78
Yamana Gold, Inc. TSX:YRI US $1,708 US $186 US $3,419 72.0 0.51 124.9 0.89 58% 24.4 0.37 55.5 0.83 44% 47.5 0.64 69.4 0.93 68% 40% US $48 US $27
Group Average - Total # Companies: 17 US $80 US $57
Equivalency assumptions (US$ / 09-18-15): $1,089/oz Au, $14.77/oz Ag, $941/oz Pt, $622/oz Pd, $2.27/lb Cu, $0.74/lb Zn, $0.75/lb Pb, $4.35/lb Ni, $4.75/lb Mo, $11.87/lb Co, $5,700/t Sb, $35.38/lb U3O8, $0.20/lb Sn, $93.00/t HCC, $47.08/t 62% Fe
Source: SNL Financial retrieved on November 6, 2015
Enterprise
Value
(millions)
Symbol
Market
Capitalization
(millions)
Working
Capital
(millions)
Global Reserves & Resources Reserves Resources (M&I and Inferred)
Au
(Moz)
Au
(g/t)
AuEq
(Moz)
AuEq
(g/t)% Au
Global
% AuAu
(Moz)
Au
(g/t)
AuEq
(Moz)
AuEq
(g/t)
EV/oz
Au
EV/oz
AuEq
Au
(Moz)
Au
(g/t)
AuEq
(Moz)
AuEq
(g/t)% Au
% Au
Inferred
Alacer Gold Corp. TSX:ASR US $549 US $420 US $302 8.7 0.43 17.4 0.86 50% 2.8 2.13 3.1 2.38 90% 1.0 0.06 8.4 0.55 12% 276% US $35 US $17
Alamos Gold, Inc. TSX:AGI US $866 US $148 US $1,041 21.4 1.11 22.5 1.17 95% 6.2 1.62 6.2 1.62 100% 15.2 0.99 16.3 1.06 93% 34% US $49 US $46
Argonaut Gold Inc. TSX:AR US $147 US $101 US $108 13.1 0.57 13.8 0.61 95% 3.0 0.56 3.0 0.56 100% 10.1 0.58 10.9 0.62 93% 14% US $8 US $8
Centamin Plc LSE:CEY US $1,069 US $293 US $901 10.2 1.19 10.2 1.19 100% 4.4 1.08 4.4 1.08 100% 5.8 1.28 5.8 1.28 100% 31% US $88 US $88
China Gold International Resources Corp Ltd TSX:CGG US $533 US ($127) US $1,317 12.7 0.18 60.2 0.86 21% 5.8 0.30 23.2 1.22 25% 6.9 0.14 37.0 0.73 19% 51% US $104 US $22
Dundee Precious Metals Inc. TSX:DPM US $172 US $49 US $307 6.5 3.12 9.7 4.65 67% 3.1 3.34 4.2 4.46 75% 3.4 2.94 5.5 4.81 61% 49% US $47 US $32
Evolution Mining Limited ASX:EVN US $1,394 US $136 US $1,266 13.0 1.29 13.4 1.34 97% 5.2 1.20 5.2 1.20 100% 7.8 1.36 8.2 1.44 95% 36% US $97 US $94
G-Resources Group Limited SEHK:1051 US $603 US $332 US $308 7.1 1.18 8.0 1.32 89% 2.5 1.98 2.9 2.25 88% - - - - - - US $43 US $38
Nord Gold N.V. LSE:NORD US $1,041 US $620 US $1,651 30.8 0.68 34.3 0.76 90% 12.4 0.54 12.7 0.56 97% 18.0 0.81 21.1 0.95 85% 43% US $54 US $48
Northern Star Resources Limited ASX:NST US $1,085 US $91 US $978 10.8 3.45 25.7 8.18 42% 1.6 6.45 1.6 6.45 100% 6.3 3.04 21.1 10.21 30% 58% US $90 US $38
OceanaGold Corporation TSX:OGC US $1,065 US $72 US $1,119 16.9 1.43 18.4 1.55 92% 5.2 1.42 6.2 1.68 85% 10.3 1.35 10.4 1.37 98% 49% US $66 US $61
Primero Mining Corp. TSX:P US $330 US $18 US $403 6.8 0.84 10.4 1.29 65% 2.0 1.50 3.0 2.27 66% 4.8 0.71 7.4 1.10 65% 26% US $60 US $39
Regis Resources Limited ASX:RRL US $701 US $40 US $680 7.6 0.95 7.6 0.95 100% 2.0 1.06 2.0 1.06 100% 5.6 0.92 5.6 0.92 100% 19% US $89 US $89
Resolute Mining Limited ASX:RSG US $167 US $34 US $188 13.5 1.52 13.5 1.52 100% 4.8 1.60 4.8 1.60 100% 8.7 1.47 8.7 1.47 100% 33% US $14 US $14
SEMAFO Inc. TSX:SMF US $619 US $145 US $607 7.8 2.89 7.8 2.89 100% 2.0 3.01 2.0 3.01 100% 5.7 2.84 5.7 2.84 100% 38% US $78 US $78
Group Average - Total # Companies: 15 US $62 US $48
Equivalency assumptions (US$ / 09-18-15): $1,089/oz Au, $14.77/oz Ag, $941/oz Pt, $622/oz Pd, $2.27/lb Cu, $0.74/lb Zn, $0.75/lb Pb, $4.35/lb Ni, $4.75/lb Mo, $11.87/lb Co, $5,700/t Sb, $35.38/lb U3O8, $0.20/lb Sn, $93.00/t HCC, $47.08/t 62% Fe
Source: SNL Financial retrieved on November 6, 2015
Enterprise
Value
(millions)
Company Symbol
Market
Capitalization
(millions)
Working
Capital
(millions)
Global Reserves & Resources Reserves Resources (M&I and Inferred)
Au
(Moz)
Au
(g/t)
AuEq
(Moz)
AuEq
(g/t)% Au
Global
% AuAu
(Moz)
Au
(g/t)
AuEq
(Moz)
AuEq
(g/t)
EV/oz
Au
EV/oz
AuEq
Au
(Moz)
Au
(g/t)
AuEq
(Moz)
AuEq
(g/t)% Au
% Au
Inferred

The Weekly Dig 11/6/15
Haywood Mining [email protected] Page 27
Junior Gold Producers – EV/oz Comparables
Aureus Mining Inc. TSX:AUE US $88 US $12 US $156 2.5 2.48 2.5 2.48 100% 0.8 3.38 0.8 3.38 100% 1.7 2.19 1.7 2.19 100% 68% US $61 US $61
Avnel Gold Mining Ltd. TSX:AVK US $55 US $13 US $30 2.3 4.15 2.3 4.15 100% - - - - - 2.3 4.15 2.3 4.15 100% 6% US $13 US $13
Banro Corporation TSX:BAA US $46 US ($51) US $276 13.0 1.60 13.0 1.60 100% 2.9 2.11 2.9 2.11 100% 10.1 1.49 10.1 1.49 100% 52% US $21 US $21
Endeavour Mining Corporation TSX:EDV US $190 US $52 US $393 9.9 2.07 9.9 2.07 100% 4.1 2.32 4.1 2.32 100% 3.2 2.50 3.2 2.50 100% 78% US $40 US $40
Golden Star Resources, Ltd. TSX:GSC US $53 US ($89) US $58 12.8 2.60 12.8 2.60 100% 1.7 2.11 1.7 2.11 100% 11.0 2.69 11.0 2.69 100% 23% US $5 US $5
Goldgroup Mining Inc. TSX:GGA US $8 US ($0) US $11 0.7 1.07 1.1 1.61 66% - - - - - 0.7 1.07 1.1 1.61 66% 49% US $16 US $10
Guyana Goldfields Inc. TSX:GUY US $336 US ($9) US $433 8.9 2.94 8.9 2.94 100% 3.5 2.74 3.5 2.74 100% 5.4 3.09 5.4 3.09 100% 39% US $49 US $49
Kirkland Lake Gold Inc. TSX:KGI US $317 US $58 US $349 5.1 18.32 5.1 18.32 100% 1.5 19.33 1.5 19.33 100% 3.6 17.94 3.6 17.94 100% 37% US $69 US $69
Luna Gold Corp. TSX:LGC US $10 US $20 US $38 3.0 1.40 3.0 1.40 100% - - - - - 3.0 1.39 3.0 1.39 100% 4% US $13 US $13
Mandalay Resources Corp. TSX:MND US $234 US $25 US $242 1.4 0.78 3.9 2.10 37% 0.7 2.35 1.0 3.39 69% 0.7 0.48 2.8 1.86 26% 30% US $169 US $63
Metanor Resources Inc. TSXV:MTO US $11 US $1 US $15 1.5 2.09 1.5 2.09 100% 0.2 7.37 0.2 7.37 100% 1.3 1.88 1.3 1.88 100% 75% US $10 US $10
Minera IRL Limited AIM:MIRL US $8 US ($27) US $0 2.6 2.63 2.6 2.64 100% 1.0 3.38 1.0 3.38 100% 1.6 2.31 1.6 2.32 100% 74% - -
Newmarket Gold Inc. TSX:NMI US $151 US ($1) US $139 0.9 2.16 0.9 2.16 100% 0.1 3.58 0.1 3.58 100% 0.8 2.00 0.8 2.00 100% 19% US $152 US $152
Orosur Mining Inc. TSX:OMI US $10 US $5 US $7 1.7 0.71 2.3 0.99 72% 0.2 2.01 0.2 2.01 100% 1.1 0.53 1.7 0.87 61% 7% US $4 US $3
Orvana Minerals Corp. TSX:ORV US $18 US $22 US ($4) 3.5 2.46 4.2 3.00 82% 0.4 3.04 0.6 4.64 65% 3.1 2.41 3.7 2.85 85% 47% - -
Perseus Mining Limited ASX:PRU US $138 US $125 US $73 8.0 1.02 8.0 1.02 100% 2.5 1.29 2.5 1.29 100% 1.1 0.74 1.1 0.74 100% 190% US $9 US $9
Richmont Mines Inc. AMEX:RIC US $167 US $51 US $116 5.0 3.68 5.0 3.68 100% 0.2 6.43 0.2 6.43 100% 4.8 3.61 4.8 3.61 100% 59% US $23 US $23
Rubicon Minerals Corporation TSX:RMX US $50 US $44 US $38 3.3 9.00 3.3 9.00 100% - - - - - 3.3 9.00 3.3 9.00 100% 66% US $11 US $11
Shanta Gold Ltd. AIM:SHG US $41 US $15 US $90 2.9 3.19 2.9 3.19 100% 0.8 4.44 0.8 4.44 100% 2.1 2.90 2.1 2.90 100% 62% US $31 US $31
St Andrew Goldfields Ltd. TSX:SAS US $96 US $13 US $77 5.7 3.18 5.7 3.18 100% 0.8 5.03 0.8 5.03 100% 4.8 2.99 4.8 2.99 100% 45% US $14 US $14
Teranga Gold Corporation TSX:TGZ US $147 US $30 US $148 7.9 1.21 7.9 1.22 99% 2.3 1.36 2.3 1.36 100% 5.5 1.16 5.6 1.17 99% 39% US $19 US $19
Timmins Gold Corp. TSX:TMM US $50 US ($6) US $54 6.8 0.64 6.9 0.66 98% 1.4 0.50 1.4 0.50 100% 5.3 0.69 5.5 0.71 97% 43% US $8 US $8
Wesdome Gold Mines Ltd. TSX:WDO US $100 US $2 US $106 5.5 1.59 5.5 1.59 100% 0.4 4.61 0.4 4.61 100% 5.1 1.52 5.1 1.52 100% 53% US $19 US $19
Group Average - Total # Companies: 23 US $36 US $31
Equivalency assumptions (US$ / 09-18-15): $1,089/oz Au, $14.77/oz Ag, $941/oz Pt, $622/oz Pd, $2.27/lb Cu, $0.74/lb Zn, $0.75/lb Pb, $4.35/lb Ni, $4.75/lb Mo, $11.87/lb Co, $5,700/t Sb, $35.38/lb U3O8, $0.20/lb Sn, $93.00/t HCC, $47.08/t 62% Fe
Source: SNL Financial retrieved on November 6, 2015
Enterprise
Value
(millions)
Company Symbol
Market
Capitalization
(millions)
Working
Capital
(millions)
Global Reserves & Resources Reserves Resources (M&I and Inferred)
Au
(Moz)
Au
(g/t)
AuEq
(Moz)
AuEq
(g/t)% Au
Global
% AuAu
(Moz)
Au
(g/t)
AuEq
(Moz)
AuEq
(g/t)
EV/oz
Au
EV/oz
AuEq
Au
(Moz)
Au
(g/t)
AuEq
(Moz)
AuEq
(g/t)% Au
% Au
Inferred

The Weekly Dig 11/6/15
Haywood Mining [email protected]
Page 28
Gold Development-Stage Companies (Engineering Study Complete) – EV/oz Comparables
Company
African Gold Group Inc. TSXV:AGG US $8 US ($1) US $8 2.2 1.00 2.2 1.00 100% - - - - - 2.2 1.00 2.2 1.00 100% 50% US $4 US $4
Almaden Minerals Ltd. TSX:AMM US $41 US $11 US $34 2.0 0.52 4.0 1.03 50% - - - - - 2.0 0.52 4.0 1.03 50% 18% US $17 US $8
Asanko Gold Inc. TSX:AKG US $315 US $204 US $217 9.4 1.68 9.4 1.68 100% 4.7 1.68 4.7 1.68 100% 4.7 1.68 4.7 1.68 100% 48% US $23 US $23
ATAC Resources Ltd. TSXV:ATC US $34 US $14 US $19 0.8 1.61 0.8 1.64 98% - - - - - 0.8 1.61 0.8 1.64 98% 36% US $24 US $24
Azumah Resources Ltd ASX:AZM US $8 US $0 US $8 1.8 1.51 1.8 1.51 100% 0.6 2.14 0.6 2.14 100% 1.2 1.33 1.2 1.33 100% 49% US $4 US $4
Belo Sun Mining Corp TSX:BSX US $74 US $9 US $64 6.8 1.04 6.8 1.04 100% 3.8 1.02 3.8 1.02 100% 3.0 1.07 3.0 1.07 100% 52% US $9 US $9
Carlisle Goldfields Limited TSX:CGJ US $22 US $5 US $17 2.1 1.74 2.1 1.74 100% - - - - - 2.1 1.74 2.1 1.74 100% 48% US $8 US $8
NewCastle Gold Ltd. TSXV:NCA US $20 US ($1) US $18 4.3 0.60 4.3 0.60 100% - - - - - 4.3 0.60 4.3 0.60 100% 26% US $4 US $4
Chaarat Gold Holdings Ltd AIM:CGH US $31 US $6 US $26 6.1 3.02 6.2 3.06 99% - - - - - 6.1 3.02 6.2 3.06 99% 15% US $4 US $4
Chalice Gold Mines Limited ASX:CHN US $21 US $28 US ($7) 1.5 2.69 1.5 2.69 100% - - - - - 1.5 2.69 1.5 2.69 100% 56% - -
Chesapeake Gold Corp. TSXV:CKG US $67 US $20 US $47 19.8 0.49 30.1 0.75 66% 18.5 0.50 28.4 0.77 65% 1.4 0.44 1.7 0.52 83% 59% US $2 US $2
Dalradian Resources Inc. TSX:DNA US $114 US $25 US $87 3.5 9.87 3.5 10.03 98% - - - - - 3.5 9.87 3.5 10.03 98% 71% US $25 US $25
Exeter Resource Corporation TSX:XRC US $31 US $19 US $12 25.3 0.49 39.1 0.76 65% 0.0 3.31 0.0 3.31 100% 25.3 0.49 39.1 0.76 65% 7% US $0 US $0
Gold Road Resources Limited ASX:GOR US $193 US $33 US $158 6.1 1.26 6.3 1.30 97% - - - - - 6.1 1.26 6.3 1.30 97% 26% US $26 US $25
Golden Queen Mining Co. Ltd. TSX:GQM US $61 US $69 US $89 0.9 0.53 1.1 0.65 81% 0.5 0.66 0.6 0.81 81% 0.4 0.43 0.5 0.53 81% 30% US $99 US $80
Goldrock Mines Corp. TSXV:GRM US $20 US $1 US $17 3.5 0.44 4.7 0.59 74% 1.5 0.72 1.5 0.72 100% 2.0 0.33 3.2 0.55 61% 48% US $5 US $4
Gryphon Minerals Ltd. ASX:GRY US $15 US $12 US $1 3.7 1.37 3.7 1.37 100% 0.8 1.48 0.8 1.48 100% 2.8 1.34 2.8 1.34 100% 23% US $0 US $0
Hummingbird Resources PLC AIM:HUM US $32 US ($7) US $51 6.3 1.63 6.3 1.63 100% - - - - - 6.3 1.63 6.3 1.63 100% 47% US $8 US $8
Integra Gold Corp. TSXV:ICG US $87 US $20 US $68 4.2 6.41 4.2 6.42 100% - - - - - 4.2 6.41 4.2 6.42 100% 52% US $16 US $16
International Tower Hill Mines Ltd. TSX:ITH US $29 US $7 US $21 20.1 0.59 20.1 0.59 100% 10.1 0.69 10.1 0.69 100% 10.1 0.51 10.1 0.51 100% 44% US $1 US $1
Kaminak Gold Corp. TSXV:KAM US $83 US $8 US $73 4.9 1.61 4.9 1.61 100% - - - - - 4.9 1.61 4.9 1.61 100% 42% US $15 US $15
KEFI Minerals Plc AIM:KEFI US $10 US ($1) US $9 1.9 1.96 1.9 1.96 100% 1.0 2.12 1.0 2.12 100% 0.9 1.82 0.9 1.82 100% 20% US $4 US $4
Kerr Mines Inc. TSX:KER US $2 US ($14) US $9 1.0 7.52 1.0 7.52 100% 0.3 8.77 0.3 8.77 100% 0.7 7.16 0.7 7.16 100% 74% US $9 US $9
Kula Gold Limited ASX:KGD US $5 US $1 US $4 2.1 1.48 2.1 1.48 100% 0.7 2.17 0.7 2.17 100% 1.4 1.27 1.4 1.27 100% 56% US $2 US $2
Lupaka Gold Corp. TSXV:LPK US $5 US ($1) US $5 2.8 1.17 3.1 1.33 88% - - - - - 2.8 1.17 3.1 1.33 88% 42% US $2 US $2
Lydian International Limited TSX:LYD US $37 US $13 US $25 5.0 0.69 5.4 0.73 94% 2.5 0.78 2.7 0.83 94% 2.5 0.61 2.7 0.65 94% 80% US $5 US $5
Magellan Minerals Limited TSXV:MNM US $8 US ($3) US $9 2.2 1.70 2.2 1.73 98% - - - - - 2.2 1.70 2.2 1.73 98% 70% US $4 US $4
Manas Resources Ltd. ASX:MSR US $2 US ($1) US $2 1.2 2.18 1.2 2.18 100% - - - - - 1.2 2.18 1.2 2.18 100% 15% US $2 US $2
Metals Exploration Plc AIM:MTL US $98 US ($11) US $155 1.5 1.62 1.6 1.81 90% 0.8 1.86 0.8 2.02 92% 0.7 1.43 0.8 1.63 88% 82% US $105 US $94
Midas Gold Corp. TSX:MAX US $36 US $9 US $26 6.5 1.57 7.1 1.70 92% 4.6 1.60 5.0 1.75 92% 2.0 1.49 2.1 1.61 93% 55% US $4 US $4
Moneta Porcupine Mines Inc. TSX:ME US $16 US $0 US $15 4.3 1.17 4.3 1.17 100% - - - - - 4.3 1.17 4.3 1.17 100% 75% US $4 US $4
Orezone Gold Corporation TSX:ORE US $23 US $2 US $21 5.1 1.08 5.1 1.08 100% 1.3 0.76 1.3 0.76 100% 3.8 1.26 3.8 1.26 100% 21% US $4 US $4
Pershimco Resources Inc. TSXV:PRO US $31 US $2 US $28 0.8 0.69 1.0 0.86 80% 0.5 0.77 0.5 0.82 94% 0.1 7.46 0.1 7.46 100% 12% US $35 US $28
Pilot Gold Inc. TSX:PLG US $28 US $13 US $37 1.7 0.31 3.9 0.71 44% 0.0 1.13 0.0 1.13 100% 1.6 0.30 3.8 0.71 43% 40% US $22 US $10
Premier Gold Mines Limited TSX:PG US $284 US $67 US $224 8.9 2.24 9.0 2.28 98% 0.3 4.38 0.3 4.47 98% 8.5 2.20 8.7 2.24 98% 25% US $25 US $25
Pretium Resources Inc. TSX:PVG US $741 US $0 US $690 50.4 0.70 63.3 0.88 80% 7.5 14.14 7.9 14.92 95% 42.9 0.60 55.4 0.78 77% 35% US $14 US $11
Red Eagle Mining Corporation TSXV:RD US $39 US ($1) US $38 0.6 3.35 0.6 3.35 100% 0.4 5.19 0.4 5.19 100% 0.2 1.98 0.2 1.98 100% 64% US $62 US $62
RNI NL ASX:RNI US $16 US ($17) US $30 - - 0.1 0.13 - - - - - - - - 0.1 0.13 - - - US $404
Roxgold Inc. TSXV:ROG US $150 US $14 US $131 1.1 13.87 1.1 13.87 100% 0.8 11.83 0.8 11.83 100% 0.3 23.05 0.3 23.05 100% 84% US $121 US $121
RTG Mining Inc. TSX:RTG US $50 US $10 US $42 0.6 1.70 1.2 3.60 47% - - - - - 0.6 1.70 1.2 3.60 47% 54% US $73 US $34
Sabina Gold & Silver Corp. TSX:SBB US $83 US $17 US $66 7.2 6.21 7.2 6.21 100% 2.5 6.30 2.5 6.30 100% 4.7 6.16 4.7 6.16 100% 40% US $9 US $9
Sandspring Resources Ltd. TSXV:SSP US $11 US ($1) US $10 10.0 0.84 11.2 0.95 89% 4.1 1.00 4.5 1.11 90% 5.9 0.75 6.7 0.86 88% 53% US $1 US $1
Seabridge Gold, Inc. TSX:SEA US $376 US $11 US $362 87.8 0.54 152.5 0.94 58% 44.7 0.62 68.7 0.95 65% 43.1 0.48 83.7 0.94 51% 70% US $4 US $2
Sihayo Gold Limited ASX:SIH US $7 US ($2) US $4 1.1 2.60 1.1 2.60 100% 0.4 2.41 0.4 2.41 100% 0.7 2.73 0.7 2.73 100% 43% US $4 US $4
Terraco Gold Corp. TSXV:TEN US $10 US $0 US $10 1.0 0.70 1.0 0.70 100% - - - - - 1.0 0.70 1.0 0.70 100% 8% US $10 US $10
Torex Gold Resources Inc TSX:TXG US $697 US $89 US $929 9.3 2.63 12.4 3.50 75% 4.2 2.69 4.2 2.75 98% 5.2 2.59 8.1 4.08 63% 88% US $100 US $75
True Gold Mining Inc. TSXV:TGM US $58 US $14 US $36 4.5 1.10 4.5 1.10 100% 0.9 0.89 0.9 0.89 100% 3.6 1.17 3.6 1.17 100% 59% US $8 US $8
Tyhee Gold Corp. TSXV:TDC US $3 US ($6) US $8 2.2 2.08 2.2 2.08 100% 1.3 2.03 1.3 2.03 100% 0.9 2.17 0.9 2.17 100% 56% US $4 US $4
Vast Resources plc AIM:VAST US $29 US $4 US $40 2.4 1.57 3.0 1.95 80% 0.5 1.90 0.5 1.90 100% 1.9 1.50 2.5 1.96 76% 70% US $17 US $13
Victoria Gold Corp. TSXV:VIT US $35 US $7 US $25 6.4 0.66 6.5 0.67 99% 2.3 0.78 2.3 0.78 100% 4.1 0.61 4.2 0.62 99% 38% US $4 US $4
Group Average - Total # Companies: 49 US $20 US $25
Group Average - 0 - 20 million ounces # Companies: 46 US $21 US $27
Group Average - 20 - 50 million ounces # Companies: 2 US $1 US $1
Group Average - +50 million ounces # Companies: 2 US $9 US $7
Equivalency assumptions (US$ / 09-18-15): $1,089/oz Au, $14.77/oz Ag, $941/oz Pt, $622/oz Pd, $2.27/lb Cu, $0.74/lb Zn, $0.75/lb Pb, $4.35/lb Ni, $4.75/lb Mo, $11.87/lb Co, $5,700/t Sb, $35.38/lb U3O8, $0.20/lb Sn, $93.00/t HCC, $47.08/t 62% Fe
Source: SNL Financial retrieved on November 6, 2015
Global
EV/oz
Au
EV/oz
AuEq
Resources (M&I and Inferred)
Au
(Moz)
Au
(g/t)
AuEq
(Moz)
AuEq
(g/t)% Au
% Au
Inferred
Reserves
Au
(Moz)
Au
(g/t)
AuEq
(Moz)
AuEq
(g/t)% Au
Symbol
Market
Capitalization
(millions)
Working
Capital
(millions)
Enterprise
Value
(millions)
Global Reserves & Resources
Au
(Moz)
Au
(g/t)
AuEq
(Moz)
AuEq
(g/t)% Au

The Weekly Dig 11/6/15
Haywood Mining [email protected]
Page 29
Gold Exploration-Stage Companies (Resource Only) – EV/oz Comparables
Adventure Gold, Inc. TSXV:AGE US $8 US $1 US $7 0.8 2.61 0.8 2.61 100% - - - - - 0.8 2.61 0.8 2.61 100% 98% US $9 US $9
Alexandria Minerals Corporation TSXV:AZX US $5 US $0 US $5 2.0 1.99 2.5 2.48 80% - - - - - 2.0 1.99 2.5 2.48 80% 50% US $3 US $2
Atacama Pacific Gold Corporation TSXV:ATM US $7 US ($0) US $6 5.9 0.37 5.9 0.37 100% 3.7 0.40 3.7 0.40 100% 2.1 0.33 2.1 0.33 100% 29% US $1 US $1
Balmoral Resources Ltd TSX:BAR US $39 US $6 US $31 0.6 0.90 0.6 0.90 100% - - - - - 0.6 0.90 0.6 0.90 100% 68% US $52 US $52
Brazil Resources Inc. TSXV:BRI US $32 US $1 US $31 6.2 0.64 8.0 0.83 78% - - - - - 6.2 0.64 8.0 0.83 78% 55% US $5 US $4
Calibre Mining Corp. TSXV:CXB US $13 US $1 US $12 0.4 1.86 0.5 2.50 74% - - - - - 0.4 1.86 0.5 2.50 74% 100% US $33 US $25
Columbus Gold Corp. TSXV:CGT US $46 US $4 US $42 2.5 1.48 2.5 1.48 100% - - - - - 2.5 1.48 2.5 1.48 100% 22% US $17 US $17
Condor Gold PLC AIM:CNR US $28 US $5 US $24 3.7 3.08 4.1 3.35 92% 0.7 3.04 0.7 3.12 98% 3.1 3.09 3.4 3.41 91% 65% US $6 US $6
Corvus Gold Inc. TSX:KOR US $31 US $2 US $29 1.7 0.26 1.8 0.28 95% - - - - - 1.7 0.26 1.8 0.28 95% 64% US $16 US $16
Eastmain Resources Inc. TSX:ER US $36 US $3 US $33 1.8 4.37 1.8 4.37 100% - - - - - 1.8 4.37 1.8 4.37 100% 34% US $18 US $18
Eco Oro Minerals Corp TSX:EOM US $45 US $1 US $42 3.5 4.38 3.7 4.62 95% - - - - - 3.5 4.38 3.7 4.62 95% 37% US $12 US $11
Ecuador Gold and Copper Corp. TSXV:EGX US $3 US ($3) US $5 9.6 0.41 14.4 0.62 67% - - - - - 9.6 0.41 14.4 0.62 67% 25% US $1 US $0
Eurasian Minerals Inc. TSXV:EMX US $41 US $3 US $39 4.3 0.10 34.9 0.82 12% - - - - - 4.3 0.10 34.9 0.82 12% 60% US $9 US $1
Falco Resources Ltd. TSXV:FPC US $22 US $3 US $18 2.2 2.60 2.8 3.36 77% - - - - - 2.2 2.60 2.8 3.36 77% 99% US $8 US $6
Geologix Explorations Inc. TSX:GIX US $3 US $1 US $3 1.7 0.28 3.4 0.58 48% 1.5 0.31 3.0 0.61 50% 0.2 0.15 0.5 0.41 37% 100% US $2 US $1
GobiMin Inc. TSXV:GMN US $16 US $22 US ($9) 2.9 1.48 4.8 2.44 61% - - - - - 2.9 1.48 4.8 2.44 61% 63% - -
Gold Bullion Development Corp. TSXV:GBB US $8 US ($3) US $8 3.2 0.89 3.2 0.91 98% - - - - - 3.2 0.89 3.2 0.91 98% 49% US $3 US $3
Gold Canyon Resources Inc. TSXV:GCU US $44 US $1 US $43 5.4 1.07 5.7 1.15 93% - - - - - 5.4 1.07 5.7 1.15 93% 15% US $8 US $7
Gold Standard Ventures Corp TSXV:GSV US $71 US $13 US $57 2.1 0.63 2.2 0.67 94% - - - - - 2.1 0.63 2.2 0.67 94% 80% US $28 US $26
Golden Reign Resources Ltd. TSXV:GRR US $8 US $0 US $8 0.9 7.81 1.0 7.98 98% - - - - - 0.9 7.81 1.0 7.98 98% 84% US $8 US $8
Goldquest Mining Corp. TSXV:GQC US $15 US $2 US $12 2.4 2.33 3.6 3.46 67% - - - - - 2.4 2.33 3.6 3.46 67% 23% US $5 US $3
Harte Gold Corp. TSX:HRT US $21 US $0 US $21 0.5 9.47 0.5 9.47 100% - - - - - 0.5 9.47 0.5 9.47 100% 33% US $44 US $44
IDM Mining Ltd. TSX:IDM US $5 US ($1) US $5 0.5 8.06 0.5 8.42 96% - - - - - 0.5 8.06 0.5 8.42 96% 18% US $10 US $10
Kasbah Resources Limited ASX:KAS US $9 US $2 US $6 0.2 0.56 0.3 0.65 86% - - 0.0 0.10 - 0.2 1.20 0.2 1.29 93% - US $27 US $23
Kilo Goldmines Ltd. TSXV:KGL US $4 US $1 US $2 1.2 2.51 1.2 2.51 100% - - - - - 1.2 2.51 1.2 2.51 100% 100% US $1 US $1
Lexam VG Gold Inc. TSX:LEX US $13 US $1 US $12 2.4 2.74 2.4 2.74 100% - - - - - 2.4 2.74 2.4 2.74 100% 39% US $5 US $5
Lion One Metals Limited TSXV:LIO US $16 US $3 US $13 0.7 0.09 11.1 1.43 7% - - - - - 0.7 0.09 11.1 1.43 7% 60% US $17 US $1
Marathon Gold Corporation TSX:MOZ US $13 US $4 US $11 1.3 2.37 1.3 2.37 100% - - - - - 1.3 2.37 1.3 2.37 100% 15% US $8 US $8
Nighthawk Gold Corp. TSXV:NHK US $3 US $2 US $2 2.4 1.69 2.4 1.69 100% - - - - - 2.4 1.69 2.4 1.69 100% 88% US $1 US $1
Niogold Mining Corp. TSXV:NOX US $29 US $4 US $25 2.1 1.36 2.1 1.36 100% - - - - - 2.1 1.36 2.1 1.36 100% 28% US $12 US $12
Northern Gold Mining Inc. TSXV:NGM US $4 US ($3) US $7 2.1 1.68 2.1 1.68 100% - - - - - 2.1 1.68 2.1 1.68 100% 39% US $3 US $3
Orca Gold Inc. TSXV:ORG US $14 US $16 US ($10) 1.6 1.78 1.6 1.83 97% - - - - - 1.6 1.78 1.6 1.83 97% 28% - -
Puma Exploration Inc. TSXV:PUM US $3 US ($0) US $3 0.3 1.45 0.8 4.60 31% - - - - - 0.3 1.45 0.8 4.60 31% 2% US $13 US $4
Pure Gold Mining Inc. TSXV:PGM US $8 US $2 US $5 1.2 9.47 1.2 9.47 100% - - - - - 1.2 9.47 1.2 9.47 100% 24% US $4 US $4
Renaissance Minerals Limited ASX:RNS US $10 US $1 US $9 1.1 2.22 1.1 2.22 100% - - - - - 1.1 2.22 1.1 2.22 100% 15% US $8 US $8
Rye Patch Gold Corp. TSXV:RPM US $16 US $4 US $12 2.5 0.35 3.0 0.42 83% - - - - - 2.5 0.35 3.0 0.42 83% 32% US $5 US $4
Sarama Resources Limited TSXV:SWA US $5 US $1 US $3 0.6 1.81 0.6 1.81 100% - - - - - 0.6 1.81 0.6 1.81 100% 100% US $4 US $4
Spanish Mountain Gold Ltd TSXV:SPA US $5 US ($1) US $5 7.0 0.40 7.2 0.41 98% - - - - - 7.0 0.40 7.2 0.41 98% 50% US $1 US $1
Temex Resources Corp. TSXV:TME US $17 US $1 US $16 - - - - - - - - - - - - - - - - - -
Teras Resources Inc. TSXV:TRA US $6 US $0 US $6 1.1 0.48 1.3 0.56 87% - - - - - 1.1 0.48 1.3 0.56 87% 10% US $5 US $4
Treasury Metals Inc. TSX:TML US $26 US ($5) US $30 1.6 1.88 1.8 2.20 85% - - - - - 1.6 1.88 1.8 2.20 85% 24% US $19 US $16
TriMetals Mining Inc. TSX:TMI US $9 US $2 US $6 1.8 0.07 14.3 0.55 12% - - - - - 1.8 0.07 14.3 0.55 12% 47% US $3 US $0
WCB Resources Ltd. TSXV:WCB US $4 US $1 US $3 1.2 1.10 1.3 1.18 93% - - - - - 1.2 1.10 1.3 1.18 93% 22% US $3 US $3
West Kirkland Mining Inc. TSXV:WKM US $11 US $1 US $10 0.9 0.49 1.2 0.62 79% 0.6 0.58 0.7 0.69 84% 0.4 0.40 0.5 0.56 72% 46% US $10 US $8
Group Average - Total # Companies: 44 US $11 US $9
Equivalency assumptions (US$ / 09-18-15): $1,089/oz Au, $14.77/oz Ag, $941/oz Pt, $622/oz Pd, $2.27/lb Cu, $0.74/lb Zn, $0.75/lb Pb, $4.35/lb Ni, $4.75/lb Mo, $11.87/lb Co, $5,700/t Sb, $35.38/lb U3O8, $0.20/lb Sn, $93.00/t HCC, $47.08/t 62% Fe
Source: SNL Financial retrieved on November 6, 2015
EV/oz
Au
EV/oz
AuEq
Au
(Moz)
Au
(g/t)
AuEq
(Moz)
AuEq
(g/t)% Au
Global
% Au% AuAu
(Moz)
Au
(g/t)
AuEq
(Moz)
Global Reserves & Resources Reserves Resources (M&I and Inferred)
Au
(Moz)
Au
(g/t)
AuEq
(Moz)
AuEq
(g/t)
AuEq
(g/t)
% Au
Inferred
Company Symbol
Market
Capitalization
(millions)
Working
Capital
(millions)
Enterprise
Value
(millions)

The Weekly Dig 11/6/15
Haywood Mining [email protected] Page 30
Silver – EV/oz Comparables
Alexco Resource Corporation TSX:AXR US $30 US $7 US $25 67 319 111 526 61% - - - - - 67 319 111 526 61% 18% US $0.37 US $0.22
Argentex Mining Corporation OTCPK:AGXM.F US $2 US $0 US $2 26 93 49 179 52% - - - - - 26 93 49 179 52% 18% US $0.07 US $0.04
Athena Silver Corp OTCPK:AHNR US $1 US ($2) US $3 43 67 43 67 100% - - - - - 43 67 43 67 100% - US $0.07 US $0.07
Bear Creek Mining Corp. TSXV:BCM US $43 US $25 US $18 523 41 980 76 53% 291 52 559 99 52% 232 32 421 58 55% 33% US $0.03 US $0.02
Defiance Silver Corp. TSXV:DEF US $4 US $0 US $4 17 182 18 192 95% - - - - - 17 182 18 192 95% 100% US $0.23 US $0.22
Dolly Varden Silver Corporation TSXV:DV US $3 US $0 US $2 43 333 43 333 100% - - - - - 43 333 43 333 100% 25% US $0.05 US $0.05
Global Minerals Ltd. TSXV:CTG.H US $0 US ($0) US $0 - - - - - - - - - - - - - - - - - -
Golden Arrow Resources Corp. TSXV:GRG US $8 US $0 US $8 54 77 80 116 67% 10 211 11 228 93% 43 67 69 108 63% 44% US $0.14 US $0.10
Golden Minerals Company AMEX:AUMN US $11 US $3 US $8 144 42 377 110 38% - - - - - 144 42 377 110 38% 59% US $0.05 US $0.02
Iberian Minerals Ltd. TSXV:IML US $8 US $4 US $4 22 9 286 114 8% - - - - - 22 9 286 114 8% - US $0.17 US $0.01
Investigator Resources Limited ASX:IVR US $3 US $2 US $1 20 105 24 128 83% - - - - - 20 105 24 128 83% 100% US $0.07 US $0.06
Kootenay Silver Inc TSXV:KTN US $17 US $1 US $16 53 27 155 80 34% - - - - - 53 27 155 80 34% 24% US $0.30 US $0.10
MacPhersons Resources Limited ASX:MRP US $23 US $2 US $21 20 24 77 90 26% 8 44 24 127 35% 12 18 54 80 22% 29% US $1.05 US $0.27
MAG Silver Corp. TSX:MAG US $465 US $82 US $389 90 48 229 121 39% - - - - - 90 48 229 121 39% 31% US $4.32 US $1.70
Minco Silver Corporation TSX:MSV US $17 US $52 US ($30) 182 160 273 241 66% 50 189 60 226 84% 132 152 214 246 62% 47% - -
Mines Management, Inc. AMEX:MGN US $9 US $1 US $11 231 68 495 146 47% - - - - - 231 68 495 146 47% 28% US $0.05 US $0.02
Northair Silver Corp. TSXV:INM US $5 US $2 US $2 63 85 74 101 85% - - - - - 63 85 74 101 85% 18% US $0.04 US $0.03
Silver Bear Resources Inc. TSX:SBR US $2 US ($5) US $8 57 576 57 576 100% - - - - - 57 576 57 576 100% 59% US $0.14 US $0.14
Silver Bull Resources, Inc. OTCPK:SVBL US $8 US $1 US $7 91 48 357 188 25% - - - - - 91 48 357 188 25% 0% US $0.07 US $0.02
Silver Predator Corp. TSXV:SPD US $2 US $0 US $5 21 60 28 81 74% - - - - - 21 60 28 81 74% 19% US $0.22 US $0.17
Silver Range Resources Ltd. TSXV:SNG US $1 US $2 US ($0) 40 28 162 111 25% - - - - - 40 28 162 111 25% 96% - -
Soltoro Ltd. TSXV:SOL US $22 US ($1) US $22 - - - - - - - - - - - - - - - - - -
T inka Resources Ltd. TSXV:TK US $19 US $7 US $12 33 35 123 131 27% - - - - - 33 35 123 131 27% 57% US $0.35 US $0.10
Group Average - Total # Companies: 21 US $0.41 US $0.18
Equivalency assumptions (US$ / 09-18-15): $1,089/oz Au, $14.77/oz Ag, $941/oz Pt, $622/oz Pd, $2.27/lb Cu, $0.74/lb Zn, $0.75/lb Pb, $4.35/lb Ni, $4.75/lb Mo, $11.87/lb Co, $5,700/t Sb, $35.38/lb U3O8, $0.20/lb Sn, $93.00/t HCC, $47.08/t 62% Fe
Source: SNL Financial retrieved on November 6, 2015
EV/oz
Ag
EV/oz
AgEq
Ag
(Moz)
Ag
(g/t)
AgEq
(Moz)
AgEq
(g/t)% Ag
Global
% Ag% AgAg
(Moz)
Ag
(g/t)
AgEq
(Moz)
Global Reserves & Resources Reserves Resources (M&I and Inferred)
Ag
(Moz)
Ag
(g/t)
AgEq
(Moz)
AgEq
(g/t)
AgEq
(g/t)
% Ag
Inferred
Company Symbol
Market
Capitalization
(millions)
Working
Capital
(millions)
Enterprise
Value
(millions)

The Weekly Dig 11/6/15
Haywood Mining [email protected] Page 31
Copper Non-Producers – EV/lb Comparables
Shares Market Working LTD Enterprise Copper
Company Symbol Price O/S Capitalization Capital Value Value Ratio*** Reserve (P&P) Resource (Total)
(millions) (millions) (millions) (millions) (millions) (% Contained) (CuEq** Mlb) (CuEq** Mlb) Reserve Total
Africo Resources Ltd. TSX:ARL C$ 0.43 71.3 US$ 23 US$ 48.4 US$ 0.0 US$ (26) Cu / Co 52% - 3,662 - -
AQM Copper Inc. TSXV:AQM C$ 0.05 141.0 US$ 5 US$ 1.9 US$ 0.0 US$ 3 Cu / Au 90% - 2,026 - $0.001
Aquila Resources Inc. TSX:AQA C$ 0.15 220.9 US$ 24 US$ 0.7 US$ 6.5 US$ 30 Au / Zn 19% - 1,587 - $0.019
Candente Copper Corp. TSX:DNT C$ 0.05 151.7 US$ 6 US$ (1.3) US$ 0.0 US$ 7 Cu / Au 89% - 12,427 - $0.001
Colorado Resources Ltd. TSXV:CXO C$ 0.07 47.2 US$ 2 US$ 2.2 US$ 0.0 US$ 0 Cu / Au 59% - 1,165 - $0.000
Copper Fox Metals Inc TSXV:CUU C$ 0.16 407.7 US$ 48 US$ 2.1 US$ 0.0 US$ 45 Cu / Au 68% 2,375 5,648 $0.019 $0.008
Coro Mining Corp. TSX:COP C$ 0.02 159.4 US$ 2 US$ 0.4 US$ 0.3 US$ 2 Cu / Au 84% 195 965 $0.012 $0.002
Crazy Horse Resources Inc. TSXV:CZH C$ 0.02 48.6 US$ 1 US$ 0.5 US$ 0.0 US$ 0 Cu / Au 80% 2,638 5,794 $0.000 $0.000
EurOmax Resources Limited TSXV:EOX C$ 0.35 116.8 US$ 31 US$ (5.5) US$ 0.0 US$ 36 Cu / Au 48% 1,848 2,680 $0.020 $0.014
Exeter Resource Corporation TSX:XRC C$ 0.46 88.4 US$ 31 US$ 20.1 US$ 0.0 US$ 10 Au / Cu 41% 12,504 22,559 $0.001 $0.000
Foran Mining Corporation TSXV:FOM C$ 0.10 90.8 US$ 7 US$ 1.4 US$ 0.0 US$ 5 Cu / Zn 46% - 1,756 - $0.003
Getty Copper Inc. TSXV:GTC C$ 0.02 108.4 US$ 1 US$ (0.5) US$ 0.0 US$ 2 Cu / Mo 96% 620 969 $0.003 $0.002
Gold Reach Resources Ltd. TSXV:GRV C$ 0.14 41.3 US$ 4 US$ 0.6 US$ 0.0 US$ 4 Cu / Mo 68% - 5,444 - $0.001
Highland Copper Co Inc. TSXV:HI C$ 0.14 154.0 US$ 16 US$ (9.6) US$ 0.0 US$ 26 Cu / Ag 96% 871 6,019 $0.030 $0.004
Indico Resources Ltd. TSXV:IDI C$ 0.07 147.0 US$ 8 US$ (2.2) US$ 0.0 US$ 10 Cu / - 100% - 410 - $0.024
Kiska Metals Corporation TSXV:KSK C$ 0.02 115.5 US$ 2 US$ 0.9 US$ 0.0 US$ 1 Au / Cu 38% - 2,048 - $0.000
Los Andes Copper Limited TSXV:LA C$ 0.14 216.7 US$ 23 US$ (0.1) US$ 0.0 US$ 23 Cu / Mo 89% - 12,305 - $0.002
Marengo Mining Limited TSX:MRN C$ 0.01 1137.9 US$ 4 US$ (40.5) US$ 6.0 US$ 51 Cu / Au 84% - 7,561 - $0.007
Nevada Copper Corp. TSX:NCU C$ 0.91 80.5 US$ 55 US$ (14.6) US$ 86.7 US$ 156 Cu / Au 91% 5,791 7,917 $0.027 $0.020
NGEx Resources Inc. TSX:NGQ C$ 0.50 187.7 US$ 71 US$ 1.1 US$ 0.0 US$ 69 Cu / Au 76% - 27,655 - $0.003
Northern Dynasty Minerals Ltd. TSX:NDM C$ 0.49 143.9 US$ 52 US$ (3.2) US$ 0.0 US$ 56 Cu / Au 57% - 142,635 - $0.000
Northisle Copper and Gold Inc. TSXV:NCX C$ 0.02 82.3 US$ 1 US$ (0.1) US$ 0.0 US$ 1 Cu / Au 51% - 4,358 - $0.000
NovaCopper Inc. TSX:NCQ C$ 0.51 104.8 US$ 40 US$ 17.8 US$ 0.0 US$ 22 Cu / Zn 83% - 9,685 - $0.002
Panoro Minerals Ltd. TSXV:PML C$ 0.13 220.6 US$ 21 US$ 1.4 US$ 0.0 US$ 19 Cu / Au 77% - 10,114 - $0.002
Polymet Mining Corp. TSX:POM C$ 1.45 276.6 US$ 302 US$ (59.1) US$ 0.0 US$ 361 Cu / Ni 49% 3,145 10,139 $0.115 $0.036
Quaterra Resources Inc. TSXV:QTA C$ 0.08 193.5 US$ 12 US$ 4.8 US$ 0.5 US$ 7 Cu / Ag 96% - 8,247 - $0.001
Redhawk Resources, Inc. TSX:RDK C$ 0.05 157.7 US$ 6 US$ 0.0 US$ 0.5 US$ 6 Cu / Mo 92% - 3,835 - $0.002
Regulus Resources Inc TSXV:REG C$ 0.20 56.4 US$ 8 US$ 6.9 US$ 0.0 US$ 2 Cu / Au 0% - 7,290 - $0.000
Reservoir Minerals Inc. TSXV:RMC C$ 4.40 48.5 US$ 160 US$ 25.3 US$ 0.0 US$ 135 Cu / Au 71% - 3,419 - $0.040
Serengeti Resources Inc. TSXV:SIR C$ 0.03 51.1 US$ 1 US$ (0.0) US$ 0.2 US$ 1 Cu / Au 67% - 4,153 - $0.000
St Augustine Gold and Copper Limited TSX:SAU C$ 0.12 726.8 US$ 63 US$ 6.0 US$ 0.0 US$ 57 Cu / Au 58% 2,131 3,263 $0.027 $0.017
Sunridge Gold Corp. TSXV:SGC C$ 0.24 209.9 US$ 38 US$ 4.9 US$ 0.0 US$ 33 Cu / Zn 50% 2,182 3,491 $0.015 $0.009
Tintina Resources Inc. TSXV:TAU C$ 0.08 222.5 US$ 13 US$ 8.2 US$ 0.0 US$ 5 Cu / Co 86% - 1,538 - $0.003
Western Copper and Gold Corporation TSX:WRN C$ 0.37 94.2 US$ 26 US$ 7.9 US$ 0.0 US$ 18 Cu / Au 45% 10,033 22,599 $0.002 $0.001
Group Average - Total $0.022 $0.007
*All reserve and resource data sourced from IntierraRMG, additional data sourced from Capital IQ and Market Q.
**CuEq = copper equivalent. Calculated based on Haywood's formal long-term metal price forecasts.
***Copper Ratio = value of in situ copper / total value of in situ metals.
Primary /
Secondary
Metal
Reserves & Resources* - Attributable
EV/lb CuEq** (US$)

The Weekly Dig 11/6/15
Haywood Mining [email protected] Page 32
Nickel Non-Producers – EV/lb Comparables
Zinc Non-Producers – EV/lb Comparables
Shares Market Working LTD Enterprise Nickel
Company Symbol Price O/S Capitalization Capital Value Value Ratio*** Reserve (P&P) Resource (Total)
(millions) (millions) (millions) (millions) (millions) (% Contained) (NiEq** Mlb) (NiEq** Mlb) Reserve Total
Anfield Nickel Corp. TSXV:ANF C$ 0.68 43.4 US$ 22 US$ 4.2 US$ 0.0 US$ 18 Ni / Co 99% 2,169 3,616 $0.008 $0.005
Asian Mineral Resources Limited TSXV:ASN C$ 0.04 779.5 US$ 21 US$ 12.9 US$ 8.0 US$ 16 Ni / Cu 86% 85 146 $0.184 $0.107
Canadian Arrow Mines Ltd. TSXV:CRO C$ 0.01 140.0 US$ 1 US$ (0.4) US$ 0.0 US$ 1 Ni / Cu 82% - 141 - $0.007
CaNickel Mining Limited TSX:CML C$ 0.06 37.5 US$ 2 US$ (51.2) US$ 0.0 US$ 53 Ni / - 100% 83 370 $0.640 $0.143
First Point Minerals Corp. TSX:FPX C$ 0.08 105.8 US$ 6 US$ 1.0 US$ 0.0 US$ 5 Ni / - 100% - 2,186 - $0.002
Hard Creek Nickel Corporation TSXV:HNC C$ 0.02 18.1 US$ 0 US$ 0.1 US$ 0.0 US$ 0 Ni / Co 91% - 9,161 - $0.000
Mustang Minerals Corp. TSXV:MUM C$ 0.01 256.5 US$ 1 US$ 0.2 US$ 0.0 US$ 1 Co / Ni 38% 2 1,176 $0.310 $0.001
Noront Resources Ltd TSXV:NOT C$ 0.43 236.8 US$ 76 US$ (19.2) US$ 16.7 US$ 112 Ni / Cu 78% 498 851 $0.224 $0.131
North American Nickel Inc. TSXV:NAN C$ 0.13 122.2 US$ 12 US$ 3.7 US$ 0.0 US$ 8 Ni / Cu 0% - - - -
Northern Shield Resources Inc. TSXV:NRN C$ 0.02 152.6 US$ 2 US$ 0.0 US$ 0.0 US$ 2 Ni / Cu 0% - - - -
Poseidon Nickel Limited ASX:POS A$ 0.05 732.0 US$ 28 US$ (0.7) US$ 27.6 US$ 56 Ni / Au 98% 171 1,284 $0.328 $0.044
Royal Nickel Corporation TSX:RNX C$ 0.22 131.1 US$ 21 US$ 9.1 US$ 0.0 US$ 12 Ni / Co 94% 7,217 13,124 $0.002 $0.001
Sama Resources Inc. TSXV:SME C$ 0.16 103.1 US$ 12 US$ 0.1 US$ 0.0 US$ 12 Ni / Cu 71% - 195 - $0.063
Strongbow Exploration Inc. TSXV:SBW C$ 0.10 25.6 US$ 2 US$ 0.7 US$ 0.0 US$ 1 Ni / Cu 86% - 417 - $0.003
Talon Metals Corporation TSX:TLO C$ 0.14 106.8 US$ 11 US$ (4.6) US$ 0.0 US$ 15 Ni / Fe 56% - 125 - $0.124
Victory Nickel Inc. TSX:NI C$ 0.02 57.6 US$ 1 US$ (6.1) US$ 5.0 US$ 12 Ni / Cu 90% 423 1,033 $0.028 $0.012
Group Average - Total $0.215 $0.046
*All reserve and resource data sourced from IntierraRMG, additional data sourced from Capital IQ and Market Q.
**NiEq = nickel equivalent. Calculated based on Haywood's formal long-term metal price forecasts.
***Nickel Ratio = value of in situ nickel / total value of in situ metals.
Primary /
Secondary
Metal
Reserves & Resources* - Attributable
EV/lb NiEq** (US$)
Shares Market Working LTD Enterprise Zinc
Company Symbol Price O/S Capitalization Capital Value Value Ratio*** Reserve (P&P) Resource (Total)
(millions) (millions) (millions) (millions) (millions) (% Contained) (ZnEq** Mlb) (ZnEq** Mlb) Reserve Total
Canada Zinc Metals Corp. TSXV:CZX C$ 0.15 152.4 US$ 17 US$ 7.6 US$ 0.0 US$ 10 Zn / Pb 82% - 6,096 - $0.002
Canadian Zinc Corporation TSX:CZN C$ 0.08 218.0 US$ 13 US$ 4.8 US$ 0.0 US$ 8 Zn / Pb 40% 2,525 10,077 $0.003 $0.001
El Nino Ventures Inc. TSXV:ELN C$ 0.02 37.1 US$ 0 US$ (0.1) US$ 0.0 US$ 1 Zn / Cu 45% - 1,357 - $0.000
Firestone Ventures Inc. TSXV:FV C$ 0.01 36.8 US$ 0 US$ (0.5) US$ 0.0 US$ 1 Zn / Pb 73% - 454 - $0.001
Foran Mining Corporation TSXV:FOM C$ 0.10 90.8 US$ 7 US$ 1.4 US$ 0.0 US$ 5 Cu / Zn 33% - 4,962 - $0.001
InZinc Mining Ltd. TSXV:IZN C$ 0.05 72.2 US$ 3 US$ 0.8 US$ 0.0 US$ 2 Zn / Cu 77% - 3,873 - $0.000
Rathdowney Resources Ltd. TSXV:RTH C$ 0.17 118.1 US$ 15 US$ 0.7 US$ 0.0 US$ 14 Zn / Pb 80% - 3,437 - $0.004
Sunridge Gold Corp. TSXV:SGC C$ 0.24 209.9 US$ 38 US$ 4.9 US$ 0.0 US$ 33 Cu / Zn 29% 6,167 9,867 $0.005 $0.003
Wolfden Resources Corp. TSXV:WLF C$ 0.08 67.1 US$ 4 US$ 2.1 US$ 0.0 US$ 2 Au / Zn 29% - 4,516 - $0.000
Zazu Metals Corporation TSX:ZAZ C$ 0.13 55.4 US$ 5 US$ 0.7 US$ 0.0 US$ 5 Zn / Pb 69% - 3,077 - $0.002
Group Average - Total $0.004 $0.002
*All reserve and resource data sourced from IntierraRMG, additional data sourced from Capital IQ and Market Q.
**ZnEq = Zinc equivalent. Calculated based on Haywood's formal long-term metal price forecasts.
***Zinc Ratio = value of in situ zinc / total value of in situ metals.
Primary /
Secondary
Metal
Reserves & Resources* - Attributable
EV/lb ZnEq** (US$)
The Weekly Dig 11/6/15
Haywood Mining [email protected] Page 33
Dissemination of Research Research reports are disseminated either through electronic medium or in printed copy. Clients may access reports on our website, or receive publications directly via email. Haywood strives to ensure all clients receive research in a timely manner and at the same time. It is against our policy for analysts to discuss or circulate their recommendations internally prior to public distribution. This policy applies equally to recommendation changes, target changes and/or forecast revisions.
For Canadian residents: Haywood Securities Inc. is a Canadian registered broker-dealer and a member of the Investment Industry Regulatory Organization of Canada, the Toronto Stock Exchange, the Toronto Venture Exchange and the Canadian Investor Protection Fund and accepts responsibility for the dissemination of this report. Any Canadian client that wishes further information on any securities discussed in this report should contact a qualified salesperson of Haywood Securities Inc.
For U.S. residents: This investment research is distributed in the United States, as third party research by Haywood Securities (USA) Inc. Haywood Securities (USA) Inc. is a wholly owned subsidiary of Haywood Securities Inc., registered with the U.S. Securities and Exchange Commission, and is a member of FINRA and the Securities Investor Protection Corporation (SIPC). Haywood Securities (USA) Inc. as a U.S. registered broker-dealer accepts responsibility for this Research Report and its dissemination in the United States. Any U.S. client that wishes further information on any securities discussed in this report or wish to effect a transaction in these securities should contact a qualified salesperson of Haywood Securities (USA) Inc. Haywood Securities Inc. Research Analysts are considered Foreign Research Analysts to the USA and are not registered/qualified as Research Analysts with FINRA. As these analysts are considered Foreign Research Analysts they may not be specifically subject to FINRA (formerly NASD) Rule 2711 and FINRA (formerly NYSE) Rule 472 restrictions on communications with a Subject Company, Public Appearances and trading securities held by a Research Analyst Account.
This report may be distributed in the following states: nil. Otherwise, this report may only be distributed into those states with an institutional buyer state securities registration exemption.
Analyst Certification We, Geordie Mark, Mick Carew, Colin Healey, Kerry Smith, Stefan Ioannou, Ben Asuncion, and Tara Hassan, hereby certify that the views expressed in this report (which includes the rating assigned to the issuer’s shares as well as the analytical substance and tone of the report) accurately reflect my/our personal views about the subject securities and the issuer. No part of my/our compensation was, is, or will be directly or indirectly related to the specific recommendations.

The Weekly Dig 11/6/15
Haywood Mining [email protected] Page 34
Important Disclosures
Of the companies included in the report the following Important Disclosures apply:
Ticker Company 1 2 3 4 5 6 7 8
TSX:AGI Alamos Gold Inc. X
TSX:AKG Asanko Gold Inc. X X X X
TSX:BTO B2Gold Corp. X
TSX:ABX Barrick Gold Corporation X
TSX:CS Capstone Mining Corp. X
TSX:CUM Copper Mountain Mining Corp. X
TSX:DML Denison Mines Corp. X X X
TSX:DGC Detour Gold Corporation X X X X
TSX:ELD Eldorado Gold Corporation X X
TSX:EDV Endeavour Mining Corp. X X
TSX:EFR Energy Fuels Inc. X X
TSXV:FOM Foran Mining Corp. X X
TSXV:HI Highland Copper Company Inc X X X X
TSX:HBM Hudbay Minerals, Inc. X X
TSXV:ICG Integra Gold Corp. X X X
TSX:KDX Klondex Mines Ltd. X X
TSX:LSG Lake Shore Gold Corp. X X X
TSX:LUC Lucara Diamond Corp. X X
TSX:LUN Lundin Mining Corporation X X X
TSX:MND Mandalay Resources Corp. X
TSX:MAX Midas Gold Corp. X X X X X X
TSX:MPV Mountain Province Diamonds Inc. X X X
TSX:NSU Nevsun Resources Ltd. X
TSXV:NCA NewCastle Gold Ltd. X X X
TSXV:NXE NexGen Energy Ltd. X X
TSX:NCQ NovaCopper Inc. X X X
TSX:OGC OceanaGold Corporation X
TSX:ORE Orezone Resources Inc. X
TSX:PLG Pilot Gold Inc. X X
TSXV:ROG Roxgold Inc. X X X X X
TSX:RNX Royal Nickel Corporation X X
TSX:RTG RTG Gold Inc. X X X X
TSXV:SWA Sarama Resources Ltd. X
TSX:SMF SEMAFO Inc. X
TSXV:SVL SilverCrest Mines Inc. X
TSX:THO Tahoe Resources Inc. X X
TSX:TLO Talon Metals Corp. X X X
TSX:TV Trevali Resources Corp. X X X
TSXV:TGM True Gold Mining Inc. X
AMEX:UEC Uranium Energy Corp. X
TSX:U Uranium Participation Corporation X
1 The Analyst(s) preparing this report (or a member of the Analysts’ households) have a financial interest in this company.
2 As of the end of the month immediately preceding this publication either Haywood Securities, Inc., one of its subsidiaries, its officers or directors beneficially owned 1% or more of this company.

The Weekly Dig 11/6/15
Haywood Mining [email protected] Page 35
3 Haywood Securities, Inc. has reviewed lead projects of this company and a portion of the expenses for this travel have been reimbursed by the issuer.
4 Haywood Securities Inc. or one of its subsidiaries has managed or co-managed or participated as selling group in a public offering of securities for this company in the past 12 months.
5 Haywood Securities, Inc. or one of its subsidiaries has received compensation for investment banking services from this company in the past 12 months
6 Haywood Securities, Inc. or one of its subsidiaries has received compensation for investment banking services from this company in the past 24 months
7 Haywood Securities, Inc. or one of its subsidiaries is restricted on this company at the time of publication
8 Haywood Securities, Inc. or one of its subsidiaries expects to receive or intends to seek compensation for investment banking services from this company in the next three months
Other material conflict of interest of the research analyst of which the research analyst or member knows or has reason to know at the time of publication or at the time of public appearance:
n/a
Rating Structure
Each company within an analyst’s universe, or group of companies covered, is assigned: (i) a recommendation or rating, usually BUY, HOLD, or SELL; (ii) a 12 month target price, which represents an analyst’s current assessment of a company’s potential stock price over the next year; (iii) an overall risk rating which represents an analyst’s assessment of the company’s overall investment risk; and (iv) specific risk ratings or risk profile parameters which in their aggregate support an analyst’s overall risk rating. These ratings are more fully explained below. Before acting on our recommendation we caution you to confer with your Haywood investment advisor to determine the suitability of our recommendation for your specific investment objectives, risk tolerance and investment time horizon.
Recommendation Rating
BUY – The analyst believes that the security will outperform other companies in their sector on a risk adjusted basis or for the reasons stated in the research report the analyst believes that the security is deserving of a (continued) BUY rating.
HOLD – The analyst believes that the security is expected to perform in line with other companies in their sector on a risk adjusted basis or for the reasons stated in the research report the analyst believes that the security is deserving of a (continued) HOLD rating.
SELL – Investors are advised to sell the security or hold alternative securities within the sector. Stocks in this category are expected to under-perform other companies on a risk adjusted basis or for the reasons stated in the research report the analyst believes that the security is deserving of a (continued) SELL rating.
TENDER – The analyst is recommending that investors tender to a specific offering for the company’s stock.
RESEARCH COMMENT – An analyst comment about an issuer event that does not include a rating or recommendation.
UNDER REVIEW – Placing a stock Under Review does not revise the current rating or recommendation of the analyst. A stock will be placed Under Review when the relevant company has a significant material event with further information pending or to be announced. An analyst will place a stock Under Review while he/she awaits sufficient information to re-evaluate the company’s financial situation.
COVERAGE DROPPED – Haywood Securities will no longer cover the issuer. Haywood will provide notice to clients whenever coverage of an issuer is discontinued.
Haywood’s focus is to search for undervalued companies which analysts believe may achieve attractive risk-adjusted returns. This research coverage on potentially undervalued companies may result in an outweighed percentage of companies rated as BUY. Management regularly reviews rating and targets in all sectors to ensure fairness and accuracy.
For further information on Haywood Securities’ research dissemination policies, please visit: http://www.haywood.com/research_dissemination.asp
Overall Risk Rating Very High Risk: Venture type companies or more established micro, small, mid or large cap companies whose risk profile parameters and/or lack of liquidity warrant such a designation. These companies are only appropriate for investors who have a

The Weekly Dig 11/6/15
Haywood Mining [email protected] Page 36
very high tolerance for risk and volatility and who are capable of incurring temporary or permanent loss of a very significant portion of their investment capital.
High Risk: Typically micro or small cap companies which have an above average investment risk relative to more established or mid to large cap companies. These companies will generally not form part of the broad senior stock market indices and often will have less liquidity than more established mid and large cap companies. These companies are only appropriate for investors who have a high tolerance for risk and volatility and who are capable of incurring a temporary or permanent loss of a significant loss of their investment capital.
Medium-High Risk: Typically mid to large cap companies that have a medium to high investment risk. These companies will often form part of the broader senior stock market indices or sector specific indices. These companies are only appropriate for investors who have a medium to high tolerance for risk and volatility and who are prepared to accept general stock market risk including the risk of a temporary or permanent loss of some of their investment capital
Moderate Risk: Large to very large cap companies with established earnings who have a track record of lower volatility when compared against the broad senior stock market indices. These companies are only appropriate for investors who have a medium tolerance for risk and volatility and who are prepared to accept general stock market risk including the risk of a temporary or permanent loss of some of their investment capital.
Risk Profile Parameters – Mining and Minerals Sector Forecast Risk: High (7-10) – The Company’s primary project(s) is at an earlier stage of exploration and/or resource delineation whereby grades, tonnages, capital and operating costs, and other economic/operational parameters are not yet reliably established. Moderate (4-6) – The Company has taken steps to de-risk its primary producing, or soon to be producing project(s) and has established reasonably reliable operational and economic parameters. Low (1-3) – The Company has de-risked the majority of its primary project(s) through operational history and established production profile(s).
Financial Risk: High (7-10) – The Company’s near- and medium-term (capital) expenditure considerations, including the current year or next forecast year, are not fully funded through a combination of established debt facilities, cash on hand, and/or anticipated cash flow from existing operations—successful project execution depends, in part, on future (equity) financing(s). Existing and/or forecast levels of leverage are above average relative to the Company’s peer group. The risk of a significant capital cost overrun(s) is high given the early stage of project development. Moderate (4-6) – The Company’s near-term (capital) expenditure program, in the current year or next forecast year, is fully funded through a combination of established debt facilities, cash on hand, and/or anticipated cash flow from existing operations. Medium-term funding requirements will likely require additional financing consideration, but should be achievable assuming no significant uncontrollable events impede access to capital. Existing and/or forecast levels of leverage are in-line with the Company’s peer group. The risk of a significant capital cost overrun(s) is moderate given the advanced stage of project development. Low (1-3) – the Company’s near- and medium-term (capital) expenditure program is fully funded through a combination of established debt facilities, cash on hand, and/or anticipated cash flow from existing operations. Existing and/or forecast levels of leverage are below average relative to the Company’s peer group.
Valuation Risk: High (7-10) – The current valuation is at a premium to peers. The valuation reflects considerable future exploration success and/or commodity appreciation. Where applicable, the current capitalization exceeds the “DCF” evaluation by more than 50%. Moderate (4-6) – The current valuation is within historic ranges and generally consistent with peers. The valuation reflects reasonable exploration success and/or commodity appreciation. Where applicable, the current capitalization exceeds the DCF valuation by 15% to 50%. Low (1-3) – The current valuation is at the low end of historic ranges and at a discount to peer valuations. The valuation reflects limited new exploration success and no commodity appreciation. Where applicable, the current capitalization exceeds the DCF valuation by less than 15% or falls below the current market value.
Political Risk: High (7-10) –Obtaining permits is challenging. Properties are located in an area(s) with high geo-political uncertainty, limited access, and/or have significant new infrastructure requirements. Moderate (4-6) – Properties are located in an area(s) with moderate geo-political risk, reasonable or manageable access, and some established infrastructure. Low (1-3) – Properties are located in areas with a manageable geo-political risk profile and established access/infrastructure.

The Weekly Dig 11/6/15
Haywood Mining [email protected] Page 37
Distribution of Ratings (as of November 6, 2015)
Distribution of Ratings IB
Clients
% # (TTM)
Buy 61.7% 66 91.7%
Hold 4.7% 5 0.0%
Sell 0.0% 0 0.0%
Tender 0.0% 0 0.0%
UR (Buy) 2.8% 3 8.3%
UR (Hold) 0.0% 0 0.0%
UR (Sell) 0.0% 0 0.0%
dropped (TTM) 30.8% 33 0.0%
Price Chart, Rating and Target Price History (as of November 6, 2015)
Alamos Gold, Inc. (AGI-T) Date Target(C$) Rating7/15/15 $9.00 Buy1/27/15 $9.25 Buy
10/23/14 $11.25 Buy4/16/14 $12.00 Buy1/29/14 $11.50 Buy1/15/14 $16.00 Buy11/1/13 $17.00 Buy6/11/13 $16.00 Buy4/26/13 $19.50 Buy2/22/13 $21.00 Buy1/8/13 $23.00 Buy
0
5
10
15
20
25
30
35
40
Dec12
Mar13
Jun13
Sep13
Dec13
Mar14
Jun14
Sep14
Dec14
Mar15
Jun15
Sep15
Price History (C$) Target/Rating/Coverage Change
Asanko Gold Inc. (AKG-T) Date Target(C$) Rating7/15/15 $3.60 Buy1/21/15 $3.20 Buy
10/23/14 $3.35 Buy4/16/14 $3.60 Buy1/15/14 $3.75 Buy
12/11/13 $3.30 Buy
Initiated Coverage 12/11/13
0
0.5
1
1.5
2
2.5
3
3.5
4
4.5
5
Nov12
Feb13
May13
Aug13
Nov13
Feb14
May14
Aug14
Nov14
Feb15
May15
Aug15
Price History (C$) Target/Rating/Coverage Change
B2Gold Corp. (BTO-T) Date Target(C$) Rating3/17/15 $2.75 Buy1/27/15 $3.25 Buy
11/17/14 $3.20 Buy10/23/14 $3.45 Buy8/15/14 $3.75 Buy7/9/14 $3.90 Buy
4/16/14 $3.80 Buy3/18/14 $3.75 Buy2/5/14 $3.50 Buy
Transferred Coverage 09/12/12; Re-Initiated Coverage 02/05/14
0
0.5
1
1.5
2
2.5
3
3.5
4
4.5
Nov12
Feb13
May13
Aug13
Nov13
Feb14
May14
Aug14
Nov14
Feb15
May15
Aug15
Price History (C$) Target/Rating/Coverage Change
Barrick Gold Corporation (ABX-T) Date Target(C$) Rating8/7/15 $11.00 Buy
7/15/15 $15.65 Hold4/29/15 $15.75 Hold2/20/15 $15.00 Hold1/27/15 $14.25 Hold
10/23/14 $17.25 Hold7/9/14 $23.50 Hold5/1/14 $23.00 Hold
2/18/14 $24.00 Hold1/15/14 $20.50 Hold
10/22/13 $20.00 Buy6/11/13 $26.50 Buy4/25/13 $34.50 Buy2/15/13 $43.50 Buy1/8/13 $46.25 Buy
0
5
10
15
20
25
30
35
40
45
50
Nov12
Feb13
May13
Aug13
Nov13
Feb14
May14
Aug14
Nov14
Feb15
May15
Aug15
Price History (C$) Target/Rating/Coverage Change
Capstone Mining Corp. (CS-T) Date Target(C$) Rating7/9/15 $1.50 Buy
1/27/15 $2.00 Buy5/8/13 $3.50 Buy
4/30/13 $3.00 UR(Buy)3/15/13 $3.00 Buy1/8/13 $3.25 Buy
11/9/12 $4.00 Buy
0
0.5
1
1.5
2
2.5
3
3.5
4
4.5
Nov12
Feb13
May13
Aug13
Nov13
Feb14
May14
Aug14
Nov14
Feb15
May15
Aug15
Price History (C$) Target/Rating/Coverage Change
Copper Mountain Mining Corporation (CUM-T) Date Target(C$) Rating7/15/15 $1.85 Buy1/27/15 $2.00 Buy1/19/15 $3.50 UR(Buy)8/11/14 $3.50 Buy7/7/14 $3.00 Hold7/7/14 $3.00 Buy
4/16/14 $2.75 Buy2/24/14 $2.50 Buy
11/12/13 $2.00 Buy10/22/13 $2.35 Buy6/11/13 $3.00 Buy5/16/13 $3.50 Buy3/20/13 $3.75 Buy1/8/13 $5.00 Buy
11/16/12 $5.50 Buy0
1
2
3
4
5
6
Nov12
Feb13
May13
Aug13
Nov13
Feb14
May14
Aug14
Nov14
Feb15
May15
Aug15
Price History (C$) Target/Rating/Coverage Change

The Weekly Dig 11/6/15
Haywood Mining [email protected] Page 38
Denison Mines Corp. (DML-T) Date Target(C$) Rating3/25/14 $2.10 Buy
Transferred & Re-initiated Coverage 08/20/12
0
0.5
1
1.5
2
2.5
Nov12
Feb13
May13
Aug13
Nov13
Feb14
May14
Aug14
Nov14
Feb15
May15
Aug15
Price History (C$) Target/Rating/Coverage Change
Detour Gold Corporation (DGC-T) Date Target(C$) Rating7/15/15 $18.50 Buy1/27/15 $14.00 Buy
10/23/14 $13.50 Buy7/31/14 $15.50 Buy7/9/14 $16.50 Buy
4/16/14 $13.75 Buy3/6/14 $12.50 Buy
1/15/14 $8.50 Buy11/11/13 $11.00 Buy10/22/13 $13.75 Buy6/11/13 $21.50 Buy4/29/13 $32.00 Buy1/8/13 $42.25 Buy
0
5
10
15
20
25
30
35
40
45
Nov12
Feb13
May13
Aug13
Nov13
Feb14
May14
Aug14
Nov14
Feb15
May15
Aug15
Price History (C$) Target/Rating/Coverage Change
Eldorado Gold Corporation (ELD-T) Date Target(C$) Rating7/15/15 $6.75 Buy2/23/15 $7.75 Buy1/27/15 $9.00 Buy
10/23/14 $9.50 Buy7/9/14 $8.50 Hold
4/16/14 $8.00 Hold2/24/14 $7.50 Hold
10/22/13 $7.50 Buy8/6/13 $14.25 Buy
6/11/13 $14.75 Buy5/6/13 $17.50 Buy
2/25/13 $19.25 Buy1/8/13 $19.75 Buy
0
5
10
15
20
25
Nov12
Feb13
May13
Aug13
Nov13
Feb14
May14
Aug14
Nov14
Feb15
May15
Aug15
Price History (C$) Target/Rating/Coverage Change
Endeavour Mining Corporation (EDV-T) Date Target(C$) Rating1/27/15 $1.30 Buy11/5/14 $1.15 Buy
10/23/14 $1.05 Buy8/21/14 $1.25 Buy
Initiated Coverage 08/21/14
0
0.5
1
1.5
2
2.5
3
Nov12
Feb13
May13
Aug13
Nov13
Feb14
May14
Aug14
Nov14
Feb15
May15
Aug15
Price History (C$) Target/Rating/Coverage Change
Energy Fuels Inc. (EFR-T) Date Target(C$) Rating9/30/15 $11.00 Buy7/15/15 $12.00 Buy7/9/14 $12.50 Buy
4/16/14 $14.00 Buy3/31/14 $15.00 Buy1/15/14 $16.00 Buy11/6/13 $16.50 Buy11/1/13 $17.50 UR(Buy)2/14/13 $17.50 Buy
Targets and prices prior to 11/06/13 adjusted for share
consolidation; Transferred & Re-initiated Coverage 08/20/12
0
2
4
6
8
10
12
14
16
18
20
Nov12
Feb13
May13
Aug13
Nov13
Feb14
May14
Aug14
Nov14
Feb15
May15
Aug15
Price History (C$) Target/Rating/Coverage Change
Foran Mining Corp. (FOM-V) Date Target(C$) Rating7/15/15 $0.35 Buy4/17/15 $0.50 Buy
10/22/13 $0.35 Buy6/11/13 $0.65 Buy4/17/13 $0.75 Buy
Initiated Coverage 04/17/13
0
0.1
0.2
0.3
0.4
0.5
0.6
0.7
0.8
Nov12
Feb13
May13
Aug13
Nov13
Feb14
May14
Aug14
Nov14
Feb15
May15
Aug15
Price History (C$) Target/Rating/Coverage Change
Highland Copper Company Inc. (HI-V) Date Target(C$) Rating7/15/15 $0.35 Buy2/27/15 $0.50 Buy
12/17/14 $0.65 Buy7/18/14 $0.75 Buy
Initiated Coverage 07/18/14
0
0.1
0.2
0.3
0.4
0.5
0.6
0.7
0.8
Nov12
Feb13
May13
Aug13
Nov13
Feb14
May14
Aug14
Nov14
Feb15
May15
Aug15
Price History (C$) Target/Rating/Coverage Change
HudBay Minerals, Inc. (HBM-T) Date Target(C$) Rating7/15/15 $12.00 Buy5/11/15 $12.00 Hold2/23/15 $11.00 Hold
10/23/14 $11.00 Buy8/1/14 $11.00 Hold
6/24/14 $10.00 Hold5/2/14 $9.50 Hold
12/19/13 $9.50 Buy
Initiated Coverage 12/19/13
0
2
4
6
8
10
12
14
Nov12
Feb13
May13
Aug13
Nov13
Feb14
May14
Aug14
Nov14
Feb15
May15
Aug15
Price History (C$) Target/Rating/Coverage Change

The Weekly Dig 11/6/15
Haywood Mining [email protected] Page 39
Integra Gold Corp. (ICG-V) Date Target(C$) Rating7/15/15 $0.70 Buy6/23/15 $0.65 Buy
Initiated Coverage 06/23/15
0
0.2
0.4
0.6
0.8
1
1.2
1.4
Nov12
Feb13
May13
Aug13
Nov13
Feb14
May14
Aug14
Nov14
Feb15
May15
Aug15
Price History (C$) Target/Rating/Coverage Change Klondex Mines Ltd. (KDX-T) Date Target(C$) Rating
7/15/15 $4.00 Buy1/22/15 $3.50 Buy
Initiated Coverage 01/22/15
0
0.5
1
1.5
2
2.5
3
3.5
4
4.5
Nov12
Feb13
May13
Aug13
Nov13
Feb14
May14
Aug14
Nov14
Feb15
May15
Aug15
Price History (C$) Target/Rating/Coverage Change
Lake Shore Gold Corp. (LSG-T) Date Target(C$) Rating7/15/15 $1.70 Buy
10/23/14 $1.30 Buy7/23/14 $1.40 Buy7/9/14 $1.20 Buy
4/16/14 $1.15 Buy1/24/14 $1.10 Hold1/15/14 $0.75 Hold6/11/13 $0.60 Hold5/17/13 $0.70 Hold3/20/13 $1.20 Buy1/8/13 $1.70 Buy
0
0.2
0.4
0.6
0.8
1
1.2
1.4
1.6
1.8
Nov12
Feb13
May13
Aug13
Nov13
Feb14
May14
Aug14
Nov14
Feb15
May15
Aug15
Price History (C$) Target/Rating/Coverage Change
Lucara Diamond Corp. (LUC-T) Date Target(C$) Rating8/13/15 $2.50 Buy4/28/15 $2.80 Buy
Initiated Coverage 04/28/15
0
0.5
1
1.5
2
2.5
3
Nov12
Feb13
May13
Aug13
Nov13
Feb14
May14
Aug14
Nov14
Feb15
May15
Aug15
Price History (C$) Target/Rating/Coverage Change
Lundin Mining Corporation (LUN-T) Date Target(C$) Rating11/2/15 $7.75 UR (Buy)7/15/15 $7.75 Buy1/27/15 $6.75 Buy
10/23/14 $7.75 Buy7/9/14 $7.50 Buy
4/16/14 $6.20 Buy6/11/13 $5.70 Buy2/25/13 $6.00 Buy1/8/13 $6.00 Hold
Transferred Coverage: 11/02/15
0
1
2
3
4
5
6
7
8
9
Nov
12
Feb
13
May
13
Aug
13
Nov
13
Feb
14
May
14
Aug
14
Nov
14
Feb
15
May
15
Aug
15
Price History (C$) Target/Rating/Coverage Change
Mandalay Resources Corp. (MND-T) Date Target(C$) Rating11/6/15 $1.25 Buy
10/23/14 $1.50 Buy8/8/14 $1.60 Buy5/7/14 $1.40 Buy
4/16/14 $1.35 Buy1/15/14 $1.30 Buy
10/22/13 $1.40 Buy6/11/13 $1.50 Buy1/8/13 $1.70 Buy
Transferred 09/12/12; Re-initiated 10/09/12
0
0.2
0.4
0.6
0.8
1
1.2
1.4
1.6
1.8
Nov12
Feb13
May13
Aug13
Nov13
Feb14
May14
Aug14
Nov14
Feb15
May15
Aug15
Price History (C$) Target/Rating/Coverage Change
Midas Gold Corp. (MAX-T) Date Target(C$) Rating7/15/15 $0.50 Hold1/27/15 $0.80 Buy1/9/15 $0.85 Buy
10/23/14 $1.15 Buy8/21/14 $1.30 Buy7/9/14 $1.40 Buy
1/15/14 $1.50 Buy11/5/13 $1.70 Buy
12/12/12 $6.20 UR(Buy)
Transferred and Re-initiated Coverage 11/05/13
0
1
2
3
4
5
6
7
Nov12
Feb13
May13
Aug13
Nov13
Feb14
May14
Aug14
Nov14
Feb15
May15
Aug15
Price History (C$) Target/Rating/Coverage Change
Mountain Province Diamonds Inc. (MPV-T) Date Target(C$) Rating7/15/15 $8.50 Buy2/19/15 $7.40 Buy2/5/15 $7.70 Buy
Initiated Coverage 02/05/15
0
1
2
3
4
5
6
7
8
9
Nov12
Feb13
May13
Aug13
Nov13
Feb14
May14
Aug14
Nov14
Feb15
May15
Aug15
Price History (C$) Target/Rating/Coverage Change

The Weekly Dig 11/6/15
Haywood Mining [email protected] Page 40
Midas Gold Corp. (MAX-T) Date Target(C$) Rating7/15/15 $0.50 Hold1/27/15 $0.80 Buy1/9/15 $0.85 Buy
10/23/14 $1.15 Buy8/21/14 $1.30 Buy7/9/14 $1.40 Buy
1/15/14 $1.50 Buy11/5/13 $1.70 Buy
12/12/12 $6.20 UR(Buy)
Transferred and Re-initiated Coverage 11/05/13
0
1
2
3
4
5
6
7
Nov12
Feb13
May13
Aug13
Nov13
Feb14
May14
Aug14
Nov14
Feb15
May15
Aug15
Price History (C$) Target/Rating/Coverage Change
Mountain Province Diamonds Inc. (MPV-T) Date Target(C$) Rating7/15/15 $8.50 Buy2/19/15 $7.40 Buy2/5/15 $7.70 Buy
Initiated Coverage 02/05/15
0
1
2
3
4
5
6
7
8
9
Nov12
Feb13
May13
Aug13
Nov13
Feb14
May14
Aug14
Nov14
Feb15
May15
Aug15
Price History (C$) Target/Rating/Coverage Change
NewCastle Gold Ltd. (NCA-V) Date Target(C$) Rating9/3/15 $0.30 Buy
7/15/15 $0.60 Buy1/27/15 $0.70 Buy
12/12/14 $0.65 Buy10/23/14 $0.75 Buy
7/9/14 $1.40 Buy4/16/14 $1.35 Buy1/15/14 $1.20 Buy
11/28/13 $1.50 Buy
Began trading 05/14/13 as Castle Mountain Mining; Initiated
Coverage 11/28/13; Name changed to NewCastle Gold 06/30/15
0
0.2
0.4
0.6
0.8
1
1.2
1.4
1.6
May13
Aug13
Nov13
Feb14
May14
Aug14
Nov14
Feb15
May15
Aug15
Price History (C$) Target/Rating/Coverage Change
Nevsun Resources Ltd. (NSU-T) Date Target(C$) Rating7/15/15 $5.00 Buy4/29/15 $5.50 Buy2/18/14 $5.00 Buy6/11/13 $4.50 Buy3/22/13 $5.00 Buy
11/13/12 $5.00 Hold
0
1
2
3
4
5
6
Nov12
Feb13
May13
Aug13
Nov13
Feb14
May14
Aug14
Nov14
Feb15
May15
Aug15
Price History (C$) Series5
NexGen Energy Ltd. (NXE-V) Date Target(C$) Rating11/5/15 $2.10 Buy
Initiated Coverage 11/05/15
0
0.1
0.2
0.3
0.4
0.5
0.6
0.7
0.8
0.9
1
Apr13
Jul13
Oct13
Jan14
Apr14
Jul14
Oct14
Jan15
Apr15
Jul15
Oct15
Price History (C$) Target/Rating/Coverage Change
NovaCopper Inc. (NCQ-T) Date Target(C$) Rating7/15/15 $1.25 Buy1/27/15 $1.75 Buy7/9/14 $2.00 Buy
3/19/14 $2.75 Buy
Began Trading 04/25/12; Initiated Coverage 03/19/14
0
0.5
1
1.5
2
2.5
3
3.5
Nov12
Feb13
May13
Aug13
Nov13
Feb14
May14
Aug14
Nov14
Feb15
May15
Aug15
Price History (C$) Target/Rating/Coverage Change
OceanaGold Corporation (OGC-T) Date Target(C$) Rating10/2/15 $4.00 Buy7/15/15 $4.10 Buy4/30/15 $3.80 Buy2/20/15 $3.60 Buy1/27/15 $3.20 Buy
10/23/14 $3.30 Buy9/22/14 $3.50 Buy
Initiated Coverage 09/22/14
0
0.5
1
1.5
2
2.5
3
3.5
4
4.5
Nov12
Feb13
May13
Aug13
Nov13
Feb14
May14
Aug14
Nov14
Feb15
May15
Aug15
Price History (C$) Target/Rating/Coverage Change
Orezone Gold Corporation (ORE-T) Date Target(C$) Rating11/2/15 $0.55 UR (Hold)
7/15/15 $0.55 Hold11/10/14 $1.10 Buy10/23/14 $1.30 Buy7/11/14 $1.35 Buy6/10/14 $1.25 Buy4/22/14 $0.90 Buy
Initiated Coverage 04/22/14; Transferred Coverage: 11/02/15
0
0.5
1
1.5
2
2.5
Nov
12
Feb
13
May
13
Aug
13
Nov
13
Feb
14
May
14
Aug
14
Nov
14
Feb
15
May
15
Aug
15
Price History (C$) Target/Rating/Coverage Change

The Weekly Dig 11/6/15
Haywood Mining [email protected] Page 41
Pilot Gold Inc. (PLG-T) Date Target(C$) Rating7/15/15 $1.50 Buy1/29/15 $1.90 Buy1/27/15 $1.60 Buy
10/23/14 $1.70 Buy4/2/14 $2.00 Buy
1/15/14 $1.70 Buy10/22/13 $2.10 Buy6/11/13 $2.60 Buy
Initiated Coverage 10/09/12
0
0.5
1
1.5
2
2.5
3
Nov12
Feb13
May13
Aug13
Nov13
Feb14
May14
Aug14
Nov14
Feb15
May15
Aug15
Price History (C$) Target/Rating/Coverage Change
Roxgold Inc. (ROG-V) Date Target(C$) Rating7/15/15 $1.10 Buy11/5/14 $1.00 Buy7/9/14 $1.25 Buy
4/23/14 $1.15 Buy1/27/14 $1.05 Buy
Initiated Coverage 01/27/14
0
0.2
0.4
0.6
0.8
1
1.2
1.4
Nov12
Feb13
May13
Aug13
Nov13
Feb14
May14
Aug14
Nov14
Feb15
May15
Aug15
Price History (C$) Target/Rating/Coverage Change
Royal Nickel Corporation (RNX-T) Date Target(C$) Rating7/15/15 $0.50 Buy1/27/15 $0.60 Buy4/16/14 $0.75 Buy
10/22/13 $0.50 Buy6/20/13 $0.75 Buy1/8/13 $1.00 Buy
0
0.2
0.4
0.6
0.8
1
1.2
Nov12
Feb13
May13
Aug13
Nov13
Feb14
May14
Aug14
Nov14
Feb15
May15
Aug15
Price History (C$) Target/Rating/Coverage Change
RTG Mining Inc. (RTG-T) Date Target(C$) Rating9/11/15 $1.30 Buy
Initiated Coverage 09/11/15
0
0.2
0.4
0.6
0.8
1
1.2
1.4
1.6
1.8
Nov12
Feb13
May13
Aug13
Nov13
Feb14
May14
Aug14
Nov14
Feb15
May15
Aug15
Price History (C$) Target/Rating/Coverage Change
Sarama Resources Limited (SWA-V) Date Target(C$) Rating7/15/15 $0.20 Buy1/27/15 $0.25 Buy
10/23/14 $0.20 Buy7/9/14 $0.40 Buy
4/15/14 $0.50 Buy1/15/14 $0.60 Buy9/17/13 $0.90 Buy6/11/13 $0.85 Buy2/1/13 $1.20 Buy
Initiated Coverage 02/01/13
0
0.2
0.4
0.6
0.8
1
1.2
1.4
Nov12
Feb13
May13
Aug13
Nov13
Feb14
May14
Aug14
Nov14
Feb15
May15
Aug15
Price History (C$) Target/Rating/Coverage Change
SEMAFO Inc. (SMF-T) Date Target(C$) Rating7/15/15 $5.00 Buy1/27/15 $5.75 Buy
10/23/14 $6.25 Buy7/9/14 $6.50 Buy
4/16/14 $5.50 Buy3/13/14 $5.25 Buy1/27/14 $4.25 Buy1/15/14 $4.00 Buy
11/14/13 $3.80 Buy10/22/13 $3.30 Buy8/27/13 $3.00 Buy8/8/13 $2.30 Buy
6/11/13 $2.80 Buy5/15/13 $3.50 Buy3/25/13 $4.00 Buy1/23/13 $5.00 Buy1/8/13 $5.50 Buy
0
1
2
3
4
5
6
7
Nov12
Feb13
May13
Aug13
Nov13
Feb14
May14
Aug14
Nov14
Feb15
May15
Aug15
Price History (C$) Target/Rating/Coverage Change
Tahoe Resources Inc. (THO-T) Date Target(C$) Rating7/15/15 $16.50 Buy4/29/15 $19.25 Buy4/2/15 $16.00 Hold
1/27/15 $14.50 Sell12/5/14 $12.75 Sell11/7/14 $15.00 Sell
10/23/14 $17.25 Sell7/9/14 $18.75 Sell
5/12/14 $17.00 Sell1/15/14 $15.00 Sell11/5/13 $15.25 Sell
Initiated Coverage 11/05/13
0
5
10
15
20
25
30
35
Nov12
Feb13
May13
Aug13
Nov13
Feb14
May14
Aug14
Nov14
Feb15
May15
Aug15
Price History (C$) Target/Rating/Coverage Change
Talon Metals Corp. (TLO-T) Date Target(C$) Rating7/15/15 $0.35 Buy
11/25/14 $0.50 Buy
Initiated Coverage 11/25/14
0
0.1
0.2
0.3
0.4
0.5
0.6
Nov12
Feb13
May13
Aug13
Nov13
Feb14
May14
Aug14
Nov14
Feb15
May15
Aug15
Price History (C$) Target/Rating/Coverage Change

The Weekly Dig 11/6/15
Haywood Mining [email protected] Page 42
B: Buy; H: Hold; S: Sell; T: Tender; UR: Under Review Source: Capital IQ and Haywood Securities
Trevali Mining Corporation (TV-T) Date Target(C$) Rating5/21/15 $1.25 Buy9/26/14 $1.35 Buy8/18/14 $1.35 Hold5/20/14 $1.15 Buy5/14/14 $1.15 UR(Buy)
12/12/13 $1.15 Buy6/11/13 $1.35 Buy2/11/13 $1.50 Buy
Initiated Coverage 02/11/13
0
0.2
0.4
0.6
0.8
1
1.2
1.4
1.6
Nov12
Feb13
May13
Aug13
Nov13
Feb14
May14
Aug14
Nov14
Feb15
May15
Aug15
Price History (C$) Target/Rating/Coverage Change
True Gold Mining Inc. (TGM-V) Date Target(C$) Rating1/15/15 $0.55 Buy
10/23/14 $0.80 Buy8/13/14 $0.75 Buy2/18/14 $0.70 Buy1/15/14 $0.60 Buy
12/18/13 $0.65 Buy6/11/13 $0.60 Buy5/9/13 $0.70 Buy3/5/13 $0.90 Buy
Initiated Coverage 03/05/13
0
0.1
0.2
0.3
0.4
0.5
0.6
0.7
0.8
0.9
1
Nov12
Feb13
May13
Aug13
Nov13
Feb14
May14
Aug14
Nov14
Feb15
May15
Aug15
Price History (C$) Target/Rating/Coverage Change
Uranium Energy Corp. (UEC-AMEX) Date Target(US$) Rating7/15/15 $2.00 Hold6/24/15 $2.10 Hold7/8/14 $1.70 Hold
4/16/14 $2.00 Hold1/15/14 $2.30 Hold
10/22/13 $2.40 Hold6/11/13 $2.70 Hold1/8/13 $3.10 Buy
Transferred & Re-initiated Coverage 08/20/12
0
0.5
1
1.5
2
2.5
3
3.5
Nov12
Feb13
May13
Aug13
Nov13
Feb14
May14
Aug14
Nov14
Feb15
May15
Aug15
Price History (US$) Target/Rating/Coverage Change
Uranium Participation Corp. (U-T) Date Target(C$) Rating7/15/15 $6.50 Buy1/27/15 $6.20 Buy
10/23/14 $5.80 Buy7/9/14 $5.70 Buy
4/16/14 $6.60 Buy1/15/14 $6.50 Buy
10/22/13 $5.70 Buy6/11/13 $6.50 Buy1/8/13 $7.80 Buy
Transferred & Re-initiated Coverage 08/20/12
0
1
2
3
4
5
6
7
8
9
Nov12
Feb13
May13
Aug13
Nov13
Feb14
May14
Aug14
Nov14
Feb15
May15
Aug15
Price History (C$) Target/Rating/Coverage Change