· i s s i ≤3.98 130° ≤ 1 ≤ 180
TRANSCRIPT
SUPPORT INFORMATION
A Systematic Analysis of Atomic Protein-Ligand Interactions from the PDB
Renato Ferreira de Freitas1, Matthieu Schapira1,2,*
1 Structural Genomics Consortium, University of Toronto, Toronto, ON M5G 1L7,
Canada2 Department of Pharmacology and Toxicology, University of Toronto, Toronto, ON
M5S 1A8, Canada
p.1 Title Page
p2. Computational Methods
p3. Figure S1. Distance and angles used to search for non-covalent interactions involving
aromatic rings; a) -stacking, b) amide stacking. The angle is the planar angle between
two rings or one ring and the amide bond
p4. Figure S2. Distance and angles used to search for halogen bonding (a) and multipolar
halogen interaction (b).
p6. Table S2. Most frequent protein-ligand interactions extracted from PDB.
p8. Figure S3. Selected molecular properties for the 11016 ligands in the database
p8. Figure S4. Distribution of the occurrence of the hydrophobic (aliphatic-aromatic)
interactions with each amino acid.
p9 Figure S5. 3D scatter plot of the hydrophobic interactions involving and aromatic
carbon from the receptor and an aliphatic carbon from the ligand.
p9. Figure S6. Distribution of the occurrence of the N-H…O interactions with each
amino acid.
p10. Figure S7. Distribution of the occurrence of the O-H…O interactions with each
amino acid.
p10. Figure S8. (a) Distribution of the occurrence of the - stacking interactions with
each amino acid.
p11. Figure S9. (a) Distribution of the occurrence of the C-H…O interactions with each
amino acid.
1
Electronic Supplementary Material (ESI) for MedChemComm.This journal is © The Royal Society of Chemistry 2017

p12. Figure S10. (a) Distribution of the occurrence of the salt bridge interactions with
each amino acid; (b) 3D scatter plot of the salt bridge interactions.
p12. Figure S11. Distribution of the occurrence of the amide- stacking interactions with
each amino acid.
p13. Figure S12. Distribution of the occurrence of the cation- stacking interactions with
each amino acid.
p13. Figure S13. Distribution of the occurrence of the halogen bonding interactions with
each amino acid.
p14. Figure S14. Distribution of the occurrence of the halogen multipolar interactions
with each amino acid.
Computational Methods
In this study, we downloaded all protein-ligand complexes available in the PDB1
(76056 PDB entries). They were extracted from a snapshot of PDB captured on
September 25, 2016, and filtered using the following criteria: (i) crystal structures with
resolution ≤ 2.5 Å, (ii) included at least one small ligand with a heavy atom count ≥6 and
≤100, (iii) structures classified as DNA or RNA were eliminated, (iv) structures that do
not contain a protein molecule, but only contain a DNA or RNA molecule complexed to a
ligand were excluded, (v) we removed all ligands containing phosphorous in their
structures (including nucleotides and nucleotide-like analogues) (vi) compounds of low
interest for medicinal chemistry applications (such as buffers) were removed using the
BioLiP list.2 These selection criteria led to a set of 11,016 PDB entries. All the complexes
were converted into ICM objects using Molsoft ICM suite.3 In this step, alternative
conformations/models molecules were removed, hydrogens were added and energy-
minimized, water hydrogen rotameric state and protonation states were fixed, missing
side chains in the protein were inserted, and partial charges and atom types were
assigned.
We wrote an icm script to examine the environment of proteins-ligand contacts.
In the first step, the script identifies all ligand and protein atoms that come within 4.0 Å
2

of each other. These close-contact atoms are then characterized according to their
respective icm and mmff atom types. In the second step, for each ligand-protein atom
pair, the respective ligand and protein atoms are expanded to include the atoms in
question and their successive neighbors. In addition, the script also extracts the distance
between the interacting atoms, their coordinates, as well as the coordinates for the
neighboring atoms. Finally, each ligand-protein atom pair that had the same icm atom
types were grouped together and saved as icm tables for further analysis.
Hydrophobic contacts were identified when a ligand carbon (or halogen) atom
comes within 4.0 Å of a receptor carbon (or sulfur) atom. A hydrogen bond was
identified if the hydrogen-bond donor was within 3.9 Å of the hydrogen-bond acceptor,
and the angle formed between the donor, the hydrogen atom, and the acceptor, θ, was
larger than 90°.4 To account for the hydrogen bonds mediated by water between the
protein and the ligand, the water were considered as part of the receptor and only the ones
tightly bound (2-3 hydrogen bond coordination) were kept for analysis.
For weak hydrogen bonding, the distance and angle cutoffs were 3.6 Å and 130°,
respectively.4 Potential salt bridges were detected when two atoms of opposite charges
were in a contact distance below 4.0 Å. The same cutoff distance was applied to a
positively charged nitrogen close to an aromatic carbon to identify potential cation-
interactions. For interactions involving two aromatic rings (or an amide and a ring), the
planar angle was calculated (Figure S1) as well as the angle between the two vectors
normal to the planes (). An edge-to-face - stacking interaction was detected if the
angle was between 60° and 120° (60° ≤ ≤ 120°). If ≤ 30° or ≥ 150° the interaction
was considered as a face-to-face - stacking interaction. The same criteria were applied
to the amide stacking interactions.
3

Figure S1. Distance and angles used to search for non-covalent interactions involving aromatic rings; a) -
stacking, b) amide stacking. The angle is the planar angle between two rings or one ring and the amide
bond.
For halogen bonding interactions we collected only those with X···A distances that are
less than their respective van der Walls radius sums plus 0.2 Å to account for the
uncertainties in the distances (Figure S2a and Table S1 for the cutoff values) as well as
with halogen bonding angles 130° ≤ α1 ≤ 180° 90° ≤ α2 ≤ 150°. For multipolar halogen
interactions, we also only considered the contacts that are less than their respective van
der Walls radius sums plus 0.2 Å and the angles 1 ≥ 140° and 70° ≤ 2 ≤ 110° (Figure
S2b).
Figure S2. Distance and angles used to search for halogen bonding (a) and multipolar halogen interaction
(b).
4

We used the fit quality (FQ) score to measure ligand efficiency of ligands with different
sizes (10.1021/jm701255b)5
FQ = LE/LEscale
LEscale= 0.0715+7.5328/(HA)+25.7079/(HA2)-361.4722/(HA3)
References
(1) Berman, H. M. The Protein Data Bank. Nucleic Acids Res. 2000, 28, 235–242.
(2) Yang, J.; Roy, A.; Zhang, Y. BioLiP: A Semi-Manually Curated Database for Biologically
Relevant Ligand-Protein Interactions. Nucleic Acids Res. 2013, 41, D1096-103.
(3) Abagyan, R.; Totrov, M. Biased Probability Monte Carlo Conformational Searches and
Electrostatic Calculations for Peptides and Proteins. J. Mol. Biol. 1994, 235, 983–1002.
(4) Jubb, H. C.; Higueruelo, A. P.; Ochoa-Montaño, B.; Pitt, W. R.; Ascher, D. B.; Blundell, T. L.
Arpeggio: A Web Server for Calculating and Visualising Interatomic Interactions in Protein
Structures. J. Mol. Biol. 2016, 429, 365–371.
(5) Reynolds, C. H.; Tounge, B. A.; Bembenek, S. D. Ligand Binding Efficiency: Trends, Physical
Basis, and Implications. J. Med. Chem. 2008, 51, 2432–2438.
5

Table S2. Most frequent protein-ligand interactions extracted from PDBInteraction Protein Atom Ligand Atom Distance (Å) Angle (°) # Interactions
Hydrophobic
aliphatic-aromatic C ali C aro ≤ 4.0 42443
aromatic-aliphatic C aro C ali ≤ 4.0 8899
aliphatic-aliphatic C ali C ali ≤ 4.0 8974
carbon-halogen C X ≤ 4.0 5147
sulfur-aromatic S C aro ≤ 4.0 1309
Hydrogen bonding
O-HO O neg OH ≤ 3.9 ≥ 90 4959
O-HO OH O neg ≤ 3.9 ≥ 90 1221
O-HO O OH ≤ 3.9 ≥ 90 1296
O-HO OH O ≤ 3.9 ≥ 90 775
N-HO NH O ≤ 3.9 ≥ 90 4872
N-HO O NH ≤ 3.9 ≥ 90 2682
N-HO NH O neg ≤ 3.9 ≥ 90 1441
N-HO O neg NH ≤ 3.9 ≥ 90 1565
N-HO NH pos O ≤ 3.9 ≥ 90 2904
N-HO O NH pos ≤ 3.9 ≥ 90 1641
N-HN NH N ≤ 3.9 ≥ 90 333
OWAT Owat O ≤ 3.9 ≥ 90 3131
NWAT Owat N ≤ 3.9 ≥ 90 1757
-Stacking
-stacking (edge to face) C aro C aro ≤ 4.0 60 ≤ θ ≤ 120 8704
-stacking (face to face) C aro C aro ≤ 4.0 ≤ 30 or ≥ 150 8537
Weak hydrogen bonding
C-HO O CH aro ≤ 3.6 ≥ 130 4927
C-HO CH aro O ≤ 3.6 ≥ 130 702
C-HO CH ali O ≤ 3.6 ≥ 130 5316
C-HO O CH ali ≤ 3.6 ≥ 130 2655
Salt bridge
NO N pos O neg ≤ 4.0 4882
ON O neg N pos ≤ 4.0 2394
Amide stacking
Amide stacking (face to face) C (amide) C aro ≤ 4.0 ≤ 30 or ≥ 150 2907
6
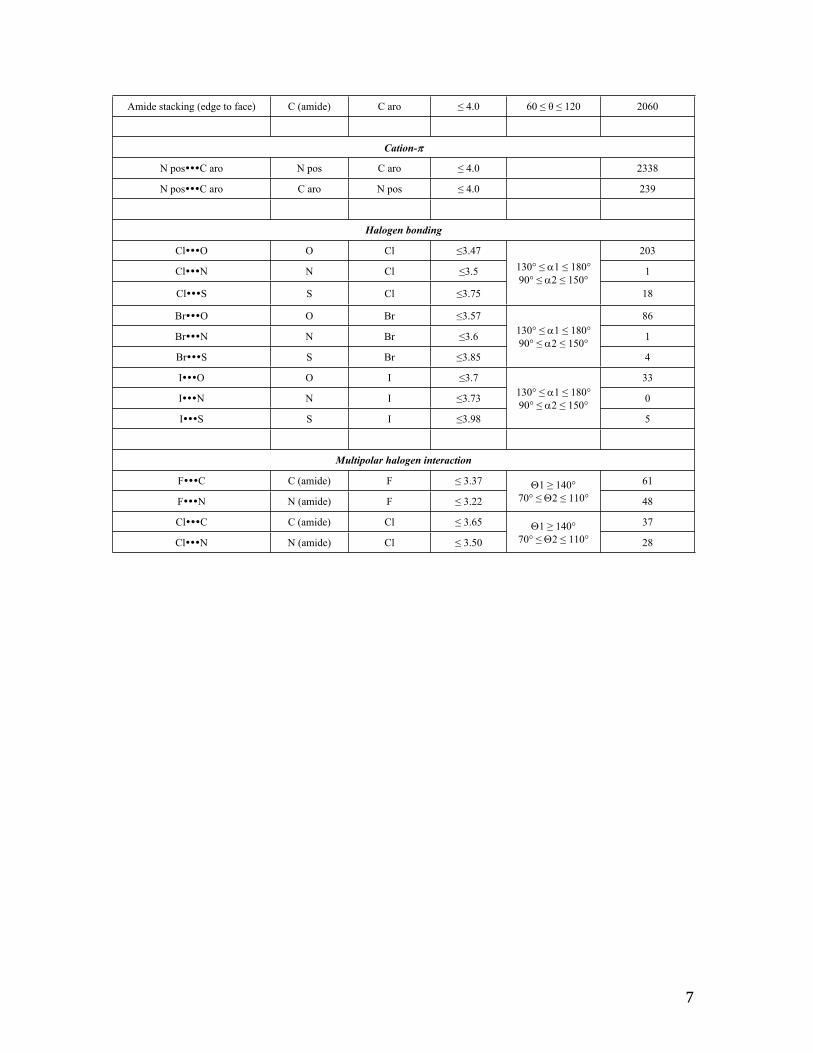
Amide stacking (edge to face) C (amide) C aro ≤ 4.0 60 ≤ θ ≤ 120 2060
Cation-
N posC aro N pos C aro ≤ 4.0 2338
N posC aro C aro N pos ≤ 4.0 239
Halogen bonding
ClO O Cl ≤3.47 203
ClN N Cl ≤3.5 1
ClS S Cl ≤3.75
130° ≤ 1 ≤ 180°90° ≤ 2 ≤ 150°
18
BrO O Br ≤3.57 86
BrN N Br ≤3.6 1
BrS S Br ≤3.85
130° ≤ 1 ≤ 180°90° ≤ 2 ≤ 150°
4
IO O I ≤3.7 33
IN N I ≤3.73 0
IS S I ≤3.98
130° ≤ 1 ≤ 180°90° ≤ 2 ≤ 150°
5
Multipolar halogen interaction
FC C (amide) F ≤ 3.37 61
FN N (amide) F ≤ 3.221 ≥ 140°
70° ≤ 2 ≤ 110° 48
ClC C (amide) Cl ≤ 3.65 37
ClN N (amide) Cl ≤ 3.501 ≥ 140°
70° ≤ 2 ≤ 110° 28
7

Avg = 25 ± 11 Avg = 2.1 ± 2.8 Avg = 359.5 ± 155.7
Avg = 3.0 ± 2.3 Avg = 6.4 ± 4.0 Avg = 76.6 ± 44.6
Figure S3. Selected molecular properties for the 11016 ligands in the database.
Figure S4. Frequency distribution of hydrophobic (aliphatic-aromatic) interactions with
each amino acid.
.
8

Phe Tyr Trp
90°
Figure S5. 3D scatter plot of the hydrophobic interactions involving an aromatic carbon
from the receptor and an aliphatic carbon from the ligand.
Figure S6. Frequency distribution of N-H…O interactions with each amino acid.
9

Figure S7. Distribution of the occurrence of the O-H…O interactions with each amino
acid.
Figure S8. (a) Distribution of the occurrence of the - stacking interactions with each
amino acid.
10

Figure S9. Distribution of the occurrence of the C-H…O interactions with each amino
acid
11

Figure S10. (a) Distribution of the occurrence of the salt bridge interactions with each
amino acid; (b) 3D scatter plot of the salt bridge interactions.
Figure S11. Distribution of the occurrence of the amide- stacking interactions with each
amino acid.
12

Figure S12. Distribution of the occurrence of the cation- stacking interactions with each
amino acid
Figure S13. Distribution of the occurrence of the halogen bonding interactions with each
amino acid
13

Figure S14. Distribution of the occurrence of the halogen multipolar interactions with
each amino acid
14