the virginia tech u.s. forest service january 2018 housing...
TRANSCRIPT

The Virginia Tech – U.S. Forest Service January 2018
Housing Commentary: Section II
Delton Alderman
Forest Products Marketing Unit
Forest Products Laboratory
U.S. Forest Service
Madison, WI
304.431.2734
2018 Virginia Polytechnic Institute and State University VCE-CNRE-12NP
Virginia Cooperative Extension programs and employment are open to all, regardless of age, color, disability, gender, gender identity, gender expression, national origin, political affiliation, race, religion, sexual orientation, genetic information, veteran status, or any other basis protected by law. An equal opportunity/affirmative action employer. Issued in furtherance of Cooperative Extension work, Virginia Polytechnic Institute and State University, Virginia State University, and the U.S. Department of Agriculture cooperating. Edwin J. Jones, Director, Virginia Cooperative Extension, Virginia Tech, Blacksburg; M. Ray McKinnie, Administrator, 1890 Extension Program, Virginia State University, Petersburg.
Urs Buehlmann
Department of Sustainable Biomaterials
College of Natural Resources & Environment
Virginia Tech
Blacksburg, VA
540.231.9759

Table of Contents
Slide 3: Federal Reserve System Indicators
Slide 37: Private Indicators
Slide 80: Demographics
Slide 94: Economics
Slide 102: Virginia Tech Disclaimer
Slide 103: USDA Disclaimer
TOC
Federal Reserve System and Private Indicators
Return to TOC

U.S. Economic Indicators
Source: https://www.frbatlanta.org/economy-matters/regional-economics/data-digests; 3/14/18 Return to TOC
Atlanta Fed GDPNow™
Latest forecast: 1.9 percent — March 14, 2018
“The GDPNow model estimate for real GDP growth (seasonally adjusted annual rate) in the first
quarter of 2018 is 1.9 percent on March 14, down from 2.5 percent on March 9. After yesterday's
Consumer Price Index release from the U.S. Bureau of Labor Statistics and this morning's retail
sales report from the U.S. Census Bureau, the nowcast of first-quarter real personal consumption
expenditures growth fell from 2.2 percent to 1.4 percent.” – Pat Higgins, Economist, Federal
Reserve Bank of Atlanta

Return to TOC
Index Points to little change in economic growth in January
Production-related indicators contributed –0.01 to the CFNAI in January, down from +0.11 in
December. Total industrial production decreased 0.1 percent in January after increasing 0.4 percent
in December. The sales, orders, and inventories category made a contribution of +0.07 to the
CFNAI in January, down slightly from +0.09 in December. The Institute for Supply Management’s
Manufacturing New Orders Index decreased to 65.4 in January from 67.4 in the previous month.
Employment-related indicators contributed +0.09 to the CFNAI in January, up from –0.02 in
December. Nonfarm payrolls increased by 200,000 in January after increasing by 160,000 in
December. The contribution of the personal consumption and housing category to the CFNAI edged
up to –0.03 in January from –0.05 in December. Housing starts increased to 1,326,000 annualized
units in January from 1,209,000 in December.” – Laura LaBarbera, Media Relations, Federal
Reserve Bank of Chicago
Chicago Fed: National Activity Index
“The Chicago Fed National Activity
Index (CFNAI) ticked down to +0.12 in
January from +0.14 in December. Two
of the four broad categories of
indicators that make up the index
decreased from December, and two of
the four categories made negative
contributions to the index in January.
The index’s three-month moving
average, CFNAI-MA3, decreased to
+0.17 in January from +0.43 in
December.
Source: https://www.chicagofed.org/publications/cfnai/index; 2/26/18

Return to TOC
U.S. Economic Indicators
Growth in Texas Manufacturing Accelerates in February
“Texas factory activity expanded at a faster pace in February, according to business executives
responding to the Texas Manufacturing Outlook Survey. The production index, a key measure of state
manufacturing conditions, rose 11 points to 27.9, signaling a pickup in output growth.
Demand growth continued at roughly the same pace as in January, while some other measures of
manufacturing activity pointed to slightly stronger growth this month. The new orders and growth rate
of orders indexes held steady at 25.3 and 15.3, respectively. The capacity utilization index rose five
points, coming in at 19.6. The shipments index also rose five points and reached 32.1, its highest
reading since 2006.
Perceptions of broader business conditions improved further in February. The general business activity
index pushed up to 37.2, its highest reading in 12 years. The company outlook index climbed four
points to 31.5, on par with its December 2017 reading, which was also the highest in 12 years. ” –
Emily Kerr, Business Economist, The Federal Reserve Bank of Dallas
Source: https://www.dallasfed.org/research/surveys/tmos/2018/1802.aspx#tab-report; 2/26/18
Federal Reserve Bank of Dallas

Return to TOC
U.S. Economic Indicators
Texas Service Sector Activity Continues to Increase
“Texas service sector activity continued to reflect expansion in February, according to business
executives responding to the Texas Service Sector Outlook Survey. The revenue index, a key measure
of state service sector conditions, came in at a reading of 13.2, similar to January.
Labor market indicators reflected faster employment growth and slightly longer workweeks this month.
The employment index rose from 6.8 to 12.3. The hours worked index was unchanged at 3.8.
Perceptions of broader economic conditions reflected less optimism in February. The general business
activity index fell five points to 17.5. The company outlook index moved down eight points to 12.9,
with 24 percent of respondents noting their outlook improved from last month and 11 percent noting it
worsened.” – Amy Jordan, Assistant Economist, The Federal Reserve Bank of Dallas
Source: https://www.dallasfed.org/research/surveys/tssos/2018/1802.aspx; 2/27/18
Return to TOC
U.S. Economic Indicators
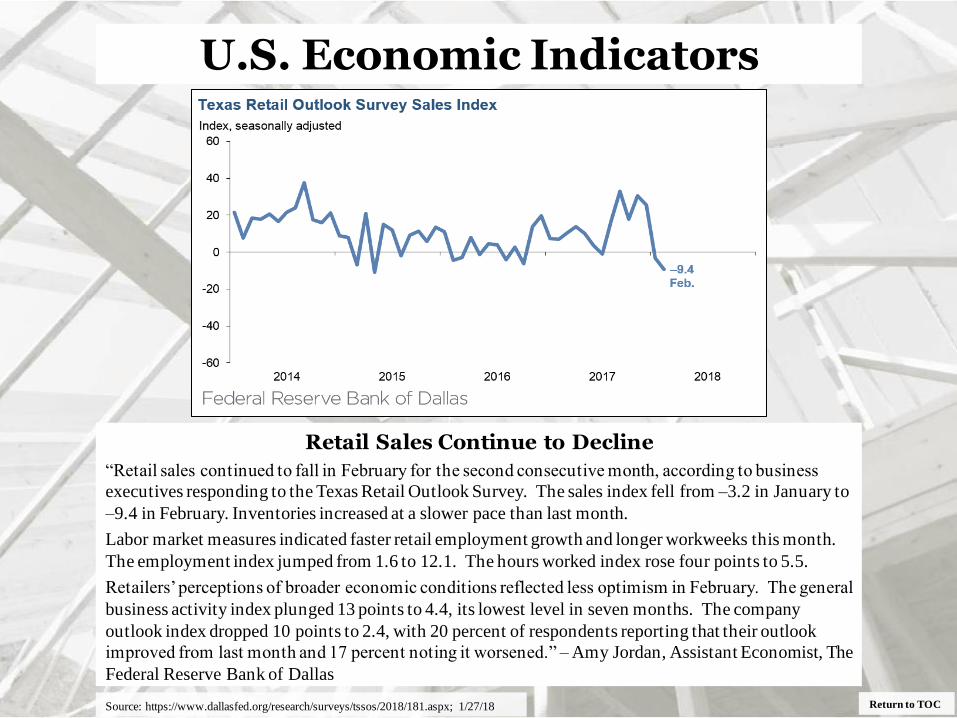
Retail Sales Continue to Decline
“Retail sales continued to fall in February for the second consecutive month, according to business
executives responding to the Texas Retail Outlook Survey. The sales index fell from –3.2 in January to
–9.4 in February. Inventories increased at a slower pace than last month.
Labor market measures indicated faster retail employment growth and longer workweeks this month.
The employment index jumped from 1.6 to 12.1. The hours worked index rose four points to 5.5.
Retailers’ perceptions of broader economic conditions reflected less optimism in February. The general
business activity index plunged 13 points to 4.4, its lowest level in seven months. The company
outlook index dropped 10 points to 2.4, with 20 percent of respondents reporting that their outlook
improved from last month and 17 percent noting it worsened.” – Amy Jordan, Assistant Economist, The
Federal Reserve Bank of Dallas
Source: https://www.dallasfed.org/research/surveys/tssos/2018/181.aspx; 1/27/18

The Federal Reserve Bank of Kansas City
Tenth District Manufacturing Survey Posted Continued Solid Growth
“The Tenth District manufacturing survey posted continued solid growth in February, and firms’
expectations for future activity increased moderately. Most price indexes rose further, with some
indexes at their highest levels in seven to ten years.
The month-over-month composite index was 17 in February, higher than 16 in January and 13 in
December (… Chart 1). The composite index is an average of the production, new orders,
employment, supplier delivery time, and raw materials inventory indexes. Factory activity grew at
both durable and non-durable goods plants, particularly for metals, machinery, and plastics
products. Most month-over-month indexes also increased. The shipments, new orders, and
employment indexes all rose moderately. The order backlog index fell from 20 to 13, and the new
orders for exports index also eased somewhat. The raw materials inventory index decreased from
15 to 8, while the finished goods inventory index was basically unchanged.” – Pam Campbell, The
Federal Reserve Bank of Kansas City
Return to TOC
U.S. Economic Indicators
Source: https://www.kansascityfed.org/~/media/files/publicat/research/indicatorsdata/mfg/2018/2018feb22mfg.pdf; 2/22/18

Return to TOC
U.S. Economic Indicators The Federal Reserve Bank of Kansas City
“February was another good month for factories in our region. A rising number of firms reported
higher input and selling prices.” – Chad Wilkerson, Vice President and Economist, The Federal
Reserve Bank of Kansas City
“Most year-over-year factory indexes were higher in February. The composite index rose from 35
to 38, and the production, shipments, new orders, and order backlog indexes also increased. The
employment index climbed from 31 to 39, and the capital expenditures index inched slightly higher.
The raw materials inventory index fell from 38 to 23, while the finished goods inventory index
increased slightly.
Future factory activity expectations improved moderately over the previous month. The future
composite index rose from 29 to 38, and the future production, shipments, new orders, and order
backlog indexes also increased. The future employment index jumped from 33 to 41, while the
future capital expenditures index moved slightly lower. The future raw materials inventory index
increased from 15 to 23, while the future finished goods inventory index decreased modestly.
Most price indexes continued to increase in February. The month-over-month finished goods price
index rose from 21 to 26, and the raw materials price index increased considerably, with both
reaching their highest levels in the last seven to nine years. The year-over-year finished goods price
index edged up from 49 to 51, its highest level since September 2011, and the year-over-year raw
materials price index moved moderately higher. The future finished goods price index climbed
from 44 to 53, reaching a ten-year high, and the future raw materials price index jumped to its
highest level in seven years.” – Pam Campbell, The Federal Reserve Bank of Kansas City
Source: https://www.kansascityfed.org/~/media/files/publicat/research/indicatorsdata/mfg/2018/2018feb22mfg.pdf; 2/22/18

Return to TOC
U.S. Economic Indicators The Federal Reserve Bank of Kansas City
LMCI suggest the level of activity increased and
momentum remained high in January
“The Kansas City Fed Labor Market Conditions Indicators (LMCI) suggest the level of
activity increased and momentum remained high in January. The level of activity indicator
increased in January from 0.49 to 0.59, while the momentum indicator decelerated from 1.42
to 1.18.
The table in the current release shows the five labor market variables that made the largest
contributions to the increase in the activity indicator over the last six months and the five
variables that made the largest positive contributions to the momentum indicator in January
2018. The activity indicator increased 0.07 over the last six months. The largest contribution
came from an increase in average hourly earnings. Sixteen variables made a positive
contribution, and eight variables made a negative contribution. The momentum indicator was
1.18 in January, where the largest contributor to momentum was initial claims. Fifteen
variables made a positive contribution, and nine variables made a negative contribution.” –
Bill Medley, Director, Public Affairs, The Federal Reserve Bank of Kansas City
Source: https://www.kansascityfed.org/~/media/files/publicat/research/indicatorsdata/lmci/2018/lmci_020718.pdf; 2/7/18

Return to TOC
U.S. Economic Indicators
Source: https://www.kansascityfed.org/~/media/files/publicat/research/indicatorsdata/lmci/2018/lmci_020718.pdf; 2/7/18
Return to TOC
Empire State Manufacturing Survey
Growth Continues
“Business activity continued to expand in New York State, according to firms responding to the
February 2018 Empire State Manufacturing Survey. The headline general business conditions
index fell five points to 13.1, suggesting a somewhat slower pace of growth than in January. The
new orders index and the shipments index were little changed, and indicated ongoing growth in
orders and shipments. Unfilled orders increased slightly, and delivery times lengthened. Labor
market conditions pointed to a modest increase in employment and hours worked. Input price
increases picked up noticeably, with the prices paid index reaching its highest level in several years.
Firms remained very optimistic about future business conditions, and capital spending plans
continued to be robust.
Manufacturing firms in New York State reported that business activity continued to expand, though
at a somewhat slower pace than last month. The general business conditions index moved down
five points to 13.1. Thirty-seven percent of respondents reported that conditions had improved over
the month, while 24 percent reported that conditions had worsened. The new orders index was little
changed at 13.5, and the shipments index was also little changed at 12.5 — readings that indicated
ongoing growth in orders and shipments. The unfilled orders index remained positive for a second
consecutive month, reflecting a small increase in unfilled orders. The delivery time index rose
eight points to 11.1, a sign that delivery times lengthened. The inventories index declined but
remained positive at 4.9, suggesting that inventory levels edged higher.” – Richard Deitz and Jason
Bram, The Federal Reserve Bank of New York
U.S. Economic Indicators
Source: https://www.newyorkfed.org/survey/empire/empiresurvey_overview.html; 2/15/18

Return to TOC
U.S. Economic Indicators
Source: https://www.newyorkfed.org/survey/empire/empiresurvey_overview.html; 2/15/18

Return to TOC
Empire State Manufacturing Survey
Input Increases Pick Up
“The index for number of employees rose to 10.9, signaling a modest increase in
employment levels, and the average workweek index rose to 4.6, indicating that hours
worked also climbed. Input price increases were noticeably higher. The prices paid index
climbed twelve points to 48.6, its highest level in nearly six years. The prices received index
held steady at 21.5, a level pointing to continued moderate selling price increases.
Firms Remain Optimistic about Future Conditions
Looking ahead, firms continued to be optimistic about the six-month outlook. The index for
future business conditions edged up two points to 50.5. The index for future delivery times
reached a record high of 15.3, indicating that firms expected longer delivery times in the
months ahead. The index for future prices paid stayed close to last month’s multiyear high,
and the capital expenditures index, at 31.9, showed that firms’ capital spending plans
remained strong.” – Richard Deitz and Jason Bram, The Federal Reserve Bank of New York
U.S. Economic Indicators
Source: https://www.newyorkfed.org/survey/empire/empiresurvey_overview.html; 2/15/18

Return to TOC
Business Leaders Survey (Services)
Business Climate Index Hits Record High
“The region’s services sector continues to experience solid growth, according to the New York
Fed’s February Business Leaders Survey. The survey’s business climate index reached a record
high, and the activity, employment, and capital spending indexes were all fairly steady at high
levels, indicating continued expansion. Firms were increasingly optimistic about future business
conditions, and strong gains in employment were expected in the months ahead. Notably, price
pressures picked up, with the prices paid index advancing to a level not seen since 2014, and the
prices received measure reaching its highest mark in six years.” – Jason Bram and Richard Deitz,
The Federal Reserve Bank of New York
U.S. Economic Indicators
Source: https://www.newyorkfed.org/survey/business_leaders/bls_overview.html; 2/16/18

Return to TOC
Business Leaders Survey
“Activity in the region’s service sector continued to grow at a solid pace, according to firms
responding to the Federal Reserve Bank of New York’s February 2018 Business Leaders Survey.
The survey’s headline business activity index edged down two points but remained firmly positive
at 15.9. The business climate index rose five points to 21.1, a record high, signaling that firms, on
balance, regarded the business climate as better than normal. The employment index moved up five
points to 15.5, indicating that employment continued to increase moderately. The wages index
climbed five points to 41.7, its highest level in more than a year, suggesting that wage growth
accelerated. The indexes for input prices and selling prices both reached multiyear highs, a sign
that price increases accelerated. Indexes for the six-month outlook suggested that firms were very
optimistic about future conditions.
Business activity in the region’s service sector continued to grow strongly. The headline business
activity index edged down two points to 15.9, pointing to a slightly slower pace of growth than last
month. Forty-one percent of respondents reported that conditions improved over the month, while
25 percent said that conditions worsened. The business climate index moved up five points to a
record-high reading of 21.1, signaling that, on balance, firms viewed the business climate as better
than normal and did so to the greatest extent in years.” – Jason Bram and Richard Deitz, The
Federal Reserve Bank of New York
U.S. Economic Indicators
Source: https://www.newyorkfed.org/survey/business_leaders/bls_overview.html; 2/16/18

Return to TOC
Business Leaders Survey
Price Increases Continue to Pick Up
“The employment index rose five points to 15.5, indicating that employment levels continued to
increase moderately. The wages index moved up for a second consecutive month, climbing five
points to 41.7, a sign that wages increased at a faster pace. The prices paid index advanced
seven points to 56.1, its highest level since 2014, pointing to an acceleration in input price
increases. The prices received index rose four points to 20.5, its highest level in more than six
years, indicating that selling price increases also picked up. The capital spending index advanced to
21.5, a sign that capital spending increased at its fastest pace in two years.
Optimism Remains Widespread
Businesses continued to be very optimistic about the six-month outlook. The index for future
business activity rose three points to 50.0, and the index for future business climate moved up three
points to 38.6. The index for future employment suggested that respondents expected employment
to increase in the months ahead, and indexes for future prices pointed to an expectation that prices
would continue to rise. The index for planned capital spending rose four points to 30.1.” – Jason
Bram and Richard Deitz, The Federal Reserve Bank of New York
U.S. Economic Indicators
Source: https://www.newyorkfed.org/survey/business_leaders/bls_overview.html; 2/16/18

The Federal Reserve Bank of New York Nowcast
Return to TOC
U.S. Economic Indicators
March 9, 2018: Highlights
• “The New York Fed Staff Nowcast stands at 2.8% for 2018:Q1 and 3.0% for 2018:Q2.” – The
Federal Reserve Bank of New York
Source: https://www.newyorkfed.org/research/policy/nowcast; 3/9/18
Notes: We start reporting the Nowcast for a reference quarter about one month before the quarter begins; we stop updating it about one month after the
quarter closes. Colored bars reflect the impact of each broad category of data on the Nowcast; the impact of specific data releases is shown in the
accompanying table.
Source: Authors' calculations, based on data accessed through Haver Analytics.

The New York Fed DSGE Model Forecast–March 2018
Return to TOC
U.S. Economic Indicators
“We describe our forecast very briefly and highlight its change since November 2017. As
usual, we wish to remind our readers that the DSGE model forecast is not an official New
York Fed forecast, but only an input to the Research staff’s overall forecasting process. For
more information about the model and variables discussed here, see our DSGE model Q & A.
The March model forecast for 2018–21 is summarized in the table below, alongside the
November 2017 forecast for the same period, and in the charts that follow. The model uses
quarterly macroeconomic data released through the fourth quarter of 2017 and available
financial data and staff forecasts through February 21, 2018.” – Michael Cai, Marco Del
Negro, Abhi Gupta, and Pearl Li, The Federal Reserve Bank of New York
Source: http://libertystreeteconomics.newyorkfed.org/2018/03/the-new-york-fed-dsge-model-forecast-march-2018.html; 3/9/18

The New York Fed DSGE Model Forecast–March 2018
Return to TOC
U.S. Economic Indicators
How do the latest forecasts compare with the November forecasts?
“The current Q4/Q4 GDP growth forecast for 2018, at 2.1 percent, is higher than in
November. Favorable financial conditions continue to provide stimulus to the economy.
Moreover, growth in the fourth quarter of 2017 was stronger than predicted by the model in
November. Growth is expected to moderate to 1.9 percent in 2019 before accelerating again
to about 2.1 percent in the following years, roughly comparable with the November forecast.
Short-run inflation forecasts are much higher than they were in November. However,
inflation is still projected to decline in the medium run, reaching 1.7 percent in 2021.
Largely reflecting the continued improvement in financial conditions, the model’s estimate of
the real natural rate of interest — the real rate of interest that would prevail in the economy
absent nominal rigidities and markup shocks — is higher over the forecast horizon relative to
the November estimate. The natural rate is projected to increase throughout the forecast
horizon, reaching 1.0 percent at the end of 2018 and 1.4 percent in 2019.” – Michael Cai,
Marco Del Negro, Abhi Gupta, and Pearl Li, The Federal Reserve Bank of New York
Source: http://libertystreeteconomics.newyorkfed.org/2018/03/the-new-york-fed-dsge-model-forecast-march-2018.html; 3/9/18

Source: https://www.philadelphiafed.org/research-and-data/regional-economy/business-outlook-survey/2018/bos0218; 2/15/18
February 2018 Manufacturing Business Outlook Survey
Most Current Indicators Improved This Month
“Results from the Manufacturing Business Outlook Survey suggest that the region’s
manufacturing sector continues to expand in February. The indexes for general activity, new
orders, and employment were all positive this month and increased from their readings last
month. Price increases for inputs were more widespread this month, according to the
respondents. The survey’s future indexes, reflecting expectations for the next six months,
suggest continued optimism.
The index for current manufacturing activity increased 4 points in February to a reading of
25.8. The index has stayed within a relatively narrow range over the past nine months (see
Chart 1). Nearly 41 percent of the firms indicated increases in activity this month, while 15
percent reported decreases. The demand for manufactured goods, as measured by the
survey’s current new orders index, showed notable improvement: The diffusion index
increased 14 points, with 41 percent of the firms reporting an increase in new orders this
month. The current shipments index remained positive but fell 15 points to 15.5. Both the
unfilled orders and delivery times indexes were positive, suggesting an increase in unfilled
orders and slower deliveries.” – Mike Trebing, Senior Economic Analyst, The Federal
Reserve Bank of Philadelphia
Return to TOC
U.S. Economic Indicators

February 2018 Manufacturing Business Outlook Survey
“The survey’s indicators for labor market conditions suggest a pickup in hiring this month.
Over 30 percent of the firms reported increases in employment this month, up from 24
percent in January. The employment index increased 8 points. The firms also reported
overall higher average work hours in February, although the workweek index fell 3 points to
13.7.” – Mike Trebing, Senior Economic Analyst, The Federal Reserve Bank of Philadelphia
Return to TOC
U.S. Economic Indicators
Source: https://www.philadelphiafed.org/research-and-data/regional-economy/business-outlook-survey/2018/bos0218; 2/15/18

February 2018 Manufacturing Business Outlook Survey
Input Prices Increases Are More Widespread
“Cost pressures were more widespread this month among the reporting manufacturers: The
prices paid index increased 12 points to 45.0, its highest reading since May 2011… . Forty-
six percent of the firms reported higher input prices this month compared with 33 percent in
January. With respect to prices received for manufactured goods, 25 percent of the firms
reported higher prices, and 1 percent reported lower prices. The prices received index edged
down 1 point to 23.9.
Firms Remain Optimistic
The survey’s six-month indicators remained at high readings in February. The diffusion
index for future general activity declined 1 point to 41.2 in February (see Chart 1). Over 55
percent of the manufacturers expect increases in activity over the next six months, while 14
percent expect declines. The indexes for future new orders and shipments improved: The
future new orders index increased 3 points, while the future shipments index increased 2
points. The future employment diffusion index increased 6 points to 40.4. Forty-five percent
of the firms expect to increase employment over the next six months. Over 44 percent of the
responding firms expect to increase capital spending over the next six months, with the future
capital spending index increasing 4 points in February, its highest reading since April 1984.”
– Mike Trebing, Senior Economic Analyst, The Federal Reserve Bank of Philadelphia
Return to TOC
U.S. Economic Indicators
Source: https://www.philadelphiafed.org/research-and-data/regional-economy/business-outlook-survey/2018/bos0218; 2/15/18

February 2018 Manufacturing Business Outlook Survey
Summary
“The February Manufacturing Business Outlook Survey indicates continued growth in
regional manufacturing this month. The demand for manufactured goods, as reflected
in new orders, showed improvement this month, and more firms added to their
payrolls. The firms reported more widespread price increases for purchased inputs this
month. In special questions this month, the firms’ forecast for their own price changes
for the next year edged higher compared with their forecast three months ago. The
indicators reflecting the firms’ overall expectations for manufacturing conditions over
the next six months remained at high levels. The firms’ expectations for future
employment and capital spending showed notable improvement this month.” – Mike
Trebing, Senior Economic Analyst, The Federal Reserve Bank of Philadelphia
Return to TOC
U.S. Economic Indicators
Source: https://www.philadelphiafed.org/research-and-data/regional-economy/business-outlook-survey/2018/bos0218; 2/15/18

Philadelphia Fed: GDPplus
Return to TOC Source: https://philadelphiafed.org/research-and-data/real-time-center/gdpplus/; 2/28/18
“As of February 28 Q4 2017 GDPplus = 2.6%; Real GDP = 2.5%; and Real
GDI = 2.4%.” – The Federal Reserve Bank of Philadelphia

Philadelphia Fed
Return to TOC Source: https://www.philadelphiafed.org/-/media/research-and-data/regional-economy/indexes/leading/2017/leadingindexes1217.pdf; 2/2/18
“The Federal Reserve Bank of Philadelphia has released the leading indexes for the 50 states for
December 2017. The indexes are a six-month forecast of the state coincident indexes (also released by the
Bank). Forty-four state coincident indexes are projected to grow over the next six months, and six are
projected to decrease.
For comparison purposes, the Philadelphia Fed has also developed a similar leading index for its U.S.
coincident index, which is projected to grow 1.4 percent over the next six months.” – Daniel Mazone, The
Federal Reserve Bank of Philadelphia

The Federal Reserve Bank of Richmond
Fifth District Manufacturing Firms Reported Robust Growth in February
“Fifth District manufacturing firms saw robust growth in February, according to the
results from the latest survey by the Federal Reserve Bank of Richmond. The
composite manufacturing index jumped from 14 in January to 28 in February, the
second highest value on record, driven by increases in shipments, orders, and
employment. The wages index remained in positive territory at 23, while the available
skills metric dropped from −10 in January to −17 in February. Despite greater
difficulty finding skilled workers, District manufacturing firms saw strong growth in
employment and the average workweek in February. Survey results show that
manufacturers expect to see continued growth in the coming months.
Manufacturing firms saw growth accelerate for both prices paid and prices received,
with each increasing at the highest rate since April 2017. Firms expect prices to
continue to grow at a faster rate in the near future.” – Jeannette Plamp, Economic
Analyst, The Federal Reserve Bank of Richmond
Return to TOC
U.S. Economic Indicators
Source: https://www.richmondfed.org/research/regional_economy/surveys_of_business_conditions/manufacturing/2018/mfg_02_27_18; 2/27/18

Return to TOC
U.S. Economic Indicators
Source: https://www.richmondfed.org/research/regional_economy/surveys_of_business_conditions/manufacturing/2018/mfg_02_27_18; 2/27/18

Return to TOC
U.S. Economic Indicators
Source: https://www.richmondfed.org/research/regional_economy/surveys_of_business_conditions/manufacturing/2018/mfg_02_27_18; 2/27/18

Return to TOC
U.S. Economic Indicators
Source: https://www.richmondfed.org/research/regional_economy/surveys_of_business_conditions/manufacturing/2018/mfg_02_27_18; 2/27/18

Return to TOC
U.S. Economic Indicators The Federal Reserve Bank of San Francisco
FRBSF FedViews
• “Based on the advance estimate of the Bureau of Economic Analysis, real GDP expanded at an
annual rate of 2.6 percent for the fourth quarter of 2017 and 2.5 percent for the year overall.
The bulk of the strength in real GDP growth can be attributed to robust consumer spending,
which in turn reflects household wage gains, increased equity prices, and supportive financial
conditions. As monetary policy continues to normalize over the next two to three years, we
expect growth gradually to fall back to our trend growth estimate of about 1.8%.
• Recent employment gains remain solid. Nonfarm payroll employment in January rose by
200,000 jobs. During 2017, payroll gains have averaged around 181,000 jobs per month.
• The unemployment rate remained at 4.1% in January, unchanged since October. We expect this
rate to fall below 4% in 2018 before gradually returning to our estimate for its natural level at
4.75%.
• Inflation continues to remain below the Federal Reserve’s 2% target. Overall inflation in the
twelve months through December, as measured by the price index for personal consumption
expenditures was 1.7%. Core inflation, which excludes volatile food and energy prices, rose
1.5% in the twelve months through December. Given the strong labor market conditions, we
expect overall and core consumer price inflation to rise gradually and reach our 2% target over
the next couple of years.” – Fernanda Nechio, Research Advisor, The Federal Reserve Bank of
San Francisco
Source: https://www.frbsf.org/economic-research/publications/fedviews/2018/february/february-08-2018; 2/8/18

Return to TOC
U.S. Economic Indicators The Federal Reserve Bank of San Francisco
FRBSF FedViews
• “The developed world is undergoing a dramatic demographic transition. In most advanced
economies, actual and expected longevity have increased steadily, while the median retirement
age has changed little, leading to longer retirement periods. Meanwhile, population growth
rates are declining and in some cases, even becoming negative.
• Changing demographics can affect the natural real rate of interest, r-star; the inflation-adjusted
interest rate that is consistent with steady inflation at the Fed’s target and the economy growing
at its potential. Demographic trends affect the equilibrium rate by changing incentives to save
and consume. Lengthier retirement periods may raise some households’ desire to save rather
than consume, lowering r-star. At the same time, declining population growth increases the
share of older households in the economy, who generally have higher marginal propensities to
consume, raising consumption and r-star. As population growth declines, it could also reduce
real GDP growth and productivity, thereby putting downward pressure on r-star.
• In the United States, these demographic changes have already put significant downward
pressure on interest rates between 1990 and 2017. As demographic movements tend to be long-
lasting, the effects on interest rates may be ongoing. A lower equilibrium rate has the potential
to limit the scope for the Federal Reserve to cut interest rates in response to future recessionary
shocks.” – Fernanda Nechio, Research Advisor, The Federal Reserve Bank of San Francisco
Source: https://www.frbsf.org/economic-research/publications/fedviews/2018/february/february-08-2018; 2/8/18

Return to TOC
U.S. Economic Indicators
Source: https://www.frbsf.org/economic-research/publications/fedviews/2018/february/february-08-2018; 2/8/18

Return to TOC
U.S. Economic Indicators
Source: https://www.frbsf.org/economic-research/publications/fedviews/2018/february/february-08-2018; 2/8/18

FHFA House Price Index
FHFA House Price Index Up 1.6 Percent in Fourth Quarter
“U.S. house prices rose 1.6 percent in the fourth quarter of 2017 according to the Federal Housing
Finance Agency (FHFA) House Price Index (HPI). House prices rose 6.7 percent from the fourth
quarter of 2016 to the fourth quarter of 2017. FHFA's seasonally adjusted monthly index for December
was up 0.3 percent from November.” – Stefanie Johnson and Corinne Russell, FHFA
Home price appreciation in the fourth quarter showed absolutely no letup throughout the U.S. As we
begin to evaluate home prices in the first quarter, we will monitor whether new headwinds—higher
mortgage rates and changes in tax laws—will lead to any moderation in the rate of house price
growth.” – Dr. Andrew Leventis, Deputy Chief Economist, FHFA
Return to TOC
U.S. Economic Indicators
Source: https://www.fhfa.gov/AboutUs/Reports/ReportDocuments/MonthlyHPI_Jan242018.pdf; 2/27/18
Source: FHFA

Return to TOC
Markit Canada Manufacturing PMI™
“At 55.6 in February, the seasonally
adjusted IHS Markit Canada
Manufacturing Purchasing Managers’
Index® (PMI™) eased only slightly from
55.9 in January and remained well above
the 50.0 no-change threshold. Improving
business conditions have been recorded in
each month since March 2016.
Manufacturing rebound continues, helped by fastest rise in export sales since November 2014
February data pointed to a relatively strong improvement in overall business conditions, which
continued the positive start to 2018 for the manufacturing sector. Robust rises in output and new
orders contributed to the sharpest pace of job creation for six months.
February data indicates that the manufacturing sector maintained its positive start to 2018. Job
creation reached a six-month high and input buying was the strongest since early-2011, suggesting
that goods producers are gearing up for a sustained improvement in demand conditions. Canadian
manufacturers widely commented on feeling a positive impact from the strengthening U.S.
economy, which meant that export sales performed particularly well in February.
However, stronger demand for raw materials resulted in intense pressure on manufacturing supply
chains, especially in relation to transportation capacity. Manufacturers noted that logistics
bottlenecks had pushed up input costs and encouraged inventory building in February. …”– Tim
Moore, Associate Director at Survey Compilers, IHS Markit
Private Indicators: Global
Source: https://www.markiteconomics.com/Survey/PressRelease.mvc/5ebb1648de2b4aea9ab636c05839d3f6; 3/1/18
Source: IHS Markit; StatCan.

Return to TOC
Caixin China General Manufacturing PMI™
Manufacturing sector continues to improve
at modest pace in February
“Adjusted for seasonal factors, including the Chinese
New Year, the headline Purchasing Managers’ Index™
(PMI™) – a composite indicator designed to provide a
single-figure snapshot of operating conditions in the
manufacturing economy – edged up to 51.6 in February,
from 51.5 in January, to signal a further improvement in
the health of the sector. Though only modest, the latest
reading signalled the strongest improvement in operating
conditions for six months.
Business conditions continued to improve across China’s manufacturing sector in February.
Although growth in production softened from that seen in January, total new work expanded at a
slightly faster pace. Meanwhile, companies continued to shed staff as part of efforts to reduce
costs, which contributed to a further rise in the level of outstanding work. Although the rate of
input price inflation eased further in February, it remained sharp overall and remained much
stronger than that seen for output charges. Business sentiment remained strongly positive in
February, with the degree of optimism reaching an 11-month high.
The stocks of finished products and stocks of purchases indices on average showed increases in the
range that indicates economic expansion, reflecting that companies were making active
preparations to start work in March. This was also reflected in a rise for the future output index.
For now, the durability of the Chinese economy will persist. Looking ahead, whether demand
generated from the beginning of work in March will gain strength will be key in determining
China’s economic direction for 2018.” – Dr. Zhengsheng Zhong, Director of Macroeconomic
Analysis, CEBM Group
Private Indicators: Global
Source: https://www.markiteconomics.com/Survey/PressRelease.mvc/b5ceb4da794b499e8e1615f40a3e41d6; 3/1/18
Source: IHS Markit, Caixin.

Return to TOC
Markit Eurozone Manufacturing PMI®
“The final IHS Markit Eurozone Manufacturing
PMI® eased to a four-month low of 58.6 in
February, down from 59.6 in January, better
than the earlier flash estimate of 58.5 and well
above its long-run average of 51.8. The PMI
has remained above the 50.0 no-change mark,
signalling expansion, for 56 months.
Eurozone manufacturing upturn remains robust in February
The eurozone manufacturing sector continued to expand at a robust pace in February. Although
rates of increase in output and new orders eased further from the highs reached before the turn of
the year, the sector is still enjoying one of its best growth spells over the past 18 years.
Although the Eurozone Manufacturing PMI fell for a second successive month in February, the
survey data indicate that factories are still enjoying their best growth spell for 18 years. The
average PMI for the first quarter so far is the second-highest since the spring of 2000, falling just
short of the near-record peak seen in the fourth quarter of last year.
The broad-based nature of the upturn is especially welcome, with all surveyed countries reporting
solid rates of expansion. Even Greece is enjoying its fastest growth for 18 years. There are signs,
however, that growth could cool further in coming months. A slowdown in growth of new export*
order inflows to an 11-month low suggests that the appreciation of the euro may be starting to curb
export sales. Job creation, while still among the highest seen in the twenty-year survey history, has
meanwhile moderated as a result of the slower inflows of orders, adding to suspicions that the
manufacturing growth peak is behind us. … .” – Chris Williamson, Chief Business Economist,
Markit®
Private Indicators: Global
Source: https://www.markiteconomics.com/Survey/PressRelease.mvc/b0f35ea860834a4ea35e374189ef2104; 3/1/18
Source: IHS Markit.

Return to TOC
Markit Eurozone Composite PMI®
“The final IHS Markit Eurozone PMI®
Composite Output Index posted 57.1 in
February, down from January’s near 12-
year high of 58.8, but well above the series
average of 53.0. The headline index has
signalled expansion in each of the past 56
months, although the latest reading was
slightly below the flash estimate of 57.5.
Eurozone economic growth remains elevated in February
Although pulling back from January’s near 12-year high to a four-month low in February, the rate
of output growth in the euro area remained robust. Manufacturers and service providers saw
continued strong inflows of new business, while job creation and price pressures also remained
elevated. The manufacturing sector again registered stronger output growth than services. Both
sectors also continued to enjoy the best periods of expansion for seven years, despite seeing rates of
increase in output and new orders easing across the board in February.
The upturn also remains as broad as it is strong. Italy is set for its best quarter for 12 years while
Germany is enjoying the steepest growth for seven years so far this year. French growth remains
strong despite easing slightly since the final quarter of last year, and Spain is set for its best quarter
since the strong upturn seen in the spring of 2017.” – Chris Williamson, Chief Business Economist,
Markit®
Private Indicators: Global
Source: https://www.markiteconomics.com/Survey/PressRelease.mvc/9fc57899736d40ed849f5e3e80784928; 3/5/18
Sources: IHS Markit, Eurostat..

Return to TOC
Markit/BME Germany Manufacturing PMI®
“The headline IHS Markit/BME Germany Manufacturing
PMI – a single-figure snapshot of the performance of the
manufacturing economy – dipped to 60.6 in February, from
January’s 61.1. The latest reading was well above the 50.0
no-change mark, indicating another month of strong growth
within the sector. However, since reaching a record-high at
the end of 2017, the PMI has retreated for two consecutive
months, down to its lowest level since last October.
Manufacturing boom shows signs of easing amid supply-chain constraints
Germany’s booming manufacturing sector grew at a slightly slower rate in February, according to the
latest PMI® survey data from IHS Markit and BME, with reports of supply-chain bottlenecks helping
drive up costs and prices charged at the factory gate. Despite easing in February, output growth across
Germany’s factories remained strong and among the highest seen since early-2011. The expansion was
led by consumer and capital goods sectors, which both recorded similarly steep increases in levels of
output.
Although February’s final manufacturing PMI reading came in higher than the preliminary ‘flash’
estimate, the overall message from the survey data is unchanged: the sector continues to grow strongly
but is showing signs of easing off from the record highs seen at the end of 2017. Insight into why the
pace of growth has tempered slightly can be gleaned from some of the survey’s sub-indices. Recent
months have seen manufacturers hiking up output prices, under pressure from spiralling costs. The
problem lies largely in supply chains, where capacity issues have led to bottlenecks forming and
allowed vendors to negotiate higher prices as demand outstrips supply. The seriousness of the problem
is highlighted by the survey’s measure of delivery times, which in February showed the greatest
deterioration in supplier performance in 22 years of data collection.” – Phil Smith, Principal Economist,
IHSMarkit® Source: https://www.markiteconomics.com/Survey/PressRelease.mvc/34af65ffd0ff48329cd55d6665adea49; 3/1/18
Private Indicators: Global
Source: IHS Markit, Budesbank

Return to TOC
JP Morgan Global Manufacturing PMI™
“The J.P. Morgan Global All-Industry Output
Index – which is produced by J.P. Morgan and
IHS Markit in association with ISM and
IFPSM – rose to a 41-month high of 54.8 in
February, up from 54.6 in January. The
headline index has now signalled expansion
for 65 successive months. Output index
readings were identical for manufacturing and
services, representing a four-month low for
the former and 35-month high for the latter.
Global economic growth strengthens in February
The rate of expansion in global economic output accelerated to a near three-and-a-half year high in
February, as stronger growth in the service sector offset a slightly weaker upturn at manufacturers. The
upturn remained broad-based by sub-sector, with output rising across the six areas of economic activity
covered by the survey in February. The fastest increases were in the business services, consumer goods
and financial services categories, all of which saw growth pick up. Rates of expansion eased in the
consumer services, intermediate goods and investment goods sectors.
The level of incoming new business rose to the greatest extent since June 2014. This led to another
increase in backlogs of work, which companies responded to by raising capacity.
The February PMI surveys signalled a further acceleration in the rate of expansion in global economic
output. According to the PMI, growth hit a near three-and-a-half year high, as inflows of new business
strengthened. The acceleration was mainly led by the service economy, as signs of growth slowdown
from recent highs were observed in manufacturing. With economic conditions remaining solid overall,
global growth should remain solid in coming months.” – David Hensley, Global Economist, J.P.
Morgan
Private Indicators: Global
Source: https://www.markiteconomics.com/Survey/PressRelease.mvc/89c9566e29df4c3ab2e9a419a0a2c0de; 3/5/18
Source: IHS Markit
Return to TOC
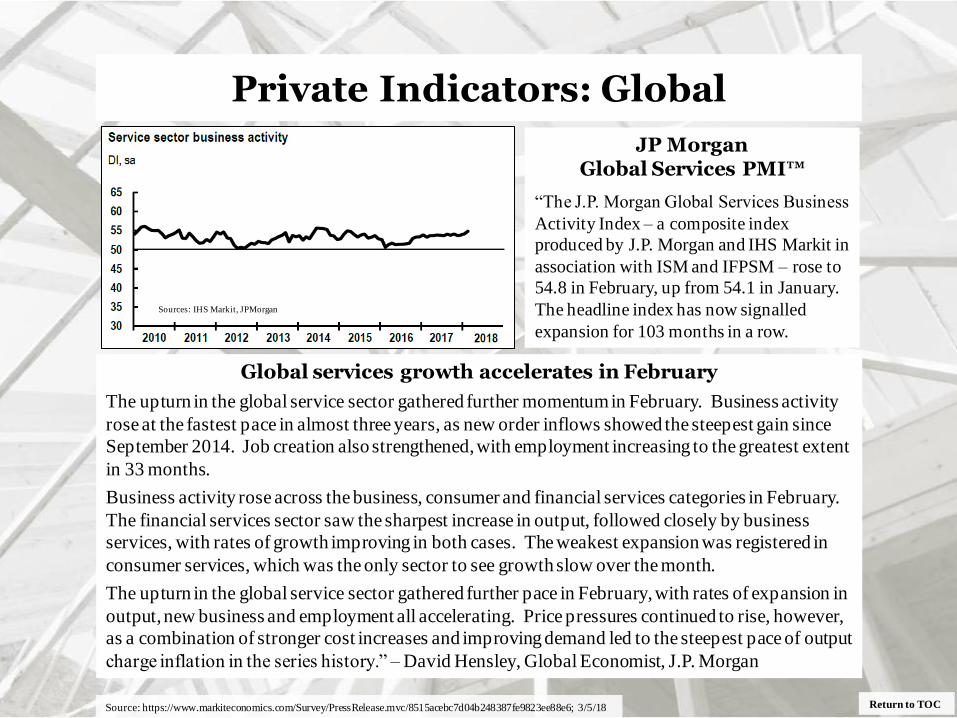
JP Morgan Global Services PMI™
“The J.P. Morgan Global Services Business
Activity Index – a composite index
produced by J.P. Morgan and IHS Markit in
association with ISM and IFPSM – rose to
54.8 in February, up from 54.1 in January.
The headline index has now signalled
expansion for 103 months in a row.
Global services growth accelerates in February
The upturn in the global service sector gathered further momentum in February. Business activity
rose at the fastest pace in almost three years, as new order inflows showed the steepest gain since
September 2014. Job creation also strengthened, with employment increasing to the greatest extent
in 33 months.
Business activity rose across the business, consumer and financial services categories in February.
The financial services sector saw the sharpest increase in output, followed closely by business
services, with rates of growth improving in both cases. The weakest expansion was registered in
consumer services, which was the only sector to see growth slow over the month.
The upturn in the global service sector gathered further pace in February, with rates of expansion in
output, new business and employment all accelerating. Price pressures continued to rise, however,
as a combination of stronger cost increases and improving demand led to the steepest pace of output
charge inflation in the series history.” – David Hensley, Global Economist, J.P. Morgan
Private Indicators: Global
Source: https://www.markiteconomics.com/Survey/PressRelease.mvc/8515acebc7d04b248387fe9823ee88e6; 3/5/18
Sources: IHS Markit, JPMorgan

Return to TOC
Markit/CIPS UK Manufacturing PMI™
“The upturn in the UK manufacturing sector
slowed further during February. At 55.2, the
seasonally adjusted IHS Markit/CIPS
Purchasing Managers’ Index® (PMI®) fell to
an eight-month low and lost further ground
after hitting a 51-month high last November.
UK PMI slips to eight-month low as slower output
growth offsets stronger new order inflows
Manufacturing production increased at the slowest pace for 11 months in February, with
decelerations seen across the consumer, intermediate and investment goods sectors. Brighter news
was provided by the trend in new orders, which rose at a faster pace than in January. Companies
indicated that domestic demand strengthened, while new export business rose at a solid (albeit
slower) pace.
The February survey provided mixed signals on the health of the UK manufacturing sector. The
PMI’s Output Index fell to its second-lowest level since the EU referendum and, based on its past
relationship with official ONS data, is consistent with only a subdued 0.4% quarterly pace of
growth in production volumes. This would represent a marked downshift from the 1.3% increase
signalled for the final quarter of 2017, providing a further brake on the rate of expansion in the
wider economy. However, positive news was provided by other survey indicators that are
suggesting output growth may revive in the coming months. New orders showed the largest
monthly gain since November and are outpacing the rate of growth in output to one of the greatest
extents in more than a decade. Stocks of finished goods fell, raising the forward looking new
orders to inventory ratio, while companies remained sufficiently confident in the outlook to take on
more staff. … .” – Rob Dobson, Director & Senior Economist, IHS Markit
Private Indicators: Global
Source: https://www.markiteconomics.com/Survey/PressRelease.mvc/96ba41bca3ee47309dc2fe2635b93216; 3/1/18
Sources: IHS Markit

Private Indicators American Institute of Architects (AIA)
January Architecture Billings Index
Firms start the year with strong billings
“Architecture firms started 2018 on a positive note as AIA’s Architecture Billings Index (ABI) score
rose to 54.7, its highest January score since 2007. Any score over 50 indicates an increase in
billings, and a higher score than in December of 2017 means that billings continues to grow in the
new year. Inquiries into new projects also remained strong, as did the share of firms reporting an
increase in the value of new signed design contracts — a good indicator of work in the pipeline.
Firms have seen consistently strong growth in new project activity for the last 15 months.” – Kermit
Baker, Chief Economist, AIA , Honorable AIA
Return to TOC Source: http://aiad8.prod.acquia-sites.com/sites/default/files/2018-02/ABI-January2018.pdf/; 2/25/18
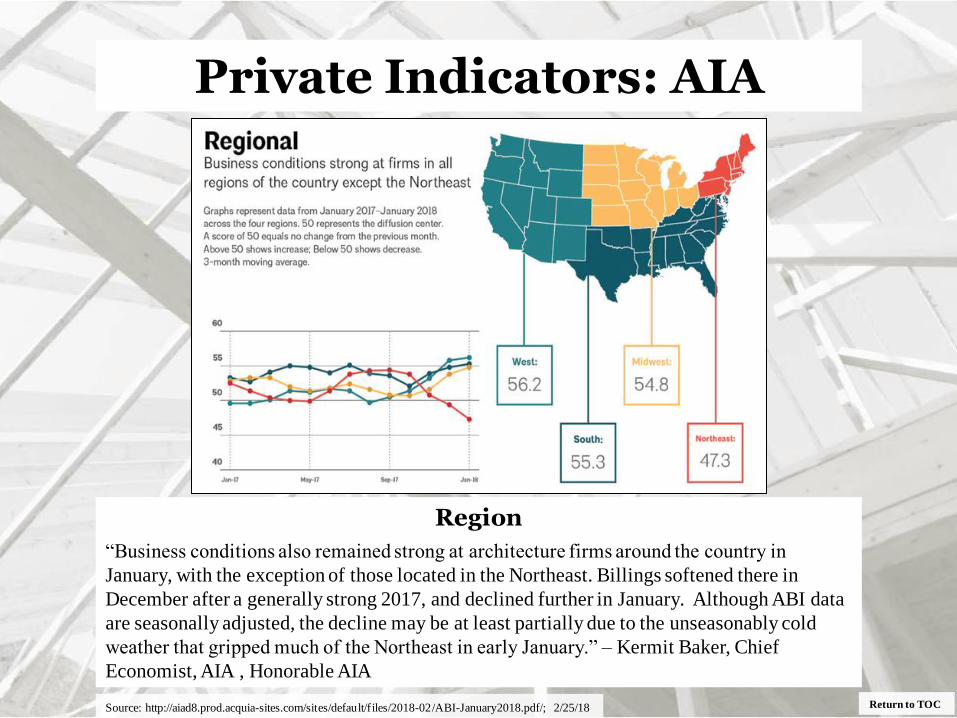
Private Indicators: AIA
Region
“Business conditions also remained strong at architecture firms around the country in
January, with the exception of those located in the Northeast. Billings softened there in
December after a generally strong 2017, and declined further in January. Although ABI data
are seasonally adjusted, the decline may be at least partially due to the unseasonably cold
weather that gripped much of the Northeast in early January.” – Kermit Baker, Chief
Economist, AIA , Honorable AIA
Return to TOC Source: http://aiad8.prod.acquia-sites.com/sites/default/files/2018-02/ABI-January2018.pdf/; 2/25/18
Private Indicators: AIA
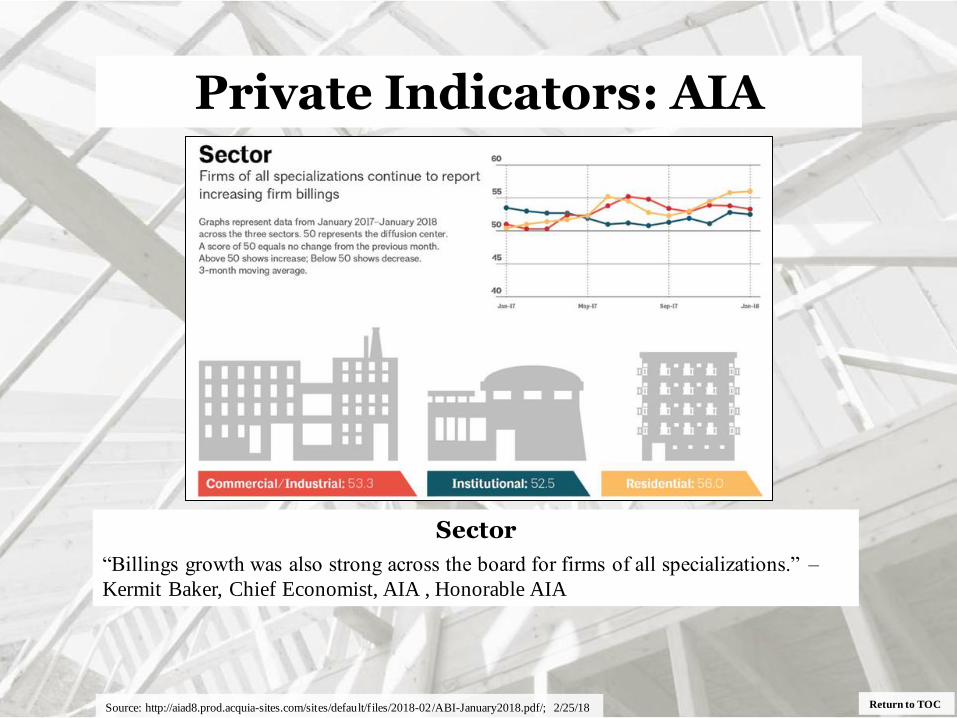
Return to TOC
Sector
“Billings growth was also strong across the board for firms of all specializations.” –
Kermit Baker, Chief Economist, AIA , Honorable AIA
Source: http://aiad8.prod.acquia-sites.com/sites/default/files/2018-02/ABI-January2018.pdf/; 2/25/18

Private Indicators
Dodge Data & Analytics
January Construction Starts Slip 2 Percent
Public Works Weakens, While Nonresidential Building Edges Up and Multifamily Housing Rebounds
“The value of new construction starts in January receded 2% to a seasonally adjusted
annual rate of $725.9 billion, easing slightly after December’s 13% hike, according to
Dodge Data & Analytics. The nonbuilding construction sector, comprised of public
works and electric utilities/gas plants, pulled back 18% after surging 45% in
December, … . In addition, residential building climbed 7% in January, helped by a
rebound for multifamily housing after three straight months of declines. On an
unadjusted basis, total construction starts in January were $52.2 billion, down 7% from
the same month a year ago. On a twelve-month moving total basis, total construction
starts in the twelve months ending January 2018 were up 2% from the twelve months
ending January 2017.
The January statistics produced a reading of 154 for the Dodge Index (2000=100),
compared to December’s upwardly revised 156. During 2017, the pattern of
construction starts frequently showed an up-and-down pattern, which was present
towards the end of last year when the Dodge Index fell to 138 in November followed
by 156 in December. The 154 reading for the Dodge Index in January, along with
December’s 156, shows construction starts climbing back close to last year’s mid-
range of activity. For 2017 as a whole, the Dodge Index averaged 159.” – Benjamin
Gorelick, Spector & Associates
Return to TOC Source: https://www.construction.com/news/january-construction-starts-slip-2-percent-feb-2018; 2/22/18

Private Indicators
Dodge Data & Analytics
“Although the expansion for the construction industry lost some momentum during 2017, on a
broad level it can be characterized as deceleration as opposed to decline. January’s level of activity,
which held close to last year’s mid-range, is consistent with the picture of a decelerating expansion.
The factors affecting construction activity going forward in 2018 have become more varied. Some
dampening may come from higher material prices and tight labor markets, yet while interest rates
are rising the increases are expected to stay moderate this year. The tax reform legislation is
anticipated to lift economic growth in the near term, which may benefit commercial building and
manufacturing construction starts. The Trump Administration has provided the outline of an
infrastructure program, but the details need to be worked out by Congress against the backdrop of a
growing federal budget deficit, which may limit any benefit this year for public works. One plus
for 2018 is that the institutional side of nonresidential building should stay close to last year’s
elevated pace.
Useful perspective is made possible by looking at twelve-month moving totals, in this case the
twelve months ending January 2018 versus the twelve months ending January 2017, which reveal
total construction starts advancing 2%. By major sector, nonbuilding construction grew 2%, with
public works up 12% and electric utilities/gas plants down 29%. Nonresidential building increased
3%, with institutional building up 7%, commercial building down 5%, while manufacturing plant
starts climbed 26%. Residential building grew 2%, with single family housing up 8% while
multifamily housing fell 12%.” – Robert A. Murray, Chief Economist, Dodge Data & Analytics
Return to TOC Source: https://www.construction.com/news/january-construction-starts-slip-2-percent-feb-2018; 2/22/18

Private Indicators
Dodge Data & Analytics
“Residential building in January was $331.3 billion (annual rate), up 7%. Multifamily
housing jumped 39%, showing renewed strength after the loss of momentum that took place
during the closing months of 2017. During January, there were eleven multifamily projects
valued at $100 million or more that reached groundbreaking, compared to four such projects
in December. The largest January multifamily projects were the $260 million multifamily
portion of a $289 million mixed-use complex in San Jose CA, a $250 million multifamily
high-rise in Jersey City NJ, and a $175 million multifamily high-rise in Houston TX.
In January, the top five metropolitan markets ranked by the dollar amount of multifamily
starts were – New York NY, Miami FL, Boston MA, Houston TX, and Washington DC.
Metropolitan areas ranked 6 through 10 were – San Jose CA, Philadelphia PA, San Francisco
CA, St. Louis MO, and Seattle WA.
Single family housing in January receded 3%, settling back after the modest gains reported
during the previous five months. In January, single family housing showed this pattern by
major region – the West, down 11%; the South Central, down 2%; the South Atlantic, down
1%; the Midwest, unchanged; and the Northeast, up 9%.”– Robert A. Murray, Chief
Economist, Dodge Data & Analytics
Return to TOC Source: https://www.construction.com/news/january-construction-starts-slip-2-percent-feb-2018; 2/22/18

Private Indicators
Return to TOC Source: https://www.construction.com/news/january-construction-starts-slip-2-percent-feb-2018; 2/22/18

Private Indicators
Dodge Data & Analytics
Commercial and Multifamily Construction Starts in 2017 Settled Back in Many of the Top U.S. Metropolitan Areas
Moderate Declines Followed Elevated Activity in 2016
“Many of the leading U.S. metropolitan areas for commercial and multifamily construction starts
showed reduced activity in 2017 compared to levels reported during 2016, according to Dodge Data &
Analytics. Of the top ten markets ranked by the dollar amount of construction starts, seven registered
declines, one was essentially unchanged, and just two showed greater activity in 2017. For the
metropolitan areas ranked 11 through 20, the 2017 performance was more evenly balanced, with four
reporting declines, one essentially unchanged, and five reporting gains. At the national level, the
volume of commercial and multifamily construction starts was $194.7 billion, down 7% from 2016,
although still 8% above the amount reported for 2015.
The New York NY metropolitan area, at $25.2 billion in 2017, continued to be the leading market in the
U.S. for commercial and multifamily construction starts, although it dropped 16% from its 2016
amount. New York NY’s share of the U.S. total was 13% in 2017, down from 14% in 2016 and 19% in
2015. After reaching its most recent peak back in 2015 at an exceptional $34.9 billion, New York NY
has seen its commercial and multifamily dollar amount slide by 28%. The other six metropolitan areas
in the 2017 top ten with declines from their 2016 amounts were – Los Angeles CA ($8.1 billion), down
20%; Dallas-Ft. Worth TX ($7.5 billion), down 17%; Washington DC ($7.3 billion), down 16%; Miami
FL ($6.6 billion), down 20%; Chicago IL ($6.5 billion), down 26%; and Boston MA ($5.4 billion),
down 26%. Each of these six metropolitan areas had registered double-digit gains of at least 25%
during 2016, and while each retreated during 2017 five were able to stay above their respective 2015
amounts (the exception being Miami FL). Holding steady in 2017 was Seattle WA ($6.0 billion), while
2017 gains were reported for San Francisco CA ($7.3 billion), up 29%; and Atlanta GA ($6.5 billion),
up 24%. … .” – Benjamin Gorelick, Spector & Associates
Return to TOC Source: https://www.construction.com/news/commercial-multifamily-construction-starts-2017-settled-back-many-top-us-metropolitan-areas; 2/14/18

Private Indicators
Return to TOC Source: https://www.construction.com/news/commercial-multifamily-construction-starts-2017-settled-back-many-top-us-metropolitan-areas; 2/14/18

Private Indicators
Dodge Data & Analytics
Commercial and Multifamily Construction Starts in 2017 Settled Back in Many of the Top U.S. Metropolitan Areas
“For the metropolitan areas ranked 11 through 20, decreased commercial and multifamily
construction starts for 2017 were reported for Denver CO ($3.2 billion), down 25%; Phoenix AZ
($2.6 billion), down 15%; Nashville TN ($2.5 billion), down 8%; and San Jose CA ($2.5 billion),
down 1%. Houston TX ($3.9 billion), held steady with its 2016 amount even with the dislocations
caused by Hurricane Harvey. Double-digit growth was reported in 2017 for Philadelphia PA ($4.1
billion), up 31%; and Orlando FL ($2.9 billion), up 24%. More modest increases were reported for
Austin TX ($3.2 billion), up 2%; Baltimore MD ($2.7 billion), up 4%; and San Diego CA ($2.6
billion), up 8%.
The commercial and multifamily total is comprised of office buildings, stores, hotels, warehouses,
commercial garages, and multifamily housing. The 7% drop for commercial and multifamily
construction starts at the U.S. level in 2017 reflected mostly a multifamily pullback. Multifamily
construction starts at the U.S. level in 2017 dropped 12% to $84.9 billion, which followed a 10%
increase in 2016 ($96.1 billion). Commercial building construction starts in 2017 slipped 3% to
$109.8 billion, staying close to the 2016 level ($113.1 billion) achieved with a 22% hike that year.”
– Benjamin Gorelick, Spector & Associates
Return to TOC Source: https://www.construction.com/news/commercial-multifamily-construction-starts-2017-settled-back-many-top-us-metropolitan-areas; 2/14/18

Private Indicators
Dodge Data & Analytics
Commercial and Multifamily Construction Starts in 2017 Settled Back in Many of the Top U.S. Metropolitan Areas
“Of the commercial and multifamily project types, multifamily housing is the one that appears to
have already reached its peak and is now heading downward, as shown by the 12% decline in dollar
terms during 2017. The expansion for multifamily housing began back in 2010, and in 2015 it
benefitted from a surge of activity in the New York NY metropolitan area and then in 2016 it
showed broader growth geographically due to strong gains by other major metropolitan areas. That
pattern shifted in 2017, as markets such as Los Angeles CA, Dallas-Ft. Worth TX, and Washington
DC retreated from the levels posted during 2016. Multifamily vacancy rates, while still low
historically, have been edging up slightly on a year-over-year basis for almost two years. In
addition, the banking sector has taken a more cautious stance towards lending for multifamily
projects. In the most recent survey of bank lending officers by the Federal Reserve. 16% of the
respondents indicated that they had tightened standards for multifamily loans during the fourth
quarter of 2017, compared to just 1% of the respondents that reported tightening for nonresidential
building project loans. At the same time, the downturn for multifamily housing at the national level
is expected to stay moderate for the near term, as the latecomers to the multifamily expansion,
particularly in the smaller markets, continue to see growth.
By geography, eight of the top ten commercial and multifamily markets in 2017 registered declines
for multifamily housing – New York NY, down 4%; Los Angeles CA, down 17%; Dallas-Ft. Worth
TX, down 26%; Washington DC, down 23%; Miami FL, down 50%; Chicago IL, down 24%;
Seattle WA, down 10%; and Boston MA, down 29%. The two markets in the top ten showing
multifamily gains in 2017 were San Francisco CA, up 3%; and Atlanta GA, up 26%.” – Robert A.
Murray, Chief Economist, Dodge Data & Analytics
Return to TOC Source: https://www.construction.com/news/commercial-multifamily-construction-starts-2017-settled-back-many-top-us-metropolitan-areas; 2/14/18

Private Indicators
Dodge Data & Analytics
Commercial and Multifamily Construction Starts in 2017 Settled Back in Many of the Top U.S. Metropolitan Areas
“The picture for commercial building is mixed, as both office buildings and warehouses seem to
still be in the process of reaching a peak. Although downtown and suburban office vacancy rates
edged up slightly in the fourth quarter of 2017, they remain low by recent standards, and warehouse
vacancy rates have not yet begun to rise in a sustained manner. At the same time, the lodging sector
is seeing slower growth for revenue per available room compared to a few years ago, and hotel
construction starts are easing back, particularly from 2016 which saw several very large hotel and
casino projects reach the construction start stage. As for store construction, its 10% retreat in dollar
terms at the national level during 2017 is consistent with its weak performance in the overall
expansion for commercial building to date.
By geography, six of the top ten commercial and multifamily markets in 2017 registered declines
for commercial building – New York NY, down 28%; Los Angeles CA, down 23%; Dallas-Ft.
Worth TX, down 12%; Washington DC, down 8%; Chicago IL, down 28%; and Boston MA, down
22%. The four markets in the top ten showing commercial building gains in 2017 were San
Francisco CA, up 57%; Miami FL, up 40%; Atlanta GA, up 24%; and Seattle WA, up 8%.” –
Robert A. Murray, Chief Economist, Dodge Data & Analytics
Return to TOC Source: https://www.construction.com/news/commercial-multifamily-construction-starts-2017-settled-back-many-top-us-metropolitan-areas; 2/14/18

Return to TOC
Private Indicators
MNI Chicago February Chicago
Business Barometer Declines to 61.9
“The MNI Chicago Business
Barometer fell 3.8 points to 61.9
in February, down from 65.7 in
January, to the lowest level since
August 2017.
New Orders Fall to Six-Month Low; Input Price Inflation Eases
Business activity continued to expand in February, although at a softer pace than in January. All
five of the Barometer components receded on the month, but despite a second straight monthly fall,
the Barometer was still up 8% on last February and above the 2017 average of 60.8. As in January,
firms reported a slower pace of both incoming orders and output in February. The New Orders
indicator fell to a six-month low, contributing the most to the Barometer’s decline, while the
Production indicator also fell in February, down to a level last seen lower in September. Despite
trending lower recently, however, both indicators remain elevated relative to recent years.
Disruptive weather conditions this month and large promotions at the back-end of last year appear
to have weighed on demand and output in February, but despite the Barometer’s broad -based
decline activity remains upbeat. That said, a large proportion of firms are anxious about the cost of
input materials, and warn they could pass on these higher costs to consumers if inflationary
pressures do not abate.” – Jamie Satchi, Economist, MNI Indicators
Source: https://www.ism-chicago.org/index.cfm; 2/28/18

Private Indicators
Return to TOC
The Conference Board Leading Economic Index® (LEI) for the U.S. increased 1.0 percent in January to 108.1 (2016 = 100), following a 0.6 percent
increase in December, and a 0.4 percent increase in November..
Source: https://www.conference-board.org/data/bcicountry.cfm; 2/22/18
Economic Growth to Continue Through First Half of 2018
“The U.S. LEI accelerated further in January and
continues to point to robust economic growth in
the first half of 2018. While the recent stock
market volatility will not be reflected in the U.S.
LEI until next month, consumers’ and business’
outlook on the economy had been improving for
several months and should not be greatly
impacted. The leading indicators reflect an
economy with widespread strengths coming
from financial conditions, manufacturing,
residential construction, and labor markets.” –
Ataman Ozyildirim, Director of Business Cycles
and Growth Research, The Conference Board
“The Conference Board Coincident Economic Index® (CEI) for the U.S. increased 0.1 percent in
January to 103.0 (2016 = 100), following a 0.3 percent increase in December, and a 0.2 percent
increase in November.
The Conference Board Lagging Economic Index® (LAG) for the U.S. increased 0.1 percent in
January to 104.0 (2016 = 100), following a 0.7 percent increase in December and a 0.1 percent
increase in November.” – The Conference Board
U.S. Composite Economic Indexes (2016 = 100)

Private Indicators
Return to TOC
The Conference Board Help Wanted OnLine® (HWOL)
Online Job Ads Decreased 185,700 in February 2018
• “ February 2018 shows large drop following a flat January
• Loss widespread across most States and MSAs
Online advertised vacancies decreased 185,700 to 4,717,600 in February, according to The Conference
Board Help Wanted OnLine® (HWOL) Data Series, released today. The January Supply/Demand
rate stands at 1.36 unemployed for each advertised vacancy, with a total of 1.8 million more
unemployed workers than the number of advertised vacancies. The number of unemployed was
approximately 6.7 million in January.
The Professional occupational category saw changes in Healthcare practitioners and technical (-88.5)
and Computer and mathematical science (14.9). The Services/Production occupational category saw
losses in Sales (-27.6), Transportation(-24.1), and Office and admin (-20.6).” – Carol Courter, The
Conference Board
Source: https://www.conference-board.org/data/helpwantedonline.cfm; 3/7/18
Source: The Conference Board
Private Indicators
Return to TOC
Equipment Leasing and Finance Association
Confidence Remains High in February
“The Equipment Leasing & Finance Foundation (the Foundation) releases the February
2018 Monthly Confidence Index for the Equipment Finance Industry (MCI-EFI) today.
Designed to collect leadership data, the index reports a qualitative assessment of both
the prevailing business conditions and expectations for the future as reported by key
executives from the $1 trillion equipment finance sector. Overall, confidence in the
equipment finance market is 73.2 in February, easing from 75.3 in January, which was
an all-time high level for the index.” – Anneliese DeDiemar, Author, Equipment
Leasing & Finance Association
“Our strong start to the year could be tempered with the recent volatility of the stock
market and overall fears of rate increases. I believe by the end of the quarter we will
have a strong picture regarding demand for the year. At this point, indications look
favorable for continued positive trends in equipment acquisition and for financing for
those transactions.” – Valerie Hayes Jester, President, Brandywine Capital Associates
Source: https://www.elfaonline.org/news/press-room/press-releases/details/2018/02/15/equipment-leasing-and-finance-industry-confidence-remains-high-in-february; 2/15/18

Private Indicators
Return to TOC
Equipment Leasing and Finance Association
February 2018 Survey Results:
“The overall MCI-EFI is 73.2 in February, easing from 75.3 in January.
• When asked to assess their business conditions over the next four months, 46.4% of
executives responding said they believe business conditions will improve over the next
four months, a decrease from 67.7% in January. 53.6% of respondents believe business
conditions will remain the same over the next four months, an increase from 29.0% the
previous month. None believe business conditions will worsen, down from 3.2% who
believed so the previous month.
• 67.6% of survey respondents believe demand for leases and loans to fund capital
expenditures (capex) will increase over the next four months, relatively unchanged from
67.7% in January. 32.1% believe demand will “remain the same” during the same four-
month time period, up from 29.0% the previous month. None believe demand will
decline, a decrease from 3.2% who believed so in January.
• 28.6% of the respondents expect more access to capital to fund equipment acquisitions
over the next four months, down from 35.5% in January. 67.9% of executives indicate
they expect the “same” access to capital to fund business, an increase from 61.3% last
month. 3.6% expect “less” access to capital, up from 3.2% last month.” – Anneliese
DeDiemar, Author, Equipment Leasing & Finance Association
Source: https://www.elfaonline.org/news/press-room/press-releases/details/2018/02/15/equipment-leasing-and-finance-industry-confidence-remains-high-in-february; 2/15/18

Private Indicators
Return to TOC
Equipment Leasing and Finance Association
February 2018 Survey Results:
• “When asked, 42.9% of the executives report they expect to hire more employees over
the next four months, an increase from 41.9% in January. 53.6% expect no change in
headcount over the next four months, a decrease from 54.8% last month. 3.6% expect to
hire fewer employees, up from 3.2% in January.
• 25.0% of the leadership evaluate the current U.S. economy as “excellent,” down from
25.8% last month. 75.0% of the leadership evaluate the current U.S. economy as “fair,”
up from 74.2% in January. None evaluate it as “poor,” unchanged from last month.
• 60.7% of the survey respondents believe that U.S. economic conditions will get “better”
over the next six months, a decrease from 61.3% in January. 35.7% of survey
respondents indicate they believe the U.S. economy will “stay the same” over the next six
months, a decrease from 38.7% the previous month. 3.6% believe economic conditions
in the U.S. will worsen over the next six months, an increase from none in January.
• In February, 53.6% of respondents indicate they believe their company will increase
spending on business development activities during the next six months, a decrease from
61.3% in January. 46.4% believe there will be “no change” in business development
spending, an increase from 35.5% the previous month. None believe there will be a
decrease in spending, a decrease from 3.2% last month.” – Anneliese DeDiemar, Author,
Equipment Leasing & Finance Association
Source: https://www.elfaonline.org/news/press-room/press-releases/details/2018/02/15/equipment-leasing-and-finance-industry-confidence-remains-high-in-february; 2/15/18

Private Indicators
Return to TOC
Equipment Leasing and Finance Association
Monthly Leasing & Finance Index: January 2018
January New Business Volume Up 10 Percent Year-over-year
“The Equipment Leasing and Finance Association’s (ELFA) Monthly Leasing and Finance
Index (MLFI-25), which reports economic activity from 25 companies representing a cross
section of the $1 trillion equipment finance sector, showed their overall new business volume
for January was $6.9 billion, up 10 percent year-over-year from new business volume in
January 2017. Volume was down 46 percent month-to-month from $12.8 billion in
December, following the typical end-of-quarter, end-of-year spike in new business activity.
Receivables over 30 days were 1.90 percent, up from 1.50 percent the previous month
and up from 1.70 percent the same period in 2017. Charge-offs were 0.34 percent,
down from 0.48 percent the previous month, and down from 0.43 percent in the year-
earlier period.
Credit approvals totaled 76.9 percent in January, down from 77.6 percent in December. Total
headcount for equipment finance companies was up 1.9 percent year over year. Previously,
headcount was elevated due to acquisition activity at an MLFI reporting company.” – Amy
Vogt, Vice President, Communications and Marketing, ELFA
Source: https://www.elfaonline.org/news/press-room/press-releases/details/2018/02/26/equipment-leasing-and-finance-association-s-survey-of-economic-
activity-monthly-leasing-and-finance-index; 2/26/18

Private Indicators
Return to TOC
Equipment Leasing and Finance Association
January New Business Volume Up 10 Percent Year-over-year
“Separately, the Equipment Leasing & Finance Foundation’s Monthly Confidence Index
(MCI-EFI) in February is 73.2, easing from 75.3 in January, which was an all-time high level
for the index.” – Amy Vogt, Vice President, Communications and Marketing, ELFA
“A confident commercial sector of the U.S. economy showed itself with double-digit growth
in the dollar volume of financed equipment for the month of January. Despite a spike in
delinquencies, which bears a watchful eye for signs of deterioration in credit markets in the
coming months, the new year gets off to a strong start for the equipment finance industry.
Business owners continue to expand their operations and acquire productive assets, even as
interest rates edge up ever so slightly and the Fed is poised to cool an overheated economy.”
– Ralph Petta, President and CEO, ELFA
“The equipment finance industry enjoyed a great year in 2017 and is maintaining that
momentum through January as evidenced by this month's MLFI. Optimism continues to be
fueled by tax reform and favorable interest rates. Potential borrowers planning for the
upcoming lease accounting changes in 2019 have spurred a wave of innovation towards
consumption models and managed services agreements in lieu of traditional financing
products. Barring larger macroeconomic events, all of this should result in a dynamic and
growing equipment finance market in 2018.” – James Cress, Vice President and General
Manager, ELFA
Source: https://www.elfaonline.org/news/press-room/press-releases/details/2018/02/26/equipment-leasing-and-finance-association-s-survey-of-economic-
activity-monthly-leasing-and-finance-index; 2/26/18

Private Indicators
Return to TOC
Equipment Leasing and Finance Association
Monthly Leasing & Finance Index: January 2018
“January new business volume registered the typical end-of-quarter, end-of-year spike as
member companies scrambled to close out the year. While 2017 was a good year, overall, for
the equipment finance industry, most industry observers look for even stronger business
activity in 2018. The reasons for this optimistic outlook? A continued healthy and growing
economy, an abundance of liquidity, strong capex demand buoyed by recent tax law changes,
and a sense of confidence by the business community not seen since just after the 2016
election. Absent a wild card event or external shock of some sort, we are bullish about
2018.” – Ralph Petta, President and CEO, ELFA
“The equipment finance industry finished 2017 with a strong uptick in new business volume.
This was due in large part to renewed optimism for future economic performance as well as
improving industry conditions in key capital-intensive industries such as energy and
transportation. Industry participants are very bullish on the prospects for 2018 as evidenced
by the record high in the Monthly Confidence Index. With lower corporate taxes and
favorable interest rates and credit environment, as well as an economy poised to breakout
from its pattern of modest growth, I believe these dynamics will create the perfect storm to
accelerate growth in the equipment finance industry in 2018.” – Thomas Jaschik, President,
BB&T Equipment Finance
Source: https://www.elfaonline.org/data/mlfi-25-monthly-leasing-and-finance-index/view-mlfi/monthly-leasing-finance-index-January-2017; 1/25/18

Return to TOC
February 2018 Manufacturing ISM® Report On Business®
January PMI® at 60.8%
New Orders, Production, and Employment Growing
Supplier Deliveries Slowing at Faster Rate; Backlog Growing Raw Materials Inventories Growing, Customers’ Inventories Too Low
Prices Increasing at Faster Rate; Exports and Imports Growing
“Economic activity in the manufacturing sector expanded in January, and the overall economy
grew for the 106th consecutive month, say the nation's supply executives in the latest
Manufacturing ISM® Report On Business®. The February PMI® registered 60.8 percent, an
increase of 1.7 percentage points from the January reading of 59.1 percent.
The New Orders Index registered 64.2 percent, a decrease of 1.2 percentage points from the January
reading of 65.4 percent.
The Production Index registered 62 percent, a 2.5 percentage point decrease compared to the January
reading of 64.5 percent.
The Employment Index registered 59.7 percent, an increase of 5.5 percentage points from the January
reading of 54.2 percent.
The Supplier Deliveries Index registered 61.1 percent, a 2 percentage point increase from the January
reading of 59.1 percent.
The Inventories Index registered 56.7 percent, an increase of 4.4 percentage points from the January
reading of 52.3 percent.
The Prices Index registered 74.2 percent in February, a 1.5 percentage point increase from the January
reading of 72.7 percent, indicating higher raw materials prices for the 24th consecutive month.
Comments from the panel reflect expanding business conditions, with new orders and production
maintaining high levels of expansion; employment expanding at a faster rate to support production; order
backlogs expanding at a faster rate; and export orders and imports continuing to grow faster in February.
Supplier deliveries continued to slow (improving) at a faster rate. Price increases occurred across most
industry sectors. The Customers’ Inventories Index indicates levels remain too low. Capital expenditure
lead times improved by five days while production material supplier lead times extended four days during
the month of February.” – Timothy R. Fiore, CPSM, CPSD, Chair of the ISM® Manufacturing Business
Survey Committee Source: https://www.instituteforsupplymanagement.org/ISMReport/MfgROB.cfm?navItemNumber=12942; 3/1/18

Return to TOC Source: https://www.instituteforsupplymanagement.org/ISMReport/NonMfgROB.cfm; 3/5/18
February 2018 Non-Manufacturing ISM® Report On Business®
February NMI® at 59.5%
Business Activity Index at 62.8%; New Orders Index at 64.8%; Employment Index at 55.0%
“Economic activity in the non-manufacturing sector grew in February for the 97th consecutive month,
say the nation's purchasing and supply executives in the latest Non-Manufacturing ISM® Report On
Business®. The NMI® registered 59.5 percent, which is 0.4 percentage point lower than the January
reading of 59.9 percent. This represents continued growth in the non-manufacturing sector at a slightly
slower rate.
The Non-Manufacturing Business Activity Index increased to 62.8 percent, 3 percentage points higher
than the January reading of 59.8 percent, reflecting growth for the 103rd consecutive month, at a faster
rate in February.
The New Orders Index registered 64.8 percent, 2.1 percentage points higher than the reading of 62.7
percent in January.
The Employment Index decreased 6.6 percentage points in February to 55 percent from the January
reading of 61.6 percent.
The Prices Index decreased by 0.9 percentage point from the January reading of 61.9 percent to 61
percent, indicating that prices increased in February for the 24th consecutive month.
According to the NMI®, 16 non-manufacturing industries reported growth. The non-manufacturing
sector reflected the second consecutive month of strong growth in February. The decrease in the
Employment Index possibly prevented an even stronger reading for the NMI® composite index. The
majority of respondents’ continue to be positive about business conditions and the economy.” –
Anthony Nieves, CPSM, C.P.M., CFPM, Chair of the Institute for Supply Management® (ISM®) Non-
Manufacturing Business Survey Committee
Private Indicators

Return to TOC
Markit U.S. Manufacturing PMI™
“The seasonally adjusted IHS Markit final U.S.
Manufacturing Purchasing Managers’
Index™ (PMI™) registered 55.3 in February,
down slightly from 55.5 in January. Although
below January’s 34-month high, the overall
improvement in operating conditions across the
manufacturing sector was one of the strongest
recorded since late-2014.
PMI close to three-year peak as new order inflows hit 13-month high
February survey data signalled one of the strongest improvements in the health of the U.S.
manufacturing sector seen over the past three years, led by a sharp expansion in new orders.
Meanwhile, inflationary pressures intensified with rates of both input and output price inflation
reaching multi-year highs. At the same time, business confidence towards output in the year-ahead
improved, which supported further widespread job creation. Growth of manufacturing output
remained solid in February, despite easing slightly to a three-month low. The sustained upturn in
production was widely linked to greater client demand and increased order book volumes.
US factories are enjoying one of the best growth spells seen since 2014, boding well for the sector
to make a solid contribution to GDP in the first quarter. The survey’s output index readings for the
first two months of 2018 are indicative of the sector growing at an annualised rate of just under 3%.
The most encouraging news was another surge in new order inflows, which helped boost optimism
about the year ahead and drive further widespread job gains. Manufacturers are clearly in
expansion mode, enjoying robust demand from home alongside rising export orders. …” – Chris
Williamson, Chief Economist, Markit®
Private Indicators
Source: https://www.markiteconomics.com/Survey/PressRelease.mvc/c25c780c923d41d9a87df9a176ab6db4; 3/1/18
Source: IHS Markit

Return to TOC
Business activity expansion accelerates to six-month high
Business activity across the U.S. service sector expanded sharply in February, according to the latest
PMI data. The upturn in output accelerated to the fastest since August 2017. In addition, greater client
demand led to a steep rise in new business, which rose at the strongest pace in almost three years.
Capacity pressures intensified as a result of the upswing in demand, with backlogs of work
accumulating to the greatest extent since March 2015.
More favourable demand conditions drove the latest rise in new business, with panellists linking the
upturn to the acquisition of new clients and investment in new facilities. Moreover, the rate of
growth accelerated for the second consecutive month to the quickest in almost three years.
A surge in service sector activity comes as welcome news after a disappointing couple of months,
especially is it was accompanied by further robust manufacturing growth in February. So far, the
two PMI surveys point to the economy expanding at a steady 2.5% annualised rate in the first
quarter. With growth of new orders across the two sectors collectively growing at the fastest rate
for three years, March could also prove to be a good month for business activity, rounding off a
solid opening quarter or the year.” – Chris Williamson, Chief Economist, Markit®
Markit U.S. Services PMI™
“The seasonally adjusted final IHS Markit U.S.
Services Business Activity Index registered
55.9 in February, up from 53.3 in January.
Following a nine-month low in the previous
survey period, the rate of expansion in business
activity picked up to the fastest since August
2017. Service providers generally attributed the
sharp rise in output to greater client demand.
Private Indicators
Source: https://www.markiteconomics.com/Survey/PressRelease.mvc/de95dc43b7e74562a6d5bf2a5eb77d33; 3/5/18
Source: IHS Markit
Private Indicators
Return to TOC
National Association of Credit Management –
Credit Managers’ Index
“Can it be true? Are we really seeing a positive trend emerge as far as NACM’s Credit
Managers’ Index (CMI) is concerned? The numbers for this month’s combined score are up –
56.5 as compared to the 55.1 that was noted last month. This latest reading is almost as high as
it was last November when it reached 56.6. The index of favorable factors also improved, and
by quite a lot – moving from 61.4 to 64.9. This is again close to the numbers that were seen last
November when the reading was 65.7. There was similar progress in the index for unfavorable
factors – 50.9 for February from 50.8 in January. The movement in the unfavorable categories
has been slight for some time, which has been an ongoing concern.
The details have been interesting – as is usually the case. The majority of the movement has
been in the favorable categories, but there was some significant movement in the unfavorables
as well. The sales category made a big jump from 63 to 66.8, marking the highest point since
September of last year when it hit 67.3. One of the themes you may have noticed already is that
this month’s numbers are back to what they were in the latter part of last year when the economy
as a whole was growing at around 3%. The new credit applications category jumped back into
the 60s by moving from 59.8 in January to the current reading of 63.3. There was a similar
pattern as far as dollar collections were concerned, as last month the reading was 58.7 and this
month the reading is 62.9. To complete the favorable sweep, there was the reading for amount
of credit extended (64.3 to 66.4). These are really very healthy numbers and all rival the highs
seen last fall.” – Adam Fusco, Associate Editor, NACM
Source: http://web.nacm.org/CMI/PDF/CMIcurrent.pdf; 2/28/18

Private Indicators
Return to TOC
National Association of Credit Management –
Credit Managers’ Index
“There was also a substantial dip in accounts placed for collection as the numbers fell from 51.7
back to contraction territory (anything under 50) with a 49.8 reading. The disputes category stayed
the same – better than falling, but still in contraction at 49.6. The dollar amount beyond terms
category has been a problem all year as companies fall into the slow-pay category one month and
manage to escape it the next. This month there was an improvement from 47 to 49.9, but that is
still in the contraction zone. There was a slight reduction in the numbers for amount of customer
deductions from 49.7 to 49.1. The only reading that really seemed to improve was filings for
bankruptcies (55.2 to 55.4).” – Adam Fusco, Associate Editor, NACM
“To be honest, two good months in a row hardly constitutes a trend, but it has been many months in
a row for all this up and down gyration. It is gratifying to see two consecutive months of solid
performance. the good news for the moment is that these readings have been relatively stable and
even getting a little better.
The bottom line here is that there are still lots of companies that are struggling and have not yet
participated in the recovery that has been driving the economy as a whole. As a matter of fact,
there is some additional risk these days as competitors feeling that growth start to push everyone to
keep pace – some will simply not be able to keep up.
Ready or not, there are companies seeking credit to expand and stay with the competition, but are
not qualified to get what they seek. Companies are still in trouble and are likely to react more
negatively as expansion pressure grows. The most important observation from the unfavorable list
is that four of the six readings are in contraction territory – albeit less dramatically than was the
case the previous month.” – Dr. Chris Kuehl, Economist, NACM
Source: http://web.nacm.org/CMI/PDF/CMIcurrent.pdf; 2/28/18

Private Indicators
Return to TOC Source: http://web.nacm.org/CMI/PDF/CMIcurrent.pdf; 2/28/18

Private Indicators February 2018 Report:
“Small business owners are showing
unprecedented confidence in the
economy as the optimism index
continues at record high numbers,
rising to 107.6 in February, according to
the NFIB Small Business Economic
Trends Survey, released March 13. The
historically high numbers include a
jump in small business owners
increasing capital outlays and raising
compensation.” – Holly Wade, NFIB
Return to TOC
Small Business Economy Heats Up After Years on the Sideline
Optimism, capital spending, compensation, job creation – all up, according to the NFIB Small Business Economic Trends survey
“For the first time since 2006, taxes received the fewest votes as the number 1 business problem for
small business. The February report shows several components of the Index reached noteworthy
highs. In a sign that small businesses are confident and expect growth, owners are spending capital
with a net 22 percent planning to raise worker compensation and 66 percent reported capital
outlays, up 5 points from January and the highest reading since 2004.
Moreover, owners expecting higher real sales rose 3 points to a net 28 percent, one of the best
readings since 2007. Owners also reported higher nominal sales in the past three months at a net 8
percent of all owners. The net percent of owners reporting inventory increases rose 3 percentage
points to a net 7 percent on top of a 6-point rise in January.” – Holly Wade, NFIB
Source: http://www.nfib.com/surveys/small-business-economic-trends/; 3/13/18

Private Indicators
Return to TOC
Commentary
“Small business owners are telling us loud and clear that they’re optimistic, ready to
hire, and prepared to raise wages – it’s one of the strongest readings I’ve seen in the
45-year history of the Index. The fact that several components saw significant
increases tells us that small businesses are flourishing in a way we haven’t seen in over
a decade.” – William C. Dunkelberg, Chief Economist, NFIB
“When small business owners have confidence and certainty in the economy, they’re
able to hire more workers and invest in their business. The historically high readings
indicate that policy changes – lower taxes and fewer regulations – are transformative
for small businesses. After years of standing on the sidelines and not benefiting from
the so-called recovery, Main Street is on fire again.” – Juanita Duggan, President and
CEO, NFIB
“Job creation remained strong in February, as reported in the NFIB February Jobs
Report, released last week. Finding qualified workers remained as the number one
problem for small business owners, surpassing taxes and regulations which have held
the top two spots for years.” – Holly Wade, NFIB
Source: http://www.nfib.com/surveys/small-business-economic-trends/; 3/13/18

Private Indicators
Return to TOC
The Paychex | IHS Markit Small
Business Employment Watch
Source: https://www.paychex.com/employment-watch/; 3/6/18

Private Indicators
Return to TOC
The Paychex | IHS Small Business Jobs Index
National Jobs Index
• “At 99.77, the Paychex | IHS Markit Small Business Jobs Index is down 1.00
percent from last year.
• February marks the eighth consecutive month the national index has been below
100.” – James Diffley, Chief Regional Economist, IHS Markit
Source: https://www.paychex.com/employment-watch/; 3/6/18
2/2018
Index: 99.77
3-Month National
Trend

Private Indicators
Return to TOC
The Paychex | IHS Small Business Jobs Index
Regional Jobs Index
• “At 100.34, the South ranks first
among regions for the 22nd
consecutive month and is the only
region above 100.
• The Northeast ranks third among
regions, but has the best one-month
and 12-month growth rates.” – James
Diffley, Chief Regional Economist,
IHS Markit
Note: Percentages displayed in the regional heat map reflect 1-
month changes.
Source: https://www.paychex.com/employment-watch/; 3/6/18

Private Indicators
Return to TOC
S&P CoreLogic Case-Shiller National Home Price Index Shows Home Prices End The Year 6.3% Higher Than 2016
The rise in home prices should be causing the same nervous wonder aimed at the stock market after
its recent bout of volatility. Across the 20 cities covered by S&P Corelogic Case Shiller Home
Price Indices, the average increase from the financial crisis low is 62%; over the same period,
inflation was 12.4%. None of the cities covered in this release saw real, inflation-adjusted prices
fall in 2017. The National Index, which reached its low point in 2012, is up 38% in six years after
adjusting for inflation, a real annual gain of 5.3%. The National Index’s average annual real gain
from 1976 to 2017 was 1.3%. Even considering the recovery from the financial crisis, we are
experiencing a boom in home prices.
Within the last few months, there are beginning to be some signs that gains in housing may be
leveling off. Sales of existing homes fell in December and January after seasonal adjustment and
are now as low as any month in 2017. Pending sales of existing homes are roughly flat over the last
several months. New home sales appear to be following the same trend as existing home sales.
While the price increases do not suggest any weakening of demand, mortgage rates rose from 4% to
4.4% since the start of the year. It is too early to tell if the housing recovery is slowing. If it is,
some moderation in price gains could be seen later this year.” – David Blitzer, Managing Director
and Chairman of the Index Committee, S&P Dow Jones
“S&P Dow Jones Indices today released the latest results for the S&P CoreLogic Case-Shiller
Indices, the leading measure of U.S. home prices. Data released today for December 2017 shows
that home prices continued their rise across the country over the last 12 months.
Source: http://us.spindices.com/index-family/real-estate/sp-corelogic-case-shiller; 2/27/18

Private Indicators
Return to TOC
S&P/Case-Shiller Home Price Indices
Source: http://us.spindices.com/index-family/real-estate/sp-corelogic-case-shiller; 2/27/18
218.2
204.5
196.2
0
25
50
75
100
125
150
175
200
225
250
20-City Composite 10-City Composite U.S. National Home Price Index
Sources: S&P Dow Jones Indices and CoreLogic; Data through August 2018
“The indices have a base value of 110 in January 2000; thus, for example, a current index value of 150 translates to
a 50% appreciation rate since January 2000 for a typical home located within the subject market.” – S&P CoreLogic

Return TOC
Demographics
Source: http://www.pewresearch.org/fact-tank/2018/01/31/more-adults-now-share-their-living-space-driven-in-part-by-parents-living-with-their-adult-children; 1/26/18
More adults now share their living space, driven in part by parents living with their adult children
“American adults are increasingly sharing a home with other adults with whom they are not
romantically involved. This arrangement, known as “doubling up” or shared living, gained notice
in the wake of the Great Recession, and nearly a decade later, the prevalence of shared living has
continued to grow.” – Richard Fry, Senior Researcher, Pew Research Center

Return TOC
Demographics
Source: http://www.pewresearch.org/fact-tank/2018/01/31/more-adults-now-share-their-living-space-driven-in-part-by-parents-living-with-their-adult-children; 1/26/18
More adults now share their living space, driven in part by
parents living with their adult children
“While the rise in shared living during and
immediately after the recession was attributed in
large part to a growing number of Millennials
moving back in with their parents, the longer-term
increase has been partially driven by a different
phenomenon: parents moving in with their adult
children.
In 2017, nearly 79 million adults (31.9% of the adult
population) lived in a shared household – that is, a
household with at least one “extra adult” who is not
the household head, the spouse or unmarried partner
of the head, or an 18- to 24-year-old student. In
1995, the earliest year with comparable data, 55
million adults (28.8%) lived in a shared household.
In 2004, at the peak of homeownership and before
the onset of the home foreclosure crisis, 27.4% of
adults shared a household.” – Richard Fry, Senior
Researcher, Pew Research Center

Return TOC
Demographics
Source: http://www.pewresearch.org/fact-tank/2018/01/31/more-adults-now-share-their-living-space-driven-in-part-by-parents-living-with-their-adult-children; 1/26/18
More adults now share their living space, driven in part by parents living with their adult children
“A shared household is defined somewhat differently from a multigenerational household (although
the two can overlap), as shared households can include unrelated adults and adult siblings. More
adults live in shared households than multigenerational households: In 2014, 61 million Americans
(including children) resided in multigenerational households.
The nearly 79 million adults living in a shared household include about 25 million adults who own
or rent the household. An additional 10 million adults are the spouse or unmarried partner of the
head of the household. Another 40 million, or 16% of all adults, are the “extra adult” in the shared
household. This share living in someone else’s household is up from 14% in 1995.
Adults who live in someone else’s household typically live with a relative. Today, 14% of adults
living in someone else’s household are a parent of the household head, up from 7% in 1995. Some
47% of extra adults today are adult children living in their mom and/or dad’s home, down from
52% in 1995. Other examples of extra adults are a sibling living in the home of a brother or sister,
or a roommate.
In 2017, only 18% of extra adults lived in a household in which the head was unrelated (typically a
housemate or roommate). Living with nonrelatives has become less prevalent since 1995, when
22% of extra adults lived with a nonrelative.
Regardless of their relationship to the household head, young adults are more likely than middle-
aged or older adults to live in someone else’s household. Among those younger than 35, 30% were
the extra adult in someone else’s household in 2017, up from 26% in 1995. Among 35- to 54-year-
olds, 12% were living in someone else’s household, an increase from 9% in 1995. Today 10% of
55- to 64-year-olds are an extra adult, up from 6% in 1995. The only adult group that isn’t more
likely than before to live in another adult’s household is those ages 75 and older (10% in both
years).” – Richard Fry, Senior Researcher, Pew Research Center

Return TOC
Demographics
Source: http://www.pewresearch.org/fact-tank/2018/01/31/more-adults-now-share-their-living-space-driven-in-part-by-parents-living-with-their-adult-children; 1/26/18
More adults now share their living space, driven in part by parents living with their adult children
“The rise in shared living may have implications for the nature of household finances – that is, how
income and expenses are shared among members.
In addition, the increase in “doubling up” is offsetting other social trends bearing on the nature of
the nation’s households and demand for housing. While Americans are less likely to be living with
a spouse or unmarried partner in their household, the rise in doubling up means more adults are
living with nonrelatives and with relatives other than romantic partners. As a result, the average
number of adults per household has not declined since 1995, and consequently, the number of
households per adult has not increased.
In fact, household formation, or the number of households for every 100 adults, has recently fallen
to very modest levels for several age groups. For example, in 2017 there were 31 households
headed by an adult younger than 35 for every 100 adults in that age bracket (adjusted for the age
bias in head-of-household status), among the lowest rate of household formation for this age group
since the early 1970s. Decreased household formation is not confined to young adults. Last year
there were 61 households headed by a 65- to 74-year-old for every 100 65- to 74-year-olds. While
this marked a slight statistical increase from 2014, the last time household formation rates were that
low among this demographic was 1972.
The rise in shared living is likely not simply a response to rising housing costs and weak incomes.
Nonwhite adults are much more likely than white adults to be doubled up, mirroring their greater
propensity to live in multigenerational households. Nonwhite adults are a growing share of the
adult population, and thus some of the rise in shared living arrangements is due to longer-running
demographic change.” – Richard Fry, Senior Researcher, Pew Research Center

Return TOC
Demographics
Source: http://trend.pewtrusts.org/en/archive/winter-2018/how-generation-x-could-change-the-american-dream; 1/26/18
How Generation X Could Change the American Dream
Gen Xers are a bellwether for the nation — and the future isn’t looking good.
“In the United States, many people have long believed that hard work and ambition determine
economic success and that this country is exceptional at promoting opportunity from the bottom up.
It is the essence of the American Dream — the idea that each subsequent generation will do better
than the one that came before and that together a rising tide will lift all boats. But for many, the
dream is fading. The Pew Research Center has found that just 37 percent of Americans believe
children today will be financially better off than their parents, a lower share than in 21 other nations
in a global survey.
Americans may be right to be worried about today’s children, but we won’t know for several
decades whether they exceed their parents’ financial standing. Economic mobility — the study of
how people move up and down the economic ladder over time — is a backward-looking measure;
we can only know whether people are better off than their parents or their peers once they’ve had
enough time to go to school, build a career, and hopefully acquire wealth. So we get a much better
sense of the future of the American Dream by looking at today’s adults, and in particular, that small
and sometimes overlooked group known as Generation X.
Born between 1965 and 1980, Gen X is a bellwether cohort to examine for evidence of generational
progress. Now mostly in their 30s and 40s, many have completed their educations, established
work histories, and started families. They have two decades in the labor market and are in their
prime working years, resulting in a lot of good data on how they’re doing, not just financially but in
terms of their economic mobility as well. What we know shows why so many people have
concerns about the American Dream.” – Erin Currier, Director-Family Financial Security and
Mobility, The Pew Charitable Trusts

Return TOC
Demographics How Generation X Could Change the American Dream
“Sixty-five million Gen Xers are sandwiched between two much larger and louder cohorts: the 76.4
million baby boomers and the 83 million millennials. In many ways, the coming of age of Gen
Xers has corresponded to a turning point in the American story. Consider just a few of the social
and economic dynamics at work for Gen Xers. They are the first cohort to experience a labor
market that practically demands postsecondary education for economic success (over a lifetime, the
average college graduate earns $570,000 more than the average person with only a high school
diploma), and they have responded with higher educational attainment. By age 33, 18 percent of
Gen X men and 20 percent of Gen X women had earned a four-year degree, compared with 17
percent of men and 14 percent of women in the baby-boom generation.
But along with the earnings gains, Gen Xers have also seen the cost of college soar. Since 1980,
college tuition has far outpaced inflation and median income growth, and student debt among this
group has grown exponentially. In 1977, when the youngest Gen Xers were in fourth grade, a third
of students borrowed for college. By the time this generation was finishing school in 2000, 65
percent did.
Data Points
$43,000 About how much the typical Generation X household earns annually.
This is a sizable increase from the $31,000 earned by their parents at the same age. In fact, three-
quarters of Gen Xers have higher family incomes than their parents did.
56% of Generation Xers hold mortgage debt, the most of any generation.
43 percent hold car loans (the most of any generation), and 26 percent have education loans (topped
only by millennials, 41 percent of whom have student debt). These findings are from The Pew
Charitable Trusts’ Survey of American Family Finances.
40% of Generation Xers who were raised at the bottom of the income ladder, and stayed there, are
black.” – Erin Currier, Director-Family Financial Security and Mobility, The Pew Charitable Trusts
Source: http://trend.pewtrusts.org/en/archive/winter-2018/how-generation-x-could-change-the-american-dream; 1/26/18

Return TOC
Demographics
How Generation X Could Change the American Dream
“Gen Xers are also the first generation to experience nearly equitable labor force participation
between women and men; about three-quarters of Gen X women were in the labor force in 2000,
compared with a little more than half of similarly aged women who worked in 1975. (In the case of
couples, that added earner has been critical for family financial security, because median wages for
men have been nearly flat over the past two decades.)
And Gen Xers are much more racially diverse than groups that came before. In 1963, just 16
percent of 18- to 33-year-olds in the silent generation were nonwhite. By 1988, when Gen Xers
were the same age, that percentage had more than doubled to 34. And millennials continue the
trend, with 43 percent of that cohort Americans of color.
These social and economic trends suggest that the rules of the game have shifted dramatically for
Gen Xers, and they provide an important backdrop for reviewing this generation’s success in
achieving the American Dream.” – Erin Currier, Director-Family Financial Security and Mobility,
The Pew Charitable Trusts Source: http://trend.pewtrusts.org/en/archive/winter-2018/how-generation-x-could-change-the-american-dream; 1/26/18

Return TOC
How Generation X Could Change the American Dream
Gen X’s finances “There are a number of ways to assess the financial security of Gen Xers, but it’s easiest to start
with how they stack up against their parents. Despite experiencing flat earnings for much of their
careers, the typical Gen X household earns about $43,000 annually, a sizable increase from the
$31,000 earned by their parents at the same age. In fact, three-quarters of Gen Xers have higher
family incomes than their parents did, a bright spot in the financial picture for this group. More
women working and adding a second earner to many families certainly helped this metric. These
income totals are adjusted for inflation and family size, and since families have gotten smaller
across the generation, Gen Xers’ extra income is also spread among fewer people. So on the basis
of this metric alone, one could argue that Gen X is doing better than the generation that came
before.
However, economic well-being includes more than just family income, and taking a more holistic
view of Gen X finances reveals some vulnerabilities. Namely, Gen Xers haven’t been able to
translate their extra income into wealth. Not including home equity, the typical Gen Xer has just
over $13,000 in wealth (defined as total assets minus total debts), compared with the $18,000 held
by a typical Gen Xer’s parents when they were the same ages. Just 36 percent of Gen Xers have
higher family wealth than their parents did — a notable difference from their intergenerational
income gains. But they are falling short by this measure in large part because, among those with
debt, Gen Xers have six times more than their parents did.
In fact, right now Gen Xers have higher debt than pretty much everyone: In The Pew Charitable
Trusts’ Survey of American Family Finances, 9 in 10 Gen Xers reported holding debt, the highest
proportion of any group, including millennials. Fifty-six percent of Gen Xers hold mortgage debt
(the most of any generation), 43 percent hold car loans (the most of any generation), and 26 percent
have education loans (the most of any generation except millennials, 41 percent of whom have
student debt).” – Erin Currier, Director-Family Financial Security and Mobility, The Pew Charitable
Trusts Source: http://trend.pewtrusts.org/en/archive/winter-2018/how-generation-x-could-change-the-american-dream; 1/26/18
Demographics

Return TOC
How Generation X Could Change the American Dream
Gen X’s finances “To some degree, this is to be expected. Gen Xers are in their prime debt -acquiring years, buying
houses and cars, and even though they’re well into their careers, some still have student loan debt.
Debt is not inherently bad, especially if it’s leveraged for things that build income and wealth, such
as college education and homeownership. And the presence of debt signals access to credit, a good
indicator of financial security.
But the weight of Gen Xers’ debt, especially without higher assets to offset it, stands in contrast to
the generations that came before, threatening this group's wealth acquisition in the short term and
its retirement preparedness in the long term.
The Great Recession didn’t help. Gen Xers were already behind previous cohorts before the
economic downturn: In 2007, the typical Gen Xer had fewer financial assets — in the form of
money held in savings accounts, 401(k)s, pensions, and individual retirement accounts — than baby
boomers held at the same age. But the timing of the recession was particularly challenging for Gen
Xers, many of whom purchased homes during the housing bubble. While all groups experienced
wealth losses in the recession, Gen X took the hardest hit. From 2007 to 2010, Gen Xers lost nearly
half of their wealth, an average of about $33,000.
As a result, Gen Xers are not on track for a secure retirement. If current trends continue, they’re
slated to replace just 50 percent of their working-age income through savings when retired. Most
financial planners recommend that number be closer to 70 or 80 percent.
Taken together, these facts don’t paint a rosy picture. A holistic accounting of Gen X balance sheets
suggests that, unless something changes, this generation may not, in fact, do better than the one that
came before it.” – Erin Currier, Director-Family Financial Security and Mobility, The Pew
Charitable Trusts
Source: http://trend.pewtrusts.org/en/archive/winter-2018/how-generation-x-could-change-the-american-dream; 1/26/18
Demographics

Return TOC
How Generation X Could Change the American Dream
Gen X’s finances “But what about another definition of the American Dream — the idea that anyone can pull himself
or herself up by the bootstraps and that hard work and ambition are the keys to economic success?
Looking at the typical Gen Xer obscures the diversity of experience across this generation, and if
Gen Xers raised at the bottom of the economic ladder were significantly upwardly mobile, one
could feel confident that despite shaky balance sheets the American Dream is just fine. Answering
that question requires a deeper dive into the metrics of economic mobility — and specifically
exploring which Gen Xers move up the economic ladder and how far.” – Erin Currier, Director-
Family Financial Security and Mobility, The Pew Charitable Trusts
Source: http://trend.pewtrusts.org/en/archive/winter-2018/how-generation-x-could-change-the-american-dream; 1/26/18
Demographics

Return TOC
How Generation X Could Change the American Dream
A tale of two Gen Xs “Studies examining economic mobility in the nation as a whole have found notable “stickiness” at
the top and bottom of the income ladder across generations: About 40 percent of those raised by
low-income parents remain low-income themselves, and about 40 percent of those raised by high-
income parents end up high income.
For Gen X, this stickiness at the bottom is even more pronounced than for other generations: Half
of Gen Xers raised at the bottom remain stuck there themselves, and nearly three-quarters never
reach the middle. Similarly, 40 percent of those raised at the top remain there as adults, and more
than two-thirds never fall to the middle. In fact, 7 in 10 Gen Xers at the top rung of the income
ladder in their 30s were raised by parents who were also above the middle in their 30s.
A whole host of things influence whether a person will end up in the bottom, middle, or top of the
economic ladder as an adult. Family background clearly plays a sizable role, but so does
educational attainment, family structure, and race — and all these are exemplified in the balance
sheets of Gen Xers: College-educated, partnered, or white Gen Xers typically have higher income
and wealth totals than do their counterparts who have less education, are single, or are black. Those
with a college degree have $25,000 a year more in family income, $9,000 more in non-home-equity
wealth, and $26,000 more in home equity than do their non-college-educated peers. Gen Xers who
are part of a couple have $13,000 more income and three times the non-home-equity wealth and
home equity of their single peers. And typical white Gen Xers have about $17,000 more in family
income and hold over four times the non-home-equity wealth and home equity of typical black Gen
Xers, underscoring powerful and persistent racial wealth gaps.” – Erin Currier, Director-Family
Financial Security and Mobility, The Pew Charitable Trusts
Source: http://trend.pewtrusts.org/en/archive/winter-2018/how-generation-x-could-change-the-american-dream; 1/26/18
Demographics

Return TOC
How Generation X Could Change the American Dream
A tale of two Gen Xs “But family background, education, and race aren’t just contributing factors to who enters the top of
the income ladder within one cohort; these demographic characteristics fuel a cycle of immobility
and growing inequality between the two ends of the economic spectrum, generation after
generation. In fact, the space between the haves and have nots is so wide that Gen Xers raised in
and stuck at the top of the income ladder have very little in common with those raised in and stuck
at the bottom.
For instance, 83 percent of those raised in and currently at the top of the income ladder are in a
couple, compared with just 44 percent of those raised in and stuck at the bottom. Of those at the
top, nearly all of them — 96 percent — also had parents who were in a couple, while far fewer (59
percent) of those stuck at the bottom did. Seven in 10 Gen Xers at the top have a college degree,
and in 75 percent of cases, at least one of their parents does, too. In contrast, a mere 2 percent of
their peers at the bottom are college-educated, and only 3 percent have at least one parent who is.
Less than 1 percent of Gen Xers who were raised in and remain at the top of the income ladder are
black, in large part because so few black children were raised there. In contrast, 4 in 10 Gen Xers
raised in and stuck at the bottom are black.
Simply put, Gen Xers raised in the top come from financially comfortable, well-educated, and
nearly always white parents and become financially comfortable and well-educated themselves,
while Gen Xers raised in the bottom have the exact opposite family background, race, and
economic outcome. This story is not significantly different from the mobility experience of other
generations, which also see stickiness at the ends driven in part by these demographic
characteristics. But the fact that Gen Xers’ stickiness is more pronounced, that the economic
repercussions of an economically stable (or unstable) upbringing are more powerful for this
generation than for groups that came before, should be seen as a wake-up call to Americans.” – Erin
Currier, Director-Family Financial Security and Mobility, The Pew Charitable Trusts Source: http://trend.pewtrusts.org/en/archive/winter-2018/how-generation-x-could-change-the-american-dream; 1/26/18
Demographics
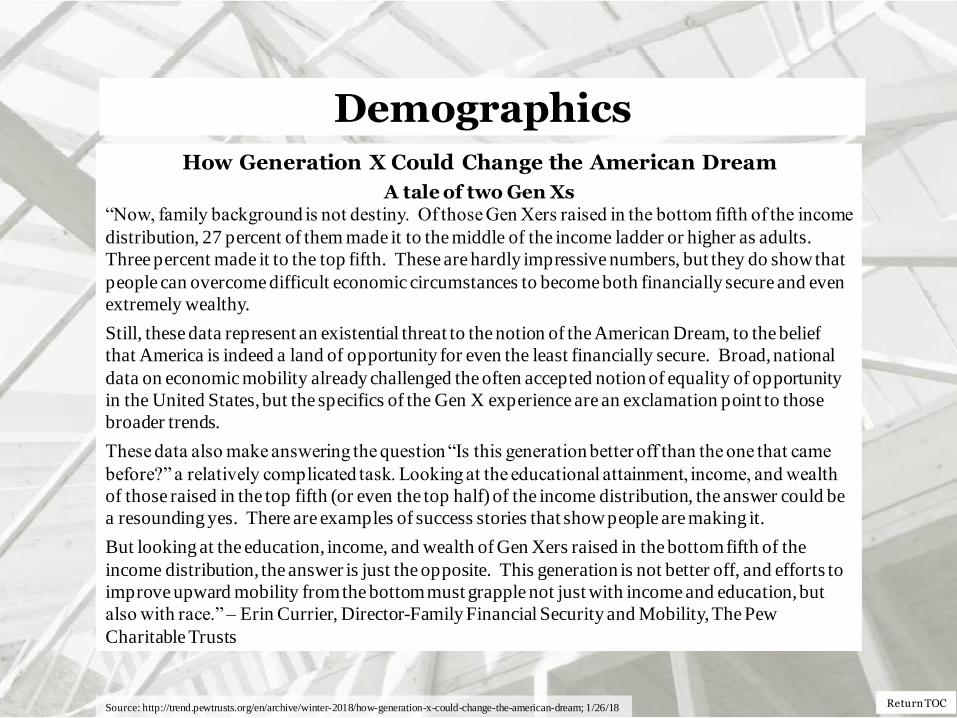
Return TOC
How Generation X Could Change the American Dream
A tale of two Gen Xs “Now, family background is not destiny. Of those Gen Xers raised in the bottom fifth of the income
distribution, 27 percent of them made it to the middle of the income ladder or higher as adults.
Three percent made it to the top fifth. These are hardly impressive numbers, but they do show that
people can overcome difficult economic circumstances to become both financially secure and even
extremely wealthy.
Still, these data represent an existential threat to the notion of the American Dream, to the belief
that America is indeed a land of opportunity for even the least financially secure. Broad, national
data on economic mobility already challenged the often accepted notion of equality of opportunity
in the United States, but the specifics of the Gen X experience are an exclamation point to those
broader trends.
These data also make answering the question “Is this generation better off than the one that came
before?” a relatively complicated task. Looking at the educational attainment, income, and wealth
of those raised in the top fifth (or even the top half) of the income distribution, the answer could be
a resounding yes. There are examples of success stories that show people are making it.
But looking at the education, income, and wealth of Gen Xers raised in the bottom fifth of the
income distribution, the answer is just the opposite. This generation is not better off, and efforts to
improve upward mobility from the bottom must grapple not just with income and education, but
also with race.” – Erin Currier, Director-Family Financial Security and Mobility, The Pew
Charitable Trusts
Source: http://trend.pewtrusts.org/en/archive/winter-2018/how-generation-x-could-change-the-american-dream; 1/26/18
Demographics

Return TOC
How Generation X Could Change the American Dream
A tale of two Gen Xs “These data on Gen Xers make clear that our current economy,
built within an increasingly globally competitive world, will
remain a classic tale of the haves and the have nots, unless there
are changes in policy to ensure broader economic opportunity.
But there is no single solution to these concerns. Improving
economic mobility — especially upward mobility from the
bottom — requires a multifaceted approach that recognizes the
systems of advantage and disadvantage at work within
communities and institutions, as well as acknowledgment that
the majority of those in need of help are families of color. The
current lack of mobility from the bottom is a result of policy
choices, so reversing these trends means a collective agreement
to prioritize equity in general and racial equity in particular.
The lessons from Gen X are sobering and have implications for
everyone. They are also a call to action for policymakers,
community leaders, employers, and philanthropists to work
together and find the concrete changes needed to create more
equality of opportunity. Not to act on these data and find ways
to alter these trends will forever change the American Dream for
those generations still to come.” – Erin Currier, Director-Family
Financial Security and Mobility, The Pew Charitable Trusts
Source: http://trend.pewtrusts.org/en/archive/winter-2018/how-generation-x-could-change-the-american-dream; 1/26/18
Demographics

Return TOC
Economics Board of Governors of the Federal Reserve System
Changes in U.S. Family Finances from 2013 to 2016: Evidence from the Survey of Consumer Finances
“During the three years between the beginning of the 2013 and 2016 surveys, real gross
domestic product grew at an annual rate of 2.2 percent, the civilian unemployment rate fell
from 7.5 percent to 5 percent, and the annual rate of change in the consumer price index
averaged 0.8 percent. These changes in aggregate economic performance led to broad-based
income gains across many different types of families. Several observations from the SCF
about family incomes stand out:
• Between 2013 and 2016, median family income grew 10 percent, and mean family
income grew 14 percent (figure 1).
• Families throughout the income distribution experienced gains in average real incomes
between 2013 and 2016, reversing the trend from 2010 to 2013, when real incomes fell or
remained stagnant for all but the top of the income distribution.
• Families at the top of the income distribution saw larger gains in income between 2013
and 2016 than other families, consistent with widening income inequality.
• Families without a high school diploma and nonwhite and Hispanic families experienced
larger proportional gains in incomes than other families between 2013 and 2016, although
more-educated families and white non-Hispanic families continue to have higher incomes
than other families.” – Jesse Bricker, Lisa Dettling, Alice Henriques, Joanne Hsu,
Lindsay Jacobs, Kevin Moore, Sarah Pack, John Sabelhaus, Jeffrey Thompson, and
Richard Windle; Division of Research and Statistics; Board of Governors of the Federal
Reserve System
Source: https://www.federalreserve.gov/publications/files/scf17.pdf; 9/1/17

Return TOC
Economics
Source: https://www.federalreserve.gov/publications/files/scf17.pdf; 9/1/17

Return TOC
Economics
Source: https://www.federalreserve.gov/publications/files/scf17.pdf; 9/1/17
Board of Governors of the Federal Reserve System
“Overall, between 2013 and 2016, median net worth grew 16 percent, and mean net worth
grew 26 percent (figure 2).
• Families at the top of the income and wealth distributions experienced large gains in
mean and median net worth after experiencing modest gains between 2010 and 2013.
• Families near the bottom of the income and wealth distribution experienced large gains in
mean and median net worth after experiencing large declines between 2010 and 2013.
• Families without a college education and nonwhite and Hispanic families experienced
larger proportional increases in net worth than other types of families, although more-
educated families and white non-Hispanic families continue to have higher wealth than
other families.
• Homeownership rates decreased between 2013 and 2016 to 63.7 percent, continuing a
decline from their peak of 69.1 percent in 2004. For families that own a home, mean net
housing values (value of a home minus outstanding mortgages) rose.” – Jesse Bricker et
al.; Division of Research and Statistics; Board of Governors of the Federal Reserve
System

Return TOC
Economics
Source: https://www.federalreserve.gov/publications/files/scf17.pdf; 9/1/17
Board of Governors of the Federal Reserve System
“Overall, between 2013 and 2016, median net worth grew 16 percent, and mean net worth
grew 26 percent (figure 2).
• Retirement plan participation and retirement account asset values rose between 2013 and
2016 for families across the income distribution, with the largest proportional increases in
participation occurring among families in the bottom half of the income distribution.
• Ownership rates and the value of direct and indirect holdings of corporate equities
increased between 2013 and 2016, with the largest proportional increase in ownership
among families in the bottom and upper-middle parts of the income distribution.
• Business ownership increased from 2013 to 2016 to 13.0 percent, nearing its 2010 level.
These gains were broad based, occurring throughout the income distribution, with the
largest proportional gains occurring among the highest earners.
Income Median and mean inflation-adjusted before-tax family incomes increased between 2013 and
2016. Overall, median income rose 10 percent between 2013 and 2016, from $48,100 to
$52,700 (table 1). Mean income increased 14 percent, from $89,900 to $102,700. The
relatively larger rise in mean income relative to median income is consistent with a widening
income distribution during this period.” – Jesse Bricker et al.; Division of Research and
Statistics; Board of Governors of the Federal Reserve System

Return TOC
Economics
Source: https://www.federalreserve.gov/publications/files/scf17.pdf; 9/1/17

Return TOC
Economics
Source: https://www.federalreserve.gov/publications/files/scf17.pdf; 9/1/17
Board of Governors of the Federal Reserve System
Parental Educational Attainment
“Higher levels of parental education are associated with higher incomes and wealth-holding (figure
C). The typical family in which at least one of the respondent’s parents has a four-year college
degree had a little more than double the income and wealth of families in which neither of the
respondent’s parents had a high school diploma. However, the relationship between parental
education and income and wealth is not as strong as the relationship between a respondent’s own
education and income and wealth. In 2016, the typical family headed by respondents with a college
degree had over 3 times more income and almost 13 times more wealth than families headed by
respondents without a high school diploma (tables 1 and 2 of the main text).” – Jesse Bricker et al.;
Division of Research and Statistics; Board of Governors of the Federal Reserve System

Return TOC
Economics
Source: https://www.federalreserve.gov/publications/files/scf17.pdf; 9/1/17
Board of Governors of the Federal Reserve System
Recent Trends in the Distribution of Income and Wealth
“Data from the 2016 SCF indicate that the shares of income and wealth held by affluent families
have reached historically high levels since the modern SCF began in 1989. The share of income
received by the top 1 percent of families was 20.3 percent in 2013 and rose to 23.8 percent in 2016
(figure A). The top 1 percent of families now receives nearly as large a share of total income as the
next highest 9 percent of families combined (percentiles 91 through 99), who received 26.5 percent
of all income. This share has remained fairly stable over the past quarter of a century.
Correspondingly, the rising income share of the top 1 percent mirrors the declining income share of
the bottom 90 percent of the distribution, which fell to 49.7 percent in 2016.” – Jesse Bricker et al.;
Division of Research and Statistics; Board of Governors of the Federal Reserve System
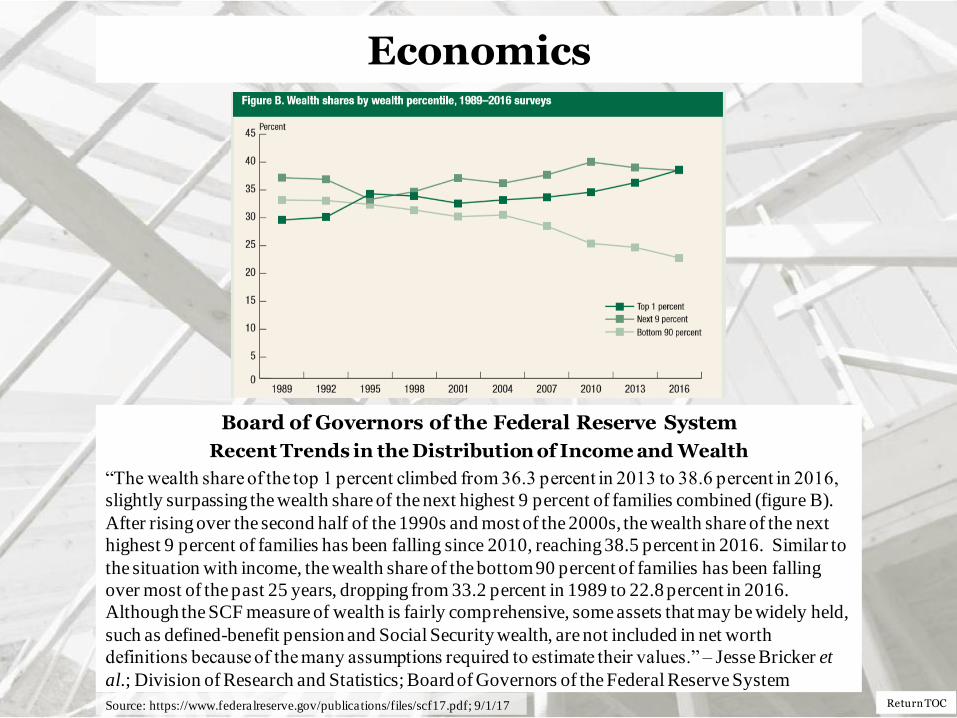
Return TOC
Economics
Source: https://www.federalreserve.gov/publications/files/scf17.pdf; 9/1/17
Board of Governors of the Federal Reserve System
Recent Trends in the Distribution of Income and Wealth
“The wealth share of the top 1 percent climbed from 36.3 percent in 2013 to 38.6 percent in 2016,
slightly surpassing the wealth share of the next highest 9 percent of families combined (figure B).
After rising over the second half of the 1990s and most of the 2000s, the wealth share of the next
highest 9 percent of families has been falling since 2010, reaching 38.5 percent in 2016. Similar to
the situation with income, the wealth share of the bottom 90 percent of families has been falling
over most of the past 25 years, dropping from 33.2 percent in 1989 to 22.8 percent in 2016.
Although the SCF measure of wealth is fairly comprehensive, some assets that may be widely held,
such as defined-benefit pension and Social Security wealth, are not included in net worth
definitions because of the many assumptions required to estimate their values.” – Jesse Bricker et
al.; Division of Research and Statistics; Board of Governors of the Federal Reserve System

Return TOC Return to TOC
Virginia Tech Disclaimer
Disclaimer of Non-endorsement
Reference herein to any specific commercial products, process, or service by trade name, trademark, manufacturer, or
otherwise, does not constitute or imply its endorsement, recommendation, or favoring by Virginia Tech. The views and
opinions of authors expressed herein do not necessarily state or reflect those of Virginia Tech, and shall not be used for
advertising or product endorsement purposes.
Disclaimer of Liability
With respect to documents sent out or made available from this server, neither Virginia Tech nor any of its employees,
makes any warranty, expressed or implied, including the warranties of merchantability and fitness for a particular
purpose, or assumes any legal liability or responsibility for the accuracy, completeness, or usefulness of any information,
apparatus, product, or process disclosed, or represents that its use would not infringe privately owned rights.
Disclaimer for External Links
The appearance of external hyperlinks does not constitute endorsement by Virginia Tech of the linked web sites, or the
information, products or services contained therein. Unless otherwise specified, Virginia Tech does not exercise any
editorial control over the information you January find at these locations. All links are provided with the intent of
meeting the mission of Virginia Tech’s web site. Please let us know about existing external links you believe are
inappropriate and about specific additional external links you believe ought to be included.
Nondiscrimination Notice
Virginia Tech prohibits discrimination in all its programs and activities on the basis of race, color, national origin, age,
disability, and where applicable, sex, marital status, familial status, parental status, religion, sexual orientation, genetic
information, political beliefs, reprisal, or because all or a part of an individual's income is derived from any public
assistance program. Persons with disabilities who require alternative means for communication of program information
(Braille, large print, audiotape, etc.) should contact the author. Virginia Tech is an equal opportunity provider and
employer.

Return TOC
U.S. Department of Agriculture Disclaimer
Disclaimer of Non-endorsement
Reference herein to any specific commercial products, process, or service by trade name, trademark, manufacturer, or
otherwise, does not necessarily constitute or imply its endorsement, recommendation, or favoring by the United States
Government. The views and opinions of authors expressed herein do not necessarily state or reflect those of the United
States Government, and shall not be used for advertising or product endorsement purposes.
Disclaimer of Liability
With respect to documents available from this server, neither the United States Government nor any of its employees,
makes any warranty, express or implied, including the warranties of merchantability and fitness for a particular purpose,
or assumes any legal liability or responsibility for the accuracy, completeness, or usefulness of any information,
apparatus, product, or process disclosed, or represents that its use would not infringe privately owned rights.
Disclaimer for External Links
The appearance of external hyperlinks does not constitute endorsement by the U.S. Department of Agriculture of the
linked web sites, or the information, products or services contained therein. Unless otherwise specified, the Department
does not exercise any editorial control over the information you January find at these locations. All links are provided
with the intent of meeting the mission of the Department and the Forest Service web site. Please let us know about
existing external links you believe are inappropriate and about specific additional external links you believe ought to be
included.
Nondiscrimination Notice
The U.S. Department of Agriculture (USDA) prohibits discrimination in all its programs and activities on the basis of
race, color, national origin, age, disability, and where applicable, sex, marital status, familial status, parental status,
religion, sexual orientation, genetic information, political beliefs, reprisal, or because all or a part of an individual's
income is derived from any public assistance program. (Not all prohibited bases apply to all programs.) Persons with
disabilities who require alternative means for communication of program information (Braille, large print, audiotape,
etc.) should contact USDA's TARGET Center at 202.110.21100 (voice and TDD). To file a complaint of discrimination
write to USDA, Director, Office of Civil Rights, 1400 Independence Avenue, S.W., Washington, D.C. 20250-11411 or
call 1100.11115.3211 (voice) or 202.110.11311 (TDD). The USDA is an equal opportunity provider and employer.
Return to TOC