the vibrational spectroscopy of mineralseprints.qut.edu.au/15940/1/wayde_martens_thesis.pdf ·...
TRANSCRIPT

THE VIBRATIONAL SPECTROSCOPY OF MINERALS
WAYDE NEIL MARTENS
B. APPL. SCI. (APPL. CHEM.) M.SC. (APPL. SCI.)
Inorganic Materials Research Program, School of Physical and Chemical
Science, Queensland University of Technology
A THESIS SUBMITED FOR THE DEGREE OF DOCTOR OF PHILOSOPHY OF THE QUEENSLAND UNIVERSITY OF TECHNOLOGY
2004

2

3
Toss another rock on the Raman…

4
KEYWORDS
Annabergite
Aragonite
Arupite
Baricite
Cerussite
Erythrite
Hörnesite
Infrared Spectroscopy
Köttigite
Minerals
Parasymplesite
Raman Spectroscopy
Solid Solutions
Strontianite
Vibrational Spectroscopy
Vivianite
Witherite

5
ABSTRACT
This thesis focuses on the vibrational spectroscopy of the aragonite and
vivianite arsenate minerals (erythrite, annabergite and hörnesite), specifically the
assignment of the spectra. The infrared and Raman spectra of cerussite have been
assigned according to the vibrational symmetry species. The assignment of satellite
bands to 18O isotopes has been discussed with respect to the use of these bands to the
quantification of the isotopes. Overtone and combination bands have been assigned
according to symmetry species and their corresponding fundamental vibrations. The
vibrational spectra of cerussite have been compared with other aragonite group
minerals and the differences explained on the basis of differing chemistry and crystal
structures of these minerals.
The single crystal spectra of natural erythrite has been reported and compared
with the synthetic equivalent. The symmetry species of the vibrations have been
assigned according to single crystal and factor group considerations. Deuteration
experiments have allowed the assignment of water vibrational frequencies to discrete
water molecules in the crystal structure. Differences in the spectra of other vivianite
arsenates, namely annabergite and hörnesite, have been explained by consideration of
their differing chemistry and crystal structures.
A novel approach to the assignment of site occupancy of ions in the erythrite –
annabergite solid solution has been reported. This approach has utilised vibrational
spectroscopy, in conjunction with careful consideration of the crystal structures of the
minerals. It has been shown that in the erythrite – annabergite solid solution Co

6
prefers metal site 2 contrasting nickel which prefers site 1. This study in conjunction
with other studies has yielded the trend that the more electronegative metal prefers to
occupy site 1, with the least electronegative metal preferring to occupy site 2.
Fundamentally this thesis has increased the knowledge base of the
spectroscopic properties of the aragonite and the vivianite minerals. The site
occupancy of metal ion substitutions in solid solution series of the vivianite group of
minerals has been further enhanced, with novel method of studying the site occupancy
of ions in solid solutions has been developed. A detailed knowledge and
understanding of factor group analysis applied to the study of minerals has been
achieved.

7
PUBLICATIONS WRITTEN IN THE COURSE OF STUDY
1. Martens, W., N., Rintoul, L., Kloprogge, J.T., and Frost, R., L. (2004) Raman single crystal study of cerussite. American Mineralogist, 89, 352-358.
2. Martens, W., N., Kloprogge, J.T., Frost, R., L., and Rintoul, L. (2004) Site
occupancy of Co and Ni in erythrite - annabergite solid solutions by vibrational spectroscopy. American Mineralogist, Submitted.
3. Martens, W., N., Kloprogge, J.T., Frost, R., L., and Rintoul, L.. (2004)
Single-crystal Raman study of erythrite,Co3(AsO4)2·8H2O. Journal of Raman Spectroscopy, 35, 208-216.
4. Martens, W.N., Frost, R.L., and Williams, P.A. (2003) The basic copper
phosphate minerals pseudomalachite, ludjibaite and reichenbachite: An infrared emission and Raman spectroscopic study. Neues Jahrbuch fuer Mineralogie, Monatshefte(8), 337-362.
5. Martens, W.N., Frost, R.L., Kloprogge, J.T., and Williams, P.A. (2003) The
basic copper arsenate minerals olivenite, cornubite, cornwallite, and clinoclase: An infrared emission and Raman spectroscopic study. American Mineralogist, 88(4), 501-508.
6. Martens, W., Frost, R.L., and Williams, P.A. (2003) Molecular structure of
the adelite group of minerals - a Raman spectroscopic study. Journal of Raman Spectroscopy, 34(2), 104-111.
7. Martens, W., Frost, R.L., and Williams, P.A.. (2003) Raman and infrared
spectroscopic study of the basic copper chloride minerals - implications for the study of the copper and brass corrosion and "bronze disease". Neues Jahrbuch fuer Mineralogie, Abhandlungen, 178(2), 197-215.
8. Martens, W., Frost, R.L., Kloprogge, J.T., and Williams, P.A. (2003) Raman
spectroscopic study of the basic copper sulphates- implications for copper corrosion and "bronze disease". Journal of Raman Spectroscopy, 34(2), 145-151.
9. Martens, W., Frost, R.L., and Kloprogge, J.T. (2003) Raman spectroscopy of
synthetic erythrite, partially dehydrated erythrite and hydrothermally synthesized dehydrated erythrite. Journal of Raman Spectroscopy, 34(1), 90-95.
10. Martens, W., and Frost, R.L. (2003) An infrared spectroscopic study of the
basic copper phosphate minerals: Cornetite, libethenite, and pseudomalachite. American Mineralogist, 88(1), 37-46.
11. Martens, W.N., Frost, R.L., Kristof, J., and Kloprogge, J.T. (2002) Raman
spectroscopy of dimethyl sulphoxide and deuterated dimethyl sulphoxide at 298 and 77 K. Journal of Raman Spectroscopy, 33(2), 84-91.

8
12. Martens, W.N., Frost, R.L., Kristof, J., and Horvath, E. (2002) Modification of Kaolinite Surfaces through Intercalation with Deuterated Dimethylsulfoxide. Journal of Physical Chemistry B, 106(16), 4162-4171.
13. Martens, W.N., Ding, Z., Frost, R.L., Kristof, J., and Kloprogge, J.T. (2002)
Raman spectroscopy of hydrazine- intercalated kaolinite at 77, 298, 323, 343 and 358 K. Journal of Raman Spectroscopy, 33(1), 31-36.
14. Martens, W.N., Kloprogge, J.T., Frost, R.L., and Bartlett, J.R. (2002) A
Crystallite Packing Model for Pseudoboehmite Formed during the Hydrolysis of Trisecbutoxyaluminium to Explain the Peptizability. Journal of Colloid and Interface Science, 247(1), 132-137.
15. Kristof, J., Frost, R.L., Martens, W.N., and Horvath, E. (2002) Separation of
Adsorbed and Intercalated Hydrazine in Hydrazine-Hydrate Intercalated Kaolinite by Controlled-Rate Thermal Analysis. Langmuir, 18(4), 1244-1249.
16. Kloprogge, J.T., Visser, D., Martens, W.N., Duong, L.V., and Frost, R.L.
(2003) Identification by RAMAN microscopy of magnesian vivianite formed from Fe2+, Mg2+, Mn2+ and PO4
3- in a Roman camp near fort Vechten, Utrecht, The Netherlands. Netherlands Journal of Geosciences, 82(2), 209-214.
17. Kloprogge, J.T., Martens, W.N., Nothdurft, L., Duong, L.V., and Webb, G.E.
(2003) Low temperature synthesis and characterization of nesquehonite. Journal of Materials Science Letters, 22(11), 825-829.
18. Kloprogge, J.T., Hickey, L., Doung, L.V., Martens, W., N., and Frost, R., L.
(2004) Synthesis and characterization of K2Ca5(SO4)6·H2O, the equivalent of görgeyite, a rare evaporite mineral. American Mineralogist, 89, 266-272.
19. Johnson, T.E., Martens, W., Frost, R.L., Ding, Z., and Kloprogge, J.T. (2002)
Structured water in hydrotalcites of formula MgxZn6-xAl2(OH)16(CO3).4H2O: a Raman microscopic study. Journal of Raman Spectroscopy, 33(8), 604-609.
20. Frost, R.L., Williams, P.A., Martens, W., Kloprogge, J.T., and Leverett, P.
(2002) Raman spectroscopy of the basic copper phosphate minerals cornetite, libethenite, pseudomalachite, reichenbachite and ludjibaite. Journal of Raman Spectroscopy, 33(4), 260-263.
21. Frost, R.L., Williams, P.A., Martens, W., and Kloprogge, J.T. (2002) Raman
spectroscopy of the polyanionic copper(II) minerals buttgenbachite and connellite: implications for studies of ancient copper objects and bronzes. Journal of Raman Spectroscopy, 33(9), 752-757.
22. Frost, R.L., Williams, P.A., and Martens, W. (2003) Raman spectroscopy of
the minerals boleite, cumengeite, diaboleite and phosgenite - implications for the analysis of cosmetics of antiquity. Mineralogical Magazine, 67(1), 103-111.

9
23. Frost, R.L., Williams, P.A., Kloprogge, J.T., and Martens, W. (2003) Raman spectroscopy of the copper chloride minerals nantokite, eriochalcite and claringbullite - implications for copper corrosion. Neues Jahrbuch fuer Mineralogie, Monatshefte(10), 433-445.
24. Frost, R.L., Weier, M.L., Martens, W., Kloprogge, J.T., and Ding, Z. (2003)
Dehydration of synthetic and natural vivianite. Thermochimica Acta, 401(2), 121-130.
25. Frost, R.L., Weier, M.L., Martens, W., Kloprogge, J.T., and Ding, Z.. (2003)
Thermal decomposition of the vivianite arsenates- implications for soil remediation. Thermochimica Acta, 403(2), 237-249.
26. Frost, R.L., Martens, W.N., and Williams, P.A. (2002) Raman spectroscopy
of the phase-related basic copper arsenate minerals olivenite, cornwallite, cornubite and clinoclase. Journal of Raman Spectroscopy, 33(5), 475-484.
27. Frost, R.L., Martens, W.N., Rintoul, L., Mahmutagic, E., and Kloprogge, J.T.
(2002) Raman spectroscopic study of azurite and malachite at 298 and 77 K. Journal of Raman Spectroscopy, 33(4), 252-259.
28. Frost, R.L., Martens, W.N., Kloprogge, T., and Williams, P.A. (2002)
Vibrational spectroscopy of the basic manganese and ferric phosphate minerals: Strunzite, ferrostrunzite and ferristrunzite. Neues Jahrbuch fuer Mineralogie, Monatshefte(11), 481-496.
29. Frost, R.L., Martens, W.N., and Kloprogge, J.T. (2002) Raman spectroscopic
study of cinnabar (HgS), realgar (As4S4), and orpiment (As2S3) at 298 and 77K. Neues Jahrbuch fuer Mineralogie, Monatshefte(10), 469-480.
30. Frost, R.L., Martens, W.N., Duong, L., and Kloprogge, J.T. (2002) Evidence
for molecular assembly in hydrotalcites. Journal of Materials Science Letters, 21(16), 1237-1239.
31. Frost, R.L., Martens, W., Williams, P.A., and Kloprogge, J.T. (2003) Raman
spectroscopic study of the vivianite arsenate minerals. Journal of Raman Spectroscopy, 34(10), 751-759.
32. Frost, R.L., Martens, W., Williams, P.A., and Kloprogge, J.T.. (2002) Raman
and infrared spectroscopic study of the vivianite-group phosphates vivianite, baricite and bobierrite. Mineralogical Magazine, 66(6), 1063-1073.
33. Frost, R.L., Martens, W., Kloprogge, J.T., and Williams, P.A. (2002) Raman
spectroscopy of the basic copper chloride minerals atacamite and paratacamite: implications for the study of copper, brass and bronze objects of archaeological significance. Journal of Raman Spectroscopy, 33(10), 801-806.

10
34. Frost, R.L., Martens, W., Kloprogge, J.T., and Ding, Z. (2003) Raman spectroscopy of selected lead minerals of environmental significance. Spectrochimica Acta, Part A: Molecular and Biomolecular Spectroscopy, 59A(12), 2705-2711.
35. Frost, R.L., Martens, W., Ding, Z., Kloprogge, J.T., and Johnson, T.E. (2003)
The role of water in synthesized hydrotalcites of formula MgxZn6-
xCr2(OH)16(CO3).4H2O and NixCo6-xCr2(OH)16(CO3).4H2O-an infrared spectroscopic study. Spectrochimica Acta, Part A: Molecular and Biomolecular Spectroscopy, 59A(2), 291-302.
36. Frost, R.L., Martens, W., Ding, Z., and Kloprogge, J.T. (2003) DSC and
high-resolution TG of synthesized hydrotalcites of Mg and Zn. Journal of Thermal Analysis and Calorimetry, 71(2), 429-438.
37. Frost, R.L., Kristof, J., Mako, E., and Martens, W.N. (2002) Modification of
the Hydroxyl Surface of Kaolinite through Mechanochemical Treatment Followed by Intercalation with Potassium Acetate. Langmuir, 18(17), 6491-6498.
38. Frost, R.L., Kristof, J., Horvath, E., Martens, W.N., and Kloprogge, J.T.
(2002) Complexity of Intercalation of Hydrazine into Kaolinite-A Controlled Rate Thermal Analysis and DRIFT Spectroscopic Study. Journal of Colloid and Interface Science, 251(2), 350-359.
39. Frost, R.L., Kloprogge, T., Williams, P.A., Martens, W., Johnson, T.E., and
Leverett, P. (2002) Vibrational spectroscopy of the basic copper phosphate minerals: pseudomalachite, ludjibaite and reichenbachite. Spectrochimica Acta, Part A: Molecular and Biomolecular Spectroscopy, 58A(13), 2861-2868.
40. Frost, R.L., Kloprogge, T., Weier, M.L., Martens, W.N., Ding, Z., and
Edwards, H.G.H. (2003) Raman spectroscopy of selected arsenates-implications for soil remediation. Spectrochimica Acta, Part A: Molecular and Biomolecular Spectroscopy, 59(10), 2241-2246.
41. Frost, R.L., Edwards, H.G.M., Duong, L., Kloprogge, J.T., and Martens,
W.N. (2002) Raman spectroscopic and SEM study of cinnabar from Herod's palace and its likely origin. Analyst (Cambridge, United Kingdom), 127(2), 293-296.
42. Frost, R.L., Duong, L., and Martens, W. (2003) Molecular assembly in
secondary minerals - Raman spectroscopy of the arthurite group species arthurite and whitmoreite. Neues Jahrbuch fuer Mineralogie, Monatshefte(5), 223-240.
43. Frost, R.L., Ding, Z., Martens, W.N., Johnson, T.E., and Kloprogge, J.T.
(2003) Molecular assembly in synthesised hydrotalcites of formula CuxZn6-
xAl2(OH)16(CO3).4H2O-a vibrational spectroscopic study. Spectrochimica Acta, Part A: Molecular and Biomolecular Spectroscopy, 59(2), 321-328.

11
44. Frost, R.L., Ding, Z., Martens, W.N., and Johnson, T.E. (2003) Thermal activation of copper oxide based upon the copper hydrotalcite CuxZn6-
xAl2(OH)16(CO3).4H2O. Thermochimica Acta, 398(1-2), 167-174. 45. Frost, R.L., Ding, Z., Kloprogge, J.T., and Martens, W.N. (2002) Thermal
stability of azurite and malachite in relation to the formation of mediaeval glass and glazes. Thermochimica Acta, 390(1-2), 133-144.
46. Frost, R., L., Martens, W., and Kloprogge, J.T. (2004) Synthetic deuterated
erythrite-a vibrational spectroscopic study. Spectrochimica acta. Part A, Molecular and biomolecular spectroscopy, 60(1-2), 343-9.
47. Frost, R., L., Kloprogge, J.T., and Martens, W., N. (2004) Raman
spectroscopy of the arsenate and sulphates of the tsumcorite mineral group. Journal of Raman Spectroscopy, 35, 28-35.
48. Ding, Z., Martens, W., and Frost, R.L. (2002) Thermal activation of copper
nitrate. Journal of Materials Science Letters, 21(18), 1415-1417.

12
TABLE OF CONTENTS
KEYWORDS…………………………………………………………………………………….... 4
ABSTRACT……………………………………………………………………………………….. 5
PUBLICATIONS WRITTEN IN THE COURSE OF STUDY………………………………… 7
STATEMENT OF ORIGINALITY……………………………………………………………… 14
ACKNOWLEGMENTS…………………………………………………………………………... 15
1. INTRODUCTION……………………………………………………………………………… 16
1.1. Description Of Scientific Problem Investigated………………………………………… 16
1.2. Overall Objectives Of This Study………………………………………………………... 17
1.3. Specific Aims Of This Study……………………………………………………………… 17
1.4. Account Of Scientific Progress Linking The Scientific Papers………………………… 18
1.5. References…………………………………………………………………………………. 20
2. THEORETICAL CONSIDERATIONS OF MINERAL SPECTROSCOPY……………… 21
2.1. Introduction……………………………………………………………………………….. 21
2.2. Factor Group Analysis……………………………………………………………………. 24
2.3. Elements Of Symmetry…………………………………………………………………… 25
2.4. Prediction Of The Number Of Normal Modes Of Vibration…………………………... 27
2.5. Point Group Analysis Of Free Molecules………………………………………………... 28
2.6. Application Of The Internal Modes To The Crystal Structure………………………... 32
2.7. Lattice Modes……………………………………………………………………………... 35
2.8. Assignment Of Spectra, Selection Rules, Polarised
Orientated Vibrational Spectroscopy …………………………………………………….
36
2.9. Birefringence……………………………………………………………………………... 39
2.10. Porto Notation……………………………………………………………………………. 40
2.11. Olivenite Example………………………………………………………………………... 41
2.12. Vivianite Minerals And Solid Solutions………………………………………………… 44
2.13. References………………………………………………………………………………… 48

13
3. SINGLE CRYSTAL STUDY OF CERUSSITE……………………………………………… 52
4. SINGLE CRYSTAL STUDY OF ERYTHRITE…………………………………………….. 62
5. SYNTHETIC DEUTERATED ERYTHRITE-A VIBRATIONAL SPECTROSCOPIC
STUDY……………………………………………………………………………….………….
74
6. SITE OCCUPANCY OF CO AND NI IN ERYTHRITE - ANNABERGITE SOLID
SOLUTIONS BY VIBRATIONAL SPECTROSCOPY……………………………………...
84
7. GENERAL DISCUSSION……………………………………………………………………... 95
8. APPENDIX…………………………………………………………………………………….. 98

14
STATEMENT OF ORIGINALITY
The material presented in this thesis has not been previously submitted for a
degree at any other university or institution. To the best of my knowledge, this thesis
contains no material published or written by any other person except where due
acknowledgement is made.
Wayde Martens

15
ACKNOWLEDGMENTS
Thank you to all the people who made this project a possibility. By no means is this acknowledgment complete and by chance the author does not acknowledge you, your contribution however small it is gratefully appreciated. The effort, and financial support of my supervisor Associate Professor Ray Frost has made this thesis a reality. Thank you for always being encouraging, even though sometimes I did not appreciate the constant push you applied which has resulted in the completion of this thesis. You have imparted to me the knowledge of how to make the system work. Dr. Theo Kloprogge (unofficial co-supervisor), Thank you for all the help you have given me through out my journey of the thesis, in both life and academic life. With out your help this thesis would not contain the amount of mineralogy that it does. Although the emotional scars that you have imparted by you will not heal, thank you Dr. Llew (The instrument Nazi) Rintoul, for all your help and insults. Your help in the area of vibrational spectroscopy has left me with a very deep understanding of how the molecules of the universe vibrate. As such thanks for the simulation, mental that is. To all members of the inorganic materials group thank you for always distracting me. You have managed to have never allow me to get bogged down on any one thing. To the demolition expert (Simon Montgomery) please be safe in you future explosions. Sorry I mean exploits. Hopefully you are not required to operate a microwave in the future. Neil, you have seen the bane of my existence, nature always wins. I know your pain when you see SEM images of natural kaolinite growing on quartz. Matt Weier and James Brady may you suffer the rest of your existence for the pain you have caused me. Thanks for trying to keep me sane. However it is apparent that you have failed. Mr. Tony Raferty, I can not thank you enough for all the help you have given me with XRD, crystallography, and Siroquant. Loc Doung, Thor Bostrum and all at the AEMF thank you for allowing me access to your instruments.

16
1. INTRODUCTION:
1.1. DESCRIPTION OF SCIENTIFIC PROBLEM INVESTIGATED
Minerals have been important since ancient times, due to their wealth creation
potential and raw material production [1-3]. Minerals have been used as sources of
metals, building materials, additives, etc.[1-3] Some minerals were even used as
colorants for medieval manuscripts and cosmetics in ancient Egypt [4-8].
Identification of minerals is of the utmost importance as knowledge of secondary
mineralogy gives a direct indication of the primary mineralogy which is of particular
interest for mineral exploration [1]. Therefore, an identification procedure is required
for minerals that is non-destructive, fast, and effective. Raman spectroscopy has
proven a useful technique for the non-destructive identification of minerals [9-12].
Vibrational spectroscopy provides a tool for the identification of minerals with
mineral infrared (IR) spectra being routinely acquired [13]. Identification is easy
through a finger printing technique [12, 13], but the interpretation of spectra is
difficult. Interpretation of mineral vibrational spectra requires factor group analysis
and careful consideration of the crystal structures of the minerals. This study was
undertaken to acquire the spectra of selected groups of closely related minerals and
correlate their spectral differences to their crystal structures. Solid solutions are
known to hinder spectroscopic identification, due to changes in the spectra caused by
replacement of cations or anions in the minerals. This study has been undertaken to
understand the physical changes in the crystal structure due to solid solutions and
correlate this with the effect on the vibrational spectra.

17
1.2. OVERALL OBJECTIVES OF THIS STUDY
In this study the primary objective is firstly to gain an understanding of the
vibrational spectroscopy of minerals. Specifically cerussite in relation to the other
aragonite group minerals and the annabergite erythrite members of the vivianite
group of minerals and their solid solutions. The second objective is to use
vibrational spectroscopy to gain an understanding of the solid solution phenomenon
in the vivianite group of minerals. This study of the solid solutions of vivianites will
focus on the effect of cationic substitution on the vibrational spectra and crystal
structure in synthetic systems. The study utilises the analytical techniques of Raman
spectroscopy, infrared spectroscopy, SEM, and XRD.
1.3. SPECIFIC AIMS OF THE STUDY
The specific aims of the research presented in this thesis were:
• Acquire the vibrational spectra of the aragonite minerals and explain
the differences in the spectra due to changes in the crystal structure of
the minerals.
• Acquire and explain the single crystal Raman spectra of erythrite and
compare these with other vivianite arsenates. A detailed analysis of
bands is undertaken to pinpoint specific vibrating units.
• Determine and explain the solid solution phenomena of erythrite and
annabergite with respect to the vibrational spectra of the minerals.
• Determine the site occupancy of metal ions in the solid solution series
between erythrite and annabergite

18
1.4. ACCOUNT OF SCIENTIFIC PROGRESS LINKING THE SCIENTIFIC
PAPERS
To use vibrational spectra to explain differences related to crystal structures of
minerals it is necessary to gain a full understanding of factor group analysis. It is not
possible to assign any mineral spectra without such knowledge. To establish a basis
the vibrational spectroscopy of the vivianite minerals must be understood, before the
consideration of solid solutions. At this stage with detailed knowledge of factor group
analysis and knowledge of the spectroscopic behaviour of the vivianite arsenates it is
possible to undertake a study of the solid solution phenomenon in the erythrite –
annabergite series. To this end the following chapters are arranged to (Figure 1):
1. Show how factor group analysis is undertaken, how to assign spectra of minerals,
and particular assignment tools utilised in this thesis. (Chapter 2)
2. Assign the single crystal spectra of cerussite and compare the spectra of other
aragonite minerals, further illustrating the assignment of spectra of minerals.
(Chapter 3)
3. Determine and assign the single crystal spectra of erythrite, with comparison to
other vivianite arsenates to determine a basis for further work on
erythrite/annabergite. Comparison of the spectra to other vivianite minerals
establishes a crystallographic basis for variation of the spectra. (Chapter 4)
4. Investigate the spectra of deuterated erythrite to determine the assignment of water
vibrational modes, and track the independent water molecules. (Chapter 5)
5. Investigate the solid solution of erythrite annabergite using synthetic samples.
(Chapter 6)

19
Figure 1 Interaction and arrangement of chapters
Factor Group Analysis (FGA) of Minerals (Chapter 2)
Single Crystal Study of Cerussite (Chapter 3)
Application of FGA to assignment of spectra Spectral differences due to crystal structure
Single crystal study Of Erythrite (Chapter 4)
Basis study of spectroscopy of vivianites
Deuterated erythrite (Chapter 5)
Further assignment of spectra of vivianites particularly water modes
Solid solution of erythrite and annabergite (Chapter 6)
Determine site occupancy in solid solutions with vibrational spectroscopy
Appendix (Chapter 8)
Auxiliary mineral spectroscopy studies

20
References
1. Klein, C., Mineral Science. 22 ed. 2002, New York: Wiley. 2. Korbel, P. and M. Novak, The Complete Encylopedia Of Minerals. 2001,
U.K.: Grange Books. 3. Bishop, A.C., A.R. Woolley, and W.R. Hamilton, Philip's Minerals, Rocks
and Fossils. 3rd ed. 1999, London: Octopus Publishing Proup. 4. Frost, R.L., W. Martens, J.T. Kloprogge, and P.A. Williams, Journal of Raman
Spectroscopy, 2002. 33(10): p. 801-806. 5. Reiderer, J., Archaeometry, 1974. 16: p. 102. 6. Scott, D.A., Stud. Conserv., 200. 45: p. 39. 7. Kuchitsu, N., N. Kuroki, S. Inokuchi, and S. Mitsuishi, Hozon Kagaku, 1999.
38: p. 108. 8. Dei, L., A. Ahle, P. Baglioni, and D.F. Dini, E., Stud. Conserv., 1998. 43: p.
80. 9. Brooke, C., H. Edwards, and J. Tait, Journal of Raman Spectroscopy,
1999(30): p. 429. 10. Burgio, L., Ciomartan, and R. Clark, Journal of Raman Spectroscopy,
1997(29): p. 79. 11. Farmer, V.C., ed. The Infrared spectra of minerals. 1974, Mineralogical
Society: London. 12. Frost, R.L., J. Kloprogge, and J. Schmidt, Non-destructive identification of
minerals by Raman microscopy. The Internet Journal of Vibrational Spectroscopy. 3(4).
13. Hunt, G., Salisbry. Mod. Geol., 1971(2): p. 23.

21
2. THEORETICAL CONSIDERATIONS OF MINERAL SPECTROSCOPY
2.1. Introduction
Minerals are elements or combinations of elements in a crystalline form which
have been produced by a natural geological process [1-3], as such each different
mineral species must be different in composition or crystal structure [1-3].
Therefore, minor substitutions in a mineral structure are not classified as different
minerals unless this substitution occurs in constant specific ratios [1].
Identification of minor phases - present as associations - can also give an
indication of the geological history of the major mineral species [1]. Therefore, an
identification procedure that is non-destructive, fast, and effective is required to
identify these minerals. Current mineral identification techniques include:
(i) X-ray Diffraction (XRD):
X-ray diffraction is currently used as the main phase identification
technique. However, it is occasionally inappropriate due to the
necessity to grind the samples, which causes obvious damage to
valuable samples.
(ii) Optical Mineralogy:
Optical mineralogy is used as an identification procedure but 1 µm thin
sections must be prepared. The procedure is time consuming with user
experience playing a major role in the analysis.
(iii) SEM, AA/AE, ICP-MS, XRF:
These are the main suite of techniques used for compositional analysis.
Carbon coating (SEM) or dissolution (AA/AE, ICP-MS, XRF) is a

22
requisite for these analyses. A set of accurately known standards have
to be prepared for a reliable calibration of the method.
Vibrational spectroscopy provides an alternative tool for the identification of
minerals, with mineral IR spectra being routinely acquired [4]. Identification is easy
through a finger printing technique [4, 5], but the interpretation of spectra is difficult.
Vibrational spectroscopy is often the best method for the identification of minerals
when other techniques such as XRD can not be undertaken due to sample quantity
(minor phases), crystallinity (amorphous/semi-amorphous) and destructiveness
(grinding/dissolution)[5, 6]. Raman spectroscopy has proven a useful technique for
the non-destructive identification of minerals [5-8].
Copper arsenates, phosphates, chlorides, and carbonates have been extensively
used in many medieval manuscripts for pigments, but due to their nature, are easily
confused owing to their similarities in chemical composition, crystal structure, and
colour [9-16]. The dark green copper phosphate polymorphs - pseudomalachite,
reichenbachite, and ludjibaite - are difficult to distinguish. These copper minerals are
also confused with malachite Cu2(CO3)(OH)2 [17], and the copper arsenates
cornwallite, olivenite, and clinoclase [9-16]. Easy non-destructive methods of
analysis are required for these minerals, thus the utilisation of vibrational
spectroscopy is important for the study of these minerals and medieval manuscripts
[18, 19]. Raman spectroscopy can easily distinguish different anions such as
carbonate, arsenate, phosphate, nitrates, sulphides, chlorides, etc. [5, 6]. Minerals with
polymorphs can also be distinguished through the use of factor group analysis. Raman
spectroscopy has even been employed to identify the geographical origin of

23
minerals[19]. Raman microscopy allows the easy selective orientation of crystals and
has the ability to acquire the spectrum of a single crystal due to its spatial resolution
of 1µm [20]. Fluorescence from the sample matrix is also reduced with Raman
microscopy due to the reduction of sampling volume [20]. Birefringence can also
cause problems in Raman spectroscopy, because of the confocal nature of
microscopes; Raman microscopy evades this problem [20]. However, Raman
microscopy does suffer from some disadvantages, for instance a large amount of
leakage due to the microscope optics can occur. This is due to the analysed and
excitation radiation collected without a strictly parallel arrangement. The amount of
radiation that is not incident/ collected strictly parallel may be calculated [20].
Samples have an increased tendency to burn / decompose in Raman microscopy with
the laser power concentrated into a smaller volume. This is especially a problem with
blue samples when using He-Ne lasers as blue samples absorb red light, thus the laser
radiation is absorbed by the sample and dissipated as heat.
Solid solutions provide an added complication to vibrational spectroscopy due to
the broadening of spectra from random substitutions into the crystalline lattice causing
a loss of factor group. Standards are often not available for comparison and therefore,
identification is sometimes inconclusive, requiring the synthesis of minerals for
reliable identification standards.
Complex solid solutions also exist, the presence of which may be studied by
vibrational spectroscopy, as other techniques such as XRD may not detect them.
Many secondary mineral samples are also rare and found only in exclusive secondary
mineral collections. Techniques such as attenuated total reflectance (ATR), diffuse

24
reflectance (DRIFT) and Raman microanalysis are often used for the study of
minerals and other crystalline or semi-crystalline materials. Data analysis is often
fraught with danger and a number of critical questions aris e. What bands are
applicable to which molecular species? How many bands do we expect for each
molecule? And how do differences in crystal space group affect the vibrational
spectra of the mineral? For these questions to be answered, factor group analysis
must be employed. Factor group analysis of simple free molecules is often easy, but
the extension into crystalline materials is frequently troublesome. The following
sections offer a review of factor group analysis of simple molecules and then an
extension to crystalline lattices. These sections discuss symmetry elements, factor
group analysis of free molecules, site symmetry and factor group analysis of solids, as
well as the assignment of vibrations to molecular groups and symmetry species.
2.2. Factor Group Analysis
Factor group analysis is a method used for determining symmetry of vibrations
[6, 20-27]. It is useful for determining how many bands are expected of each type of
molecule in the vibrating unit and is also useful for ascertaining differences in spectra
of polymorphous materials. The variation in the spectra of polymorphs are due to the
difference in the symmetry of the polymorph [6, 20-27]. The symmetry elements and
the combination of symmetry elements is the crux of factor group analysis. An atom
in a vibrating unit, a molecule or crystal, may be thought of as having three degrees of
movement, namely x, y, and z directions. From the combination of the symmetry
elements of each vibrating unit the movement of the atoms, which results in an overall
25
change in the dipole moment (infrared spectroscopy) or polarisablity of the electron
cloud (Raman spectroscopy), may be inferred.
2.3. Elements of symmetry
To gain an understanding of factor group analysis it is necessary to first obtain
an understanding of elements of symmetry. It is these elements of symmetry and the
addition of them that predicts the normal modes of vibration of a molecule in a
crystalline lattice. Symmetry elements such as inversion centres, mirror planes,
rotation axis and the addition of these to get the overall symmetry species will be
looked at in this section. A symmetry element is an operation that once applied to a
shape leaves that shape unchanged after the operation [6, 21, 28]. One of the simplest
symmetry elements is possibly the mirror plane, an example of which is human hands.
If both hands are placed together with small fingers touching it is easy to see that if a
mirror is placed between the hands, one hand reflects onto the other hand. Each digit
on the hand has an identical image on both the left and right of the image. This is also
applicable to molecules such as the water molecule; a mirror plane may be drawn
down the centre of the molecule bisecting the oxygen and the angle of the two
hydrogens. Another mirror plane, which bisects all atoms, is also present, as shown in
Figure 1.

26
Figure 1 Symmetry elements in the water molecule
Another symmetry element is the rotation axis. An example of a rotation axis
is shown in Figure 1, where the water molecule may be rotated about the oxygen.
Other more complex images such as the tetrahedron also have rotation axis. Each
apex of the tetrahedron has a three fold rotation axis. If a shape has no symmetry
operation applicable to it the symmetry element is assigned to a C1 rotation axis and
represents the lowest symmetry possible. Inversion centres are centres of symmetry
where all elements are able to be transposed through the centre of symmetry to
achieve the same image as before. An example of an inversion centre is shown in
Figure 2.
Figure 2 Inversion centre

27
It can be seen that if all points are transposed through the origin to the other
side along the axis, the same shape is achieved. Elements of symmetry are able to be
combined to achieve a set of possible symmetry operations of a factor group. This
factor group will be discussed further in the following sections.
2.4.Prediction of the number of normal modes of vibration
The number of normal modes of vibration for a crystal or molecule may be
calculated from the number of degrees of freedom of it has to vibrate. This is related
to the number of atoms in the crystal or molecule. Since there are three degrees of
freedom for an atom to vibrate, there are 3N modes of motion possible where N is the
number of atoms in the molecule or crystal. As the whole crystal or molecule may
translate in three directions, then these must be subtracted from the total. Molecules
may also rotate about three directions for bent molecules, or two directions for linear
molecule, thus three or two modes must be deducted respectively. This allows the
following formula for the calculation of the normal modes of vibration of a molecule:
3N-5 Linear molecules
3N-6 Bent molecules.
Crystals have an added confusion, as the contents of the unit cell may not
reflect the content of the Bravais unit cell. Only the number of atoms in the Bravais
unit cell may be used to predict the number of normal modes of vibration of a crystal.
The number of atoms in the Bravais cell can be calculated by the formula:
LPZ
N =
Where N is the number of atoms in the Bravais unit cell, Z is the number of atoms in
the unit cell, and LP is the number of lattice point as determined from Table 1.

28
Table 1 Unit cell type and number of lattice points
Type A,B,C or I F P R LP 2 4 1 3 or 1*
* This lattice may have been reduced to primitive form
From the number of atoms in the Bravais cell the number of modes of
vibrations of a crystal may be determined by the formula:
3N-3 where N is the number of atoms in the Bravais unit cell. Only the three translational modes are subtracted in the case of a crystal as the
rotation of an atom or a molecule is not the same as the rotation of a neighbouring
group or atom.
2.5.Point group analysis of free molecules
The water molecule is one of the simplest cases which contains a combination
of symmetry elements. The water molecule has three atoms - one oxygen bound to
two hydrogens – at an angle of ~120° (Figure 1). A line can be drawn down the
middle of the oxygen, bisecting the angle between the two hydrogens. If the molecule
is rotated around this axis, there are two positions, which produce the same image as
the original starting position. This line represents a two fold rotation or commonly
referred to as the C2 axis and a rotation of 180° about the C2 axis is called a C2
symmetry operation. There are also two more symmetry elements in the water
molecule, the mirror planes. The first plane is the plane of the atoms; the second plane
is normal to the first and intersects it along the C2 axis. These mirror planes reflect the
atoms on one side of the molecule directly onto the other side. These are the Cs
planes, where s represents a mirror plane. Once the symmetry operations for the

29
molecule are known, the point group may be determined by following the flow chart
below (Figure 3). In this case, it may be deduced that the molecule has C2v symmetry.
The next step is to use the point group to assign the symmetry species of the
vibrations of the molecule. Consider the water molecule in terms of distinct elements;
the oxygen, which is sitting on a C2 axis and two mirror planes, and two identical
hydrogens sitting on a mirror plane. There are rules of convention governing the
assignment of the x, y, z axes [28].The z axis in vibrational spectroscopy is considered
the most important axis, which is commonly the axis that intersects the most atoms
with the most symmetry [28]. In the water molecule the z axis corresponds to the C2
axis. In this case the oxygen atom is sited on the highest point of symmetry [28]. The
x axis is now chosen to be perpendicular to the molecular plane and the y axis to be in
the molecular plane [28].

30
Figure 3 Flow chart for determination of point group [28]
Having assigned the axes, correlation tables such as those in Farmer may be
consulted to find the symmetry species of the vibrations of the molecules [11]. The
correlation table for C2v is shown below in Table 2. The first column shows the
highest symmetry group. In this particular case it is the C2v column that is the highest
symmetry species present. The letters in this column represent the modes, which are
available to the molecule to vibrate. Each distinct atom (with respect to symmetry and
atomic type) is considered for its particular symmetry elements. Consulting the
correlation for oxygen (C2v), it can be seen that there is displacement for the oxygen
in the A1, B1 and B2 symmetry operations. The hydrogens can be seen to be on
yzsC elements allowing for two displacements in the A1 mode, one in the A2 mode, one
for B1 and two for the B2 mode. The addition of these modes gives the reducible

31
representation given by in this case 3A1 + A2 + 2B1 + 3B2. However six of these
modes describe the modes of vibration which describe rotations and translations. In
Table 2 it can be seen that translations (T) and rotations (R), occur as the modes A1
(Tz), A2 (Rz), B1 (Tx,Ry), and B2 (Ty, Rx). The available modes of vibration of the
water molecules can then be obtained by the subtraction of the translation and
rotations possible. This is summarised in Table 3.
Table 2. Correlation table for the C2v point group
Table 3. Factor group analysis of the water molecule.
Available modes Elements of symmetry A1 A2 B1 B2
Displacements of the O atom C2v 1z 0 1x 1y Displacements of the H atoms Cs
yz 2p 1x 1x 2p Rotations and translations Tz Rz Tx,
Ry Ty, Rx
Available vibrations of the water molecules
2A1 - - 1B2
The irreducible representation of the water molecule is Γ = 2A1 + B2, which
predicts 3 modes for water. The 3N-6 rule discussed earlier allows for a check of the
number of modes possible, in this case confirming the prediction of three modes of
vibration for water. In Table 3 it is seen that translations apply to the normal modes
for the water molecule. This indicates that the dipole moment oscillates in the same

32
direction as the translation allowing for infrared activity. In addition it can be seen
that the polarisability tensor has modes applicable for the normal modes of water.
Thus, the modes will be Raman active also.
2.6. Application of the internal modes to the crystal structure
The discussion to date has dealt with the vibrational modes available to
isolated molecules. For the extension of factor group analysis to crystalline solids an
understanding of crystallography is required. Crystalline lattices exist as a specific
structure for which the atoms may only exist on only specific sites. There exist some
230 space groups which relate to 33 crystallographic space groups. Each specific
space group has a finite number of sites with specific symmetry. The “International
Table For Crystallography” has the relative co-ordinates for each symmetry site
contained in the unit cell which may be used in conjunction with single crystal XRD
to determine the identity of the atoms on each site. For the use of the XRD results in
vibrational spectroscopy the following table (Table 4) is needed to translate from
Hermann-Mauguin notation (XRD, crystallography) to Schoenflies notation
(spectroscopic) [11, 32].
33
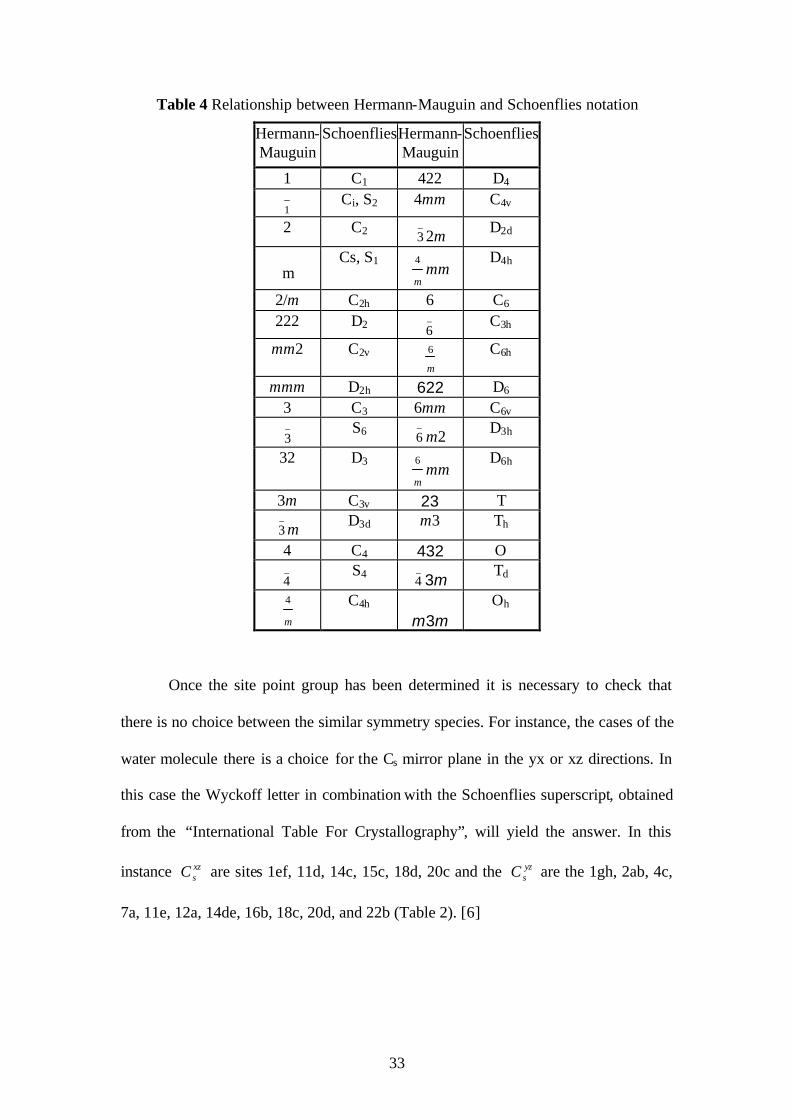
Table 4 Relationship between Hermann-Mauguin and Schoenflies notation
Hermann-Mauguin
Schoenflies Hermann-Mauguin
Schoenflies
1 C1 422 D4
1_
Ci, S2 4mm C4v
2 C2 3_2m D2d
m Cs, S1
m
4mm
D4h
2/m C2h 6 C6 222 D2
6_
C3h
mm2 C2v m
6 C6h
mmm D2h 622 D6 3 C3 6mm C6v
3_
S6 6_
m2 D3h
32 D3 m
6mm
D6h
3m C3v 23 T
3_m D3d m3 Th
4 C4 432 O
4_
S4
4_
3m Td
m
4 C4h
m3m Oh
Once the site point group has been determined it is necessary to check that
there is no choice between the similar symmetry species. For instance, the cases of the
water molecule there is a choice for the Cs mirror plane in the yx or xz directions. In
this case the Wyckoff letter in combination with the Schoenflies superscript, obtained
from the “International Table For Crystallography”, will yield the answer. In this
instance xzsC are sites 1ef, 11d, 14c, 15c, 18d, 20c and the yz
sC are the 1gh, 2ab, 4c,
7a, 11e, 12a, 14de, 16b, 18c, 20d, and 22b (Table 2). [6]

34
Once the sites have been unequivocally determined, the factor group splitting
can be determined. Appropriate correlation tables can be consulted to determine how
the site symmetry reduces the internal modes to lower symmetry modes. If vibrational
modes are degenerate such as E and T modes, the site symmetry may split the modes
into lower symmetry species allowing multiple modes for the degenerate modes. A
crystal symmetry correlation table, such as Table 5, (Factor Group) can be used to
determine the splitting of the site mode which will result in splitting of these modes.
The occurrence of more than one of the identical molecules (with relation to
symmetry and atom type, could result in coupling). In the case of water molecules
(C2v) sitting on a C1 site in a C2h crystal, such as gypsum, the A1 and B2 mode form A
modes on C1 site and split to Ag, Bg, Au, and Bu modes in the C2h crystal as shown in
Table 6. This would suggest that in this case there is the occurrence of four of the
same molecules in the lattice, which will result in the splitting of A modes. It is also
noted that this results in a symmetric characteristic (Ag modes, vibrating in phase) and
an anti-symmetric mode (Bg, vibrating out of phase).
Table 5. Correlation table for the C2h Point group

35
Table 6 Factor group splitting for a water molecule on a C1 site in a C2h crystal
Free
C2v
Site
C1
Crystal
C2h
2A1
B2
3A
3Ag
3Bg
3Au
3Bu
The 3N-3 rule may then be applied to determine if all modes of vibration have
been described. In the case of crystals, the contents of the Bravis lattice must be
considered and not the total unit cell contents as discussed in the previous sections.
Taking this into account, three modes are available to the free water molecule, but in
the case above there are 4 water molecules in the Bravis cell and hence each mode
splits into 4, allowing 12 modes of vibration. All the modes of vibration determined in
this section have been concerned with the vibration of the molecule, the so-called
internal modes of vibration. There are also the vibrations of the molecule as a whole,
vibrating within the crystalline lattice.
2.7. Lattice modes
Lattice modes are dealt with by a similar mechanism to that of the vibrations
of molecules. The main difference between the factor group analysis of lattice
vibrations and internal modes, is that lattice modes are considered as the movements
of groups of atoms in the crystalline lattice [21, 25]. For instance, gypsum
CaSO4.2H2O, the water and sulphate molecules would be considered as free entities
then subjected to the symmetry constraints of the site, then the crystal symmetry. It is
then necessary to consider the motions of the sulphate group, the water molecules, as

36
well as the motion of the calcium atoms in the crystal. To consider the factor group
analysis of lattice modes it is necessary to know the site symmetry of each group [21,
25]. It is necessary to know the modes available for the molecule to translate and
rotate. While in the case of atoms, only translations need be considered due to their
rotational symmetry, it is however necessary to consider translations and rotations in
the case of molecules [25]. The appropriate modes may be deduced from correlation
tables. In the case of water molecules on C1 sites there are 6A modes available for the
water molecule to rotate and translate. This is then related to the C2h crystal group.
This predicts the formation of the reducible representation 6Ag + 6Bg + 6Au + 6Bu.
Each group of atoms is considered in turn to produce the active lattice vibrations
which are added to achieve the lattice modes of the crystal. It is again necessary to
consider the three modes that represent the translations of the whole crystal, which are
not active vibrations. These modes are subtracted to give the irreducible
representation 5Ag + 4Bg + 5Au + 4Bu.
2.8.Assignment of spectra, Selection Rules, Polarised Orientated Vibrational
spectroscopy
Assignment of spectral bands to various symmetry species can be achieved via
polarised single crystal Raman and polarised single crystal infrared investigations [20,
21, 25]. The symmetry species of the vibrations can be ascertained by orientating the
crystal of a mineral along different polarisations of the incident radiation. For Raman
measurements the polarisability tensor of the vibration is different along different axis
of the crystal [20, 21, 25]. The probability of a Raman transition is proportional to
[20, 21, 25]:

37
?? oa? i dt Where ?o is the vibrational wave function, a is the polarisability of the
molecule, ? i is the vibrational wave function, and dt implies the integration is carried
over all possible variables of the wave functions. The polarisability a is the ease with
which the electron cloud in the molecule may be distorted. This quantity is a tensor, a
3X3 array of components, i.e. axx, axy, axz, ayx, ayy, ayz, azx, azy, and azz, where akl = alk.
In the case where the integral is zero, then there is zero probability that the transition
will occur [20, 21, 25]. The integral will only be non zero in the case where the
product ? oa? is totally symmetric, that is +1. This can only be achieved when akl has
the same symmetry properties as ? i [21, 25]. The symmetry properties of akl are the
same as the symmetry properties of kl. Thus, if the normal mode has the same
symmetry as one of these binary combinations of x, y, and z, then a transition from the
ground state will be Raman active [21, 25]. A typical form of a polarisability tensor is
shown in Chapters 3 and 4. If a character is shown, then a transition along the axis
may be allowed. Modes of vibration that are not allowed will be of zero intensity or
very low intensity. Orientated single crystal Raman studies, with Raman spectra taken
of all possible orientations and polarisations possible, will yield the symmetry species
of the vibrations.
The polarisability tensors for a vibration are calculated along the spectroscopic
axis [20]. Thus it is necessary to know the relationship of the crystallographic axis in
relation to the spectroscopic axis. This can be achieved by the knowledge of the
translations of a spectroscopic group, available in correlation tables. In this way a
spectroscopic axis of translation can be seen to move in a direction associated with a
mode of vibration. From the correlation tables these modes can be related to the site
and space groups to determine the spectroscopic axis with relation to the crystal axis.

38
From an atomic coordinate model, the relationship between the spectroscopic and
crystallographic axis can be deduced. The spectroscopic axis can also be deduced
from the correlation tables, by looking at the symmetry species and Schoenflies /
Wyckoff letter if the space group has choices for the definition of the same symmetry
element.
Once the symmetry species of the bands are identified there is a possibility of
further assignment from deuteration, isotopic and analogous series studies (cationic
and anionic series) through the use of Hooke’s Law. Satellite bands are known to exist
in cerussite, with the intensity of these bands about 1% of the corresponding ν1 band
intensity[29-31]. This satellite is due to isotopic 18O substitution in the carbonate
group [29-31]. The calculated frequencies of this vibration are, from Equation 1, for
cerussite 1030, aragonite 1058, witherite 1034, and strontianite 1044 cm-1, which are
in good agreement with the experimental results [32].
V =µ
kcp
o
21
(Equation 1)
µ= reduced mass of participating atoms ko = force constant V = vibrational frequency in wavenumbers c= speed of light
Studies have shown a strong correlation between OH stretching frequencies
and both the O…O bond distances and the H…O hydrogen bond distances. [33-36] The
significant work of Libowitzky [37] showed that a regression function can be
employed, relating the above correlations with regression coefficients better than 0.96
[37]. The function is ?1 = 3592-304x109exp(-d(O-O)/0.1321) cm-1. Minerals where

39
two or more types of OH units are identified in the structure, the known hydrogen
bond distances may be used to calculate the hydroxyl stretching frequency. From this
predicted hydroxyl stretching frequency further assignment of the spectra may be
made.
Some vibrations that are treated as lattice vibrations such as hydroxyl
stretching vibrations, therefore may be hard to differentiate these vibrations from the
other lattice modes. Vector analysis may be employed to gain insight into these bands.
Vector analysis considers vibrations of a molecule as a vector. Interactions of this
vector with other vectors of an identical nature are deduced from the factor group. For
the below example of olivenite, it is unclear how many vibrations are expected from
the hydroxyl groups. As the hydroxyl groups are sitting on C1 sites there is only one
vector that the hydroxyl is allowed to vibrate on their site symmetry (A). When this is
allowed to split in the factor group there are 1Ag, 1Au, 1Bg, and 1Bu modes predicted,
of which, g modes are Raman active and u modes are infrared active. Olivenite does
indeed have two hydroxyl bands in the Raman [16]. This implies that in the structure
of olivenite there are four hydroxyls which couple to produce the four modes.
2.9. Birefringence
Birefringence is a well known hindrance to single crystal vibrational studies.
Birefringence is manifested as the differences in the refractive indices down each
independent optical axis. As such, there is a difference in the velocity of light down
these axes, hence a change in the resulting polarisation of the incident light. Erythrite
is known to be birefringent with refractive indices of a = 1.625, ß=1.661, and ? =

40
1.691 [38]. The optical axes or pseudo-optical axes, are orthogonal on all axes except
on the 010 face, in which the optical axis make a 30° angle with the c crystal axis
[39]. The amount of depolarisation of incident radiation on a birefringent crystal can
be calculated from the equation:
L = 100[cos2 ? – sin 2(G- ? ).sin 2G.sin2 (?/?).180] [39]
where L is the amount of radiation for which the plane of polarization is rotated by
90°, G is the angle the optical axis makes with the incident radiation, ? is the angle
between the analyser and polariser, ? is the difference between the refractive indices
multiplied by the thickness of the sample and ? is the wavelength of the incident
radiation [39]. This equation predicts that along the 010 face of a crystal of erythrite
incident polarised radiation is 28 % scrambled. This prevents the collection of reliable
oriented single crystal data from the 010-crystal face.
2.10. Porto notation
Porto notation is a way of expressing the orientation of the crystal with
reference to the polarisation of the laser in both the excitation and analysing directions
[25]. This notation consists of a four letter code expressing the direction of the
propagation of the incident radiation, the polarisation of the incident radiation, the
polarisation of the analysed radiation and the direction of propagation of the analysed
radiation. For example BACB, the first letter depicts the axis for the propagation of
the laser light, the second depicts the orientation of the polarisation direction i.e. the
direction that the laser is vibrating in the excitation, the third is the vibrational

41
direction of the Raman scattered photons that are being analysed and the last the
direction of propagation of the analysed laser beam [25]. This is all done with
reference to the crystal that is being analysed. An example is shown in Figure 4.
Figure 4 A example of Porto notation.
2.11. Olivenite Example
Olivenite is an olive-green copper arsenate mineral, and as with all secondary
copper arsenate minerals, it is formed from the oxidisation of native copper ore in
arsenate containing ground waters [16]. Crystals of olivenite may be short prismatic
to acicular; globular, reniform or nodular, fibrous structure; massive, granular to
earthy. Olivenite has the formula, Cu2(AsO4)OH, with four structural units per unit
cell. The crystal structure of olivenite is monoclinic, P21/n, with the Schoenflies
notation for this space group being C2h5 [16, 38]. From the atom coordinates, Figure 5,
it can be deduced that all atoms in the structure are on C1 sites. There are nine atoms

42
in a formula unit with four formula units per unit cell predicts 3N–3 (3*4*9 – 3 =
105) vibrations. The arsenate ion has the free symmetry of Td, with the arsenic atom
siting on all elements of symmetry, and all oxygen’s siting on a mirror plane and a
three fold rotation axis. From character tables, Table 7 may be constructed for the
arsenate ion.
Figure 5 Atom positions of each atom in the olivenite crystal structure.
Table 7. Factor group analysis of the free arsenate ion.
Available modes Elements of symmetry A1 A2 E F1 F2
Displacements of the As atom Td 0 0 0 0 1 Displacements of the O atoms C3v 1a 0 1p 1p 2
Rotations and translations R T Available vibrations of the arsenate ion A1 - E - 2T2

43
The arsenate vibrations can then be split to the site and space group in
accordance with Table 8. This shows that the A1 + E + 2T2 modes of the arsenate split
to A modes in the C1 site and split to 9Ag +9Bg + 9Au + 9Bu modes in C2h. The Ag and
Bg modes will be Raman active while the Au and Bu modes will be infrared active
[16].
Table 8. The factor group splitting of the arsenate ion in the olivenite structure.
Td C1 C2h A1 E
2T2
9A
9Ag 9Bg 9Au 9Bu
As all atoms in the crystal lattice have site symmetry of C1, only A modes are
available for the rotations and translations of the arsenate, the copper, and the
hydroxides. From this, construction of Table 9 can be undertaken to determine the
modes of vibration in the factor group.
Table 9. Factor group analysis of the lattice modes in olivenite
Site group Crystal C1
18A
52hC
18Ag 18Au
18Bg 18Bu
Γ = 18Ag + 18Bg + 17Au+ 16 Bg
69 Vibrations
It may be calculated that 105 normal modes of vibration are predicted for the
olivenite crystal from the 3N-3 rule. From the factor group analysis it has been
calculated that 105 vibrations are predicted, 36 internal modes of the arsenate ion and

44
69 lattice modes [16]. As both the 3N-3 rule and factor group analysis predicts the
same number of vibrations then all modes of vibrations have been calculated.
Once the symmetry species of the normal modes of vibration have been
determined, is necessary to determine the activity of these modes. Inspection of the
relevant correlation tables reveal that the Ag modes are active in Raman spectra of
XX, YY, ZZ and XY nature (Table 5). The Bg modes are active in the YZ, ZX spectra
(Table 5). These tensor elements are along the spectroscopic axes, and therefore great
caution must be practiced to ensure that the relationship between the spectroscopic
and crystallographic axes are known. In the case of the monoclinic cell the b
crystallographic axis is usually the unique axis which relates to the z spectroscopic
axis. Further to this, the relation of the optical axis to the spectroscopic axis must be
also checked to ensure that no birefringence occurs. In monoclinic cases,
misalignment of the optical and spectroscopic axis usually occurs in spectra excited
down the b axis. Other examples of factor group analysis are shown in Chapters 3 and
4.
2.12. Vivianite minerals and solid solutions
Vivianite group of minerals have the general formula A32+(XO4)2.8H2O, where
A2+ may be Co, Fe, Mg, Ni, Zn and X may be P or As [38]. Vivianite minerals are
monoclinic with point group 2/m [38] and two formula units per unit cell [38, 40].
The vivianite group consist of the minerals[38, 40, 41]:

45
Annabergite Ni3(AsO4)2.8H2O
Arupite Ni3(PO4)2.8H2O
Baricite (Mg,Fe)3(PO4)2.8H2O,
Erythrite Co3(AsO4)2.8H2O,
Hörnesite Mg3(AsO4)2.8H2O,
Köttigite Zn3(AsO4)2.8H2O,
Parasymplesite Fe3(AsO4)2.8H2O
Vivianite Fe3(PO4)2.8H2O.
These minerals are closely related to bobierrite Mg3(PO4)2.8H2O, and
manganese-hörnesite (Mn, Mg)3(AsO4)2.8H2O which have a b-axis twice of those in
the vivianite group [38, 40, 41].
Vivianites form solid solutions of mixed metal and mixed phosphates with
most metal ions producing complete solid solution mixing curves [42-55]. Erythrite
has been used for the preparation of pigments and glazes due to its brilliant pink
colour [56-61], with the remediation of arsenates from soils also receiving attention
[62-64]. The thermal transformations of vivianites has recently been studied with
Raman, infrared, and infrared emission spectroscopy [65-67].The infrared spectrum of
vivianite minerals has been previously determined [6, 68, 69]. Single crystal x-ray
diffraction studies have determined the crystal structure of erythrite [40]. The unit cell
contains 2 formula units in the space group 32hC with cell parameters of a = 10.251 Å,
b = 13.447 Å, c = 4.764 Å, and ß = 104.98° [38]. There are two sites occupied by two
independent cobalt atoms (C2h, C2 site symmetry), with one independent arsenate ion
(Cs site symmetry) and two independent water molecules (Ci site symmetry)[70].

46
Minerals of the vivianite group crystallize in the form of M (1)O2(H2O)4 octahedra
and M (2)2O6(H2O)4 double octahedral groups (where M is the metal), which are
linked via XO4 tetrahedra to complex sheets in (010), further interconnected by
hydrogen bonds only[70]. This structure is shown for erythrite in Figure 6.
Figure 6 The atomic structure of erythrite
Mixed metal vivianite samples, of chemical compositions
Co2.01Fe0.74Ni0.25(AsO4)2.8H2O for erythrite and Ni2.48Mg0.50Fe0.02(AsO4)2.8H2O for
annabergite, have been studied by energy dispersion x-ray spectroscopy and
microprobe analyses [70]. The M2+ cation distribution on the M(1) and M(2) sites in
erythrite and annabergite have been investigated by Moessbauer spectroscopy and site
occupancy refinements [70]. Magnesium substituted annabergite showed a strong
preference for Mg2+ to occupy the Ni(2) sites over the Ni(1) sites [70]. Moessbauer
spectroscopy of erythrite reveals an analogous preference of Fe2+ on the Co(2) site
[70]. Further evidence for the ordering of Mg and Ni site has also been demonstrated
in cabrerite, a currently disregarded mineral name[45]. Cabrerite has a monoclinic

47
space group C2/m, with a = 10.211, b = 13.335, c = 4.728 Å, and ß = 104.97° and Z =
2. Significant ordering of the Ni-Mg in the octahedral sites occurs. Single octahedra,
M(1), and double octahedral groups, M(2)::: M(2), are connected by AsO4 tetrahedra
to form complex sheets parallel to (010) [45]. Magnesian nickeloan erythrite has been
found with composition (Co0.54Mg0.29Ni0.15Zn0.02)(AsO4)2.8H2O giving an indication
of the complexity of solid solutions available to the vivianite minerals [62].
Furthermore, vivianite samples from the Big Chief pegmatite mine, Glendale,
Pennington Co., South Dakota, USA were found to contain oxide contents of FeO
38.9 %, MnO 4.2 %, NiO 0.13 %, CaO 0.5 %, P2O5 28.4 %, H2 O (28.7), with minor
As2O5, Na2O, ZnO and CuO [71]. This indicates that even metal ions that do not form
vivianite structures may substitute in the lattice of vivianite minerals. Due to this fact,
the vivianite group of minerals is an excellent choice for the study of solid solutions.

48
2.13. References
1. Klein, C., Mineral Science. 22 ed. 2002, New York: Wiley. 2. Korbel, P. and M. Novak, The Complete Encyclopaedia Of Minerals. 2001,
U.K.: Grange Books. 3. Bishop, A.C., A.R. Woolley, and W.R. Hamilton, Philip's Minerals, Rocks
and Fossils. 3rd ed. 1999, London: Octopus Publishing Proup. 4. Hunt, G., Salisbry. Mod. Geol., 1971(2): p. 23. 5. Frost, R.L., J. Kloprogge, and J. Schmidt, Non-destructive identification of
minerals by Raman microscopy. The Internet Journal of Vibrational Spectroscopy. 3(4).
6. Farmer, V.C., ed. The Infrared spectra of minerals. 1974, Mineralogical Society: London.
7. Brooke, C., H. Edwards, and J. Tait, Journal of Raman Spectroscopy, 1999(30): p. 429.
8. Burgio, L., Ciomartan, and R. Clark, Journal of Raman Spectroscopy, 1997(29): p. 79.
9. Martens, W. and R.L. Frost, An infrared spectroscopic study of the basic copper phosphate minerals: Cornetite, libethenite, and pseudomalachite. American Mineralogist, 2003. 88(1): p. 37-46.
10. Martens, W.N., et al., The Basic copper arsenate minerals olivenite, cornubite, cornwallite, and clinoclase: An infrared wmission and Raman spectroscopic study. American Mineralogist, 2003. 88.
11. Frost, R.L., et al., Vibrational spectroscopy of the basic copper phosphate minerals: pseudomalachite, ludjibaite and reichenbachite. Spectrochimica acta. Part a, molecular and biomolecular spectroscopy, 2002. 58(13): p. 2861-8. FIELD Reference Number: FIELD Journal Code:9602533 FIELD Call Number:.
12. Frost, R.L., et al., Vibrational spectroscopy of the basic copper phosphate minerals: pseudomalachite, ludjibaite and reichenbachite. Spectrochimica Acta, Part A: Molecular and Biomolecular Spectroscopy, 2002. 58(13): p. 2861-2868.
13. Frost, R., L., et al., Vibrational spectroscopy of the basic copper phosphate minerials: pseudomalachite, ludjibaite, and reichenbachite. Spectrochimica Acta. Part A, 2002. 58: p. 2861.
14. Frost, R.L., et al., Raman spectroscopy of the polyanionic copper(II) minerals buttgenbachite and connellite: implications for studies of ancient copper objects and bronzes. Journal of Raman Spectroscopy, 2002. 33(9): p. 752-757.
15. Frost, R.L., et al., Raman spectroscopy of the basic copper phosphate minerals cornetite, libethenite, pseudomalachite, reichenbachite and ludjibaite. Journal of Raman Spectroscopy, 2002. 33(4): p. 260-263.
16. Frost, R.L., W.N. Martens, and P.A. Williams, Raman spectroscopy of the phase-related basic copper arsenate minerals olivenite, cornwallite, cornubite and clinoclase. Journal of Raman Spectroscopy, 2002. 33(5): p. 475-484.
17. Frost, R.L., et al., Raman spectroscopic study of azurite and malachite at 298 and 77 K. Journal of Raman Spectroscopy, 2002. 33(4): p. 252-259.
18. Frost, R.L., et al., Raman spectroscopy of the basic copper chloride minerals atacamite and paratacamite: implications for the study of copper, brass and

49
bronze objects of archaeological significance. Journal of Raman Spectroscopy, 2002. 33(10): p. 801-806.
19. Frost, R.L., et al., Analyst, 2002: p. 127. 20. Turell, G. and J. Couset, Raman Microscopy: Development and Applications.
1996: Academic Press. 21. Davidson, G., Introductory Group theory for chemists. 1971, London: Elsevier
Publishing Co. 22. Coleyshaw, E.E., W.P. Griffith, and R.J. Bowell, Fourier-transform Raman
spectroscopy of minerals. Spectrochim. Acta, Part A, 1994. 50A(11): p. 1909-18.
23. Brown, A. and E.R. Clark, Infrared analysis of geological materials. J. Geol. Educ., 1980. 28(2): p. 92-5.
24. Ferraro, J.R., Factor group analysis for some common minerals. Appl. Spectrosc., 1975. 29(5): p. 418-21.
25. Nakamoto, K., Infrared and Raman spectra of inorganic and coordination compounds: Part A: theory and applications in inorganic chemistry. 5 ed. 1997, New York: Wiley-Interscience.
26. Plavsic, B., S. Kobe, and B. Orel, FTIR spectroscopy as a method for determination of the crystallization forms of calcium carbonate. Zb. Ref. Posvetovanja Slov. Kem. Dnevi, 1997: p. 487-492.
27. Plavsic, B., S. Kobe, and B. Orel, FTIR spectroscopy as a method for the study of the different crystallization forms of CaCO3. Key Eng. Mater., 1997. 132-136(Pt. 1, Euro Ceramics V): p. 268-270.
28. Salthouse, J.A. and M.J. Ware, Point group character tables and related data. 1972, London: Cambridge University Press.
29. Farmer, V.C., The Infrared Spectra of Minerals, ed. V.C. Farmer. Vol. 4. 1974, London.
30. Sterzel, W. and E. Chorinsky, Effect of heavy carbon isotopes on the infrared spectrum of carbonates. Spectrochim. Acta, Part A, 1968. 24(4): p. 353-60.
31. Cloots, R., Raman spectrum of carbonates MIICO3 in the 1100-1000 cm-1 region: observation of the .nu.1 mode of the isotopic carbonate (C16O218O)2- ion. Spectrochim. Acta, Part A, 1991. 47A(12): p. 1745-50.
32. Elderfield, H. and R. Chester, Effect of periodicity on the infrared absorption v2 frequency of anhydrous normal carbonate minerals. Amer. Mineral., 1971. 56(9-10): p. 1600-6.
33. Emsley, J., Very strong hydrogen bonding. Chemical Society Reviews, 1980. 9: p. 91-124.
34. Lutz, H., Hydroxide ions in condensed materials - correlation of spectroscopic and structural data. Structure and Bonding (Berlin, Germany), 1995. 82: p. 85-103.
35. Mikenda, W., Stretching frequency versus bond distance correlation of O-D(H)...Y (Y = N, O, S, Se, Cl, Br, I) hydrogen bonds in solid hydrates. Journal of Molecular Structure, 1986. 147: p. 1-15.
36. Novak, A., Hydrogen bonding in solids. Correlation of spectroscopic and crystallographic data. Structure and Bonding (Berlin), 1974. 18: p. 177-216.
37. Libowitsky, E., Correlation of the O-H stretching frequencies and the O-H...H hydrogen bond lengths in minerals. Monatschefte fÜr chemie, 1999. 130: p. 1047-1049.
38. Anthony, J.W., et al., Arsenates, Phosphates, Vanadates. 1 ed. Handbook of Mineralogy. Vol. 4. 2000, Tucson, Arizona: Mineral Data Publishing.

50
39. Bloss, F.D., Optical Crystallography. 1999, Washington, DC: The Mineralogical Society of America.
40. Wildner, M. and G. Giester, Structure and crystal chemistry of vivianite-type compounds: crystal structures of erythrite and annabergite with a mossbauer study of erythrite. European Journal of Mineralogy, 1996(8): p. 187-192.
41. Mandarino, J.A., Fleischer's Glossary of Mineral Species. 8 ed. 1999, Tuscon: The Mineralogical Record Inc.
42. Al-Borno, A. and M.B. Tomson, The temperature dependence of the solubility product constant of vivianite. Geochim. Cosmochim. Acta, 1994. 58(24): p. 5373-8.
43. Amthauer, G. and G.R. Rossman, Mixed valence of iron in minerals with cation clusters. Phys. Chem. Miner., 1984. 11(1): p. 37-51.
44. Ermolaev, M.I., et al., Preparation of water-soluble cobalt and nickel compounds from erythrin-annabergite minerals. Zh. Prikl. Khim. (Leningrad), 1977. 50(9): p. 1920-2.
45. Giuseppetti, G. and C. Tadini, The crystal structure of cabrerite, (Ni,Mg)3(AsO4)2.8H2O, a variety of annabergite. Bull. Mineral., 1982. 105(4): p. 333-7.
46. Jambor, J.L. and J.E. Dutrizac, Solid solutions in the annabergite-erythrite-hoernesite synthetic system. Can. Mineral., 1995. 33(5): p. 1063-71.
47. Kurnakov, N.S. and I.A. Andreevskii, Solid solutions of water and oxygen in the phosphates of the vivianite group. Ann. inst. anal. phys. chim., 1924. 2: p. 485-7.
48. Manceau, A., A.I. Gorshkov, and V.A. Drits, Structural chemistry of manganese, iron, cobalt, and nickel in manganese hydrous oxides: Part I. Information from XANES spectroscopy. Am. Mineral., 1992. 77(11-12): p. 1133-43.
49. Merlina, F.E. and T.V. Krylova, Mineral forms of cobalt and nickel in arsenic-cobalt ore and phase analysis methods. Obogashch. Rud, 1972. 17(6): p. 36-8.
50. Pizarro, J.L., et al., Synthetic pathways to obtain phosphates and arsenates of Co(II) and Ni(II) related to minerals: magnetic properties. Solid State Ionics, 1993. 63-65(1-4): p. 71-7.
51. Schmetzer, K., W. Horn, and W. Bartelke, Cobalt- and nickel-containing koritnigite from Jachymov (Joachimsthal), CSSR - a second occurrence. Neues Jahrb. Mineral., Monatsh., 1980(6): p. 237-40.
52. Schmetzer, K., W. Horn, and O. Medenbach, Cobaltkoritnigite, (Co,Zn)[H2O|AsO3OH], a new mineral and pitticite, Fe2O3.cntdot.As2O5.cntdot.9-10H2O, an amorphous iron-arsenate-hydrate. Neues Jahrb. Mineral., Monatsh., 1981(6): p. 257-66.
53. Wolfe, C.W., Classification of minerals of the type A3(XO4)2.nH2O. Am. Mineral., 1940. 25: p. 738-54,787-809.
54. Yakhontova, L.K., et al., X-ray diffraction study of erythrite and its varieties. Konst. Svoistva Miner., 1974. 8: p. 36-40.
55. Yakhontova, L.K., A.P. Grudev, and A.A. Petrova, Composition and nomenclature of minerals of erythrite-annabergite series. Zap. Vses. Mineral. O-va., 1979. 108(3): p. 287-93.
56. Hartwig, J., Production and use of Safre or Zaffera (cobalt) and Smalte by glassmakers from 16th to 18th century. Verre (Versailles, France), 2001. 7(4): p. 40-48.

51
57. Tourangeau, P., Preparation of colored mineral powders by thermal treatment and materials colored therewith, in U.S. 2000, (Can.). Us. p. 2020 pp.
58. Markl, G., The color of minerals and their advantage. Aufschluss, 1999. 50(6): p. 337-341.
59. Tourangeau, P., Pigments obtained by treatment of minerals, in Fr. Demande. 1999, (Fr.). Fr. p. 159 pp.
60. Colored powders useful as pigments, their preparation and use, in Fr. Demande. 1998, (Tourangeau, Paulette, Fr.). Fr. p. 165 pp.
61. Tourangeau, P., Pigments manufactured from minerals, in Can. Pat. Appl. 1998, (Can.). Ca. p. 2074 pp.
62. Beyer, H., Minerals from the dumps of the stibnite veins of Ahrbrueck (Eifel), especially a find of cabrerite. Aufschluss, 1978. 29(11): p. 401-8.
63. Mann, H., et al., Retardation of toxic heavy metal dispersion from nickel-copper mine tailings, Sudbury District, Ontario: role of acidophilic microorganisms. II. Structure and microanalysis of bioprecipitants. Biorecovery, 1989. 1(3): p. 173-87.
64. Wappler, G. and G. Tischendorf, Identification of some secondary minerals from the dumps of the Friedrichsglueck Mine, near Neustadt/Rennsteig [East Germany]. Z. Geol. Wiss., 1980. 8(11): p. 1397-402.
65. Frost, R.L., et al., Thermal decomposition of the vivianite arsenates-implications for soil remediation. Thermochimica Acta, 2003. 403(2): p. 237-249.
66. Martens, W., R.L. Frost, and J.T. Kloprogge, Raman spectroscopy of synthetic erythrite, partially dehydrated erythrite and hydrothermally synthesized dehydrated erythrite. Journal of Raman Spectroscopy, 2003. 34(1): p. 90-95.
67. Frost, R., L., et al., Dehydration of synthetic and natural vivianite. Thermochimica Acta, 2002. In. Press.
68. Gevork'yan, S.V. and A.S. Povarennykh, Characteristics of the IR spectra of water molecules incorporated into phosphate and arsenate structures. Mineral. Zh., 1980. 2(1): p. 29-36.
69. Frost, R.L., et al., Raman and infrared spectroscopic study of the vivianite-group phosphates vivianite, baricite and bobierrite. Mineralogical Magazine, 2002. 66(6): p. 1063-1073.
70. Wildner, M., et al., Structure and crystal chemistry of vivianite-type compounds: crystal structures of erythrite and annabergite with a Moessbauer study of erythrite. Eur. J. Mineral., 1996. 8(1): p. 187-92.
71. Ritz, C., E.J. Essene, and D.R. Peacor, Metavivianite, Fe3(PO4)2.8H2O, a new mineral. Am. Mineral., 1974. 59(9-10): p. 896-9.

52
Chapter 3 – SINGLE CRYSTAL RAMAN SPECTROSCOPY OF CERUSSITE
Wayde N. Martens, Llew Rintoul, J. Theo Kloprogge, and Ray L. Frost
Wayde N. Martens Inorganic Materials Research Program, Queensland
University of Technology, Brisbane, Queensland 4001,
Australia.
Llew Rintoul Inorganic Materials Research Program, Queensland
University of Technology, Brisbane, Queensland 4001,
Australia.
J. Theo Kloprogge Inorganic Materials Research Program, Queensland
University of Technology, Queensland 4001, Australia.
Ray L. Frost Inorganic Materials Research Program, Queensland
University of Technology, Brisbane, Queensland 4001,
Australia.
American Mineralogist (2004), 89, 352-358

53
3.1. Statement of contribution
Wayde N. Martens : Wrote the manuscript, experimental design, conducted
experiments, and data analysis.
Llew Rintoul : Aided experimental design, major editing, aided data analysis,
aided writing of manuscript.
J. Theo Kloprogge: Major editing, aided data analysis
Ray L. Frost : Editing, data analysis, supervision

54
3.2. Abstract
Raman and infrared active modes of cerussite have been assigned according to
their symmetry species, and compared to other aragonite group minerals. Small
satellite bands at 823 and 1031 cm-1 to the low wavenumber side of the fundamental
vibrations ?2 and ?1, respectively, have been assigned to the isotopic substitutions of
13C and 18O. The Raman active ?1 and ?2 carbonate modes are observed at 1051 and
835 cm-1. The absence of the B2g component of the ?1 and ?2 vibrations has been
explained by the small coupling between the Ag and B2g modes. The Raman active ?3
carbonate anti-symmetric stretching mode is observed at 1361(Ag), 1376 (B1g), 1419
(B3g) and 1477 (B2g) cm-1, while the corresponding infrared active bands are observed
at 1396, 1432, and 1456 cm-1. The Raman active ?4 carbonate bending mode is
observed at 673 (Ag), 668 (B2g), 681 (B1g), and 694 (B2g) cm-1. The corresponding
infrared bands are observed at 670, 679, and 698 cm-1. In both ?3 and ?4, the factor
group splitting between the B1g and B3g modes is 1 to 3 times smaller than the
separation of the Ag and B2g modes. Raman active lattice vibrations are detected at
120 (B3g), 132 (Ag), 148 (B1g), 152(B2g), 174 (B2g), 179 (B1g), 213 (Ag), 226 (B3g),
and 243 cm-1 (B2g). Corresponding infrared active bands are detected at 573, 543,
573, 423, 375, 290, 205, 165, 146, and 134 cm-1. Raman bands at 949, 966, 989, 1000
and 1104 cm-1 and at 922, 946, 967, 988, 996, and 1007 cm-1 in the infrared spectra
are assigned to combination and overtone bands. Raman bands at 1676 (Ag), 1689
(Ag), 1730 (B3g), and 1740 (B1g) cm-1 are ascribed to combination modes of ?1 + ?4
with bands at 2052 and 2092 cm-1 assigned to 2?1. Corresponding infrared bands are
observed at 1729 and 1740 cm-1 (?1 + ?3). Bands at 2359, 2409, 2471, and 2521 cm-1
are ascribed to ?1 + ?3, with broad bands at 1246 and 1323 cm-1 assigned to 2?4
modes.

55

56

57

58

59

60

61

62
Chapter 4 - Single Crystal Raman Study of Erythrite Co3(AsO4)2.8H2O
Wayde N. Martens, J. Theo Kloprogge, Ray L. Frost and Llew Rintoul
Wayde N. Martens Inorganic Materials Research Program, Queensland
University of Technology, Brisbane, Queensland 4001,
Australia.
J. Theo Kloprogge Inorganic Materials Research Program, Queensland
University of Technology, Queensland 4001, Australia.
Ray L. Frost Inorganic Materials Research Program, Queensland
University of Technology, Brisbane, Queensland 4001,
Australia.
Llew Rintoul Inorganic Materials Research Program, Queensland
University of Technology, Brisbane, Queensland 4001,
Australia.
Anonymous referee’s comments: “The paper is easy to read, clear, and scientifically
convincing. It reports a careful crystallographic and spectroscopic study of single
crystals of mineralogical interest, with potential applications in identification of
pigments……”
Journal of Raman Spectroscopy (2004), 35, 208-216

63
4.1 Statement of contribution
Wayde N. Martens : Wrote the manuscript, experimental design, conducted
experiments, and data analysis.
J. Theo Kloprogge: Major editing, aided data analysis
Ray L. Frost : Editing, data analysis
Llew Rintoul : Aided experimental design, editing, aided data analysis, aided
writing of manuscript.

64
4.2 Abstract
Single crystal Raman and infrared spectra of natural and synthetic erythrite
Co3(AsO4)2.8H2O are reported, and compared to the spectra polycrystalline, synthetic
annabergite (Ni3(AsO4)2.8H2O) and hörnesite (Mg3(AsO4)2.8H2O). Factor group
analysis and single crystal considerations have been used to interpret the experimental
data. The Raman spectra of erythrite reveal ?1 arsenate stretching vibration at 850
cm-1 (Ag) with the corresponding infrared band at 821 cm-1 (Bu). The ?3
antisymmetric vibration is split into three components, observed at 796 (Ag), 788 (Ag)
and 803 (Bg) cm-1. The ?2 symmetric bending modes are observed at 375 (Ag) and 385
(Bg) cm-1. The ?4 bending modes are predicted to split into three bands which are
observed at 441 (Ag), 446 (Bg) and 457 (Ag) cm-1. Lattice vibrations are found at 112
(Ag), 124 (Bg), 145(Ag), 157 (Bg), 165 (Ag), 179 (Ag), 189 (Ag), 191(Bg), 201 (Bg),
210 (Ag), 227 (Ag), 250 (Ag), 264(Ag), 264 (Ag), 280 (Bg), 302 (Bg), 321 (Bg), and 338
cm-1 (Ag). Hydroxyl stretching modes are observed at 3050, 3218, 3333, 3449 and
3479 cm-1, in the infrared spectrum. Raman active hydroxyl bands are detected at
3009 (Bg), 3052 (Ag), 3190 (Bg) 3203 (Bg), 3281 (Ag) and 3310 (Bg), 3436 (Bg) and
3443 (Ag) cm-1. Infrared hydroxyl bands at 3050, and 3218 cm-1 are from water type
II, short hydrogen bonding distances, and the bands at 3449 and 3479 cm-1 are due to
water I, long hydrogen bonding distances. Water bending modes are detected in the
infrared spectrum at 1571, 1621, 1641, and 1682 cm-1, but due to the inherent weak
Raman scattering cross section of water these could not be detected in the Raman
spectra.

65

66

67

68

69

70

71

72

73

74
Chapter 5 – Synthetic deuterated erythrite – a vibrational spectroscopic study
Ray L. Frost, Wayde N. Martens, and J. Theo Kloprogge
Ray L. Frost Inorganic Materials Research Program, Queensland
University of Technology, Brisbane, Queensland 4001,
Australia.
Wayde N. Martens Inorganic Materials Research Program, Queensland
University of Technology, Brisbane, Queensland 4001,
Australia.
J. Theo Kloprogge Inorganic Materials Research Program, Queensland
University of Technology, Queensland 4001, Australia.
Spectrochimica Acta Part A (2003), 343

75
5.1 Statement of contribution
Ray L. Frost: Wrote the manuscript, data analysis.
Wayde N. Martens : Aided in writing manuscript, experimental design, conducted
experiments, Editing, data analysis
J. Theo Kloprogge: Editing, aided data analysis

76
5.2 Abstract
A comparison of deuterated and non-deuterated erythrite has been made using
a combination of infrared and Raman spectroscopy. Infrared shows bands at 3442,
3358, 3194 and 3039 cm-1. The band at 3442 cm-1 is attributed to weakly hydrogen
bonded water and the band at 3039 cm-1 to strongly hydrogen bonded water.
Deuteration results in the observation of OD bands at 2563, 2407 and 2279 cm-1. The
ratio of these bands changes with deuteration. Deuteration shows that the strongly
hydrogen bonded water is replaced in preference to the weakly hydrogen bonded
water. Three HOH bending modes are observed at 1686, 1633, 1572 and DOD
bending modes at 1236, 1203 and 1176 cm-1. Deuteration causes the loss of intensity
of the bands at 841, 710 and 561 cm-1 and new bands are observed at 692, 648 and
617 cm-1. These three bands are attributed to the water librational modes. Deuteration
results in additional Raman band at 809 cm-1 with increasing intensity with extent of
deuteration. Deuteration results in the shift of Raman bands to lower wavenumbers.

77

78

79

80

81

82

83

84
Chapter 6 – Site occupancy of Co and Ni in erythrite - annabergite solid solutions by vibrational spectroscopy
Wayde N. Martens, J. Theo Kloprogge, Ray L. Frost and Llew Rintoul
Wayde N. Martens Inorganic Materials Research Program, Queensland
University of Technology, Brisbane, Queensland 4001,
Australia.
J. Theo Kloprogge Inorganic Materials Research Program, Queensland
University of Technology, Queensland 4001, Australia.
Ray L. Frost Inorganic Materials Research Program, Queensland
University of Technology, Brisbane, Queensland 4001,
Australia.
Llew Rintoul Inorganic Materials Research Program, Queensland
University of Technology, Brisbane, Queensland 4001,
Australia.
American Mineralogist, Submitted 02-04-04

85
6.1 Statement of contribution
Wayde N. Martens : Wrote the manuscript, experimental design, conducted
experiments, and data analysis.
J. Theo Kloprogge: Major editing, aided data analysis
Ray L. Frost : Editing, data analysis
Llew Rintoul : Aided experimental design, editing, aided data analysis, aided
writing of manuscript.

86
6.2 Abstract
The solid solutions series between erythrite (Co3(AsO4)2.8H2O) and
annabergite (Ni3(AsO4)2.8H2O) has been synthesised and studied by a combination of
X-ray diffraction, scanning electron microscopy, Raman and infrared spectroscopy.
The solid solution between erythrite and annabergite has been found to be complete,
with the monoclinic C2/m space group being retained throughout the solid solution
series. The unit cell parameters decrease in size along all crystallographic directions
as nickel is introduced into the unit cell. The ß angle in the unit cell also decreases
from 105.052° (Co3(AsO4)2.8H2O) to 104.886° (Ni3(AsO4)2.8H2O), as the unit cell
volume decreases. Crystals of annabergite and samples with high Ni content are
elongated along the a crystallographic direction, contrasting with crystals of erythrite
and high Co containing samples, which are elongated along the c crystallographic
direction. In the Raman and infrared spectra of the synthetic minerals, the band
positions were found to shift in accordance with the increase in bonding strength
associated with the decrease in the unit cell parameters. It has been shown that trends
in Raman band positions of the anti-symmetric arsenate stretching vibration are
sensitive to the site occupancy in the crystal structure. Changes in the crystal
morphology, unit cell parameters and vibrational spectra have been rationalised in
terms of the site occupancy of Co and Ni in the crystal structure. Substitution of
nickel has been shown to be directed to metal site 1 whereas cobalt is directed to
metal site 2.

87

88

89

90

91

92

93

94

95
7. GENERAL DISCUSSION
This thesis has increased the scientific knowledge of the crystallographic and
spectroscopic properties of the aragonite group and the vivianite group minerals. In
particular fundamental knowledge of the spectroscopy of the end members, erythrite
and annabergite, and their solid solutions has been obtained. A new method of
studying the site occupancy of ions in solid solutions has been developed which
utilises vibrational spectroscopy. A detailed knowledge and understanding of factor
group analysis applied to the study of minerals has been achieved. This has been
applied to a significant number of minerals as shown by the number of refereed
articles published by the author, and cited in the beginning of the thesis.
The inspection of the Raman spectra of aragonites reveals the presence of
isotopic bands. The assignment of the satellite band to 18O-12C allows the use of this
band to quantify the oxygen isotopic ratio. This can have important implications for
various areas in geology. Oxygen isotope fractionation between carbonates and
(sea)water for example is well known to depend on temperature. In principle this
allows one for example to determine the paleotemperatures of ancient oceans with a
resolution better than 0.5 °C based on fractionation between calcite and seawater. A
similar technique also exists for cerussite, and a variety of other minerals. The normal
analysis method for stable isotopes involves very careful preparation of your samples
under clean room conditions followed by measurement with ICP-MS (Inductively
Coupled Plasma-Mass Spectrometry). It may be suggested that, when properly
standardised, Raman spectroscopy can be a rapid and much cheaper alternative to get
an idea of the isotope fractionation in carbonates.

96
Consideration of the water stretching and bending vibrations and the factor
group splitting of the arsenate stretching vibrations has allowed the determination of
the site occupancy of metal cations in the structure of the minerals. This finding has
profound implications for the field of mineral science, particularly where there is an
inability to collect high quality X-ray diffraction data (i.e. synchrotron) for Rietveld
analysis. Rietveld analysis also requires high operator skills, and is difficult for even
the skilled users. The technique used in this thesis does require basic knowledge of
the crystal unit cell, which is only available from crystallographic data obtained by
XRD. The infrared and Raman based technique may aid in the structural
determination of many other minerals and solid solutions. Questions still remain
however about the wider validity of the technique to other mineral solid solution
series. Future work needs to be directed to other solid solution series with known site
occupancy preferences to fully confirm the technique. The investigation of the
erythrite - annabergite solid solution series continues. Rietveld analysis of high
quality X-ray diffraction data is expected to be available in due course. Potentially the
type of techniques developed in this thesis may be applied to quite a few solid
solution series. Of most interest are solid solution series which have temperature
dependencies such as Fe in sphalerite (ZnS), ilmenite, garnets pyroxenes and
plagioclase minerals. Such solid solutions are well known geothermometers and as
mineral solid solutions directly effect infrared and Raman spectroscopic data such
vibrational techniques may yield a new field in geothermometers. This would be of
particular use where the mineral samples may not be able to be subjected to chemical
analysis such as SEM microprobe analysis.

97
Much work has been done on the analysis of mineral vibrational spectra, but
prediction of mineral spectra, or the prediction of mineral crystal structures from
spectra is still not routinely possible. Quantum mechanical computer models are able
to predict mineral spectra from crystal structures, but these are cumbersome, usually
requiring many days of supercomputer time. This study and others have shown that
the vibrational spectroscopy of minerals are fundamentally controlled by unit cell
chemistry, symmetry and bonding distances. Much more work is required on the
vibrational spectroscopy of minerals, to allow Monte Carlo type calculations of the
mineral crystal structures. Statistical techniques such as chemometrics, principal
component analysis (PCA) and SIMCA may also be useful for discrimination of
mineral crystal structures. Few such studies have been conducted on minerals, with
most concerned with quantification of mineral mixtures. PCA and SIMCA techniques
applied to infrared and Raman spectra, may be able to discriminate between different
crystal structures as similar factor group splitting patterns occur for groups of
minerals as seen in this study.
Even though this study has been able to achieve the objectives proposed, it has
raised more questions than answers. More work is still required in the field of mineral
spectroscopy as the spectra of most minerals, especially Raman spectra, are still yet to
be reported. Mineral spectral databases are still in the early stages of development, as
such, even simple tasks such as mineral identification are at this stage not possible.
Fundamental work on the spectroscopy of minerals such as the work contained with
in this thesis needs to be conducted to understand mineral spectra and their
assignment to enable databases such as those already existing for X-ray diffraction
(powder diffraction file, PDF) to be developed.

98
8. Appendix The following papers are supporting studies which were conducted is parallel
with this thesis.

99
Frost, R.L., Martens, W., Williams, P.A. and Kloprogge, J.T., J. Raman Spectrosc.
2003, 34, 751-759.
Frost, R.L., Weier, M.L., Martens, W., Kloprogge, J.T. and Ding Z., Thermochimica
acta, 2003, 403, 237-249.
Frost, R.L., Weier, M.L., Martens, W., Kloprogge, J.T. and Ding Z., Thermochimica
acta, 2003, 401, 121-130.
Frost, R.L., Kloprogge, J.T., and Martens, W., J. Raman Spectrosc. 2004, 35, 28-35.
Martens, Frost, R.L. and W., Williams, P.A., J.T., J. Raman Spectrosc. 2003, 34, 104-
111.

100

101

102

103

104

105

106

107

108

109

110

111

112

113

114

115

116

117

118

119

120

121

122

123

124

125

126

127

128

129

130

131

132

133

134

135

136

137

138

139

140

141

142

143

144

145

146

147