the value of water: scoping a research of analysis
TRANSCRIPT

U.S. Department of the Interior Bureau of Reclamation Phoenix Area Office Final Report - May 2014
The Value of Water: Scoping a Research of Analysis
(S&T ID-7013)
The Value of Water: Scoping a Research of Analysis
iii
Mission Statements The mission of the Department of the Interior is to protect and provide access to our Nation’s natural and cultural heritage and honor our trust responsibilities to Indian Tribes and our commitments to island communities. The mission of the Bureau of Reclamation is to manage, develop, and protect water and related resources in an environmentally and economically sound manner in the interest of the American public.

4600 EAST WASHINGTON ST., SUITE 500 • PHOENIX, ARIZONA 85034 • P. 602.263.9500 • F. 602.265.1422pw://Carollo/Documents/Client/CO/WRF/9005A00/Deliverables/LCI-LCIA Report
WATER RESEARCH FOUNDATION STUDY 4443 UNITED STATES BUREAU OF RECLAMATION
PHASE 1- PROOF OF CONCEPT:
USING LIFE CYCLE INVENTORY AND LIFE CYCLE IMPACT ASSESSMENT DATABASE
FOR QUANTIFYING EMBEDDED WATER/ENERGY IN A WATER TREATMENT SYSTEM
FINAL
November 2012

November 2012 i pw://Carollo/Documents/Client/CO/WRF/9005A00/Deliverables/LCI-LCIA Report (Final)
WATER RESOURCE FOUNDATION STUDY 4443 UNITED STATES BUREAU OF RECLAMATION
PHASE 1- PROOF OF CONCEPT: USING LIFE CYCLE INVENTORY AND
LIFE CYCLE IMPACT ASSESSMENT DATABASE FOR QUANTIFYING EMBEDDED WATER/ENERGY IN A WATER TREATMENT SYSTEM
TABLE OF CONTENTS
Page
EXECUTIVE SUMMARY ......................................................................................................... 1 1.0 PROJECT BACKGROUND AND OBJECTIVE ............................................................. 1 2.0 TASK 1 - BOUNDARY, GOAL, AND SCOPE OF WATER TREATMENT
ASSEMBLY ................................................................................................................... 2 3.0 TASK 2 - LITERATURE REVIEW, METHODOLOGY DESCRIPTION, AND
RELATED RESEARCH ................................................................................................. 4 3.1 LCA Methodology ................................................................................................ 4 3.2 LCA Tools ........................................................................................................... 6
3.2.1 SimaPro LCA Software ........................................................................ 6 3.2.2 GaBi LCA Software .............................................................................. 6 3.2.3 LCI Database ....................................................................................... 7 3.2.4 LCIA Methodology ................................................................................ 8
3.3 LCA Database Data Gap for Water/Wastewater Industry LCA Applications ..... 8 3.4 Related Research ............................................................................................... 9 3.5 Summary ........................................................................................................... 11
4.0 TASK 3 - LIFE CYCLE INVENTORY TEMPLATE ...................................................... 11 4.1 Life Cycle Inventory Database .......................................................................... 11 4.2 Life Cycle Inventory Template .......................................................................... 12 4.3 Dynamic Life Cycle Inventory ............................................................................ 14
5.0 LIFE CYCLE IMPACT ASSESSMENT ....................................................................... 17 6.0 RESULTS AND DISCUSSION .................................................................................... 20
6.1 Carbon Emissions Results ................................................................................ 26 6.2 Energy Consumption Analysis .......................................................................... 29 6.3 Embedded Water Results ................................................................................. 30 6.4 Summary Results .............................................................................................. 33 6.5 Limitations and Data Gaps ............................................................................... 33
7.0 TASK 6 - FULL SCALE PLAN OF RESEARCH OUTLINE ........................................ 34 8.0 REFERENCES ............................................................................................................ 36 9.0 ABBREVIATIONS........................................................................................................ 38
LIST OF APPENDICES APPENDIX A LIFE CYCLE INVENTORY AND LIFE CYCLE IMPACT ASSESSMENT
DATABASE DEMONSTRATION APPENDIX B FUTURE RESEARCH PLAN

November 2012 ii pw://Carollo/Documents/Client/CO/WRF/9005A00/Deliverables/LCI-LCIA Report (Final)
LIST OF TABLES Table ES1 Summary Results ......................................................................................... ES-3 Table 1 Conceptual Water Treatment Facility Boundary ................................................ 2 Table 2 Database and LCIA Methods Used in SimaPro and GaBi ................................ 7 Table 3 Life Cycle Inventory Template .......................................................................... 12 Table 4 LCA Environmental Impacts Associated with Unit Quantity of Material .......... 18 Table 5 Conceptual Case Study Inputs ......................................................................... 20 Table 6 Life Cycle Inventory Data ................................................................................. 24 Table 7 Breakdown Results for Global Warming .......................................................... 27 Table 8 Operational Phase Energy Consumption versus Embedded Energy
(Breakdown by Process) .................................................................................. 29 Table 9 Breakdown Results for Embedded Water........................................................ 31 Table 10 Summary Results ............................................................................................. 33
LIST OF FIGURES Figure 1 Phase 1 Study Boundary .................................................................................... 2 Figure 2 LCA Inventory Analysis Framework (Vigon et al 1993) ..................................... 5 Figure 3 Step 1 - Select the Treatment Modules ........................................................... 15 Figure 4 Step 2 - Breakdown Results ............................................................................. 16 Figure 5 Step 3 - Review and Customize Design Calculations ...................................... 16 Figure 6 Global Warming Potential (in g CO2 equivalent) Breakdown by Process ....... 26 Figure 7 Operational Phase Energy Consumption versus Embedded Energy
(Breakdown by Process) .................................................................................. 30 Figure 8 Embedded Water (in Liters) Breakdown by Process ....................................... 30

November 2012 ES-1 pw://Carollo/Documents/Client/CO/WRF/9005A00/Deliverables/LCI-LCIA Report (Final)
Water Research Foundation and United States Bureau of Reclamation
PHASE 1 - PROOF OF CONCEPT: USING LIFE CYCLE INVENTORY AND LIFE CYCLE IMPACT ASSESSMENT DATABASE FOR
QUANTIFYING EMBEDDED WATER/ENERGY IN A WATER TREATMENT SYSTEM
EXECUTIVE SUMMARY This research aimed at demonstrating how collecting water infrastructure related life cycle inventory (LCI) data is crucial for life cycle assessment (LCA) and quantification of the environmental impacts (especially embedded water/energy) of a water treatment system.
The fundamental technical approach of the research is based on LCA principles and methodology. LCA is an ISO 14040 normalized method for the environmental assessment of industrial systems from “cradle-to-grave,” which begins with raw materials extracted from the earth, and continues with product development, manufacturing, and disposal (Vince et al. 2008). An LCA study consists of four steps, goal and scope, LCI, life cycle impact assessment (LCIA) and data interpretation. The second step, LCI, is to develop an inventory that contains the quantity of all major inputs and outputs during the entire life cycle of each water treatment process/system within the established boundary. For a water treatment system, this typically includes the raw water being pumped, the product water being delivered, the construction material, consumables, energy and chemical used for each process component during construction and operation, and the quantity of the waste disposal.
Lack of detailed LCI data directly relevant to the widely used water treatment process components and equipment limits the number of embedded water and energy accounting studies and the depth of such studies. Most of the published literatures on LCA for water and wastewater industry remained at a strategic level, aiming at providing guidance and framework for greenhouse gas (GHG) and water footprint assessment. Material and consumable data for water treatment processes is rarely documented in detail. Collecting detailed LCI data for water treatment system is a long-term objective for a subsequent phase of research. To demonstrate how the LCI data can be utilized for assessing embedded water and energy, this initial research phase presented a conceptual study that covers all four steps of an LCA. The study boundary was a theoretical water treatment facility including raw water pumping, coagulation, flocculation, sedimentation, filtration, chlorine disinfection as well as chemicals such as coagulants, acid and liquid chlorine.

November 2012 ES-2 pw://Carollo/Documents/Client/CO/WRF/9005A00/Deliverables/LCI-LCIA Report (Final)
An LCI data input template was developed in MS Excel format. This template was used to gather LCI data for the treatment process components within the conceptual case study boundary. Conventionally, the step for filling in this type of LCI template is a time-consuming challenge for water treatment related LCA studies. Users need to collect mechanical equipment and construction materials (e.g., concrete, steel, aluminum, plastics, wood, etc.) used for building each treatment process, as well as consumable material (e.g. filter media), chemicals (e.g., ferric chloride, alum sulfate, sodium hypochlorite), and energy usage during the operation phase of the facility life span.
To improve the efficiencies for the data collection, the data collected in the MS Excel spreadsheet was organized in a module approach. The LCI data was linked to common design calculations. This spreadsheet allowed the user to select or deselect the treatment modules to customize a conceptual water treatment facility. It also allowed quick adjustment of key assumptions (e.g., the unit process capacity, as length of life cycle, unit power costs, and redundancy requirements) and critical design criteria (e.g., surface loading rate, side water depth, retention time, chemical dosage, and power efficiency) for each treatment process. This resulted in a dynamic LCI database that can be easily customized to cover a wide range flow capacity, types, sizes, and preferences.
The study also established environmental impact data for each inventory items. The quantitative measures of impacts were collected from Ecoinvent database. The environmental impacts were normalized to unit quantity of materials, equipment, chemicals, and energy, such as embedded water in one cubic yard of concrete, one pound of steel, one pound or gallon of 12 percent sodium hypochlorite, etc.
By summing the products of the quantity of each inventory item multiplying the corresponding unit quantity inventory environmental impact, the total environmental impacts for a water treatment process and facility can be quickly assessed. The conceptual case study results and a quick guide of how to use this spreadsheet were provided in Appendix A.
The proposed research demonstrated the use of the LCI data for assessing the embedded carbon dioxide emission, embedded energy and embedded water associated with the conceptual water treatment facility. Table ES1 summarizes the results.
It was determined that to produce 1,000 liters of finished water, the 10-million gallon per day (mgd) conceptual water treatment facility emits 211 gram carbon dioxide equivalent (g CO2 eq), and consumes 0.08 kWh (during the operational phase) and approximately 10 liters of embedded natural water resources. It suggested that the operational phase contributions (energy for raw water pumping and chemical usage) dominate the overall emission of CO2. The capital (concrete and equipment) produces less than 20 percent contribution to global warming. Similarly, the operational phase contribution dominates the intake of water resource. The capital components produce less than 5 percent contribution to embedded water. The operating phase energy consumption takes up less than 30 percent of the total energy. The embedded energy associated with the production of chemicals, energy and equipment represents more than 70 percent of the total energy consumed. The spreadsheet

November 2012 ES-3 pw://Carollo/Documents/Client/CO/WRF/9005A00/Deliverables/LCI-LCIA Report (Final)
database also provides breakdown analysis to allow assessment by individual inventory items (e.g., material, energy) or by individual processes. For example, 95+ percent of the energy used for raw water pumping is consumed during the operational phase. However, 95+ percent of the energy used for chemical facilities is embedded energy, consumed prior to the chemical used at the water treatment facility. This conceptual case study demonstrated application potential of the proposed LCI data and methodology. It also identified data gaps to be filled in and future research needs. Table ES1 Summary Results
Phase 1 - Proof of Concept: Using Life Cycle Inventory and Life Cycle Impact Assessment Database for Quantifying Embedded Water/Energy in a Water Treatment System
Impact Category
Operational Phase
Electricity
Global Warming Contributed by
Operational Phase Power
Embedded Global
Warming Global
Warming Embedded
Water Unit kWh g CO2 eq g CO2 eq g CO2 eq liters
Entire Water Treatment Facility 2.19E+07 1.64E+10 4.20E+10 5.83E+10 2.80E+09
Total per 1,000 gallons of Water Produced 2.99E-01 2.24E+02 5.75E+02 7.99E+02 3.84E+01
Total per 1,000 liters of Water Produced 7.91E-02 5.92E+01 1.52E+02 2.11E+02 1.01E+01
NoteBased on 10-mgd water treatment facility, producing 7.30E+10 gallons of water or 2.76E+11 liters of water on a 20-year life cycle. Not all components are included in the study boundary.
:

November 2012 1 pw://Carollo/Documents/Client/CO/WRF/9005A00/Deliverables/LCI-LCIA Report (Final)
Water Research Foundation and United States Bureau of Reclamation
PHASE 1 - PROOF OF CONCEPT: USING LIFE CYCLE INVENTORY AND LIFE CYCLE IMPACT ASSESSMENT DATABASE FOR
QUANTIFYING EMBEDDED WATER/ENERGY IN A WATER TREATMENT SYSTEM
1.0 PROJECT BACKGROUND AND OBJECTIVE Paradoxically, water is our most precious, most wasted, and most undervalued resource. Often due to a lack of understanding, the American public takes for granted that water flows on command where and when it is needed. Centrally distributed water is a commercial product produced by water utilities. Similar to other commercial products such as beef, coffee, hamburger, or milk, water claims commitments of water and other natural resources embedded in the infrastructure and operation of the water conveyance, treatment, and distribution systems. Producing and delivering water from sources with various water qualities consumes commercial products such as energy, equipment, instruments, and chemicals, each of which contains embedded water or removes locally available water from consideration for other uses.
The primary objective of the proposed research is to establish a methodology and framework for collecting and utilizing useful data for assessing the environmental impacts (specifically quantifying the embedded water/energy) of a water treatment system. This research aims at improving the efficiency of assessing such environmental impacts using the existing methodology and resources. It allows water utilities and research partners to quickly assess the water and carbon embedded in the water treatment infrastructures, establishing a foundation for making informed, environmentally responsible decisions. It offers opportunities to raise awareness of the true value of water by accounting for the embedded volume of freshwater and natural resources used to produce the centrally distributed water as a product measured over the full supply chain.
As demonstrated in this project, the use of life cycle inventory data and life cycle impact assessment database offers an efficient approach for assessing the embedded freshwater and carbon emissions for water treatment facilities. This demonstration identifies application potential, data gaps, and future research for the proposed research concept.
The following six main tasks were included in the Phase 1 study. Findings of each task are documented in the following sections.
• Task 1: Boundary, Goal, and Scope of Water Treatment Assembly
• Task 2: Literature Review, Methodology Description, and Data Gap Assessment
• Task 3: Data Collection Template
• Task 4: Life Cycle Impact Assessment

November 2012 2 pw://Carollo/Documents/Client/CO/WRF/9005A00/Deliverables/LCI-LCIA Report (Final)
• Task 5: Final Report: Summary of Findings
• Task 6: Full Scale Plan of Research Outline
2.0 TASK 1 - BOUNDARY, GOAL, AND SCOPE OF WATER TREATMENT ASSEMBLY
To demonstrate how the proposed approach can be used to efficiently account for the embedded water and energy in the water treatment infrastructure, a conceptual conventional water treatment facility was established as the study boundary for this Phase in Task 1. The conceptual water treatment facility included the following basic process components for a conventional water treatment plant:
• Raw water pumping
• Coagulation and flocculation
• Sedimentation
• Filtration
• Disinfection
• Chemical storage and feed system
Figure 1 illustrates the study boundary. Descriptions of each process component are shown in Table 1. More detailed process inputs can be found in Appendix A: Life Cycle Inventory and Life Cycle Impact Assessment Database Demonstration.
Figure 1 Phase 1 Study Boundary
Table 1 Conceptual Water Treatment Facility Boundary
Phase 1 - Proof of Concept: Using Life Cycle Inventory and Life Cycle Impact Assessment Database for Quantifying Embedded Water/Energy in a Water Treatment System
Parameters Units Value Plant Flow mgd 0-80, adjustable Life Cycle yr 20, adjustable Unit Cost for Electricity $/kWh 0.08, adjustable Raw Water Pumping Pump Station Wet Well Retention Time min 60, adjustable

November 2012 3 pw://Carollo/Documents/Client/CO/WRF/9005A00/Deliverables/LCI-LCIA Report (Final)
Table 1 Conceptual Water Treatment Facility Boundary Phase 1 - Proof of Concept: Using Life Cycle Inventory and Life Cycle Impact Assessment Database for Quantifying Embedded Water/Energy in a Water Treatment System
Parameters Units Value Coagulation and Flocculation Type of Rapid Mix Concrete basins G Value 1/s 500, adjustable Rapid Mix Retention Time min 1, adjustable Side Water Depth ft 14, adjustable Stage of Flocculator 3, adjustable Stage 1 G 1/s 35, adjustable Stage 2 G 1/s 21, adjustable Stage 3 G 1/s 10, adjustable Sedimentation Type of Sedimentation Tank Options circular or rectangular concrete basin Surface Loading Rate gpm/sf 0.72, adjustable Sedimentation Basins Retention Time min 120, adjustable Filtration Surface Loading Rate gpm/sf 6, adjustable Side Water Depth ft 18, adjustable Depth of Media Anthracite in 24, adjustable Sand in 12, adjustable Gravel in 6, adjustable Design Backwash Surface Loading Rate gpm/sf 20, adjustable Chlorine Contact Basin Chlorine Contact Basin Retention Time min 30, adjustable Type of Rapid Mix Concrete basins G Value 1/s 500, adjustable Chemical Storage and Feed – Alum Type of Chemicals Alum 50% Dosage mg/L 40, adjustable Design Storage day 30, adjustable Chemical Storage and Feed – Sulfuric Acid Type of Chemicals Sulfuric Acid 93% Dosage mg/L 20, adjustable Design Storage day 30, adjustable Chemical Storage and Feed – Sodium Hypochlorite Type of Chemicals Sodium Hypochlorite 12.5% Dosage mg/L 5, adjustable Design Storage day 30, adjustable

November 2012 4 pw://Carollo/Documents/Client/CO/WRF/9005A00/Deliverables/LCI-LCIA Report (Final)
The components considered in the study included:
• Primary construction material consumed to construct the water treatment facility (e.g., concrete, steel, FRP, etc.)
• Electrical power required for operating the mechanical equipment (pumps, mixers, blowers, etc.)
• Process chemical storage and feed
• Waste flows (e.g., disposal of filter media)
• Embedded environmental impacts (water and energy) associated with each material, energy, and chemical items used to build the treatment structures and process trains
The following are NOT included in the Phase 1 study, but may be addressed in the future phases:
• Residuals handling
• Raw water storage and conveyance (e.g., canal, reservoir)
• Finished water distribution
• Site work and excavation, pavement, yard piping, miscellaneous process piping, instruments, administration building, maintenance facilities, electrical buildings and substations, control rooms, security systems, and HVAC
• The indoor/outdoor illumination and other building electricity
• Use of standby power
3.0 TASK 2 - LITERATURE REVIEW, METHODOLOGY DESCRIPTION, AND RELATED RESEARCH
This section presented a brief literature review related to this research. The review focused on the following three aspects:
• Life cycle assessment methodologies used for this study
• Available LCA tools that are similar to what was used for this study
• Limitations and data gaps in the available database
3.1 LCA Methodology
The proposed approach for assessing embedded water and energy utilizes LCA principles and methodology. LCA is a technique for assessing the environmental aspects and potential impacts associated with a product or system (Curran 1996). The LCA method was first described by the Society for Environmental Toxicology and Chemistry (SETAC) (SETAC 1991; SETAC 1993) and refined by the EPA in 1993 (EPA 1993). Then LCA was formalized by the International Organization of Standardization (ISO) 14040: Principles and Framework and ISO 14044: Requirements and Guidelines.

November 2012 5 pw://Carollo/Documents/Client/CO/WRF/9005A00/Deliverables/LCI-LCIA Report (Final)
LCA is an ISO 14040 normalized method for the environmental assessment of industrial systems from “cradle-to-grave,” which begins with raw materials extracted from the earth, and continues with product development, manufacturing, and disposal (Vince et al. 2008). LCA considers all energy and environmental implications of processes through the entire life cycle, including design, planning, material extraction and production, manufacturing or construction, use, maintenance, and end-of-life fate of the product (reuse, recycling, incineration, or land filling) (American National Standard Institution 1997). In addition, LCA allows comparison between different schemes providing the same service or function. The general categories of environmental impacts under consideration include resource use, human health, and ecological consequences. LCA can assist in decision-making, improving the environmental aspects of products and selection of relevant indicators of environmental performance.
Figure 2 presents the LCA framework (Vigon et al. 1993 and Vigon and Harrison 1994). Process-based LCA requires data collection from various companies, government agencies, and published studies to evaluate the inputs and outputs of the system.
Figure 2 LCA Inventory Analysis Framework (Vigon et al 1993)
An LCA study consists of four steps:
1. Defining the goal and scope of the study.
2. Making a model of the product life cycle with all the environmental inflows and outflows. This data collection effort is usually referred to as the life cycle inventory (LCI) stage.
3. Understanding the environmental relevance of all the inflows and outflows. This is referred to as the life cycle impact assessment (LCIA) phase.
4. Interpreting the study.

November 2012 6 pw://Carollo/Documents/Client/CO/WRF/9005A00/Deliverables/LCI-LCIA Report (Final)
3.2 LCA Tools
A number of tools are available for environmental impact assessment. Most of these tools were developed to assess the environmental impact of industrial products. Very few of them have been used for impact assessment of municipal water and wastewater facilities. The most commonly used life cycle assessment tools for the water industry include SimaPro and GaBi.
3.2.1
SimaPro is a commercial LCA software tool made according to the ISO standard to facilitate the LCA analysis by PRé Consultants, Netherlands. SimaPro 7.2.0 (PRé Consultants 2004 and 2007) was used to analyze the contribution of the life cycle stages to the overall environmental load produced by the treatment systems. SimaPro includes a large database, including Ecoinvent database, containing a number of processes and several impact assessment methods allowing life cycle analysis of complex systems in an organized way. The updated SimaPro include US based databases such as USA input output database 98 and Franklin USA98. The impact analysis model included in SimaPro contains the TRACI (developed by US Environmental Protection Agency) and the BEES (developed by the National Institute of Standard and Technology) as well as other European based methods. Due to the large amount of uncertainty associated with the geographic and technological factors, these database and impact analysis methods allow a more accurate analysis of the environmental performance of the system in the North America. Instead of giving much focus on long, detailed, and expensive studies, this software allows simplified analysis within a reasonable time. It is successfully used by several researchers to perform LCA of water/wastewater supply and treatment technologies (Ortiz et al. 2007; Lassaux et al. 2007). Although it started as a processed based LCA tool, the new version of SimaPro included the EIO-LCA database. Therefore, EIO-LCA was used to fill in the gaps when process data was not available.
SimaPro LCA Software
3.2.2
GaBi is another commonly used commercial LCA software made by PE International, Germany. It was first released in 1993. The software is designed to provide services to perform life cycle assessment, life cycle engineering, technology benchmarking/system analysis, energy efficiency analysis, greenhouse gas accounting, and environmental management systems and sustainability reporting. Similar to SimaPro, Gabi also allows user to build scenarios (called plans in GaBi) and bench mark and compare the environmental impacts of different scenarios. The software is built on Gabi LCA databases, integrated with the Swiss based Ecoinvent LCI database. GaBi has been successfully used in LCA studies, such as by Vince et al. (2008) performing environmental assessment compared different potable water supply systems.
GaBi LCA Software
Table 2 below summarizes the databases and LCIA methods used in SimaPro and GaBi.

November 2012 7 pw://Carollo/Documents/Client/CO/WRF/9005A00/Deliverables/LCI-LCIA Report (Final)
Table 2 Database and LCIA Methods Used in SimaPro and GaBi Phase 1 - Proof of Concept: Using Life Cycle Inventory and Life Cycle Impact Assessment Database for Quantifying Embedded Water/Energy in a Water Treatment System
Databases LCIA Methods
SimaPro
Ecoinvent, US LCI, ELCD, US Input Output,
EU and Danish Input Output, Dutch Input Output, LCA Food
ReCiPe, Eco-indicator 99, USEtox, IPCC 2007, EPD, Impact 2002+,
CML-IA, Traci 2, BEES, Ecological Footprint EDIP 2003,
Ecological scarcity 2006, EPS 2000, Greenhouse Gas Protocol and others
GaBi GaBi Databases, Ecoinvent, U.S. LCI
CML 2011 – version Dec 2007, Nov 2009, Nov 2010, CML 1996, Eco-Indicator 95, Eco-Indicator 95 RF, Eco-Indicator 99, EDIP 1997, EDIP 2003, Impact 2002+,
Method of Ecological Scarcity (UBP Method), ReCiPe, TRACI 2.0, USEtox
Reference http://www.pre-sustainability.com/databases http://www.gabi-software.com/international/databases Note: See Abbreviation List for acronyms.
3.2.3
This study utilizes the European based Ecoinvent and US based US LCI database. They represent the most widely used LCA databases by the published water treatment system LCA studies. Data gaps identified when using these databases to develop the life cycle inventory for the conceptual water treatment facility accurately reflect the real limitations of the best available data. A brief description of these LCI databases is provided as follows.
LCI Database
The Ecoinvent database is a Swiss based commercial database, one of the world’s leading LCI database products. It provides access to unit processes as well as cradle-to-grave inventories covering different industrial areas. Ecoinvent contains international industrial life cycle inventory data on energy supply, resource extraction, material supply, chemicals, metals, agriculture, waste management services, and transport services. Ecoinvent is compatible with and commonly used by all major LCA software tools.
US life cycle inventory (LCI) database is a publically available LCI database, created by NREL and its partners, to help answer questions about environmental impacts. This database maintains data quality, covers commonly used materials, products, and processes in the U.S. with up-to-date, critically reviewed LCI data. This database is a collection of unit processes. It provides a cradle-to-grave accounting of the energy and material flows into and out of the environment that are associated with producing a material, component, or assembly, covering commonly used materials, products, and processes. The critically reviewed LCI data are consistent with a common research protocol and with international standards. The LCI data support efforts to develop product LCA, support systems, and LCA tools. The use of the database requires registration for access.

November 2012 8 pw://Carollo/Documents/Client/CO/WRF/9005A00/Deliverables/LCI-LCIA Report (Final)
3.2.4
Among the several impact assessment methods incorporated in SimaPro and GaBi, Building for Environmental and Economic Sustainability [BEES] was used for this study. The selection of this commonly used LCIA method satisfies the purpose of this study, i.e., demonstrating the utility of the LCI data without focusing on the LCIA.
LCIA Methodology
The BEES method was developed by the National Institute of Standards and Technology as a systematic methodology for selecting building products that achieve the most appropriate balance between environment and economics. It is an online web application open to public access. BEES Online measures the environmental performance of building products by using the life cycle assessment approach specified in the ISO 14040 series of standards. All stages in the life of a product are analyzed: raw material acquisition, manufacture, transportation, installation, use, and recycling and waste management. Online application is user friendly, but the content is limited to building construction material.
3.3 LCA Database Data Gap for Water/Wastewater Industry LCA Applications
With the available software and database, the important challenge for LCA application in the field of water and wastewater industry is that several processes, equipment, and chemicals commonly used in water/wastewater treatment are not directly included in existing databases and may require time-consuming steps for raw data gathering, assembling, and analysis. This sets a barrier for the water/wastewater utilities to use LCA in embedded water and energy assessment in sustainability evaluation.
The following items are exemplary water treatment components that are not readily available in the current LCA databases covering materials, manufacturing process, transportation and end of use disposal of the product.
• Readily available data such as quantity take-off of construction material (concrete, steel, etc.) consumed for a commonly used water treatment unit processes with a given capacity (e.g., a 10-mgd coagulation tank, a 1-mgd granular media filter, or a 10-million gallon [MG] reservoir).
• Data of major treatment equipment such as UV lamp for disinfection, centrifuges, gravity belt thickener, and belt filter press for sludge thickening and dewatering.
• Data of miscellaneous equipment for water and wastewater treatment process, such as strainers and mixers.
• Data of common facility structure components, such as aluminum basin covers, and other widely used units such as above ground chemical storage totes and tanks, even though the material (aluminum, high density polyethylene [HDPE] or fiber-reinforced plastic [FRP]) are in the database.
• Data for equipment related to filtration process, including: – Cartridge filters (polypropylene type) for membrane pre-filtration.

November 2012 9 pw://Carollo/Documents/Client/CO/WRF/9005A00/Deliverables/LCI-LCIA Report (Final)
– Membrane materials commonly used in water and wastewater treatment such as microfiltration (MF), ultrafiltration (UF), nanofiltration (NF), reverse osmosis (RO), and electrodialysis (ED) membranes.
– Membrane element housing. – Filter media, such as anthracite for sand filters and fabric for cloth media filters.
• Data of chemicals commonly used in water and wastewater processes at various bulk concentrations, such as sulfuric acid, phosphonate type antiscalant, acrylamide polymers.
Some of these data gaps can be filled by engineers and designers through reviewing typical treatment facility design documents. Others may take additional level of data collection efforts and require participation from industry partners such as equipment manufacturers and trade organizations. These gaps set forth the target for the proposed LCI data collection in future research phases.
3.4 Related Research
The literature review findings on the topic of water and energy embedded in water/wastewater industry that are directly related to this study are summarized in the following section.
Bonton et al. (2012) conducted a study comparing life cycle assessment of two water treatment plants: an empirical modeled (conceptual-designed) conventional granular activated carbon (GAC) plant and an existing nanofiltration plant located in the province of Quebec, Canada that has been in operation for over 10 years. This study used SimaPro software version 7.3 for life cycle inventory and impact assessment. The Ecoinvent 2.0 database was chosen for the inventory analysis of inputs (resources, energy) and outputs (emissions) of each chemical and materials process. Energy resources included in Ecoinvent 2.0 were replaced by local energy resources depending on the location of the manufactured product (US energy or Quebec hydro-electricity energy).This study performed detailed LCA comparison for these two plants based on equal feed (raw surface freshwater) and treated water qualities. The study revealed that among the phases of construction, operation, and decommissioning, the operation phase has the highest potential environmental impacts. It also indicated that the conventional-GAC plant has greater impacts than the NF plant, caused by the use of coal-based GAC treatment, based on the fact that hydroelectricity is a dominant power source. Corrosion control chemicals (carbon dioxide, calcium hydroxide, and sulfuric acid) in a distribution system using pH and alkalinity adjustments have significant environmental impacts. The study developed life cycle inventory for NF treatment plant. The main building components (wall, insulation, foundation, etc.) and treatment components (pre-filters, pipes, tanks, etc.) were considered in the inventory. For membrane elements, it included PVC membrane housing and spiral wound membrane module stowage (assumed to be PVC instead of the actual material).
Vince et al. (2008) compared different potable water supply systems (groundwater treatment, ultrafiltration, nanofiltration, seawater reverse osmosis, and thermal distillation) using LCA.

November 2012 10 pw://Carollo/Documents/Client/CO/WRF/9005A00/Deliverables/LCI-LCIA Report (Final)
They used Gabi 4.2 software and IMPACT 2002+ method to assess the impact assessment results. The data collection relies on specifically developed models (“LCA modeling”) for water treatment steps and on the Ecoinvent database for the other industrial processes such as chemicals and electricity production. The results showed that the electricity was the main source of environmental impacts. Thermal desalination, membrane treatment processes, and ozone production were identified to be “the most energy intensive treatment steps seconded with chemicals production for coagulant and remineralization.”
The Engineering Research Center (ERC) for Re-inventing the Nation’s Urban Water Infrastructure (ReNUWIt) as an interdisciplinary, multi-institution research center, aims “to facilitate the transition of water systems to a new state in which they consume less energy and resources while continuing to meet the needs of urban users and aquatic ecosystems”. One of the ReNUWIt outreach goals is to develop breakthrough modular technologies and novel system-level approaches to substantially reduce energy use and related GHGs emissions in water conveyance, treatment, distribution, and reuse. The ERC Year I annual report (2012) included LCA under U-thrust efforts (urban systems integration and institutions) U4 theme (life cycle assessment of urban water infrastructure), intended to quantify energy, GHGs, toxic emissions, and waste production in the evaluation of new technologies. The goal under the U-thrust is to use LCA principles to “assess comprehensive life-cycle environmental costs in decision making related to urban water infrastructure.” This effort will extend previous research on LCA for urban water infrastructure by developing a comprehensive set of environmental, economic, and social metrics as well as complete LCA models related to complex water systems, including their supply chains.
The best literature relevant to the proposed study was the Water-Energy Sustainability Tool (WEST) and Wastewater-Energy Sustainability Tool (WWEST). WEST and WWEST are MS Excel-based tools, established and currently in progress of development by Arpad Horvath and Jennifer Stokes at University of California, Berkeley. WEST is developed to determine the environmental effects of water system infrastructure and operation (Stokes and Horvath 2006), considering up to five water sources and process design scenarios. WWEST evaluates each wastewater treatment scenario separately. Based on the material and energy inputs for the facility construction and operation phases, the model provides output for life cycle air emissions. These efforts included LCI data collection for the water and wastewater treatment systems.
Several case studies were conducted using WEST. Stokes and Horvath (2009) used WEST to evaluate the life cycle assessment of water systems. Four water sources (imported water, seawater desalination, brackish groundwater desalination, and recycled water) were analyzed in southern California. Seawater desalination was reported to be 1.5 to 2.4 times more environmentally intensive than imported water and brackish groundwater. Since energy is the dominant factor for environmental impacts, different alternatives of energy production were discussed. Later in 2011, the researchers used WEST in a California case study utility and concluded that energy production, followed by chemical production, are the most significant activities contributing to water supply’s energy needs and emissions.

November 2012 11 pw://Carollo/Documents/Client/CO/WRF/9005A00/Deliverables/LCI-LCIA Report (Final)
3.5 Summary
In summary, within the few literatures that have been published on water/energy LCA applied in water and wastewater industry, most of the reference literatures are at a strategic level, aiming at providing guidance and framework for GHG and water footprint assessment. Most of these studies utilized available LCA databases (such as Ecoinvent) to develop the life cycle inventory for the water treatment components. Detailed quantification of material and consumables for the water treatment system were rarely developed and documented for these studies. The best literature relevant to the proposed study was the WEST tool by Stokes and Horvath, which included LCI data collection for water and wastewater treatment components (e.g., pipeline, equipment, solids disposal, etc.).
The primary focus of the proposed research is to outline an approach that could be further developed through subsequent research to develop LCI data that are relevant to the water treatment system. Through gathering in-depth engineering data on material use and equipment design for common water infrastructure, the proposed research could produce useful data sets that can be used in LCA tools such as SimaPro, GaBi or WEST. Collaborating with researchers developing these tools and the relevant LCA database is critical in future phases.
4.0 TASK 3 - LIFE CYCLE INVENTORY TEMPLATE After defining the boundaries, the goal and the scope, the next step of the life cycle assessment was to develop a life cycle inventory that contains the quantity of all major inputs and outputs during the entire life cycle of each process/system within the established boundary. For this study, the LCI included the amount of water being pumped and treated, the product water being delivered, the construction material, consumables, energy and chemicals used for each process component during construction and operation, and the quantity of the waste disposal.
4.1 Life Cycle Inventory Database
In the inventory phase, a model was made of the complex technical system that is used to produce, transport, use, and dispose a product. This resulted in a flow sheet or process tree with all the relevant processes. For each process, all the relevant inflows and the outflows were collected.
Essentially, the process inputs could be divided into environmental input (raw materials and energy resources, say raw water pumped from the canal, etc.) and economic input (products, semi-finished products or energy from technosphere - say steel, concrete, chemicals etc.). Similarly, process outputs could be divided into environmental output (emissions to water, air and soil - say carbon dioxide, etc.) and economic output (product/co-product, or semi-finished product or energy to other processes in the technosphere - say the finished water, etc.). The creation of the LCI does not have to iterative until all inputs and outputs are exhaustively

November 2012 12 pw://Carollo/Documents/Client/CO/WRF/9005A00/Deliverables/LCI-LCIA Report (Final)
listed, considering all contributions in the entire life cycle of a product from mining, processing, transportation to consumption and final disposal. The LCA databases containing same or similar processes/products are used to fill in the economic inputs down in the supply chain and reduce the data collection burden. For example, when the LCA modeler includes concrete in the LCI, the database will automatically include all raw materials and energy resources consumed during the production and transportation of concrete.
4.2 Life Cycle Inventory Template
One of the main subtasks of Task 3 is to establish an input data template in MS Excel format. This inventory template quantitatively identified the energy and material consumption throughout the life cycle of the water treatment system within the study boundary. Each unit process was set up in a separate worksheet using a modular approach. In each modular worksheet, the following inventory data were derived from the design calculations:
• Raw and product water in million gallons per day (mgd) or gallons per minute (gpm)
• Construction materials, such as concrete, steel, aluminum, plastics, wood, etc. in pounds of material (lb) or cubic yard of volume (cy)
• Consumable material during the facility operation, such as filter media, etc. in pounds of material (lb)
• Chemical usage, such as ferric chloride, alum sulfate, sodium hypochlorite, etc. in pounds of chemical (lb)
• Electrical energy usage during operation of the facility life span, in kW
• Mechanical equipment in US dollar value ($)
The Phase 1 template is limited to the components to assemble a water treatment facility defined in the Phase 1 study boundary. These items are included in this phase to illustrate how the proposed approach works to account for the embedded energy and water. The list could be expanded in a future phase to cover more types of material, process, energy, and wastes. Table 3 shows an example of the input data collection template.
Table 3 Life Cycle Inventory Template Phase 1 - Proof of Concept: Using Life Cycle Inventory and Life Cycle Impact Assessment Database for Quantifying Embedded Water/Energy in a Water Treatment System
Select Process Select Capacity mgd Impact Category Quantity Material Unit
Mechanical/Equipment Pumps and compressors
USD Blowers and fans
USD
Measuring and dispensing pumps
USD Pipe, valves, and pipe fittings
USD
Materials Gravel
kg

November 2012 13 pw://Carollo/Documents/Client/CO/WRF/9005A00/Deliverables/LCI-LCIA Report (Final)
Table 3 Life Cycle Inventory Template Phase 1 - Proof of Concept: Using Life Cycle Inventory and Life Cycle Impact Assessment Database for Quantifying Embedded Water/Energy in a Water Treatment System
Select Process Select Capacity mgd Impact Category Quantity Material Unit
Sand
kg Hard coal mix, at regional storage
kg
Concrete (reinforced)
kg
Concrete, normal
m3 Brick
kg
Polyvinylchloride, suspension polymerized
kg PVC pipe
kg
Polyethylene, HDPE, granulate
kg HDPE pipes
kg
Glass fiber reinforced plastic, polyester resin, hand lay-up
kg St13 I - Material
kg
Reinforcing steel
kg Steel product manufacturing, average metal working
kg
Copper I - Material
kg Copper product manufacturing, average metal working
kg
Aluminum, production mix
kg Aluminum product manufacturing
kg
Chemicals Sodium hydroxide, 50% in H2O, production mix
kg Sodium hypochlorite, 15% in H2O
kg
Lime, hydrated, packed
kg Quicklime, milled, packed
kg
Sulfuric acid, liquid
kg Hydrochloric acid, from the reaction of hydrogen with chlorine
kg
Hydrochloric acid, 30% in H2O
kg Phosphoric acid, industrial grade, 85% in H2O
kg
Aluminum sulfate, powder
kg Iron (III) chloride, 40% in H2O
kg
Ammonium sulfate, as N, at regional storehouse
kg Energy
Electricity, high voltage, at grid
kWh Natural gas, at consumer
MJ

November 2012 14 pw://Carollo/Documents/Client/CO/WRF/9005A00/Deliverables/LCI-LCIA Report (Final)
4.3 Dynamic Life Cycle Inventory
The inventory templates were filled for each of the water treatment processes included in the study boundary. The following eight filled life cycle inventory templates were developed during the Phase 1 study.
• Raw Water Pumping
• Chemical: Alum
• Chemical: Sulfuric
• Coagulation Flocculation
• Sedimentation
• Filtration
• Chemical: Sodium Hypochlorite
• Chlorine Contact Basin
The steps for filling in this template represent a time-consuming challenge for water treatment related LCA studies. The LCA researchers or the water utilities interested in assessing the environmental impacts associated with the water treatment processes have to collect treatment capacities, chemical dosage, energy consumption, basin sizes, thickness of concrete walls, quantity of rebar, etc. and convert the quantities of material and energy into the required format. To improve the efficiencies for the data collection, the proposed approach links the inventory data to common design calculations.
The templates are incorporated into a MS Excel database file. The spreadsheet allows the user to select or deselect the treatment modules to build a customized conceptual water treatment facility. It allows adjustment of the unit process capacity (in million gallons per day) and automatically recalculates the associated environmental impacts. It includes detailed design calculations with default design criteria (e.g., surface loading rate, side water depth, retention time, chemical dosage, power efficiency) and other assumptions (e.g., length of life cycle, unit power costs, redundancy requirements) that are kept adjustable. By keeping the inventory linked with adjustable design calculations, each of these filled templates represents a dynamic database that can be quickly customized to cover a wide range flow capacity, types, sizes, preferences, etc.
These sheets as well as the design calculations and a detailed guide on how to use the spreadsheet can be found in Appendix A. The raw excel spreadsheet file is also attached to this report.
To customize the inventory database, users need to follow a few simple steps.

November 2012 15 pw://Carollo/Documents/Client/CO/WRF/9005A00/Deliverables/LCI-LCIA Report (Final)
• Illustrated in Figure 3.
Step 1: Select the Treatment Modules
• By clicking on the checkboxes located on the “Main” workbook, users can select or deselect appropriate modules to assemble their own treatment facility. When selecting or deselecting the checkboxes, workbooks named in corresponding modules will appear or disappear from the workbook.
• Adjust the plant flow input in the blue cell to the desired treatment capacity (e.g., 10 mgd). The current database is limited to 0 - 80 mgd. This range can be expanded in future phases.
• Review default length of life cycle (20 years) and unit cost for electricity ($0.08/kWh). Adjust if necessary.
• Once the user completes Step 1 inputs, the total environmental impacts (embedded energy and water) associated with the selected treatment facility is updated in a table below the input area. These values are expressed in gram of carbon dioxide equivalent for global warming and liters of embedded water.
Figure 3 Step 1 - Select the Treatment Modules
• Illustrated in Figure 4.
Step 2: Breakdown Results
• Besides the total gram of carbon dioxide equivalent and liters of embedded water, users can review more detailed results by clicking on ungroup buttons to expand hidden rows and columns. These results include: – Contribution of environmental impacts broken down by material and energy
inventory. – Results for 11 more impact categories such as ozone depletion potential,
acidification, etc. besides global warming and embedded water.

November 2012 16 pw://Carollo/Documents/Client/CO/WRF/9005A00/Deliverables/LCI-LCIA Report (Final)
Figure 4 Step 2 - Breakdown Results
• Illustrated in Figure 5, user can choose to review each of the workbooks corresponding to the selected treatment modules.
Step 3: Review and Customize Design Calculations
• User’s input cells are color coded in blue and recommended default design criteria in green. Follow the color coding to enter and adjust inputs as necessary.
• When making changes to the design calculations, the life cycle inventory data on the bottom of each modular workbook is updated automatically.
Figure 5 Step 3 - Review and Customize Design Calculations (Left: Design Calculation Example; Right: Module Inventory Database Example)

November 2012 17 pw://Carollo/Documents/Client/CO/WRF/9005A00/Deliverables/LCI-LCIA Report (Final)
5.0 LIFE CYCLE IMPACT ASSESSMENT Task 4 of the study established a quantitative environmental impact package for the inventory established in Task 3. For the Phase 1 study, the quantitative measures of impacts were collected from readily available sources, i.e., Ecoinvent database, the same data used in SimaPro. The environmental impacts were normalized to unit quantity of materials, equipment, chemicals, and energy, such as embedded water in one cubic yard of concrete, one pound of steel, one pound or gallon of 12 percent sodium hypochlorite, etc. The unit environmental impacts were then summarized into the same MS Excel database file developed in Task 4. The impacts examined in this study will mainly focus on embedded water and carbon emissions during the facility construction and operation. It also includes other impact categories that are commonly evaluated in a typical LCA analysis, such as ozone depletion and smog. Table 4 presents the results of the environmental impacts for unit quantity of material and energy.

November 2012 18 pw://Carollo/Documents/Client/CO/WRF/9005A00/Deliverables/LCI-LCIA Report (Final)
Table 4 LCA Environmental Impacts Associated with Unit Quantity of Material Phase 1 - Proof of Concept: Using Life Cycle Inventory and Life Cycle Impact Assessment Database for Quantifying Embedded Water/Energy in a Water Treatment System
Impact Category Quantity Material
Unit Global
Warming Acidification HH
Cancer HH
Noncancer HH Criteria
Air Pollutants Eutrophication Ecotoxicity Smog
Natural Resource Depletion
Indoor Air Quality
Habitat Alteration
Embedded Water
Ozone Depletion
Impact Unit CO2 eq H+ moles eq C7H7 eq C7H7 eq microDALYs N eq 2,4-D eq NOx eq MJ surplus TVOC eq T&E count liters CFC-11 eq
Mechanical/Equipment Pumps and compressors 1 USD 8.05E+02 1.89E+02 1.33E+01 2.89E+03 8.86E-02 1.80E-01 5.42E+00 3.37E+00 1.15E+00 0.00E+00 0.00E+00 0.00E+00 1.62E-03
Blowers and fans 1 USD 8.93E+02 2.07E+02 1.29E+01 2.67E+03 9.66E-02 2.35E-01 5.22E+00 3.55E+00 1.19E+00 0.00E+00 0.00E+00 0.00E+00 1.45E-03
Measuring and dispensing pumps 1 USD 8.83E+02 2.16E+02 1.54E+01 3.35E+03 9.62E-02 2.17E-01 5.50E+00 3.74E+00 1.31E+00 0.00E+00 0.00E+00 0.00E+00 1.93E-03
Pipe, valves, and pipe fittings 1 USD 1.06E+03 2.55E+02 1.73E+01 6.58E+03 1.26E-01 2.19E-01 6.25E+00 4.06E+00 1.35E+00 0.00E+00 0.00E+00 0.00E+00 6.14E-03
Materials Gravel 1 kg 1.02E+01 2.87E+00 2.02E-03 8.41E+00 3.92E-04 2.66E-03 2.53E-02 5.64E-02 1.64E-02 0.00E+00 0.00E+00 1.12E-01 9.95E-06
Sand 1 kg 9.73E+00 2.72E+00 1.63E-03 7.32E+00 3.55E-04 2.55E-03 2.21E-02 5.55E-02 1.60E-02 0.00E+00 0.00E+00 9.31E-02 9.85E-06
Hard coal mix, at regional storage 1 kg 2.68E+02 8.22E+01 1.40E-01 2.63E+03 1.38E-01 7.15E-02 4.62E-01 1.35E+00 4.72E-01 0.00E+00 3.73E-14 3.46E+00 5.34E-06
Concrete (reinforced) 1 kg 1.07E+02 4.01E+01 6.89E+00 9.26E+03 6.68E-03 2.85E-02 4.28E-01 7.94E-01 1.87E-01 0.00E+00 0.00E+00 1.92E+00 8.84E-07
Concrete, normal 1 m3 2.59E+05 2.56E+04 5.19E+02 1.07E+06 8.73E+00 3.04E+01 1.14E+03 5.58E+02 9.63E+01 0.00E+00 8.06E-13 3.83E+03 6.37E-03
Brick 1 kg 2.12E+02 3.15E+01 6.73E-02 7.62E+01 8.10E-03 3.43E-02 2.42E-01 5.88E-01 3.28E-01 0.00E+00 1.40E-16 1.21E+00 4.09E-06
Polyvinylchloride, suspension polymerised
1 kg 1.89E+03 2.87E+02 1.71E+00 5.54E+03 7.92E-02 4.66E-01 2.57E+01 4.87E+00 6.40E+00 0.00E+00 1.09E-15 4.64E+02 1.21E-07
PVC pipe 1 kg 3.18E+03 7.42E+02 5.32E+02 6.77E+05 2.61E-01 9.62E-01 3.90E+01 9.79E+00 0.00E+00 0.00E+00 0.00E+00 7.43E+01 0.00E+00
Polyethylene, HDPE, granulate, at plant
1 kg 1.90E+03 3.40E+02 9.69E-01 1.74E+02 1.10E-01 1.61E-01 6.43E-01 4.11E+00 1.01E+01 0.00E+00 7.86E-16 3.22E+01 9.37E-08
HDPE pipes 1 kg 2.44E+03 5.01E+02 7.15E-01 8.68E+01 1.63E-01 2.15E-01 1.12E+00 1.04E+01 0.00E+00 0.00E+00 0.00E+00 4.65E+01 0.00E+00
Glass fiber reinforced plastic, polyester resin, hand lay-up
1 kg 4.67E+03 8.88E+02 6.36E+01 3.34E+04 3.27E-01 4.68E+00 3.53E+01 1.11E+01 8.84E+00 0.00E+00 1.34E-14 1.57E+02 3.80E-04
St13 I - Material 1 kg 1.00E+03 5.27E+02 1.72E+02 2.31E+05 9.32E-02 2.70E-01 9.57E+00 8.87E+00 8.46E-01 0.00E+00 0.00E+00 1.18E+00 2.93E-06
Reinforcing steel, at plant 1 kg 1.40E+03 2.64E+02 1.44E+01 4.21E+04 5.09E-01 2.28E-01 1.08E+02 3.73E+00 1.09E+00 0.00E+00 2.49E-14 2.58E+01 2.17E-05
Steel product manufacturing, average metal working
1 kg 1.79E+03 3.08E+02 8.23E+00 1.77E+04 2.39E-01 8.82E-01 3.29E+01 3.91E+00 2.07E+00 0.00E+00 5.66E-14 5.25E+01 6.39E-05
Copper I - Material 1 kg 7.51E+03 3.52E+04 1.29E-02 1.42E+01 9.42E+00 1.09E+00 6.28E-01 3.11E+01 1.25E+01 0.00E+00 0.00E+00 1.26E-01 2.92E-07
Copper product manufacturing, average metal working
1 kg 1.80E+03 1.66E+03 1.45E+02 3.07E+05 8.02E-01 1.21E+00 5.28E+01 8.56E+00 2.27E+00 0.00E+00 7.42E-13 6.18E+01 7.44E-05
Aluminum, production mix, at plant - Material
1 kg 7.77E+03 1.88E+03 3.29E+01 2.22E+04 1.43E+00 1.68E+00 3.13E+01 1.66E+01 7.99E+00 0.00E+00 8.57E-14 2.03E+02 3.03E-04
Aluminum product manufacturing, average metal working - Processing
1 kg 3.17E+03 6.47E+02 1.08E+01 9.71E+03 4.07E-01 1.18E+00 1.48E+01 6.44E+00 3.57E+00 0.00E+00 2.47E-14 9.11E+01 1.27E-04

November 2012 19 pw://Carollo/Documents/Client/CO/WRF/9005A00/Deliverables/LCI-LCIA Report (Final)
Table 4 LCA Environmental Impacts Associated with Unit Quantity of Material Phase 1 - Proof of Concept: Using Life Cycle Inventory and Life Cycle Impact Assessment Database for Quantifying Embedded Water/Energy in a Water Treatment System
Impact Category Quantity Material
Unit Global
Warming Acidification HH
Cancer HH
Noncancer HH Criteria
Air Pollutants Eutrophication Ecotoxicity Smog
Natural Resource Depletion
Indoor Air Quality
Habitat Alteration
Embedded Water
Ozone Depletion
Impact Unit CO2 eq H+ moles eq C7H7 eq C7H7 eq microDALYs N eq 2,4-D eq NOx eq MJ surplus TVOC eq T&E count liters CFC-11 eq
Chemicals Sodium hydroxide, 50% in H2O, production mix
1 kg 1.01E+03 2.36E+02 1.21E+00 1.50E+04 9.72E-02 2.93E-01 7.71E+01 2.16E+00 8.96E-01 0.00E+00 7.46E-15 1.13E+02 2.78E-05
Sodium hypochlorite, 15% in H2O 1 kg 7.63E+02 1.74E+02 8.30E-01 8.72E+03 7.19E-02 2.15E-01 4.37E+01 1.90E+00 8.71E-01 0.00E+00 4.77E-15 6.50E+01 2.35E-05
Lime, hydrated, packed 1 kg 7.57E+02 3.77E+01 3.54E-01 7.76E+02 2.48E-02 4.24E-02 3.42E-01 6.33E-01 5.19E-01 0.00E+00 9.25E-17 2.30E+00 4.30E-05
Quicklime, milled, packed 1 kg 9.82E+02 4.85E+01 3.89E-01 9.37E+02 3.21E-02 5.32E-02 4.35E-01 8.14E-01 6.73E-01 0.00E+00 1.14E-16 2.04E+00 5.58E-05
Sulfuric acid, liquid 1 kg 8.60E+01 6.75E+02 1.04E-01 1.64E+02 1.82E-01 6.29E-02 3.67E-01 8.42E-01 1.54E-01 0.00E+00 1.46E-16 5.07E+01 7.71E-06
Hydrochloric acid, from the reaction of hydrogen with chlorine
1 kg 1.17E+03 2.75E+02 3.15E+00 1.50E+04 1.12E-01 3.11E-01 7.66E+01 2.53E+00 1.27E+00 0.00E+00 8.09E-15 1.18E+02 2.44E-03
Hydrochloric acid, 30% in H2O 1 kg 7.35E+02 1.82E+02 1.77E+00 7.83E+03 7.20E-02 2.87E-01 3.91E+01 1.61E+00 8.79E-01 0.00E+00 5.04E-15 7.25E+01 1.23E-03
Phosphoric acid, industrial grade, 85% in H2O
1 kg 1.21E+03 1.67E+03 3.14E+01 7.13E+03 6.57E-01 1.06E+02 6.46E+00 4.16E+00 1.79E+00 0.00E+00 2.93E-14 1.56E+02 5.92E-05
Aluminum sulfate, powder 1 kg 4.58E+02 4.44E+02 3.25E+00 1.40E+03 2.02E-01 1.29E-01 3.68E+00 1.65E+00 5.59E-01 0.00E+00 6.50E-15 3.89E+01 2.04E-05
Iron (III) chloride, 40% in H2O 1 kg 6.17E+02 1.50E+02 1.87E+00 1.29E+04 6.08E-02 1.90E-01 6.69E+01 1.46E+00 5.64E-01 0.00E+00 4.49E-15 6.38E+01 1.53E-03
Ammonium sulfate, as N 1 kg 2.37E+03 3.45E+02 1.22E+00 3.02E+03 1.51E-01 3.45E-01 4.64E+00 3.84E+00 5.56E+00 0.00E+00 3.50E-15 7.71E+00 6.05E-05
Energy Electricity, high voltage 1 kWh 7.48E+02 2.64E+02 1.53E+00 2.62E+03 8.97E-02 9.43E-02 1.93E+00 1.74E+00 5.04E-01 0.00E+00 1.72E-14 2.67E+01 4.71E-06
Natural gas, at consumer 1 MJ 1.32E+01 2.83E+01 3.34E-01 3.89E+02 7.76E-03 3.66E-03 8.95E-02 2.48E-02 1.81E-01 0.00E+00 2.21E-17 3.44E-02 1.09E-08

November 2012 20 pw://Carollo/Documents/Client/CO/WRF/9005A00/Deliverables/LCI-LCIA Report (Final)
6.0 RESULTS AND DISCUSSION By summing the product of each inventory item and the corresponding unit quantity inventory environmental impact, the total environmental impacts for a water treatment process and facility can be quickly assessed. A conceptual case study was assessed using the proposed approach. Table 5 summarizes the key inputs for this case study. Table 6 summarizes the life cycle inventory calculated from the parameters in Table 5. More details can be found in Appendix A. Table 5 Conceptual Case Study Inputs
Phase 1 - Proof of Concept: Using Life Cycle Inventory and Life Cycle Impact Assessment Database for Quantifying Embedded Water/Energy in a Water Treatment System
Parameters Units Value Plant Flow mgd 10 Life Cycle yr 20 Unit Cost for Electricity $/kWh 0.08 Water Treated on Life Cycle gallons 7.30E+10 Raw Water Pumping Pump Station Wet Well Retention Time min 60 Total Number of Wet Wells ea 2 + 0 Basin Length ft 75 Basin Width ft 25 Total Wet Well Depth ft 18 Total Number of Pumps ea 2+1 Flow per Pump mgd 5 TDH ft 50 Break Horsepower (BHP) HP 44 Efficiency % 75 Motor Efficiency % 95 VFD Efficiency % 98 Motor Size HP 63 Online Factor % 100% Power Consumption kWh/year 820,000 Pipe Length ft 500 Maximum Design Velocity fps 8 Chemical: Alum Type of Chemicals
Alum 50%
Dosage mg/L 40 Design Storage day 30 Total Number of Storage Tank ea 2

November 2012 21 pw://Carollo/Documents/Client/CO/WRF/9005A00/Deliverables/LCI-LCIA Report (Final)
Table 5 Conceptual Case Study Inputs Phase 1 - Proof of Concept: Using Life Cycle Inventory and Life Cycle Impact Assessment Database for Quantifying Embedded Water/Energy in a Water Treatment System
Parameters Units Value Chemical Tank Diameter ft 12 Chemical Tank Height (excluding freeboard) ft 11 Chemical Storage Tank Volume gallons 10,000 Chemical Storage Tank Material
Fiberglass
Total Number of Metering Pumps ea 1+1 Misc Equipment Size HP 0.2 Chemical: Sulfuric Acid Type of Chemicals
Sulfuric Acid 93%
Dosage mg/L 20 Design Storage day 30 Total Number of Storage Tank ea 2 Chemical Tank Diameter ft 12 Chemical Tank Height (excluding freeboard) ft 2 Chemical Storage Tank Volume gallons 2000 Chemical Storage Tank Material
Fiberglass
Total Number of Metering Pumps ea 1+1 Misc Equipment Size HP 0.2 Coagulation Flocculation Total Number of Rapid Mix ea 2 Rapid Mix Retention Time min 1 Total Rapid Mix Depth ft 16 Basin Length ft 8 Basin Width ft 8 Total Number of Mixers ea 1+1 G Value 1/s 500 Break Horsepower (BHP) HP 8 Efficiency
0.65
Motor Efficiency
0.95 Motor Size HP 12 Online Factor % 100% Power Consumption kWh/year 80494 Type of Flocculation Tank
Vertical, 3-Stage, Concrete
Total Number of Flocculation Tank ea 1+1 Flocculation Tank Retention Time min 30 Total Flocculation Tank Depth ft 16 Basin Length ft 77 Basin Width ft 26

November 2012 22 pw://Carollo/Documents/Client/CO/WRF/9005A00/Deliverables/LCI-LCIA Report (Final)
Table 5 Conceptual Case Study Inputs Phase 1 - Proof of Concept: Using Life Cycle Inventory and Life Cycle Impact Assessment Database for Quantifying Embedded Water/Energy in a Water Treatment System
Parameters Units Value Total Number of Flocculators ea 1+1 Stage 1 G 1/s 35 Stage 2 G 1/s 21 Stage 3 G 1/s 10 Sedimentation Total Number of Sedimentation Basins ea 1+1 Sedimentation Basins Retention Time min 120 Surface Loading Rate gpm/sf 0.72 Side Water Depth ft 14 Freeboard ft 2 Total Sedimentation Basin Depth ft 16 Total Number of Scrapper ea 1+1 Sedimentation - Concrete Rectangular
Basin Length ft 100 Basin Width ft 100 Sedimentation - Concrete Circular
Basin Diameter ft 111 Filtration Type of Filter Box
Rectangular Concrete
Type of Filter Media
Dual Media Total Number of Filters ea 4+1 Surface Loading Rate gpm/sf 6 Side Water Depth ft 18 Freeboard ft 2 Total Filter Depth ft 20 Basin Length ft 25 Basin Width ft 13 Type of Media
Dual Media
Depth of Media
Anthracite in 24 Sand in 12 Gravel in 6 Chemical: Sodium Hypochlorite Type of Chemicals
Sodium Hypochlorite 12.5%
Dosage mg/L 5 Design Storage day 30 Total Number of Storage Tank ea 2

November 2012 23 pw://Carollo/Documents/Client/CO/WRF/9005A00/Deliverables/LCI-LCIA Report (Final)
Table 5 Conceptual Case Study Inputs Phase 1 - Proof of Concept: Using Life Cycle Inventory and Life Cycle Impact Assessment Database for Quantifying Embedded Water/Energy in a Water Treatment System
Parameters Units Value Chemical Storage Tank Volume gallons 5000 Chemical Storage Tank Material
Fiberglass
Total Number of Metering Pumps ea 1+1 Miscellaneous Equipment Size HP 0.2 Chlorine Contact Basin Type of Chlorine Contact Basin
Rectangular Concrete
Total Number of Chlorine Contact Basin ea 1+1 Chlorine Contact Basin Retention Time min 30 Side Water Depth ft 14 Freeboard ft 2 Total Chlorine Contact Basin Depth ft 16 Basin Length ft 45 Basin Width ft 45 Total Number of Rapid Mix ea 2 Rapid Mix Retention Time min 0.5 Total Rapid Mix Depth ft 16 Basin Length ft 6 Basin Width ft 6 Total Number of Mixers ea 1+1 G Value 1/s 500 Break Horsepower (BHP) HP 4 Efficiency
0.65
Motor Efficiency
0.95 Motor Size HP 6 Power Consumption kWh/year 40,680

November 2012 24 pw://Carollo/Documents/Client/CO/WRF/9005A00/Deliverables/LCI-LCIA Report (Final)
Table 6 Life Cycle Inventory Data Phase 1 - Proof of Concept: Using Life Cycle Inventory and Life Cycle Impact Assessment Database for Quantifying Embedded Water/Energy in a Water Treatment System
Unit 1 1 1 1 1 1 1 1 Process Raw Water Pumping Chemical_Alum Chemical_Sulfuric Coagulation Sedimentation Filtration Chemical_Hypo Chlorine Contact Total
Equipment Pumps and Compressors USD 1.97E+04 0.00E+00 0.00E+00 2.54E+05 1.90E+05 1.24E+04 0.00E+00 3.20E+04 5.08E+05
Blowers and Fans USD 0.00E+00 0.00E+00 0.00E+00 0.00E+00 0.00E+00 1.86E+04 0.00E+00 0.00E+00 1.86E+04
Measuring and Dispensing Pumps USD 0.00E+00 5.00E+03 5.00E+03 0.00E+00 0.00E+00 0.00E+00 5.00E+03 0.00E+00 1.50E+04
Conveyors and Conveying Equipment USD 0.00E+00 0.00E+00 0.00E+00 0.00E+00 0.00E+00 0.00E+00 0.00E+00 0.00E+00 0.00E+00
Industrial Trucks and Tractors USD 0.00E+00 0.00E+00 0.00E+00 0.00E+00 0.00E+00 0.00E+00 0.00E+00 0.00E+00 0.00E+00
Pipe, Valves, and Pipe Fittings USD 0.00E+00 0.00E+00 0.00E+00 0.00E+00 0.00E+00 0.00E+00 0.00E+00 0.00E+00 0.00E+00
Plumbing Fixture Fittings and Trim USD 0.00E+00 0.00E+00 0.00E+00 0.00E+00 0.00E+00 0.00E+00 0.00E+00 0.00E+00 0.00E+00
Turbines and Turbine Generator Sets USD 0.00E+00 0.00E+00 0.00E+00 0.00E+00 0.00E+00 0.00E+00 0.00E+00 0.00E+00 0.00E+00
Motors and Generators USD 0.00E+00 0.00E+00 0.00E+00 0.00E+00 0.00E+00 0.00E+00 0.00E+00 0.00E+00 0.00E+00
Water Supply and Sewerage Systems USD 0.00E+00 0.00E+00 0.00E+00 0.00E+00 0.00E+00 0.00E+00 0.00E+00 0.00E+00 0.00E+00
Material
Reinforcing Steel kg 6.31E+04 3.21E+00 1.30E+00 5.87E+04 1.57E+05 3.38E+04 2.02E+00 1.09E+05 4.21E+05
Concrete, Normal m3 4.59E+02 3.85E+04 1.62E+04 4.80E+02 1.23E+03 2.66E+02 2.46E+04 7.53E+02 8.24E+04
Concrete (Reinforced) kg 0.00E+00 0.00E+00 0.00E+00 0.00E+00 0.00E+00 0.00E+00 0.00E+00 0.00E+00 0.00E+00
Brick kg 0.00E+00 0.00E+00 0.00E+00 0.00E+00 0.00E+00 0.00E+00 0.00E+00 0.00E+00 0.00E+00
Wood Board kg 0.00E+00 0.00E+00 0.00E+00 0.00E+00 0.00E+00 0.00E+00 0.00E+00 0.00E+00 0.00E+00
Sand kg 0.00E+00 0.00E+00 0.00E+00 0.00E+00 0.00E+00 1.70E+05 0.00E+00 0.00E+00 1.70E+05
Hard Coal Mix, at Regional Storage kg 0.00E+00 0.00E+00 0.00E+00 0.00E+00 0.00E+00 1.48E+05 0.00E+00 0.00E+00 1.48E+05
Gravel kg 0.00E+00 0.00E+00 0.00E+00 0.00E+00 0.00E+00 7.39E+04 0.00E+00 0.00E+00 7.39E+04
HDPE pipes kg 0.00E+00 0.00E+00 0.00E+00 0.00E+00 0.00E+00 1.26E+05 0.00E+00 0.00E+00 1.26E+05
PVC pipe kg 1.03E+04 0.00E+00 0.00E+00 2.06E+03 2.06E+03 4.12E+03 0.00E+00 2.06E+03 2.06E+04
Glass Fiber Reinforced Plastic, Polyamide, Injection Molding kg 0.00E+00 0.00E+00 0.00E+00 0.00E+00 0.00E+00 0.00E+00 0.00E+00 0.00E+00 0.00E+00
Glass Fiber Reinforced Plastic, Polyester Resin, Hand Lay-Up kg 0.00E+00 3.18E+03 6.36E+02 0.00E+00 8.37E+03 2.71E+03 1.59E+03 0.00E+00 1.65E+04
Polyethylene, HDPE, Granulate kg 0.00E+00 0.00E+00 0.00E+00 0.00E+00 0.00E+00 0.00E+00 0.00E+00 0.00E+00 0.00E+00
St13 I - Material kg 0.00E+00 0.00E+00 0.00E+00 0.00E+00 0.00E+00 0.00E+00 0.00E+00 0.00E+00 0.00E+00
Copper I - Material kg 0.00E+00 0.00E+00 0.00E+00 0.00E+00 0.00E+00 0.00E+00 0.00E+00 0.00E+00 0.00E+00
Copper Product Manufacturing, Average Metal Working kg 0.00E+00 0.00E+00 0.00E+00 0.00E+00 0.00E+00 0.00E+00 0.00E+00 0.00E+00 0.00E+00
Aluminum, Production Mix - Material kg 0.00E+00 0.00E+00 0.00E+00 0.00E+00 0.00E+00 0.00E+00 0.00E+00 0.00E+00 0.00E+00
Aluminum Product Manufacturing, Average Metal Working kg 0.00E+00 0.00E+00 0.00E+00 0.00E+00 0.00E+00 0.00E+00 0.00E+00 0.00E+00 0.00E+00

November 2012 25 pw://Carollo/Documents/Client/CO/WRF/9005A00/Deliverables/LCI-LCIA Report (Final)
Table 6 Life Cycle Inventory Data Phase 1 - Proof of Concept: Using Life Cycle Inventory and Life Cycle Impact Assessment Database for Quantifying Embedded Water/Energy in a Water Treatment System
Unit 1 1 1 1 1 1 1 1 Process Raw Water Pumping Chemical_Alum Chemical_Sulfuric Coagulation Sedimentation Filtration Chemical_Hypo Chlorine Contact Total
Chemical
Sodium Hydroxide, 50% in H2O, Production Mix kg 0.00E+00 0.00E+00 0.00E+00 0.00E+00 0.00E+00 0.00E+00 0.00E+00 0.00E+00 0.00E+00
Sodium Hypochlorite, 15% in H2O kg 0.00E+00 0.00E+00 0.00E+00 0.00E+00 0.00E+00 0.00E+00 1.11E+07 0.00E+00 1.11E+07
Lime, Hydrated, Packed kg 0.00E+00 0.00E+00 0.00E+00 0.00E+00 0.00E+00 0.00E+00 0.00E+00 0.00E+00 0.00E+00
Quicklime, Milled, Packed kg 0.00E+00 0.00E+00 0.00E+00 0.00E+00 0.00E+00 0.00E+00 0.00E+00 0.00E+00 0.00E+00
Sulfuric Acid, Liquid kg 0.00E+00 0.00E+00 5.94E+06 0.00E+00 0.00E+00 0.00E+00 0.00E+00 0.00E+00 5.94E+06
Aluminum Sulfate, Powder kg 0.00E+00 2.21E+07 0.00E+00 0.00E+00 0.00E+00 0.00E+00 0.00E+00 0.00E+00 2.21E+07
Iron (III) Chloride, 40% in H2O kg 0.00E+00 0.00E+00 0.00E+00 0.00E+00 0.00E+00 0.00E+00 0.00E+00 0.00E+00 0.00E+00
Hydrochloric Acid, from the Reaction of Hydrogen With Chlorine kg 0.00E+00 0.00E+00 0.00E+00 0.00E+00 0.00E+00 0.00E+00 0.00E+00 0.00E+00 0.00E+00
Hydrochloric Acid, 30% in H2O kg 0.00E+00 0.00E+00 0.00E+00 0.00E+00 0.00E+00 0.00E+00 0.00E+00 0.00E+00 0.00E+00
Phosphoric Acid, Industrial Grade, 85% in H2O kg 0.00E+00 0.00E+00 0.00E+00 0.00E+00 0.00E+00 0.00E+00 0.00E+00 0.00E+00 0.00E+00
Ammonium Sulfate, as N, at Regional Storehouse kg 0.00E+00 0.00E+00 0.00E+00 0.00E+00 0.00E+00 0.00E+00 0.00E+00 0.00E+00 0.00E+00
Energy
Electricity, High Voltage, at Grid kWh 1.64E+07 3.14E+05 3.14E+05 2.01E+06 1.06E+06 6.40E+05 3.14E+05 8.14E+05 2.19E+07
Natural Gas, at Consumer MJ 0.00E+00 0.00E+00 0.00E+00 0.00E+00 0.00E+00 0.00E+00 0.00E+00 0.00E+00 0.00E+00

November 2012 26 pw://Carollo/Documents/Client/CO/WRF/9005A00/Deliverables/LCI-LCIA Report (Final)
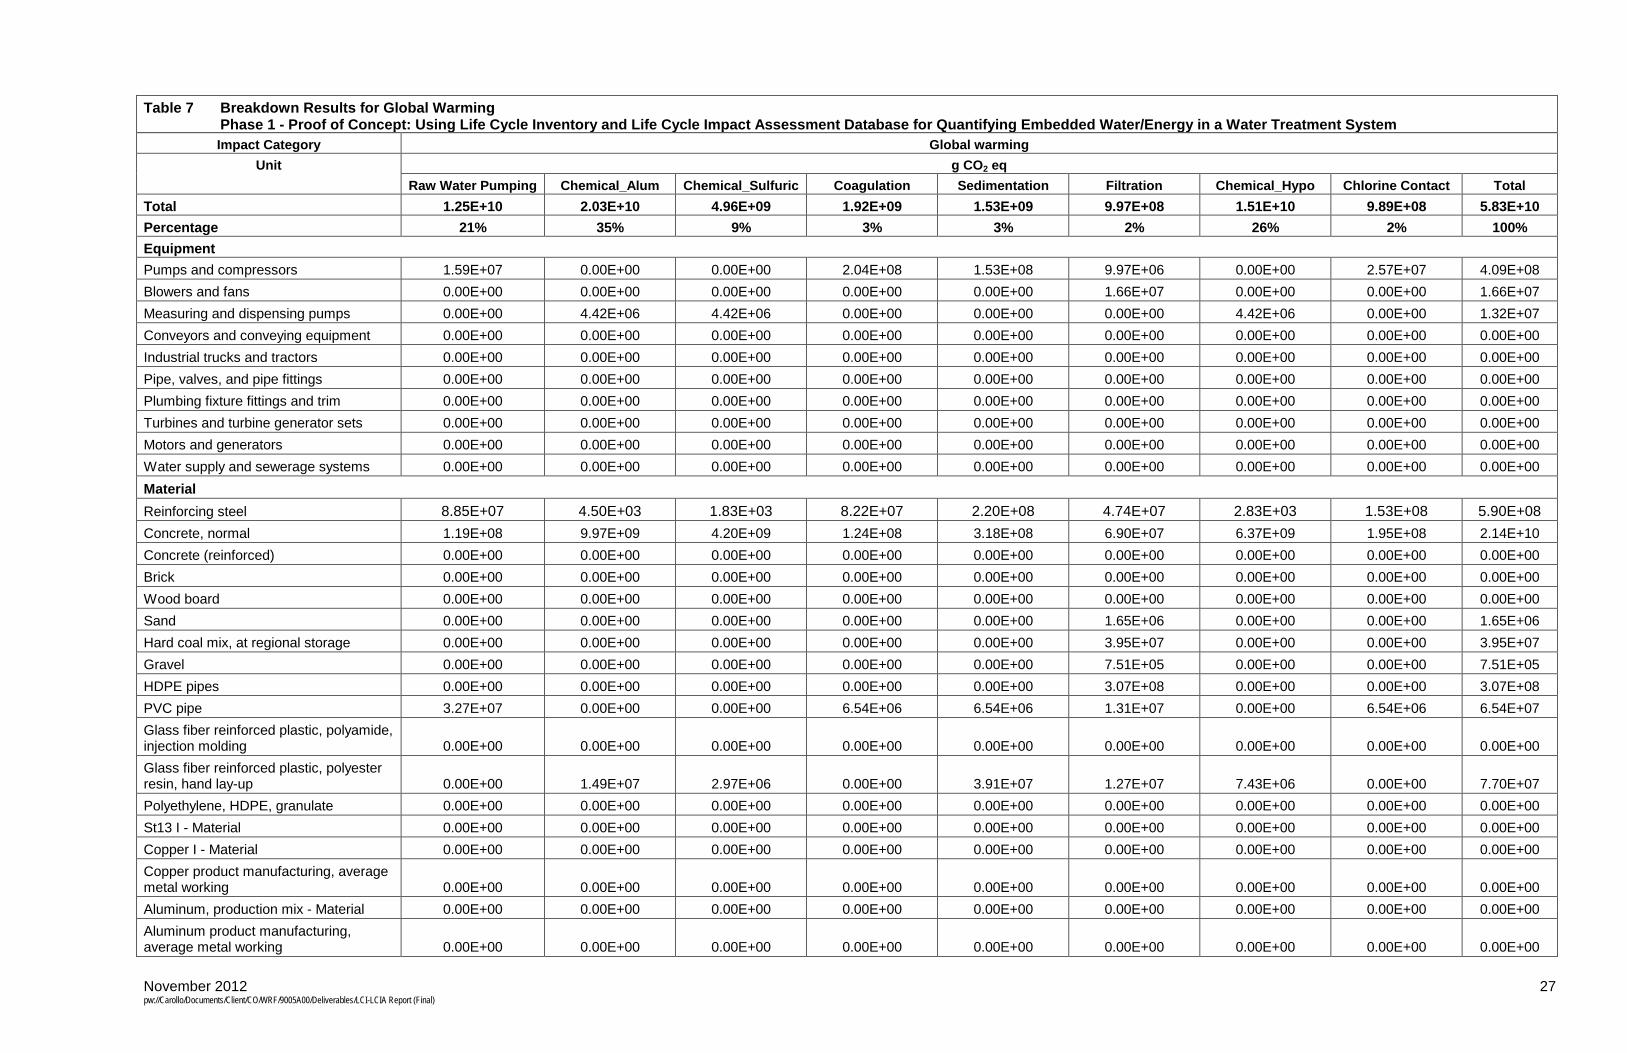
6.1 Carbon Emissions Results
Table 7 and Figure 6 present a breakdown analysis of global warming potential expressed in g CO2 equivalent. It was observed that the operational phase contributions (energy for raw water pumping and chemical usage) dominant the overall emission of CO2. The capital (concrete and equipment) produces less than 20 percent contributions to global warming. This is consistent with findings by other LCAs that the operation stage instead of the capital usually represents more than 70 percent of the overall impact (Friedrich 2002).
Figure 6 Global Warming Potential (in g CO2 equivalent) Breakdown by Process
November 2012 27 pw://Carollo/Documents/Client/CO/WRF/9005A00/Deliverables/LCI-LCIA Report (Final)
Table 7 Breakdown Results for Global Warming Phase 1 - Proof of Concept: Using Life Cycle Inventory and Life Cycle Impact Assessment Database for Quantifying Embedded Water/Energy in a Water Treatment System Impact Category Global warming
Unit g CO2 eq
Raw Water Pumping Chemical_Alum Chemical_Sulfuric Coagulation Sedimentation Filtration Chemical_Hypo Chlorine Contact Total
Total 1.25E+10 2.03E+10 4.96E+09 1.92E+09 1.53E+09 9.97E+08 1.51E+10 9.89E+08 5.83E+10 Percentage 21% 35% 9% 3% 3% 2% 26% 2% 100% Equipment
Pumps and compressors 1.59E+07 0.00E+00 0.00E+00 2.04E+08 1.53E+08 9.97E+06 0.00E+00 2.57E+07 4.09E+08 Blowers and fans 0.00E+00 0.00E+00 0.00E+00 0.00E+00 0.00E+00 1.66E+07 0.00E+00 0.00E+00 1.66E+07 Measuring and dispensing pumps 0.00E+00 4.42E+06 4.42E+06 0.00E+00 0.00E+00 0.00E+00 4.42E+06 0.00E+00 1.32E+07 Conveyors and conveying equipment 0.00E+00 0.00E+00 0.00E+00 0.00E+00 0.00E+00 0.00E+00 0.00E+00 0.00E+00 0.00E+00 Industrial trucks and tractors 0.00E+00 0.00E+00 0.00E+00 0.00E+00 0.00E+00 0.00E+00 0.00E+00 0.00E+00 0.00E+00 Pipe, valves, and pipe fittings 0.00E+00 0.00E+00 0.00E+00 0.00E+00 0.00E+00 0.00E+00 0.00E+00 0.00E+00 0.00E+00 Plumbing fixture fittings and trim 0.00E+00 0.00E+00 0.00E+00 0.00E+00 0.00E+00 0.00E+00 0.00E+00 0.00E+00 0.00E+00 Turbines and turbine generator sets 0.00E+00 0.00E+00 0.00E+00 0.00E+00 0.00E+00 0.00E+00 0.00E+00 0.00E+00 0.00E+00 Motors and generators 0.00E+00 0.00E+00 0.00E+00 0.00E+00 0.00E+00 0.00E+00 0.00E+00 0.00E+00 0.00E+00 Water supply and sewerage systems 0.00E+00 0.00E+00 0.00E+00 0.00E+00 0.00E+00 0.00E+00 0.00E+00 0.00E+00 0.00E+00 Material
Reinforcing steel 8.85E+07 4.50E+03 1.83E+03 8.22E+07 2.20E+08 4.74E+07 2.83E+03 1.53E+08 5.90E+08 Concrete, normal 1.19E+08 9.97E+09 4.20E+09 1.24E+08 3.18E+08 6.90E+07 6.37E+09 1.95E+08 2.14E+10 Concrete (reinforced) 0.00E+00 0.00E+00 0.00E+00 0.00E+00 0.00E+00 0.00E+00 0.00E+00 0.00E+00 0.00E+00 Brick 0.00E+00 0.00E+00 0.00E+00 0.00E+00 0.00E+00 0.00E+00 0.00E+00 0.00E+00 0.00E+00 Wood board 0.00E+00 0.00E+00 0.00E+00 0.00E+00 0.00E+00 0.00E+00 0.00E+00 0.00E+00 0.00E+00 Sand 0.00E+00 0.00E+00 0.00E+00 0.00E+00 0.00E+00 1.65E+06 0.00E+00 0.00E+00 1.65E+06 Hard coal mix, at regional storage 0.00E+00 0.00E+00 0.00E+00 0.00E+00 0.00E+00 3.95E+07 0.00E+00 0.00E+00 3.95E+07 Gravel 0.00E+00 0.00E+00 0.00E+00 0.00E+00 0.00E+00 7.51E+05 0.00E+00 0.00E+00 7.51E+05 HDPE pipes 0.00E+00 0.00E+00 0.00E+00 0.00E+00 0.00E+00 3.07E+08 0.00E+00 0.00E+00 3.07E+08 PVC pipe 3.27E+07 0.00E+00 0.00E+00 6.54E+06 6.54E+06 1.31E+07 0.00E+00 6.54E+06 6.54E+07 Glass fiber reinforced plastic, polyamide, injection molding 0.00E+00 0.00E+00 0.00E+00 0.00E+00 0.00E+00 0.00E+00 0.00E+00 0.00E+00 0.00E+00 Glass fiber reinforced plastic, polyester resin, hand lay-up 0.00E+00 1.49E+07 2.97E+06 0.00E+00 3.91E+07 1.27E+07 7.43E+06 0.00E+00 7.70E+07 Polyethylene, HDPE, granulate 0.00E+00 0.00E+00 0.00E+00 0.00E+00 0.00E+00 0.00E+00 0.00E+00 0.00E+00 0.00E+00 St13 I - Material 0.00E+00 0.00E+00 0.00E+00 0.00E+00 0.00E+00 0.00E+00 0.00E+00 0.00E+00 0.00E+00 Copper I - Material 0.00E+00 0.00E+00 0.00E+00 0.00E+00 0.00E+00 0.00E+00 0.00E+00 0.00E+00 0.00E+00 Copper product manufacturing, average metal working 0.00E+00 0.00E+00 0.00E+00 0.00E+00 0.00E+00 0.00E+00 0.00E+00 0.00E+00 0.00E+00 Aluminum, production mix - Material 0.00E+00 0.00E+00 0.00E+00 0.00E+00 0.00E+00 0.00E+00 0.00E+00 0.00E+00 0.00E+00 Aluminum product manufacturing, average metal working 0.00E+00 0.00E+00 0.00E+00 0.00E+00 0.00E+00 0.00E+00 0.00E+00 0.00E+00 0.00E+00

November 2012 28 pw://Carollo/Documents/Client/CO/WRF/9005A00/Deliverables/LCI-LCIA Report (Final)
Table 7 Breakdown Results for Global Warming Phase 1 - Proof of Concept: Using Life Cycle Inventory and Life Cycle Impact Assessment Database for Quantifying Embedded Water/Energy in a Water Treatment System Impact Category Global warming
Unit g CO2 eq
Raw Water Pumping Chemical_Alum Chemical_Sulfuric Coagulation Sedimentation Filtration Chemical_Hypo Chlorine Contact Total
Chemical Sodium hydroxide, 50% in H2O,
production mix 0.00E+00 0.00E+00 0.00E+00 0.00E+00 0.00E+00 0.00E+00 0.00E+00 0.00E+00 0.00E+00 Sodium hypochlorite, 15% in H2O 0.00E+00 0.00E+00 0.00E+00 0.00E+00 0.00E+00 0.00E+00 8.44E+09 0.00E+00 8.44E+09 Lime, hydrated, packed 0.00E+00 0.00E+00 0.00E+00 0.00E+00 0.00E+00 0.00E+00 0.00E+00 0.00E+00 0.00E+00 Quicklime, milled, packed 0.00E+00 0.00E+00 0.00E+00 0.00E+00 0.00E+00 0.00E+00 0.00E+00 0.00E+00 0.00E+00 Sulfuric acid, liquid 0.00E+00 0.00E+00 5.11E+08 0.00E+00 0.00E+00 0.00E+00 0.00E+00 0.00E+00 5.11E+08 Aluminum sulfate, powder 0.00E+00 1.01E+10 0.00E+00 0.00E+00 0.00E+00 0.00E+00 0.00E+00 0.00E+00 1.01E+10 Iron (III) chloride, 40% in H2O 0.00E+00 0.00E+00 0.00E+00 0.00E+00 0.00E+00 0.00E+00 0.00E+00 0.00E+00 0.00E+00 Hydrochloric acid, from the reaction of hydrogen with chlorine 0.00E+00 0.00E+00 0.00E+00 0.00E+00 0.00E+00 0.00E+00 0.00E+00 0.00E+00 0.00E+00 Hydrochloric acid, 30% in H2O 0.00E+00 0.00E+00 0.00E+00 0.00E+00 0.00E+00 0.00E+00 0.00E+00 0.00E+00 0.00E+00 Phosphoric acid, industrial grade, 85% in H2O 0.00E+00 0.00E+00 0.00E+00 0.00E+00 0.00E+00 0.00E+00 0.00E+00 0.00E+00 0.00E+00 Ammonium sulfate, as N, at regional storehouse 0.00E+00 0.00E+00 0.00E+00 0.00E+00 0.00E+00 0.00E+00 0.00E+00 0.00E+00 0.00E+00 Energy
Electricity, high voltage, at grid 1.23E+10 2.35E+08 2.35E+08 1.50E+09 7.91E+08 4.79E+08 2.35E+08 6.09E+08 1.64E+10 Natural gas, at consumer 0.00E+00 0.00E+00 0.00E+00 0.00E+00 0.00E+00 0.00E+00 0.00E+00 0.00E+00 0.00E+00
November 2012 29 pw://Carollo/Documents/Client/CO/WRF/9005A00/Deliverables/LCI-LCIA Report (Final)
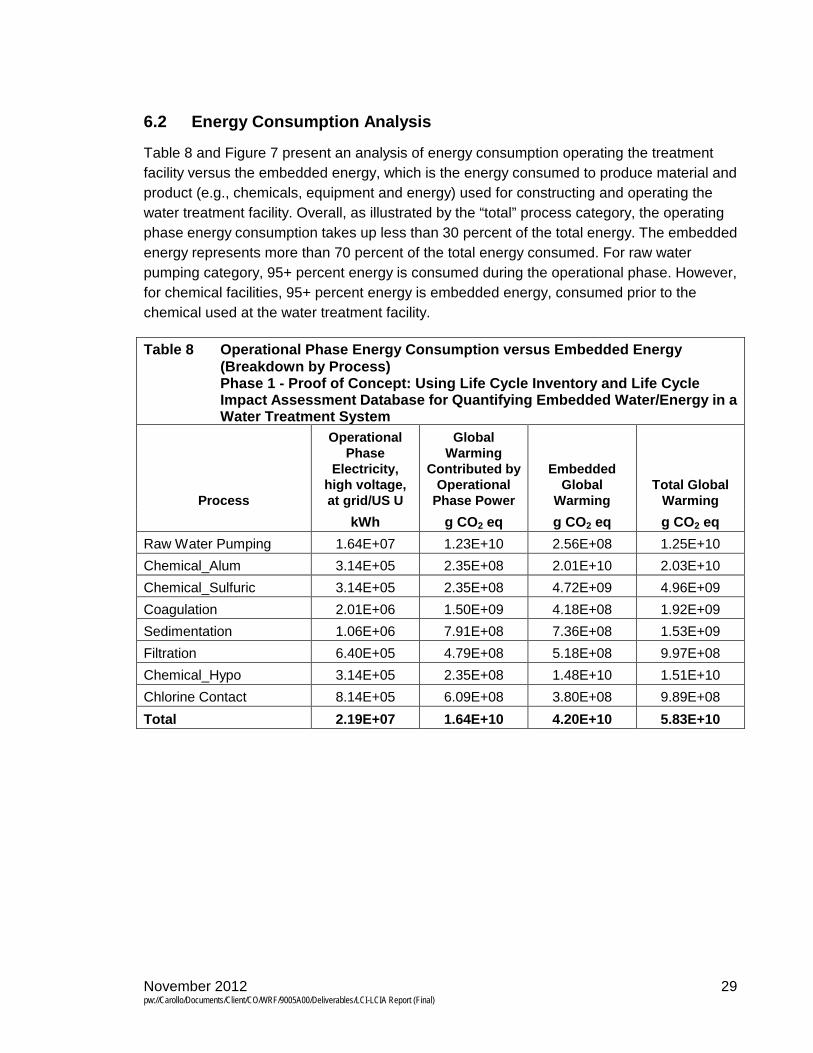
6.2 Energy Consumption Analysis
Table 8 and Figure 7 present an analysis of energy consumption operating the treatment facility versus the embedded energy, which is the energy consumed to produce material and product (e.g., chemicals, equipment and energy) used for constructing and operating the water treatment facility. Overall, as illustrated by the “total” process category, the operating phase energy consumption takes up less than 30 percent of the total energy. The embedded energy represents more than 70 percent of the total energy consumed. For raw water pumping category, 95+ percent energy is consumed during the operational phase. However, for chemical facilities, 95+ percent energy is embedded energy, consumed prior to the chemical used at the water treatment facility.
Table 8 Operational Phase Energy Consumption versus Embedded Energy (Breakdown by Process) Phase 1 - Proof of Concept: Using Life Cycle Inventory and Life Cycle Impact Assessment Database for Quantifying Embedded Water/Energy in a Water Treatment System
Process
Operational Phase
Electricity, high voltage, at grid/US U
Global Warming
Contributed by Operational
Phase Power
Embedded Global
Warming Total Global
Warming kWh g CO2 eq g CO2 eq g CO2 eq Raw Water Pumping 1.64E+07 1.23E+10 2.56E+08 1.25E+10 Chemical_Alum 3.14E+05 2.35E+08 2.01E+10 2.03E+10 Chemical_Sulfuric 3.14E+05 2.35E+08 4.72E+09 4.96E+09 Coagulation 2.01E+06 1.50E+09 4.18E+08 1.92E+09 Sedimentation 1.06E+06 7.91E+08 7.36E+08 1.53E+09 Filtration 6.40E+05 4.79E+08 5.18E+08 9.97E+08 Chemical_Hypo 3.14E+05 2.35E+08 1.48E+10 1.51E+10 Chlorine Contact 8.14E+05 6.09E+08 3.80E+08 9.89E+08 Total 2.19E+07 1.64E+10 4.20E+10 5.83E+10

November 2012 30 pw://Carollo/Documents/Client/CO/WRF/9005A00/Deliverables/LCI-LCIA Report (Final)
Figure 7 Operational Phase Energy Consumption versus Embedded Energy
(Breakdown by Process)
6.3 Embedded Water Results
Table 9 and Figure 8 present a breakdown analysis of embedded water expressed in liters. Similar to the global warming impact, the operational phase contributions (raw water pumping and chemical usage) dominant the intake of water resource. The capital (concrete and equipment) produces less than 5 percent contributions to embedded water. For the purpose of this analysis, the raw water intake to the water treatment facility and the water used on the water treatment plant site was not included. The results represent the embedded water consumed to produce the construction material, chemicals, energy, etc. associated with the conceptual treatment facility on the entire life cycle (i.e., 10 mgd treated water for 20 years).
Figure 8 Embedded Water (in Liters) Breakdown by Process
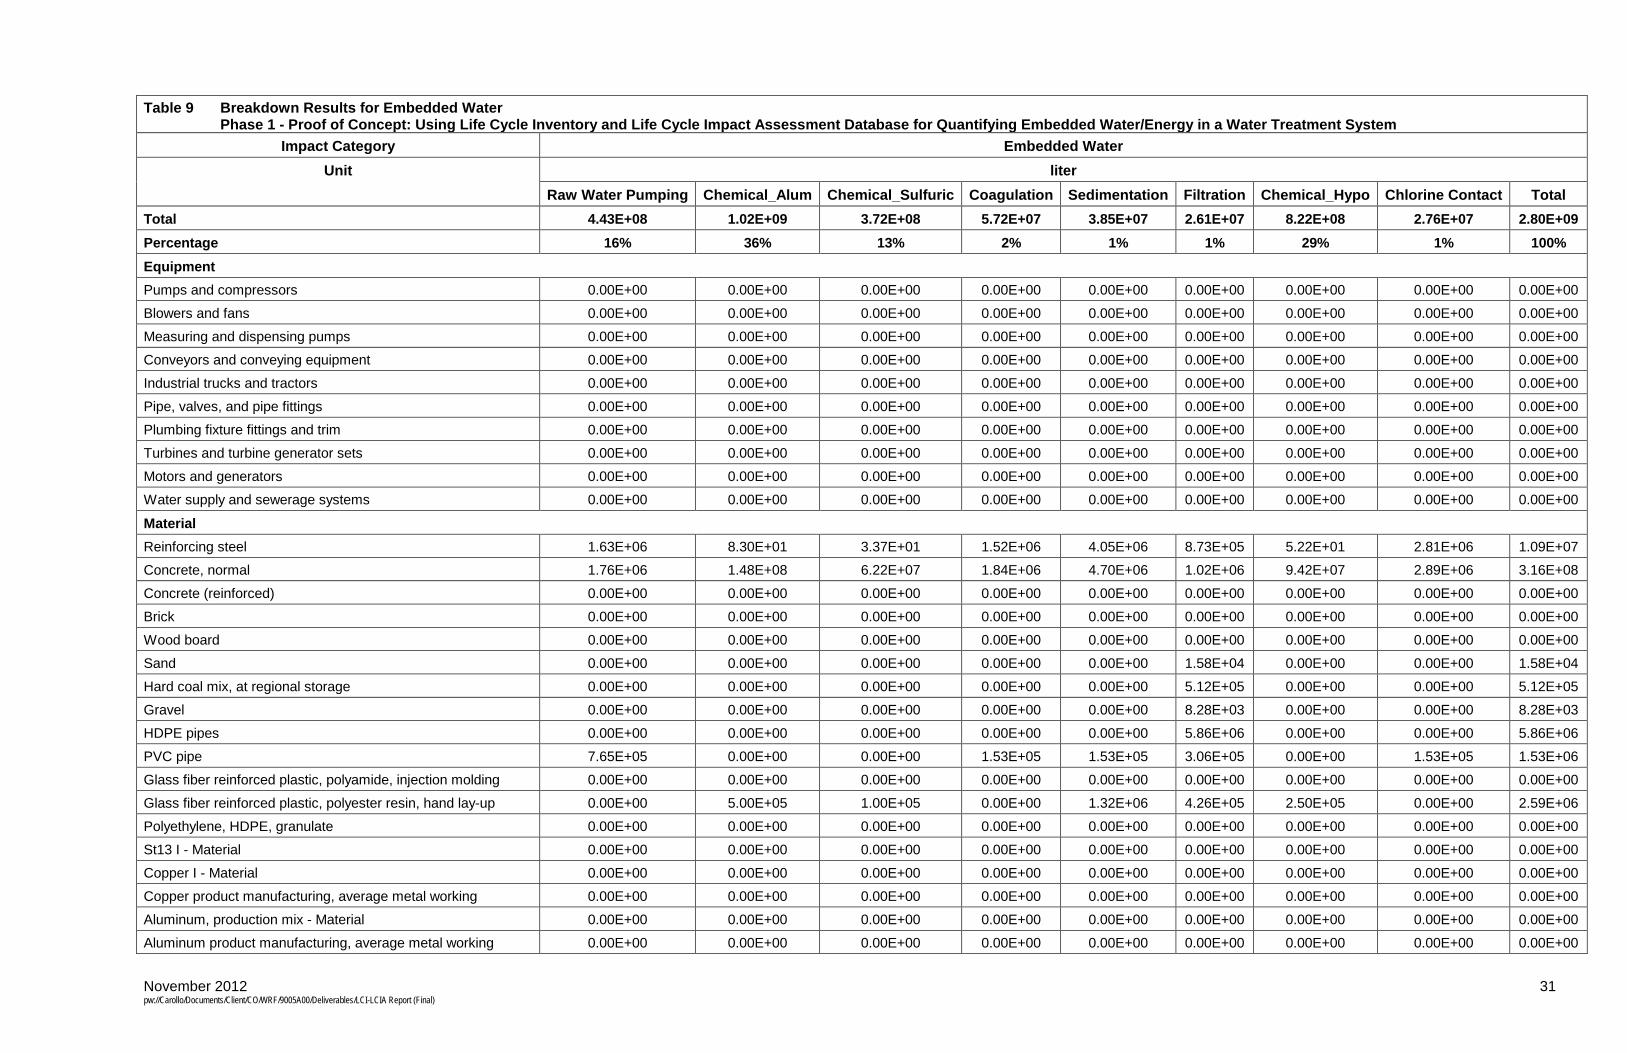
November 2012 31 pw://Carollo/Documents/Client/CO/WRF/9005A00/Deliverables/LCI-LCIA Report (Final)
Table 9 Breakdown Results for Embedded Water Phase 1 - Proof of Concept: Using Life Cycle Inventory and Life Cycle Impact Assessment Database for Quantifying Embedded Water/Energy in a Water Treatment System
Impact Category Embedded Water Unit liter
Raw Water Pumping Chemical_Alum Chemical_Sulfuric Coagulation Sedimentation Filtration Chemical_Hypo Chlorine Contact Total
Total 4.43E+08 1.02E+09 3.72E+08 5.72E+07 3.85E+07 2.61E+07 8.22E+08 2.76E+07 2.80E+09 Percentage 16% 36% 13% 2% 1% 1% 29% 1% 100% Equipment
Pumps and compressors 0.00E+00 0.00E+00 0.00E+00 0.00E+00 0.00E+00 0.00E+00 0.00E+00 0.00E+00 0.00E+00
Blowers and fans 0.00E+00 0.00E+00 0.00E+00 0.00E+00 0.00E+00 0.00E+00 0.00E+00 0.00E+00 0.00E+00
Measuring and dispensing pumps 0.00E+00 0.00E+00 0.00E+00 0.00E+00 0.00E+00 0.00E+00 0.00E+00 0.00E+00 0.00E+00
Conveyors and conveying equipment 0.00E+00 0.00E+00 0.00E+00 0.00E+00 0.00E+00 0.00E+00 0.00E+00 0.00E+00 0.00E+00
Industrial trucks and tractors 0.00E+00 0.00E+00 0.00E+00 0.00E+00 0.00E+00 0.00E+00 0.00E+00 0.00E+00 0.00E+00
Pipe, valves, and pipe fittings 0.00E+00 0.00E+00 0.00E+00 0.00E+00 0.00E+00 0.00E+00 0.00E+00 0.00E+00 0.00E+00
Plumbing fixture fittings and trim 0.00E+00 0.00E+00 0.00E+00 0.00E+00 0.00E+00 0.00E+00 0.00E+00 0.00E+00 0.00E+00
Turbines and turbine generator sets 0.00E+00 0.00E+00 0.00E+00 0.00E+00 0.00E+00 0.00E+00 0.00E+00 0.00E+00 0.00E+00
Motors and generators 0.00E+00 0.00E+00 0.00E+00 0.00E+00 0.00E+00 0.00E+00 0.00E+00 0.00E+00 0.00E+00
Water supply and sewerage systems 0.00E+00 0.00E+00 0.00E+00 0.00E+00 0.00E+00 0.00E+00 0.00E+00 0.00E+00 0.00E+00
Material
Reinforcing steel 1.63E+06 8.30E+01 3.37E+01 1.52E+06 4.05E+06 8.73E+05 5.22E+01 2.81E+06 1.09E+07
Concrete, normal 1.76E+06 1.48E+08 6.22E+07 1.84E+06 4.70E+06 1.02E+06 9.42E+07 2.89E+06 3.16E+08
Concrete (reinforced) 0.00E+00 0.00E+00 0.00E+00 0.00E+00 0.00E+00 0.00E+00 0.00E+00 0.00E+00 0.00E+00
Brick 0.00E+00 0.00E+00 0.00E+00 0.00E+00 0.00E+00 0.00E+00 0.00E+00 0.00E+00 0.00E+00
Wood board 0.00E+00 0.00E+00 0.00E+00 0.00E+00 0.00E+00 0.00E+00 0.00E+00 0.00E+00 0.00E+00
Sand 0.00E+00 0.00E+00 0.00E+00 0.00E+00 0.00E+00 1.58E+04 0.00E+00 0.00E+00 1.58E+04
Hard coal mix, at regional storage 0.00E+00 0.00E+00 0.00E+00 0.00E+00 0.00E+00 5.12E+05 0.00E+00 0.00E+00 5.12E+05
Gravel 0.00E+00 0.00E+00 0.00E+00 0.00E+00 0.00E+00 8.28E+03 0.00E+00 0.00E+00 8.28E+03
HDPE pipes 0.00E+00 0.00E+00 0.00E+00 0.00E+00 0.00E+00 5.86E+06 0.00E+00 0.00E+00 5.86E+06
PVC pipe 7.65E+05 0.00E+00 0.00E+00 1.53E+05 1.53E+05 3.06E+05 0.00E+00 1.53E+05 1.53E+06
Glass fiber reinforced plastic, polyamide, injection molding 0.00E+00 0.00E+00 0.00E+00 0.00E+00 0.00E+00 0.00E+00 0.00E+00 0.00E+00 0.00E+00
Glass fiber reinforced plastic, polyester resin, hand lay-up 0.00E+00 5.00E+05 1.00E+05 0.00E+00 1.32E+06 4.26E+05 2.50E+05 0.00E+00 2.59E+06
Polyethylene, HDPE, granulate 0.00E+00 0.00E+00 0.00E+00 0.00E+00 0.00E+00 0.00E+00 0.00E+00 0.00E+00 0.00E+00
St13 I - Material 0.00E+00 0.00E+00 0.00E+00 0.00E+00 0.00E+00 0.00E+00 0.00E+00 0.00E+00 0.00E+00
Copper I - Material 0.00E+00 0.00E+00 0.00E+00 0.00E+00 0.00E+00 0.00E+00 0.00E+00 0.00E+00 0.00E+00
Copper product manufacturing, average metal working 0.00E+00 0.00E+00 0.00E+00 0.00E+00 0.00E+00 0.00E+00 0.00E+00 0.00E+00 0.00E+00
Aluminum, production mix - Material 0.00E+00 0.00E+00 0.00E+00 0.00E+00 0.00E+00 0.00E+00 0.00E+00 0.00E+00 0.00E+00
Aluminum product manufacturing, average metal working 0.00E+00 0.00E+00 0.00E+00 0.00E+00 0.00E+00 0.00E+00 0.00E+00 0.00E+00 0.00E+00

November 2012 32 pw://Carollo/Documents/Client/CO/WRF/9005A00/Deliverables/LCI-LCIA Report (Final)
Table 9 Breakdown Results for Embedded Water Phase 1 - Proof of Concept: Using Life Cycle Inventory and Life Cycle Impact Assessment Database for Quantifying Embedded Water/Energy in a Water Treatment System
Impact Category Embedded Water Unit liter
Raw Water Pumping Chemical_Alum Chemical_Sulfuric Coagulation Sedimentation Filtration Chemical_Hypo Chlorine Contact Total
Chemical
Sodium hydroxide, 50% in H2O, production mix 0.00E+00 0.00E+00 0.00E+00 0.00E+00 0.00E+00 0.00E+00 0.00E+00 0.00E+00 0.00E+00
Sodium hypochlorite, 15% in H2O 0.00E+00 0.00E+00 0.00E+00 0.00E+00 0.00E+00 0.00E+00 7.19E+08 0.00E+00 7.19E+08
Lime, hydrated, packed 0.00E+00 0.00E+00 0.00E+00 0.00E+00 0.00E+00 0.00E+00 0.00E+00 0.00E+00 0.00E+00
Quicklime, milled, packed 0.00E+00 0.00E+00 0.00E+00 0.00E+00 0.00E+00 0.00E+00 0.00E+00 0.00E+00 0.00E+00
Sulfuric acid, liquid 0.00E+00 0.00E+00 3.01E+08 0.00E+00 0.00E+00 0.00E+00 0.00E+00 0.00E+00 3.01E+08
Aluminum sulfate, powder 0.00E+00 8.59E+08 0.00E+00 0.00E+00 0.00E+00 0.00E+00 0.00E+00 0.00E+00 8.59E+08
Iron (III) chloride, 40% in H2O 0.00E+00 0.00E+00 0.00E+00 0.00E+00 0.00E+00 0.00E+00 0.00E+00 0.00E+00 0.00E+00
Hydrochloric acid, from the reaction of hydrogen with chlorine 0.00E+00 0.00E+00 0.00E+00 0.00E+00 0.00E+00 0.00E+00 0.00E+00 0.00E+00 0.00E+00
Hydrochloric acid, 30% in H2O 0.00E+00 0.00E+00 0.00E+00 0.00E+00 0.00E+00 0.00E+00 0.00E+00 0.00E+00 0.00E+00
Phosphoric acid, industrial grade, 85% in H2O 0.00E+00 0.00E+00 0.00E+00 0.00E+00 0.00E+00 0.00E+00 0.00E+00 0.00E+00 0.00E+00
Ammonium sulfate, as N, at regional storehouse 0.00E+00 0.00E+00 0.00E+00 0.00E+00 0.00E+00 0.00E+00 0.00E+00 0.00E+00 0.00E+00
Energy
Electricity, high voltage, at grid 4.39E+08 8.39E+06 8.39E+06 5.37E+07 2.83E+07 1.71E+07 8.39E+06 2.18E+07 5.85E+08
Natural gas, at consumer 0.00E+00 0.00E+00 0.00E+00 0.00E+00 0.00E+00 0.00E+00 0.00E+00 0.00E+00 0.00E+00

November 2012 - DRAFT 33 pw://Carollo/Documents/Client/CO/WRF/9005A00/Deliverables/LCI-LCIA Report (Final)
6.4 Summary Results
Table 10 presents the carbon emission and embedded water associated with the conceptual water treatment facility. The results are presented in total carbon emission and embedded water for the 10-mgd treatment facility and per 1,000 gallons or 1,000 liters of water produced. Table 10 Summary Results
Phase 1 - Proof of Concept: Using Life Cycle Inventory and Life Cycle Impact Assessment Database for Quantifying Embedded Water/Energy in a Water Treatment System
Impact Category
Operational Phase
Electricity
Global Warming Contributed by
Operational Phase Power
Embedded Global
Warming Global
Warming Embedded
Water Unit kWh g CO2 eq g CO2 eq g CO2 eq liters
Entire Water Treatment Facility 2.19E+07 1.64E+10 4.20E+10 5.83E+10 2.80E+09
Total per 1,000 gallons of Water Produced
2.99E-01 2.24E+02 5.75E+02 7.99E+02 3.84E+01
Total per 1,000 liters of Water Produced 7.91E-02 5.92E+01 1.52E+02 2.11E+02 1.01E+01
NoteBase on 10-mgd water treatment facility, producing 7.30E+10 gallons of water or 2.76E+11 liters of water on a 20-year life cycle.
:
6.5 Limitations and Data Gaps
Besides the most commonly used construction material such as concrete, steel, aluminum, many other materials used in the water industry may not be easily identified in the existing LCA database. Most LCA studies, including the Phase 1 study of this project, concluded that the capital (material consumption and equipment) usually represents less than 30 percent of the overall impact. Details such as ethylene propylene diene monomer (EPDM) gaskets and rubber liner of a ductile iron resilient wedge gate valve may not produce any significance in the overall evaluation. However, oversimplification may also compromise the accuracy of LCA studies. Future research is recommended to prioritize the data collection efforts and strategically collect typical details that can be commonly used in water treatment LCA.
Ecoinvent database includes several categories for equipment, expressed in US$. These categories include pumps and compressors, blowers and fans, measuring and dispensing pumps, conveyors and conveying equipment, industrial trucks and tractors, pipe, valves, and pipe fittings, plumbing fixture fittings and trim, turbines and turbine generator sets, motors and generators, water supply and sewerage systems, etc. However, this cannot cover all equipment used in the water treatment processes. For example, sludge scrapper, mixer, and flocculator do not fit in any of these categories directly. Moreover, knowing that the categories

November 2012 - DRAFT 34 pw://Carollo/Documents/Client/CO/WRF/9005A00/Deliverables/LCI-LCIA Report (Final)
do not distinguish motor sizes and type of pumps/compressors the data accuracy is questionable.
Without extensive data collection and analysis, it is difficult to account for the weight / quantity of certain materials consumed for a treatment facility component. For example, Ecoinvent database has a few data entry for different type of FRP material, expressed in kg and labeled as “Glass fiber reinforced plastic, polyamide, injection molding” and “Glass fiber reinforced plastic, polyester resin, hand lay-up”. The Phase 1 database took a simplified approach by estimating the weight of the FRP tank after it is sized (e.g., 3,500 lb for a 10,000-gallon tank based on shop drawings for reference projects). Detailed trade knowledge on how an FRP tank is manufactured and how much energy and natural resources are consumed during the manufacturing process should be obtained in future research phases.
Ecoinvent database contains cast iron as a material, but no information on cast iron / ductile iron pipe can be found. The database does include PVC and HDPE pipe, expressed by weight. The spreadsheet developed for this phase of project collected some data (e.g., weight per linear foot) for various pipe sizes and product grade. Such data are often readily available from equipment manufacturers. It is recommended that extensive data collection should be conducted for other piping material in future research phases.
Data of common water facility components, such as aluminum flat or dome covers, handrails, grating, cable tray, FRP water troughs and launders, and chemical storage totes and tanks, lime silos, etc., are not readily available, even though the raw material (aluminum, HDPE or FRP) are included in the Ecoinvent database. Such data gaps could be filled efficiently by collecting data for typical products and trade standards.
Some data of chemicals commonly used in water and wastewater processes are included in the Ecoinvent database, but are limited. For example, the database may have 50 percent caustic soda solution but not have it at 25 percent. By accounting for the energy and water consumption during the chemical batching process, chemical products at various concentrations can be easily modeled with accuracy.
7.0 TASK 6 - FULL SCALE PLAN OF RESEARCH OUTLINE Task 6 of the study developed a full-scale plan of research outline and define the research questions for the future phase. The full-scale plan aimed to assist decision making on process selections for water treatment, with regard to sustainability values. The research outline covered sections such as research objectives of future phases, expanded study boundaries and level of details, existing and raw data collection, case studies and water treatment alternative evaluation. This document in included in Appendix B: Future Research Plan.

November 2012 - DRAFT 35 pw://Carollo/Documents/Client/CO/WRF/9005A00/Deliverables/LCI-LCIA Report (Final)
The technical approach for the proposed future studies could potentially consist of the following steps.
• Task 1: Expand the Prototype LCA Data Collection. Determine the high priority data elements (and their numeric value).
• Task 2: Stakeholder Workshop. To get utility input on specific research ideas.
• Task 3: Water Utility Case Studies.
• Task 4: Power Supply Sensitivity Analysis.
The following briefly describes these steps.
• Expand the prototype LCA data established in Phase 1 of the study. Fill in data gap using available literature references and published database information.
Task 1: Expand the Prototype LCA Data Collection
• Update literature review with up-to-date on-going research, applications, opportunities, and challenges related to LCA analysis in the field of water industry.
• Establish a data collection plan.
• Prioritize the data collection efforts.
• Collaborate with industry partners (e.g., equipment manufacturers or professional organizations) to collect raw data for water industry on membrane technologies and advanced oxidation processes.
• Conduct stakeholder workshop to prioritize the data wish list generated in the Phase 1 study, focusing on the interest of the southwest region of the United States, i.e., reclamation service area.
Task 2: Stakeholder Workshop
• Invite reclamation and utilities who are using lesser water quality sources.
• Investigate the opportunities for reclamation and drinking water utilities to integrate the use of LCA analyses into sustainable planning and operations.
• Gather input from water utilities to prioritize the data collection and establish case study areas.
• Select case study topics gathered at the stakeholder workshop (described in Task 2).
Task 3: Water Utility Case Studies
• Identify case study partnership. Set case study boundaries.
• Potential case study # 1: Investigate embedded water and energy associated with three water supply alternatives for central Arizona, including imported water, brackish water desalination, and indirect potable reuse.

November 2012 - DRAFT 36 pw://Carollo/Documents/Client/CO/WRF/9005A00/Deliverables/LCI-LCIA Report (Final)
• Potential case study # 2: Wastewater Treatment Plant Reclaimed Water Appraisal Study, which evaluates the environmental impacts of using reclaimed water as for other purposes (such as power plant cooling water, wetland restoration, and indirect potable reuse)
• Review current status of renewable energies as power supply alternatives, such as wind, solar, or taking advantage of biogas for power cogeneration in situ.
Task 4: Power Supply Sensitivity Analysis
• Collect renewable energies data based on literature review and available LCA software and database. Investigate opportunities to corporate with NREL and utilize their expertise and knowledge to assist the data collection.
• Conduct sensitivity analysis using LCA results to evaluate environmental impacts generated by various power supply sources.
8.0 REFERENCES Alexandre Bonton et al. 2012 Comparative life cycle assessment of water treatment plants.
Desalination 284, 2012 42-54.
Alexandre Bonton, Christian Bouchard, Benoit Barbeau, and Stephane Jedrzejak, Comparative Life Cycle Assessment of Water Treatment Plants, Desalination 284 (2012) 42 – 54
ANSI (American National Standard Institution). 1997. Environmental Management – Life Cycle Assessment — Principles and framework. ISO 14040.
Curran, M.A. 1996. Environmental Life-Cycle Assessment. McGraw-Hill, New York, USA.
EPA (Environmental Protection Agency). 1993. Life Cycle Assessment: Inventory Guidelines and Principles. EPA/600/R-92/245. Office of Research and Development. Cincinnati, Ohio, USA.
Friedrich E. 2002. Life-Cycle Assessment as an Environmental Management Tool in the Production of Potable Water. Water Science and Technology 46(9):29-36.
Hyde. 2011. Water Footprinting in the Urban Water Sector (Report 4419). Denver: Water Research Foundation.
Jennifer Stokes and Arpad Horvath, Life-Cycle Assessment of Urban Water Provision: Tool and Case Study in California, J. Infrastruct. Syst. 17, 15 (2011)
Lassaux S., R. Renzoni, and A. Germail. 2007. Life Cycle Assessment of Water from the Pumping Station to the Wastewater Treatment Plant. International Journal of LCA 12(2):118 – 126.
November 2012 - DRAFT 37 pw://Carollo/Documents/Client/CO/WRF/9005A00/Deliverables/LCI-LCIA Report (Final)
Ortiz, M., R.G. Raluy, L. Serra, and J. Uche. 2007. Life cycle assessment of water treatment technologies: wastewater and water-reuse in a small town. Desalination 204:121-131.
PRé Consultants, the Netherlands. 2004. SimaPro database manuals.
PRé Consultants, the Netherlands. 2007. SimaPro LCA software. http://www.pre.nl/SimaPro/ default.htm (accessed 11 September 2008).
Re-inventing the Nation’s Urban Water Infrastructure Engineering Research Center, Year I Annual Report, April 17, 2012
SETAC (Society of Environmental Toxicology and Chemistry). 1991. A Technical Framework for Life Cycle Assessment. Fava, J., Denison, R., Jones, B., Curran, M.A., Vigon, B., Selke, S., and Barnum, J. (eds).
SETAC. 1993. Guidelines for Life-Cycle Assessment: A Code of Practice, from the SETAC workshop in Sesimbra, Portugal. SETAC Press, Pensacola, Florida, USA.
Stokes and Horvath. 2006. Life Cycle Energy Assessment of Alternative Water Supply Systems. International Journal of Life Cycle Assessment, 11 (5): 335-343.
Stokes and Horvath. 2009. Energy and Air Emission Effect of Water Supply. Environmental Science and Technology, 43(8):2680-2687
UKWIR’s report 08/CL/01/6, Carbon Accounting in the UK water Industry: Guidelines for Dealing with Embodied Carbon and Whole Life-cycle Accounting, by MWH, 2008.
Vigon, B.W., and C.L. Harrison. USEPA Risk Reduction Engineering Laboratory. 1994. Life-cycle assessment: inventory guidelines and principles. CRC Press, Boca Raton, Florida, USA.
Vigon, B.W., D.A. Tolle, B.W. Cornaby, H.C. Latham, and C.L. Harrison. 1993. Life-cycle Assessment: Inventory Guidelines and Principles. U.S. Environmental Protection Agency, Cincinnati, Ohio.
Vince et al. 2008. LCA Tool for the environmental evaluation of potable water production. Desalination, 220:37-56
Water Research Foundation’s ongoing project “Toolbox for Water Utility Energy and Greenhouse Gas Emission Management: An International Review – 4224”, Draft Report, 2012

November 2012 - DRAFT 38 pw://Carollo/Documents/Client/CO/WRF/9005A00/Deliverables/LCI-LCIA Report (Final)
9.0 ABBREVIATIONS BEES Building for Environmental and Economic Sustainability CML Institute of Environmental Sciences ED electrodialysis EPD Environmental Product Declarations EPDM ethylene propylene diene monomer EPS Environmental Product Strategies ELCD European Reference Life Cycle Database ERC Engineering Research Center FRP Fiber-Reinforced Plastic GAC granular activated carbon GHG greenhouse gas GWRC Global Water Research Coalition HDPE high density polyethylene IA impact assessment IAC Industrial Assessment Centers IPCC Intergovernmental Panel on Climate Change ISO International Organization for Standardization LCA life-cycle assessment LCI life cycle inventory LCIA life cycle inventory assessment MF microfiltration NF nanofiltration NREL National Renewable Energy Laboratory ReNUWIt Re-inventing the Nation’s Urban Water Infrastructure ReCiPe LCIA method attempting to combine midpoint and endpoint impact
assessments RO reverse osmosis SETAC Society for Environmental Toxicology and Chemistry Traci Tool for the Reduction and Assessment of Chemical and Other
Environmental Impacts UBP Method of Ecological Scarcity UF ultrafiltration UKWIR UK Water Industry Research USEPA United States Environmental Protection Agency UNEP united nations environment programme USEtox UNEP-SETAC toxicity model WEST Water-Energy Sustainability Tool WWEST Wastewater-Energy Sustainability Tool
pw://Carollo/Documents/Client/CO/WRF/9005A00/Deliverables/LCI-LCIA Report (Final)
Appendix A
LIFE CYCLE INVENTORY AND LIFE CYCLE IMPACT ASSESSMENT DATABASE DEMONSTRATION


LIFE CYCLE INVENTORY AND LIFE CYCLE IMPACT ASSESSMENT DATABASE MAIN PAGE
Water Research Foundation LIFE CYCLE INVENTORY AND LIFE CYCLE IMPACT ASSESSMENT DATABASE
1 Raw Water Pumping1 Ch i l Al
Carbon Analysis Water Analysis Energy Analysis LCI Database Summary
Raw Water Pumping1 Chemical_Alum1 Chemical_Sulfuric1 Coag-Floc1 Sedimentation1 Filtration1 Chemical_Hypochlorite1 Chlorine Contact
Chemical: AlumChemical: Sulfuric AcidCoagulation / FlocculationSedimentationFiltrationCh i l S di H hl it1 Chlorine Contact
Entire Facility
General Assumptions:Plant Capacity mgd 10Life Cycle yr 20
Chemical: Sodium HypochloriteChlorine Contact Basin
Life Cycle yr 20Unit Cost for Electricity $/kwhr 0.08Water Produced on Life Cycle gallons 7.30E+10Water Produced on Life Cycle liters 2.76E+11
* check online factor on indvidual input sheets
Summary: Entire Facility
Impact category Global warming Water intake
Unit g CO2 eq litersTotal 5.83E+10 2.80E+09Total per 1000 gallons of Water Produced 7.99E+02 3.84E+01Total per 1000 liters of Water Produced 2.11E+02 1.01E+01EquipmentPumps and compressors 4.09E+08 0.00E+00Blowers and fans 1.66E+07 0.00E+00Measuring and dispensing pumps 1.32E+07 0.00E+00Conveyors and conveying equipment 0.00E+00 0.00E+00Industrial trucks and tractors 0.00E+00 0.00E+00Pipe, valves, and pipe fittings 0.00E+00 0.00E+00Plumbing fixture fittings and trim 0.00E+00 0.00E+00Turbines and turbine generator sets 0.00E+00 0.00E+00Motors and generators 0.00E+00 0.00E+00Water supply and sewerage systems 0 00E+00 0 00E+00Water supply and sewerage systems 0.00E+00 0.00E+00MaterialReinforcing steel, at plant/RER U 5.86E+08 1.08E+07Concrete, normal, at plant/CH U 2.14E+10 3.16E+08Concrete (reinforced) I 0.00E+00 0.00E+00Brick, at plant/RER U 0.00E+00 0.00E+00Wood board ETH U 0 00E+00 0 00E+00Wood board ETH U 0.00E+00 0.00E+00Sand ETH U 1.65E+06 1.58E+04Hard coal mix, at regional storage/UCTE U 3.95E+07 5.12E+05Gravel ETH U 7.51E+05 8.28E+03HDPE pipes E 3.07E+08 5.86E+06PVC pipe E 6.54E+07 1.53E+06Glass fibre reinforced plastic, polyamide, injection moulding, at plant/RER U 0.00E+00 0.00E+00Glass fibre reinforced plastic, polyester resin, hand lay-up, at plant/RER U 7.70E+07 2.59E+06
Polyethylene, HDPE, granulate, at plant/RER U 0.00E+00 0.00E+00St13 I - Material 0.00E+00 0.00E+00Copper I - Material 0.00E+00 0.00E+00C d t f t i t lCopper product manufacturing, average metal working/RER U 0.00E+00 0.00E+00Aluminium, production mix, at plant/RER U - Material 0.00E+00 0.00E+00Aluminium product manufacturing, average metal working/RER U - Processing 0.00E+00 0.00E+00ChemicalChemicalSodium hydroxide, 50% in H2O, production mix, at plant/RER U 0.00E+00 0.00E+00Sodium hypochlorite, 15% in H2O, at plant/RER U 8.44E+09 7.19E+08Lime, hydrated, packed, at plant/CH U 0.00E+00 0.00E+00Quicklime, milled, packed, at plant/CH U 0.00E+00 0.00E+00, , p , pSulphuric acid, liquid, at plant/RER U 5.11E+08 3.01E+08Aluminium sulphate, powder, at plant/RER U 1.01E+10 8.59E+08Iron (III) chloride, 40% in H2O, at plant/CH U 0.00E+00 0.00E+00Hydrochloric acid, from the reaction of hydrogen with chlorine, at plant/RER U 0.00E+00 0.00E+00
Hydrochloric acid, 30% in H2O, at plant/RER U 0.00E+00 0.00E+00Phosphoric acid, industrial grade, 85% in H2O, at plant/RER U 0.00E+00 0.00E+00Ammonium sulphate, as N, at regional storehouse/RER U 0.00E+00 0.00E+00EnergyElectricity high voltage at grid/US U 1 64E+10 5 85E+08Electricity, high voltage, at grid/US U 1.64E+10 5.85E+08Natural gas, at consumer/RNA U 0.00E+00 0.00E+00

Water Research Foundation
LIFE CYCLE INVENTORY AND LIFE CYCLE IMPACT ASSESSMENT DATABASE
Treatment Process Material Inventory
Unit 1 1 1 1 1 1 1 1Process Raw Water Pumping Chemical_Alum Chemical_Sulfuric Coagulation Sedimentation Filtration Chemical_Hypo Chlorine Contact Entire FacilityEquipment
Pumps and compressors USD 1.97E+04 0.00E+00 0.00E+00 2.54E+05 1.90E+05 1.24E+04 0.00E+00 3.20E+04 5.08E+05Blowers and fans USD 0.00E+00 0.00E+00 0.00E+00 0.00E+00 0.00E+00 1.86E+04 0.00E+00 0.00E+00 1.86E+04Measuring and dispensing pumps USD 0.00E+00 5.00E+03 5.00E+03 0.00E+00 0.00E+00 0.00E+00 5.00E+03 0.00E+00 1.50E+04Conveyors and conveying equipment USD 0.00E+00 0.00E+00 0.00E+00 0.00E+00 0.00E+00 0.00E+00 0.00E+00 0.00E+00 0.00E+00Industrial trucks and tractors USD 0.00E+00 0.00E+00 0.00E+00 0.00E+00 0.00E+00 0.00E+00 0.00E+00 0.00E+00 0.00E+00Pipe, valves, and pipe fittings USD 0.00E+00 0.00E+00 0.00E+00 0.00E+00 0.00E+00 0.00E+00 0.00E+00 0.00E+00 0.00E+00Plumbing fixture fittings and trim USD 0.00E+00 0.00E+00 0.00E+00 0.00E+00 0.00E+00 0.00E+00 0.00E+00 0.00E+00 0.00E+00Turbines and turbine generator sets USD 0.00E+00 0.00E+00 0.00E+00 0.00E+00 0.00E+00 0.00E+00 0.00E+00 0.00E+00 0.00E+00Motors and generators USD 0.00E+00 0.00E+00 0.00E+00 0.00E+00 0.00E+00 0.00E+00 0.00E+00 0.00E+00 0.00E+00Water supply and sewerage systems USD 0 00E+00 0 00E+00 0 00E+00 0 00E+00 0 00E+00 0 00E+00 0 00E+00 0 00E+00 0 00E+00Water supply and sewerage systems USD 0.00E+00 0.00E+00 0.00E+00 0.00E+00 0.00E+00 0.00E+00 0.00E+00 0.00E+00 0.00E+00
MaterialReinforcing steel, at plant/RER U kg 6.13E+04 3.21E+00 1.30E+00 5.87E+04 1.57E+05 3.23E+04 2.02E+00 1.09E+05 4.18E+05Concrete, normal, at plant/CH U m3 4.32E+02 3.85E+04 1.62E+04 4.80E+02 1.23E+03 2.57E+02 2.46E+04 7.53E+02 8.24E+04Concrete (reinforced) I kg 0.00E+00 0.00E+00 0.00E+00 0.00E+00 0.00E+00 0.00E+00 0.00E+00 0.00E+00 0.00E+00Brick, at plant/RER U kg 0.00E+00 0.00E+00 0.00E+00 0.00E+00 0.00E+00 0.00E+00 0.00E+00 0.00E+00 0.00E+00Wood board ETH U kg 0.00E+00 0.00E+00 0.00E+00 0.00E+00 0.00E+00 0.00E+00 0.00E+00 0.00E+00 0.00E+00Sand ETH U kg 0.00E+00 0.00E+00 0.00E+00 0.00E+00 0.00E+00 1.70E+05 0.00E+00 0.00E+00 1.70E+05Hard coal mix, at regional storage/UCTE U kg 0.00E+00 0.00E+00 0.00E+00 0.00E+00 0.00E+00 1.48E+05 0.00E+00 0.00E+00 1.48E+05Gravel ETH U kg 0.00E+00 0.00E+00 0.00E+00 0.00E+00 0.00E+00 7.39E+04 0.00E+00 0.00E+00 7.39E+04HDPE pipes E kg 0.00E+00 0.00E+00 0.00E+00 0.00E+00 0.00E+00 1.26E+05 0.00E+00 0.00E+00 1.26E+05PVC pipe E kg 1.03E+04 0.00E+00 0.00E+00 2.06E+03 2.06E+03 4.12E+03 0.00E+00 2.06E+03 2.06E+04Glass fibre reinforced plastic, polyamide, injection moulding, at plant/RER U kg 0.00E+00 0.00E+00 0.00E+00 0.00E+00 0.00E+00 0.00E+00 0.00E+00 0.00E+00 0.00E+00Glass fibre reinforced plastic, polyester resin, hand lay-up, at plant/RER U kg 0.00E+00 3.18E+03 6.36E+02 0.00E+00 8.37E+03 2.71E+03 1.59E+03 0.00E+00 1.65E+04Polyethylene, HDPE, granulate, at plant/RER U kg 0.00E+00 0.00E+00 0.00E+00 0.00E+00 0.00E+00 0.00E+00 0.00E+00 0.00E+00 0.00E+00St13 I - Material kg 0.00E+00 0.00E+00 0.00E+00 0.00E+00 0.00E+00 0.00E+00 0.00E+00 0.00E+00 0.00E+00Copper I - Material kg 0.00E+00 0.00E+00 0.00E+00 0.00E+00 0.00E+00 0.00E+00 0.00E+00 0.00E+00 0.00E+00Copper product manufacturing, average metal working/RER U kg 0.00E+00 0.00E+00 0.00E+00 0.00E+00 0.00E+00 0.00E+00 0.00E+00 0.00E+00 0.00E+00Aluminium, production mix, at plant/RER U - Material kg 0.00E+00 0.00E+00 0.00E+00 0.00E+00 0.00E+00 0.00E+00 0.00E+00 0.00E+00 0.00E+00Aluminium, production mix, at plant/RER U Material kg 0.00E+00 0.00E+00 0.00E+00 0.00E+00 0.00E+00 0.00E+00 0.00E+00 0.00E+00 0.00E+00Aluminium product manufacturing, average metal working/RER U - Processing kg 0.00E+00 0.00E+00 0.00E+00 0.00E+00 0.00E+00 0.00E+00 0.00E+00 0.00E+00 0.00E+00
ChemicalSodium hydroxide, 50% in H2O, production mix, at plant/RER U kg 0.00E+00 0.00E+00 0.00E+00 0.00E+00 0.00E+00 0.00E+00 0.00E+00 0.00E+00 0.00E+00Sodium hypochlorite, 15% in H2O, at plant/RER U kg 0.00E+00 0.00E+00 0.00E+00 0.00E+00 0.00E+00 0.00E+00 1.11E+07 0.00E+00 1.11E+07Lime, hydrated, packed, at plant/CH U kg 0.00E+00 0.00E+00 0.00E+00 0.00E+00 0.00E+00 0.00E+00 0.00E+00 0.00E+00 0.00E+00Quicklime, milled, packed, at plant/CH U kg 0.00E+00 0.00E+00 0.00E+00 0.00E+00 0.00E+00 0.00E+00 0.00E+00 0.00E+00 0.00E+00Sulphuric acid, liquid, at plant/RER U kg 0.00E+00 0.00E+00 5.94E+06 0.00E+00 0.00E+00 0.00E+00 0.00E+00 0.00E+00 5.94E+06Aluminium sulphate, powder, at plant/RER U kg 0.00E+00 2.21E+07 0.00E+00 0.00E+00 0.00E+00 0.00E+00 0.00E+00 0.00E+00 2.21E+07Iron (III) chloride, 40% in H2O, at plant/CH U kg 0.00E+00 0.00E+00 0.00E+00 0.00E+00 0.00E+00 0.00E+00 0.00E+00 0.00E+00 0.00E+00Hydrochloric acid, from the reaction of hydrogen with chlorine, at plant/RER U kg 0.00E+00 0.00E+00 0.00E+00 0.00E+00 0.00E+00 0.00E+00 0.00E+00 0.00E+00 0.00E+00Hydrochloric acid, 30% in H2O, at plant/RER U kg 0.00E+00 0.00E+00 0.00E+00 0.00E+00 0.00E+00 0.00E+00 0.00E+00 0.00E+00 0.00E+00Phosphoric acid, industrial grade, 85% in H2O, at plant/RER U kg 0.00E+00 0.00E+00 0.00E+00 0.00E+00 0.00E+00 0.00E+00 0.00E+00 0.00E+00 0.00E+00Ammonium sulphate, as N, at regional storehouse/RER U kg 0.00E+00 0.00E+00 0.00E+00 0.00E+00 0.00E+00 0.00E+00 0.00E+00 0.00E+00 0.00E+00
EnergyElectricity, high voltage, at grid/US U kWh 1.64E+07 3.14E+05 3.14E+05 2.01E+06 1.06E+06 6.40E+05 3.14E+05 8.14E+05 2.19E+07Natural gas, at consumer/RNA U MJ 0.00E+00 0.00E+00 0.00E+00 0.00E+00 0.00E+00 0.00E+00 0.00E+00 0.00E+00 0.00E+00

Water Research Foundation
LIFE CYCLE INVENTORY AND LIFE CYCLE IMPACT ASSESSMENT DATABASE
Environmental Impacts of Unit Quantity Inventories
Impact category Quantity Unit Global warming Water intake Acidification HH cancerHH
noncancerHH criteria air
pollutants Eutrophication Ecotoxicity SmogNatural resource
depletionIndoor air
qualityHabitat
alterationUnit g CO2 eq liters H+ moles eq g C7H7 eq g C7H7 eq microDALYs g N eq g 2,4-D eq g NOx eq MJ surplus TVOC eq T&E countEquipmentPumps and compressors 1 USD 8.05E+02 0.00E+00 1.89E+02 1.33E+01 2.89E+03 8.86E-02 1.80E-01 5.42E+00 3.37E+00 1.15E+00 0.00E+00 0.00E+00Blowers and fans 1 USD 8.93E+02 0.00E+00 2.07E+02 1.29E+01 2.67E+03 9.66E-02 2.35E-01 5.22E+00 3.55E+00 1.19E+00 0.00E+00 0.00E+00Measuring and dispensing pumps 1 USD 8.83E+02 0.00E+00 2.16E+02 1.54E+01 3.35E+03 9.62E-02 2.17E-01 5.50E+00 3.74E+00 1.31E+00 0.00E+00 0.00E+00Conveyors and conveying equipment 1 USD 8.88E+02 0.00E+00 1.97E+02 1.31E+01 2.50E+03 9.38E-02 1.82E-01 5.41E+00 3.44E+00 1.15E+00 0.00E+00 0.00E+00Industrial trucks and tractors 1 USD 1.16E+03 0.00E+00 2.63E+02 1.80E+01 3.48E+03 1.23E-01 2.36E-01 8.34E+00 4.91E+00 1.50E+00 0.00E+00 0.00E+00Pipe, valves, and pipe fittings 1 USD 1.06E+03 0.00E+00 2.55E+02 1.73E+01 6.58E+03 1.26E-01 2.19E-01 6.25E+00 4.06E+00 1.35E+00 0.00E+00 0.00E+00Plumbing fixture fittings and trim 1 USD 9.18E+02 0.00E+00 2.66E+02 1.74E+01 9.95E+03 1.26E-01 2.20E-01 6.48E+00 4.12E+00 1.45E+00 0.00E+00 0.00E+00Turbines and turbine generator sets 1 USD 8.78E+02 0.00E+00 1.95E+02 1.30E+01 3.01E+03 9.44E-02 1.74E-01 6.11E+00 3.50E+00 1.13E+00 0.00E+00 0.00E+00Motors and generators 1 USD 1.08E+03 0.00E+00 2.68E+02 1.72E+01 4.25E+03 1.26E-01 2.23E-01 1.21E+01 4.60E+00 1.46E+00 0.00E+00 0.00E+00Water supply and sewerage systems 1 USD 2.00E+03 0.00E+00 2.87E+02 1.72E+01 1.22E+03 1.09E-01 3.15E-01 2.79E+00 4.76E+00 3.22E+00 0.00E+00 0.00E+00MaterialReinforcing steel, at plant/RER U 1 kg 1.40E+03 2.58E+01 2.64E+02 1.44E+01 4.21E+04 5.09E-01 2.28E-01 1.08E+02 3.73E+00 1.09E+00 0.00E+00 2.49E-14Concrete, normal, at plant/CH U 1 m3 2.59E+05 3.83E+03 2.56E+04 5.19E+02 1.07E+06 8.73E+00 3.04E+01 1.14E+03 5.58E+02 9.63E+01 0.00E+00 8.06E-13Concrete (reinforced) I 1 kg 1.07E+02 1.92E+00 4.01E+01 6.89E+00 9.26E+03 6.68E-03 2.85E-02 4.28E-01 7.94E-01 1.87E-01 0.00E+00 0.00E+00Brick, at plant/RER U 1 kg 2.12E+02 1.21E+00 3.15E+01 6.73E-02 7.62E+01 8.10E-03 3.43E-02 2.42E-01 5.88E-01 3.28E-01 0.00E+00 1.40E-16Wood board ETH U 1 kg -2.43E+03 1.16E+01 1.78E+02 1.74E+00 2.62E+03 3.06E-02 1.43E-01 2.32E+00 2.34E+00 6.06E-01 0.00E+00 0.00E+00Sand ETH U 1 kg 9.73E+00 9.31E-02 2.72E+00 1.63E-03 7.32E+00 3.55E-04 2.55E-03 2.21E-02 5.55E-02 1.60E-02 0.00E+00 0.00E+00Hard coal mix, at regional storage/UCTE U 1 kg 2.68E+02 3.46E+00 8.22E+01 1.40E-01 2.63E+03 1.38E-01 7.15E-02 4.62E-01 1.35E+00 4.72E-01 0.00E+00 3.73E-14Gravel ETH U 1 kg 1.02E+01 1.12E-01 2.87E+00 2.02E-03 8.41E+00 3.92E-04 2.66E-03 2.53E-02 5.64E-02 1.64E-02 0.00E+00 0.00E+00HDPE pipes E 1 kg 2.44E+03 4.65E+01 5.01E+02 7.15E-01 8.68E+01 1.63E-01 2.15E-01 1.12E+00 1.04E+01 0.00E+00 0.00E+00 0.00E+00PVC pipe E 1 kg 3.18E+03 7.43E+01 7.42E+02 5.32E+02 6.77E+05 2.61E-01 9.62E-01 3.90E+01 9.79E+00 0.00E+00 0.00E+00 0.00E+00Glass fibre reinforced plastic, polyamide, injection moulding, at plant/RER U 1 kg 8.61E+03 6.01E+02 1.62E+03 4.23E+00 3.04E+03 6.23E-01 8.22E+00 1.02E+01 1.76E+01 1.64E+01 0.00E+00 1.87E-14Glass fibre reinforced plastic, polyester resin, hand lay-up, at plant/RER U 1 kg 4.67E+03 1.57E+02 8.88E+02 6.36E+01 3.34E+04 3.27E-01 4.68E+00 3.53E+01 1.11E+01 8.84E+00 0.00E+00 1.34E-14
Polyethylene, HDPE, granulate, at plant/RER U 1 kg 1.90E+03 3.40E+02 9.69E-01 1.74E+02 1.10E-01 1.61E-01 6.43E-01 4.11E+00 1.01E+01 0.00E+00 7.86E-16 3.22E+01St13 I - Material 1 kg 1.00E+03 5.27E+02 1.72E+02 2.31E+05 9.32E-02 2.70E-01 9.57E+00 8.87E+00 8.46E-01 0.00E+00 0.00E+00 1.18E+00Copper I - Material 1 kg 7.51E+03 3.52E+04 1.29E-02 1.42E+01 9.42E+00 1.09E+00 6.28E-01 3.11E+01 1.25E+01 0.00E+00 0.00E+00 1.26E-01Copper product manufacturing, average metal working/RER U 1 kg 1.80E+03 1.66E+03 1.45E+02 3.07E+05 8.02E-01 1.21E+00 5.28E+01 8.56E+00 2.27E+00 0.00E+00 7.42E-13 6.18E+01
Aluminium, production mix, at plant/RER U - Material 1 kg 7.77E+03 1.88E+03 3.29E+01 2.22E+04 1.43E+00 1.68E+00 3.13E+01 1.66E+01 7.99E+00 0.00E+00 8.57E-14 2.03E+02Aluminium product manufacturing, average metal working/RER U - Processing 1 kg 3.17E+03 6.47E+02 1.08E+01 9.71E+03 4.07E-01 1.18E+00 1.48E+01 6.44E+00 3.57E+00 0.00E+00 2.47E-14 9.11E+01ChemicalSodium hydroxide, 50% in H2O, production mix, at plant/RER U 1 kg 1.01E+03 1.13E+02 2.36E+02 1.21E+00 1.50E+04 9.72E-02 2.93E-01 7.71E+01 2.16E+00 8.96E-01 0.00E+00 7.46E-15Sodium hypochlorite, 15% in H2O, at plant/RER U 1 kg 7.63E+02 6.50E+01 1.74E+02 8.30E-01 8.72E+03 7.19E-02 2.15E-01 4.37E+01 1.90E+00 8.71E-01 0.00E+00 4.77E-15Lime, hydrated, packed, at plant/CH U 1 kg 7.57E+02 2.30E+00 3.77E+01 3.54E-01 7.76E+02 2.48E-02 4.24E-02 3.42E-01 6.33E-01 5.19E-01 0.00E+00 9.25E-17Quicklime, milled, packed, at plant/CH U 1 kg 9.82E+02 2.04E+00 4.85E+01 3.89E-01 9.37E+02 3.21E-02 5.32E-02 4.35E-01 8.14E-01 6.73E-01 0.00E+00 1.14E-16Sulphuric acid, liquid, at plant/RER U 1 kg 8.60E+01 5.07E+01 6.75E+02 1.04E-01 1.64E+02 1.82E-01 6.29E-02 3.67E-01 8.42E-01 1.54E-01 0.00E+00 1.46E-16Aluminium sulphate, powder, at plant/RER U 1 kg 4.58E+02 3.89E+01 4.44E+02 3.25E+00 1.40E+03 2.02E-01 1.29E-01 3.68E+00 1.65E+00 5.59E-01 0.00E+00 6.50E-15Iron (III) chloride, 40% in H2O, at plant/CH U 1 kg 6.17E+02 6.38E+01 1.50E+02 1.87E+00 1.29E+04 6.08E-02 1.90E-01 6.69E+01 1.46E+00 5.64E-01 0.00E+00 4.49E-15Hydrochloric acid, from the reaction of hydrogen with chlorine, at plant/RER U 1 kg 1.17E+03 2.75E+02 3.15E+00 1.50E+04 1.12E-01 3.11E-01 7.66E+01 2.53E+00 1.27E+00 0.00E+00 8.09E-15 1.18E+02
Hydrochloric acid, 30% in H2O, at plant/RER U 1 kg 7.35E+02 1.82E+02 1.77E+00 7.83E+03 7.20E-02 2.87E-01 3.91E+01 1.61E+00 8.79E-01 0.00E+00 5.04E-15 7.25E+01
Phosphoric acid, industrial grade, 85% in H2O, at plant/RER U 1 kg 1.21E+03 1.67E+03 3.14E+01 7.13E+03 6.57E-01 1.06E+02 6.46E+00 4.16E+00 1.79E+00 0.00E+00 2.93E-14 1.56E+02
Ammonium sulphate, as N, at regional storehouse/RER U 1 kg 2.37E+03 3.45E+02 1.22E+00 3.02E+03 1.51E-01 3.45E-01 4.64E+00 3.84E+00 5.56E+00 0.00E+00 3.50E-15 7.71E+00EnergyElectricity, high voltage, at grid/US U 1 kWh 7.48E+02 2.67E+01 2.64E+02 1.53E+00 2.62E+03 8.97E-02 9.43E-02 1.93E+00 1.74E+00 5.04E-01 0.00E+00 1.72E-14Natural gas, at consumer/RNA U 1 MJ 1.32E+01 3.44E-02 2.83E+01 3.34E-01 3.89E+02 7.76E-03 3.66E-03 8.95E-02 2.48E-02 1.81E-01 0.00E+00 2.21E-17

Water Research Foundation
LIFE CYCLE INVENTORY AND LIFE CYCLE IMPACT ASSESSMENT DATABASE
Life Cyccle Environmental Impacts for Water Treatment Facilities
Unit Process (Selected on Main Page) Entire Facility
Impact category Global warming Water intake Acidification HH cancer HH noncancer HH criteria air pollutants Eutrophication Ecotoxicity Smog Natural resource
depletionIndoor air
qualityHabitat
alterationOzone
depletionUnit g CO2 eq liters H+ moles eq g C7H7 eq g C7H7 eq microDALYs g N eq g 2,4-D eq g NOx eq MJ surplus TVOC eq T&E count g CFC-11 eq
1 Total 5.83E+10 2.80E+09 2.40E+10 1.83E+08 3.08E+11 9.33E+06 1.05E+07 7.53E+08 1.52E+08 4.32E+07 0.00E+00 6.55E-07 0.00E+002 Equipment3 Pumps and compressors 4.09E+08 0.00E+00 9.60E+07 6.76E+06 1.47E+09 4.50E+04 9.17E+04 2.76E+06 1.71E+06 5.82E+05 0.00E+00 0.00E+00 0.00E+004 Blowers and fans 1.66E+07 0.00E+00 3.84E+06 2.40E+05 4.97E+07 1.80E+03 4.37E+03 9.70E+04 6.60E+04 2.21E+04 0.00E+00 0.00E+00 0.00E+005 Measuring and dispensing pumps 1.32E+07 0.00E+00 3.24E+06 2.31E+05 5.02E+07 1.44E+03 3.26E+03 8.25E+04 5.60E+04 1.97E+04 0.00E+00 0.00E+00 0.00E+006 Conveyors and conveying equipment 0.00E+00 0.00E+00 0.00E+00 0.00E+00 0.00E+00 0.00E+00 0.00E+00 0.00E+00 0.00E+00 0.00E+00 0.00E+00 0.00E+00 0.00E+007 Industrial trucks and tractors 0 00E+00 0 00E+00 0 00E+00 0 00E+00 0 00E+00 0 00E+00 0 00E+00 0 00E+00 0 00E+00 0 00E+00 0 00E+00 0 00E+00 0 00E+007 Industrial trucks and tractors 0.00E+00 0.00E+00 0.00E+00 0.00E+00 0.00E+00 0.00E+00 0.00E+00 0.00E+00 0.00E+00 0.00E+00 0.00E+00 0.00E+00 0.00E+008 Pipe, valves, and pipe fittings 0.00E+00 0.00E+00 0.00E+00 0.00E+00 0.00E+00 0.00E+00 0.00E+00 0.00E+00 0.00E+00 0.00E+00 0.00E+00 0.00E+00 0.00E+009 Plumbing fixture fittings and trim 0.00E+00 0.00E+00 0.00E+00 0.00E+00 0.00E+00 0.00E+00 0.00E+00 0.00E+00 0.00E+00 0.00E+00 0.00E+00 0.00E+00 0.00E+0010 Turbines and turbine generator sets 0.00E+00 0.00E+00 0.00E+00 0.00E+00 0.00E+00 0.00E+00 0.00E+00 0.00E+00 0.00E+00 0.00E+00 0.00E+00 0.00E+00 0.00E+0011 Motors and generators 0.00E+00 0.00E+00 0.00E+00 0.00E+00 0.00E+00 0.00E+00 0.00E+00 0.00E+00 0.00E+00 0.00E+00 0.00E+00 0.00E+00 0.00E+0012 Water supply and sewerage systems 0.00E+00 0.00E+00 0.00E+00 0.00E+00 0.00E+00 0.00E+00 0.00E+00 0.00E+00 0.00E+00 0.00E+00 0.00E+00 0.00E+00 0.00E+0013 Material14 Reinforcing steel, at plant/RER U 5.86E+08 1.08E+07 1.11E+08 6.03E+06 1.76E+10 2.13E+05 9.54E+04 4.52E+07 1.56E+06 4.56E+05 0.00E+00 1.04E-08 0.00E+0015 Concrete, normal, at plant/CH U 2.14E+10 3.16E+08 2.11E+09 4.28E+07 8.85E+10 7.20E+05 2.50E+06 9.42E+07 4.60E+07 7.93E+06 0.00E+00 6.64E-08 0.00E+0016 Concrete (reinforced) I 0.00E+00 0.00E+00 0.00E+00 0.00E+00 0.00E+00 0.00E+00 0.00E+00 0.00E+00 0.00E+00 0.00E+00 0.00E+00 0.00E+00 0.00E+0017 Brick, at plant/RER U 0.00E+00 0.00E+00 0.00E+00 0.00E+00 0.00E+00 0.00E+00 0.00E+00 0.00E+00 0.00E+00 0.00E+00 0.00E+00 0.00E+00 0.00E+0018 Wood board ETH U 0.00E+00 0.00E+00 0.00E+00 0.00E+00 0.00E+00 0.00E+00 0.00E+00 0.00E+00 0.00E+00 0.00E+00 0.00E+00 0.00E+00 0.00E+0019 Sand ETH U 1.65E+06 1.58E+04 4.61E+05 2.76E+02 1.24E+06 6.04E+01 4.33E+02 3.75E+03 9.43E+03 2.73E+03 0.00E+00 0.00E+00 0.00E+0020 Hard coal mix, at regional storage/UCTE U 3.95E+07 5.12E+05 1.21E+07 2.07E+04 3.89E+08 2.04E+04 1.06E+04 6.83E+04 1.99E+05 6.97E+04 0.00E+00 5.51E-09 0.00E+0021 Gravel ETH U 7.51E+05 8.28E+03 2.12E+05 1.49E+02 6.21E+05 2.89E+01 1.97E+02 1.87E+03 4.17E+03 1.21E+03 0.00E+00 0.00E+00 0.00E+0022 HDPE pipes E 3.07E+08 5.86E+06 6.30E+07 9.00E+04 1.09E+07 2.05E+04 2.71E+04 1.41E+05 1.31E+06 0.00E+00 0.00E+00 0.00E+00 0.00E+0023 PVC pipe E 6.54E+07 1.53E+06 1.53E+07 1.10E+07 1.39E+10 5.38E+03 1.98E+04 8.03E+05 2.02E+05 0.00E+00 0.00E+00 0.00E+00 0.00E+00
24
Glass fibre reinforced plastic, polyamide, injection moulding, at plant/RER U 0 00E+00 0 00E+00 0 00E+00 0 00E+00 0 00E+00 0 00E+00 0 00E+00 0 00E+00 0 00E+00 0 00E+00 0 00E+00 0 00E+00 0 00E+0024 plant/RER U 0.00E+00 0.00E+00 0.00E+00 0.00E+00 0.00E+00 0.00E+00 0.00E+00 0.00E+00 0.00E+00 0.00E+00 0.00E+00 0.00E+00 0.00E+00
25
Glass fibre reinforced plastic, polyester resin, hand lay-up, at plant/RER U 7.70E+07 2.59E+06 1.46E+07 1.05E+06 5.50E+08 5.40E+03 7.71E+04 5.82E+05 1.83E+05 1.46E+05 0.00E+00 2.21E-10 0.00E+00
26 Polyethylene, HDPE, granulate, at plant/RER U 0.00E+00 0.00E+00 0.00E+00 0.00E+00 0.00E+00 0.00E+00 0.00E+00 0.00E+00 0.00E+00 0.00E+00 0.00E+00 0.00E+00 0.00E+0027 St13 I - Material 0.00E+00 0.00E+00 0.00E+00 0.00E+00 0.00E+00 0.00E+00 0.00E+00 0.00E+00 0.00E+00 0.00E+00 0.00E+00 0.00E+00 0.00E+0028 Copper I - Material 0.00E+00 0.00E+00 0.00E+00 0.00E+00 0.00E+00 0.00E+00 0.00E+00 0.00E+00 0.00E+00 0.00E+00 0.00E+00 0.00E+00 0.00E+00
29 Copper product manufacturing, average metal working/RER U 0.00E+00 0.00E+00 0.00E+00 0.00E+00 0.00E+00 0.00E+00 0.00E+00 0.00E+00 0.00E+00 0.00E+00 0.00E+00 0.00E+00 0.00E+0030 Aluminium, production mix, at plant/RER U - Material 0.00E+00 0.00E+00 0.00E+00 0.00E+00 0.00E+00 0.00E+00 0.00E+00 0.00E+00 0.00E+00 0.00E+00 0.00E+00 0.00E+00 0.00E+00
31
Aluminium product manufacturing, average metal working/RER U - Processing 0.00E+00 0.00E+00 0.00E+00 0.00E+00 0.00E+00 0.00E+00 0.00E+00 0.00E+00 0.00E+00 0.00E+00 0.00E+00 0.00E+00 0.00E+00
32 Chemical
33 Sodium hydroxide, 50% in H2O, production mix, at plant/RER U 0.00E+00 0.00E+00 0.00E+00 0.00E+00 0.00E+00 0.00E+00 0.00E+00 0.00E+00 0.00E+00 0.00E+00 0.00E+00 0.00E+00 0.00E+0034 Sodium hypochlorite, 15% in H2O, at plant/RER U 8.44E+09 7.19E+08 1.92E+09 9.17E+06 9.64E+10 7.95E+05 2.38E+06 4.83E+08 2.11E+07 9.63E+06 0.00E+00 5.28E-08 0.00E+0035 Lime, hydrated, packed, at plant/CH U 0.00E+00 0.00E+00 0.00E+00 0.00E+00 0.00E+00 0.00E+00 0.00E+00 0.00E+00 0.00E+00 0.00E+00 0.00E+00 0.00E+00 0.00E+0036 Quicklime, milled, packed, at plant/CH U 0.00E+00 0.00E+00 0.00E+00 0.00E+00 0.00E+00 0.00E+00 0.00E+00 0.00E+00 0.00E+00 0.00E+00 0.00E+00 0.00E+00 0.00E+00
S l h i id li id l /RER U37 Sulphuric acid, liquid, at plant/RER U 5.11E+08 3.01E+08 4.01E+09 6.20E+05 9.77E+08 1.08E+06 3.74E+05 2.18E+06 5.01E+06 9.16E+05 0.00E+00 8.67E-10 0.00E+0038 Aluminium sulphate, powder, at plant/RER U 1.01E+10 8.59E+08 9.83E+09 7.19E+07 3.11E+10 4.46E+06 2.85E+06 8.14E+07 3.66E+07 1.24E+07 0.00E+00 1.44E-07 0.00E+0039 Iron (III) chloride, 40% in H2O, at plant/CH U 0.00E+00 0.00E+00 0.00E+00 0.00E+00 0.00E+00 0.00E+00 0.00E+00 0.00E+00 0.00E+00 0.00E+00 0.00E+00 0.00E+00 0.00E+00
40
Hydrochloric acid, from the reaction of hydrogen with chlorine, at plant/RER U 0.00E+00 0.00E+00 0.00E+00 0.00E+00 0.00E+00 0.00E+00 0.00E+00 0.00E+00 0.00E+00 0.00E+00 0.00E+00 0.00E+00 0.00E+00
41 Hydrochloric acid, 30% in H2O, at plant/RER U 0.00E+00 0.00E+00 0.00E+00 0.00E+00 0.00E+00 0.00E+00 0.00E+00 0.00E+00 0.00E+00 0.00E+00 0.00E+00 0.00E+00 0.00E+00
42 Phosphoric acid, industrial grade, 85% in H2O, at plant/RER U 0.00E+00 0.00E+00 0.00E+00 0.00E+00 0.00E+00 0.00E+00 0.00E+00 0.00E+00 0.00E+00 0.00E+00 0.00E+00 0.00E+00 0.00E+00
43 Ammonium sulphate, as N, at regional storehouse/RER U 0.00E+00 0.00E+00 0.00E+00 0.00E+00 0.00E+00 0.00E+00 0.00E+00 0.00E+00 0.00E+00 0.00E+00 0.00E+00 0.00E+00 0.00E+0044 Energy45 Electricity, high voltage, at grid/US U 1.64E+10 5.85E+08 5.77E+09 3.34E+07 5.73E+10 1.96E+06 2.06E+06 4.22E+07 3.81E+07 1.10E+07 0.00E+00 3.75E-07 0.00E+0046 Natural gas, at consumer/RNA U 0.00E+00 0.00E+00 0.00E+00 0.00E+00 0.00E+00 0.00E+00 0.00E+00 0.00E+00 0.00E+00 0.00E+00 0.00E+00 0.00E+00 0.00E+00

2%
Global Warming Breakdown by Process
21%
26%26%
Raw Water Pumping
Chemical_Alum
Chemical_Sulfuric
Coagulation
Sedimentation
3%
2%
Filtration
Chemical_Hypo
Chlorine Contact
35%9%
3%
9%

Water Research Foundation
LIFE CYCLE INVENTORY AND LIFE CYCLE IMPACT ASSESSMENT DATABASE
Life Cyccle Environmental Impacts for Water Treatment Facilities
Global Warming
Raw Water Pumping Chemical_Alum Chemical_Sulfuric Coagulation Sedimentation Filtration Chemical_Hypo Chlorine Contact Entire Facility
Impact category Global warming Global warming Global warming Global warming Global warming Global warming Global warming Global warming Global warming
Unit g CO2 eq g CO2 eq g CO2 eq g CO2 eq g CO2 eq g CO2 eq g CO2 eq g CO2 eq g CO2 eq1 Total 1.25E+10 2.03E+10 4.96E+09 1.92E+09 1.53E+09 9.92E+08 1.51E+10 9.89E+08 5.83E+10
Percentage 21% 35% 9% 3% 3% 2% 26% 2% 100%2 Equipment3 Pumps and compressors 1.59E+07 0.00E+00 0.00E+00 2.04E+08 1.53E+08 9.97E+06 0.00E+00 2.57E+07 4.09E+084 Blowers and fans 0.00E+00 0.00E+00 0.00E+00 0.00E+00 0.00E+00 1.66E+07 0.00E+00 0.00E+00 1.66E+075 Measuring and dispensing pumps 0.00E+00 4.42E+06 4.42E+06 0.00E+00 0.00E+00 0.00E+00 4.42E+06 0.00E+00 1.32E+076 Conveyors and conveying equipment 0.00E+00 0.00E+00 0.00E+00 0.00E+00 0.00E+00 0.00E+00 0.00E+00 0.00E+00 0.00E+006 y y g q p 0.00E 00 0.00E 00 0.00E 00 0.00E 00 0.00E 00 0.00E 00 0.00E 00 0.00E 00 0.00E 007 Industrial trucks and tractors 0.00E+00 0.00E+00 0.00E+00 0.00E+00 0.00E+00 0.00E+00 0.00E+00 0.00E+00 0.00E+008 Pipe, valves, and pipe fittings 0.00E+00 0.00E+00 0.00E+00 0.00E+00 0.00E+00 0.00E+00 0.00E+00 0.00E+00 0.00E+009 Plumbing fixture fittings and trim 0.00E+00 0.00E+00 0.00E+00 0.00E+00 0.00E+00 0.00E+00 0.00E+00 0.00E+00 0.00E+0010 Turbines and turbine generator sets 0.00E+00 0.00E+00 0.00E+00 0.00E+00 0.00E+00 0.00E+00 0.00E+00 0.00E+00 0.00E+0011 Motors and generators 0.00E+00 0.00E+00 0.00E+00 0.00E+00 0.00E+00 0.00E+00 0.00E+00 0.00E+00 0.00E+0012 Water supply and sewerage systems 0.00E+00 0.00E+00 0.00E+00 0.00E+00 0.00E+00 0.00E+00 0.00E+00 0.00E+00 0.00E+0013 Material14 Reinforcing steel, at plant/RER U 8.59E+07 4.50E+03 1.83E+03 8.22E+07 2.20E+08 4.53E+07 2.83E+03 1.53E+08 5.86E+0815 Concrete, normal, at plant/CH U 1.12E+08 9.97E+09 4.20E+09 1.24E+08 3.18E+08 6.66E+07 6.37E+09 1.95E+08 2.14E+1016 Concrete (reinforced) I 0.00E+00 0.00E+00 0.00E+00 0.00E+00 0.00E+00 0.00E+00 0.00E+00 0.00E+00 0.00E+0017 Brick, at plant/RER U 0.00E+00 0.00E+00 0.00E+00 0.00E+00 0.00E+00 0.00E+00 0.00E+00 0.00E+00 0.00E+0018 Wood board ETH U 0.00E+00 0.00E+00 0.00E+00 0.00E+00 0.00E+00 0.00E+00 0.00E+00 0.00E+00 0.00E+0019 Sand ETH U 0.00E+00 0.00E+00 0.00E+00 0.00E+00 0.00E+00 1.65E+06 0.00E+00 0.00E+00 1.65E+0620 Hard coal mix, at regional storage/UCTE U 0.00E+00 0.00E+00 0.00E+00 0.00E+00 0.00E+00 3.95E+07 0.00E+00 0.00E+00 3.95E+0721 Gravel ETH U 0.00E+00 0.00E+00 0.00E+00 0.00E+00 0.00E+00 7.51E+05 0.00E+00 0.00E+00 7.51E+0522 HDPE pipes E 0.00E+00 0.00E+00 0.00E+00 0.00E+00 0.00E+00 3.07E+08 0.00E+00 0.00E+00 3.07E+0823 PVC pipe E 3.27E+07 0.00E+00 0.00E+00 6.54E+06 6.54E+06 1.31E+07 0.00E+00 6.54E+06 6.54E+07
24
Glass fibre reinforced plastic, polyamide, injection moulding, at plant/RER U 0.00E+00 0.00E+00 0.00E+00 0.00E+00 0.00E+00 0.00E+00 0.00E+00 0.00E+00 0.00E+00g p
25
Glass fibre reinforced plastic, polyester resin, hand lay-up, at plant/RER U 0.00E+00 1.49E+07 2.97E+06 0.00E+00 3.91E+07 1.27E+07 7.43E+06 0.00E+00 7.70E+07
26 Polyethylene, HDPE, granulate, at plant/RER U 0.00E+00 0.00E+00 0.00E+00 0.00E+00 0.00E+00 0.00E+00 0.00E+00 0.00E+00 0.00E+0027 St13 I - Material 0.00E+00 0.00E+00 0.00E+00 0.00E+00 0.00E+00 0.00E+00 0.00E+00 0.00E+00 0.00E+0028 Copper I - Material 0.00E+00 0.00E+00 0.00E+00 0.00E+00 0.00E+00 0.00E+00 0.00E+00 0.00E+00 0.00E+00
29
Copper product manufacturing, average metal working/RER U 0.00E+00 0.00E+00 0.00E+00 0.00E+00 0.00E+00 0.00E+00 0.00E+00 0.00E+00 0.00E+00
30 Aluminium, production mix, at plant/RER U - Material 0.00E+00 0.00E+00 0.00E+00 0.00E+00 0.00E+00 0.00E+00 0.00E+00 0.00E+00 0.00E+00
31
Aluminium product manufacturing, average metal working/RER U - Processing 0.00E+00 0.00E+00 0.00E+00 0.00E+00 0.00E+00 0.00E+00 0.00E+00 0.00E+00 0.00E+00
32 Chemical
33
Sodium hydroxide, 50% in H2O, production mix, at plant/RER U 0.00E+00 0.00E+00 0.00E+00 0.00E+00 0.00E+00 0.00E+00 0.00E+00 0.00E+00 0.00E+00
34 Sodium hypochlorite, 15% in H2O, at plant/RER U 0.00E+00 0.00E+00 0.00E+00 0.00E+00 0.00E+00 0.00E+00 8.44E+09 0.00E+00 8.44E+0935 Lime, hydrated, packed, at plant/CH U 0.00E+00 0.00E+00 0.00E+00 0.00E+00 0.00E+00 0.00E+00 0.00E+00 0.00E+00 0.00E+0036 Quicklime, milled, packed, at plant/CH U 0.00E+00 0.00E+00 0.00E+00 0.00E+00 0.00E+00 0.00E+00 0.00E+00 0.00E+00 0.00E+0037 Sulphuric acid, liquid, at plant/RER U 0.00E+00 0.00E+00 5.11E+08 0.00E+00 0.00E+00 0.00E+00 0.00E+00 0.00E+00 5.11E+0838 Aluminium sulphate, powder, at plant/RER U 0.00E+00 1.01E+10 0.00E+00 0.00E+00 0.00E+00 0.00E+00 0.00E+00 0.00E+00 1.01E+1039 Iron (III) chloride, 40% in H2O, at plant/CH U 0.00E+00 0.00E+00 0.00E+00 0.00E+00 0.00E+00 0.00E+00 0.00E+00 0.00E+00 0.00E+00
40
Hydrochloric acid, from the reaction of hydrogen with chlorine, at plant/RER U 0.00E+00 0.00E+00 0.00E+00 0.00E+00 0.00E+00 0.00E+00 0.00E+00 0.00E+00 0.00E+00
41 Hydrochloric acid, 30% in H2O, at plant/RER U 0.00E+00 0.00E+00 0.00E+00 0.00E+00 0.00E+00 0.00E+00 0.00E+00 0.00E+00 0.00E+00
42
Phosphoric acid, industrial grade, 85% in H2O, at plant/RER U 0.00E+00 0.00E+00 0.00E+00 0.00E+00 0.00E+00 0.00E+00 0.00E+00 0.00E+00 0.00E+00
43
Ammonium sulphate, as N, at regional storehouse/RER U 0.00E+00 0.00E+00 0.00E+00 0.00E+00 0.00E+00 0.00E+00 0.00E+00 0.00E+00 0.00E+00
44 Energy45 Electricity, high voltage, at grid/US U 1.23E+10 2.35E+08 2.35E+08 1.50E+09 7.91E+08 4.79E+08 2.35E+08 6.09E+08 1.64E+1046 Natural gas, at consumer/RNA U 0.00E+00 0.00E+00 0.00E+00 0.00E+00 0.00E+00 0.00E+00 0.00E+00 0.00E+00 0.00E+00

1%
Water Intake Breakdown by Process
16%
29%
Raw Water Pumping
Chemical_Alum
Chemical_Sulfuric
Coagulation
Sedimentation
1%1%
Filtration
Chemical_Hypo
Chlorine Contact
36%2%
13%

Water Research Foundation
LIFE CYCLE INVENTORY AND LIFE CYCLE IMPACT ASSESSMENT DATABASE
Life Cyccle Environmental Impacts for Water Treatment Facilities
Water Intake
Raw Water Pumping Chemical_Alum Chemical_Sulfuric Coagulation Sedimentation Filtration Chemical_Hypo Chlorine Contact Entire Facility
Impact category Water intake Water intake Water intake Water intake Water intake Water intake Water intake Water intake Water intake
Unit liter liter liter liter liter liter liter liter liter1 Total 4.43E+08 1.02E+09 3.72E+08 5.72E+07 3.85E+07 2.61E+07 8.22E+08 2.76E+07 2.80E+09
Percentage 16% 36% 13% 2% 1% 1% 29% 1% 100%2 Equipment3 Pumps and compressors 0.00E+00 0.00E+00 0.00E+00 0.00E+00 0.00E+00 0.00E+00 0.00E+00 0.00E+00 0.00E+004 Blowers and fans 0.00E+00 0.00E+00 0.00E+00 0.00E+00 0.00E+00 0.00E+00 0.00E+00 0.00E+00 0.00E+005 Measuring and dispensing pumps 0.00E+00 0.00E+00 0.00E+00 0.00E+00 0.00E+00 0.00E+00 0.00E+00 0.00E+00 0.00E+006 Conveyors and conveying equipment 0.00E+00 0.00E+00 0.00E+00 0.00E+00 0.00E+00 0.00E+00 0.00E+00 0.00E+00 0.00E+007 Industrial trucks and tractors 0.00E+00 0.00E+00 0.00E+00 0.00E+00 0.00E+00 0.00E+00 0.00E+00 0.00E+00 0.00E+008 Pipe, valves, and pipe fittings 0.00E+00 0.00E+00 0.00E+00 0.00E+00 0.00E+00 0.00E+00 0.00E+00 0.00E+00 0.00E+009 Plumbing fixture fittings and trim 0.00E+00 0.00E+00 0.00E+00 0.00E+00 0.00E+00 0.00E+00 0.00E+00 0.00E+00 0.00E+0010 Turbines and turbine generator sets 0.00E+00 0.00E+00 0.00E+00 0.00E+00 0.00E+00 0.00E+00 0.00E+00 0.00E+00 0.00E+0011 Motors and generators 0.00E+00 0.00E+00 0.00E+00 0.00E+00 0.00E+00 0.00E+00 0.00E+00 0.00E+00 0.00E+0012 Water supply and sewerage systems 0.00E+00 0.00E+00 0.00E+00 0.00E+00 0.00E+00 0.00E+00 0.00E+00 0.00E+00 0.00E+0013 Material14 Reinforcing steel, at plant/RER U 1.58E+06 8.30E+01 3.37E+01 1.52E+06 4.05E+06 8.35E+05 5.22E+01 2.81E+06 1.08E+0715 Concrete, normal, at plant/CH U 1.66E+06 1.48E+08 6.22E+07 1.84E+06 4.70E+06 9.85E+05 9.42E+07 2.89E+06 3.16E+0816 Concrete (reinforced) I 0.00E+00 0.00E+00 0.00E+00 0.00E+00 0.00E+00 0.00E+00 0.00E+00 0.00E+00 0.00E+0017 Brick, at plant/RER U 0.00E+00 0.00E+00 0.00E+00 0.00E+00 0.00E+00 0.00E+00 0.00E+00 0.00E+00 0.00E+0018 Wood board ETH U 0.00E+00 0.00E+00 0.00E+00 0.00E+00 0.00E+00 0.00E+00 0.00E+00 0.00E+00 0.00E+0019 Sand ETH U 0.00E+00 0.00E+00 0.00E+00 0.00E+00 0.00E+00 1.58E+04 0.00E+00 0.00E+00 1.58E+0420 Hard coal mix, at regional storage/UCTE U 0.00E+00 0.00E+00 0.00E+00 0.00E+00 0.00E+00 5.12E+05 0.00E+00 0.00E+00 5.12E+0521 Gravel ETH U 0.00E+00 0.00E+00 0.00E+00 0.00E+00 0.00E+00 8.28E+03 0.00E+00 0.00E+00 8.28E+0322 HDPE pipes E 0.00E+00 0.00E+00 0.00E+00 0.00E+00 0.00E+00 5.86E+06 0.00E+00 0.00E+00 5.86E+0623 PVC pipe E 7.65E+05 0.00E+00 0.00E+00 1.53E+05 1.53E+05 3.06E+05 0.00E+00 1.53E+05 1.53E+06
24
Glass fibre reinforced plastic, polyamide, injection moulding, at plant/RER U 0.00E+00 0.00E+00 0.00E+00 0.00E+00 0.00E+00 0.00E+00 0.00E+00 0.00E+00 0.00E+00
25
Glass fibre reinforced plastic, polyester resin, hand lay-up, at plant/RER U 0.00E+00 5.00E+05 1.00E+05 0.00E+00 1.32E+06 4.26E+05 2.50E+05 0.00E+00 2.59E+06
26 Polyethylene, HDPE, granulate, at plant/RER U 0.00E+00 0.00E+00 0.00E+00 0.00E+00 0.00E+00 0.00E+00 0.00E+00 0.00E+00 0.00E+0027 St13 I - Material 0.00E+00 0.00E+00 0.00E+00 0.00E+00 0.00E+00 0.00E+00 0.00E+00 0.00E+00 0.00E+0028 Copper I - Material 0.00E+00 0.00E+00 0.00E+00 0.00E+00 0.00E+00 0.00E+00 0.00E+00 0.00E+00 0.00E+00
29
Copper product manufacturing, average metal working/RER U 0.00E+00 0.00E+00 0.00E+00 0.00E+00 0.00E+00 0.00E+00 0.00E+00 0.00E+00 0.00E+00
30 Aluminium, production mix, at plant/RER U - Material 0.00E+00 0.00E+00 0.00E+00 0.00E+00 0.00E+00 0.00E+00 0.00E+00 0.00E+00 0.00E+00
31
Aluminium product manufacturing, average metal working/RER U - Processing 0.00E+00 0.00E+00 0.00E+00 0.00E+00 0.00E+00 0.00E+00 0.00E+00 0.00E+00 0.00E+00
32 Chemical
33
Sodium hydroxide, 50% in H2O, production mix, at plant/RER U 0.00E+00 0.00E+00 0.00E+00 0.00E+00 0.00E+00 0.00E+00 0.00E+00 0.00E+00 0.00E+00
34 Sodium hypochlorite, 15% in H2O, at plant/RER U 0.00E+00 0.00E+00 0.00E+00 0.00E+00 0.00E+00 0.00E+00 7.19E+08 0.00E+00 7.19E+0835 Lime, hydrated, packed, at plant/CH U 0.00E+00 0.00E+00 0.00E+00 0.00E+00 0.00E+00 0.00E+00 0.00E+00 0.00E+00 0.00E+0036 Quicklime, milled, packed, at plant/CH U 0.00E+00 0.00E+00 0.00E+00 0.00E+00 0.00E+00 0.00E+00 0.00E+00 0.00E+00 0.00E+0037 Sulphuric acid, liquid, at plant/RER U 0.00E+00 0.00E+00 3.01E+08 0.00E+00 0.00E+00 0.00E+00 0.00E+00 0.00E+00 3.01E+0838 Aluminium sulphate, powder, at plant/RER U 0.00E+00 8.59E+08 0.00E+00 0.00E+00 0.00E+00 0.00E+00 0.00E+00 0.00E+00 8.59E+0839 Iron (III) chloride, 40% in H2O, at plant/CH U 0.00E+00 0.00E+00 0.00E+00 0.00E+00 0.00E+00 0.00E+00 0.00E+00 0.00E+00 0.00E+00
40
Hydrochloric acid, from the reaction of hydrogen with chlorine, at plant/RER U 0.00E+00 0.00E+00 0.00E+00 0.00E+00 0.00E+00 0.00E+00 0.00E+00 0.00E+00 0.00E+00
41 Hydrochloric acid, 30% in H2O, at plant/RER U 0.00E+00 0.00E+00 0.00E+00 0.00E+00 0.00E+00 0.00E+00 0.00E+00 0.00E+00 0.00E+00
42
Phosphoric acid, industrial grade, 85% in H2O, at plant/RER U 0.00E+00 0.00E+00 0.00E+00 0.00E+00 0.00E+00 0.00E+00 0.00E+00 0.00E+00 0.00E+00
43
Ammonium sulphate, as N, at regional storehouse/RER U 0.00E+00 0.00E+00 0.00E+00 0.00E+00 0.00E+00 0.00E+00 0.00E+00 0.00E+00 0.00E+00
44 Energy45 Electricity, high voltage, at grid/US U 4.39E+08 8.39E+06 8.39E+06 5.37E+07 2.83E+07 1.71E+07 8.39E+06 2.18E+07 5.85E+0846 Natural gas, at consumer/RNA U 0.00E+00 0.00E+00 0.00E+00 0.00E+00 0.00E+00 0.00E+00 0.00E+00 0.00E+00 0.00E+00

Water Research Foundation
LIFE CYCLE INVENTORY AND LIFE CYCLE IMPACT ASSESSMENT DATABASE
Life Cyccle Environmental Impacts for Water Treatment Facilities
Operational Phase Energy Consumption by ProcessOperational Phase Energy Consumption by Process
Process
Operational Phase Electricity, high voltage, at
grid/US U
Global Warming Contributed by
Operational Phase Power
Embedded Global
Warming Total Global
WarmingkWh g CO2 eq g CO2 eq g CO2 eq
Raw Water Pumping 1.64E+07 1.23E+10 2.46E+08 1.25E+10Chemical_Alum 3.14E+05 2.35E+08 2.01E+10 2.03E+10
Chemical_Sulfuric 3.14E+05 2.35E+08 4.72E+09 4.96E+09Coagulation 2.01E+06 1.50E+09 4.18E+08 1.92E+09
Sedimentation 1.06E+06 7.91E+08 7.36E+08 1.53E+09Filtration 6.40E+05 4.79E+08 5.13E+08 9.92E+08
Chemical_Hypo 3.14E+05 2.35E+08 1.48E+10 1.51E+10Chlorine Contact 8.14E+05 6.09E+08 3.80E+08 9.89E+08
Total 2.19E+07 1.64E+10 4.19E+10 5.83E+10
Global Warming Contributed by Operational Phase Power g CO2 eq
Embedded Global Warming g CO2 eq
50%60%70%80%90%
100%
Embedded Global Warming g CO2 eq
0%10%20%30%40%

Life Cycle Inventory and Life Cylce Impact Assessment Database Quick Guide
LIFE CYCLE INVENTORY AND LIFE CYCLE IMPACT ASSESSMENT DATABASE
QUICK GUIDE
Click on the image or click on "Main" Workbook to startClick on the image or click on "Main" Workbook to start.
On Main page, user can click on
4 4
1
5
1
2
33
4

Life Cycle Inventory and Life Cylce Impact Assessment Database Quick Guide
On Main Workbook, check the boxes to select water treatment moduels and assemble your water
treatment plant. New workbook will be generated when the corresponding checkboxes are selected.
1treatment plant. New workbook will be generated when the corresponding checkboxes are selected.
1
Input plant capacity. Adjust life cycle length and unit cost for electricity.2
Review result summary in this area. Use drop down menu to view environmental
impact results for individual process or entire treatment facility.
3
Click on the expand and collapse hidden details to view breakdown results by inventory items
(e.g., material, energy) and impact data for additional environmental categories.4

Life Cycle Inventory and Life Cylce Impact Assessment Database Quick Guide
Use the buttons to view results of additional analysis5
Carbon Emission Analysis Detailed Breakdown Results by Inventory Item
(e.g., material, energy) and by process area (e.g., coagulation, sedimentation).

Life Cycle Inventory and Life Cylce Impact Assessment Database Quick Guide
Water Intake Analysis Detailed Breakdown Results by Inventory Item
(e.g., material, energy) and by process area (e.g., coagulation, sedimentation).
Energy analysis for energy consumed during the operation of the water treatment
facility versus the embedded energy used for producing the chemicals, equipment,
material, and energy.

Life Cycle Inventory and Life Cylce Impact Assessment Database Quick Guide
Material inventory summary, environmental impacts asscoiated with unit quantity of
material and energy and total environmental impacts associated with the entire water
treatment facility.
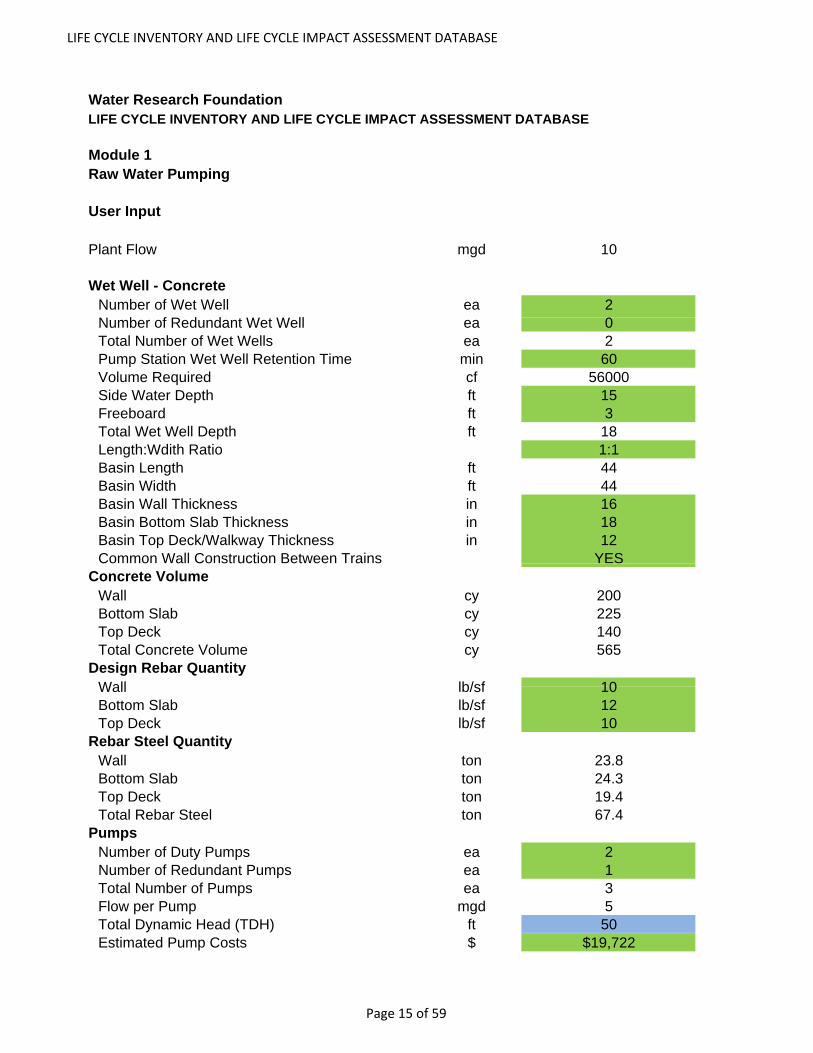
LIFE CYCLE INVENTORY AND LIFE CYCLE IMPACT ASSESSMENT DATABASE
Water Research Foundation LIFE CYCLE INVENTORY AND LIFE CYCLE IMPACT ASSESSMENT DATABASE
Module 1Raw Water Pumping
User Input
Plant Flow mgd 10Note: Flow capacity is limited to 80 mgd.
Wet Well - ConcreteNumber of Wet Well ea 2N b f R d d t W t W ll 0Number of Redundant Wet Well ea 0Total Number of Wet Wells ea 2Pump Station Wet Well Retention Time min 60Volume Required cf 56000Side Water Depth ft 15Freeboard ft 3Total Wet Well Depth ft 18Length:Wdith Ratio 1:1Basin Length ft 44Basin Width ft 44Basin Wall Thickness in 16Basin Bottom Slab Thickness in 18Basin Top Deck/Walkway Thickness in 12Common Wall Construction Between Trains YES
Concrete VolumeWall cy 200Bottom Slab cy 225Top Deck cy 140Total Concrete Volume cy 565
Design Rebar QuantityWall lb/sf 10Wall lb/sf 10Bottom Slab lb/sf 12Top Deck lb/sf 10
Rebar Steel QuantityWall ton 23.8Bottom Slab ton 24.3Top Deck ton 19.4T t l R b St l t 67 4Total Rebar Steel ton 67.4
PumpsNumber of Duty Pumps ea 2Number of Redundant Pumps ea 1Total Number of Pumps ea 3Flow per Pump mgd 5Total Dynamic Head (TDH) ft 50Estimated Pump Costs $ $19,722
Page 15 of 59

LIFE CYCLE INVENTORY AND LIFE CYCLE IMPACT ASSESSMENT DATABASE
Water Research Foundation LIFE CYCLE INVENTORY AND LIFE CYCLE IMPACT ASSESSMENT DATABASE
Module 1Raw Water PumpingPumping Energy
Break Horsepower (BHP) 44Break Horsepower (BHP) 44Efficiency 0.75Motor Efficiency 0.95Variable Frequency Drive (VFD) Efficiency 0.98Motor Size HP 63Motor Size KW 47Run Time per Day hr/day 24R D W k d / k 7Run Day per Week day/week 7Online Factor % 100%Power Consumption kWh/year 819769Electricity Cost $/kwhr 0.08Power Cost $/year $65,582
Piping and Misc.Pipe Length ft 500Maximum Design Velocity fps 8Pipe Diameter inches 20
Type of Pipes PVC_Schedule 80Weight per Linear Foot lb/lf 45.30Total Pipe Weight lb 22652
Estimated Pipe, Valve, and Fittings $ $5,000
Module Inventory
Page 16 of 59

LIFE CYCLE INVENTORY AND LIFE CYCLE IMPACT ASSESSMENT DATABASE
Water Research Foundation LIFE CYCLE INVENTORY AND LIFE CYCLE IMPACT ASSESSMENT DATABASE
Module 1Raw Water Pumping
Process Unit Raw Influent PSProcess Unit Raw Influent PSEquipment
Pumps and compressors USD $19,722Blowers and fans USDMeasuring and dispensing pumps USDConveyors and conveying equipment USDIndustrial trucks and tractors USDPi l d i fitti USDPipe, valves, and pipe fittings USDPlumbing fixture fittings and trim USDTurbines and turbine generator sets USDMotors and generators USDWater supply and sewerage systems USD
MaterialReinforcing steel, at plant/RER U kg 61,291Concrete, normal, at plant/CH U m3 432Concrete (reinforced) I kgBrick, at plant/RER U kgWood board ETH U kgSand ETH U kgHard coal mix, at regional storage/UCTE U kgGravel ETH U kggHDPE pipes E kgPVC pipe E kg 10,296Glass fibre reinforced plastic, polyamide, injection moulding, at plant/RER U kgGlass fibre reinforced plastic, polyester resin, hand lay-up, at plant/RER U kg
Polyethylene, HDPE, granulate, at plant/RER U kg
St13 I - Material kgCopper I - Material kgCopper product manufacturing, average metal working/RER U kg
Aluminium, production mix, at plant/RER U - Material kgMaterial g
Aluminium product manufacturing, average metal working/RER U - Processing kg
ChemicalSodium hydroxide, 50% in H2O, production mix, at plant/RER U kgSodium hypochlorite, 15% in H2O, at plant/RER U kgLime, hydrated, packed, at plant/CH U kg
Page 17 of 59

LIFE CYCLE INVENTORY AND LIFE CYCLE IMPACT ASSESSMENT DATABASE
Water Research Foundation LIFE CYCLE INVENTORY AND LIFE CYCLE IMPACT ASSESSMENT DATABASE
Module 1Raw Water Pumping
Quicklime, milled, packed, at plant/CH U kgSulphuric acid liquid at plant/RER U kgSulphuric acid, liquid, at plant/RER U kgAluminium sulphate, powder, at plant/RER U kgIron (III) chloride, 40% in H2O, at plant/CH U kgHydrochloric acid, from the reaction of hydrogen with chlorine, at plant/RER U kg
Hydrochloric acid, 30% in H2O, at plant/RER U kg
Phosphoric acid industrial grade 85% in H2O atPhosphoric acid, industrial grade, 85% in H2O, at plant/RER U kg
Ammonium sulphate, as N, at regional storehouse/RER U kg
Energy
Electricity, high voltage, at grid/US U (Life Cycle) kWh 16,395,384Natural gas, at consumer/RNA U MJ
Notes and Disclaimers:
1. This represents a conceptual level analysis. The structure was simplifed as shown below. p p y pNo structural details such as special foundation requirements, piping penetrations, overflow, perforated walls, gates and valves were considered. Assume single wall thickness, slab thickness and deck thickness. This could be detailed in future phase of research.2. No site specific civil site work was included in this analysis. No power supply infrastructure is included. No control and instruments were included.3. The equipment costs included herein are based on generic equipment used for similar facility. Prices were not verified in this phase and should be further developed in futurefacility. Prices were not verified in this phase and should be further developed in future phases.4. No residuals handling facility was included in the study boundary.
Page 18 of 59

LIFE CYCLE INVENTORY AND LIFE CYCLE IMPACT ASSESSMENT DATABASE
Water Research Foundation LIFE CYCLE INVENTORY AND LIFE CYCLE IMPACT ASSESSMENT DATABASE
Module 1Raw Water Pumping
Page 19 of 59

Water Research Foundation LIFE CYCLE INVENTORY AND LIFE CYCLE IMPACT ASSESSMENT DATABASE
Module 2Chemical - Alum
User Input
Plant Flow mgd 10
Chemical DescriptionType of Chemicals Alum 50%D /L 40Dosage mg/L 40Design Storage day 30Concentration 50%Specific Gravity 1.3Chemical Usage lb/day 6664Chemical Usage gallon per day 615Run Time per Day hr/day 24Run Day per Week day/week 7Online Factor % 100%Chemical Usage lb/year 2432360Chemical Storage SystemStorage Volume gallon 18439Number of Duty Chemical Storage Tank ea 2Number of Redundant Storage Tank ea 0Number of Redundant Storage Tank ea 0Total Number of Storage Tank ea 2Chemical Tank Diameter ft 12
Chemical Tank Height (excluding freeboard) ft 11
Chemical Storage Tank Volume gallons 10000Chemical Storage Tank Material Fiber GlassTotal Material Weight lb 7000Total Material Weight lb 7000Chemical Metering PumpsNumber of Duty Metering Pumps ea 1Number of Redundant Metering Pumps ea 1Total Number of Metering Pumps ea 2Estimated Total Chemical Metering Pump and Misc. Equipment Costs $ $5,000E C tiEnergy ConsumptionMisc Equipment Size HP 0.2Misc Equipment Size KW 0.1Run Time per Day hr/day 24Run Day per Week day/week 7Online Factor % 100%Power Consumption kWh/year 15678Electricity Cost $/kwhr 0.08Power Cost $/year $1,254

Water Research Foundation LIFE CYCLE INVENTORY AND LIFE CYCLE IMPACT ASSESSMENT DATABASE
Module 2Chemical - Alum
Chemical Containment AreaContainment Area Depth ft 6Containment Area Width ft 18Containment Area Length ft 19Wall Thickness in 16B tt Sl b Thi k i 18Bottom Slab Thickness in 18Concrete VolumeWall cy 22Bottom Slab cy 21Total Concrete Volume cy 42Design Rebar QuantityWall lb/sf 10Bottom Slab lb/sf 12Rebar Steel QuantityWall ton 2.2Bottom Slab ton 2.0Total Rebar Steel ton 4.2

Water Research Foundation LIFE CYCLE INVENTORY AND LIFE CYCLE IMPACT ASSESSMENT DATABASE
Module 2Chemical - Alum
Module Inventory
Process Unit ChemicalEquipmentPumps and compressors USDBlowers and fans USDM i d di i USD $5 000Measuring and dispensing pumps USD $5,000Conveyors and conveying equipment USDIndustrial trucks and tractors USDPipe, valves, and pipe fittings USDPlumbing fixture fittings and trim USDTurbines and turbine generator sets USDMotors and generators USDWater supply and sewerage systems USDMaterialReinforcing steel, at plant/RER U kg 3Concrete, normal, at plant/CH U m3 38,477Concrete (reinforced) I kgBrick, at plant/RER U kgWood board ETH U kgWood board ETH U kgSand ETH U kgHard coal mix, at regional storage/UCTE U kgGravel ETH U kgHDPE pipes E kgPVC pipe E kgGlass fibre reinforced plastic, polyamide, injection moulding at plant/RER U kginjection moulding, at plant/RER U kgGlass fibre reinforced plastic, polyester resin, hand lay-up, at plant/RER U kg 3,182
Polyethylene, HDPE, granulate, at plant/RER U kg
St13 I - Material kgCopper I - Material kgC d t f t i t lCopper product manufacturing, average metal working/RER U kg
Aluminium, production mix, at plant/RER U - Material kg
Aluminium product manufacturing, average metal working/RER U - Processing kg
ChemicalSodium hydroxide, 50% in H2O, production mix, at plant/RER U kg

Water Research Foundation LIFE CYCLE INVENTORY AND LIFE CYCLE IMPACT ASSESSMENT DATABASE
Module 2Chemical - Alum
Sodium hypochlorite, 15% in H2O, at plant/RER U kgLime, hydrated, packed, at plant/CH U kgQuicklime, milled, packed, at plant/CH U kgSulphuric acid, liquid, at plant/RER U kg
Aluminium sulphate, powder, at plant/RER U kg 22 112 364p , p , p kg 22,112,364
Iron (III) chloride, 40% in H2O, at plant/CH U kgHydrochloric acid, from the reaction of hydrogen with chlorine, at plant/RER U kg
Hydrochloric acid, 30% in H2O, at plant/RER U kg
Phosphoric acid, industrial grade, 85% in H2O, at plant/RER U kg
Ammonium sulphate, as N, at regional storehouse/RER U kg
EnergyElectricity, high voltage, at grid/US U (Life Cycle) kWh 313,552y )Natural gas, at consumer/RNA U MJ
Notes and Disclaimers:
1. This represents a conceptual level analysis. No structural details such as special foundation requirements, piping penetrations, overflow, perforated walls, gates and valves were considered.requirements, piping penetrations, overflow, perforated walls, gates and valves were considered. Assume single wall thickness, slab thickness and deck thickness. This could be detailed in future phase of research.2. No site specific civil site work was included in this analysis. No power supply infrastructure is included. No control and instruments were included.3. The equipment costs included herein are based on generic equipment used for similar facility. Prices were not verified in this phase and should be further developed in future phases.4 No residuals handling facility was included in the study boundary4. No residuals handling facility was included in the study boundary.

Water Research Foundation LIFE CYCLE INVENTORY AND LIFE CYCLE IMPACT ASSESSMENT DATABASE
Module 3Chemical - Sulfuric Acid
User Input
Plant Flow mgd 10
Chemical DescriptionType of Chemicals Sulfuric Acid 93%D /L 20Dosage mg/L 20Design Storage day 30Concentration 93%Specific Gravity 1.84Chemical Usage lb/day 1791.397849Chemical Usage gallon per day 117Run Time per Day hr/day 24Run Day per Week day/week 7Online Factor % 100%Chemical Usage lb/year 653860Chemical Storage SystemStorage Volume 3502Number of Duty Chemical Storage Tank ea 2Number of Redundant Storage Tank ea 0Number of Redundant Storage Tank ea 0Total Number of Storage Tank ea 2Chemical Tank Diameter ft 12
Chemical Tank Height (excluding freeboard) ft 2
Chemical Storage Tank Volume gallons 2000Chemical Storage Tank Material Fiber GlassTotal Material Weight lb 1400Total Material Weight lb 1400Chemical Metering PumpsNumber of Duty Metering Pumps ea 1Number of Redundant Metering Pumps ea 1Total Number of Metering Pumps ea 2Estimated Total Chemical Metering Pump and Misc. Equipment Costs $ $5,000E C tiEnergy ConsumptionMisc Equipment Size HP 0.2Misc Equipment Size KW 0.1Run Time per Day hr/day 24Run Day per Week day/week 7Online Factor % 100%Power Consumption kWh/year 15678Electricity Cost $/kwhr 0.08Power Cost $/year $1,254

Water Research Foundation LIFE CYCLE INVENTORY AND LIFE CYCLE IMPACT ASSESSMENT DATABASE
Module 3Chemical - Sulfuric Acid
Chemical Containment AreaContainment Area Depth ft 6Containment Area Width ft 18Containment Area Length ft 4Wall Thickness in 16Bottom Slab Thickness in 18Concrete VolumeConcrete VolumeWall cy 13Bottom Slab cy 5Total Concrete Volume cy 18Design Rebar QuantityWall lb/sf 10Bottom Slab lb/sf 12Rebar Steel QuantityWall ton 1.3Bottom Slab ton 0.4Total Rebar Steel ton 1.7

Water Research Foundation LIFE CYCLE INVENTORY AND LIFE CYCLE IMPACT ASSESSMENT DATABASE
Module 3Chemical - Sulfuric Acid
Module InventoryModule Inventory
Process Unit ChemicalEquipmentPumps and compressors USDBlowers and fans USDMeasuring and dispensing pumps USD $5,000C d i i t USDConveyors and conveying equipment USDIndustrial trucks and tractors USDPipe, valves, and pipe fittings USDPlumbing fixture fittings and trim USDTurbines and turbine generator sets USDMotors and generators USDWater supply and sewerage systems USDMaterialReinforcing steel, at plant/RER U kg 1Concrete, normal, at plant/CH U m3 16,221Concrete (reinforced) I kgBrick, at plant/RER U kgWood board ETH U kgSand ETH U kgSand ETH U kg
Hard coal mix, at regional storage/UCTE U kgGravel ETH U kgHDPE pipes E kgPVC pipe E kgGlass fibre reinforced plastic, polyamide, injection moulding at plant/RER U kginjection moulding, at plant/RER U kgGlass fibre reinforced plastic, polyester resin, hand lay-up, at plant/RER U kg 636Polyethylene, HDPE, granulate, at plant/RER U kg
St13 I - Material kgCopper I - Material kgC d t f t iCopper product manufacturing, average metal working/RER U kg
Aluminium, production mix, at plant/RER U - Material kg
Aluminium product manufacturing, average metal working/RER U - Processing kg
Chemical

Water Research Foundation LIFE CYCLE INVENTORY AND LIFE CYCLE IMPACT ASSESSMENT DATABASE
Module 3Chemical - Sulfuric Acid
Sodium hydroxide 50% in H2O productionSodium hydroxide, 50% in H2O, production mix, at plant/RER U kgSodium hypochlorite, 15% in H2O, at plant/RER U kgLime, hydrated, packed, at plant/CH U kgQuicklime, milled, packed, at plant/CH U kgSulphuric acid, liquid, at plant/RER U kg 5,944,184
Aluminium sulphate, powder, at plant/RER U kg
Iron (III) chloride, 40% in H2O, at plant/CH U kgHydrochloric acid, from the reaction of hydrogen with chlorine, at plant/RER U kg
Hydrochloric acid, 30% in H2O, at plant/RER kgU kg
Phosphoric acid, industrial grade, 85% in H2O, at plant/RER U kg
Ammonium sulphate, as N, at regional storehouse/RER U kg
EnergyElectricity, high voltage, at grid/US U (Life y g g g (Cycle) kWh 313,552Natural gas, at consumer/RNA U MJ
Notes and Disclaimers:
1. This represents a conceptual level analysis. No structural details such as special foundation requirements, piping penetrations, overflow, perforated walls, gates and valvesfoundation requirements, piping penetrations, overflow, perforated walls, gates and valves were considered. Assume single wall thickness, slab thickness and deck thickness. This could be detailed in future phase of research.2. No site specific civil site work was included in this analysis. No power supply infrastructure is included. No control and instruments were included.3. The equipment costs included herein are based on generic equipment used for similar facility. Prices were not verified in this phase and should be further developed in future phasesphases.4. No residuals handling facility was included in the study boundary.

Water Research Foundation LIFE CYCLE INVENTORY AND LIFE CYCLE IMPACT ASSESSMENT DATABASE
Module 4Coagulation Flocculation
User Input
Plant Flow mgd 10Note: Flow capacity is limited to 80 mgd.
Rapid Mix Chamber- ConcreteNumber of Rapid Mix ea 1N b f R d d t R id Mi 1Number of Redundant Rapid Mix ea 1Total Number of Rapid Mix ea 2Rapid Mix Retention Time min 1Volume Required cf 930Side Water Depth ft 14Freeboard ft 2Total Rapid Mix Depth ft 16Length:Wdith Ratio 1:1Basin Length ft 8Basin Width ft 8Basin Wall Thickness in 16Basin Bottom Slab Thickness in 18Basin Top Deck/Walkway Thickness in 12
Common Wall Construction Between Trains YESConcrete VolumeWall cy 32Bottom Slab cy 9Top Deck cy 5Total Concrete Volume cy 46Design Rebar QuantityDesign Rebar QuantityWall lb/sf 10Bottom Slab lb/sf 12Top Deck lb/sf 10Rebar Steel QuantityWall ton 3.3Bottom Slab ton 1.0T D k t 0 7Top Deck ton 0.7Total Rebar Steel ton 4.9MixersNumber of Duty Mixers ea 1Number of Redundant Mixer ea 1Total Number of Mixers ea 2Viscosity(µ) lbf-sec/sf 0.000018G Value 1/s 500P=G^2*V*µ ft-lbf/sec 4185

Water Research Foundation LIFE CYCLE INVENTORY AND LIFE CYCLE IMPACT ASSESSMENT DATABASE
Module 4Coagulation Flocculation
Estimated Mixer Costs $ $64 000Estimated Mixer Costs $ $64,000Mixer EnergyBreak Horsepower (BHP) HP 8Efficiency 0.65Motor Efficiency 0.95Motor Size HP 12Motor Size KW 9R Ti D h /d 24Run Time per Day hr/day 24Run Day per Week day/week 7Online Factor % 100%Power Consumption kWh/year 80494Electricity Cost $/kwhr 0.08Power Cost $/year $6,440
Flocculation Tank - ConcreteType of Flocculation Tank Vertical, 3-Stage, ConcreteNumber of Flocculation Tank ea 1Number of Redundant Flocculation Tank ea 1Total Number of Flocculation Tank ea 2Flocculation Tank Retention Time min 30Volume Required cf 27835qSide Water Depth ft 14Freeboard ft 2Total Flocculation Tank Depth ft 16Length:Wdith Ratio 1:3Basin Length ft 77Basin Width ft 26Basin Wall Thickness in 16Basin Wall Thickness in 16Basin Bottom Slab Thickness in 18Separation Wall Thickness in 16Basin Top Deck/Walkway Thickness in 12Basin Top Walkway Width ft 5Number of Stages ea 3Number of Separation Wall per Train 2
Common Wall Construction Between Trains YESConcrete VolumeBasin Wall cy 264Bottom Slab cy 232Top Walkway cy 5Separation Wall Between Stages cy 81Total Concrete Volume cy 582Design Rebar Quantity
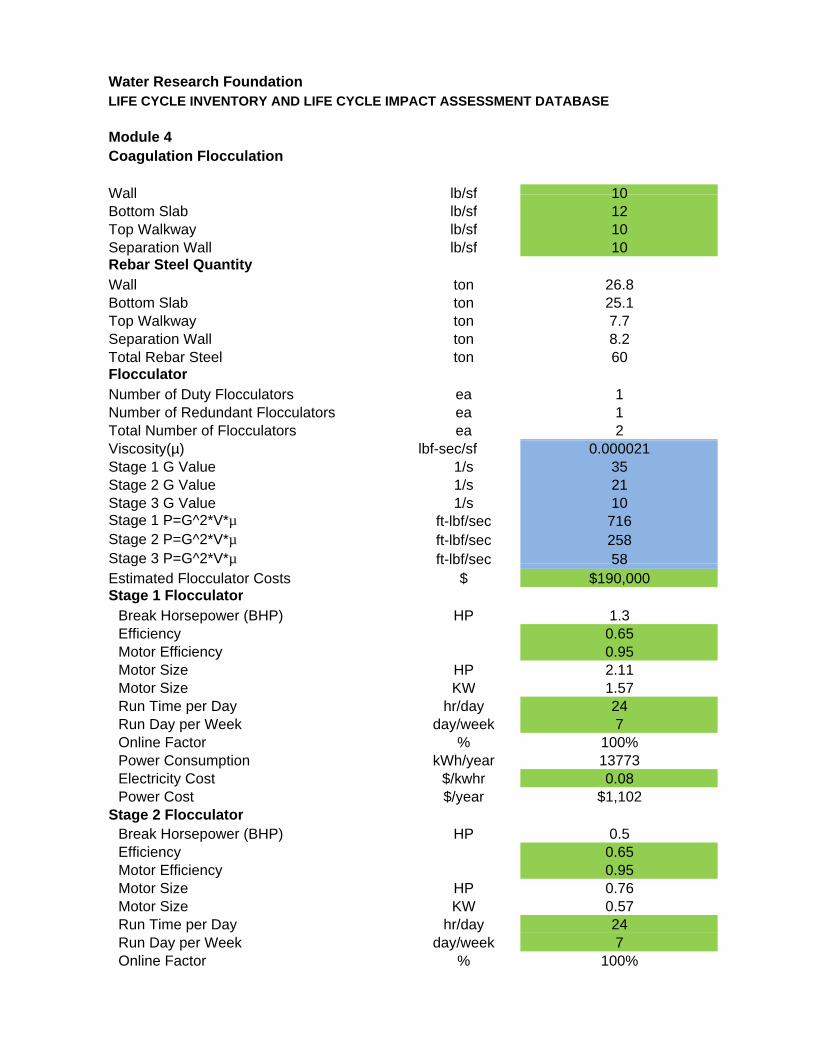
Water Research Foundation LIFE CYCLE INVENTORY AND LIFE CYCLE IMPACT ASSESSMENT DATABASE
Module 4Coagulation Flocculation
Wall lb/sf 10Wall lb/sf 10Bottom Slab lb/sf 12Top Walkway lb/sf 10Separation Wall lb/sf 10Rebar Steel QuantityWall ton 26.8Bottom Slab ton 25.1T W lk t 7 7Top Walkway ton 7.7Separation Wall ton 8.2Total Rebar Steel ton 60FlocculatorNumber of Duty Flocculators ea 1Number of Redundant Flocculators ea 1Total Number of Flocculators ea 2Viscosity(µ) lbf-sec/sf 0.000021Stage 1 G Value 1/s 35Stage 2 G Value 1/s 21Stage 3 G Value 1/s 10Stage 1 P=G^2*V*µ ft-lbf/sec 716Stage 2 P=G^2*V*µ ft-lbf/sec 258Stage 3 P=G^2*V*µ ft-lbf/sec 58g µ ft lbf/sec 58Estimated Flocculator Costs $ $190,000Stage 1 Flocculator
Break Horsepower (BHP) HP 1.3Efficiency 0.65Motor Efficiency 0.95Motor Size HP 2.11Motor Size KW 1 57Motor Size KW 1.57Run Time per Day hr/day 24Run Day per Week day/week 7Online Factor % 100%Power Consumption kWh/year 13773Electricity Cost $/kwhr 0.08Power Cost $/year $1,102
St 2 Fl l tStage 2 FlocculatorBreak Horsepower (BHP) HP 0.5Efficiency 0.65Motor Efficiency 0.95Motor Size HP 0.76Motor Size KW 0.57Run Time per Day hr/day 24Run Day per Week day/week 7Online Factor % 100%

Water Research Foundation LIFE CYCLE INVENTORY AND LIFE CYCLE IMPACT ASSESSMENT DATABASE
Module 4Coagulation Flocculation
Power Consumption kWh/year 4958Power Consumption kWh/year 4958Electricity Cost $/kwhr 0.08Power Cost $/year $397
Stage 3 FlocculatorBreak Horsepower (BHP) HP 0.11Efficiency 0.65Motor Efficiency 0.95M t Si HP 0 17Motor Size HP 0.17Motor Size KW 0.13Run Time per Day hr/day 24Run Day per Week day/week 7Online Factor % 100%Power Consumption kWh/year 1124Electricity Cost $/kwhr 0.08Power Cost $/year $90
Piping and Misc.Pipe Length ft 100Maximum Design Velocity fps 8Pipe Diameter inches 20Type of Pipes PVC_Schedule 40Weight per Linear Foot lb/lf 45.30g pTotal Pipe Weight lb 4530
Estimated Pipe, Valve, and Fittings $ $5,000

Water Research Foundation LIFE CYCLE INVENTORY AND LIFE CYCLE IMPACT ASSESSMENT DATABASE
Module 4Coagulation Flocculation
Module InventoryModule Inventory
Process Unit Coag-FloccEquipment
Pumps and compressors USD $254,000Blowers and fans USDMeasuring and dispensing pumps USDC d i i t USDConveyors and conveying equipment USDIndustrial trucks and tractors USDPipe, valves, and pipe fittings USDPlumbing fixture fittings and trim USDTurbines and turbine generator sets USDMotors and generators USDWater supply and sewerage systems USD
MaterialReinforcing steel, at plant/RER U kg 58,665Concrete, normal, at plant/CH U m3 480Concrete (reinforced) I kgBrick, at plant/RER U kgWood board ETH U kgSand ETH U kgSand ETH U kg
Hard coal mix, at regional storage/UCTE U kgGravel ETH U kgHDPE pipes E kgPVC pipe E kg 2,059
Glass fibre reinforced plastic, polyamide, injection moulding, at plant/RER U kgGlass fibre reinforced plastic, polyester resin, hand lay-up, at plant/RER U kgPolyethylene, HDPE, granulate, at plant/RER U kg
St13 I - Material kgC I M t i l kCopper I - Material kgCopper product manufacturing, average metal working/RER U kg
Aluminium, production mix, at plant/RER U - Material kg
Aluminium product manufacturing, average metal working/RER U - Processing kgmetal working/RER U Processing
Chemical

Water Research Foundation LIFE CYCLE INVENTORY AND LIFE CYCLE IMPACT ASSESSMENT DATABASE
Module 4Coagulation Flocculation
Sodium hydroxide 50% in H2O productionSodium hydroxide, 50% in H2O, production mix, at plant/RER U kgSodium hypochlorite, 15% in H2O, at plant/RER U kgLime, hydrated, packed, at plant/CH U kgQuicklime, milled, packed, at plant/CH U kgSulphuric acid, liquid, at plant/RER U kgAluminium sulphate powder at plant/RERAluminium sulphate, powder, at plant/RER U kgIron (III) chloride, 40% in H2O, at plant/CH U kgHydrochloric acid, from the reaction of hydrogen with chlorine, at plant/RER U kg
Hydrochloric acid, 30% in H2O, at kgplant/RER U kg
Phosphoric acid, industrial grade, 85% in H2O, at plant/RER U kg
Ammonium sulphate, as N, at regional storehouse/RER U kg
EnergyElectricity, high voltage, at grid/US U (Life y g g g (Cycle) kWh 2,006,982Natural gas, at consumer/RNA U MJ
Notes and Disclaimers:
1. This represents a conceptual level analysis. The structure was simplifed as shown below.1. This represents a conceptual level analysis. The structure was simplifed as shown below. No structural details such as special foundation requirements, piping penetrations, overflow, perforated walls, gates and valves were considered. Assume single wall thickness, slab thickness and deck thickness. This could be detailed in future phase of research.2. No site specific civil site work was included in this analysis. No power supply infrastructure is included. No control and instruments were included.3. The equipment costs included herein are based on generic equipment used for similar facility Prices were not verified in this phase and should be further developed in futurefacility. Prices were not verified in this phase and should be further developed in future phases.4. No residuals handling facility was included in the study boundary.

Water Research Foundation LIFE CYCLE INVENTORY AND LIFE CYCLE IMPACT ASSESSMENT DATABASE
Module 4Coagulation Flocculation

Water Research Foundation LIFE CYCLE INVENTORY AND LIFE CYCLE IMPACT ASSESSMENT DATABASE
Module 5Sedimentation
Plant Flow mgd 10Note: Flow capacity is limited to 80 mgd.
Type of Sedimentation Rectangular
Sedimentation - Concrete RectangularNumber of Sedimentation Basins ea 1N b f R d d t S di t ti
Circular Concrete Rectangular Concrete
Number of Redundant Sedimentation Basins ea 1Total Number of Sedimentation Basins ea 2Sedimentation Basins Retention Time min 120Volume Required cf 111340Surface Loading Rate gpm/sf 0.72Surface Area Required sf 9640Side Water Depth ft 14Freeboard ft 2Total Sedimentation Basin Depth ft 16Length:Wdith Ratio 1:1Basin Length ft 100Basin Width ft 100Actual Surface Area sf 10000Actual Retention Time min 151Basin Wall Thickness in 16Basin Bottom Slab Thickness in 18Basin Top Walkway Width ft 5Basin Top Deck/Walkway Thickness in 12
Common Wall Construction Between Trains YESCommon Wall Construction Between Trains YESConcrete VolumeWall cy 400Bottom Slab cy 1130Top Walkway cy 74Total Concrete Volume cy 1604Design Rebar QuantityWall lb/sf 10Wall lb/sf 10Bottom Slab lb/sf 12Top Walkway lb/sf 10Rebar Steel QuantityWall ton 40.0Bottom Slab ton 122.4Top Walkway ton 10.0Total Rebar Steel ton 172.4

Water Research Foundation LIFE CYCLE INVENTORY AND LIFE CYCLE IMPACT ASSESSMENT DATABASE
Module 5Sedimentation
Weir TroughWeir TroughType of Material FRPDesign Weir Loading gpm/ft 10Length of Troughs ft 347Depth of Troughs ft 3Width of Troughs ft 4Thickness of Material in 0.25D it f M t i l lb/ f 116Density of Material lb/cf 116Estimated Total FRP Weight per ft lb 18413

Water Research Foundation LIFE CYCLE INVENTORY AND LIFE CYCLE IMPACT ASSESSMENT DATABASE
Module 5Sedimentation
Sludge ScrapperNumber of Duty Scrapper ea 1Number of Redundant Scrapper ea 1Total Number of Scrapper ea 2Estimated Mixer Costs $ $190,000Mixer EnergyB k H (BHP) f All T i HP 5Break Horsepower (BHP) for All Trains HP 5Efficiency 0.65Motor Efficiency 0.95Motor Size HP 8Motor Size KW 6Run Time per Day hr/day 24Run Day per Week day/week 7Online Factor % 100%Power Consumption kWh/year 52893Electricity Cost $/kwhr 0.08
Power Cost $/year $4,231
Piping and Misc.Pipe Length ft 100p gMaximum Design Velocity fps 8Pipe Diameter inches 20Type of Pipes PVC_Schedule 40Weight per Linear Foot lb/lf 45.30Total Pipe Weight lb 4530
Estimated Pipe Valve and Fittings $ $5 000Estimated Pipe, Valve, and Fittings $ $5,000

Water Research Foundation LIFE CYCLE INVENTORY AND LIFE CYCLE IMPACT ASSESSMENT DATABASE
Module 5Sedimentation
Module Inventory
Process Unit SedimentationEquipment
Pumps and compressors USD $190,000Blowers and fans USDM i d di i USDMeasuring and dispensing pumps USDConveyors and conveying equipment USDIndustrial trucks and tractors USDPipe, valves, and pipe fittings USDPlumbing fixture fittings and trim USDTurbines and turbine generator sets USDMotors and generators USDWater supply and sewerage systems USD
MaterialReinforcing steel, at plant/RER U kg 156,738Concrete, normal, at plant/CH U m3 1,226Concrete (reinforced) I kgBrick, at plant/RER U kgWood board ETH U kgWood board ETH U kgSand ETH U kg
Hard coal mix, at regional storage/UCTE U kgGravel ETH U kgHDPE pipes E kgPVC pipe E kg 2,059Glass fibre reinforced plastic polyamideGlass fibre reinforced plastic, polyamide, injection moulding, at plant/RER U kgGlass fibre reinforced plastic, polyester resin, hand lay-up, at plant/RER U kg 8,370Polyethylene, HDPE, granulate, at plant/RER U kg
St13 I - Material kgC I M t i l kCopper I - Material kgCopper product manufacturing, average metal working/RER U kg
Aluminium, production mix, at plant/RER U - Material kg
Aluminium product manufacturing, average metal working/RER U - kgProcessing
Chemical

Water Research Foundation LIFE CYCLE INVENTORY AND LIFE CYCLE IMPACT ASSESSMENT DATABASE
Module 5Sedimentation
Sodium hydroxide 50% in H2OSodium hydroxide, 50% in H2O, production mix, at plant/RER U kgSodium hypochlorite, 15% in H2O, at plant/RER U kgLime, hydrated, packed, at plant/CH U kgQuicklime, milled, packed, at plant/CH U kgSulphuric acid, liquid, at plant/RER U kgAluminium sulphate powder at plant/RERAluminium sulphate, powder, at plant/RER U kgIron (III) chloride, 40% in H2O, at plant/CH U kgHydrochloric acid, from the reaction of hydrogen with chlorine, at plant/RER U kg
Hydrochloric acid, 30% in H2O, at kgplant/RER U kg
Phosphoric acid, industrial grade, 85% in H2O, at plant/RER U kg
Ammonium sulphate, as N, at regional storehouse/RER U kg
EnergyElectricity, high voltage, at grid/US U (Life y g g g (Cycle) kWh 1,057,868Natural gas, at consumer/RNA U MJ
Notes and Disclaimers:Notes and Disclaimers:
1. This represents a conceptual level analysis. The structure was simplifed as shown below. No structural details such as special foundation requirements, piping penetrations, overflow, perforated walls, gates and valves were considered. Assume single wall thickness, slab thickness and deck thickness. This could be detailed in future phase of research.2. No site specific civil site work was included in this analysis. No power supply infrastructure is included No control and instruments were includedinfrastructure is included. No control and instruments were included.3. The equipment costs included herein are based on generic equipment used for similar facility. Prices were not verified in this phase and should be further developed in future phases.4. No residuals handling facility was included in the study boundary.

Water Research Foundation LIFE CYCLE INVENTORY AND LIFE CYCLE IMPACT ASSESSMENT DATABASE
Module 5Sedimentation

Water Research Foundation LIFE CYCLE INVENTORY AND LIFE CYCLE IMPACT ASSESSMENT DATABASE
Module 6Filtration
User Input
Plant Flow mgd 10Note: Flow capacity is limited to 80 mgd.
Type of Filter Box Rectangular ConcreteType of Filter Media Dual MediaFilt C tFilter - Concrete
Number of Duty Filters ea 4 (min 4)Number of Redundant Filters ea 1Total Number of Filters ea 5Surface Loading Rate gpm/sf 6Surface Area Required sf 1160Side Water Depth ft 18Freeboard ft 2Total Filter Depth ft 20Length:Wdith Ratio 1:2Basin Length ft 25Basin Width ft 13Actual Surface Area sf 1300Basin Wall Thickness in 16Basin Bottom Slab Thickness in 18Basin Top Walkway Width ft 5Basin Top Deck/Walkway Thickness in 12Common Wall Construction Between Trains YES
Concrete VolumeWall cy 212Bottom Slab cy 101Bottom Slab cy 101Top Walkway cy 23Total Concrete Volume cy 336
Design Rebar QuantityWall lb/sf 10Bottom Slab lb/sf 12Top Walkway lb/sf 10
R b St l Q titRebar Steel QuantityWall ton 21.5Bottom Slab ton 10.9Top Walkway ton 3.1Total Rebar Steel ton 35.5
Backwash TroughsType of Material FRPDesign Weir Loading gpm/ft 20Number of Troughs ea 2

Actual Weir Loading gpm/ft 17.4Depth of Troughs ft 3Width of Troughs ft 3Thickness of Material in 0.25Density of Material lb/cf 116Estimated Total FRP Weight per Trough lb 597Total FRP Weight lb 5970Total FRP Weight lb 5970
Filter MediaType of Media Dual MediaDepth of Media
Anthracite in 24Sand in 12Gravel in 6
Density of MediaDensity of MediaAnthracite lb/cf 50Sand lb/cf 115Gravel lb/cf 100
Volume of MediaAnthracite cf 3250Sand cf 1625G l f 812 5Gravel cf 812.5
Weight of MediaAnthracite lb 162500Sand lb 186875Gravel lb 81250
Meida Replacement Frequency years 10Replacement During Life Cycle 2Total Weight during Life Cycle
Anthracite lb 325000Sand lb 373750Gravel lb 162500
Type Underdrain MSCap Type SLength, in 48Width, in 11,Height, in 12Weight, lb 25HDEP Material Weight lb 276989
Backwash PumpsNumber of Duty Pumps ea 1Number of Redundant Pumps ea 1Total Number of Pumps ea 2Total Number of Pumps ea 2Design Backwash Surface Loading Rate gpm/sf 20Backwash Flow Rate gpm 6500Flow per Pump mgd 9.37TDH ft 25Estimated Pump Costs $ $12,395
Compressor and Air Blower Equipment Cos $ $18,593P i EPumping Energy
Break Horsepower (BHP) 41

Efficiency 0.75Motor Efficiency 0.95VFD Efficiency 0.98Motor Size HP 59Motor Size KW 44Run Time per Day hr/day 1.3Run Day per Week day/week 7Run Day per Week day/week 7Online Factor % 6%Power Consumption kWh/year 21328Total Power Including Compressor kWh/year 31991Electricity Cost $/kwhr 0.08Power Cost $/year $2,559
Piping and Misc.Pipe Length ft 200Pipe Length ft 200Maximum Design Velocity fps 8Pipe Diameter inches 20Type of Pipes PVC_Schedule 40Weight per Linear Foot lb/lf 45.30Total Pipe Weight lb 9061
Estimated Pipe, Valve, and Fittings $ $5,000

Module Inventory
Process Unit FiltrationEquipment
Pumps and compressors USD $12,395Blowers and fans USD $18,593Measuring and dispensing pumps USDMeasuring and dispensing pumps USDConveyors and conveying equipment USDIndustrial trucks and tractors USDPipe, valves, and pipe fittings USDPlumbing fixture fittings and trim USDTurbines and turbine generator sets USDMotors and generators USDWater supply and sewerage systems USDWater supply and sewerage systems USD
MaterialReinforcing steel, at plant/RER U kg 32,314Concrete, normal, at plant/CH U m3 257Concrete (reinforced) I kgBrick, at plant/RER U kgWood board ETH U kgSand ETH U kg 169,886
Hard coal mix, at regional storage/UCTE U kg 147,727Gravel ETH U kg 73,864HDPE pipes E kg 125,904PVC pipe E kg 4,119Glass fibre reinforced plastic, polyamide, p p yinjection moulding, at plant/RER U kgGlass fibre reinforced plastic, polyester resin, hand lay-up, at plant/RER U kg 2,714Polyethylene, HDPE, granulate, at kgSt13 I - Material kgCopper I - Material kgCopper product manufacturing, average kCopper product manufacturing, average metal working/RER U kg
Aluminium, production mix, at plant/RER U - kgAluminium product manufacturing, average metal working/RER U - Processing kg
ChemicalSodium hydroxide, 50% in H2O, production mix at plant/RER U kgmix, at plant/RER U kgSodium hypochlorite, 15% in H2O, at kgLime, hydrated, packed, at plant/CH U kgQuicklime, milled, packed, at plant/CH U kgSulphuric acid, liquid, at plant/RER U kgAluminium sulphate, powder, at plant/RER U kgIron (III) chloride, 40% in H2O, at plant/CH U kgH d hl i id f th ti fHydrochloric acid, from the reaction of hydrogen with chlorine, at plant/RER U kg

Hydrochloric acid, 30% in H2O, at plant/RER kgPhosphoric acid, industrial grade, 85% in H2O, at plant/RER U kg
Ammonium sulphate, as N, at regional storehouse/RER U kg
EnergyElectricity high voltage at grid/US U (Life kWh 639 829Electricity, high voltage, at grid/US U (Life kWh 639,829Natural gas, at consumer/RNA U MJ
Notes and Disclaimers:
1. This represents a conceptual level analysis. The structure was simplifed as shown below No structural details such as special foundation requirements pipingshown below. No structural details such as special foundation requirements, piping penetrations, overflow, perforated walls, gates and valves were considered. Assume single wall thickness, slab thickness and deck thickness. This could be detailed in future phase of research.2. No site specific civil site work was included in this analysis. No power supply infrastructure is included. No control and instruments were included.3. The equipment costs included herein are based on generic equipment used for i il f ilit P i t ifi d i thi h d h ld b f thsimilar facility. Prices were not verified in this phase and should be further
developed in future phases.4. No residuals handling facility was included in the study boundary.


Water Research Foundation LIFE CYCLE INVENTORY AND LIFE CYCLE IMPACT ASSESSMENT DATABASE
Module 7Sodium Hypochlorite
User Input
Plant Flow mgd 10
Chemical DescriptionType of Chemicals Sodium Hypochlorite 12.5%D /L 5Dosage mg/L 5Design Storage day 30Concentration 13%Specific Gravity 1.2Chemical Usage lb/day 3332Chemical Usage gallon per day 333Run Time per Day hr/day 24Run Day per Week day/week 7Online Factor % 100%Chemical Usage lb/year 1216180Chemical Storage SystemStorage Volume 9988Number of Duty Chemical Storage Tank ea 2Number of Redundant Storage Tank ea 0Number of Redundant Storage Tank ea 0Total Number of Storage Tank ea 2Chemical Tank Diameter ft 12
Chemical Tank Height (excluding freeboard) ft 6
Chemical Storage Tank Volume gallons 5000Chemical Storage Tank Material Fiber GlassTotal Material Weight lb 3500Total Material Weight lb 3500Chemical Metering PumpsNumber of Duty Metering Pumps ea 1Number of Redundant Metering Pumps ea 1Total Number of Metering Pumps ea 2Estimated Total Chemical Metering Pump and Misc. Equipment Costs $ $5,000E C tiEnergy ConsumptionMisc Equipment Size HP 0.2Misc Equipment Size KW 0.1Run Time per Day hr/day 24Run Day per Week day/week 7Online Factor % 100%Power Consumption kWh/year 15678Electricity Cost $/kwhr 0.08Power Cost $/year $1,254

Water Research Foundation LIFE CYCLE INVENTORY AND LIFE CYCLE IMPACT ASSESSMENT DATABASE
Module 7Sodium Hypochlorite
Chemical Containment AreaContainment Area Depth ft 6Containment Area Width ft 18Containment Area Length ft 9Wall Thickness in 16Bottom Slab Thickness in 18Concrete VolumeConcrete VolumeWall cy 16Bottom Slab cy 11Total Concrete Volume cy 27Design Rebar QuantityWall lb/sf 10Bottom Slab lb/sf 12Rebar Steel QuantityWall ton 1.6Bottom Slab ton 1.0Total Rebar Steel ton 2.6

Water Research Foundation LIFE CYCLE INVENTORY AND LIFE CYCLE IMPACT ASSESSMENT DATABASE
Module 7Sodium Hypochlorite
Module Inventory
Process Unit ChemicalEquipmentPumps and compressors USDBlowers and fans USDM i d di i USD $5 000Measuring and dispensing pumps USD $5,000Conveyors and conveying equipment USDIndustrial trucks and tractors USDPipe, valves, and pipe fittings USDPlumbing fixture fittings and trim USDTurbines and turbine generator sets USDMotors and generators USDWater supply and sewerage systems USDMaterialReinforcing steel, at plant/RER U kg 2Concrete, normal, at plant/CH U m3 24,567Concrete (reinforced) I kgBrick, at plant/RER U kgWood board ETH U kgWood board ETH U kgSand ETH U kgHard coal mix, at regional storage/UCTE U kgGravel ETH U kgHDPE pipes E kgPVC pipe E kgGlass fibre reinforced plastic, polyamide, injection moulding at plant/RER U kginjection moulding, at plant/RER U kgGlass fibre reinforced plastic, polyester resin, hand lay-up, at plant/RER U kg 1,591
Polyethylene, HDPE, granulate, at plant/RER U kg
St13 I - Material kgCopper I - Material kgC d t f t i t lCopper product manufacturing, average metal working/RER U kg
Aluminium, production mix, at plant/RER U - Material kg
Aluminium product manufacturing, average metal working/RER U - Processing kg
ChemicalSodium hydroxide, 50% in H2O, production mix, at plant/RER U kg

Water Research Foundation LIFE CYCLE INVENTORY AND LIFE CYCLE IMPACT ASSESSMENT DATABASE
Module 7Sodium Hypochlorite
Sodium hypochlorite 15% in H2O atSodium hypochlorite, 15% in H2O, at plant/RER U kg 11,056,182Lime, hydrated, packed, at plant/CH U kgQuicklime, milled, packed, at plant/CH U kgSulphuric acid, liquid, at plant/RER U kg
Aluminium sulphate, powder, at plant/RER U kg
Iron (III) chloride, 40% in H2O, at plant/CH U kgHydrochloric acid, from the reaction of hydrogen with chlorine, at plant/RER U kg
Hydrochloric acid, 30% in H2O, at plant/RER U kg
Phosphoric acid, industrial grade, 85% in H2O, kgat plant/RER U kg
Ammonium sulphate, as N, at regional storehouse/RER U kg
EnergyElectricity, high voltage, at grid/US U (Life Cycle) kWh 313,552Natural gas, at consumer/RNA U MJg
Notes and Disclaimers:
1. This represents a conceptual level analysis. No structural details such as special foundation requirements, piping penetrations, overflow, perforated walls, gates and valves were considered. Assume single wall thickness, slab thickness and deck thickness. This could be detailed in future phase of research.phase of research.2. No site specific civil site work was included in this analysis. No power supply infrastructure is included. No control and instruments were included.3. The equipment costs included herein are based on generic equipment used for similar facility. Prices were not verified in this phase and should be further developed in future phases.4. No residuals handling facility was included in the study boundary.

Water Research Foundation LIFE CYCLE INVENTORY AND LIFE CYCLE IMPACT ASSESSMENT DATABASE
Module 8Chlorine Contact Basin
User Input
Plant Flow mgd 10Note: Flow capacity is limited to 80 mgd.
Type of Chlorine Contact Basin Rectangular ConcreteChlorine Contact Basins - ConcreteN b f Chl i C t t B i 1Number of Chlorine Contact Basin ea 1Number of Redundant Chlorine Contact Basin ea 1Total Number of Chlorine Contact Basin ea 2Chlorine Contact Basin Retention Time min 30Volume Required cf 28000Side Water Depth ft 14Freeboard ft 2Total Chlorine Contact Basin Depth ft 16Length:Wdith Ratio 1:1Basin Length ft 45Basin Width ft 45Basin Wall Thickness in 16Basin Bottom Slab Thickness in 18Basin Top Deck Thickness in 12Baffle Wall Thickness in 12Design Width of Each Flow Channel ft 5Number of Baffle Wall 8
Common Wall Construction Between Trains YESConcrete VolumeConcrete VolumeWall cy 178Bottom Slab cy 235Concrete Cover cy 150Baffle Wall cy 379Total Concrete Volume cy 942Design Rebar QuantityW ll lb/ f 10Wall lb/sf 10Bottom Slab lb/sf 12Concrete Cover lb/sf 10Baffle Wall lb/sf 10Rebar Steel QuantityWall ton 18.0Bottom Slab ton 25.4Concrete Cover ton 20.3Baffle Wall ton 51.2

Water Research Foundation LIFE CYCLE INVENTORY AND LIFE CYCLE IMPACT ASSESSMENT DATABASE
Module 8Chlorine Contact Basin
Total Rebar Steel ton 114 8Total Rebar Steel ton 114.8Rapid Mix Chamber- ConcreteNumber of Rapid Mix ea 1Number of Redundant Rapid Mix ea 1Total Number of Rapid Mix ea 2Rapid Mix Retention Time min 0.5Volume Required cf 470Sid W t D th ft 14Side Water Depth ft 14Freeboard ft 2Total Rapid Mix Depth ft 16Length:Wdith Ratio 1:1Basin Length ft 6Basin Width ft 6Basin Wall Thickness in 16Basin Bottom Slab Thickness in 18Basin Top Deck/Walkway Thickness in 12
Common Wall Construction Between Trains YESConcrete VolumeWall cy 32Bottom Slab cy 9yTop Deck cy 2Total Concrete Volume cy 43Design Rebar QuantityWall lb/sf 10Bottom Slab lb/sf 12Top Deck lb/sf 10Rebar Steel QuantityRebar Steel QuantityWall ton 3.3Bottom Slab ton 1.0Top Deck ton 0.7Total Rebar Steel ton 4.9MixersNumber of Duty Mixers ea 1N b f R d d t Mi 1Number of Redundant Mixer ea 1Total Number of Mixers ea 2Viscosity(µ) lbf-sec/sf 0.000018G Value 1/s 500P=G^2*V*µ ft-lbf/sec 2115Estimated Mixer Costs $ $32,000.00Mixer EnergyBreak Horsepower (BHP) HP 4Efficiency 0.65

Water Research Foundation LIFE CYCLE INVENTORY AND LIFE CYCLE IMPACT ASSESSMENT DATABASE
Module 8Chlorine Contact Basin
Motor Efficiency 0 95Motor Efficiency 0.95Motor Size HP 6Motor Size KW 5Run Time per Day hr/day 24Run Day per Week day/week 7Online Factor % 100%Power Consumption kWh/year 40680Electricity Cost $/kwhr 0 08Electricity Cost $/kwhr 0.08Power Cost $/year $3,254Piping and Misc.Pipe Length ft 100Maximum Design Velocity fps 8Pipe Diameter inches 20Type of Pipes PVC_Schedule 40Weight per Linear Foot lb/lf 45.30Total Pipe Weight lb 4530
Estimated Pipe, Valve, and Fittings $ $5,000

Water Research Foundation LIFE CYCLE INVENTORY AND LIFE CYCLE IMPACT ASSESSMENT DATABASE
Module 8Chlorine Contact Basin
Module InventoryModule Inventory
Process Unit Chlorine ContactEquipmentPumps and compressors USD $32,000
Blowers and fans USDMeasuring and dispensing pumps USDC d i i t USDConveyors and conveying equipment USDIndustrial trucks and tractors USDPipe, valves, and pipe fittings USDPlumbing fixture fittings and trim USDTurbines and turbine generator sets USDMotors and generators USDWater supply and sewerage systems USD
MaterialReinforcing steel, at plant/RER U kg 108,883Concrete, normal, at plant/CH U m3 753Concrete (reinforced) I kgBrick, at plant/RER U kgWood board ETH U kgSand ETH U kgSand ETH U kg
Hard coal mix, at regional storage/UCTE U kgGravel ETH U kgHDPE pipes E kgPVC pipe E kg 2,059Glass fibre reinforced plastic, polyamide, injection moulding at plant/RER U kginjection moulding, at plant/RER U kgGlass fibre reinforced plastic, polyester resin, hand lay-up, at plant/RER U kgPolyethylene, HDPE, granulate, at plant/RER U kg
St13 I - Material kgCopper I - Material kgC d t f t iCopper product manufacturing, average metal working/RER U kg
Aluminium, production mix, at plant/RER U - Material kg
Aluminium product manufacturing, average metal working/RER U - Processing
kg
Chemical

Water Research Foundation LIFE CYCLE INVENTORY AND LIFE CYCLE IMPACT ASSESSMENT DATABASE
Module 8Chlorine Contact Basin
Sodium hydroxide 50% in H2OSodium hydroxide, 50% in H2O, production mix, at plant/RER U kgSodium hypochlorite, 15% in H2O, at plant/RER U kgLime, hydrated, packed, at plant/CH U kgQuicklime, milled, packed, at plant/CH U kgSulphuric acid, liquid, at plant/RER U kgAluminium sulphate powder at plant/RERAluminium sulphate, powder, at plant/RER U kgIron (III) chloride, 40% in H2O, at plant/CH U kgHydrochloric acid, from the reaction of hydrogen with chlorine, at plant/RER U kg
Hydrochloric acid, 30% in H2O, at kgplant/RER U kg
Phosphoric acid, industrial grade, 85% in H2O, at plant/RER U kg
Ammonium sulphate, as N, at regional storehouse/RER U kg
EnergyElectricity, high voltage, at grid/US U (Life y g g g (Cycle) kWh 813,596Natural gas, at consumer/RNA U MJ
Notes and Disclaimers:
1. This represents a conceptual level analysis. No structural details such as special foundation requirements, piping penetrations, overflow, perforated walls, gates and valves were considered. Assume single wall thickness, slab thickness and deck thickness. This could be detailed in future phase of research.2 No site specific civil site work was included in this analysis No power supply2. No site specific civil site work was included in this analysis. No power supply infrastructure is included. No control and instruments were included.3. The equipment costs included herein are based on generic equipment used for similar facility. Prices were not verified in this phase and should be further developed in future phases.4. No residuals handling facility was included in the study boundary.

Water Research Foundation LIFE CYCLE INVENTORY AND LIFE CYCLE IMPACT ASSESSMENT DATABASE
Module 8Chlorine Contact Basin

pw://Carollo/Documents/Client/CO/WRF/9005A00/Deliverables/LCI-LCIA Report (Final)
Appendix B
FUTURE RESEARCH PLAN

Science and Technology Research Proposal and Performance Contract Management (PropC) System Proposal Preparation Information Template
I. GENERAL INFORMATION
I.A. Title: Full Scale Plan of Research Outline: Quantifying Embedded Water/Energy In a Water Treatment
System
I.B. State the question your R&D would answer: This is your research hypothesis. State it carefully to provide key insight into the primary question your proposal is intended to answer as it relates to and benefits Reclamation's mission of managing and delivering water and power. Maximum number of characters: 1,000
In many water scarce regions, like the southwest, communities are considering using lower quality water resources and more energy intensive treatment processes to supply their potable water needs. Utilities need help in comparing water supply and treatment options (e.g., membranes (RO/NF, MF/UF), advanced oxidation process (UV and ozone)) while considering environmental impacts, including the water and energy impacts. Utilities also need help in determining if and how renewable energy may offset these energy intensive processes. This Plan of Research will analyze data to reduce the environmental impacts of impaired water treatment and translate it into meaningful water system efficiencies. The primary objective of this research is to assess the environmental impacts in a water treatment system and provide efficiency alternatives for improved water management. The method of collection and analysis of data will be through the use of life cycle assessment tools to simplify data manipulation. Another objective is to assess the impact of the use of renewable energy on the embedded water and energy in the water treatment system. This could help support Reclamation’s renewable energy initiatives and provide bases for establishing energy rated policies and prioritize renewable energy projects.
I.C. R&D Focus and R&D Output Area: Improving Water Operations Decision Support, DS3 Water Operation Models and Decision Support
Systems
I.D. Proposed Start and Completion Years: 2013 - 2014
I.E. Type of Proposal: Conducting research and development

I.F. Security and Intellectual Property Information: No
II. PROPOSED R&D END PRODUCTS AND COMPLETION DATES
II.A. Enter the end products of your R&D proposal: A method and data to quantitatively assess environmental impacts (particularly
embedded water and energy) of different water treatment systems (e.g., membranes (RO/NF, MF/UF), UV and ozone).
Case studies that demonstrate how the method and data helped utilities examine the environmental impacts of their actual or potential water supply and treatment processes.
A report explaining how utilities can use the method and the data and perform a self-assessment on treatment system sustainability.
II.B. Need and Benefit: Describe existing capabilities available to Reclamation from both internal and external sources. Explain why they are insufficient to adequately serve Reclamation's needs. Maximum number of characters: 4,000
Paradoxically, water is our most precious, most wasted, and most undervalued resource. Producing and delivering water from sources with various water qualities consumes commercial products such as energy, equipment, instruments, and chemicals, each of which contains embedded water or removes locally available water from consideration for other uses. The life cycle assessment helps to raise the awareness of the true value of water by accounting for the embedded volume of freshwater, energy and natural resources used to produce the centrally distributed water as a product measured over the full supply chain. Applying the life cycle impact assessment concept in real world situations, such as comparing lower water quality sources and treatment, will illustrate how this concept will help utilities consider the full spectrum of impacts. In many water scarce regions, like the southwest, communities are considering using lower quality water resources and more energy intensive treatment processes to supply their potable water needs. Utilities need help in comparing water supply and advanced treatment options (e.g., membranes and advanced oxidation processes) while considering environmental impacts, including the water and energy impacts. Utilities also need help in determining if and how renewable energy may offset these energy intensive processes. Life cycle assessment (LCA) as an ISO formalized method for assessing the environmental aspects and potential impacts associated with a product or system has been around for 20 years. Research studies using LCA technique to evaluate environmental impacts of water/wastewater systems started to develop in the past decade. However, information customized for water utilities in their implement to evaluate water sources and treatment technology options regarding environmental sustainability consideration is scarcely available. A user-customizable tool that can help water utilities to evaluate a full process train (from water supply to distribution) is not readily available for implementation. Although some research studies, as briefly exampled below, focused on comparing individual

water/wastewater treatment technologies, water supply, and energy options using LCA method, blank spot of data gap and systematic tool development are still pending further study, particularly for water scarce areas like the southwest US.
Bonton, et al (2012) conducted a comparative life cycle assessment of two water treatment plants (a conceptual conventional-GAC plant vs. an actual nanofiltration plant existing in Canada) using SimaPro software. The conclusion revealed that operation phase has the highest potential environmental damage, and conventional-GAC system has greater environmental impacts than a nanofiltration system, based on the local dominant hydroelectricity power supply. Although effectively presented the use of LCA technology in water system life cycle assessment, this study did not provide available information for utility self assessment.
Vince, et al (2008) conducted LCA on potable water production processes, focusing
on desalination alternatives, based on European drinking water standards. This study drew conclusion that electricity production for plant operation is the main source of environmental impacts, followed by chemical production for coagulation and remineralization. The study showed that advanced membrane desalination has higher chemical and energy consumption than conventional groundwater/surface water treatment processes.
Dr. Jennifer Stokes and Prof. Arpad Horvath at University of Berkeley conducted
large amount of work on Water-Energy Sustainability Tool (WEST). The initial tool release took place in December 2010. Over years, this tool has been under further development and refine. With the similar intention as the proposed research, the WEST allows user input of treatment processes, materials and quantities to build LCA inventory. The WEST development focuses mostly in California scenarios to meet local water scarcity and available water sources. The proposed study will focus on the southwest water environment conditions and local stakeholders’ interest, and provide a practical module input, user-friendly tool for local utilities’ convenience to employ.
Regarding energy LCA, the Water Environment Research Foundation (WERF)
researchers started the development of Green Energy Life Cycle Assessment Tool (GELCAT) in 2009, for wastewater utilities implementations. This Microsoft Excel-based screening tool aims to assess green energy options (e.g., solar or winder power generation) life cycle environmental impact and help utilities to use green energy at facilities in North America. Water Research Foundation (WaterRF) is currently working on potential partnership to expand the research by adding drinking water perspective in the tool development.
Collecting credible raw data and assembling easily usable modules is the key to accurately and efficiently conduct full water footprint assessment and LCA for water utilities and water-related business. The current LCI database includes very few commonly used water conveyance and treatment components. For example:
Among its over 4,000 datasets in Ecoinvent, one dataset for pumps and one for compressors is all that are directly relevant to the water conveyance and treatment

equipment. These datasets are expressed generically in U.S. dollars, without differentiating the types (e.g., a centrifugal pump versus a progressing cavity pump), the size (hundreds of million gallons a day versus a few of liters an hour), and the materials used for construction.
The currently available LCI database includes hundreds of data entries for chemical industry, but has little information about typical water treatment chemicals such as polymer, antiscalant, or powder activated carbon.
The databases provide quite a lot of information on building construction materials such as concrete, metals, wood, and plastics, but have limited information regarding the manufacturing process of metal or plastic pipes.
No existing database includes materials (e.g., polyvinylidene fluoride (PVDF), polyamide, and polysulfone) and processes (e.g., membrane casting, rolling, and assembling) commonly used for making ultrafiltration and RO membranes.
Water utilities need a comprehensive, consistent, and critically reviewed inventory database that is customized to cover the most commonly used water conveyance and treatment equipment (e.g., pumps, valves, blowers, membrane elements), materials (e.g., water treatment chemicals, aluminum covers, fiberglass reinforced plastic duct, GAC), and processes (e.g., membrane production, GAC regeneration, filter backwash).
Working with water utility and industry partners (on selected case studies), the proposed research will demonstrate the benefits to integrate/incorporate the embedded water and energy concept when it comes to sustainability evaluation for water resources planning, water conveyance, and water treatment. This will benefits Reclamation and water providers in optimizing water system efficiency, promoting water and energy conservation and innovative sustainable technologies in water conveyance, treatment and operation, and supporting informed decision making on natural resource allocation and planning. Renewable energy is a priority area for Reclamation research. Better understanding of the environmental impacts associated with water treatment facilities powered on grids receiving conventional power (e.g., coal, gas, oil), versus alternative power (hydro, solar, wind, biofuel, etc.) will help Reclamation to prioritize renewable energy projects and improve energy policies. It will also help water utilities to improve their renewable energy planning efforts and improve the sustainability of water production.
II.C. Why is this the responsibility of Reclamation and not another government agency or the private sector? Maximum number of characters: 3,000
Reclamation’s mission involves managing water in an economically efficient and environmentally sensitive manner. Mission requirements often involve conducting research and studies before introducing new concepts that could lead to useful modifications and strategies in water management and policy. The Colorado River serves approximately 30 million people in the United States and Mexico. Reclamation manages the River and its reservoirs to meet water delivery obligations, provide flood control, generate hydropower, protect endangered species and native habitat, and enhance outdoor recreation opportunities. Over decades, the Phoenix Area Office has been involved at the local level, in water management and

development of sustainable water supplies in Arizona. It is critical to integrate the Renewable Energy Initiative, a priority area in Reclamation research, through practical application in ongoing work. Working with water utility and industry partners, the proposed research will demonstrate how it is beneficial to include the embedded water and energy concept when evaluating alternatives in water resources planning, water conveyance, and water treatment. This project will present sensitivity analyses on environmental impacts associated with water treatment facilities powered on grids receiving conventional power (e.g., coal, gas, oil), versus alternative power (hydro, solar, wind, biofuel, etc.). It is critical for Reclamation to establish and improve methodologies and collect critical data in assessing efficiency in water conveyance and its energy structure as justification of implementing renewable energy projects.
III. PROPOSED STEPS TO PRODUCE THE R&D END PRODUCTS LISTED IN SECTION II
III.A Methods and Approaches, End Product Dissemination: Briefly describe the methods and approaches you will use to answer your research question and how you will share your research end product(s) with peers and stakeholders. Maximum number of characters: 4,000
The technical approach for the proposed study will consist of the following steps: Task 1: Expand the prototype LCA data collection. Determine the high priority data elements
(and their numeric value) Task 2: Workshop- to get utility input on specific research ideas. Task 3: Water Utility Case Studies Task 4: Power Supply Sensitivity Analysis
The following briefly describes these steps. Task 1: Expand the prototype LCA data collection
Expand the prototype LCA data established in Phase 1 of the study. Fill in data gap using available literature references and published database information.
Update literature review with up-to-date on-going research, applications, opportunities, and challenges related to LCA analysis in the field of water industry.
Establish a data collection plan. Prioritize the data collection efforts. Collaborate with industry partners (e.g., equipment manufacturers or professional
organizations) to collect raw data for water industry on membrane technologies and advanced oxidation processes.
Task 2: Stakeholder Workshop Conduct stakeholder workshop to prioritize the data wish list generated in Phase 1 study,
focusing on the interest of the southwest region of the United States, i.e., Reclamation service area.
Invite Reclamation and utilities who are using lesser water quality sources. Investigate the opportunities for Reclamation and Drinking Water Utilities to integrate the use
of LCA analyses into sustainable planning and operations. Gather inputs form water utilities to prioritize the data collection and establish case study
areas. Task 3: Water Utility Case Studies
Select case study topics gathered at the stakeholder workshop (described in Task 2).

Identify case study partnership. Set case study boundaries. Potential case study # 1: Investigate embedded water and energy associated with three water
supply alternatives for central Arizona, including imported water, brackish water desalination, and indirect potable reuse.
Potential case study # 2: Wastewater Treatment Plant Reclaimed Water Appraisal Study, which evaluates the environmental impacts of using reclaimed water as for other purposes (such as power plant cooling water, wetland restoration, and indirect potable reuse)
Task 4: Power supply sensitivity analysis Review current status of renewable energies as power supply alternatives, such as wind, solar,
or taking advantage of biogas for power cogeneration in situ. Collect renewable energies data based on literature review and available LCA software and
database. Investigate opportunities to corporate with NREL and utilize their expertise and knowledge to assist the data collection.
Conducted sensitivity analysis using LCA results to evaluate environmental impacts generated by various power supply sources.
III.B Proposed Steps to Produce the Research End Products: List the sequential steps that you will take to conduct your R&D and share the results with end users and peers to promote adoption of your research end product. Required fields are marked with an asterisk (*).
Task 1
Step or Task * Step or task to produce the research end products listed in Section II.A (400 character limit)
Expand the prototype LCA data
Requested S&T Budget * Enter whole dollars without commas or decimals $100,000
Scheduled Complete Date *
mm/dd/yyyy 6/30/2014
Task 2
Step or Task * Step or task to produce the research end products listed in Section II.A (400 character limit)
Workshop – get utility input
Requested S&T Budget * Enter whole dollars without commas or decimals $50,000
Scheduled Complete Date *
mm/dd/yyyy 6/30/2014
Task 3
Step or Task * Step or task to produce the research end products listed in Section II.A (400 character limit)
Water Utility Case Studies
Requested S&T Budget * Enter whole dollars without commas or decimals $100,000
Scheduled Complete Date *
mm/dd/yyyy 6/30/2014
Task 4
Step or Task * Step or task to produce the research end products listed in Section II.A (400 character limit)
Power Supply Sensitivity Analysis
Requested S&T Budget * Enter whole dollars without commas or decimals $150,000
Scheduled Complete Date *
mm/dd/yyyy 6/30/2014
IV. FISCAL YEAR S&T PROGRAM FUNDING REQUEST 2013 - 2014
V. PARTNERS – COSTSHARING WITH OTHERS WHO HAVE A STAKE IN THIS EFFORT
V.A Partners: List the sequential steps that you will take to conduct your R&D and share the results with end users and peers to promote adoption of your research end product. Required fields are marked with an asterisk (*).
Partner 1
Partner First Name* Charlie
Partner Last Name* He
Organization* For Reclamation organizations enter their mail code (PN-xxxx). For outside Reclamation, spell out the name of the organization (i.e. U.S. Fish & Wildlife Service, not FWS)
Carollo Engineers, Inc.
Telephone* xxx-xx-xxxx 602-263-9500
Email* [email protected]
Partnership Status* Firm is defined as the leveraged funds or in-kind services directly associated with proposed research effort that is obligated or committed. Potential is defined as high likelihood of securing the funds or services indicated, but no commitment has yet been made. Provide other qualifying statements and considerations in the section X comments as appropriate.
Firm
Inside or Outside * Outside of Reclamation
Partner 2
Partner First Name* Maureen
Partner Last Name* Hodgins
Organization* For Reclamation organizations enter their mail code (PN-xxxx). For outside Reclamation, spell out the name of the organization (i.e. U.S. Fish & Wildlife Service, not FWS)
Water Research Foundation
Telephone* xxx-xx-xxxx 303-734-3465

Email* [email protected]
Partnership Status* Firm is defined as the leveraged funds or in-kind services directly associated with proposed research effort that is obligated or committed. Potential is defined as high likelihood of securing the funds or services indicated, but no commitment has yet been made. Provide other qualifying statements and considerations in the section X comments as appropriate.
Potential
Inside or Outside * Outside of Reclamation
Partner 3
Partner First Name* Darlene
Partner Last Name* Tuel
Organization* For Reclamation organizations enter their mail code (PN-xxxx). For outside Reclamation, spell out the name of the organization (i.e. U.S. Fish & Wildlife Service, not FWS)
Reclamation, Phoenix Area Office
Telephone* xxx-xx-xxxx 623-773-6268
Email* [email protected]
Partnership Status* Firm is defined as the leveraged funds or in-kind services directly associated with proposed research effort that is obligated or committed. Potential is defined as high likelihood of securing the funds or services indicated, but no commitment has yet been made. Provide other qualifying statements and considerations in the section X comments as appropriate.
Firm
Inside or Outside * Inside of Reclamation
V.B Partner Contribution Associate partner contributions with partners using the form below. Note that you must first add partners in Section V.A. before you can add their contributions. Required fields are marked with an asterisk (*).Add new partner contributions as needed using the template below.
Partner Contribution 1
Partner * Carollo Engineers, Inc.
Contribution Description* 250-character limit
Click here to enter text.
Cash or InKind* In-Kind
Fiscal Year* 2013 - 2014
Projected Contribution* Enter whole dollars without commas or decimals $
Partner Contribution 2
Partner * Water Research Foundation

Contribution Description* 250-character limit
Click here to enter text.
Cash or InKind* Cash
Fiscal Year* 2013 - 2016
Projected Contribution* Enter whole dollars without commas or decimals $Click here to enter text.
Partner Contribution 3
Partner * USBR
Contribution Description* 250-character limit
Click here to enter text.
Cash or InKind* Cash
Fiscal Year* 2013 - 2016
Projected Contribution* Enter whole dollars without commas or decimals $Click here to enter text.
VI. ADVOCATES This section is optional. Add information about a new advocates as needed using the template below. Required fields are marked with an asterisk (*).
Advocate 1
First Name* Darlene
Last Name* Tuel
Title* Water Resource Planner
Organization* For a Bureau of Reclamation organization, enter the mail code (PN-xxxx). For outside Reclamation, spell out the name of the organization (i.e. U.S. Fish & Wildlife Service, not FWS)
Click here to enter text.

Telephone* xxx-xx-xxxx 623-773-6268
Email* [email protected]
Advocate 2
First Name* Click here to enter text.
Last Name* Click here to enter text.
Title* Click here to enter text.
Organization* For a Bureau of Reclamation organization, enter the mail code (PN-xxxx). For outside Reclamation, spell out the name of the organization (i.e. U.S. Fish & Wildlife Service, not FWS)
Click here to enter text.
Telephone* xxx-xx-xxxx Click here to enter text.
Email* Click here to enter text.
Advocate 3
First Name* Click here to enter text.
Last Name* Click here to enter text.
Title* Click here to enter text.
Organization* For a Bureau of Reclamation organization, enter the mail code (PN-xxxx). For outside Reclamation, spell out the name of the organization (i.e. U.S. Fish & Wildlife Service, not FWS)
Click here to enter text.
Telephone* xxx-xx-xxxx Click here to enter text.
Email* Click here to enter text.
VII. RESEARCH BENEFICIARIES AND R&D LOCATIONS
VII.A Primary Research Beneficiaries: Reclamation, water utilities
VII.B R&D Location: Phoenix, AZ
VII.C NEPA Compliance Click here to enter text.

VIII. PROJECT TEAM Add information about a new project team member as needed using the template below. Required fields are marked with an asterisk (*).
Project Team Member 1
First Name* Charlie
Last Name* He
Discipline or Specialty* Civil Engineer, Salinity Management, Process Optimization
Organization* For Reclamation organizations enter their mail code (PN-xxxx). For outside Reclamation, spell out the name of the organization (i.e. U.S. Fish & Wildlife Service, not FWS)
Carollo Engineers, Inc.
Telephone* xxx-xx-xxxx 602-263-9500
Email* [email protected]
Principle Investigator?* Yes
Project Team Member 2
First Name* Zhuang
Last Name* Liu
Discipline or Specialty* Civil Engineer, Infrastructure and Planning
Organization* For Reclamation organizations enter their mail code (PN-xxxx). For outside Reclamation, spell out the name of the organization (i.e. U.S. Fish & Wildlife Service, not FWS)
Carollo Engineers, Inc.
Telephone* xxx-xx-xxxx 602-263-9500
Email* [email protected]
Principle Investigator?* No
Project Team Member 3
First Name* Guy
Last Name* Carpenter
Discipline or Specialty* Civil Engineer, Water Reuse and Resources Management
Organization* For Reclamation organizations enter their mail code (PN-xxxx). For outside Reclamation, spell out the name of the organization (i.e. U.S. Fish & Wildlife Service, not FWS)
Carollo Engineers, Inc.
Telephone* xxx-xx-xxxx 602-263-9500
Email* [email protected]
Principle Investigator?* No
Project Team Member 4
First Name* Ke
Last Name* Li
Discipline or Specialty* Life Cycle Assessment, Embedded Water and Energy Accounting
Organization* For Reclamation organizations enter their mail code (PN-xxxx). For outside Reclamation, spell out the name of the organization (i.e. U.S. Fish & Wildlife Service, not FWS)
University of Georgia
Telephone* xxx-xx-xxxx Click here to enter text.
Email* Click here to enter text.
Principle Investigator?* No
IX. POTENTIAL TECHNICAL REVIEWERS Enter the names and contact information for three technical reviewers outside of Reclamation that are qualified to review your research proposal.
Technical Reviewer 1 and Advisor
First Name* Leslie
Last Name* Meyers
Title* Chief, Program Development Division, P.E.
Organization* Reclamation Spell out the name of the organization (i.e. U.S. Fish & Wildlife Service, not FWS)
Click here to enter text.
Telephone* xxx-xx-xxxx Click here to enter text.
Email* Click here to enter text.
Technical Reviewer 2
First Name* Click here to enter text.
Last Name* Click here to enter text.
Title* Click here to enter text.
Organization* Spell out the name of the organization (i.e. U.S. Fish & Wildlife Service, not FWS)
Click here to enter text.
Telephone* xxx-xx-xxxx Click here to enter text.
Email* Click here to enter text.
Technical Reviewer 3
First Name* Click here to enter text.
Last Name* Click here to enter text.
Title* Click here to enter text.
Organization* Spell out the name of the organization (i.e. U.S. Fish & Wildlife Service, not FWS)
Click here to enter text.
Telephone* xxx-xx-xxxx Click here to enter text.
Email* Click here to enter text.
X. COMMENTS AND ADDITIONAL INFORMATION Use this space to provide any additional information regarding this proposed effort. Maximum number of characters: 4,000 Click here to enter text.
XI. TEAM QUALIFICATIONS This section is optional. Maximum number of characters: 4,000 Carollo Engineers is an environmental engineering firm specializing in the planning, design, and construction of water and wastewater facilities. Carollo’s reputation is based upon client service and a continual commitment to quality. We currently maintain 32 offices in 12 states. During our 78-year history, Carollo has successfully completed more than 20,000 projects for public sector clients. Carollo is currently ranked within ENR top 100 design firms. More importantly, ENR’s annual Source Book ranks Carollo among the top 10 firms for water and wastewater treatment plant design. Carollo has been a leader in the development of water and wastewater system hydraulic and optimization models and master plans for water agencies facing a variety of complex issues. We are experienced in creating

comprehensive, effective and user-friendly computer simulation and optimization models of water and wastewater systems. Carollo Engineers has long been a leader in engineering water reuse systems and desalination and concentrate management systems. We recognize the value of recycling, reuse and desalination to conserve finite resources, expand new sources and protect our environment. Our water reuse projects produce more than 40 billion gallons of reclaimed water each year, which is used to irrigate golf courses, parks and agricultural crops, and used for power plant cooling, groundwater replenishment, wetland maintenance and recreational purposes. Our in-house water research group maintains a lab for conducting research for new reuse technologies and treatment. We are dedicated to conserving this valuable resource and preserving our environment. Carollo strongly supports sustainable design and energy conservation initiatives by excelling in the application of green building practices that incorporate LEED® design features in its water, wastewater, water resources, and infrastructure projects nationwide. Many employees throughout the company are LEED® Accredited Professionals and several engineers are in the process of applying for LEED® accreditation. Carollo has assisted our clients to incorporate LEED® design principles and to meet various levels of LEED® rating. Carollo is a recognized leader in its ability to integrate innovative technology with sustainable design principles. Our science-based approach to process design results in more finely tuned projects that “do more with less.” Carollo typically incorporates many elements of energy efficient/sustainable design into our projects, resulting in lower life-cycle energy consumption. About Team Members Mr. Charlie (Qun) He, an associate and environmental senior project engineer with Carollo, has more than ten years of experience in water and wastewater treatment, water quality data analysis, computer modeling, advanced analytical work, environmental chemistry, water resource, hydrology, water distribution, and wastewater collection and treatment. Mr. He obtained experience in membrane technologies, including MBR, brackish water Reverse Osmosis (RO), seawater RO, and membrane concentrate management studies, testing and design. He became the company’s membrane desalination and concentrate management expert for the southwest region. He is the southwest regional lead of the Carollo's Research Group. Mr. He has gained extensive experience in water and wastewater treatment, conventional and advanced digestion process and advanced wastewater treatment. He is skilled at mathematical modeling such as BioWin, Biotran, the EPA WTP model, and both empirical and mechanistic based DBP prediction modeling. He is a member of the company's wastewater process technology group and the advanced digestion group. Dr. Zhuang Liu has over 9 years of experience specializing in water and wastewater treatment processes studies and design, groundwater treatment and contamination control, and hydrologic and hydraulic modeling. She was the project engineer for Water Research Foundation tailored collaboration project Lowering Chemical and Energy Usage for Inland Desalination Concentrate Volume Reduction. Zhuang developed the life cycle assessment model to evaluate the true environmental impacts of various desalination and concentrate management technologies. Mr. Guy Carpenter, a vice president with Carollo, has over 20 years of experience in water, water resources, wastewater, and reclaimed water consulting and master planning. His experience includes operations, capital project budgeting and management, decision support, management consulting, system evaluations, water resource development support, water rights negotiations and valuations, water resource accounting and management, and permitting. Guy is a water resources leader, able to help clients determine how to legally and physically develop and deploy water resources in a safe, reliable, and economic manner. Dr. Ke Li, an Assistant Professor at the University of Georgia. Li has studied the life-cycle environmental impacts of urban design and construction. He conducted various alternative evaluation and decision support studies for sustainable infrastructure and urban growth.