the value of the maryland shellfish aquaculture industry · the oyster industry in maryland has...
TRANSCRIPT

T H E V A L U E O F T H E M A R Y L A N D S H E L L F I S H A Q U A C U L T U R E I N D U S T R YJONATHAN VAN SENTEN, CAROLE ENGLE, MATTHEW PARKER & DONALD WEBSTER
EAST COAST COMMERCIAL FISHERMAN’S AND AQUACULTURE TRADE SHOW

Characterization of the Maryland shellfish industry
Survey design and data collection
Economic Impact Modelling
Overview

C h a r a c t e r i z a t i o n o f t h e M a r y l a n d s h e l l f i s h
i n d u s t r y

C h a r a c t e r i z a t i o n o f t h e M a r y l a n d s h e l l f i s h i n d u s t r y
Bottom culture (2010 –2017)Increasing trend for: Number of leases Number of acres
Total (January 2017) 254 leases 5,028 acres
0
1000
2000
3000
4000
5000
6000
0
50
100
150
200
250
300
Acre
sNum
ber o
f Lea
ses
Leases Acres

C h a r a c t e r i z a t i o n o f t h e M a r y l a n d s h e l l f i s h i n d u s t r y
Water column culture (2010 –2017)Increasing trend for: Number of leases Number of acres
Total (January 2017) 64 leases 290 acres 0
50
100
150
200
250
300
350
0
10
20
30
40
50
60
70
Jan-
10Ap
r-10
Jul-1
0O
ct-1
0Ja
n-11
Apr-
11Ju
l-11
Oct
-11
Jan-
12Ap
r-12
Jul-1
2O
ct-1
2Ja
n-13
Apr-
13Ju
l-13
Oct
-13
Jan-
14Ap
r-14
Jul-1
4O
ct-1
4Ja
n-15
Apr-
15Ju
l-15
Oct
-15
Jan-
16Ap
r-16
Jul-1
6O
ct-1
6Ja
n-17
Acre
s
Num
ber o
f Lea
ses
Leases Acres

C h a r a c t e r i z a t i o n o f t h e M a r y l a n d s h e l l f i s h i n d u s t r y
Average annual growth in harvest 2013-2018 : 24%
2018 harvest decline -22% Bottom culture: -26% Water column: -16%
Decline believed to be driven by influx of fresh water due to rainfall1,922
7,293
16,724
20,229
23,251
29,261
24,475
1,417
15,134
17,448
30,408
39,987
44,805
33,067
-
5,000
10,000
15,000
20,000
25,000
30,000
35,000
40,000
45,000
50,000
2012 2013 2014 2015 2016 2017 2018
MD
Bus
hels
Water Column Bottom Culture

C h a r a c t e r i z a t i o n o f t h e M a r y l a n d s h e l l f i s h i n d u s t r yBottom Culture Harvests
0
2000
4000
6000
8000
10000
12000
MD
Bush
els
2013 2014 2015 2016 2017 2018

Water Column Culture Harvests
0
500
1000
1500
2000
2500
3000
3500
MD
Bush
els
2013 2014 2015 2016 2017 2018
C h a r a c t e r i z a t i o n o f t h e M a r y l a n d s h e l l f i s h i n d u s t r y

S u r v e y d e s i g n a n d d a t a c o l l e c t i o n
S u r v e y d e s i g n a n d d a t a c o l l e c t i o n
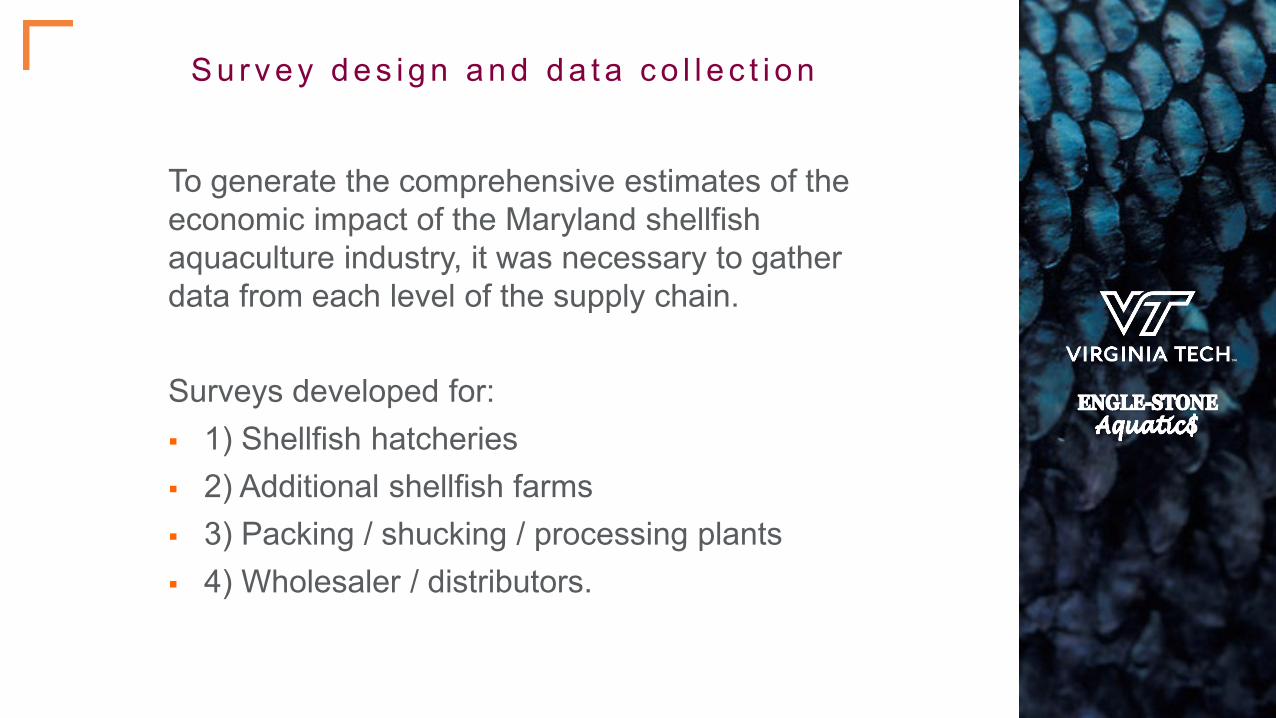
To generate the comprehensive estimates of the economic impact of the Maryland shellfish aquaculture industry, it was necessary to gather data from each level of the supply chain.
Surveys developed for: 1) Shellfish hatcheries 2) Additional shellfish farms 3) Packing / shucking / processing plants 4) Wholesaler / distributors.

S u r v e y d e s i g n a n d d a t a c o l l e c t i o n
Contact lists developed with the aid of Industry lists University of Maryland Extension Chesapeake Bay Foundation Web searches
Notification of the study and its intended goals in advance of initiating any survey activities
Telephone contact to request participation
In person interviews by project personnel

S u r v e y d e s i g n a n d d a t a c o l l e c t i o n
Survey responses were recorded and coded
Respondents information treated as confidential
Survey activities continued for a period of four months over the summer of 2019, with repeated attempts to contact members of the target populations.

S u r v e y d e s i g n a n d d a t a c o l l e c t i o n
Response Rates
Supply chain level
List frame(no.)
Refusal/unable
(no.)
No response
(no.)
Completed (no.)
Response rate (%)
Hatcheries 3 0 2 1 33%Farms 76 15 36 25 33%
Wholesale / Distributors 76 1 71 4 5%

E c o n o m i c i m p a c t m o d e l l i n g

Money must enter an economy for it to grow (Blair 1995)
Growth achieved by exports (Blair 1995)
An economy can be separated into basic and non-basic activities (Tiebout 1956)
Economic impac t mode l ing
E c o n o m i c i m p a c t m o d e l i n g
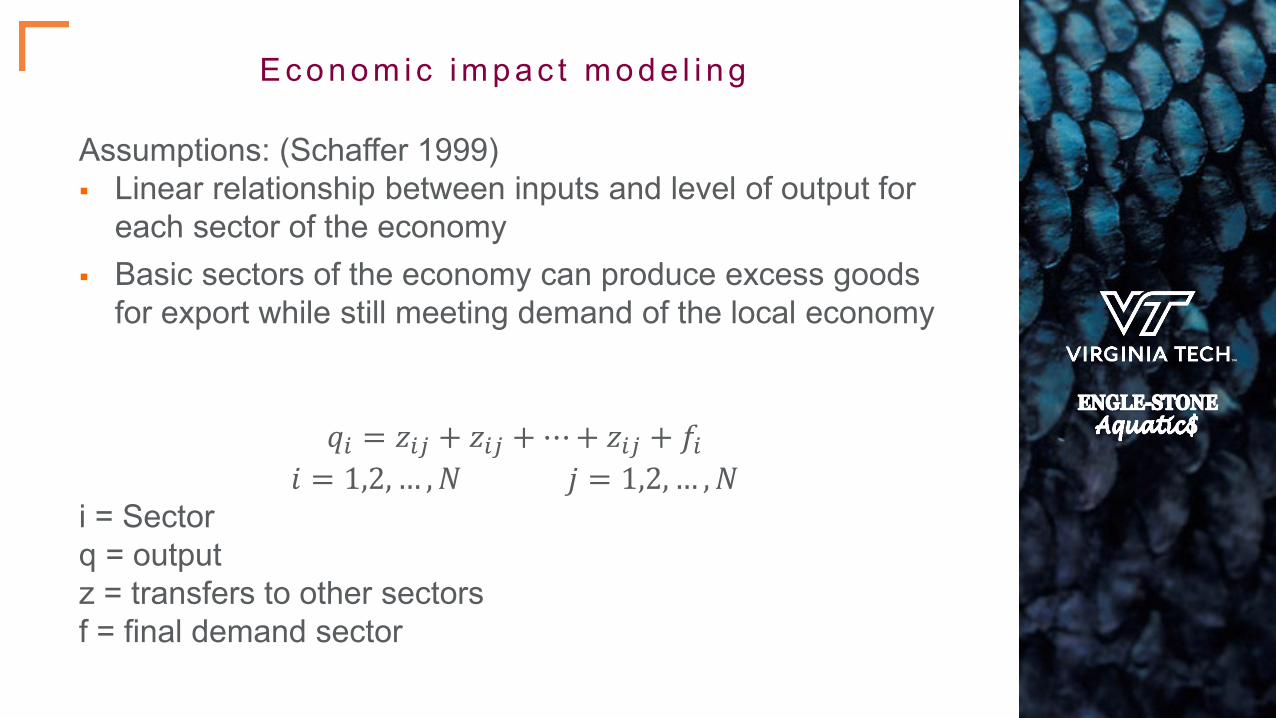
Assumptions: (Schaffer 1999) Linear relationship between inputs and level of output for
each sector of the economy Basic sectors of the economy can produce excess goods
for export while still meeting demand of the local economy
𝑞𝑞𝑖𝑖 = 𝑧𝑧𝑖𝑖𝑖𝑖 + 𝑧𝑧𝑖𝑖𝑖𝑖 + ⋯+ 𝑧𝑧𝑖𝑖𝑖𝑖 + 𝑓𝑓𝑖𝑖𝑖𝑖 = 1,2, … ,𝑁𝑁 𝑗𝑗 = 1,2, … ,𝑁𝑁
i = Sectorq = outputz = transfers to other sectorsf = final demand sector
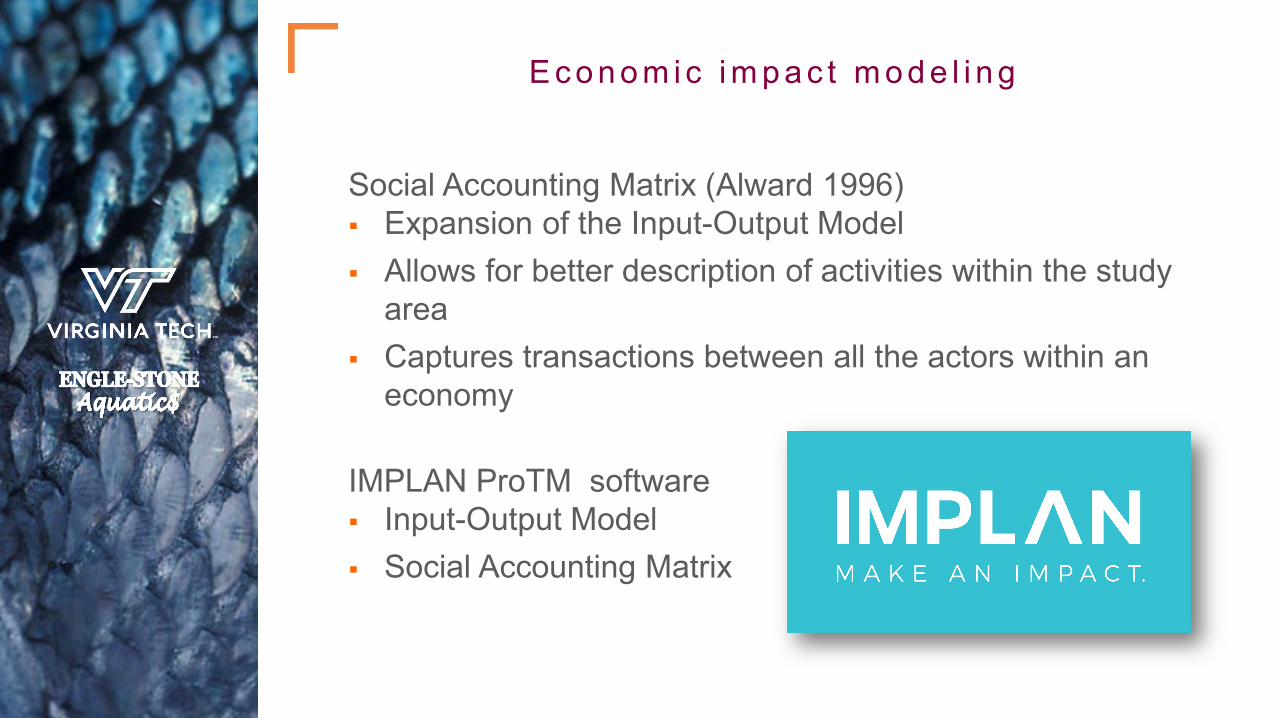
Social Accounting Matrix (Alward 1996) Expansion of the Input-Output Model Allows for better description of activities within the study
area Captures transactions between all the actors within an
economy
IMPLAN ProTM software Input-Output Model Social Accounting Matrix
E c o n o m i c i m p a c t m o d e l i n g

E c o n o m i c i m p a c t m o d e l i n g
Analysis by parts (ABP): IMPLAN does not contain a dedicated sector for aquaculture To more accurately estimate the impacts of the Maryland
shellfish aquaculture industry ABP allows for dividing the effects from an industry into its
individual components, budget expenditures, and income ABP allows for greater flexibility and customization of the model ABP allows for specification of commodity inputs, specification
of proportion of local labor income, specification of local purchases, and the use of IMPLAN’s special spending patterns
One industry spending pattern was created for each activity (water column culture, bottom culture, equipment manufacturing, and nursery and hatchery production)

E c o n o m i c i m p a c t m o d e l i n g
Study area characteristics
Category Measure/QuantityLand area (square miles) 1 9,775 (2017)Population 6,042,718
Total employment 1 3,703,941 (2017)
Gross Regional Product ($) 1 $408,670,149,785 (2017)
Per Capita Income ($) $39,070Percent poverty 9%Number of industries 1 473 (2017)
(United States Census Bureau, 2019)1 (MIG, 2019)

Definitions (Kaliba and Engle, 2004): Direct effects: effects which are accumulated within the
particular industry being investigated. For example, the direct employment or sales by shellfish farms.
Indirect effects: effects that are experienced by related industries through linked sectors. For example, purchases of fuel by shellfish farms that affect the bigger petroleum refining and production industry.
Induced effects: the changes in household expenditures from income changes in the related sectors. For example, salaries paid that lead to additional economic activity through the purchase of homes, utilities, groceries, etc.
E c o n o m i c i m p a c t m o d e l i n g

E c o n o m i c i m p a c t m o d e l i n g
Impact Type Employment Labor Income Total Value
Added Output
Direct Effect 77 $2,867,579 $812,435 $3,632,564
Indirect Effect 12 $644,664 $1,036,130 $1,681,742
Induced Effect 18 $960,075 $1,745,341 $2,827,283
Total Effect 107 $4,472,318 $3,593,906 $8,141,589
Results
Total # of affected sectors: 450

Description Total Employment
Total Labor Income
Total Value Added Total Output
Retail - Miscellaneous store retailers 4 $96,869 $116,287 $176,909
Commercial and industrial machinery and equipment repair and maintenance 2 $123,305 $184,871 $249,221
Real estate 1 $49,443 $241,524 $310,800
Retail - Building material and garden equipment and supplies stores 1 $51,897 $81,337 $128,669
Hospitals 1 $77,281 $90,666 $165,273Limited-service restaurants 1 $21,092 $51,600 $86,169Full-service restaurants 1 $22,731 $26,250 $47,019Wholesale trade 1 $65,785 $124,910 $181,959Animal production, except cattle and poultry and eggs 1 $7,010 $21,614 $33,820
Offices of physicians 1 $59,568 $58,584 $87,728
E c o n o m i c i m p a c t m o d e l i n gMost affected sectors :
Employment

Description Total Employment
Total Labor Income Total Value Added Total Output
Owner-occupied dwellings 0 $0 $274,414 $419,523Real estate 1 $49,443 $241,524 $310,800Commercial and industrial machinery and equipment repair and maintenance
2 $123,305 $184,871 $249,221
Insurance carriers 0 $38,583 $131,870 $194,192Wholesale trade 1 $65,785 $124,910 $181,959Retail - Miscellaneous store retailers 4 $96,869 $116,287 $176,909Hospitals 1 $77,281 $90,666 $165,273
Retail - Building material and garden equipment and supplies stores 1 $51,897 $81,337 $128,669
Wireless telecommunications carriers (except satellite) 0 $2,580 $35,750 $95,904
Wired telecommunications carriers 0 $18,864 $44,689 $95,421
E c o n o m i c i m p a c t m o d e l i n gMost affected sectors : Total
Output

E c o n o m i c i m p a c t m o d e l i n g
Results are likely underestimating the impacts of the Maryland shellfish industry in 2018
The response rate is the primary limitation to this analysis, and a potential cause of under-estimated activity expenditures
Processors and wholesalers/distributors are not accounted for in the data that were utilized for impact estimation
The economic impact estimated in this study was confined to activities and expenditures within the state of Maryland
Harvests of oysters were lower in 2018 than in 2017, likely caused by an influx of fresh water to the Bay. This would also have affected farm sales values for 2018, and may have had an effect on farm expenditures.
Discussion

Impact Type Employment Labor Income Total Value
Added Output
Direct Effect 98 $3,000,523 $2,139,072 $4,225,250
Indirect Effect 13 $693,691 $1,113,944 $1,803,304
Induced Effect 24 $1,255,933 $2,283,150 $3,698,561
Total Effect 135 $4,950,147 $5,536,166 $9,727,115
E c o n o m i c i m p a c t m o d e l i n gEstimate based on 2017
harvests

C o n c l u s i o n s
The oyster industry in Maryland has grown rapidly in recent years Oyster farming in Maryland provides valuable employment opportunities for
watermen and others in coastal areas The total economic output effect of the Maryland shellfish industry was
estimated at $8.1 million in 2018 Total employment effect of the Maryland shellfish industry was estimated at 107
people; direct effect 77 jobs, indirect effect 12 jobs, and induced effect 18 jobs The greater harvests and sales of oysters in 2017 were estimated to have a
greater total economic output of $9.7 million with a total employment effect of supporting 135 jobs
The Maryland oyster industry supports a wide variety of other economic sectors, from real estate and wholesale trade through direct expenditures by oyster farms that multiply in Maryland’s economy

A c k n o w l e d g m e n t s
We would like to acknowledge the participants of this study and thank them for their support and trusting us to maintain the confidentiality of their data. A thank you also to the Maryland Department of Natural Resources (MDDNR) for providing data on shellfish leases and harvest values. We would also like to thank Charles Clark for assisting with survey activities and interviews for this project. Last, but not least, we would like to recognize the project sponsor, Chesapeake Bay Foundation, Inc. This project was made possible through Award No. 443615 from Chesapeake Bay Foundation, Inc. Any opinions, findings, conclusions, or recommendations expressed in this presentation are those of the authors and do not necessarily reflect the view of the Chesapeake Bay Foundation, Inc.

T H A N K Y O U