maryland oyster population status report
TRANSCRIPT
Maryland Oyster Population Status Report 2019 Fall Survey
Mitchell Tarnowski Maryland Department of Natural Resources
and the Staff of the Shellfish Division and Cooperative Oxford Laboratory
DNR 17-050420-232
July 2020

FOR MORE INFORMATION PLEASE CONTACT Maryland Department of Natural Resources
Fishing and Boating Services Tawes State Office Building
580 Taylor Avenue Annapolis, MD 21401
1-800-688-FINS • 410-260-8258 TTY users call via the MD Relay
DNR GENERAL INFORMATION
1-877-620-8DNR www.dnr.Maryland.gov
Fisheries Service Ext. - 8258
Larry Hogan, Governor Boyd K. Rutherford, Lt. Governor
Jeannie Haddaway-Riccio, Secretary, DNR
This document is available in alternative format upon request from a qualified individual with a disability.
The facilities and services of the Maryland Department of Natural Resources are available to all without regard to race, color, religion, sex, age, sexual orientation, national origin, physical or mental disability.

CONTRIBUTORS
Editor Shellfish Division, DNR
Mitchell Tarnowski, Shellfish Biologist Technical Participants
Lead Scientist Shellfish Division, DNR
Mitchell Tarnowski, Shellfish Biologist Field Operations
Shellfish Division, DNR Robert Lehman, Captain R/V Miss Kay Steven Schneider, Biologist/First Mate Robert Bussell, Biologist Amy Larimer, Biologist
Disease Diagnostics Cooperative Oxford Laboratory, DNR
Chris Dungan, Pathologist Carol McCollough, Pathologist, Acting Laboratory Manager Stuart Lehmann, Histotechnician Amber DeMarr, Histotechnician
Laboratory Assistance Maryland Department of Natural Resources William Anderson Christopher Judy Barbara Johnston
Debra Vreeland Linda Barker Matthew Spitznagel Phillips Wharf Environmental Center
Michelle Baptiste Barbara Boyd Victoria Rico Data Management Shellfish Division, DNR Jodi Baxter, Biologist Amy Larimer, Biologist Text
Shellfish Division, DNR Mitchell Tarnowski, Shellfish Biologist
Reviewers Fishing and Boating Services, DNR Christopher Judy Carol McCollough Jodi Baxter Chris Dungan Field Assistance
Maryland Department of Natural Resources Christopher Judy Jodi Baxter Carol McCollough Margaret McGinty Laurinda Serafin Frank Marenghi Andrew Zagwodzki Amanda Ault William Anderson
George O’Donnell Anne Griffis Potomac River Fisheries Commission Oyster Recovery Partnership
Ellen Cosby Sara Coleman University of Maryland Baltimore County
Ethan Hain Jahir Batista Andvade
Cover Photo: “Thar they are!” John Hess sounding for oysters. (Photo: R. Bussell)

In Memoriam John Hess (1942-2019)
Photo: C. McCollough
John Hess, former Field Operations Supervisor for the DNR Shellfish Division and manager of the Deal Island facility, passed away on May 6, 2019. John came to DNR in 1983 after decades of working the water as a crabber and oysterman (he started at age 13), bringing with him valuable experience and knowledge. Born in Spring Hills, MD in December 1942 he was a graduate of Marion High School class of 1960 and the Nashville Auto & Diesel College. John served in the US Army Reserves as well.
John’s career in the Shellfish Division focused on the Repletion Program and spanned 25 years, during which time he helped coordinate the planting of over 60 million of bushels of shells and about 4 million bushels of seed oysters to enhance the habitat and population. This represents a personal commitment to about 10,000 acres of oyster bottom. John surveyed oyster bars for the plantings, set buoys, coordinated efforts with the local county oyster committees, worked with numerous shucking houses and runboat captains to acquire and plant fresh shells in local waters, and coordinated with DNR’s dredging contractor to plant dredged shells each summer on over 300 acres of oyster bars. John also provided key assistance on the annual DNR Fall Oyster Survey aboard the R/V Miss Kay, keeping the data sheets for many years and overseeing the samples as they were examined for oysters and spat. The boat crew often heard John call out “There they are!” as he tested the bottom with a 20‘ sounding pole to signal when the bar had been reached and the dredge could be deployed. When GPS units and color fathometers became available the oyster bars were located easily, but John kept sounding the bottom and training others to do the same. A humorous event occurred one day close to the shore of St. Mary’s College during the Fall Survey when John called out his trademark “There they are”: two students holding hands while relaxing at the shore scurried off like flushed quail thinking John was talking about them and they had been discovered. John was well known and appreciated by many at DNR. Colleagues at the Cooperative Oxford Laboratory, where the oyster samples are analyzed for diseases, remember John as conservative, careful, hardworking,

and that he expected the same of his coworkers. He exhibited these traits as he selected sites to plant shells and seed oysters, as he kept detailed records of the program’s activities, and as he expertly maintained the heavy equipment used by the Repletion Program each season. He is remembered with affection.
John retired in 2008 and he and his wife Peggy enjoyed many years together, taking trips with their Model-T vintage car. In 2016 they traveled cross country to visit three additional states to give him a total of 48 states visited. They also enjoyed their friends and family around their home in Shelltown, Maryland. John and Peggy were seen every year at the Watermen’s Trade Show in Ocean City, where John caught up with watermen and coworkers on the latest news about oysters.
John was dedicated to improving the oyster population throughout their full extent in tidewater Maryland from Pooles Island in the upper bay to Smith Island near the Virginia state line and from the upriver bars of the Potomac River near the industrial setting of the Morgantown generating station to the far reaches of the bucolic Chester River on the Eastern Shore. The Repletion Program was complicated, with a lot of moving parts and numerous individuals to deal with, yet he could always be relied on to get the job done, and with the utmost professionalism.
-Christopher Judy
.
DNR Shellfish Director Chris Judy (l) and Field Operations Supervisor John Hess inspect a sample during the Fall Oyster Survey. (Photo: C. McCollough)

TABLE OF CONTENTS
EXECUTIVE SUMMARY……………………………………………………………...............2
INTRODUCTION……………………………………………………………….........................7
METHODS……………………………………………………………………….........................7
RESULTS Freshwater Discharge Conditions……………………………………………………………10 Spatfall Intensity……………………………………………………………………………..12 Oyster Diseases………………………………………………………………………………14 Observed Mortality……………………………………………………………………..........17 Biomass Index………………………………………………………………………………..19 Cultch Index………………………………………………………………………………….20 Commercial Harvest……………………………………………………………….................22 Oyster Sanctuaries…………………………………………………………………................24
DISCUSSION Streamflow timing; Status of Tangier Sound.…………………………………………….….26
LITERATURE CITED…………………………………………………………………………30
TABLES…………………………………………………………………………………….…...32
APPENDIX 1: OYSTER HOST and OYSTER PATHOGENS………………………….….61
APPENDIX 2: GLOSSARY…………………………………………………………................64

EXECUTIVE SUMMARY Since 1939, the Maryland Department of Natural Resources and its predecessor agencies have monitored the state’s oyster population by means of annual field surveys – one of the longest running programs of this kind in the world. Integral to the Fall Oyster Survey are five types of indices intended to assess the status and trends in Maryland’s oyster populations: the Spatfall Intensity Index, a measure of recruitment success and potential increase of the population obtained from a subset of 53 oyster bars; Oyster Disease Indices, which document disease infection levels as derived from a subset of 43 sentinel oyster bars; the Total Observed Mortality Index, an indicator of annual mortality rates of post-spat stage oysters calculated from the 43 oyster bar Disease Index subset; the Biomass Index, which measures the number and weight of oysters from the 43 Disease Bar subset relative to the 1993 baseline, and the Cultch Index, a measure of habitat at the 53 Spat Intensity Index bars. The 2019 Fall Oyster Survey was conducted from 15 October to 25 November throughout the Maryland portion of Chesapeake Bay and its tributaries, including the Potomac River. A total of 339 samples were collected from 286 oyster bars. Sites monitored included natural oyster bars, oyster seed production areas, seed and shell plantings, and sanctuaries. Following the record high freshwater streamflows of 2018, elevated flows continued into the first half of 2019, depressing salinities, which in turn affected spatset, diseases, mortality and growth of oysters. By mid-year the above average flows had subsided and salinities returned to normal by the fall. The Spatfall Intensity Index of 23.0 equaled the 35-year median value. Spatset intensity increased 53% from the previous year, with slightly more than twice as many 2019 index bars having increased spatfall when compared with 2018. The highest spatset was restricted to areas much further downbay, primarily in lower Tangier Sound and adjacent mainstem of the bay across to the Western Shore, and to a lesser extent the Manokin River and Pocomoke Sound. The normally productive Choptank/Little Choptank region had unusually low counts, and spat were absent from large swaths of the bay. No spat were found along the Western Shore upbay from mid-Calvert County, the upriver two-thirds of the Potomac oyster growing region, the upper Choptank River, parts of Eastern Bay and its tributaries, and the entire Chester River and bay north of the Bay Bridge. The highest spatset on an individual bar (388 spat/bu) was observed on Point Lookout Lot B on the lower Western Shore. Disease levels were the lowest on record for the 30-year time series. Although dermo disease remained widely distributed throughout the oyster-growing waters of Maryland, being found on 88% of the sentinel bars, the percentage of infected oysters was much lower than in 2018. The 2019 mean prevalence (27%) decreased from the previous record low 40% of 2018, and was substantially below the 30-year average of 64.5%. The mean infection intensity for dermo disease (1.0) was half of the long-term average, breaking the record of the previous year for the lowest average intensity. MSX disease mean prevalence (0.1%) tied the previous year for the Disease Index bars. In contrast to 2018, the disease was not evident on the supplemental disease sites. Thus 2019, with only one diseased oyster detected, had the smallest number of sampled oysters infected with H. nelsoni in Fall Oyster Survey records from the past 30 years. The Observed Mortality Index of 13% was slightly lower than in 2018, remaining below the long-term mean for the sixteenth consecutive year. However, elevated freshwater-related mortalities of up to 100% were observed on several of the uppermost bars of the Potomac River and to a lesser extent in the upper bay, along with the Chester and upper Choptank rivers. Aside from these areas, regional average observed mortalities were generally low to moderate. Tangier Sound, typically a higher mortality area, averaged a remarkably low observed mortality of 4.2%. The 2019 Oyster Biomass Index of 1.72 represents a slight drop of this index from the previous year, ranking it sixth highest in the 27-year time series. The size distribution of index bar oysters shifted to more market oysters relative to sublegal oysters, reflecting the increase in average size. Although the sizes increased, the index population abundance declined, accounting for the dip in the Biomass Index. The 2019 Cultch Index of 0.89 bu/100 ft. was similar to the 15-year average of 0.90 bu/100 ft. However, some individual bars showed steep declines. Of the 52 bars used in this analysis, 37% had standardized volumes that were more than 25% below their respective 15-year averages. The three-year rolling averages of cultch indices have been stable over the past five years. Strong regional differences in the Cultch Index were evident. The areas with the lowest cultch included the entire mainstem of the bay, followed by the combined Chester River/Eastern Bay region.
3
The highest regional cultch indices were in areas with more favorable recruitment and consequent addition to cultch, specifically the Tangier Sound and Choptank River regions. A total of 88 oyster bars within 32 sanctuaries were sampled during the 2019 Fall Survey. Trends in recruitment, disease, and mortality were in keeping with the baywide results and well below their respective Key/Disease Bar long-term averages. Recruitment within the five restoration sanctuaries - Harris Creek, Tred Avon, Little Choptank, Manokin, and St. Marys - was lower than during the previous year, as it was in most of the adjacent harvest areas. This was unanticipated considering that the 2019 spat index was about 50% higher than in 2018, and reflects the limited geographic range for good spatset this year. A comparison of spatset in these sanctuaries with adjacent harvest areas showed similar results, with the exception of higher counts in mid-Tangier Sound (the center of higher spatsets). Oysters from monitoring sites in the restoration sanctuaries showed no evidence of MSX disease. Dermo disease prevalences and intensities were well below long-term averages, although they trended somewhat higher in the sanctuaries than in adjacent harvest areas, probably because the sanctuaries had a higher proportion of larger, older oysters which can accumulate higher burdens of the parasites. Despite the slightly higher dermo levels, observed mortality rates in the sanctuaries were comparable to those of harvest areas and continued to be markedly lower than the long-term average. The average biomass per index bar in 2019 was substantially higher in the sanctuaries than in the open harvest areas. Most of this difference was in the larger market size classes. With reported harvests of 145,000 bushels with a dockside value of $6.6 million during the 2018-19 season, commercial oyster landings dropped 24% with a loss of $2.1 million from the previous season, extending a declining trend to five years. Power dredging accounted for 44% of the landings, primarily from the lower Eastern Shore and Choptank regions. Hand tongs were the second dominant gear type, harvesting 25% of the total. The Choptank region was the leading production area with 39% of the Maryland landings, with Broad Creek alone accounting for 22% of the total landings, followed by the Tangier Sound region with 28%.

4
Figure 1a. 2019 Maryland Fall Oyster Survey station locations, all bar types (standard,
Key, Disease, seed) included.
(Return to Text)

5
Figure 1b. Maryland Fall Oyster Survey Key Bar locations included in determining the
annual Spatfall Intensity Index.
(Return to Text)
6
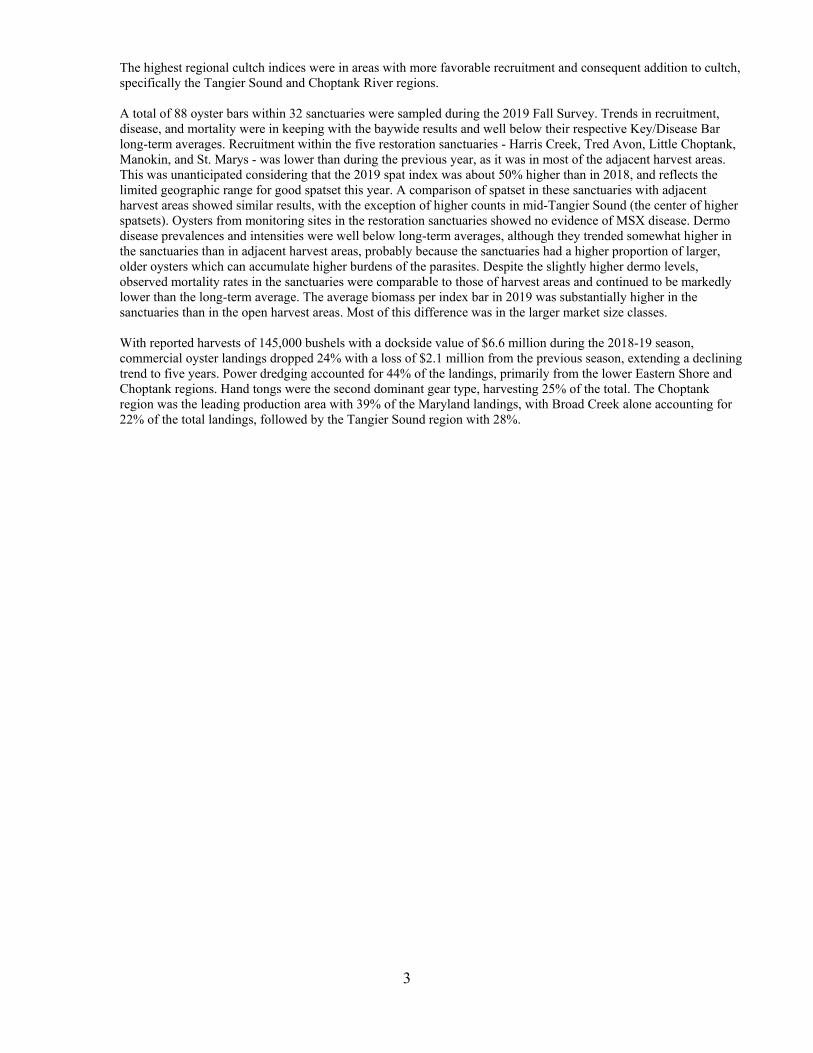
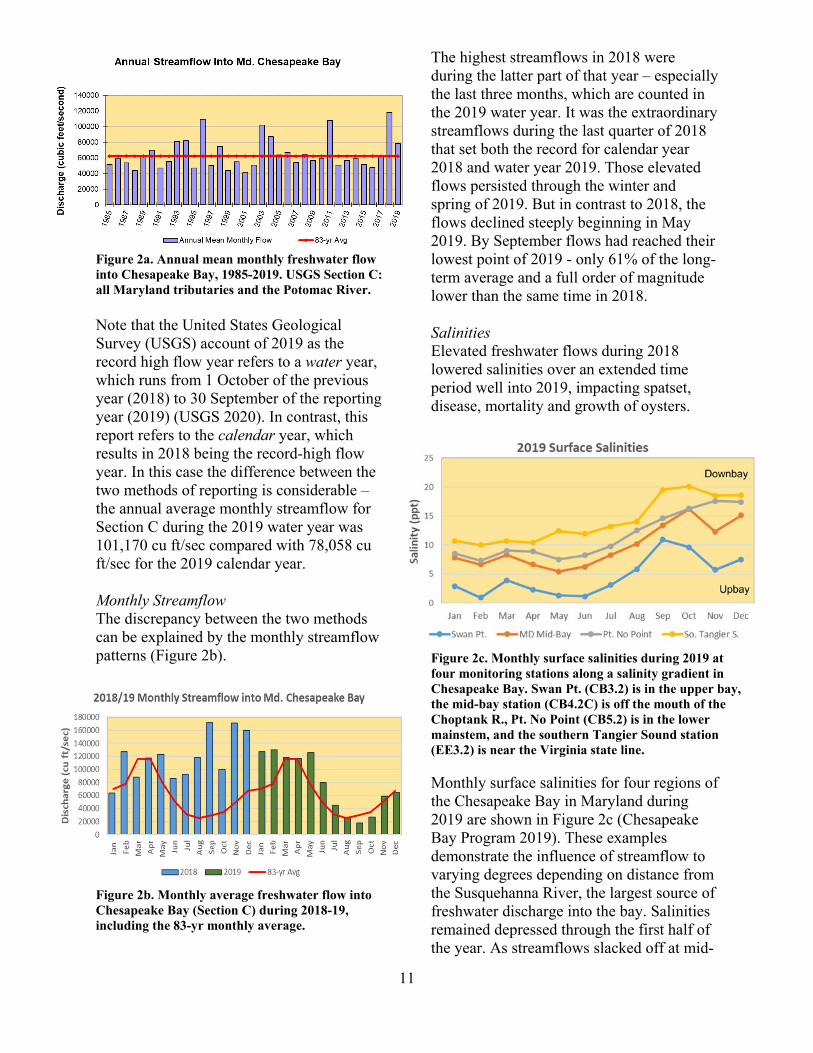
Figure 1c. Maryland Fall Oyster Survey standard Disease Bar monitoring locations and
additional disease sample stations. Disease samples could not be obtained from Lower Cedar Point, and the supplemental sites at Deep Shoal and Beacons, in 2019.
(Return to Text)

7
INTRODUCTION Since 1939, a succession of Maryland state agencies has conducted annual dredge-based surveys of oyster bars. These oyster population assessments have provided biologists and managers with information on spatfall intensity, observed mortality, and more recently, parasitic infections and habitat in the Maryland waters of Chesapeake Bay. The long-term nature of the data set is a unique and valuable aspect of the survey that gives a historical perspective and reveals trends in the oyster population. Monitored sites have included natural oyster bars, seed production and planting areas, dredged and fresh shell plantings, and sanctuaries. Since this survey began, several changes and additions have been made to develop structured indices and statistical frameworks while preserving the continuity of the long-term data set. In 1975, 53 sites and their alternates, referred to as the historical “Key Bar” set, were fixed to form the basis of an annual spatfall intensity index (Krantz and Webster 1980). These sites were selected to provide both adequate geographic coverage and continuity with data going back to 1939. An oyster parasite diagnosis component was added in 1958, and in 1990 a 43-bar subset (Disease Bar set) was established for obtaining standardized parasite prevalence and intensity data. Thirty-one of the Disease Bars are among the 53 spatfall index oyster bars (Key Bars). Collaborative Studies and Outreach Throughout the years, the Fall Survey has been a source of collaborative research opportunities for scientists and students within and outside of the Department of Natural Resources. In 2019, the Fall Survey provided a platform for researchers from the University of Maryland Baltimore County and the United States Department of Agriculture to collect water, sediment, and oyster samples as part of a multi-year collaborative study on contaminants of emerging concern in the Chesapeake Bay. The Survey continues to assist the Potomac
River Fisheries Commission with an innovative fishery management program, examining oyster plantings on two Oyster Management Reserves and evaluating several rotational seed planting areas. Data from the Fall Survey was used extensively by the multi-partner Oyster Restoration Project under the 2014 Chesapeake Bay Watershed Agreement and the legislatively mandated Oyster Stock Assessment, a collaborative effort between the department and the University of Maryland Chesapeake Biological Laboratory, which was completed in 2018 and will continue to be used in future stock assessments. Disease data collected during the survey are now shared annually in a Rutgers University database intended to facilitate oyster aquaculture along the east coast of the United States.
METHODS Field Collection The 2019 Annual Fall Oyster Survey was conducted by Shellfish Division staff of the Maryland Department of Natural Resources Fishing and Boating Services from 15 October to 25 November. A total of 339 samples was collected during surveys on 286 natural oyster bars (Figure 1a), including Key Bar (Figure 1b) and Disease Bar (Figure 1c) fixed sentinel sites as well as sanctuaries, contemporary seed oyster planting sites, shell planting locations, and former seed production areas. A 32-inch-wide oyster dredge was used to obtain the samples. Sample volumes were measured in Maryland bushels (bu) (1 Md. bu = 1.3025 U.S. standard bu; Appendix 2).The number of samples collected varied with the type of site. At each of the 53 Key Bar sites and the 43 Disease Bars, two 0.5-bu subsamples were collected from replicate dredge tows. At all other sites, one 0.5-bu subsample was collected. A list of data categories recorded from each sample appears in Table 1. Oyster counts were reported as numbers per Maryland bushel. Since 2005, tow distances have been

8
recorded for all samples using the odometer function of a global positioning system (GPS) unit, and the total volumes of dredged material per tow were noted before the subsamples were removed. Photos illustrating the collection process can be viewed at: dnr.maryland.gov/fisheries/Pages/shellfish-monitoring/sample.aspx Fall Oyster Survey Indices Integral to the Fall Oyster Survey are five categories of indices used to assess Maryland oyster populations: spatfall, disease, mortality, biomass, and cultch. The Spatfall Intensity Index is a measure of recruitment success and potential increase of the population obtained from an established subset of 53 oyster bars (Key Bars); it is the arithmetic mean of spat/bushel counts from this subset. Disease levels are documented by oyster disease prevalence indices (dermo and MSX disease) and an infection intensity index (dermo disease only) as derived from a subset of 43 oyster bars; these indices were established in 1990. The Total Observed Mortality Index is an indicator of annual natural mortality occurring among post-spat stage oysters from the 43 oyster bar Disease Index subset, calculated as the number of dead oysters (boxes and gapers) divided by the sum of live and dead oysters (Appendix 2). Although keyed to the Disease Index subset established in 1990, the Total Observed Mortality Index also includes data from 1985-1989. The Biomass Index measures the number and estimates the weight of post-spat oysters from the 43 Disease Bar subset relative to the 1993 survey year baseline. The Cultch Index is a relative measure of oyster habitat at the 53 “Key” spat index bars. The time series for the Spat Intensity, Diseases, and Mortality indices are presented in Tables 2 - 5. The majority of Fall Survey data, including supplemental pathology data and disease indices, are entered into digital files. Fouling data and oyster condition are in paper files; the data
on fouling (mussels, barnacles, tunicates, etc.) and other associated organisms are being converted to a digital format. Oyster Disease Analyses Representative samples of 30 oysters older than one year were taken at each of 42 Disease Bar sites. A sample could not be collected at Lower Cedar Point due to the total absence of live oysters on that bar. Also, the scarcity of oysters at Old Woman’s Leg resulted in a smaller sample (n = 20) obtained there. Additional samples for disease diagnostics were collected from supplemental sites, sanctuaries, and other areas of special interest. Oyster parasite diagnostic tests were performed by Aquatic Animal Health Program staff of the Cooperative Oxford Laboratory. Data reported for Perkinsus marinus (dermo disease) are from Ray’s fluid thioglycollate medium (RFTM) assays of rectum tissues. Prior to 1999, less-sensitive hemolymph (blood) assays were performed. Data reported for Haplosporidium nelsoni (MSX disease) have been generated by histology since 1999. Before 1999, hemolymph cytology was the diagnostic method used for every sample, while solid tissue histology preparations were examined for H. nelsoni only from selected locations. In this report, prevalence refers to the percentage of oysters in a sample that were infected by a specific pathogen, regardless of infection intensity. Infection intensity is calculated only for dermo disease, and categorically ranks the relative abundance of pathogen cells in analyzed oyster tissues from 0-7 (Calvo et al. 1996). Mean infection intensities are calculated for all oysters in a sample or larger group (e.g. Disease Bars set), including zeroes for uninfected oysters. For details of parasite diagnostic techniques and calculations see Gieseker (2001) and Maryland DNR (2018).
Biomass Index Department of Natural Resources staff at the Cooperative Oxford Laboratory developed the size-weight relationships used in

9
calculating the Biomass Index (Jordan et al. 2002). Oyster shells were measured in the longest dimension and the meats were removed, oven-dried, then weighed. Average dry-meat weights (dmw) were calculated for oysters in each 5-mm grouping used in the field measurements, and those standards have been used to calculate the annual Biomass Index from size-frequency data collected from Fall Survey field samples, as follows. For each of the 43 disease monitoring stations, the number of small and market oysters (= post-spat or 1+ year classes) in each 5-mm size class was multiplied by the average dry-meat weight (dmw) for that size class to obtain the total weight for each size grouping (Eq. 1). These were summed to get the total dry-meat weight of a 1 bu sample (two 0.5 bu subsamples) from a disease monitoring bar (Eq. 2). The sum of dry-meat weights from the 43 disease monitoring stations, divided by 43, yielded an annual average biomass value from the previous year’s survey (Eq. 3). These annual average biomass values were keyed to the biomass value for 1993. The Biomass Index was derived by dividing the year’s average biomass value by the 1993 average biomass value (1993 biomass index = 1.0) (Eq. 4). Note that the baseline data are from the 1993 Fall Survey. Prior to 2012, the biomass index year followed the year the data were actually collected; e.g. the 1994 baseline index was from the 1993 Fall Survey. To avoid the confusion this caused, in this report the biomass index refers to the year the data were collected (survey year). Therefore, the baseline index year is now 1993, since the data were collected during the 1993 Fall Survey, and the 2019 biomass index is derived from the 2019 Fall Survey data. Biomass Equations For each monitoring station:
1. (# post-spat oysters per size class) x (avg. dmw per size class) = total dmw per size class
2. ∑ dmw per size class = total dmw per 1 bu station sample
For all monitoring stations: 3. (∑ dmw per1 bu station sample)/43 =
annual average biomass value 4. (annual average biomass
value)/(1993 average biomass value) = Biomass Index
Cultch Index The collection of quantitative cultch data was initiated during the 2005 Fall Oyster Survey. During a sampling tow, the distance covered by the dredge while sampling on the bottom is measured using a handheld geographic positioning system (GPS) unit with an odometer function. After the dredge is retrieved, the total volume of oysters and shell is measured in bushel units. Since tow distances vary, the volume is standardized to a 100 ft. tow by dividing 100 by the actual tow distance and multiplying the result by the total cultch volume. If the dredge is full, that sample is dropped from the analysis. The Cultch Index is calculated as the annual average of the standardized cultch volumes from the 53 “Key Bars” used in the Spat Index. Because the dredge is less than 100% efficient in catching oysters and shells, this is not an absolute measure of cultch but provides a relative index for temporal and spatial comparisons. Statistical Framework In previous reports, a non-parametric treatment, Friedman’s Two-Way Rank Sum Test, was used in order to provide a statistical framework for some of the Annual Fall Survey data sets (Hollander and Wolfe 1973). This procedure, along with an associated multiple-range test, allowed for among-year comparisons for several parameters. To quantify annual relationships, a distribution-free multiple comparison procedure, based on Friedman’s

10
Rank Sum Test, was used to produce the “tiers” discussed in these reports. Each tier consisted of a set of annual mean ranks that are statistically similar to one another (Tarnowski 2018). However, with the ever-expanding number of years in the time series of the various parameters, it has become increasingly difficult to discern well-defined tiers, as there is considerable overlap among statistically similar groupings. Given the limited utility of this method due to this issue, it was decided to forego these analyses. Where this method had been most useful was the Spat Index graph, which, for example, showed a record high spat index in 1997 but only ranked a middling tier due to the limited geographic extent of the high spat counts (Tarnowski 2018). To illustrate this point in this report, annual medians of the spat index bars were substituted for the tiers, as explained in the Spatfall Intensity section that follows. Harvest Records Two data sources are used to estimate seasonal oyster harvests - dealer reports (also called Buy Tickets) and harvester reports. The volume of oysters in Maryland bushels caught each day by each license holder is reported to the Department of Natural Resources on both forms (Appendix 2). Dealer reports are submitted weekly by licensed dealers who buy oysters directly from harvesters on the day of catch. Reported on each buy ticket is the catch per day along with effort information, gear type, and location of catch. Both the dealer and the harvester must sign the buy ticket and include their license numbers. Each dealer is also responsible for paying a one dollar tax on each bushel purchased and an additional thirty-cent tax on each bushel exported out of state. Harvester reports are submitted monthly by each license holder authorized to catch oysters and include the catch each day along with effort information, gear type, and location of catch.
Buy ticket records are available from 1989 to present and harvester reports are available from 2009 to present. Although the area or river system was often recorded on buy tickets for much of the time series, the completeness of oyster bar and gear-specific information is much more variable. Generally, harvester reports are more complete with regard to gear type and oyster bar name. Due to the longer time series available from the buy ticket record, this is the standard data source for long-term trends in harvest. However, for applications where gear or oyster bar name is considered critical, the harvester report data source is frequently used instead.
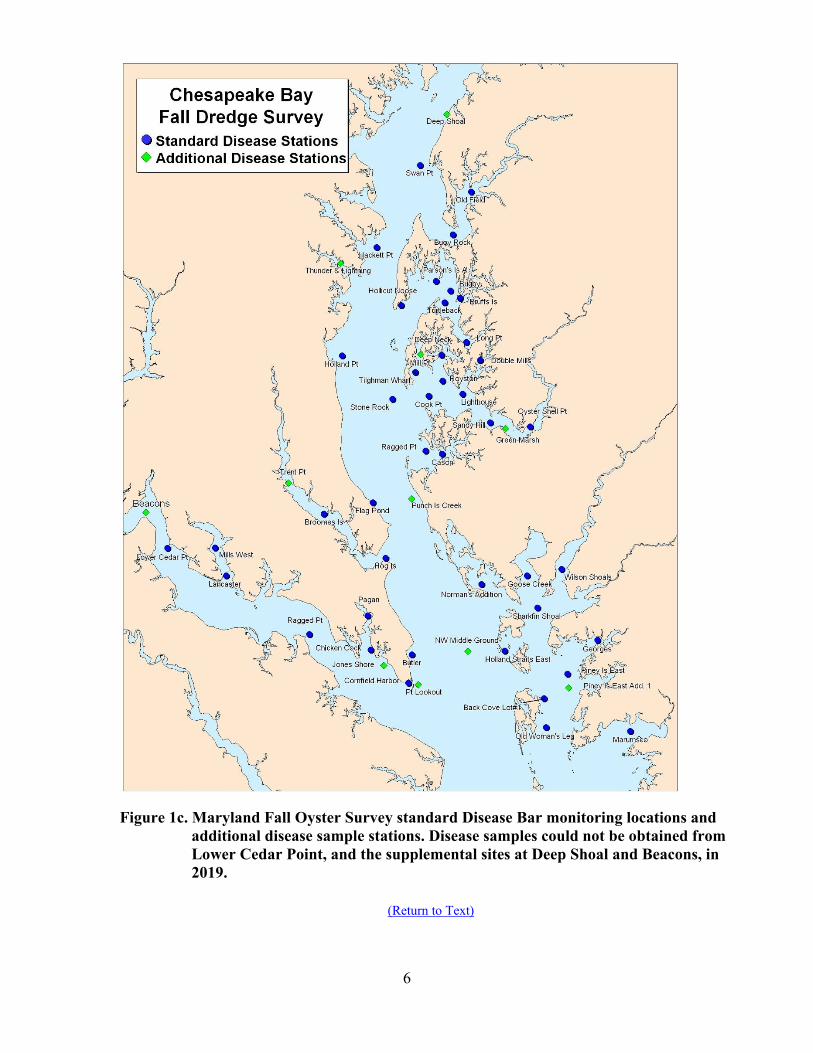
RESULTS FRESHWATER DISCHARGE CONDITIONS Salinity is a key quantifiable factor influencing oyster reproduction and recruitment, disease, and mortality. Whereas salinity is a site-specific measurement which varies widely temporally and spatially throughout the Maryland oyster grounds, freshwater flow, which influences salinity, provides a more synoptic view of baywide conditions and is therefore used as a surrogate for salinity. Annual Streamflow Following the record high freshwater streamflows of 2018 (Tarnowski 2019), elevated flows continued into the first half of 2019, depressing salinities, which in turn affected spatset, disease, mortality and growth of oysters. By mid-year the above average flows had abated and salinities returned to normal by the fall. Nevertheless, the annual streamflow into the Maryland portion of the Bay (Sec. “C” in Bue 1968) in 2019 exceeded the 83-year average by 27% (Figure 2a).
11
Figure 2a. Annual mean monthly freshwater flow into Chesapeake Bay, 1985-2019. USGS Section C: all Maryland tributaries and the Potomac River. Note that the United States Geological Survey (USGS) account of 2019 as the record high flow year refers to a water year, which runs from 1 October of the previous year (2018) to 30 September of the reporting year (2019) (USGS 2020). In contrast, this report refers to the calendar year, which results in 2018 being the record-high flow year. In this case the difference between the two methods of reporting is considerable – the annual average monthly streamflow for Section C during the 2019 water year was 101,170 cu ft/sec compared with 78,058 cu ft/sec for the 2019 calendar year. Monthly Streamflow The discrepancy between the two methods can be explained by the monthly streamflow patterns (Figure 2b).
Figure 2b. Monthly average freshwater flow into Chesapeake Bay (Section C) during 2018-19, including the 83-yr monthly average.
The highest streamflows in 2018 were during the latter part of that year – especially the last three months, which are counted in the 2019 water year. It was the extraordinary streamflows during the last quarter of 2018 that set both the record for calendar year 2018 and water year 2019. Those elevated flows persisted through the winter and spring of 2019. But in contrast to 2018, the flows declined steeply beginning in May 2019. By September flows had reached their lowest point of 2019 - only 61% of the long-term average and a full order of magnitude lower than the same time in 2018. Salinities Elevated freshwater flows during 2018 lowered salinities over an extended time period well into 2019, impacting spatset, disease, mortality and growth of oysters.
Figure 2c. Monthly surface salinities during 2019 at four monitoring stations along a salinity gradient in Chesapeake Bay. Swan Pt. (CB3.2) is in the upper bay, the mid-bay station (CB4.2C) is off the mouth of the Choptank R., Pt. No Point (CB5.2) is in the lower mainstem, and the southern Tangier Sound station (EE3.2) is near the Virginia state line.
Monthly surface salinities for four regions of the Chesapeake Bay in Maryland during 2019 are shown in Figure 2c (Chesapeake Bay Program 2019). These examples demonstrate the influence of streamflow to varying degrees depending on distance from the Susquehanna River, the largest source of freshwater discharge into the bay. Salinities remained depressed through the first half of the year. As streamflows slacked off at mid-

12
year, salinities started to climb, roughly doubling by September/October. The most dramatic increase occurred at Swan Point in the upper bay, where surface salinities jumped from 1.1 ppt in June to 10.9 ppt in September. These increases returned salinities to close to their respective long-term averages at all four locations for that time of year.
A critical threshold for a number of biological processes in oysters is 5 ppt (Tarnowski 2019). Swan Point in the upper bay had surface salinities below 5 ppt for 14 continuous months from June 2018 through July 2019. None of the other locations had salinities below 5 ppt reported in 2019, and the salinity in southern Tangier Sound never fell below 10 ppt (Figure 2c).
SPATFALL INTENSITY The Spatfall Intensity Index, a measure of recruitment success and potential increase in the population, was 23.0 spat/bu, almost identical to the 35-year median value (Figure 3a).
Figure 3a. Spatfall intensity (spat per bushel of cultch) on Maryland “Key Bars” for spat monitoring, including annual median values. Spatset intensity increased 53% from the previous year, with almost half of the 2019 index bars having increased spatfall when compared with 2018 (Table 2). However, it is somewhat unexpected that in 2019 almost a quarter of the Key Index Bars had lower spat counts than in 2018, primarily in the
Choptank, Little Choptank, and upper Tangier regions, and about one-third showed no change (albeit these were almost all zeroes), given the low salinity conditions and lower overall spat index in 2018. Two of the previous nine years (2010, 2012) had strong year classes (Figure 3b), which boosted the population and increased commercial landings.
Figure 3b. Recent Maryland spatfall indices, 2007-2019, including annual median values. However, the relatively unexceptional spatsets over the past seven years have had implications for population abundance, leading to declining harvests in the most recent years until the somewhat more favorable 2015 and 2016 year classes enter the fishery. Although only at the median of the index, the 2019 spatfall may help sustain harvest levels in the upcoming years, particularly in the Tangier Sound region.
Spatfall distribution among the Key Bars in 2019 expanded somewhat from the previous year. Spat were observed on 37 of the 53 Key Bars, whereas 32 Key Bars had spat in 2018 (Table 2). Only five bars accounted for 53% of the index, similar to 2018/2017 and compared with nine bars in 2016. In 2019, nine bars contributed 75% of the spat index (same as 2018/2017; 15 bars in 2016), while 21 bars were needed to reach 95% of the spat index; the remaining 32 bars made up only 5% of the 2019 index. In other words, 60% of the index bars were unproductive in 2019. Only four Key Bars reached triple-digit spat counts: 160 spat/bu on Drum Point

13
in the Manokin Sanctuary, 151 spat/bu on Great Rock and 138 spat/bu on Middleground, both in the Tangier Sound region, and 110 spat/bu on Cornfield Harbor in the Potomac River. Of these, only Drum Point bars has ranked consistently near the top of Key Bar spat counts over the 35-year time series (Table 2). The 2019 spat count on Great Rock was four times its long-term average. When considering all bars surveyed in addition to the Key Bars, the highest spatsets were observed downbay - primarily in middle and lower Tangier Sound and adjacent mainstem of the bay across to the Western Shore, and to a lesser extent the Manokin River and Pocomoke Sound (Figure 4). A modest spatset (11-50 spat/bu)
occurred in the mid-bay, upper Tangier Sound and associated tributaries, and the lower Patuxent and lower Potomac rivers. Spatset was disappointingly light in the normally productive Harris and Broad creeks, Little Choptank and St. Marys rivers, as well as areas in Eastern Bay. Spat were absent from samples in large swaths of the bay - no spat were found along the Western Shore upbay from mid-Calvert County, the upriver two-thirds of the Potomac oyster growing region, the upper Choptank River, parts of Eastern Bay and its tributaries, and the entire Chester River and bay north of the Bay Bridge. The highest spatset on an individual bar (388 spat/bu) was observed on Point Lookout Lot B on the lower Western Shore.
Figure 4. Oyster spatfall intensity and distribution in Maryland, 2019. Intensity ranges represent regional averages.

14
Skewed Spatfall Distributions and the Spatfall Intensity Index The annual Spatfall Intensity Index is an arithmetic mean that does not take into account geographic distribution, whereas the discontinued statistical tiers method did (see Methods section for explanation of discontinuing this analysis). For example, the near-record high spatfall intensity in 1997 was actually limited in extent, being concentrated in the eastern portion of Eastern Bay, the northeast portion of the lower Choptank River, and to a lesser extent, in parts of the Little Choptank and St. Marys rivers (Homer & Scott 2001). Over 75% of the 1997 index was accounted for by only five of the 53 Key Bars, and only ten contributed nearly 95% (Table 2). As a result, the 1997 spat index fell into the third statistical ranking tier (of six) despite being the second highest index on record and an order of magnitude higher than other Tier 3 index years (Tarnowski 2018, Figure 3a). In contrast, the 1991 spatfall (the third highest on record) was far more widespread. Fifteen Key Bars totaled 75% of the index that year, while 28 sites were needed to attain 95% of the spatfall intensity index, placing it in the top statistical ranking notwithstanding having a lower spatfall index than 1997. Another approach to understanding these skewed spatfall distributions examines the annual medians of the index (Figure 3a). Medians are generally higher in proportion to their index (mean or average) when there is a more uniform geographic distribution and are lower when the geographic distribution is limited in extent or skewed. In cases such as in 2019, where 60% of the Key Bars accounted for only 5% of the spat index, the median was low even though the index was moderate, reflecting the disparity
1 Samples were obtained from only 42 Disease Bars in 2019. Lower Cedar Point in the Potomac River had experienced 100% mortality from the freshets; no oysters were available for analysis.
between the majority of bars which experienced low to zero spatset and the few relatively productive bars. In years when spatset is more widely distributed, the annual median is much higher, such as in 1985, 1991, and to a lesser extent 2010 and 2012. In contrast, most of the years had more geographically restricted spatset distributions, dominated by a few strong recruitment bars. Again, this is most vividly illustrated in 1997, when despite having the highest spat index of the time series, the median for that year was comparatively low (e.g. half of the 2012 median, even though the 1997 spat index was over four times higher than the 2012 index). OYSTER DISEASES Dermo disease is caused by the parasite Perkinsus marinus. Prevalences and intensities wax and wane seasonally, and infections may persist from year to year before oysters die. Dermo disease was detected in oysters on 88% of the Disease Bars (Table 3) during 2019, the lowest frequency since the 43-bar subset1 was standardized in 1990. Previously, the lowest frequency had been 91% in 2018. Although dermo disease remained widely distributed throughout the oyster-growing waters of Maryland, the percentage of infected oysters has declined considerably over the past two years. The overall mean infection prevalence in oysters sampled on the Disease Bars was 27%, compared to 40% in 2018 and 69% in 2017, and was the lowest in the 30-year time series (2011 had the previous record-low mean prevalence of 38%) (Figure 5). This marks the 15th of the past 17 years when dermo disease mean prevalences were below the long-term average of 64.5%. The mean infection intensity for dermo disease (1.0)

15
was slightly lower than in 2018 (1.2) but half of the 2017 average, and well below the long-term average, establishing a new record for the lowest average intensity.
Figure 5. Annual mean P. marinus prevalences from Maryland disease monitoring bars. The geographic distribution of high prevalences (>60%) contracted substantially over the past three years from 60% of the Disease Bars in 2017, to 37% in 2018, and down to 12% this year, retreating to the lower main stem but remaining in many of the tributaries, including the Miles and Wye rivers, Harris Creek, upper Tangier Sound, and Manokin River on the Eastern Shore. (Figure 6). Overall, prevalences were relatively low throughout the remainder of the survey sites and dermo disease was not even detected at five locations, notably in portions of Tangier Sound. Outside of the regular disease monitoring sites, dermo disease was found at all nine of the supplemental sites, with prevalences greater than 60% at three of the bars. The two supplemental bars furthest upstream, Deep Shoal in the mainstem and Beacon bar in the upper reaches of the Potomac River, were not sampled for disease in 2019 because of the absence or low densities of oysters due to freshet-related mortalities. Dermo disease was undetected at these locations in 2011 when streamflows were also elevated.
Figure 6. Geographic extent and prevalence of dermo disease in Maryland, 2019. The 2019 annual mean infection intensity of 1.0 (on a 0-7 scale) was slightly lower than in 2018 (1.2) and less than half that of 2017 (2.5), establishing a new record low for the 30-year time series (Table 3). This is the 14th year of the past 17 that the infection intensity index has been at or below the long-term average (Figure 7). The average infection intensity over the 17 years since the end of the 1999-2002 drought is 1.8, similar to another period of low to moderate dermo disease levels from 1994 to 1998 when annual mean infection intensities averaged 1.7. In comparison, the drought period of 1999-2002 had mean annual intensities that averaged 3.4.

16
Figure 7. Annual P. marinus infection intensities on a scale of 0-7 in oysters from Maryland disease monitoring bars. The 2019 frequency distributions of sample mean infection intensities was similar to the previous year (Figure 8).
Figure 8. Perkinsus marinus infection intensity ranges (percent frequency by range and year) in oysters from Maryland disease monitoring bars. In 2019, 2% of the sentinel bars (1 bar) had a mean intensity of 3.0 or greater, compared to 0% in 2018 47% (20 bars) 2017. For perspective, during the peak infection intensity year of 2001, 81% of the sentinel bars had dermo disease mean intensities equal to or greater than 3.0 and 51% had intensities equal to or greater than 4.0. The proportion of bars that were in the lowest intensity range of less than 1.0 was 52% in 2019, compared to 40% in 2018 and only14% in 2017. In addition, none of the nine supplemental bars had mean infection intensities of 3.0 or greater in 2019.
Infection intensities in individual oysters that are ≥5 on a 0–7 scale are considered lethal; such infection intensities were detected in 8% of oysters sampled in 2019, slightly up from 7% in 2018 but substantially lower than the 21% in 2017. MSX disease, resulting from the parasite Haplosporidium nelsoni, is another potentially devastating oyster disease. This parasite can cause rapid mortality in oysters and generally kills a wide range of year classes, including younger oysters, over a long seasonal period. When MSX disease coincides with elevated dermo disease intensities, mortality levels can be very high, as seen in 2001 and 2002. In 2019, MSX disease mean prevalence (0.1%) of infected oysters on Disease Bars was identical to 2018 and a two-fold order of magnitude lower than the most recent peak in 2016 (11.1%). This reprises 2018 as having the lowest number of infected sentinel Disease Bars and the lowest average prevalence recorded in the time series. When considering both the Disease Bars and supplemental sites, the geographic range of MSX disease diminished slightly in 2019 and shifted to Pocomoke Sound (Figure 9). While in 2019 Haplosporidium nelsoni was detected in only one oyster on one (2%) of the Disease Bars (Marumsco) and from none of the supplemental sites, in 2018 it was found in two oysters from two supplemental bars in addition to the one oyster from the Disease Bar. Thus, 2019 had the smallest number of sampled oysters infected with H. nelsoni in Fall Oyster Survey records from the past 30 years. This compares with 14 Disease Bars (33%) with infected oysters in 2017 and 24 (56%) in 2016 (Table 4, Figure 9). For reference, at its greatest extent the parasite occurred on 90% of the bars in 2002.

17
Figure 9. Geographic distribution of MSX disease in Maryland waters, 2019. Historically, the abatement of MSX disease in 2003-2004 due to two consecutive years of record freshwater flows into the Bay signified the end of the most severe H. nelsoni epizootic on record in Maryland waters. The 2002 epizootic set record high levels for both the frequency of affected disease monitoring bars (90%) and the mean annual prevalence within the oyster populations (28%), leaving in its wake observed oyster mortalities approaching 60% statewide. Since 1990, there have been five H. nelsoni epizootics: 1991-92, 1995, 1999-2002, 2009, and 2015-16. The first three were associated with prominent spikes in observed mortalities (Figure 10), while the 2009 and 2016 outbreaks were accompanied by a modest mortality increase that were ameliorated by timely freshwater flows (Tarnowski 2011).
Figure 10. Percentage of Maryland oysters with MSX disease compared to annual means for observed mortalities on the disease monitoring bars from 1990-2019. All of these epizootics coincided with dry years (Figure 2a). These were followed closely by periods of unusually high freshwater inputs into parts of Chesapeake Bay, which resulted in purging H. nelsoni infections from most Maryland oyster populations (Homer & Scott 2001; Tarnowski 2005, 2011). The current decrease in H. nelsoni infections is associated with the record high streamflows of 2018 which remained elevated into 2019 (Figure 2b). OBSERVED MORTALITY Despite locally devastating freshets at some upstream locations (see below), the Maryland-wide Observed Mortality Index was slightly lower than the previous year (Table 5). At 13%, the 2019 index was well below the 35-year mean of 22.2%, continuing a 16-year trend as a consequence of low to moderate disease pressure (Figure 11). Nevertheless, the index was double that of 2012, which had the lowest index in the long-term time series. For the 43 disease monitoring bar subset, the average observed mortality of 13.7% over the last 16 years approaches the background mortality levels of 10% or less found prior to the mid-1980s disease epizootics (DNR, unpubl. data). This is in remarkable contrast to 2002 when record-high disease levels devastated Maryland populations, resulting in a 58% observed mortality rate.

18
Figure 11. Mean annual observed mortality, small and market oysters combined. Looking at all Survey sites, observed mortalities were generally low to moderate. Aside from the upper Potomac River and the upper bay, the highest mortality observed on an individual bar with more than 50 live oysters/bushel2 was 32.7% on Cabin Creek bar in the upper Choptank River.
Figure 12a. Geographic distribution of total observed oyster mortalities (small and market oysters) in Maryland, 2019. Mortality ranges represent regional averages; individual bars may vary substantially. 2 Sites with low numbers of live and dead oysters may distort observed mortality estimates.
The north-south gradient in observed mortalities evident in most years was not apparent in 2019, with strikingly low average mortalities throughout most of the mainstem including the lower Western Shore, and the entire Tangier Sound region (Figure 12a). Tangier Sound itself, typically a higher mortality area, averaged a remarkably low observed mortality of 4.2%, in contrast to 1999 at the start of the millennial epizootic when the average observed mortalities climbed to 48.0%. Aside from the extreme mortalities observed in the upper Potomac River and upper bay, higher regional mortalities were observed in the Chester and upper Choptank rivers, typically lower salinity areas that may suffer from freshet effects. The highest Index-bar mortality was observed on Lower Cedar Point in the upper Potomac River, where 100% of the oysters were dead (Table 5).
Freshet-Related Mortalities The prolonged period of elevated streamflows that began in 2018 and consequent drop in salinity had a severe impact on the upper Potomac bars and to a lesser extent, the upper bay oysters. In the Potomac River, all of the surveyed bars above Swan Point were devoid of live oysters (Figure 12b). Several of these bars had been planted with seed oysters over the past few years and their loss was a devastating blow to the fishery. The most dramatic impact to these seed plantings was evident early on at Bluff Point bar, where in 2018 a one bushel sample had 226 dead oysters and no live oysters. This was a prelude to what would befall the other upper Potomac bars. While a few oysters remained alive on the upper river bars in the fall of 2018, no live oysters were found in samples taken in 2019. There were also more subtle consequences from the freshet. The oysters on Beacon bar, one of the furthermost-upstream bars in the Potomac, were

19
conditioned to low salinity and had weathered several deluges over the past three decades, including the wet years in the 1990s, 2003-04, and 2011 (Figure 2a). This unique oyster population suffered 100% mortality in 2019.
Figure 12b. Observed mortalities on the upper oyster bars of the Potomac River sampled in October 2019. Compared to the upper Potomac bars, the upper bay oyster populations fared somewhat better. On the Eastern Shore side, the highest observed mortalities ranged from 62% to 100% on the three uppermost surveyed bars, but unlike in the Potomac, these were bars with extremely low numbers of live or dead oysters – less than 10 oysters/bu. For the remainder of the Eastern Shore bars in the upper bay, the observed mortality averaged 4.3%. Mortalities on the Western Shore bars of the upper bay were somewhat higher. Only one bar with more than 50 live oysters had elevated mortalities - two oyster seed
plantings on Man-O-War Shoals had mortalities of 37% and 50%, while a third sample site had only four dead but no live oysters, resulting in an exaggerated observed mortality for that sample. Surprisingly, these are almost identical to mortalities observed in 2018, despite the continued high streamflows that extended through the spring of 2019. The combined observed mortality on Man-O-War Shoals was 41.9%, in contrast with the 2011 freshet, when 100% of the oysters died on this bar. Aside from Man-O-War Shoals, the observed mortality on the other Western Shore bars in the upper bay averaged 13.9%. BIOMASS INDEX The Biomass Index is a relative measure of how the oyster population is doing over time. It accounts for recruitment, individual growth, natural mortality, and harvesting in a single metric. In assessing the size of the population, the Biomass Index integrates both the abundance of oysters and their collective body weight (another way of looking at how large they are). For example, when examining two groups of oysters with the same abundance, the group with the greater number of larger oysters would have the higher biomass. The 2019 Maryland Oyster Biomass Index of 1.72 represents a slight decline in this index from the previous year (Figure 13a), ranking it sixth highest in the 27-year time series. The size distribution shifted to more market oysters relative to sublegal oysters at a ratio of 0.80 sublegals to one market oyster, compared with the sublegal to market ratio of 1.32 in 2018. This can also be expressed as the percentage of sublegal oysters: 44.5% in 2019, down from 56.6% in the previous year. This shift is reflected in the increase in average size of index bar oysters, from 72.7 mm in 2018 to 78.1 mm in 2019. It might be expected that an increase in oyster size would result in a corresponding increase in biomass. However, the second component of the

20
Biomass Index, oyster abundance, showed a decline. For all index bars, the average number of oysters dropped from 114.4/bu in 2018 down to 97.8/bu in 2019. This difference was sufficient to counter the increase in average size, resulting in the slight dip in the Biomass Index.
Figure 13. Maryland oyster Biomass Index. The year 1993 represents the baseline index of (1). The oyster population had been slow to recover since its nadir in 2002, the last year of the devastating four-year disease epizootic. The Biomass Index remained below one3 (1.0) for eight consecutive years despite low disease pressure and high oyster survivorship over this period. Spatfall during this timeframe was sufficient to maintain the population at this level but not increase it. It was not until the strong recruitment event in 2010 - bolstered by another good spatset in 2012 - that the population began to grow, as mirrored in the increase in the Biomass Index. However, the index seems to have plateaued with the series of unexceptional spatsets over the past few years.
CULTCH INDEX The Cultch Index is a relative measure of oyster habitat. Cultch is crucial for providing hard substrate for oyster setting as well as habitat for the myriad other organisms associated with the oyster 3 The baseline (Biomass Index = 1) year of 1993 was chosen because it had the lowest harvest on record when the index was established.
community. For the purpose of the Fall Oyster Survey, cultch is defined as primarily oysters (live and dead) and shell (combined). The collection of quantitative cultch data was initiated during the 2005 Fall Oyster Survey. The 2019 Cultch Index of 0.89 bu/100 ft. was similar to the 15-year average of 0.90 bu/100 ft. However, some individual bars showed much steeper declines. Of the 52 bars used in this analysis, 37% had standardized volumes that were less than 75% of their respective 15-year averages (Figure 14).
Figure 14. Range of cultch index values for individual Key bars in 2019 and the percent difference from their 15-year averages. The red dashed line indicates 75% of the 15-year average. Although 15 years is a comparatively short time frame for discerning long-term trends in the Cultch Index, a distinctive pattern emerged over this period (Figure 15). A three-year rolling average was used to smooth the interannual variability inherent in the index (the rolling average is assigned to the terminal or third year of each grouping). The increase in the Cultch Index during the early 2010s reflects improvements in recruitment and survivorship during that period, especially
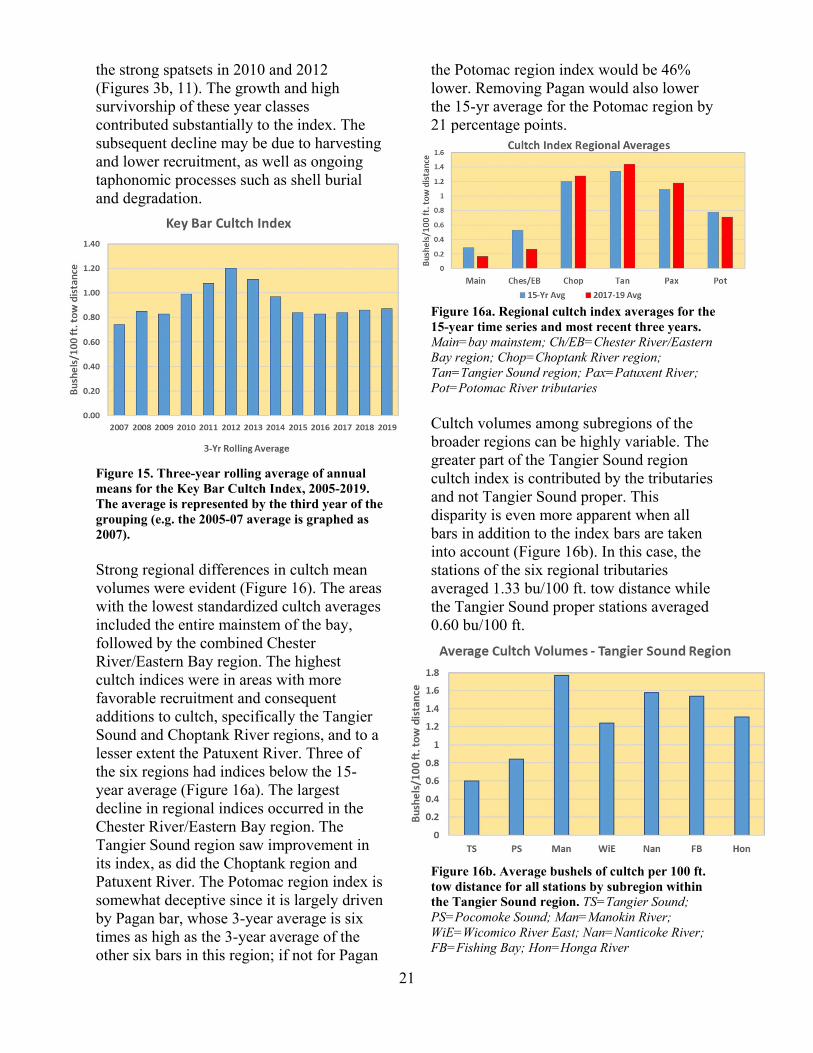
21
the strong spatsets in 2010 and 2012 (Figures 3b, 11). The growth and high survivorship of these year classes contributed substantially to the index. The subsequent decline may be due to harvesting and lower recruitment, as well as ongoing taphonomic processes such as shell burial and degradation.
Figure 15. Three-year rolling average of annual means for the Key Bar Cultch Index, 2005-2019. The average is represented by the third year of the grouping (e.g. the 2005-07 average is graphed as 2007). Strong regional differences in cultch mean volumes were evident (Figure 16). The areas with the lowest standardized cultch averages included the entire mainstem of the bay, followed by the combined Chester River/Eastern Bay region. The highest cultch indices were in areas with more favorable recruitment and consequent additions to cultch, specifically the Tangier Sound and Choptank River regions, and to a lesser extent the Patuxent River. Three of the six regions had indices below the 15-year average (Figure 16a). The largest decline in regional indices occurred in the Chester River/Eastern Bay region. The Tangier Sound region saw improvement in its index, as did the Choptank region and Patuxent River. The Potomac region index is somewhat deceptive since it is largely driven by Pagan bar, whose 3-year average is six times as high as the 3-year average of the other six bars in this region; if not for Pagan
the Potomac region index would be 46% lower. Removing Pagan would also lower the 15-yr average for the Potomac region by 21 percentage points.
Figure 16a. Regional cultch index averages for the 15-year time series and most recent three years. Main=bay mainstem; Ch/EB=Chester River/Eastern Bay region; Chop=Choptank River region; Tan=Tangier Sound region; Pax=Patuxent River; Pot=Potomac River tributaries Cultch volumes among subregions of the broader regions can be highly variable. The greater part of the Tangier Sound region cultch index is contributed by the tributaries and not Tangier Sound proper. This disparity is even more apparent when all bars in addition to the index bars are taken into account (Figure 16b). In this case, the stations of the six regional tributaries averaged 1.33 bu/100 ft. tow distance while the Tangier Sound proper stations averaged 0.60 bu/100 ft.
Figure 16b. Average bushels of cultch per 100 ft. tow distance for all stations by subregion within the Tangier Sound region. TS=Tangier Sound; PS=Pocomoke Sound; Man=Manokin River; WiE=Wicomico River East; Nan=Nanticoke River; FB=Fishing Bay; Hon=Honga River

22
COMMERCIAL HARVEST Commercial oyster landings continued to slump during the 2018-19 season. With reported harvests of 145,000 bushels, oyster landings were 20% lower than the previous harvest season, extending a declining trend to five years (Table 6, Figure 17a). This was the lowest harvest total since the 2011-12 season and was a 65% drop from the most recent landings peak in the 2013-14 season. From the long term perspective, landings during the 2018-19 season were only half of the 34-yr average of 291,000 bu/yr. At an average reported price of $45.52 per bushel, the dockside value of $6.6 million was a decrease of $2.1 million (-24%) from the previous year (Table 7a.).
Figure 17a. Maryland oyster landings over the past 27 seasons. Taken in the longer historical context, the average landings over the last several years remain only a fraction of the harvests prior to the disease epizootics of the mid-1980s (Figure 17b). Since the heyday of the Maryland oyster fishery in the 19th century, annual landings below 100,000 bushels have been reported in only five seasons, all within the past 26 years (and four of these in the most recent 17 years) following the onset of a series of disease epizootics beginning in the mid-1980s.
Figure 17b. Maryland seasonal oyster landings, 1976-77 to 2018-19. In the 15 years before the 2016-17 season, commercial oyster landings followed a similar pattern as the Biomass Index (Figure 18). Prior to the 2012-13 season, the fishery struggled to rebound from the devastating oyster blight of 2002, with a record low of 26,000 bu taken in 2003-04. The sizeable harvest increases of recent seasons, following the below-average landings of the 11 years beforehand, were due to the strong 2010 and 2012 year-classes and subsequent good survivorship, allowing a larger proportion of those cohorts to attain market size. This abundance of oysters led to an increase in the number of harvesters and fishing effort, resulting in higher landings. However, unexceptional spat sets in 2011, 2013, and 2014 were insufficient to sustain harvests, leading to the substantial drop in landings during the last three seasons. The Biomass Index did not track this harvest decline but actually increased because of above-median spatfalls in 2015 and 2016. The subsequent growth of the sublegal-size oysters as well as continued growth of oysters protected in sanctuaries contributed to maintaining the Biomass Index despite the drop in landings.

23
Figure 18. Relationship between the Biomass Index calculated at the start of the harvest season and total landings reported at the end of that same season. Note lag between the two metrics when abundant sublegal oysters add to the Biomass Index but have not yet entered the fishery (e.g. 2018-19).
Oyster growth was stunted by the low salinity conditions prevalent in 2018, with many small oysters (likely 2015/16 year classes) failing to reach market size (Figure 19).
Figure 19. Size distribution and growth of oysters from the Biomass Index bars in open harvest areas between 2018 and 2019. In fact, the average size of oysters on Biomass Index bars in harvest areas increased a mere 2.4 mm between 2017 and 2018, despite the fact that the average size of oysters in 2017 was heavily weighted with small oysters (70% of the index bar oysters were sublegals). Along with underperforming spatsets and the reduced number of market oysters, this could help
account for the steep decline in harvests during the 2018-19 season. As salinities returned to normal, the average size of oysters on the Biomass Index bars within harvest areas increased from 69.1 mm in 2018 to 75.8 mm in 2019, illustrated by the shift of the mode of the size-frequency distribution to the right. With the sustained low mortality rates over the past few years, these younger oysters continued to grow and are beginning to recruit to the fishery, which should provide a boost to the landings in the 2019-20 harvest season.
The Choptank was the dominant harvest area, accounting for 39% of the 2018-19 landings, the majority of which came from Broad Creek (22% of the Maryland harvest) (Table 6). The Tangier Sound region, including the Nanticoke, Wicomico and Honga rivers, Pocomoke Sound and Fishing Bay, slipped into second place with 28% of the landings after dominating for years. With the exceptions of the Choptank region and lower bay, almost all of the regions experienced declines in landings. The most substantial changes (>4,000 bu) in Maryland landings between the 2017-18 and 2018-19 seasons are listed below. Chester River
-decreased 4,522 bu (-88%) Upper Tangier Sound -decreased 11,263 bu (-34%) Lower Tangier Sound -decreased 4,438 bu (-61%) St. Marys River -decreased 6,388 bu (-34%) Lower Choptank River -increased 5,391 bu (+84%) The combined harvests in the entire Tangier Sound region decreased by 26,449 bushels or -40% from 2017-18, which itself had experienced a 26% loss from the previous year, and a staggering 196,461 bushels (-83%) from just five years earlier (the recent peak season of 2013-14). The St. Marys River showed the second largest decrease in

24
harvest from the prior year, yet was still almost 50% above its long-term average, ranking it third highest in the percentage of total landings. Harvests in the Chester River fell to 613 bushels, a tributary whose long-term average is 21,000 bu/year. While the Choptank region as a whole went up in landings, the middle Choptank portion and Broad Creek had declines. The northern portion of the mainstem and associated tributaries continued to perform poorly due to a lack of recruitment and repletion activity. For example, the combined percentage of landings from the upper bay and Chester River, which in a couple of seasons in the 1990s and early 2000s accounted for over half of Maryland’s total landings, was a mere 0.9% of the total harvest in 2018-19 (Table 6). The 34-year harvest average for these two regions was 33,000 bu/year, primarily sustained by numerous seed plantings from the DNR Repletion Program. Similarly, harvests from the once-productive Eastern Bay region are about a quarter of the 34-year average. For the 12th consecutive season, power dredging was the predominant method of harvesting, accounting for 44% of the total landings (Table 7b). However, the actual landings from power dredging were about one-quarter of those during the peak 2013-14 season (Table 7a). This activity took place mainly in the lower Eastern Shore and Choptank regions. Hand tonging produced 25% of the total harvests, primarily from Broad Creek - well below 74% of the landings during the 1996-97 season when power dredging was largely prohibited. Patent tonging fell slightly to 15% of the total; sail dredging (skipjacks) and diving also experienced declines. OYSTER SANCTUARIES An in-depth analysis of the performance of Maryland’s oyster sanctuary system is beyond the scope of this report and will be provided at a future date in a stand-alone
document examining longer-term trends. However, some salient points are considered here to provide a concise view of the sanctuary oyster populations, focusing on the priority (i.e. large-scale restoration) sanctuaries. A total of 88 oyster bars within 32 sanctuaries were sampled during the 2019 Fall Survey (Table 8). Recruitment within the priority sanctuaries and adjacent open harvest areas was actually lower than the previous year and well below their respective Key Bar long-term averages, with the exception of mid-Tangier Sound (Table S-1). This was unanticipated considering that the spat index was about 50% higher than the prior year (Table 2) and speaks to the limited extent of good spatset in 2019 (Figure 4). A comparison of spatset in sanctuaries with adjacent harvest areas showed similar results. Although the trend showed slightly higher spatsets in the open areas, the spat counts were so low that any differences were biologically meaningless. Tangier Sound and to a lesser extent the Manokin River, were within the locus of elevated spatsets in Maryland during 2019. The average spat count of the mid-Tangier Sound bars was significantly above that of the Manokin River (t-test, P < 0.05). This is the reverse of 2018, when the Manokin River had a higher average spatfall than mid-Tangier Sound. The average number of adult (small and market) oysters per bushel in the priority sanctuaries was over twice as high as in adjacent harvest areas. The Manokin Sanctuary had the highest average number of adult oysters of any area in this comparison and was almost an order of magnitude above the nearby mid-Tangier Sound bars (Table S-1). The only region where there was little difference between the two management treatments was the Little Choptank River.

25
Table S-1. 2019 average regional oysters/bushel by size/age class and long-term Key Bar spat/bushel for priority restoration sanctuaries and nearby harvest areas.
Region Status Regional 2019 Regional Spat Key Bar 35-Yr Avg. Sm + Mkt 2019 2018
Harris Cr. Sanc. 133 0 30 38.8 Harris Cr. Open 82 7 41 64.6 Broad Cr. Open 116 6 54 115.3 Tred Avon R. Sanc. 65 0.2 1 17.6 Tred Avon R. Open 41 3 1 17.6 L.Choptank R. Sanc. 119 5 14 87.8 L.Choptank R Open 117 3 7 56.2 Manokin R. Sanc. 332 85 107 83.8* Mid-Tangier S. Open 39 184 81 93.5* St. Marys R. Sanc. 162 8 4 165.3 St. Marys R. Open 76 15 9 79.9
*Average of two Key Bars.
Twenty oyster disease samples were obtained from 18 sanctuaries. The average dermo disease levels in these sanctuaries were considerably lower than the previous year (average prevalences of 32.8% in 2019 vs. 51.2% in 2018; mean intensities of 1.2 in 2019 vs. 1.5 in 2018). Of the 13 sentinel Disease Bars within oyster sanctuaries, dermo disease prevalences were all below the 30-year site averages, and only Georges bar in the Manokin River sanctuary exceeded the long-term intensity average (Table 3). Dermo disease levels were somewhat lower on Disease Bars in the open harvest areas, averaging 24.4% prevalence and 0.9 mean intensity (Table S-2). The higher dermo disease levels in the sanctuaries can be attributed to the fact that they had a greater proportion of older, larger oysters than the harvest bars (Figure 20); parasite burdens tend to build up as oysters age (Ford & Tripp 1996). MSX disease was not detected at any of the 13 Disease Index Bars (Table 4) and seven supplemental disease sites within sanctuaries.
Mortality rates on sanctuary bars generally continue to be well below their long-term averages (Table 5). Eight of the 12 Mortality Index bars within sanctuaries had observed mortalities below the 35-year individual bar averages. For all Mortality Index bars, observed mortalities were similar between sanctuary bars (5.6%) and open harvest bars (7.1%), despite the higher overall mean dermo disease levels at the sanctuary sites (Table S-2). The bars associated with the five priority sanctuaries and adjacent harvest areas showed extremely low observed mortalities – all were in single digits and were close to the regional estimates except for two open harvest Mortality Index bars. The 33% observed mortality on the Piney Island East harvest bar may be an overestimate, as only six oysters were found in the sample. On the other hand, Chicken Cock bar had a more representative sample of 90 live and dead oysters combined with an observed mortality of 20%.

26
Table S-2. 2019 Dermo disease levels and observed mortality estimates for disease bars and regional averages on priority restoration sanctuaries and nearby harvest areas. MSX disease was not detected at any of these sites. Averages for all Disease Bars both within and outside sanctuaries are also presented.
Region Disease Bar Status Dermo Observed Mortality %
Prevalence%
Intensity Disease Bar Regional
Harris Cr. Mill Pt./Rabbit I.* Sanc. 54 1.9 3 2.9 Harris Cr. Tilghman Wharf Open 23 1.5 4 1.8 Tred Avon R. Double Mills Sanc. 47 2.7 3 6.1 Mid-Choptank R. Lighthouse Open 3 0.2 4 2.8 Broad Cr. Deep Neck Open 33 2.8 2 1.2 L. Choptank R. Cason Sanc. 60 2.6 4 5.7 L. Choptank R. Ragged Pt. Open 60 2.6 3 3.9 Manokin R. Georges Sanc. 77 3.1 5 5.9 Mid-Tangier S. Piney Island East Open 17 2.5 33 5.2 St. Marys R. Pagan Sanc. 17 2.4 4 6.5 St. Marys R. Chicken Cock Open 27 2.4 20 10.8 Average of all Sanctuary Disease Index Bars 32.8 1.2 5.6 Average of all Harvest Disease Index Bars 24.4 0.9 7.1
*Dermo disease values are averages of the two bars. Both are supplemental bars and not part of the Disease Index set.
Figure 20. Average oyster biomass by 5 mm size classes on Biomass Index bars in harvest areas and sanctuaries. Of the 43 Biomass Index bars, 13 bars are within sanctuaries (Table 8). The average biomass per index bar in 2019 was substantially higher in the sanctuaries (200.1 g/bar) than in the open harvest areas (118.4 g/bar). Most of this difference was in the larger market size classes (Figure 20), where the average market biomass per bar in the sanctuaries (155.3 g/bar) was almost twice as high as in the open harvest areas (81.5 g/bar). In contrast, the average biomass of sublegal oysters was relatively close between the two management categories (44.7 g/bar in the sanctuaries vs. 36.9 g/bar
in the harvest areas). The average size of adult oysters was somewhat larger in the sanctuaries (81.7 mm) than on the harvest bars (75.8 mm). DISCUSSION Streamflow – Timing is Everything The consequences of the elevated streamflows over the first half of 2019 and the timing of its return to normal during that summer were mixed. The most dramatic of the adverse effects were the catastrophic mortalities suffered by the oyster populations on the most upriver bars of the Potomac River. What few oysters remained during the 2018 Fall Survey succumbed to the continued onslaught of freshwater afterwards. Observed mortalities were 100% on the seven farthest upstream Potomac River sites surveyed in 2019. Recruitment was also impacted throughout large swaths of Maryland waters. The abatement of streamflows and return to normal salinities occurred too late in many areas to allow for spawning and/or spatset, which ordinarily begins in June/early July, but can be inhibited by depressed salinities

27
(see Tarnowski 2019 for a review of the effects of low salinities on oysters). The broodstock oysters may have been in poor condition due to sustained exposure to these low salinity conditions. Another possibility is the phytoplankton that they feed on may have been sparse or of a different community composition more suited to lower salinities, which the oysters were unable to fully utilize. Either situation would affect their ability to store the energy reserves needed for gametogenesis. Further exacerbating the problem, the inability to feed sufficiently also causes oysters to draw on whatever glycogen reserves they have remaining from overwintering (Thompson et al. 1996). This could account for the poor spatfall in normally productive areas such as Broad Creek. This tributary actually had higher recruitment in 2018, probably because of spring salinities favorable to oyster condition and gametogenesis before the summer deluge began. Further downbay, the situation was quite different. The surface salinity in southern Tangier Sound remained at or above 10 ppt through the winter and into spring, sufficient to allow the initiation of the gametogenic process (Loosanoff 1953, Calabrese & Davis 1970), even though it was below average for that time of year in that region. The elevation in salinity during May and into mid-summer was well timed for successful spawning and spatfall (Thompson et al. 1996). The result was a geographic band of elevated spatfalls from middle and lower Tangier Sound across the bay to Pt. Lookout, with counts ranging from about 100 spat/bu to 350 spat/bu. The influence of salinity on oyster diseases is well documented (Ford & Tripp 1996; Tarnowski 2010, 2012). Oyster parasites are salinity sensitive, particularly H. nelsoni. The below average spring/early summer salinities, coupled with low salinities of the previous year, suppressed the development of diseases to striking effect – disease levels were the lowest in the 30-year time series.
Although MSX disease can exist in salinities as low as 10 ppt, below which it is purged from oysters, it becomes substantially more pathogenic in salinities greater than 15 ppt and temperatures higher than 20°C (Ford 1985). But by the time salinities returned to normal, it was too late in the year for diseases to progress to any great extent. As a consequence of reduced disease pressure, the 2019 observed mortality index remained below the long-term average despite the freshet-related losses in the upper bay and Potomac River. The timing of the reduced freshwater flow also benefited oyster growth, which had been depressed from the prolonged freshet. With salinities returning to normal in the late summer and early fall, at least two year classes of sublegal oysters began attaining market size simultaneously, just in time for the 2019-20 harvest season. The Status of Tangier Sound Oysters Several notable metrics call attention to the current status of the oyster population in Tangier Sound. As one of the most productive regions in Maryland, Tangier Sound historically has been the center of the oyster industry in the state. Although this productivity is in part due to its higher salinity regime, for the same reason it is also an area that has been battered by diseases, and has been especially vulnerable to MSX disease. During the 2000-01 season, in the middle of the millennial epizootics, soaring mortalities as high as 61% were observed on some bars and harvests sank to a scant 1,550 bu, or only 4% of the total Maryland landings. And yet, despite this devastation, by the 2013-14 season landings had rebounded to 103,000 bu, the highest since the 1985-86 season and three times the 34-year average, which speaks to the resiliency of this population. Landings continued to be above the long-term average until this past (2018-19) season.

28
The disease results of the 2019 survey in Tangier Sound have turned long-term patterns of geographic distribution on its head. Expected increased levels of disease with increased salinity did not occur and were below the baywide average; despite the near ubiquity of dermo disease in Maryland oysters, it was not detected in three of the five disease monitoring stations within Tangier Sound (Holland Straits bar is included in this group). The average prevalence was 16% compared with the 2019 baywide average of 27% and the 30-year average in Tangier Sound of 73.8%. Likewise, the average infection intensity was 0.58 versus 0.97 baywide and 2.6 for the 30-year average. To give an idea of how exceptional the Tangier Sound dermo disease levels were, note that the 2019 baywide averages for both prevalence and intensity were the lowest in the long-term time series. Furthermore, MSX disease, a past scourge of Tangier Sound oysters, was not detected in oysters at any of the five standard monitoring sites. The exceptionally low disease levels consequently inverted the spatial model for mortality. Observed mortality for all Tangier Sound bars was 4.2% and 3.3% for the subset of the five disease/mortality index bars, compared with 13% for the 2019 baywide mortality index and 28.7% for the long-term average of those five Tangier Sound bars. This is in contrast with the upper reaches of the bay and tributaries, where elevated 2019 observed mortalities ran as high as 100% at some locations due to prolonged high freshwater flows. Equally noteworthy was the good spatset experienced in Tangier Sound, in particular the middle and lower portions of the sound. For example, Great Rock near the Virginia line had spat counts that were four times its long-term average. Bars in this region had the highest counts since the strong 2010 and 2012 year classes. This same portion of the sound also had an above average spatset in
2018, though the counts were not nearly as high as in 2019. This strong recruitment event brings to focus two issues in particular. First is the question of the source of the larvae that generated this spatset. Given the present state of scientific expertise, the source of these larvae is unknowable, so this topic is largely speculative. What brought attention to this issue was the low average density of oysters in Tangier Sound relative to nearby tributaries. Two of these tributaries, both with oyster sanctuaries within them, have substantial numbers of broodstock oysters that could very well have provided the larvae. As noted in Table S-1 of the Sanctuary section of this report, the Manokin Sanctuary averaged over eight times the number of broodstock oysters in a bushel sample as did the adjacent high recruitment area of mid-Tangier Sound. In addition, the Nanticoke River Sanctuary, with its substantial natural oyster population (averaging 172 adult oysters/bu sample), augmented by numerous oyster aquaculture operations, sits atop Tangier Sound. This difference is even starker when looking at oyster densities over a fixed tow distance, using the same methodology as was used to determine the Cultch Index. On average, a nearly threefold longer tow distance was required to obtain a sample in Tangier Sound than in these two tributaries. The mean number of adult oysters per 100 ft. tow distance in Tangier Sound was 17 oysters/100 ft., compared with 490 oysters/100 ft. in the Manokin Sanctuary and 271 oysters/100 ft. in the Nanticoke Sanctuary. Since oysters release their gametes into the water column when reproducing, the higher the oyster density the greater the probability of fertilization success (Thompson et al. 1996). Other possible sources of larvae are suggested by the widespread nature of the southern Maryland recruitment event. This spatset, stretching from Tangier Sound
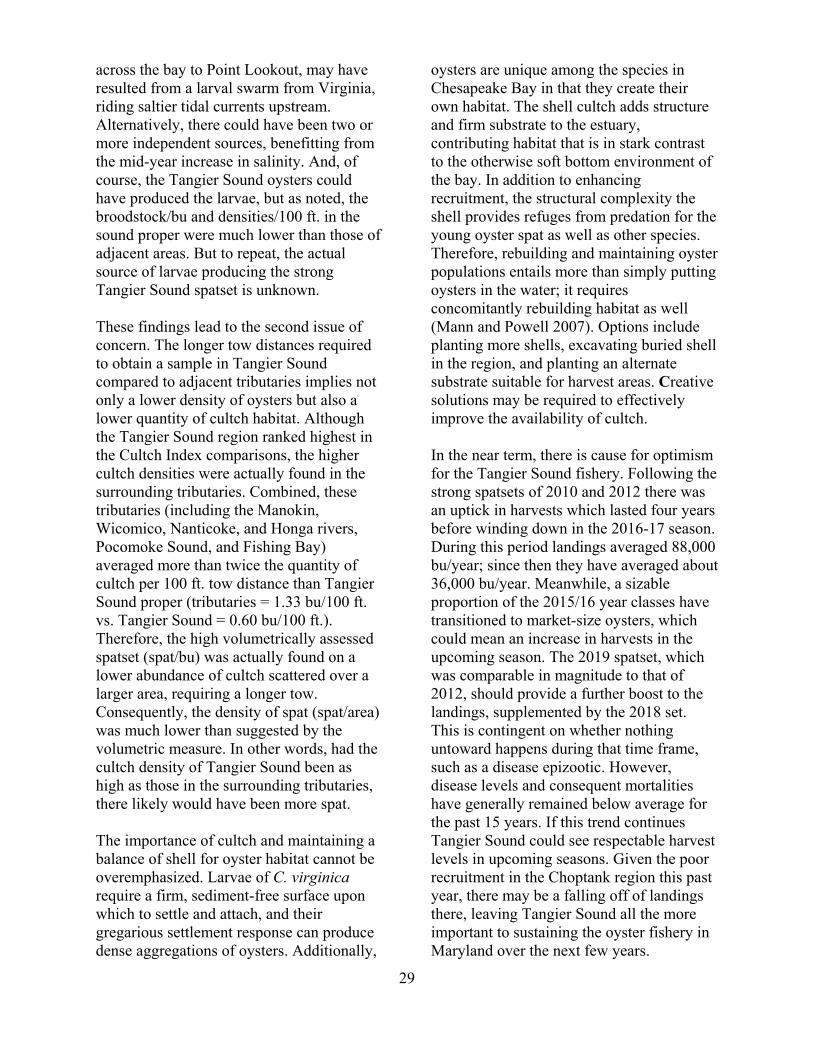
29
across the bay to Point Lookout, may have resulted from a larval swarm from Virginia, riding saltier tidal currents upstream. Alternatively, there could have been two or more independent sources, benefitting from the mid-year increase in salinity. And, of course, the Tangier Sound oysters could have produced the larvae, but as noted, the broodstock/bu and densities/100 ft. in the sound proper were much lower than those of adjacent areas. But to repeat, the actual source of larvae producing the strong Tangier Sound spatset is unknown. These findings lead to the second issue of concern. The longer tow distances required to obtain a sample in Tangier Sound compared to adjacent tributaries implies not only a lower density of oysters but also a lower quantity of cultch habitat. Although the Tangier Sound region ranked highest in the Cultch Index comparisons, the higher cultch densities were actually found in the surrounding tributaries. Combined, these tributaries (including the Manokin, Wicomico, Nanticoke, and Honga rivers, Pocomoke Sound, and Fishing Bay) averaged more than twice the quantity of cultch per 100 ft. tow distance than Tangier Sound proper (tributaries = 1.33 bu/100 ft. vs. Tangier Sound = 0.60 bu/100 ft.). Therefore, the high volumetrically assessed spatset (spat/bu) was actually found on a lower abundance of cultch scattered over a larger area, requiring a longer tow. Consequently, the density of spat (spat/area) was much lower than suggested by the volumetric measure. In other words, had the cultch density of Tangier Sound been as high as those in the surrounding tributaries, there likely would have been more spat. The importance of cultch and maintaining a balance of shell for oyster habitat cannot be overemphasized. Larvae of C. virginica require a firm, sediment-free surface upon which to settle and attach, and their gregarious settlement response can produce dense aggregations of oysters. Additionally,
oysters are unique among the species in Chesapeake Bay in that they create their own habitat. The shell cultch adds structure and firm substrate to the estuary, contributing habitat that is in stark contrast to the otherwise soft bottom environment of the bay. In addition to enhancing recruitment, the structural complexity the shell provides refuges from predation for the young oyster spat as well as other species. Therefore, rebuilding and maintaining oyster populations entails more than simply putting oysters in the water; it requires concomitantly rebuilding habitat as well (Mann and Powell 2007). Options include planting more shells, excavating buried shell in the region, and planting an alternate substrate suitable for harvest areas. Creative solutions may be required to effectively improve the availability of cultch. In the near term, there is cause for optimism for the Tangier Sound fishery. Following the strong spatsets of 2010 and 2012 there was an uptick in harvests which lasted four years before winding down in the 2016-17 season. During this period landings averaged 88,000 bu/year; since then they have averaged about 36,000 bu/year. Meanwhile, a sizable proportion of the 2015/16 year classes have transitioned to market-size oysters, which could mean an increase in harvests in the upcoming season. The 2019 spatset, which was comparable in magnitude to that of 2012, should provide a further boost to the landings, supplemented by the 2018 set. This is contingent on whether nothing untoward happens during that time frame, such as a disease epizootic. However, disease levels and consequent mortalities have generally remained below average for the past 15 years. If this trend continues Tangier Sound could see respectable harvest levels in upcoming seasons. Given the poor recruitment in the Choptank region this past year, there may be a falling off of landings there, leaving Tangier Sound all the more important to sustaining the oyster fishery in Maryland over the next few years.

30
LITERATURE CITED Beaven, G.F. 1947. Effect of the Susquehanna River flow on Chesapeake Bay salinities and history of past oyster mortalities on upper Bay bars. Proc. Natl. Shellfish. Assoc. 1946: 38-41. Bue, C.D. 1968. Monthly surface-water inflow to Chesapeake Bay: U.S. Geological Survey Open-File Report, Arlington, Va., October 1968, 45 pp. Calabrese, A. and H.C. Davis. 1970. Tolerances and requirements of embryos and larvae of bivalve mollusks. Helgolander Wiss. Meersunters. 20: 553-564. Calvo G.W. R.J. Fagan, K.N. Greenhawk, G.F. Smith GF, and S.J. Jordan. 1996. Spatial distribution and intensity of Perkinsus marinus infections in oyster recovery areas in Maryland. J. Shellfish Res. 15: 381-389. Chesapeake Bay Program Data Hub. CBP Water Quality Database (1984-present). www.chesapeakebay.net/data Chesapeake Research Consortium, Inc. 1976. The Effects of Tropical Storm Agnes on the Chesapeake Bay Estuarine System. CRC Publ. No. 54. The Johns Hopkins Univ. Press, Baltimore, Md. 639 pp. Engle, J.B. 1947. Commercial aspects of the upper Chesapeake Bay oyster bars in the light of recent oyster mortalities. Proc. Natl. Shell. Assoc. (1946): 42-46. Ford, S.E. 1985. Effects of salinity on survival of the MSX parasite Haplosporidium nelsoni (Haskin, Stauber, and Mackin) in oysters. J. Shellfish Res. 5: 85-90. Ford, S.E. and M.R. Tripp. 1996. Chapter 17. Diseases and defense mechanisms. In:
V.S. Kennedy, R.I.E. Newell, and A.F. Eble (eds.). The Eastern Oyster, Crassostrea virginica, p. 581-660. Md. Sea Grant Publ. UM-SG-TS-96-01. College Park, Md. Gieseker, C.M. 2001. Year 2000 Maryland Oyster Disease Status Report. DNR, Cooperative Oxford Lab. FS-SCOL-01-1. Oxford, Md. 27 pp. dnr.maryland.gov/fisheries/Documents/2000_oyster_disease.pdf Hollander, M. and D.A. Wolfe. 1973. Nonparametric Statistical Methods. John Wiley and Sons, New York, N.Y. Homer, M. and R. Scott. 2001. Maryland Oyster Population Status Report. 1996-2000 Fall Surveys. Md. Dept. of Natural Resources, Annapolis, Md. Jordan, S.J., K.N. Greenhawk, C.B. McCollough, J. Vanisko, and M.L. Homer. 2002. Oyster biomass, abundance, and harvest in northern Chesapeake Bay: Trends and forecasts. J. Shellfish Res. 21: 733-741. Kennedy, V.S. 1996. Ch. 10. Biology of larvae and spat. In: V.S. Kennedy, R.I.E. Newell, and A.F. Eble (eds.). The Eastern Oyster, Crassostrea virginica, p. 371-421. Md. Sea Grant Publ. UM-SG-TS-96-01. College Park, Md. Krantz, G.E. and D.W. Webster. 1980. Maryland Oyster Spat Survey – Fall 1979. Md. Sea Grant Prog. Tech. Rept. No. UM-SG-TS-80-01. College Park, Md. Loosanoff, V.L. 1953. Behavior of oysters in water of low salinities. Proc. Natl. Shellfish. Assoc. 43: 135-151. Mann, R., and E.N. Powell. 2007. Why oyster restoration goals in the Chesapeake Bay are not and probably cannot be achieved. J. Shellfish Res. 26(4): 905-917.

31
Maryland DNR. 2018. Ray’s fluid thioglycollate medium (RFTM) assays for dermo disease in oysters and Perkinsus sp. infections in other molluscs: Maryland DNR methods used at the Cooperative Oxford Laboratory. 7 pp. dnr.maryland.gov/fisheries/documents/RFTM_assays_for_dermo_disease.pdf Seliger, H.H., J.A. Boggs, R.B. Rivkin, W.H. Biggley, and K.R.H. Aspden. 1982. The transport of oyster larvae in an estuary. Mar. Biol. 71: 57-72. Tarnowski, M. 2005. Maryland Oyster Population Status Report – 2003 and 2004 Fall Surveys. DNR Publ. No. 17-1072005-62. Annapolis, Md. 33 pp. Tarnowski, M. 2010. Maryland Oyster Population Status Report – 2009 Fall Survey. DNR Publ. No. 17-8172010-471. Annapolis, Md. 43 pp. dnr.maryland.gov/fisheries/Pages/shellfish-monitoring/reports.aspx Tarnowski, M. 2011. Maryland Oyster Population Status Report – 2010 Fall Survey. DNR Publ. No. 17-7292011-517. Annapolis, Md. 47 pp. dnr.maryland.gov/fisheries/Pages/shellfish-monitoring/reports.aspx
Tarnowski, M. 2012. Maryland Oyster Population Status Report – 2011 Fall Survey. DNR Publ. No. 17-8152012-598. Annapolis, Md. 51 pp. dnr.maryland.gov/fisheries/Pages/shellfish-monitoring/reports.aspx Tarnowski, M. 2018. Maryland Oyster Population Status Report – 2017 Fall Survey. DNR Publ. No. 17-080218-87. Annapolis, Md. 51 pp. dnr.maryland.gov/fisheries/Pages/shellfish-monitoring/reports.aspx Tarnowski, M. 2019. Maryland Oyster Population Status Report - 2018 Fall Survey. DNR Publ. No. 17-070819-154. Annapolis, Md. 69 pp. dnr.maryland.gov/fisheries/Pages/shellfish-monitoring/reports.aspx Thompson, R.J., R.I.E. Newell, V.S. Kennedy, and R. Mann. 1996. Reproductive processes and early development, pp 335-370 in: The Eastern Oyster- Crassostrea virginica, V.S. Kennedy, R.I.E. Newell, and A.F. Eble. Maryland Sea Grant College Program, College Park. USGS. 2015. Estimated streamflow entering Chesapeake Bay above selected cross sections. United States Geological Survey Inflow Database. md.water.usgs.gov/waterdata/chesinflow/

32
TABLES Table 1. Listing of data recorded during the Annual Fall Dredge Survey.
Physical Parameters
-Latitude and longitude (deg., min., decmin.)
-Depth (ft.)
-Temperature (°C; surface at all stations, 1 ft. above bottom at Key & Disease Bars)
-Salinity (ppt; surface at all stations, 1 ft. above bottom at Key & Disease Bars)
-Tow distance (ft.) (2005-present)
Biological Parameters
-Total volume of material in dredge (Md. bu.) (2005-present)
-Counts of live and dead oysters by age/size classes (spat, smalls, markets) per Md. bushel of material
-Stage of oyster boxes (recent, old)
-Observed (estimated) average and range of shell heights of live and dead oysters by age/size classes (mm)
-Shell heights of oysters grouped into 5-mm intervals (Disease Bars, 1990-2009) or 1-mm intervals (Disease Bars and other locations totaling about 30% of all surveyed bars, 2010-present)
-Oyster condition index and meat quality
-Type and relative index of fouling and other associated organisms
-Type of sample and year of activity (e.g. 1997 seed planting, natural oyster bar, 1990 fresh shell planting, etc.)
The time series for the Spat Intensity, Diseases, and Mortality Indices are presented in Tables 2 - 5. The majority of Fall Survey data, including supplemental disease results, are contained in digital files. Fouling and oyster condition data are in paper files.
(Return to Text)

33
Table 2. Spatfall intensity (spat per bushel of cultch) from the 53 “Key” spat monitoring bars, 1985-2019. (S) = bar within an oyster sanctuary since 2010.
Region Oyster Bar Spatfall Intensity (Number per Bushel)
1985 1986 1987 1988 1989 1990
Upper Bay Mountain Point 6 0 0 0 0 0 Swan Point 4 0 2 2 0 0
Middle Bay
Brick House 78 0 4 8 0 3 Hackett Point 0 4 0 0 0 0 Tolly Point 2 2 2 0 0 0 Three Sisters 10 2 8 0 0 0 Holland Point (S) 6 5 0 0 0 0 Stone Rock 136 20 0 50 22 37 Flag Pond (S) 52 144 128 0 0 4
Lower Bay Hog Island 116 32 58 29 4 7 Butler nd 197 142 16 2 24
Chester River Buoy Rock 16 0 6 0 0 1
Eastern Bay Parsons Island 78 4 4 2 0 7 Wild Ground 46 8 4 8 0 18 Hollicutt Noose 24 8 12 6 0 2
Wye River Bruffs Island (S) 82 0 0 2 0 2
Miles River Ash Craft 10 2 0 10 0 2 Turtle Back 382 40 12 52 6 11
Poplar I. Narrows Shell Hill 50 6 0 6 0 48
Choptank River Sandy Hill (S) 74 16 2 0 0 28 Royston 440 8 8 0 0 57 Cook Point (S) 66 82 4 28 0 17
Harris Creek Eagle Pt./Mill Pt. (S) 258 92 2 6 6 18 Tilghman Wharf 156 28 38 4 4 109
Broad Creek Deep Neck 566 114 6 22 4 48 Tred Avon River Double Mills (S) 332 24 2 0 0 1
Little Choptank R. Ragged Point 134 82 34 112 0 65 Cason (S) 102 24 46 50 0 143
Honga River Windmill 34 112 28 22 16 155 Norman Addition 56 214 38 17 34 82
Fishing Bay Goose Creek 34 97 16 18 4 4 Clay Island 4 78 14 48 18 19
Nanticoke River Wetipquin (S) 34 10 0 0 0 3 Middleground 8 12 26 9 16 40 Evans 18 10 12 17 2 13
Wicomico River Mt. Vernon Wharf nd 0 0 0 0 0
Manokin River Georges (S) 26 98 14 4 16 4 Drum Point (S) 48 186 48 90 78 16
Tangier Sound
Sharkfin Shoal 18 44 22 24 2 16 Turtle Egg Island 154 90 12 26 26 204 Piney Island East 182 192 194 160 82 64 Great Rock 2 6 4 6 10 66
Pocomoke Sound Gunby 124 24 50 4 8 21 Marumsco 26 50 18 5 12 6
Patuxent River Broome Island 15 0 0 0 0 3 Back of Island 42 0 8 4 4 15
St. Mary’s River Chicken Cock 620 298 96 62 18 29 Pagan (S) 140 34 52 36 6 613
Breton Bay Black Walnut (S) 16 12 0 0 0 1 Blue Sow (S) 55 40 0 0 0 1
St. Clement Bay Dukehart Channel 20 7 0 0 0 1
Potomac River Ragged Point 69 35 4 0 0 2 Cornfield Harbor 383 908 362 28 14 36
Spat Index 103.8 66.1 29.1 18.7 7.8 39.0
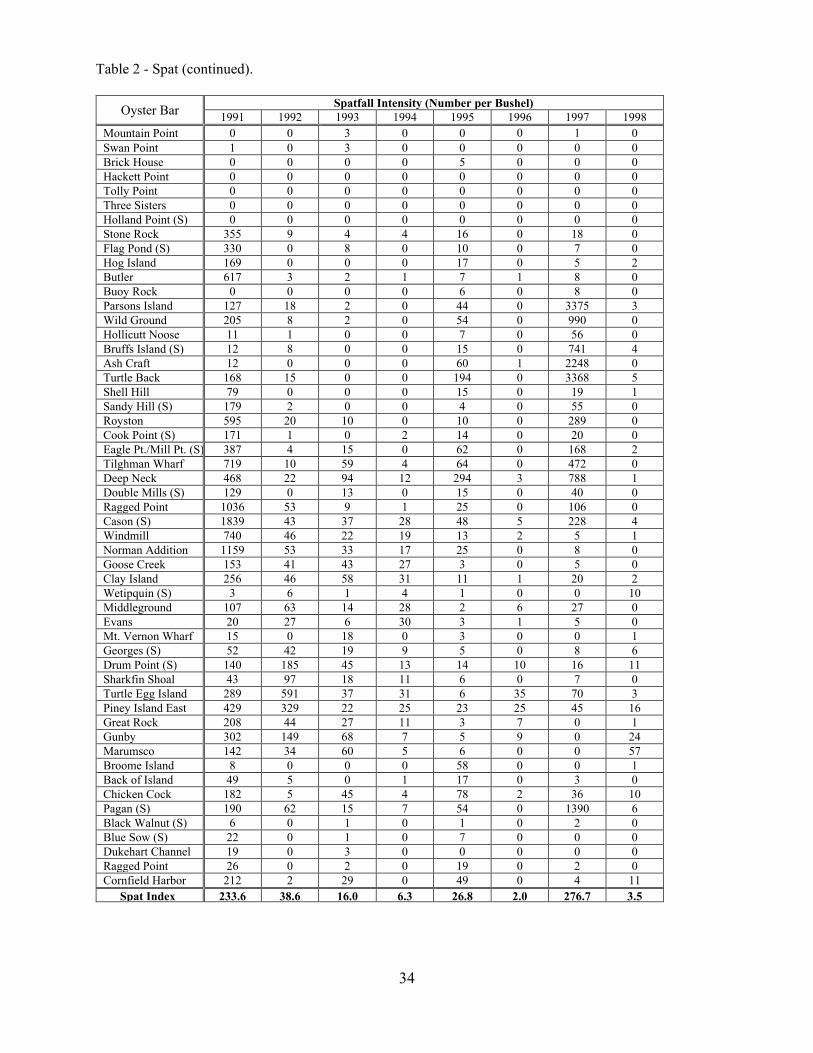
34
Table 2 - Spat (continued).
Oyster Bar Spatfall Intensity (Number per Bushel) 1991 1992 1993 1994 1995 1996 1997 1998
Mountain Point 0 0 3 0 0 0 1 0 Swan Point 1 0 3 0 0 0 0 0 Brick House 0 0 0 0 5 0 0 0 Hackett Point 0 0 0 0 0 0 0 0 Tolly Point 0 0 0 0 0 0 0 0 Three Sisters 0 0 0 0 0 0 0 0 Holland Point (S) 0 0 0 0 0 0 0 0 Stone Rock 355 9 4 4 16 0 18 0 Flag Pond (S) 330 0 8 0 10 0 7 0 Hog Island 169 0 0 0 17 0 5 2 Butler 617 3 2 1 7 1 8 0 Buoy Rock 0 0 0 0 6 0 8 0 Parsons Island 127 18 2 0 44 0 3375 3 Wild Ground 205 8 2 0 54 0 990 0 Hollicutt Noose 11 1 0 0 7 0 56 0 Bruffs Island (S) 12 8 0 0 15 0 741 4 Ash Craft 12 0 0 0 60 1 2248 0 Turtle Back 168 15 0 0 194 0 3368 5 Shell Hill 79 0 0 0 15 0 19 1 Sandy Hill (S) 179 2 0 0 4 0 55 0 Royston 595 20 10 0 10 0 289 0 Cook Point (S) 171 1 0 2 14 0 20 0 Eagle Pt./Mill Pt. (S) 387 4 15 0 62 0 168 2 Tilghman Wharf 719 10 59 4 64 0 472 0 Deep Neck 468 22 94 12 294 3 788 1 Double Mills (S) 129 0 13 0 15 0 40 0 Ragged Point 1036 53 9 1 25 0 106 0 Cason (S) 1839 43 37 28 48 5 228 4 Windmill 740 46 22 19 13 2 5 1 Norman Addition 1159 53 33 17 25 0 8 0 Goose Creek 153 41 43 27 3 0 5 0 Clay Island 256 46 58 31 11 1 20 2 Wetipquin (S) 3 6 1 4 1 0 0 10 Middleground 107 63 14 28 2 6 27 0 Evans 20 27 6 30 3 1 5 0 Mt. Vernon Wharf 15 0 18 0 3 0 0 1 Georges (S) 52 42 19 9 5 0 8 6 Drum Point (S) 140 185 45 13 14 10 16 11 Sharkfin Shoal 43 97 18 11 6 0 7 0 Turtle Egg Island 289 591 37 31 6 35 70 3 Piney Island East 429 329 22 25 23 25 45 16 Great Rock 208 44 27 11 3 7 0 1 Gunby 302 149 68 7 5 9 0 24 Marumsco 142 34 60 5 6 0 0 57 Broome Island 8 0 0 0 58 0 0 1 Back of Island 49 5 0 1 17 0 3 0 Chicken Cock 182 5 45 4 78 2 36 10 Pagan (S) 190 62 15 7 54 0 1390 6 Black Walnut (S) 6 0 1 0 1 0 2 0 Blue Sow (S) 22 0 1 0 7 0 0 0 Dukehart Channel 19 0 3 0 0 0 0 0 Ragged Point 26 0 2 0 19 0 2 0 Cornfield Harbor 212 2 29 0 49 0 4 11
Spat Index 233.6 38.6 16.0 6.3 26.8 2.0 276.7 3.5

35
Table 2 - Spat (continued).
Oyster Bar Spatfall Intensity (Number per Bushel) 1999 2000 2001 2002 2003 2004 2005 2006
Mountain Point 0 0 0 1 0 0 0 0 Swan Point 0 0 0 0 0 0 0 0 Brick House 1 1 3 97 0 0 0 0 Hackett Point 0 1 0 13 0 0 0 0 Tolly Point 2 2 1 10 0 0 0 0 Three Sisters 0 0 1 0 0 0 0 0 Holland Point (S) 0 0 1 4 0 0 0 0 Stone Rock 3 34 2 17 1 0 0 3 Flag Pond (S) 1 5 5 7 0 0 0 4 Hog Island 6 1 28 10 5 1 6 1 Butler 6 1 27 33 3 0 3 7 Buoy Rock 0 0 2 1 1 1 0 0 Parsons Island 6 6 6 5 2 0 3 0 Wild Ground 2 5 5 6 4 0 1 0 Hollicutt Noose 6 2 1 15 3 0 0 0 Bruffs Island (S) 5 9 6 0 4 0 0 0 Ash Craft 14 2 10 0 8 0 0 0 Turtle Back 13 4 45 9 72 1 5 0 Shell Hill 4 4 0 0 0 0 0 0 Sandy Hill (S) 4 0 1 1 0 2 0 5 Royston 39 0 3 10 0 14 0 44 Cook Point (S) 1 5 5 3 1 4 0 9 Eagle Pt./Mill Pt. (S) 16 0 5 4 1 12 0 19 Tilghman Wharf 49 1 1 4 0 15 0 22 Deep Neck 211 3 11 31 1 167 0 30 Double Mills (S) 1 0 0 0 0 3 0 3 Ragged Point 43 3 5 0 1 2 0 6 Cason (S) 53 5 2 9 1 5 1 93 Windmill 37 0 21 9 0 0 0 21 Norman Addition 31 1 30 33 2 0 6 80 Goose Creek 0 0 0 1 0 0 0 73 Clay Island 5 4 8 16 0 0 0 139 Wetipquin (S) 0 0 0 3 1 0 0 6 Middleground 9 1 0 14 0 0 1 54 Evans 1 0 0 12 0 1 0 13 Mt. Vernon Wharf 0 0 0 0 0 0 0 0 Georges (S) 50 6 1 280 15 4 5 75 Drum Point (S) 157 27 44 124 13 8 40 202 Sharkfin Shoal 9 5 0 57 0 2 4 63 Turtle Egg Island 180 33 33 207 25 7 90 181 Piney Island East 118 28 167 127 1 27 116 420 Great Rock 82 6 140 1 3 19 28 92 Gunby 54 32 6 108 0 29 24 36 Marumsco 27 27 4 89 0 14 11 22 Broome Island 7 0 1 15 1 0 3 4 Back of Island 22 9 44 27 11 0 0 1 Chicken Cock 132 16 12 151 56 2 2 6 Pagan (S) 95 42 117 535 9 6 10 125 Black Walnut (S) 3 0 1 2 0 0 0 0 Blue Sow (S) 11 0 2 4 1 0 0 0 Dukehart Channel 1 0 0 1 0 0 0 1 Ragged Point 1 1 0 1 0 0 0 1 Cornfield Harbor 25 5 35 31 9 0 8 6
Spat Index 29.1 6.4 15.9 40.3 4.8 6.5 6.9 35.2

36
Table 2 - Spat (continued).
Oyster Bar Spatfall Intensity (Number per Bushel) 2007 2008 2009 2010 2011 2012 2013 2014
Mountain Point 0 0 0 0 0 0 0 0 Swan Point 0 0 0 0 0 1 0 0 Brick House 0 0 6 4 1 7 0 0 Hackett Point 0 0 0 5 0 0 0 1 Tolly Point 0 0 0 2 0 1 0 0 Three Sisters 0 0 0 3 0 0 0 0 Holland Point (S) 0 0 0 1 0 0 0 0 Stone Rock 0 1 4 22 1 46 2 1 Flag Pond (S) 0 0 0 15 4 8 2 6 Hog Island 1 1 4 4 8 42 11 3 Butler 1 8 1 15 3 7 0 14 Buoy Rock 0 0 0 3 0 1 0 0 Parsons Island 0 0 8 2 0 13 0 1 Wild Ground 0 1 1 3 0 7 0 2 Hollicutt Noose 0 0 0 5 0 8 0 0 Bruffs Island (S) 0 0 0 3 0 18 0 0 Ash Craft 0 0 2 39 0 1 3 0 Turtle Back 0 0 13 13 0 16 1 1 Shell Hill 0 0 0 1 0 4 0 0 Sandy Hill (S) 3 1 5 5 0 6 1 1 Royston 2 5 20 27 0 46 9 19 Cook Point (S) 1 10 18 37 2 41 6 1 Eagle Pt./Mill Pt. (S) 0 2 17 44 0 29 4 1 Tilghman Wharf 0 6 15 72 0 183 20 46 Deep Neck 1 23 100 144 1 331 14 9 Double Mills (S) 1 3 11 4 0 5 2 1 Ragged Point 0 2 12 33 0 14 5 2 Cason (S) 0 13 9 50 0 65 14 4 Windmill 4 79 7 85 12 88 114 19 Norman Addition 0 102 6 155 27 138 145 38 Goose Creek 0 35 20 75 83 98 128 8 Clay Island 1 94 29 342 26 103 56 6 Wetipquin (S) 0 2 2 8 4 8 5 22 Middleground 0 21 6 92 23 78 59 7 Evans 0 14 9 27 10 98 3 1 Mt. Vernon Wharf 0 0 8 2 4 16 0 9 Georges (S) 5 28 22 753 243 133 117 35 Drum Point (S) 56 124 34 524 248 219 92 58 Sharkfin Shoal 1 16 14 169 23 65 46 24 Turtle Egg Island 7 32 17 202 23 153 47 24 Piney Island East 44 23 0 160 109 199 6 14 Great Rock 64 38 5 12 5 111 0 2 Gunby 4 5 24 317 25 251 20 43 Marumsco 14 12 24 261 44 81 43 19 Broome Island 0 3 5 52 2 8 4 2 Back of Island 2 7 8 47 7 70 6 3 Chicken Cock 9 1 16 37 11 27 15 38 Pagan (S) 616 0 321 227 110 325 196 64 Black Walnut (S) 0 0 0 1 0 0 0 0 Blue Sow (S) 0 0 3 0 0 0 0 0 Dukehart Channel 0 0 1 0 0 1 0 0 Ragged Point 2 1 2 0 1 0 0 2 Cornfield Harbor 7 1 1 28 3 7 7 46
Spat Index 15.9 13.5 15.7 78.0 20.1 59.9 22.7 11.3
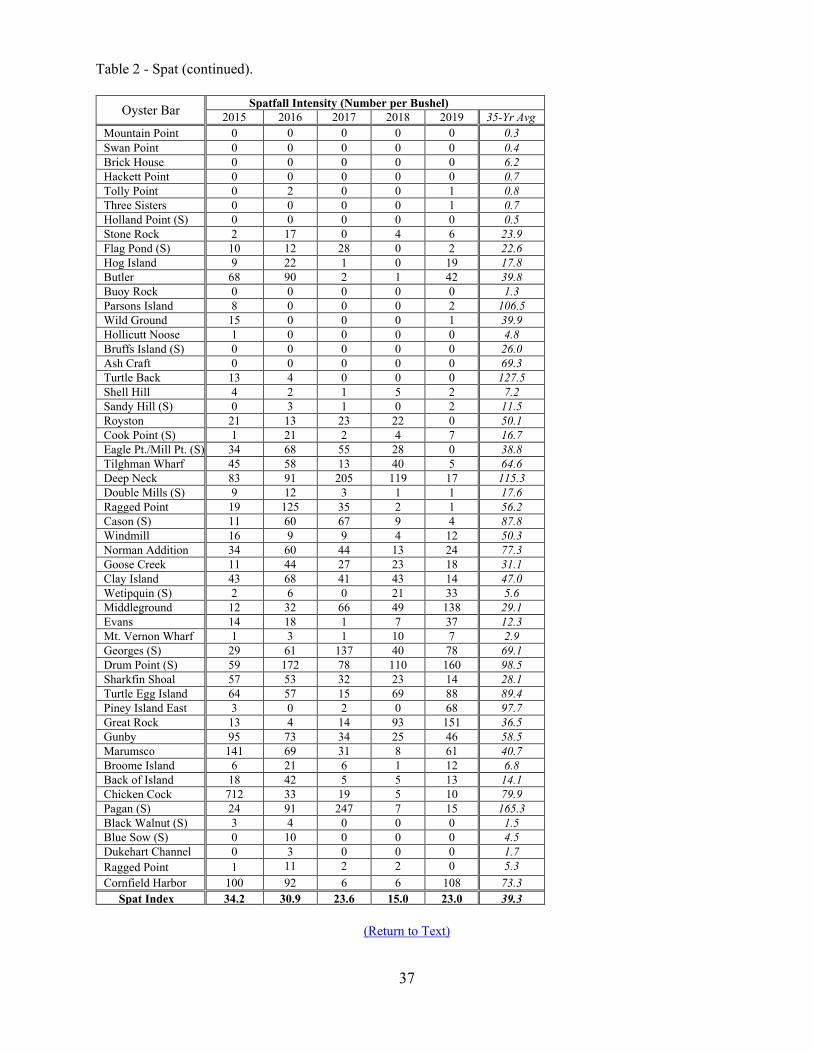
37
Table 2 - Spat (continued).
Oyster Bar Spatfall Intensity (Number per Bushel) 2015 2016 2017 2018 2019 35-Yr Avg
Mountain Point 0 0 0 0 0 0.3 Swan Point 0 0 0 0 0 0.4 Brick House 0 0 0 0 0 6.2 Hackett Point 0 0 0 0 0 0.7 Tolly Point 0 2 0 0 1 0.8 Three Sisters 0 0 0 0 1 0.7 Holland Point (S) 0 0 0 0 0 0.5 Stone Rock 2 17 0 4 6 23.9 Flag Pond (S) 10 12 28 0 2 22.6 Hog Island 9 22 1 0 19 17.8 Butler 68 90 2 1 42 39.8 Buoy Rock 0 0 0 0 0 1.3 Parsons Island 8 0 0 0 2 106.5 Wild Ground 15 0 0 0 1 39.9 Hollicutt Noose 1 0 0 0 0 4.8 Bruffs Island (S) 0 0 0 0 0 26.0 Ash Craft 0 0 0 0 0 69.3 Turtle Back 13 4 0 0 0 127.5 Shell Hill 4 2 1 5 2 7.2 Sandy Hill (S) 0 3 1 0 2 11.5 Royston 21 13 23 22 0 50.1 Cook Point (S) 1 21 2 4 7 16.7 Eagle Pt./Mill Pt. (S) 34 68 55 28 0 38.8 Tilghman Wharf 45 58 13 40 5 64.6 Deep Neck 83 91 205 119 17 115.3 Double Mills (S) 9 12 3 1 1 17.6 Ragged Point 19 125 35 2 1 56.2 Cason (S) 11 60 67 9 4 87.8 Windmill 16 9 9 4 12 50.3 Norman Addition 34 60 44 13 24 77.3 Goose Creek 11 44 27 23 18 31.1 Clay Island 43 68 41 43 14 47.0 Wetipquin (S) 2 6 0 21 33 5.6 Middleground 12 32 66 49 138 29.1 Evans 14 18 1 7 37 12.3 Mt. Vernon Wharf 1 3 1 10 7 2.9 Georges (S) 29 61 137 40 78 69.1 Drum Point (S) 59 172 78 110 160 98.5 Sharkfin Shoal 57 53 32 23 14 28.1 Turtle Egg Island 64 57 15 69 88 89.4 Piney Island East 3 0 2 0 68 97.7 Great Rock 13 4 14 93 151 36.5 Gunby 95 73 34 25 46 58.5 Marumsco 141 69 31 8 61 40.7 Broome Island 6 21 6 1 12 6.8 Back of Island 18 42 5 5 13 14.1 Chicken Cock 712 33 19 5 10 79.9 Pagan (S) 24 91 247 7 15 165.3 Black Walnut (S) 3 4 0 0 0 1.5 Blue Sow (S) 0 10 0 0 0 4.5 Dukehart Channel 0 3 0 0 0 1.7 Ragged Point 1 11 2 2 0 5.3 Cornfield Harbor 100 92 6 6 108 73.3 Spat Index 34.2 30.9 23.6 15.0 23.0 39.3
(Return to Text)

38
Table 3. Perkinsus marinus prevalence and mean intensity (scale of 0-7) in oysters from the 43 disease monitoring bars, 1990-2019. NA = insufficient quantity of oysters for analytical sample. (S) = bar within an oyster sanctuary since 2010.
Region Oyster Bar Perkinsus marinus Prevalence (%) and Mean Intensity (I)
1990 1991 1992 1993 1994 % I % I % I % I % I
Upper Bay Swan Point 7 0.1 27 0.7 23 0.4 37 0.8 3 0.1
Middle Bay
Hackett Point 0 0.0 27 0.8 57 1.2 97 3.2 23 0.5 Holland Point (S) 20 0.5 47 1.1 80 2.4 93 3.0 36 1.1 Stone Rock 47 0.5 27 0.9 100 4.4 100 3.5 90 2.5 Flag Pond (S) 30 0.8 97 2.6 97 5.7 88 2.7 30 0.8
Lower Bay Hog Island 90 3.0 97 4.5 100 4.2 93 2.4 37 1.0 Butler 100 4.0 100 4.0 81 2.4 97 3.3 80 2.1
Chester River Buoy Rock 23 0.5 80 2.5 97 2.8 93 3.3 10 0.3 Old Field (S) 17 0.2 20 0.5 37 0.9 83 2.4 20 0.6
Eastern Bay Bugby 100 3.4 100 4.0 73 1.8 100 3.0 43 0.8 Parsons Island 20 0.5 97 3.6 80 2.1 100 3.3 93 3.1 Hollicutt Noose 30 0.3 73 2.0 82 2.1 97 2.7 70 1.7
Wye River Bruffs Island (S) 83 2.8 83 2.8 93 3.0 83 2.6 63 1.3
Miles River Turtle Back 100 3.8 100 3.3 77 1.6 100 3.3 60 1.2 Long Point (S) 73 2.3 94 4.3 86 3.0 77 2.6 60 2.0
Choptank River
Cook Point (S) 17 0.2 23 0.3 87 3.7 97 4.2 90 3.0 Royston NA NA 100 4.5 97 4.8 100 3.3 80 2.0 Lighthouse 90 2.3 100 4.0 100 4.6 93 3.2 47 1.2 Sandy Hill (S) 100 5.0 100 5.7 100 4.2 100 3.8 83 2.3 Oyster Shell Pt. (S) 3 0.1 60 1.7 100 3.9 93 2.8 10 0.3
Harris Creek Tilghman Wharf 100 3.2 97 3.0 100 3.4 100 3.2 63 1.9 Broad Creek Deep Neck 100 4.9 100 5.6 100 3.7 100 3.8 67 2.3 Tred Avon River Double Mills (S) 97 3.6 100 4.9 100 4.1 100 3.8 90 2.0
Little Choptank R. Cason (S) 100 3.4 100 4.4 90 2.6 93 2.8 83 2.2 Ragged Point 100 4.8 100 4.6 100 5.0 100 3.9 87 2.3
Honga River Norman Addition 100 4.2 100 3.4 83 2.0 96 3.6 93 3.3 Fishing Bay Goose Creek 60 1.8 100 3.1 100 3.6 87 2.1 53 1.1 Nanticoke River Wilson Shoals (S) 93 2.9 100 2.8 90 2.5 83 1.6 40 0.9 Manokin River Georges (S) 83 1.9 93 2.9 58 1.4 30 0.7 50 1.2 Holland Straits Holland Straits 100 4.2 100 4.0 100 3.4 76 2.3 57 1.6
Tangier Sound
Sharkfin Shoal 23 0.3 60 1.2 97 2.8 93 2.2 63 1.4 Back Cove 100 2.7 100 4.2 97 3.3 36 1.0 80 2.2 Piney Island East 93 2.7 97 3.1 87 2.7 83 2.2 87 3.1 Old Woman’s Leg 57 1.1 100 4.5 100 4.0 82 2.0 73 2.1
Pocomoke Sound Marumsco 97 3.5 93 3.3 60 1.3 87 2.5 72 1.6 Patuxent River Broome Island 97 3.4 100 2.8 63 1.5 87 3.0 40 0.6
St. Mary’s River Chicken Cock 100 4.2 97 3.1 93 3.2 96 2.6 40 1.0 Pagan (S) 93 3.3 97 2.3 100 3.0 93 2.1 10 0.3
Wicomico R. (west) Lancaster 97 3.6 97 2.8 67 1.4 67 1.6 20 0.2 Mills West 13 0.2 80 2.0 90 2.9 63 1.8 20 0.2
Potomac River Cornfield Harbor 97 3.4 83 2.3 100 3.8 93 2.9 77 1.9 Ragged Point 97 3.8 90 2.8 40 0.9 50 1.4 10 0.2 Lower Cedar Point 40 0.7 10 0.3 23 0.6 7 0.1 7 0.1
Annual Means 69 2.3 82 3.0 83 2.8 84 2.6 54 1.4 Frequency of Positive Bars (%) 98 100 100 100 100

39
Table 3 - Dermo (continued).
Oyster Bar Perkinsus marinus Prevalence (%) and Mean Intensity (I)
1995 1996 1997 1998 1999 2000 % I % I % I % I % I % I
Swan Point 20 0.2 0 0.0 3 0.1 43 1.2 97 3.4 80 1.2 Hackett Point 90 2.5 30 0.7 43 1.3 43 1.1 97 3.3 97 3.7 Holland Point (S) 87 2.9 47 1.4 37 1.1 37 0.9 93 2.8 87 3.4 Stone Rock 87 2.2 93 2.7 90 2.3 100 3.5 100 4.0 93 3.6 Flag Pond (S) 87 3.3 63 2.0 53 1.2 73 2.3 NA NA NA NA Hog Island 93 2.7 43 1.2 47 1.3 97 3.2 93 5.5 83 3.9 Butler 87 2.5 60 1.6 57 1.0 97 3.3 93 3.2 83 2.7 Buoy Rock 67 1.7 13 0.4 7 0.7 33 0.9 93 3.0 97 3.5 Old Field (S) 83 2.3 0 0.0 10 0.2 33 0.8 97 3.0 93 3.0 Bugby 83 2.6 80 2.0 70 1.8 60 1.4 100 3.9 100 4.0 Parsons Island 70 2.1 73 2.8 63 1.4 80 2.5 100 4.7 100 3.5 Hollicutt Noose 90 2.8 60 1.4 50 1.0 83 2.5 90 3.0 100 4.1 Bruffs Island (S) 73 2.1 67 1.4 17 0.2 57 1.6 100 3.7 97 3.2 Turtle Back 100 2.8 83 2.1 83 1.8 50 1.6 100 4.3 97 3.1 Long Point (S) 67 2.2 20 0.4 23 0.6 100 2.7 100 3.6 97 3.3 Cook Point (S) NA NA 60 1.5 70 2.4 87 2.8 93 3.4 40 1.2 Royston 63 2.0 50 1.1 67 1.5 90 2.5 97 3.5 97 4.7 Lighthouse 90 3.3 77 1.8 57 1.5 43 1.5 87 2.3 100 3.4 Sandy Hill (S) 89 3.4 30 0.7 60 1.3 40 1.0 97 3.4 87 3.6 Oyster Shell Pt. (S) 68 1.8 13 0.2 50 0.9 20 0.3 83 2.3 73 2.2 Tilghman Wharf 93 2.5 67 1.3 60 1.0 67 2.0 87 2.5 93 3.4 Deep Neck 97 3.0 83 2.1 100 2.6 97 2.9 97 4.5 100 4.0 Double Mills (S) 75 2.5 70 1.2 83 2.0 100 3.0 100 4.8 100 4.7 Cason (S) 93 2.3 87 1.9 93 2.4 50 1.4 97 3.8 100 3.6 Ragged Point 93 2.5 97 2.6 97 2.1 87 1.4 100 4.0 97 3.7 Norman Addition 87 2.8 93 2.4 73 1.6 73 2.3 93 3.5 80 3.4 Goose Creek 87 2.5 97 4.0 83 2.0 100 3.0 100 5.4 97 3.1 Wilson Shoals (S) 63 1.1 83 1.8 80 1.9 70 1.6 100 4.3 70 2.1 Georges (S) 87 2.8 93 2.0 93 2.2 83 2.4 93 3.5 80 2.3 Holland Straits 93 3.1 83 2.0 67 1.8 57 1.2 80 2.5 30 0.9 Sharkfin Shoal 90 3.0 97 2.1 93 2.6 80 2.7 100 4.3 80 2.3 Back Cove 83 3.0 97 3.2 93 2.9 90 2.3 100 5.5 40 1.2 Piney Island East 93 2.5 63 1.7 73 2.2 83 1.9 63 2.4 86 2.3 Old Woman’s Leg 100 4.2 80 2.3 57 1.3 90 3.2 87 3.9 70 1.7 Marumsco 100 4.2 90 2.4 61 2.1 80 2.8 90 3.4 93 2.7 Broome Island 43 1.0 17 0.4 83 2.1 83 3.0 100 4.6 93 4.0 Chicken Cock 83 1.9 77 1.4 73 1.7 80 1.7 100 5.0 63 1.8 Pagan (S) 93 2.2 82 1.4 86 1.7 73 1.7 97 3.4 68 1.6 Lancaster 27 0.6 56 1.2 80 1.6 37 0.7 83 2.5 90 2.7 Mills West 57 1.4 60 1.2 60 1.2 20 0.4 90 3.2 97 3.6 Cornfield Harbor 93 2.5 87 2.0 83 1.8 83 2.0 97 3.9 80 2.1 Ragged Point 33 0.8 7 0.2 0 0.0 0 0.0
17 0.5 13 0.7
Lower Cedar Point 13 0.2 3 0.3 0 0.0 0 0.0 0 0.0 17 0.5 Annual Means 78 2.3 61 1.5 62 1.5 67 1.9 90 3.5 81 2.9 Bar Freq. (%) 100 95 95 95 98 100

40
Table 3 - Dermo (continued).
Oyster Bar Perkinsus marinus Prevalence (%) and Mean Intensity (I)
2001 2002 2003 2004 2005 2006 % I % I % I % I % I % I
Swan Point 93 3.3 97 2.7 33 1.0 33 0.7 47 1.2 20 0.6 Hackett Point 97 3.4 100 3.3 33 1.1 30 0.8 13 0.4 70 1.3 Holland Point (S) 93 3.2 100 3.6 33 1.1 30 0.6 53 1.6 10 0.4 Stone Rock 83 2.8 100 2.3 77 2.4 10 0.2 50 1.3 77 1.9 Flag Pond (S) NA NA 37 0.5 0 0.0 3 0.03 13 0.3 43 0.9 Hog Island 93 3.4 87 2.9 53 2.3 53 1.4 93 3.4 93 4.4 Butler 80 2.4 80 1.4 10 0.3 7 0.1 30 1.1 40 1.2 Buoy Rock 93 3.5 100 2.6 97 3.7 50 1.5 77 2.4 63 1.8 Old Field (S) 100 3.3 97 2.5 80 2.5 33 0.7 57 1.1 63 1.4 Bugby 100 4.6 97 3.1 97 3.4 63 1.7 53 1.8 87 2.7 Parsons Island 100 4.5 100 4.4 90 3.3 93 2.8 87 2.6 87 2.1 Hollicutt Noose 100 4.8 100 3.6 80 2.7 40 1.5 40 1.0 83 2.9 Bruffs Island (S) 100 3.8 100 3.6 73 1.8 80 2.5 73 1.8 53 1.6 Turtle Back 100 4.2 100 4.7 100 3.6 80 2.8 100 3.3 97 3.8 Long Point (S) 100 4.2 100 3.1 97 2.8 97 3.2 90 2.7 80 2.1 Cook Point (S) 77 2.2 NA NA 66 2.1 0 0.0 13 0.3 40 0.5 Royston 100 5.2 100 4.2 48 1.8 13 0.3 3 0.2 47 0.9 Lighthouse 100 3.3 100 4.6 20 0.6 43 1.2 27 0.6 30 0.4 Sandy Hill (S) 100 4.5 100 5.0 93 3.5 87 3.3 80 2.5 70 2.3 Oyster Shell Pt. (S) 100 3.6 100 3.0 43 1.0 43 0.8 17 0.3 30 1.1 Tilghman Wharf 100 3.5 90 3.2 87 2.4 43 0.8 0 0.0 50 0.7 Deep Neck 97 4.8 100 3.2 97 3.7 27 0.5 20 0.4 50 1.1 Double Mills (S) 100 5.5 97 2.9 53 1.7 53 2.1 53 1.6 40 1.1 Cason (S) 100 4.3 94 4.4 17 0.4 3 0.03 33 0.5 23 0.4 Ragged Point 100 4.3 100 3.5 43 1.0 13 0.2 10 0.3 23 0.4 Norman Addition 90 3.0 67 1.9 37 1.3 93 3.3 90 3.8 57 2.0 Goose Creek 100 4.1 93 4.0 57 2.0 77 2.0 63 2.2 8 0.3 Wilson Shoals (S) 100 4.0 100 3.6 83 2.3 97 2.3 90 3.0 93 3.7 Georges (S) 100 5.2 100 4.0 83 2.6 100 4.2 90 3.3 97 3.8 Holland Straits 43 1.4 50 1.1 40 0.7 70 1.7 83 3.0 83 2.1 Sharkfin Shoal 90 3.7 97 3.6 47 3.4 100 4.4 87 3.2 83 3.4 Back Cove 100 5.0 97 3.8 100 4.6 97 3.7 100 3.1 77 2.5 Piney Island East 60 1.5 100 3.1 100 3.9 100 3.9 100 3.7 80 3.4 Old Woman’s Leg 100 5.0 100 3.7 100 4.4 93 3.7 80 2.4 57 1.8 Marumsco 100 5.0 97 4.1 90 2.3 87 2.8 93 3.3 67 2.8 Broome Island 100 4.8 97 3.8 47 1.3 47 1.4 37 0.9 77 2.5 Chicken Cock 93 3.6 100 2.9 23 0.7 40 0.9 87 3.5 90 3.4 Pagan (S) 100 4.6 93 4.0 60 1.3 83 2.3 83 2.9 80 3.1 Lancaster 100 4.5 97 2.7 50 1.5 37 0.9 57 1.5 73 2.2 Mills West 100 4.8 93 3.1 60 1.6 57 1.5 50 1.3 87 2.6 Cornfield Harbor 80 2.9 97 1.7 27 0.7 30 0.5 80 2.6 100 3.3 Ragged Point 33 0.5 93 2.6 24 0.7 9 0.1 37 0.9 0 0.0 Lower Cedar Point 90 2.3 97 2.5 13 0.5 17 0.4 13 0.2 10 0.1
Annual Means 93 3.8 94 3.2 60 2.0 53 1.6 57 1.8 60 1.9 Bar Freq. (%) 100 100 98 98 98 98

41
Table 3 - Dermo (continued).
Oyster Bar Perkinsus marinus Prevalence (%) and Mean Intensity (I)
2007 2008 2009 2010 2011 2012 % I % I % I % I % I % I
Swan Point 17 0.4 20 0.6 23 0.4 3 0.1 7 0.1 3 0.03 Hackett Point 87 2.9 80 2.7 73 1.9 63 1.3 33 1.0 33 0.8 Holland Point (S) 33 0.6 23 0.8 33 0.8 13 0.4 17 0.4 0 0.0 Stone Rock 93 3.5 47 1.3 30 0.9 53 1.2 17 0.4 57 2.0 Flag Pond (S) 87 2.0 67 2.3 57 2.1 33 1.2 38 0.9 53 1.5 Hog Island 80 3.1 50 2.0 67 2.7 70 2.0 40 1.0 77 2.2 Butler 77 1.7 43 1.2 43 1.3 77 2.7 60 1.9 90 3.4 Buoy Rock 80 3.2 70 2.2 64 1.5 65 2.2 20 0.5 10 0.3 Old Field (S) 100 4.0 90 3.3 87 3.3 70 2.2 40 0.8 67 2.2 Bugby 100 3.9 93 2.9 100 3.8 67 2.0 27 0.6 73 2.3 Parsons Island 97 4.0 87 3.1 100 2.5 60 1.8 10 0.4 23 0.7 Hollicutt Noose 87 3.0 93 3.3 43 1.4 53 1.4 20 0.9 13 0.3 Bruffs Island (S) 100 3.8 93 3.0 83 2.6 73 1.6 47 1.1 33 0.9 Turtle Back 100 4.4 100 4.1 97 2.9 73 1.8 23 0.6 50 0.9 Long Point (S) 93 3.8 87 3.1 46 1.6 50 1.3 31 0.7 46 1.5 Cook Point (S) 17 0.3 13 0.4 7 0.1 43 1.0 40 1.0 93 3.2 Royston 23 0.7 17 0.4 27 0.7 3 0.1 13 0.4 27 0.8 Lighthouse 0 0.0 0 0.0 10 0.1 10 0.1 0 0.0 13 0.2 Sandy Hill (S) 87 2.5 17 0.5 13 0.2 30 0.7 40 1.5 80 2.5 Oyster Shell Pt. (S) 27 0.7 0 0.0 0 0.0 0 0.0 3 0.1 0 0.0 Tilghman Wharf 23 0.5 3 0.1 10 0.2 3 0.1 0 0.0 0 0.0 Deep Neck 90 2.7 67 2.2 70 2.4 67 1.9 43 1.1 100 3.2 Double Mills (S) 87 2.9 67 2.2 80 2.1 63 1.5 53 1.7 83 3.4 Cason (S) 60 1.9 100 2.9 100 3.2 97 3.8 70 2.2 93 3.3 Ragged Point 93 2.7 37 1.0 80 2.5 83 2.3 60 1.7 93 3.1 Norman Addition 23 0.9 37 0.7 57 1.8 100 3.9 87 3.3 100 4.3 Goose Creek 0 0.0 20 0.2 0 0.0 10 0.2 10 0.3 50 1.3 Wilson Shoals (S) 93 2.7 80 2.3 87 2.9 80 1.9 62 2.0 97 4.1 Georges (S) 83 3.8 57 2.2 57 1.6 73 2.4 50 1.2 100 3.9 Holland Straits 80 3.0 50 2.0 47 1.5 70 2.2 37 1.4 83 3.0 Sharkfin Shoal 70 1.9 70 1.7 90 3.6 97 3.6 90 3.3 100 4.2 Back Cove 93 3.2 80 2.6 87 3.3 93 3.6 80 2.7 90 3.0 Piney Island East 67 2.5 90 3.3 90 3.4 97 4.1 70 2.7 80 2.5 Old Woman’s Leg 73 2.2 90 2.8 97 4.7 70 3.0 47 1.9 77 2.7 Marumsco 37 1.1 57 1.7 90 3.0 73 2.7 67 2.5 97 3.2 Broome Island 97 3.6 93 2.5 100 4.2 90 3.3 67 2.3 87 3.0 Chicken Cock 90 4.0 40 1.3 90 3.5 83 3.3 20 0.6 50 1.3 Pagan (S) 90 2.5 57 1.8 93 2.7 97 3.9 53 2.0 87 2.8 Lancaster 97 4.2 77 2.1 73 2.4 60 2.0 37 0.8 47 1.1 Mills West 47 1.6 57 1.9 50 1.3 27 0.9 27 0.5 80 2.5 Cornfield Harbor 97 3.5 73 2.6 87 3.7 83 2.5 40 1.3 83 3.0 Ragged Point 0 0.0 8 0.1 0 0.0 4 0.1 0 0.0 3 0.03 Lower Cedar Point 30 0.6 7 0.1 10 0.3 40 0.9 20 0.4 20 0.3
Annual Means 68 2.3 56 1.8 59 2.0 57 1.8 38 1.2 59 2.0 Bar Freq. (%) 93 95 93 98 93 93
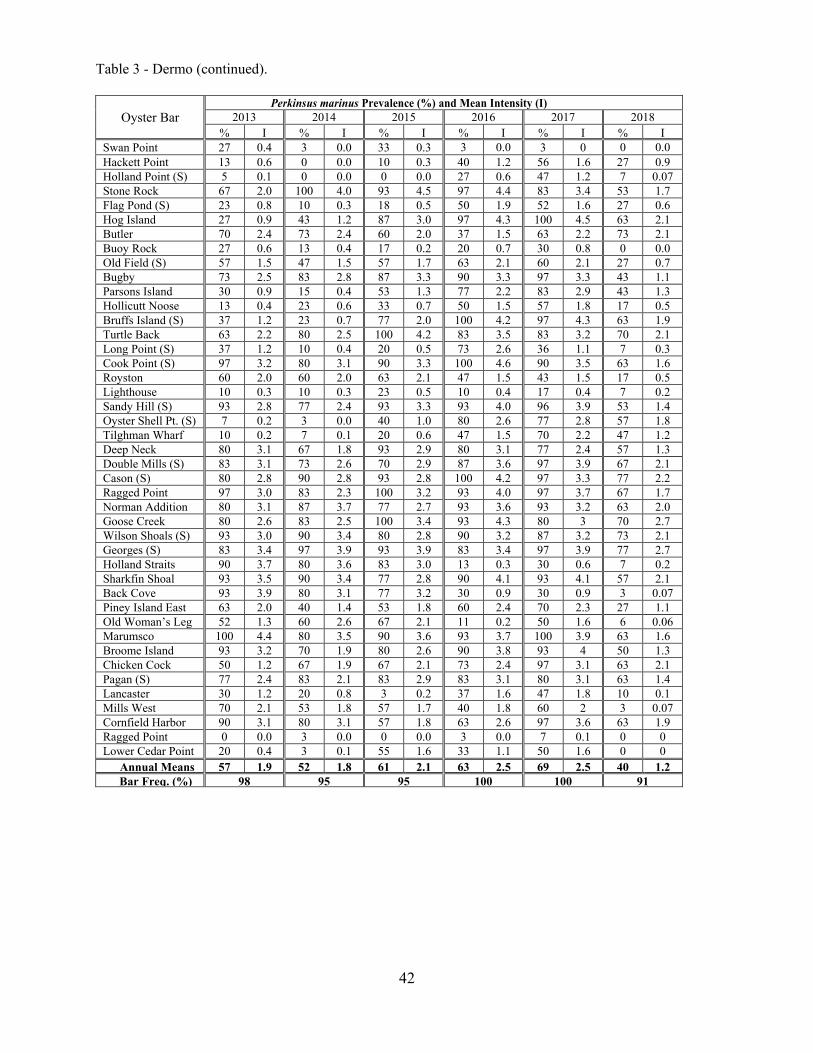
42
Table 3 - Dermo (continued).
Oyster Bar Perkinsus marinus Prevalence (%) and Mean Intensity (I)
2013 2014 2015 2016 2017 2018 % I % I % I % I % I % I
Swan Point 27 0.4 3 0.0 33 0.3 3 0.0 3 0 0 0.0 Hackett Point 13 0.6 0 0.0 10 0.3 40 1.2 56 1.6 27 0.9 Holland Point (S) 5 0.1 0 0.0 0 0.0 27 0.6 47 1.2 7 0.07 Stone Rock 67 2.0 100 4.0 93 4.5 97 4.4 83 3.4 53 1.7 Flag Pond (S) 23 0.8 10 0.3 18 0.5 50 1.9 52 1.6 27 0.6 Hog Island 27 0.9 43 1.2 87 3.0 97 4.3 100 4.5 63 2.1 Butler 70 2.4 73 2.4 60 2.0 37 1.5 63 2.2 73 2.1 Buoy Rock 27 0.6 13 0.4 17 0.2 20 0.7 30 0.8 0 0.0 Old Field (S) 57 1.5 47 1.5 57 1.7 63 2.1 60 2.1 27 0.7 Bugby 73 2.5 83 2.8 87 3.3 90 3.3 97 3.3 43 1.1 Parsons Island 30 0.9 15 0.4 53 1.3 77 2.2 83 2.9 43 1.3 Hollicutt Noose 13 0.4 23 0.6 33 0.7 50 1.5 57 1.8 17 0.5 Bruffs Island (S) 37 1.2 23 0.7 77 2.0 100 4.2 97 4.3 63 1.9 Turtle Back 63 2.2 80 2.5 100 4.2 83 3.5 83 3.2 70 2.1 Long Point (S) 37 1.2 10 0.4 20 0.5 73 2.6 36 1.1 7 0.3 Cook Point (S) 97 3.2 80 3.1 90 3.3 100 4.6 90 3.5 63 1.6 Royston 60 2.0 60 2.0 63 2.1 47 1.5 43 1.5 17 0.5 Lighthouse 10 0.3 10 0.3 23 0.5 10 0.4 17 0.4 7 0.2 Sandy Hill (S) 93 2.8 77 2.4 93 3.3 93 4.0 96 3.9 53 1.4 Oyster Shell Pt. (S) 7 0.2 3 0.0 40 1.0 80 2.6 77 2.8 57 1.8 Tilghman Wharf 10 0.2 7 0.1 20 0.6 47 1.5 70 2.2 47 1.2 Deep Neck 80 3.1 67 1.8 93 2.9 80 3.1 77 2.4 57 1.3 Double Mills (S) 83 3.1 73 2.6 70 2.9 87 3.6 97 3.9 67 2.1 Cason (S) 80 2.8 90 2.8 93 2.8 100 4.2 97 3.3 77 2.2 Ragged Point 97 3.0 83 2.3 100 3.2 93 4.0 97 3.7 67 1.7 Norman Addition 80 3.1 87 3.7 77 2.7 93 3.6 93 3.2 63 2.0 Goose Creek 80 2.6 83 2.5 100 3.4 93 4.3 80 3 70 2.7 Wilson Shoals (S) 93 3.0 90 3.4 80 2.8 90 3.2 87 3.2 73 2.1 Georges (S) 83 3.4 97 3.9 93 3.9 83 3.4 97 3.9 77 2.7 Holland Straits 90 3.7 80 3.6 83 3.0 13 0.3 30 0.6 7 0.2 Sharkfin Shoal 93 3.5 90 3.4 77 2.8 90 4.1 93 4.1 57 2.1 Back Cove 93 3.9 80 3.1 77 3.2 30 0.9 30 0.9 3 0.07 Piney Island East 63 2.0 40 1.4 53 1.8 60 2.4 70 2.3 27 1.1 Old Woman’s Leg 52 1.3 60 2.6 67 2.1 11 0.2 50 1.6 6 0.06 Marumsco 100 4.4 80 3.5 90 3.6 93 3.7 100 3.9 63 1.6 Broome Island 93 3.2 70 1.9 80 2.6 90 3.8 93 4 50 1.3 Chicken Cock 50 1.2 67 1.9 67 2.1 73 2.4 97 3.1 63 2.1 Pagan (S) 77 2.4 83 2.1 83 2.9 83 3.1 80 3.1 63 1.4 Lancaster 30 1.2 20 0.8 3 0.2 37 1.6 47 1.8 10 0.1 Mills West 70 2.1 53 1.8 57 1.7 40 1.8 60 2 3 0.07 Cornfield Harbor 90 3.1 80 3.1 57 1.8 63 2.6 97 3.6 63 1.9 Ragged Point 0 0.0 3 0.0 0 0.0 3 0.0 7 0.1 0 0 Lower Cedar Point 20 0.4 3 0.1 55 1.6 33 1.1 50 1.6 0 0
Annual Means 57 1.9 52 1.8 61 2.1 63 2.5 69 2.5 40 1.2 Bar Freq. (%) 98 95 95 100 100 91

43
Table 3 - Dermo (continued).
Oyster Bar Perkinsus marinus Prevalence (%) and Mean Intensity (I) 2019 30-Yr Avg
% I % I Swan Point 3 0.1 26.9 0.7 Hackett Point 10 0.5 49.1 1.5 Holland Point (S) 0 0 39.6 1.2 Stone Rock 23 1 71.2 2.4 Flag Pond (S) 13 0.5 46.0 1.5 Hog Island 27 1 72.4 2.7 Butler 60 2 66.9 2.1 Buoy Rock 3 0.1 50.4 1.6 Old Field (S) 17 0.4 56.8 1.7 Bugby 90 2.8 81.0 2.7 Parsons Island 7 0.4 70.6 2.4 Hollicutt Noose 13 0.5 59.4 1.9 Bruffs Island (S) 70 2.3 73.0 2.3 Turtle Back 73 2.9 84.1 2.9 Long Point (S) 3 0.03 63.3 2.1 Cook Point (S) 37 1.2 58.2 1.9 Royston 20 0.6 54.2 1.9 Lighthouse 3 0.2 43.9 1.4 Sandy Hill (S) 53 2.4 74.7 2.8 Oyster Shell Pt. (S) 3 0.1 40.1 1.2 Tilghman Wharf 23 0.9 52.0 1.5 Deep Neck 33 1.2 78.5 2.7 Double Mills (S) 47 1.8 78.9 2.8 Cason (S) 60 2 79.1 2.6 Ragged Point 60 1.4 79.7 2.6 Norman Addition 37 1.5 78.0 2.8 Goose Creek 27 1.1 66.2 2.3 Wilson Shoals (S) 30 1 82.6 2.6 Georges (S) 77 3.1 81.3 2.9 Holland Straits 0 0 62.7 2.1 Sharkfin Shoal 63 2.4 82.0 2.9 Back Cove 0 0 77.4 2.8 Piney Island East 17 0.5 75.7 2.5 Old Woman’s Leg 0 0 70.9 2.5 Marumsco 30 1 81.1 2.9 Broome Island 13 0.5 74.5 2.6 Chicken Cock 27 1.2 71.7 2.4 Pagan (S) 17 0.4 78.5 2.4 Lancaster 7 0.2 56.0 1.7 Mills West 0 0 55.6 1.7 Cornfield Harbor 40 1.3 78.0 2.5 Ragged Point 0 0 19.4 0.5 Lower Cedar Point nd nd 22.3 0.6
Annual Means 27 0.97 64.5 2.1 Bar Freq. (%) 86 96.8
(Return to Text)

44
Table 4. Prevalence of Haplosporidium nelsoni in oysters from the 43 disease monitoring bars,
1990-2019. NA = insufficient quantity of oysters for analytical sample. ND = sample collected but diagnostics not performed; prevalence assumed to be 0. (S) = bar within an oyster sanctuary since 2010.
Region Oyster Bar Haplosporidium nelsoni Prevalence (%)
1990 1991 1992 1993 1994 1995 1996 1997 Upper Bay Swan Point 0 0 0 0 ND 0 0 0
Middle Bay
Hackett Point 0 0 3 0 0 0 0 0 Holland Point (S) 0 3 13 0 0 0 0 0 Stone Rock 0 0 43 0 0 3 0 0 Flag Pond (S) 0 0 53 0 0 27 0 0
Lower Bay Hog Island 0 0 43 0 0 14 0 0 Butler 0 0 50 0 0 23 0 7
Chester River Buoy Rock ND 0 0 0 ND 0 0 0 Old Field (S) ND 0 0 0 ND 0 0 0
Eastern Bay Bugby 0 7 3 0 0 0 0 0 Parsons Island ND 0 7 0 0 0 0 0 Hollicutt Noose 0 0 17 0 0 0 0 0
Wye River Bruffs Island (S) 0 0 0 0 0 0 0 0
Miles River Turtle Back 0 0 0 0 0 23 0 0 Long Point (S) 0 0 0 0 0 0 0 0
Choptank River
Cook Point (S) 0 7 73 0 0 NA 0 3 Royston NA 0 33 0 0 0 0 0 Lighthouse 0 0 53 0 0 0 0 0 Sandy Hill (S) 0 0 13 0 ND 0 0 0 Oyster Shell Pt. (S) 0 0 30 0 ND 0 0 0
Harris Creek Tilghman Wharf 0 0 40 0 0 0 0 0 Broad Creek Deep Neck 0 0 30 0 0 0 0 0 Tred Avon River Double Mills (S) 0 0 17 0 0 0 0 0
Little Choptank R. Cason (S) 0 0 43 0 0 0 0 0 Ragged Point 0 20 57 0 0 0 0 0
Honga River Norman Addition 3 0 53 0 0 33 0 0 Fishing Bay Goose Creek 0 10 27 7 0 20 0 0 Nanticoke River Wilson Shoals (S) 0 0 57 0 ND 7 0 0 Manokin River Georges (S) 10 7 23 0 0 33 0 0 Holland Straits Holland Straits 0 20 13 13 0 52 0 10
Tangier Sound
Sharkfin Shoal 20 43 40 17 0 33 0 0 Back Cove 0 17 27 33 7 20 3 3 Piney Island East 7 23 17 20 13 10 7 13 Old Woman’s Leg 0 33 23 30 10 43 20 4
Pocomoke Sound Marumsco 0 20 20 0 0 20 0 11 Patuxent River Broome Island 0 ND 20 0 0 0 0 0
St. Mary’s River Chicken Cock 0 0 57 0 ND 0 0 0 Pagan (S) 0 0 0 0 ND 0 0 0
Wicomico R. (west)
Lancaster 0 0 0 0 ND 0 0 0 Mills West 0 0 0 0 ND 0 0 0
Potomac River Cornfield Harbor 0 0 57 0 0 37 0 0 Ragged Point 0 0 0 0 0 0 0 0 Lower Cedar Point ND ND 0 0 ND 0 0 0
Average Prevalence (%) 1.1 5.1 24.5 2.8 0.9 9.5 0.7 1.2 Frequency of Positive Bars (%) 9 28 74 14 7 40 7 16

45
Table 4 – MSX (continued).
Oyster Bar Haplosporidium nelsoni Prevalence (%) 1998 1999 2000 2001 2002 2003 2004 2005 2006 2007
Swan Point 0 0 0 0 0 0 0 0 0 0 Hackett Point 0 0 0 0 13 0 0 0 0 0 Holland Point (S) 0 0 3 7 40 0 0 0 0 0 Stone Rock 0 30 47 40 30 3 0 0 0 0 Flag Pond (S) 0 NA NA NA 20 0 0 0 0 0 Hog Island 0 60 27 27 20 0 0 0 0 0 Butler 3 47 17 27 20 3 3 0 3 10 Buoy Rock 0 0 0 0 0 0 0 0 0 0 Old Field (S) 0 0 0 0 0 0 0 0 0 0 Bugby 0 0 0 0 27 0 0 0 0 0 Parsons Island 0 0 0 3 17 0 0 0 0 0 Hollicutt Noose 0 7 10 17 37 0 0 0 0 0 Bruffs Island (S) 0 0 0 3 17 0 0 0 0 0 Turtle Back 0 0 0 7 33 0 0 0 0 0 Long Point (S) 0 0 0 0 3 0 0 0 0 0 Cook Point (S) 0 13 33 37 NA 0 0 3 0 0 Royston 0 3 7 0 60 0 0 0 0 0 Lighthouse 0 13 7 3 67 0 0 0 0 0 Sandy Hill (S) 0 0 0 10 53 0 0 0 0 0 Oyster Shell Pt. (S) 0 0 0 0 7 0 0 0 0 0 Tilghman Wharf 0 3 27 7 60 0 0 0 0 0 Deep Neck 0 3 7 0 63 0 0 0 0 0 Double Mills (S) 0 3 0 0 33 0 0 0 0 0 Cason (S) 0 7 27 33 59 0 0 0 0 0 Ragged Point 0 20 47 40 30 0 0 0 0 0 Norman Addition 3 63 37 37 20 7 0 0 0 7 Goose Creek 0 47 17 13 33 0 0 0 0 3 Wilson Shoals (S) 0 4 10 10 27 0 0 0 0 7 Georges (S) 0 40 20 13 30 0 0 0 0 7 Holland Straits 3 73 40 47 57 7 0 0 0 23 Sharkfin Shoal 20 53 37 20 27 7 0 0 0 10 Back Cove 10 33 37 10 7 7 0 7 13 33 Piney Island East 17 43 53 40 17 10 3 0 3 17 Old Woman’s Leg 23 53 30 13 13 3 3 13 13 13 Marumsco 7 37 30 17 30 0 0 0 0 10 Broome Island 0 3 10 0 13 0 0 0 0 0 Chicken Cock 0 77 7 17 30 3 0 0 0 3 Pagan (S) 0 3 13 10 40 0 0 0 0 0 Lancaster 0 0 0 0 10 0 0 0 0 0 Mills West 0 3 0 0 43 0 0 0 0 0 Cornfield Harbor 3 53 17 33 50 10 0 0 0 7 Ragged Point 0 13 10 7 60 0 0 0 0 0 Lower Cedar Point 0 0 0 0 0 0 0 0 0 0 Avg. Prev. (%) 2.1 19.2 14.9 13.0 29.0 1.4 0.2 0.5 0.7 3.1
Pos. Bars (%) 19 67 64 67 90 23 7 7 9 30

46
Table 4 - MSX (continued). Oyster Bar Haplosporidium nelsoni Prevalence (%)
2008 2009 2010 2011 2012 2013 2014 2015 2016 2017 2018 Swan Point 0 0 0 0 0 0 0 0 0 0 0 Hackett Point 0 0 0 0 0 0 0 0 0 3 0 Holland Point (S) 0 0 3 0 0 0 0 0 0 3 0 Stone Rock 10 23 3 0 0 0 0 7 13 10 0 Flag Pond (S) 3 13 7 0 0 0 0 12 10 0 0 Hog Island 7 17 0 0 0 0 0 10 40 3 0 Butler 7 37 17 0 0 0 3 13 48 0 0 Buoy Rock 0 0 0 0 0 0 0 0 0 0 0 Old Field (S) 0 0 0 0 0 0 0 0 0 0 0 Bugby 0 0 0 0 0 0 0 3 3 0 0 Parsons Island 0 0 0 0 0 0 0 0 7 0 0 Hollicutt Noose 0 13 0 0 0 0 0 0 10 0 0 Bruffs Island (S) 0 3 0 0 0 0 0 0 3 0 0 Turtle Back 0 0 0 0 0 0 0 3 7 0 0 Long Point (S) 0 0 3 0 0 0 0 0 0 0 0 Cook Point (S) 7 43 10 0 0 0 0 13 30 3 0 Royston 0 0 0 0 0 0 0 7 30 0 0 Lighthouse 0 13 3 0 0 0 0 0 37 0 0 Sandy Hill (S) 0 0 0 0 0 0 0 0 0 0 0 Oyster Shell Pt. (S) 0 0 0 0 0 0 0 0 0 0 0 Tilghman Wharf 0 3 0 0 0 0 0 7 27 0 0 Deep Neck 0 13 0 0 0 0 0 3 0 0 0 Double Mills (S) 0 0 0 0 0 0 0 0 0 0 0 Cason (S) 0 20 0 0 0 0 0 23 0 0 0 Ragged Point 0 13 10 0 0 0 0 20 17 3 0 Norman Addition 10 33 10 0 0 0 3 3 7 0 0 Goose Creek 7 27 0 0 0 0 0 13 7 0 0 Wilson Shoals (S) 0 7 0 0 0 0 0 3 0 0 0 Georges (S) 0 10 0 0 0 0 0 3 0 0 0 Holland Straits 7 33 23 0 0 0 3 10 13 0 0 Sharkfin Shoal 17 17 10 0 0 0 10 10 0 0 0 Back Cove 13 27 7 0 0 3 10 17 37 13 0 Piney Island East 0 33 7 0 0 10 27 33 10 13 3 Old Woman’s Leg 0 27 20 7 3 3 20 23 17 25 0 Marumsco 0 17 3 0 3 0 10 10 0 3 0 Broome Island 0 3 0 0 0 0 0 0 7 7 0 Chicken Cock 13 57 10 0 0 0 0 23 60 7 0 Pagan (S) 0 30 0 0 0 0 0 0 0 0 0 Lancaster 0 0 0 0 0 0 0 0 0 0 0 Mills West 0 0 0 0 0 0 0 0 0 0 0 Cornfield Harbor 10 30 7 0 0 10 10 30 33 7 0 Ragged Point 0 0 0 0 0 0 0 0 3 10 0 Lower Cedar Point 0 0 0 0 0 0 0 0 0 0 0 Avg. Prev. (%) 2.7 13.0 3.6 0.2 0.1 0.6 2.2 7.0 11.1 2.6 0.1
Pos. Bars (%) 30 60 40 2 5 9 21 56 56 33 2

47
Table 4 - MSX (continued). Oyster Bar Haplosporidium nelsoni Prevalence (%)
2019 30-yr avg Swan Point 0 0.0 Hackett Point 0 0.6 Holland Point (S) 0 2.4 Stone Rock 0 8.7 Flag Pond (S) 0 5.4 Hog Island 0 8.9 Butler 0 11.3 Buoy Rock 0 0.0 Old Field (S) 0 0.0 Bugby 0 1.4 Parsons Island 0 1.2 Hollicutt Noose 0 3.7 Bruffs Island (S) 0 0.9 Turtle Back 0 2.4 Long Point (S) 0 0.2 Cook Point (S) 0 9.8 Royston 0 4.8 Lighthouse 0 6.5 Sandy Hill (S) 0 2.6 Oyster Shell Pt. (S) 0 1.3 Tilghman Wharf 0 5.8 Deep Neck 0 4.0 Double Mills (S) 0 1.8 Cason (S) 0 7.1 Ragged Point 0 9.2 Norman Addition 0 11.0 Goose Creek 0 7.7 Wilson Shoals (S) 0 4.6 Georges (S) 0 6.5 Holland Straits 0 14.9 Sharkfin Shoal 0 13.0 Back Cove 0 13.1 Piney Island East 0 15.0 Old Woman’s Leg 0 16.2 Marumsco 3 8.4 Broome Island 0 2.2 Chicken Cock 0 12.6 Pagan (S) 0 3.3 Lancaster 0 0.3 Mills West 0 1.6 Cornfield Harbor 0 13.5 Ragged Point 0 3.4 Lower Cedar Point 0 0.0 Avg. Prev. (%) 0.1 29.8
Pos. Bars (%) 2 5.8
(Return to Text)

48
Table 5. Oyster population mortality estimates from the 43 disease monitoring bars, 1985-2019. NA = unable to obtain a sufficient sample size. (S) = bar within an oyster sanctuary since 2010.
Region Oyster Bar Total Observed Mortality (%)
1985 1986 1987 1988 1989 1990 1991 1992 Upper Bay Swan Point 14 1 2 1 9 4 4 3
Middle Bay
Hackett Point 7 0 10 9 5 2 2 12 Holland Point (S) 4 21 19 3 19 3 14 45 Stone Rock 6 NA NA NA NA 2 9 45 Flag Pond (S) NA 48 30 39 37 10 35 77
Lower Bay Hog Island NA 26 47 25 6 19 73 85 Butler NA 23 84 15 7 30 58 84
Chester River Buoy Rock 10 0 0 1 10 5 11 16 Old Field (S) 8 3 3 4 2 7 3 9
Eastern Bay Bugby 8 25 46 33 25 39 53 18 Parsons Island 19 1 26 13 2 7 43 27 Hollicutt Noose 2 32 42 25 14 1 7 9
Wye River Bruffs Island (S) 2 1 45 12 9 12 50 77
Miles River Turtle Back NA 1 19 27 15 27 51 23 Long Point (S) 17 8 23 8 12 11 53 73
Choptank River
Cook Point (S) 40 20 45 63 6 11 2 88 Royston 4 21 19 11 14 14 33 43 Lighthouse 3 14 59 14 8 8 45 52 Sandy Hill (S) 12 6 29 34 7 11 75 48 Oyster Shell Pt. (S) 9 0 1 2 2 3 2 19
Harris Creek Tilghman Wharf 2 36 57 NA 20 30 34 26 Broad Creek Deep Neck 2 25 37 32 47 66 48 40 Tred Avon River Double Mills (S) 4 7 13 9 6 28 82 50
Little Choptank R. Cason (S) 4 22 60 37 40 63 25 48 Ragged Point 5 31 84 38 7 23 53 49
Honga River Norman Addition 15 53 82 NA 11 11 48 49 Fishing Bay Goose Creek 6 26 84 59 19 7 23 63 Nanticoke River Wilson Shoals (S) 23 65 51 41 38 10 29 60 Manokin River Georges (S) 5 24 84 55 23 31 50 55 Holland Straits Holland Straits 19 51 85 90 15 27 35 71
Tangier Sound
Sharkfin Shoal 25 61 94 80 8 0 10 63 Back Cove NA NA NA NA NA 11 49 88 Piney Island East 21 16 88 11 5 23 57 55 Old Woman’s Leg 4 17 79 21 8 5 50 80
Pocomoke Sound Marumsco 3 27 77 NA 20 8 31 44 Patuxent River Broome Island 10 29 31 6 4 24 53 70
St. Mary’s River Chicken Cock 18 43 63 43 24 27 31 51 Pagan (S) 9 30 27 13 20 39 24 19
Wicomico R. (west)
Lancaster 13 6 4 4 6 28 20 8 Mills West 18 0 2 1 1 2 11 9
Potomac River Cornfield Harbor 17 59 92 51 11 16 29 77 Ragged Point 10 14 29 79 54 63 34 63 Lower Cedar Point 6 9 2 1 6 6 7 5
Annual Means 10 22 44 29 14 18 34 46

49
Table 5 - Mortality (continued).
Oyster Bar Total Observed Mortality (%) 1993 1994 1995 1996 1997 1998 1999 2000 2001 2002
Swan Point 5 35 18 43 20 3 7 13 12 14 Hackett Point 18 30 30 16 10 26 22 13 30 60 Holland Point (S) 43 42 35 49 36 36 8 33 42 67 Stone Rock 30 29 40 25 15 33 46 66 30 86 Flag Pond (S) 43 28 24 16 13 33 50 NA NA 23 Hog Island 76 16 45 20 16 33 67 67 14 31 Butler 66 37 63 17 20 20 48 67 32 11 Buoy Rock 51 33 22 17 7 7 6 25 43 61 Old Field (S) 8 12 8 17 8 5 8 21 36 47 Bugby 29 18 18 27 15 8 5 29 48 63 Parsons Island 29 18 36 22 25 8 16 29 60 59 Hollicutt Noose 29 32 30 13 15 14 13 38 55 85 Bruffs Island (S) 47 47 33 6 6 11 16 33 44 50 Turtle Back 24 40 51 21 9 9 26 38 48 54 Long Point (S) 44 8 28 8 3 9 14 33 34 66 Cook Point (S) 63 40 22 16 11 20 35 63 28 100 Royston 37 10 17 9 9 6 32 31 51 91 Lighthouse 57 27 18 15 5 6 20 33 44 92 Sandy Hill (S) 45 36 29 23 22 4 15 27 50 77 Oyster Shell Pt. (S) 20 14 18 25 6 2 1 15 28 55 Tilghman Wharf 36 6 10 9 15 6 12 19 34 85 Deep Neck 32 1 23 14 8 13 37 23 37 85 Double Mills (S) 24 10 20 9 8 10 38 40 50 85 Cason (S) 53 6 7 12 11 18 28 32 62 98 Ragged Point 71 17 16 12 13 19 34 37 70 94 Norman Addition 51 28 39 55 31 54 35 38 29 29 Goose Creek 38 7 38 69 64 20 64 63 81 85 Wilson Shoals (S) 23 10 17 11 11 9 29 25 26 52 Georges (S) 16 0 55 33 36 12 32 60 50 44 Holland Straits 18 16 45 43 20 18 35 35 17 12 Sharkfin Shoal 16 7 66 59 47 28 62 61 39 61 Back Cove 4 6 46 33 29 50 59 20 46 38 Piney Island East 13 20 65 56 49 67 38 27 12 20 Old Woman’s Leg 15 25 63 46 33 38 42 15 53 27 Marumsco 21 8 78 53 49 26 40 22 35 45 Broome Island 53 27 8 0 13 11 44 25 59 72 Chicken Cock 33 28 15 10 7 24 82 63 28 63 Pagan (S) 17 11 9 27 15 3 14 35 51 84 Lancaster 7 4 19 25 8 8 18 48 58 52 Mills West 2 4 21 18 17 16 24 36 40 75 Cornfield Harbor 47 25 56 24 7 27 78 62 44 33 Ragged Point 28 35 8 11 4 25 10 8 33 NA Lower Cedar Point 47 28 5 23 3 26 8 0 3 44 Annual Means 33 20 30 25 18 19 31 35 38 58

50
Table 5 - Mortality (continued).
Oyster Bar Total Observed Mortality (%) 2003 2004 2005 2006 2007 2008 2009 2010 2011 2012
Swan Point 13 10 11 8 10 9 33 20 27 1 Hackett Point 17 10 2 5 11 26 15 14 0 13 Holland Point (S) 50 29 5 0 0 11 0 8 50 7 Stone Rock 13 5 5 20 5 25 16 8 2 2 Flag Pond (S) 0 0 2 4 0 14 26 20 11 0 Hog Island 11 6 12 25 42 14 18 12 8 14 Butler 9 2 3 23 0 9 8 8 12 4 Buoy Rock 41 28 6 21 20 24 43 8 4 2 Old Field (S) 34 10 38 12 12 17 17 11 21 12 Bugby 50 14 2 20 52 42 50 12 4 9 Parsons Island 37 11 8 35 50 34 36 16 10 4 Hollicutt Noose 25 3 6 48 43 27 12 23 0 0 Bruffs Island (S) 50 12 5 4 12 36 33 28 0 7 Turtle Back 43 11 12 51 57 55 34 5 11 4 Long Point (S) 54 10 10 14 38 46 17 33 0 33 Cook Point (S) 21 0 0 0 12 22 7 8 6 5 Royston 69 14 0 0 9 5 10 0 1 3 Lighthouse 89 47 0 0 0 0 4 1 3 4 Sandy Hill (S) 88 59 44 24 4 5 5 0 8 6 Oyster Shell Pt. (S) 48 20 0 4 0 4 4 2 1 3 Tilghman Wharf 62 17 0 1 10 14 2 2 3 0 Deep Neck 54 14 1 3 8 9 3 6 4 3 Double Mills (S) 59 23 8 0 7 4 19 6 4 14 Cason (S) 57 4 0 2 4 16 17 33 10 13 Ragged Point 52 5 4 13 13 2 22 15 4 2 Norman Addition 9 14 40 5 3 2 6 15 9 10 Goose Creek 53 59 50 50 1 2 6 0 3 1 Wilson Shoals (S) 19 27 7 21 7 30 10 3 5 8 Georges (S) 4 24 44 76 16 48 10 12 2 11 Holland Straits 11 18 43 48 17 27 12 14 5 7 Sharkfin Shoal 23 32 54 22 10 3 18 20 12 13 Back Cove 22 23 32 12 5 8 6 15 4 10 Piney Island East 28 48 50 23 6 18 20 26 17 11 Old Woman’s Leg 35 56 26 0 12 14 37 38 26 0 Marumsco 4 11 29 20 10 21 7 13 4 15 Broome Island 14 19 6 6 20 20 11 14 3 6 Chicken Cock 2 38 50 20 20 7 27 22 11 1 Pagan (S) 7 29 66 9 4 11 29 13 5 11 Lancaster 35 27 14 7 31 17 24 0 0 0 Mills West 48 11 0 7 33 0 16 10 11 12 Cornfield Harbor 1 7 20 2 9 25 44 16 9 8 Ragged Point 76 NA NA NA 0 0 0 0 0 10 Lower Cedar Point 55 22 17 3 11 5 4 7 14 10 Annual Means 35 20 17 16 15 17 17 12 8 7

51
Table 5 - Mortality (continued).
Oyster Bar Total Observed Mortality (%) 2013 2014 2015 2016 2017 2018 2019 35-yr Avg
Swan Point 4 0 3 0 0 8 12 10.8 Hackett Point 0 0 0 3 19 3 5 12.7 Holland Point (S) 12 40 29 0 0 50 nd 23.8 Stone Rock 2 5 31 36 30 9 5 22.0 Flag Pond (S) 15 13 5 6 50 3 1 21.1 Hog Island 2 2 12 38 27 18 0 27.3 Butler 7 7 10 11 4 5 7 23.9 Buoy Rock 5 9 3 12 4 12 9 16.5 Old Field (S) 0 3 0 5 33 10 31 13.6 Bugby 8 31 21 21 13 12 17 25.3 Parsons Island 2 4 15 2 10 14 0 20.8 Hollicutt Noose 1 9 6 7 29 30 8 20.9 Bruffs Island (S) 0 4 5 16 20 41 38 23.2 Turtle Back 0 8 14 18 3 15 8 24.5 Long Point (S) 20 0 0 17 0 0 37 22.3 Cook Point (S) 9 12 16 48 45 24 13 26.3 Royston 1 6 9 16 4 2 4 17.3 Lighthouse 1 1 2 9 7 0 4 19.8 Sandy Hill (S) 3 13 11 15 15 11 11 24.9 Oyster Shell Pt. (S) 2 5 2 11 11 18 24 10.9 Tilghman Wharf 5 1 5 11 1 7 4 17.1 Deep Neck 5 7 16 8 2 3 3 20.5 Double Mills (S) 11 12 10 20 13 11 2 20.5 Cason (S) 11 8 17 26 33 8 4 25.4 Ragged Point 15 13 21 45 14 6 3 26.3 Norman Addition 9 7 13 14 15 8 2 24.7 Goose Creek 5 15 22 27 6 10 3 32.3 Wilson Shoals (S) 5 4 7 17 6 4 4 20.4 Georges (S) 15 5 8 23 15 9 5 28.3 Holland Straits 9 48 71 18 4 17 4 29.3 Sharkfin Shoal 16 18 24 19 3 7 4 31.0 Back Cove 11 19 14 1 2 8 1 22.4 Piney Island East 7 10 9 21 25 38 33 29.5 Old Woman’s Leg 50 75 15 0 50 25 10 31.1 Marumsco 13 13 17 13 20 34 36 25.5 Broome Island 7 8 14 21 3 4 0 20.4 Chicken Cock 1 7 16 32 20 17 20 27.5 Pagan (S) 4 13 22 28 6 4 4 20.3 Lancaster 13 0 3 1 1 10 5 15.0 Mills West 20 9 5 14 0 5 15 14.7 Cornfield Harbor 10 16 10 36 8 3 5 28.1 Ragged Point 0 0 50 10 8 4 33 22.5 Lower Cedar Point 0 0 6 8 27 96 100 17.5 Annual Means 8 11 14 16 14 14 13 22.2
(Return to Text)

52
Table 6. Regional summary of oyster harvests (bu.) in Maryland from buy tickets, 1985-86 through 2018-19 seasons.
Maryland Oyster Harvests (bu)
Region/Tributary 1985-86 1986-87 1987-88 1988-89 1989-90 1990-91 Upper Bay 5,600 30,800 19,100 17,700 15,700 19,800 Middle Bay 73,400 37,900 42,500 10,500 15,900 17,700 Lower Bay 32,500 5,900 70 0 3,600 37,900 Total Bay Mainstem 111,500 74,600 61,700 28,200 35,200 75,400 Chester R. 21,300 20,600 30,900 49,900 54,000 60,400 Eastern Bay 216,100 149,100 28,700 15,700 20,400 33,200 Miles R. 40,400 20,600 17,100 13,600 1,400 1,700 Wye R. 20,100 2,200 700 3,800 8,000 2,300 Total Eastern Bay Region 276,600 171,900 46,500 33,100 29,800 37,200 Upper Choptank R. 29,000 42,400 36,500 51,900 27,700 42,200 Middle Choptank R. 144,500 89,700 66,400 66,400 71,000 49,700 Lower Choptank R. 225,100 52,500 26,200 9,100 32,100 9,000 Tred Avon R. 67,700 60,900 13,700 42,400 92,100 22,000 Broad Cr. 12,900 58,700 8,500 13,500 8,100 4,300 Harris Cr. 3,500 16,700 6,900 7,800 8,800 3,300 Total Choptank R. Region 482,700 320,900 158,200 191,100 239,800 130,500 Little Choptank R. 27,100 10,500 21,500 15,000 19,000 8,800 Upper Tangier Sound 84,000 30,400 40 0 0 1,000 Lower Tangier Sound 64,400 22,200 90 0 0 1,600 Honga R. 29,400 49,300 7,700 300 1,100 5,600 Fishing Bay 107,600 87,300 90 20 20 900 Nanticoke R. 21,300 5,100 1,500 900 2,600 3,000 Wicomico R. 3,600 200 100 40 20 60 Manokin R. 40,800 47,400 500 70 10 60 Big Annemessex R. 90 10 10 0 40 0 Pocomoke Sound 32,700 22,300 0 0 0 300 Total Tangier Sound Region 383,900 264,200 10,000 1,300 3,800 12,500 Patuxent R. 96,300 16,800 1,400 3,700 8,900 48,400 Wicomico R., St. Clement and Breton bays 16,000 23,400 23,000 47,600 22,200 36,000
St. Mary’s R. and Smith Cr. 80,700 30,700 2,300 500 1,100 1,700 Total Md. Potomac Tribs. 96,700 54,100 25,300 48,100 23,300 37,700 Total Maryland (bu.)1 1,500,000 976,000 360,000 390,000 414,000 418,000
1 Includes harvests from unidentified regions. Not all harvest reports provided region information, but were included in the Md. total.

53
Table 6 - Landings (continued).
Maryland Oyster Harvests (bu) Region/Tributary 1991-92 1992-93 1993-94 1994-95 1995-96 1996-97
Upper Bay 35,200 18,200 8,900 7,800 26,600 2,600 Middle Bay 39,200 9,000 4,400 4,900 12,600 20,000 Lower Bay 9,300 90 0 1,100 800 300 Total Bay Mainstem 83,800 27,300 13,300 13,800 40,000 22,800 Chester R. 55,100 53,800 51,300 29,100 42,600 5,400 Eastern Bay 20,600 3,600 2,400 3,700 1,500 1,100 Miles R. 100 300 0 200 200 500 Wye R. 300 20 30 50 0 0 Total Eastern Bay Region 21,000 3,900 2,400 4,000 1,700 1,600 Upper Choptank R. 29,200 9,500 2,600 2,500 11,600 3,200 Middle Choptank R. 25,000 3,100 1,600 4,900 15,000 4,700 Lower Choptank R. 14,200 1,700 900 600 900 300 Tred Avon R. 800 0 0 5,900 1,300 3,800 Broad Cr. 40 50 10 400 1,000 4,000 Harris Cr. 100 20 0 14,200 5,000 13,600 Total Choptank R. Region 69,300 14,400 5,100 28,500 34,800 29,600 Little Choptank R. 3,800 50 300 19,300 1,900 40,800 Upper Tangier Sound 11,300 70 0 17,600 12,100 8,100 Lower Tangier Sound 1,700 40 0 5,400 500 10,100 Honga R. 600 20 100 1,700 400 200 Fishing Bay 6,400 500 30 11,900 20,900 8,800 Nanticoke R. 12,500 7,700 2,500 10,500 15,200 23,000 Wicomico R. 600 500 500 80 100 1,400 Manokin R. 200 40 10 100 0 900 Big Annemessex R. 10 0 0 0 0 0 Pocomoke Sound 500 0 0 100 0 300 Total Tangier Sound Region 33,800 8,900 3,100 47,400 49,200 52,800 Patuxent R. 24,500 0 0 30 100 20 Wicomico R., St. Clement and Breton bays 29,600 14,900 4,000 18,200 27,500 7,300
St. Mary’s R. and Smith Cr. 100 60 30 3,900 900 16,200 Total Potomac Md. Tribs. 29,000 15,000 4,000 22,100 28,400 23,500 Total Maryland (bu.)1 323,000 124,000 80,000 165,000 200,000 178,000
1 Includes harvests from unidentified regions.

54
Table 6 - Landings (continued).
Maryland Oyster Harvests (bu) Region/Tributary 1997-98 1998-99 1999-00 2000-01 2001-02 2002-03
Upper Bay 18,800 13,100 28,100 31,150 16,100 18,930 Middle Bay 15,300 55,800 31,500 16,400 4,550 2,410 Lower Bay 4,800 8,300 3,800 2,050 600 50 Total Bay Mainstem 38,900 77,200 63,400 49,600 21,250 21,390 Chester R. 43,000 21,000 70,100 20,800 29,450 11,830 Eastern Bay 3,800 30,900 75,800 120,500 33,400 4,650 Miles R. 30 800 35,700 20,150 6,600 50 Wye R. 400 900 9,400 11,300 1,800 60 Total Eastern Bay Region 4,200 32,600 120,900 151,950 41,800 4,760 Upper Choptank R. 4,800 3,100 7,100 1,100 7,450 10 Middle Choptank R. 5,600 2,800 1,900 8,150 5,600 520 Lower Choptank R. 200 2,400 8,300 350 1,500 40 Tred Avon R. 6,900 11,700 3,700 8,950 1,000 40 Broad Cr. 27,600 46,200 18,200 36,850 4,900 700 Harris Cr. 21,400 67,000 18,200 26,200 3,300 30 Total Choptank R. Region 66,500 133,200 57,400 81,600 23,750 1,340 Little Choptank R. 36,100 84,100 33,600 27,850 2,400 190 Upper Tangier Sound 6,000 3,500 1,500 100 5,050 3,570 Lower Tangier Sound 4,200 8,500 2,800 1,450 13,200 5,960 Honga R. 1,300 300 50 0 50 590 Fishing Bay 3,800 700 90 0 0 390 Nanticoke R. 30,300 21,700 8,800 600 2,700 540 Wicomico R. 2,200 1,400 500 50 50 10 Manokin R. 600 300 90 200 1,850 970 Big Annemessex R. 0 0 200 0 0 0 Pocomoke Sound 400 80 100 10 20 0 Total Tangier Sound Region 48,800 36,500 14,100 2,400 22,920 12,030 Patuxent R. 60 5,600 2,000 10 0 0 Wicomico R., St. Clement and Breton bays 10,200 13,700 8,800 2,600 1,400 220
St. Mary’s R. and Smith Cr. 36,700 16,400 4,500 6,150 1,650 0 Total Potomac Md. Tribs. 46,900 30,100 13,300 8,750 3,050 220 Total Maryland (bu.)1 285,000 423,000 381,000 348,000 148,000 56,000
1 Includes harvests from unidentified regions.

55
Table 6 - Landings (continued).
Maryland Oyster Harvests (bu) Region/Tributary 2003-04 2004-05 2005-06 2006-07 2007-08 2008-09 Upper Bay 2,210 1,632 17,420 14,052 13,601 7,020 Middle Bay 750 295 17,346 17,004 3,728 1,870 Lower Bay 187 1,801 269 642 2,077 5,554 Total Bay Mainstem 3,147 3,728 35,035 31,698 19,406 14.444 Chester R. 557 3,239 4,385 7,201 4,685 4,826 Eastern Bay 5,446 16,767 49,120 36,268 8,582 7,390 Miles R. 56 353 3,660 1,133 27 910 Wye R. 0 173 122 0 0 12 Total Eastern Bay Region 5,502 17,293 52,902 37,401 8,609 8,312 Upper Choptank R. 0 78 591 11 95 15 Middle Choptank R. 30 67 967 2,510 597 597 Lower Choptank R. 0 267 1,250 3,037 2,426 2,535 Tred Avon R. 0 139 149 157 61 112 Broad Cr. 954 1,342 14,006 53,577 20,413 6,097 Harris Cr. 12 71 4,429 5,342 3,308 1,900 Total Choptank R. Region 996 1,964 21,392 64,634 26,900 11,256 Little Choptank R. 1,150 144 3,534 4,218 1,516 1,163 Upper Tangier Sound 7,630 13,658 2,874 3,856 4,614 12,454 Lower Tangier Sound 5,162 15,648 5,828 1,996 8,970 19,600 Honga R. 378 2,744 270 154 860 17,305 Fishing Bay 24 106 6 0 197 3,320 Nanticoke R. 57 965 387 97 97 134 Wicomico R. 0 0 0 30 11 118 Manokin R. 1,638 2,816 737 91 364 184 Big Annemessex R. 0 5 108 17 5 13 Pocomoke Sound 0 2,676 1,071 277 1,051 765 Total Tangier Sound Region 14,889 38,618 11,281 6,518 16,169 53,893 Patuxent R. 0 466 17,808 7,316 831 1,258 Wicomico R., St. Clement and Breton bays 13 18 1,414 80 698 808
St. Mary’s R. and Smith Cr. 0 91 1,863 2,069 1,252 1,643 Total Potomac Md. Tribs. 13 109 3,277 2,149 1,950 2,451 Total Maryland (bu.)1 26,000 72,000 154,000 165,000 83,000 101,000
1 Includes harvests from unidentified regions.

56
Table 6 - Landings (continued).
Maryland Oyster Harvests (bu) Region/Tributary 2009-10 2010-11 2011-12 2012-13 2013-14 2014-15 Upper Bay 8,723 6,310 297 19 45 606 Middle Bay 4,012 2,054 439 4,310 9,218 7,321 Lower Bay 14,927 2,759 2,249 8,134 13,670 12,298 Total Bay Mainstem 27,662 11,123 2,985 12,463 22,933 20,224 Chester R. 2,874 5,290 119 102 556 3,493 Eastern Bay 2,662 1,957 221 4,966 15,650 8,763 Miles R. 11 12 81 82 727 1,871 Wye R. 227 0 9 0 0 73 Total Eastern Bay Region 2,900 1,969 311 5,048 16,377 10,707 Upper Choptank R. 42 412 0 149 213 73 Middle Choptank R. 661 523 1,598 1,725 4,032 5,548 Lower Choptank R. 3,424 3,534 3,402 11,336 12,934 26,008 Tred Avon R. 0 68 402 1,095 2,038 2,850 Broad Cr. 5,328 7,646 11,382 72,643 76,125 62,436 Harris Cr. 1,227 191 100 3,043 3,353 8,112 Total Choptank R. Region 10,682 12,374 16,884 89,991 98,695 105,028 Little Choptank R. 923 0 568 1,216 2,137 5,044 Upper Tangier Sound 24,553 19,098 24,076 40,143 57,853 53,270 Lower Tangier Sound 61,771 27,849 29,578 38,802 45,301 25,660 Honga R. 24,696 10,213 10,391 20,182 24,594 22,122 Fishing Bay 14,949 10,174 13,852 51,038 61,909 39,054 Nanticoke R. 2,168 5,300 10,121 8,385 6,558 14,924 Wicomico R. 109 1,140 3,587 5,551 4,253 3,748 Manokin R. 888 1,477 1,731 84 1,863 3,158 Big Annemessex R. 0 1,036 546 79 730 576 Pocomoke Sound 1,165 855 3,859 35,193 33,343 18,262 Total Tangier Sound Region 130,299 77,142 97,741 199,457 236,404 180,773 Patuxent R. 3,456 6,535 8,419 13,764 19,984 45,781 Wicomico R., St. Clement and Breton bays 712 2,132 1,931 4,504 6,383 3,822
St. Mary’s R. and Smith Cr. 3,186 2,275 1,454 11,345 7,909 10,775 Total Potomac Md. Tribs. 3,898 4,407 3,385 15,849 14,292 14,597 Total Maryland (bu.)1 185,245 123,613 137,317 341,232 416,578 388,658
1 Includes harvests from unidentified regions.

57
Table 6 - Landings (continued).
Maryland Oyster Harvests (bu)
Region/Tributary 2015-16 2016-17 2017-18 2018-19 34-yr Avg
Upper Bay 3,648 4,693 2580 747 12,288 Middle Bay 13,019 11,072 5,134 3,005 15,133 Lower Bay 4,285 4,314 9,112 11,083 6,015 Total Bay Mainstem 20,952 20,079 16,826 14,835 33,013 Chester R. 1,547 569 5,135 613 21,052 Eastern Bay 13,091 15,576 9,663 8,566 28,525 Miles R. 3,335 1,666 527 962 5,142 Wye R. 18 17 21 0 1,824 Total Eastern Bay Region 16,444 17,259 10,211 9,528 35,491 Upper Choptank R. 192 42 129 183 9,238 Middle Choptank R. 8,420 5,749 6,563 3,930 17,944 Lower Choptank R. 22,141 10,979 6,458 11,849 14,911 Tred Avon R. 4,007 2,403 889 2,704 10,587 Broad Cr. 67,375 32,063 32,516 32,295 21,828 Harris Cr. 7,072 2,704 3,901 5,240 7,825 Total Choptank R. Region 109,207 53,940 50,456 56,201 82,332 Little Choptank R. 2,027 2,048 453 246 11,138 Upper Tangier Sound 64,305 35,521 33,322 22,060 17,753 Lower Tangier Sound 28,269 9,471 7,244 2,806 14,003 Honga R. 13,241 11,114 2,051 925 7,646 Fishing Bay 20,195 13,608 7,441 5,728 14,442 Nanticoke R. 7,095 7,430 8,017 4,201 7,246 Wicomico R. 10,122 4,735 1,044 939 1,376 Manokin R. 1,431 1,128 1,914 1,045 3,372 Big Annemessex R. 4,037 473 90 74 240 Pocomoke Sound 10,261 6,131 5,269 2,166 5,269 Total Tangier Sound Region 158,956 89,611 66,392 39,943 71,345 Patuxent R. 50,048 22,669 9,446 9,290 12,497 Wicomico R., St. Clement and Breton bays 5,596 5,130 891 1,160 10,056
St. Mary’s R. and Smith Cr. 10,537 8,716 18,759 12,371 8,760 Total Potomac Md. Tribs. 16,133 13,846 19,650 13,531 18,796 Total Maryland (bu.)1 383,534 224,758 182,310 145,161 291,130
1 Includes harvests from unidentified regions.
(Return to Text)

58
Table 7a. Bushels of oyster harvest by gear type in Maryland, 1989-90 through 2018-19 seasons. Dockside value is in millions of dollars.
Season Hand Tongs Diver Patent Tongs
Power Dredge Skipjack Total
Harvest1 Dockside
Value 1989-90 309,723 47,861 31,307 11,424 14,007 414,445 $ 9.9 M 1990-91 219,510 74,333 105,825 4,080 14,555 418,393 $ 9.4 M 1991-92 124,038 53,232 108,123 6,344 31,165 323,189 $ 6.4 M 1992-93 71,929 24,968 18,074 1,997 8,821 123,618 $ 2.6 M 1993-94 47,309 19,589 11,644 787 133 79,618 $ 1.4 M 1994-95 99,853 29,073 31,388 1,816 2,410 164,641 $ 3.2 M 1995-96 115,677 25,657 46,040 6,347 7,630 199,798 $ 3.2 M 1996-97 130,861 16,780 15,716 8,448 6,088 177,600 $ 3.8 M 1997-98 191,079 37,477 30,340 14,937 10,543 284,980 $ 5.7 M 1998-99 294,342 58,837 36,151 25,541 8,773 423,219 $ 7.8 M 1999-2000 237,892 60,547 44,524 18,131 12,194 380,675 $ 7.2 M 2000-01 193,259 75,535 43,233 18,336 8,820 347,968 $ 6.8 M 2001-02 62,358 30,284 26,848 17,574 8,322 148,155 $ 2.9 M 2002-03 11,508 9,745 18,627 12,386 2,432 55,840 $ 1.6 M 2003-04 1,561 5,422 3,867 13,436 1,728 26,471 $ 0.7 M 2004-05 5,438 14,258 6,548 37,641 4,000 72,218 $ 1.1 M 2005-06 28,098 38,460 49,227 30,824 3,576 154,436 $ 4.7 M 2006-07 55,906 36,271 31,535 35,125 3,250 165,059 $ 5.0 M 2007-08 24,175 11,745 15,997 25,324 4,243 82,958 $ 2.6 M 2008-09 11,274 9,941 15,833 50,628 5,370 101,141 $ 2.7 M 2009-10 7,697 6,609 48,969 107,952 12,479 185,245 $4.5 M 2010-11 13,234 5,927 27,780 65,445 10,550 123,613 $4.3 M 2011-12 4,885 12,382 22,675 84,950 11,305 137,317 $4.6M 2012-13 53,622 8,107 48,095 212,837 18,471 341,132 $10.9 M 2013-14 67,093 21,510 75,937 242,964 9,074 416,578 $14.1 M 2014-15 57,289 25,126 98,187 154,716 33,518 388,658 $17.1 M 2015-16 71,296 31,110 91,852 107,781 32,815 383,534 $14.9 M 2016-17 45,929 24,434 52,740 80,586 17,724 224,758 $10.6 M 2017-18 35,717 14,787 26,673 61,882 19,161 182,310 $8.7 M 2018-19 35,574 11,461 21,532 64,073 12,487 145,161 $6.6 M
1 Harvest reports without gear information were not included in harvest by gear type totals but were included in total harvest.
(Return to Text)

59
Table 7b. Percent of oyster harvest by gear type in Maryland, 1989-90 through 2018-19 seasons. Some years may not total 100% due to incomplete data.
Season Hand Tongs Diver Patent Tongs Power Dredge Skipjack 1989-90 75 12 8 3 3 1990-91 52 18 25 1 3 1991-92 38 16 33 2 10 1992-93 57 20 14 2 7 1993-94 60 25 15 <1 <1 1994-95 61 18 19 1 1 1995-96 57 13 23 3 4 1996-97 74 9 9 5 3 1997-98 67 13 11 5 4 1998-99 69 14 9 6 2 1999-2000 62 16 12 5 3 2000-01 56 22 12 5 3 2001-02 41 20 18 12 6 2002-03 21 17 33 22 4 2003-04 6 20 15 51 7 2004-05 8 20 9 52 6 2005-06 18 25 32 20 2 2006-07 34 22 19 21 2 2007-08 29 14 19 30 5 2008-09 12 11 17 54 6 2009-10 4 4 26 58 7 2010-11 11 5 23 53 8 2011-12 4 9 17 62 8 2012-13 16 2 14 62 5 2013-14 16 5 18 58 2 2014-15 16 7 27 42 9 2015-16 21 9 27 32 10 2016-17 20 11 23 36 8 2017-18 23 9 17 39 12 2018-19 25 8 15 44 9
(Return to Text)

60
Table 8. Oyster bars within sanctuaries sampled during the 2019 Fall Survey.
Region Oyster Sanctuary Surveyed Bars Within Sanctuary Upper Bay Man O War/Gales Lump Man O War Shoals
Middle Bay Poplar Island Poplar I. Herring Bay Holland Pt.1,2 Calvert Shore Flag Pond1,2
Lower Bay Lower Mainstem East Northwest Middleground Cedar Point Cedar Point Hollow Point Lookout Pt. Lookout
Chester River
Lower Chester River Love Pt., Strong Bay, Wickes Beach
Upper Chester River Boathouse, Cliff, Drum Pt., Ebb Pt., Emory Hollow, Old Field2, Sheep, Spaniard Pt.
Chester ORA Zone A Shippen Creek
Eastern Bay Mill Hill Mill Hill Cox Creek Ringold Middleground
Wye River Wye River Bruffs I. 1,2, Mills, Race Horse, Whetstone, Wye River Middleground
Miles River Miles River Long Pt. 2
Choptank River
Cook Point Cook Pt. 1,2 Lower Choptank River Chlora Pt. Sandy Hill Sandy Hill1,2, Hambrooks Howell Point - Beacons Beacons
Upper Choptank River Green Marsh, Shoal Creek, Bolingbroke Sand, The Black Buoy, Oyster Shell Pt. 2, Dixon, Mill Dam
Choptank ORA Zone A Tanners Patch, Cabin Creek, Drum Pt. Harris Creek Harris Creek Change, Mill Pt. 1, Seths Pt., Walnut, Little Neck, Rabbit I.
Tred Avon River Tred Avon River Pecks Pt., Mares Pt., Louis Cove, Orem, Double Mills1,2, Maxmore Add. 1
Little Choptank River Little Choptank River Little Pollard, Susquehanna, Cason1,2, Butterpot, McKeils Pt.,
Grapevine, Town, Pattison Hooper Straits Hooper Straits Applegarth, Lighthouse
Nanticoke River Nanticoke River Roaring Pt. East, Wilson Shoals2, Bean Shoal, Cherry Tree, Cedar Shoal, Old Woman’s Patch, Hickory Nut, Wetipquin1
Manokin River Manokin River Piney I. Swash, Mine Creek, Marshy I., Drum Pt. 1, Georges1,2 Tangier Sound Somerset Piney I. East Add. 1 Severn River Severn River Chinks Pt.
Patuxent River Upper Patuxent Thomas, Broad Neck, Trent Hall, Buzzard I., Holland Pt. Neal Addition Neale
St. Marys River St. Marys River Pagan1,2, Horseshoe Breton Bay Breton Bay Black Walnut1
1 Key Spat Bar 2 Disease/Biomass Index Bar
(Return to Text)
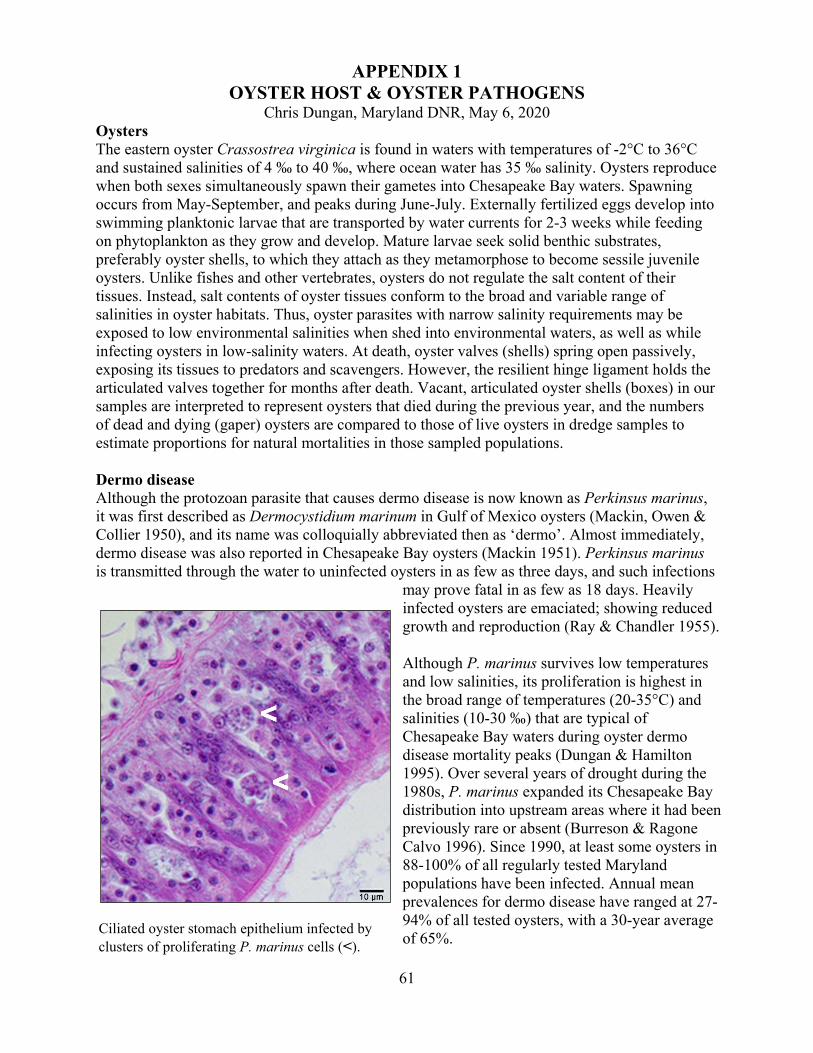
61
APPENDIX 1 OYSTER HOST & OYSTER PATHOGENS
Chris Dungan, Maryland DNR, May 6, 2020 Oysters The eastern oyster Crassostrea virginica is found in waters with temperatures of -2°C to 36°C and sustained salinities of 4 ‰ to 40 ‰, where ocean water has 35 ‰ salinity. Oysters reproduce when both sexes simultaneously spawn their gametes into Chesapeake Bay waters. Spawning occurs from May-September, and peaks during June-July. Externally fertilized eggs develop into swimming planktonic larvae that are transported by water currents for 2-3 weeks while feeding on phytoplankton as they grow and develop. Mature larvae seek solid benthic substrates, preferably oyster shells, to which they attach as they metamorphose to become sessile juvenile oysters. Unlike fishes and other vertebrates, oysters do not regulate the salt content of their tissues. Instead, salt contents of oyster tissues conform to the broad and variable range of salinities in oyster habitats. Thus, oyster parasites with narrow salinity requirements may be exposed to low environmental salinities when shed into environmental waters, as well as while infecting oysters in low-salinity waters. At death, oyster valves (shells) spring open passively, exposing its tissues to predators and scavengers. However, the resilient hinge ligament holds the articulated valves together for months after death. Vacant, articulated oyster shells (boxes) in our samples are interpreted to represent oysters that died during the previous year, and the numbers of dead and dying (gaper) oysters are compared to those of live oysters in dredge samples to estimate proportions for natural mortalities in those sampled populations. Dermo disease Although the protozoan parasite that causes dermo disease is now known as Perkinsus marinus, it was first described as Dermocystidium marinum in Gulf of Mexico oysters (Mackin, Owen & Collier 1950), and its name was colloquially abbreviated then as ‘dermo’. Almost immediately, dermo disease was also reported in Chesapeake Bay oysters (Mackin 1951). Perkinsus marinus is transmitted through the water to uninfected oysters in as few as three days, and such infections
Ciliated oyster stomach epithelium infected by clusters of proliferating P. marinus cells (<).
may prove fatal in as few as 18 days. Heavily infected oysters are emaciated; showing reduced growth and reproduction (Ray & Chandler 1955). Although P. marinus survives low temperatures and low salinities, its proliferation is highest in the broad range of temperatures (20-35°C) and salinities (10-30 ‰) that are typical of Chesapeake Bay waters during oyster dermo disease mortality peaks (Dungan & Hamilton 1995). Over several years of drought during the 1980s, P. marinus expanded its Chesapeake Bay distribution into upstream areas where it had been previously rare or absent (Burreson & Ragone Calvo 1996). Since 1990, at least some oysters in 88-100% of all regularly tested Maryland populations have been infected. Annual mean prevalences for dermo disease have ranged at 27-94% of all tested oysters, with a 30-year average of 65%.

62
MSX disease The high-salinity protozoan oyster pathogen Haplosporidium nelsoni was first detected and described as a multinucleated sphere unknown (MSX) from diseased and dying Delaware Bay
Oyster gill vein with large Haplosporidium nelsoni (MSX) multinucleate plasmodium (>) circulating with smaller hemocyte blood cells.
oysters during 1957 (Haskin et al. 1966), and it also infected oysters in lower Chesapeake Bay during 1959 (Andrews 1968). Although the common location of lightest H. nelsoni infections in oyster gill tissues suggests waterborne transmission of infectious pathogen cells, the complete life cycle and actual infection mechanism of the MSX parasite remain unknown. Despite numerous experimental attempts, MSX disease has rarely been transmitted to uninfected oysters in laboratories. However, captive experimental oysters reared in enzootic waters above 14 ‰ salinity are frequently infected, and may die within 3-6 weeks. In Chesapeake Bay, MSX disease is most active in higher salinity waters with temperatures of 5-20°C (Ewart & Ford 1993). MSX disease prevalences typically peak during June, and deaths from such infections peak during August. In Maryland waters, annual average prevalences for MSX disease have ranged at 0.1-28%, with a 30-year average of 6%.
Since MSX disease is rare in oysters from waters below 10 ‰ salinity, the distribution of H. nelsoni in Chesapeake Bay varies as salinities change with variable freshwater inflows. During an extended drought of 1999-2002, consistently low freshwater inflows raised salinities of Chesapeake Bay waters to foster upstream range expansions by MSX disease during each successive drought year (Tarnowski 2003). The geographic range for MSX disease also expanded widely during recent epizootics of 2009 and of 2014-2016. During 2003-2008, 2010-2012, and 2017-2018, freshwater inflows near or above historic averages reduced salinities of upstream Chesapeake Bay waters to dramatically limit the geographic range and effects of MSX disease (Tarnowski 2019). During 2018 and 2019, low water salinities reduced the distribution and the mean prevalence of MSX disease to historic minima.
References
Andrews, J.D. 1968. Oyster mortality studies in Virginia VII. Review of epizootiology and origin of Minchinia nelsoni. Proc. Natl. Shellfish. Assn. 58: 23-36.
Burreson, E.M. and L.M. Ragone Calvo. 1996. Epizootiology of Perkinsus marinus disease in
Chesapeake Bay, with emphasis on data since 1985. J. Shellfish Res. 15: 17-34. Dungan, C.F. and R.M. Hamilton. 1995. Use of a tetrazolium-based cell proliferation assay to
measure effects of in vitro conditions on Perkinsus marinus (Apicomplexa) proliferation. J. Eukaryot. Microbiol. 42: 379-388.

63
Ewart, J.W. and S.E. Ford. 1993. History and impact of MSX and dermo diseases on oyster
stocks in the Northeast region. NRAC Fact Sheet No. 200, 8 pp. Univ. of Massachusetts, North Dartmouth, Ma.
Haskin, H.H., L.A. Stauber, and J.G. Mackin. 1966. Minchinia nelsoni n. sp. (Haplosporida,
Haplosporidiidae): causative agent of the Delaware Bay oyster epizootic. Science 153: 1414-1416.
Ray, S.M. and A.C. Chandler. 1955. Parasitological reviews: Dermocystidium marinum, a
parasite of oysters. Exptl. Parasitol. 4: 172-200. Mackin, J.G., H.M. Owen, and A. Collier. 1950. Preliminary note on the occurrence of a new
protistan parasite, Dermocystidium marinum n. sp. in Crassostrea virginica (Gmelin). Science 111: 328-329.44
Mackin, J.G. 1951. Histopathology of infection of Crassostrea virginica (Gmelin) by
Dermocystidium marinum Mackin, Owen, and Collier. Bull Mar. Sci. Gulf and Caribbean 1: 72-87.
Tarnowski, M. 2003. Maryland Oyster Population Status Report: 2002 Fall Survey. Maryland
Department of Natural Resources, Annapolis, MD. 32 pp. dnr.maryland.gov/fisheries/Pages/shellfish-monitoring/reports.aspx
Tarnowski, M. 2019. Maryland Oyster Population Status Report: 2018 Fall Survey. Maryland
Department of Natural Resources Publ. No. 17-070819. Annapolis, MD. 69 pp. dnr.maryland.gov/fisheries/Pages/shellfish-monitoring/reports.aspx

64
APPENDIX 2 GLOSSARY
box oyster Pairs of empty shells joined together by their hinge ligaments. These remain
articulated for months after the death of an oyster, providing a durable estimator of recent oyster mortality (see gaper). Recent boxes are those with no or little fouling or sedimentation inside the shells, generally considered to have died within the previous two to four weeks. Old boxes have heavier fouling or sedimentation inside the shells and the hinge ligament is generally weaker.
bushel Unit of volume used to measure oyster catches. The official Maryland bushel is
equal to 2,800.9 cu. in., or 1.0194 times the U.S. standard bushel (heaped) and 1.3025 times the U.S. standard bushel (level).
(Return to Text) cultch Hard substrate, such as oyster shells, spread on oyster grounds for the attachment
of spat. dermo disease The oyster disease caused by the protozoan pathogen Perkinsus marinus. dredged shell Oyster shell dredged from buried ancient (3000+ years old) shell deposits. Since
1960 this shell has been the backbone of the Maryland shell planting efforts to produce seed oysters and restore oyster bars.
fresh shell Oyster shells from shucked oysters. It is used to supplement the dredged shell
plantings. gaper Dead or moribund oyster with gaping valves and tissue still present (see box
oyster). Haplosporidium The protozoan oyster parasite that causes MSX disease. nelsoni infection intensity, Perkinsus sp. parasite burdens of individual oysters, estimated by RFTM individual assays and categorized on an eight-point scale. Uninfected oysters are ranked 0,
heaviest infections are ranked 7, and intermediate-intensity infections are ranked 1-6. Oysters with infection intensities of 5 or greater are predicted to die imminently.
infection intensity, Averaged categorical infection intensity for all oysters in a sample: mean sample sum of all categorical infection intensities (0-7) ÷
number of sample oysters Oyster populations whose samples show mean infection intensities of 3.0 or greater are predicted to experience significant near-term mortalities.
infection intensity, Average of mean intensities for annual survey samples from constant mean annual sites: sum of all sample mean intensities ÷ number of annual samples intensity index, Categorical infection intensities averaged only for infected oysters: sample sum of individual infection intensities(1-7) ÷
number of infected oysters

65
intensity index, Categorical infection intensities averaged for all infected survey oysters: annual sum of all sample intensity indices ÷ number of annual samples market oyster An oyster measuring 3 inches (76 mm) or more from hinge to mouth (ventral
margin). MSX disease The oyster disease caused by the protozoan pathogen Haplosporidium nelsoni. MSX % frequency, Percent proportion of sampled populations infected by H. nelsoni (MSX): annual 100 x (number of sample with MSX infections ÷ total sample number) observed mortality, Percent proportion of annual, natural oyster population mortality sample estimated by dividing the number of dead oysters (boxes and gapers) by the sum
of live and dead oysters in a sample: 100 x [number of boxes and gapers ÷ (number of boxes and gapers + number of live)] observed mortality, Percent proportion of annual, bay-wide, natural oyster mortality annual estimated by averaging population mortality estimates from the 43 Disease Bar
(DB) samples collected during an annual survey: sum of sample mortality estimates ÷ 43 DB samples Perkinsus marinus The protozoan oyster parasite that causes dermo disease. prevalence, Percent proportion of infected oysters in a sample: sample 100 x (number infected ÷ number examined) prevalence, Percent proportion of infected oysters in an annual survey: mean annual sum of sample percent prevalences ÷ number of samples RFTM assay Ray’s fluid thioglycollate medium assay. Method for enlargement, detection, and
enumeration of Perkinsus marinus cells in oyster tissue samples. This diagnostic assay for dermo disease has been widely used and refined for over sixty years to date.
seed oysters Young oysters produced by planting shell as a substrate for oyster larvae to settle
on in historically productive areas. If the spatfall is adequate, the seed oysters are subsequently transplanted to growout (seed planting) areas, generally during the following spring.
small oyster An oyster equal to or greater than one year old but less than 3 inches (see market
oyster, spat). spat Oysters younger than one year old. spatfall, spatset, The process by which swimming oyster larvae attach to a hard set substrate such as oyster shell. During this process the larvae undergo
metamorphosis, adopting the adult form and habit. spatfall intensity, The number of spat per bushel of cultch. This is a relative measure of oyster spat

66
sample site density at a specific location, which may be used to calculate the annual spatfall intensity index.
spatfall intensity The arithmetic mean of spatfall intensities from 53 fixed reference sites index or Key Bars: sum of Key Bar spatfall intensities ÷ number of Key Bars spatfall intensity The median of spatfall intensities from 53 fixed reference sites (Key Bars). index, annual median spatfall intensity The median of the spatfall intensity indices over the time series. index, long-term median
(Return to Text)