the value of health data to dairy farmers in the united states · the value of health data to dairy...
TRANSCRIPT
The value of health data to dairy farmers in the United States
J.S. Clay 1, K.L. Parker Gaddis 2 and C. Maltecca 2
1 Dairy Records Management Systems2 Dept of Animal Science, North Carolina State University
Raleigh, NC, USA

Recording health events in U.S.
• No mandated or structured system • Mostly captured in on-farm herd management software• Not aggregated in a central location
– Typically for backup purposes– Farmers fear loss of confidentiality if data were
delivered to government databases

Dairy Records Management Systems
• 1 of 4 Dairy Records Processing Centers in U.S.• Edit and process DHIA records• Deliver management reports and data files• Software for on-farm, web and handhelds
• 19 dairy farmer cooperatives • 38 labs• 780 field technicians• 14,000 herds• 2.2m cows (49% of U.S. DHIA cows)

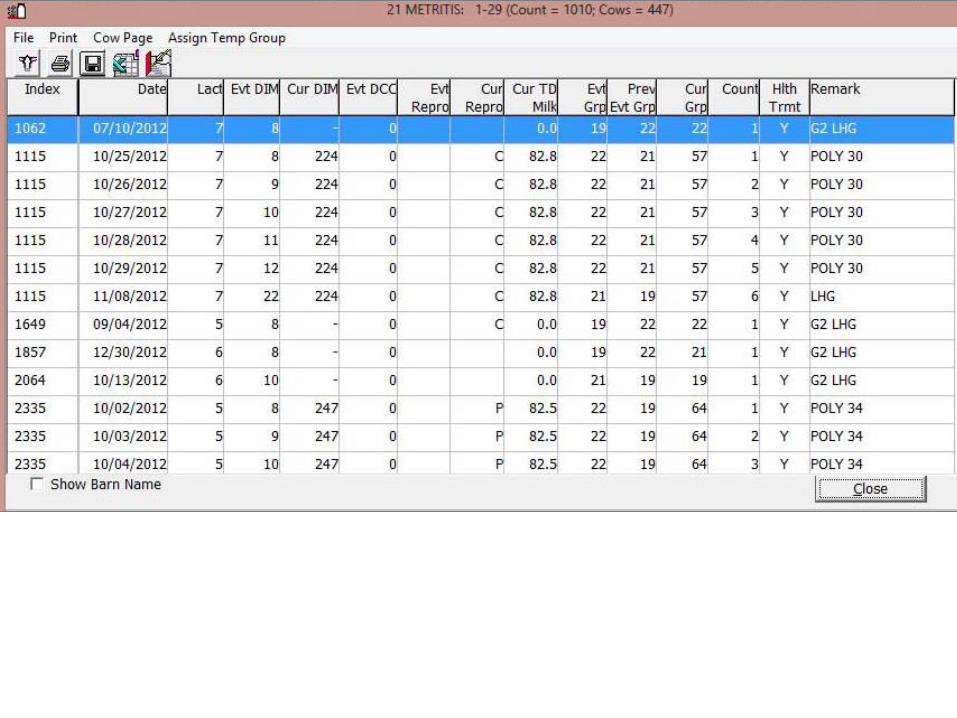
PCDART from DRMS
• User defined conditions and flexible input• 4-character mnemonic and 12-character description
KETO = ketosisMAST = mastitis
• Currently 3250 herds with 850K cows • Currently 1100 herds using PocketDairy for
cow-side entry

SOP for retained placenta
Severe: Depressed, off-feed, declining milk production, fever. Contact veterinary staff for exam – follow instructions.
Intermediate: Bright and alert, eating well, milk production stable or increasing, fever.Initiate antibiotic therapy. Excenel SQ
Mild: Bright and alert, no fever, eating well, milk production increasing, but cow has retained placenta.Initiate antibiotic therapy after 48 hours postp. Excede SQ-BOE, or Excenel SQ. Continue to monitor cow for clinical signs.
Mild and Intermediate: If placenta is still retained after 96 hours, vaginal area will be washed and gentle manual traction will be applied to remove placenta. Repeat as needed until placenta is removed.

On-farm applications of health data
• Day-to-day management of individuals• Cowpage• Action lists
• Assessments to:• Understand relationships with mgt conditions• Reduce impact on individual cows• Improve profitability• Improve cow comfort


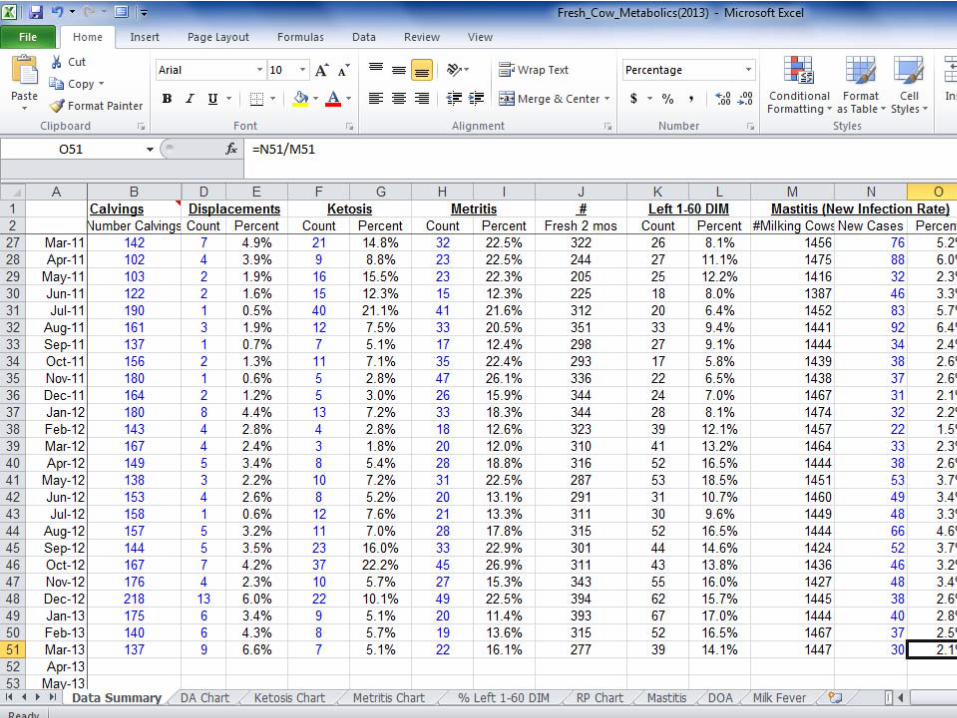
Assessments…
• Start at top-level perspective with overview• Segmentation by lot, lactation #, stage of lactation, etc.• Graphs• Drilldown to individual cows


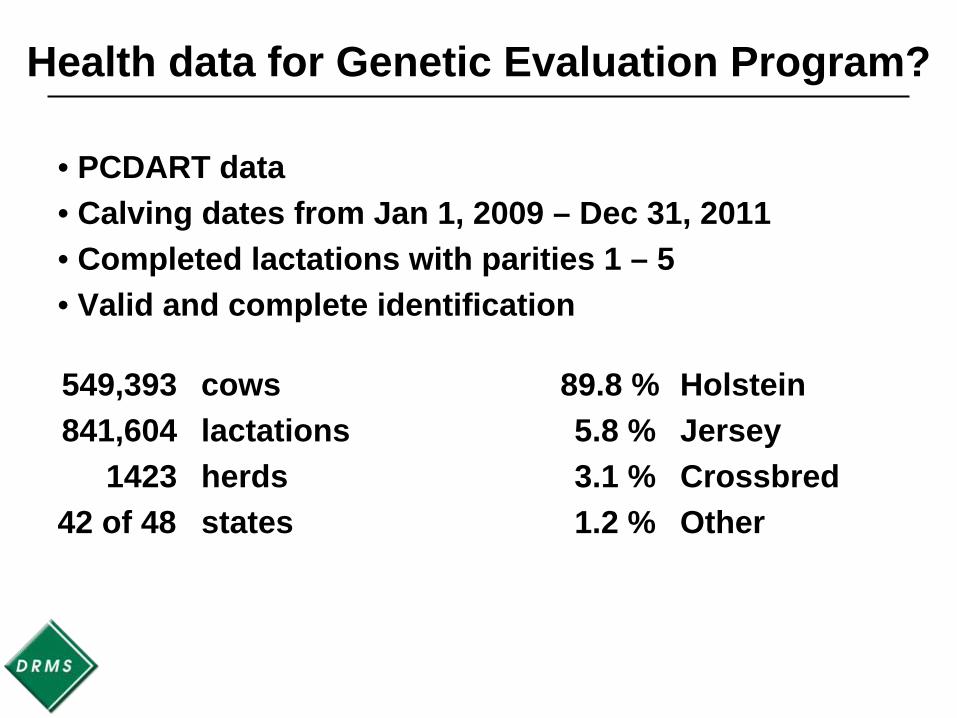
Health data for Genetic Evaluation Program?
• PCDART data• Calving dates from Jan 1, 2009 – Dec 31, 2011• Completed lactations with parities 1 – 5• Valid and complete identification
89.8 % Holstein5.8 % Jersey3.1 % Crossbred1.2 % Other
549,393 cows841,604 lactations
1423 herds42 of 48 states
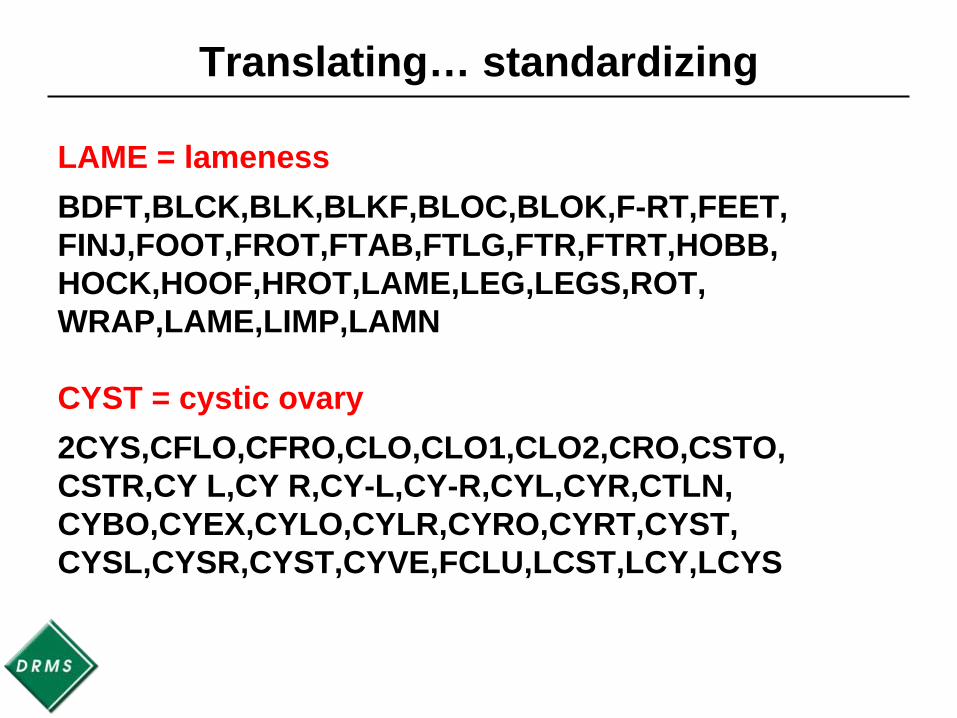
Translating… standardizing
LAME = lamenessBDFT,BLCK,BLK,BLKF,BLOC,BLOK,F-RT,FEET,FINJ,FOOT,FROT,FTAB,FTLG,FTR,FTRT,HOBB,HOCK,HOOF,HROT,LAME,LEG,LEGS,ROT,WRAP,LAME,LIMP,LAMN
CYST = cystic ovary2CYS,CFLO,CFRO,CLO,CLO1,CLO2,CRO,CSTO,CSTR,CY L,CY R,CY-L,CY-R,CYL,CYR,CTLN,CYBO,CYEX,CYLO,CYLR,CYRO,CYRT,CYST,CYSL,CYSR,CYST,CYVE,FCLU,LCST,LCY,LCYS

Herd characteristics
ServSize # Preg Died Sire
(# cows) Herds Cows Milk SCS rate (%) NM€ < 100 308 76 9,224 2.6 17 6.4 268
100 - 499 864 227 10,280 2.5 19 6.2 301500 - 999 173 689 10,816 2.4 20 6.8 317
> 1000 78 1954 10,594 2.3 20 5.8 305Total / Avg 1423 346 10,134 2.5 18 6.3 296

Disease edits
4,659,600 health events Jan 1, 2009 – Dec 31, 2012- 34 most common diseases- Parities 1 – 5- Within 365 d of calving- 1 incidence and 5 cows in Herd-Yr- On PCDART for 2 calendar years
• 2,029,263 resulting health events

13 diseases with most # cases
Health event Herds Lactations CasesLAME = lameness 550 468,274 59,922MAST = mastitis 758 570,225 59,660METR = metritis 654 540,991 45,740CYST = cystic ovary 563 322,887 18,254REPR = other repro prob. 141 155,100 14,427RETP = retained placenta 530 436,138 11,638JOHN = Johne's 68 60,160 10,748KETO = ketosis 269 290,329 10,536DIGE = digestive prob. 336 318,106 9,653WART = hairy heel wart 56 80,811 7,458CALC = hypocalcemia 455 361,183 7,339RESP = respiratory 354 342,985 6,439D.A. = displaced aboma. 439 409,836 5,859

12 diseases with least # cases
Health event Herds Lactations CasesDIAR = diarrhea/BVD 47 63,480 4,298DYST = dystocia 191 179,551 3,134INFU = mammary infusion 34 18,733 2,738ABRT = abortion 456 334,214 2,462ABCS = abscess 45 58,721 1,967CLOS = clostridium 20 21,971 1,720EDEM = udder edema 49 60,564 1,525SULC = stomach ulcer 20 28,039 1,248PNEU = pneumonia 42 53,585 713BLDM = bloody milk 24 35,667 664PEYE = pink eye 63 56,544 286DOWN = downer 42 53,057 242
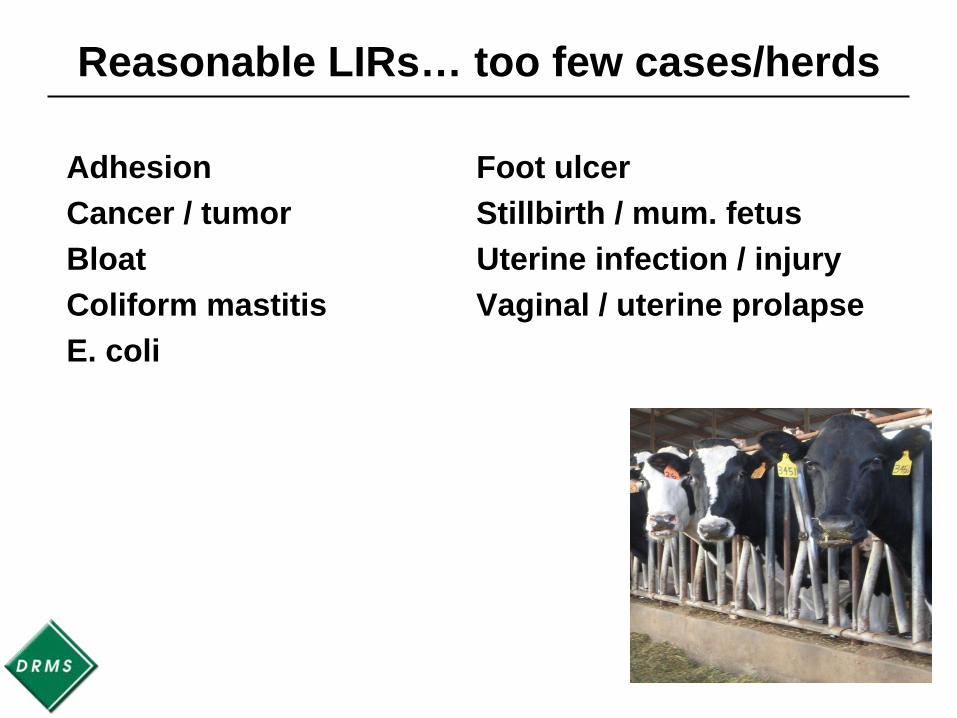
Reasonable LIRs… too few cases/herds
Adhesion Foot ulcerCancer / tumor Stillbirth / mum. fetusBloat Uterine infection / injuryColiform mastitis Vaginal / uterine prolapseE. coli

Lactation incidence rates (%)Lact
Health event Lact# LIR% MeanLAME = lameness 1 6.64
2 7.273 8.124 10.375 12.47 8.98
MAST = mastitis 1 8.622 10.183 11.564 13.355 16.30 12.00

Across Lactation LIRs (%)
Health event Lit. Mean S.E.LAME = lameness 9.27 8.98 2.41MAST = mastitis 17.98 12.00 2.97METR = metritis 12.34 8.17 2.14CYST = cystic ovary 9.05 7.32 2.01REPR = other repro prob. 6.27 2.58RETP = retained placenta 8.02 5.49 1.96JOHN = Johne's 11.88 2.82KETO = ketosis 5.07 6.27 2.31DIGE = digestive prob. 2.60 3.84 1.29WART = hairy heel wart 7.64 2.59CALC = hypocalcemia 7.44 5.20 3.44RESP = respiratory 3.30 2.72 0.84D.A. = displaced aboma. 2.67 3.18 0.93
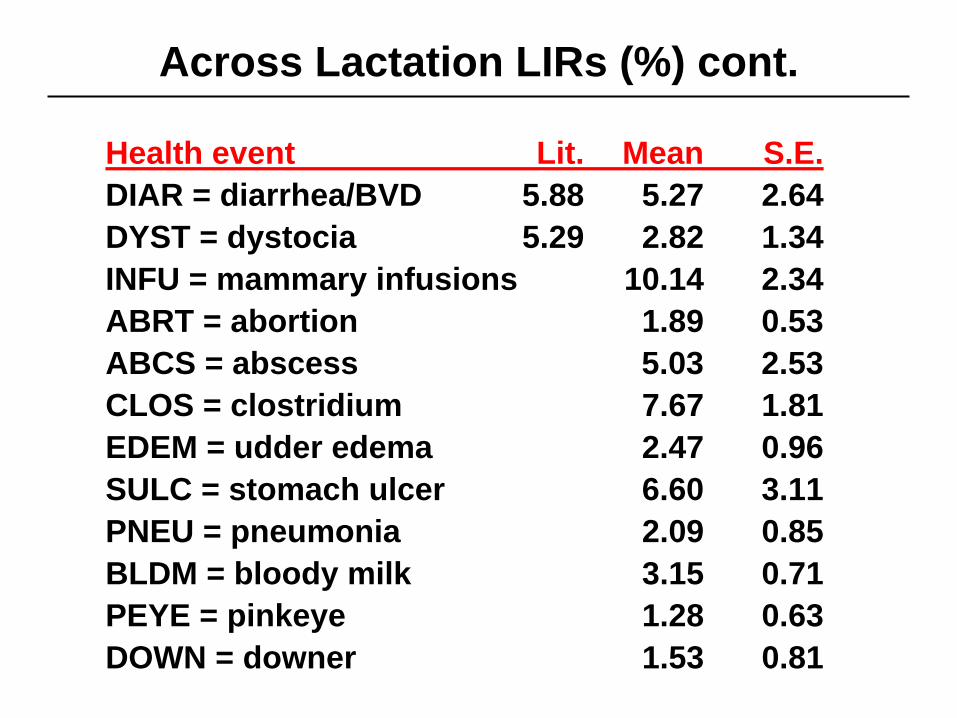
Across Lactation LIRs (%) cont.
Health event Lit. Mean S.E.DIAR = diarrhea/BVD 5.88 5.27 2.64DYST = dystocia 5.29 2.82 1.34INFU = mammary infusions 10.14 2.34ABRT = abortion 1.89 0.53ABCS = abscess 5.03 2.53CLOS = clostridium 7.67 1.81EDEM = udder edema 2.47 0.96SULC = stomach ulcer 6.60 3.11PNEU = pneumonia 2.09 0.85BLDM = bloody milk 3.15 0.71PEYE = pinkeye 1.28 0.63DOWN = downer 1.53 0.81

Do other herds enter events at same rate?
• Another group of herds do not backup at DRMS…• But their health transactions are delivered on test day
• Not a complete backup• Most health events are delivered
• Do they enter health events at the same rate?

Events / year / 100 cowsEvent Event
rate Non- rateBackup backup backup Non-B
Size # herds herds # herds herds< 100 308 106 462 36
100 – 499 864 102 880 49500 – 999 173 191 84 126
> 1000 78 246 26 179Total / Avg 1423 123 1452 52

Conclusions: Health data for the U.S. GEP?
• LIRs are similar to those found in literature• Reasonable quantities of data are available • Educational efforts can improve quality and quantity
• Define, explain and encourage SOPs• Data will become available when confidentiality
protections are assured

Questions?