the use of intellectual property in chilebhhall/papers/abudfinkhallhelmers13... · 1 the use of...
TRANSCRIPT

1
The Use of Intellectual Property in Chile
INAPI-WIPO
March 2013
PreparedbyMariaJoseAbud,CarstenFink,BronwynHall,andChristianHelmers.ThestudyhasbenefitedfromcommentsfromCarmenPazAlvarez,GustavoCrespi,AisénEtcheverry,AdanGonzalez,MaríaCatalinaOlivos,MaximilianoSantaCruz,NicolasSchubert,LuzSosa,andPilarTrivelli.
2
ContentsExecutive Summary ................................................................................................................................. 4
1. Introduction ....................................................................................................................................... 7
2. The IP system in Chile ....................................................................................................................... 10
3. Overall trends .................................................................................................................................... 14
4. Origin of applications ....................................................................................................................... 18
5. Applicant distribution....................................................................................................................... 20
6. Applicant types ................................................................................................................................. 24
7. Filings by technology and class ........................................................................................................ 26
8. Grant ratios and lags ......................................................................................................................... 31
9. IP bundles ......................................................................................................................................... 35
10. Co‐assignment of patents .............................................................................................................. 37
11. Patent filings abroad ...................................................................................................................... 40
12. A closer look at trademark activity ................................................................................................ 45
13. Conclusion ...................................................................................................................................... 51
References ............................................................................................................................................ 54
Appendix 1: The IP system in Chile ....................................................................................................... 55
Appendix 1.1: Application Procedure for Trademarks...................................................................... 55
Appendix 1.2: Intellectual Property Rights Enforcement ................................................................. 56
Appendix 1.3: Restrictions on patentability ...................................................................................... 57
Appendix 1.4: Application procedure for patents, utility models, industrial designs, drawings and
integrated circuit topographies ........................................................................................................ 59
Appendix 2: The INAPI‐WIPO Intellectual Property database .............................................................. 62
Appendix 2.1 Introduction ................................................................................................................ 62
Appendix 2.2 Description of the Raw Data ....................................................................................... 62
2.2.1 Characteristics of the raw data ............................................................................................ 62
Appendix 2.3 Data challenges ........................................................................................................... 63
2.3.1 Identification of unique RUT for each applicant .................................................................. 64
2.3.2. Identification of unique RUT for each applicant ................................................................. 65
Appendix 2.4 Data Base Design ........................................................................................................ 66
2.4.1 Trademark Data ................................................................................................................... 66
3
2.4.2 Patent Data .......................................................................................................................... 68
Appendix 2.5 Combining Trademark and Patent Data ..................................................................... 69
Appendix 2.6 Trademark Data .............................................................................................................. 72
2.6.1 Nice classes .......................................................................................................................... 72
2.6.2 Priority information ............................................................................................................. 72
2.6.3 Trademark type and use ...................................................................................................... 72
2.6.4 Application, publication and registration date .................................................................... 72
2.6.5 Legal status .......................................................................................................................... 73
Appendix 2.7 Patent Data ..................................................................................................................... 73
2.7.1 IPCs ....................................................................................................................................... 73
2.7.2 Priority Information ............................................................................................................. 74
2.7.3 Application, grant, and lapse date ....................................................................................... 74
2.7.4 Legal Status .......................................................................................................................... 74
4
ExecutiveSummaryThepastdecadeshaveseenprofoundchangesintheuseoftheintellectualproperty(IP)systemworldwide. Severalforceshavedriventhesechanges. First, investmentinthecreation of intangible assets has markedly increased. Second, the increasedinternational integrationofnational economieshasprompted companies toobtain IPprotectionmoreoften inmultiple jurisdictions, including anumberofmiddle incomeeconomies. Third, national intellectual property policies have undergone substantialreforms. Fourth, technological advances and evolving business models – driven bytechnological opportunities, complexity and competitive pressures – have ledcompanies to adapt their innovation management, often leading to more active IPmanagementandfilingstrategies.TheresultingchangesintheIPlandscapeshavepromptednumerousnewquestionsonthe role that the IP system plays in the innovation process. So far the economicsliterature has heavily focused on high income countries and does not provide muchevidence on the role of IP in middle income economies. There appear to be twounderlying reasons. First, in absolute terms, these countries have seen the largestincreases in IP use and questions of IP protection have gathered considerable publicinterest.Second,effortsbyIPofficesinhighincomecountriesandacademicresearchershave led to the creation of micro‐level patent and trademark databases that haveenabled a wide range of empirical investigations. To date, no comparable datainfrastructureexistsformiddleincomeeconomies.ThisstudyreportsontheoutcomeofajointeffortbytheNationalIndustrialPropertyInstituteofChile (INAPI)and theWorld IntellectualPropertyOrganization (WIPO) tobuild a comprehensive database on the use of IP in Chile. This database contains allpatent,trademark,utilitymodel,andregistereddesignfilingsforChileovertheperiod1991‐2010. One key contribution of the data construction work was to harmonizeapplicantnamesanduniquely identifyapplicants forall four formsof IP. Inaddition,the datawerematched to firm‐level data of the National Statistical Institute (INE) –specifically,themanufacturingcensus(ENIA)aswellasfivewaves(1997‐2008)oftheChileaninnovationsurvey(INNOVACION).ChileoffersaninterestingsettingtostudytheroleofIPintheinnovationprocessofamiddle income economy. Chile has achieved considerable economic growth over thepast decades, but still relies heavily on commodities and agricultural products as itsexport base. Chile has also proactively integrated into theworld economy through alarge number of bilateral and regional trade agreements. It has modified its IP lawseveral times during the past two decades, strengthening IP protection significantly.Chile also has a large number of research active universities. Shifting the sources ofeconomicgrowthtowardsnewsectorsandgainsineconomy‐wideproductivitythroughinnovationisanimportantimperativeforChileanpolicymakers. Thenewdatabase–henceforththeINAPI‐WIPOdatabase–enablesnewinvestigationsthat candeepenourunderstandingof the role thatpatentsplay inChile’s innovation
5
systemandexplorenewquestionsthathavenotbeenconsideredsofar.Asafirststep,thispaperprovidesadescriptiveoverviewofIPuseinChile.OuranalysisshowsthatthenumberofpatentfilingshasmorethantripledsincetheIPlaw was enacted in 1991. Nevertheless, like in most other middle income countries,patentuseasreflectedinthetotalnumberof filings–slightlyover3,000in2008– isstill relativelymodest. In contrast, trademarks are used intensively. Filings increasedfromslightlylessthan30,000peryearin1991tomorethan44,000in2010.ThisputsChile among the top trademarking countries relative to GDP worldwide. The use ofutilitymodels and industrial designs remains low throughout the two decades, evenrelativetocountriesofsimilarincomelevels.Our data reveal that non‐residents file over 90% of patents in Chile. Multinationalpharmaceutical and chemical companies file most of these patents – in contrast todevelopedcountries,whereso‐calledcomplex technology industriesaccount formostpatent filings. Industrialdesignsarealsooverwhelminglyusedbynon‐residents,withonly16%offilingscomingfromresidents.Trademarks,incontrast,areoverwhelminglyfiledbydomesticentitiesandsoareutilitymodels.Trademarksarewidelyusedacrosstheeconomy.Agriculturalproductsaccountforthelargestshareoftrademarkfilings,acategory which includes wine and fruit products. There is also a large share oftrademarksrelatedtopharmaceuticals.The great majority of patents are assigned to companies. However, a considerablenumber of Chilean universities file for patents and they are among the top residentpatentees. Other top resident patentees are companies in the mining industry andchemical and consumer product companies. Trademark filings come from bothcompaniesandindividuals.Incontrasttopatents,severalChileancompaniesareamongthetoptrademarkfilers,mostlycompaniesintheconsumergoodsindustry.Lookingat theoriginofnon‐resident filings, thedata show that thegreatmajorityofnon‐resident filingsacrossall four IP formscome from theUnitedStatesandEurope.Other SouthAmerican countries, in contrast, account foronly a small shareof filings.Forpatentstheyrepresentonly2%ofallfilingsbetween1991and2010,whereastheUS and EU combined account for more than 80% of filings. Pharmaceutical andconsumergoodscompaniesaccountformostofthesepatentfilings.The analysis also looks at the joint use of different IP rights. More than 90% ofapplicants only apply for trademarks and less than 5% of applicants apply only forpatents. Applicants that apply for more than a single type of IP right are rare; theyaccount for only 2% of applicants. The joint use of different IP rights is limited topatentsandtrademarksaswellastrademarksandindustrialdesigns.Abreakdownbyapplicant type shows that a large share of universities files for both patents andtrademarks.Thedatashowthattrademarkscovered,onaverage,in2.5Niceclassesuntil2005.Duetoachange in the law in2005, theaveragenumberofclassesdeclinedsharply to1.3classes in2006.A fall in theaveragenumberofproduct classesexplains thisdecline.Theaveragenumberofservicesclasses, incontrast,steadily increasedovertime.This

6
reflects the nature of the legal change in 2005,which did not affect filings in serviceclasses.The INAPI‐WIPO dataset can identify co‐assignment patterns in patent filings. Co‐assignments are interesting as they reveal underlying research co‐operation betweenuniversitiesand industryaswellasamongproductmarket competitors.Like inothercountries, co‐assignedpatentsaccount forasmall shareofpatent filings inChile–onaverage less than 3% between 1991 and 2010. We find that most patents are co‐assigned among non‐resident companies and in fact there is little evidence forinternational cooperation. The share of co‐assigned patents with resident and non‐residentassigneesisonly8%.Co‐assignmentsinvolvinguniversitiesaccountforaround20%ofco‐assignedpatents,whichsuggestsasignificantamountofuniversity‐industrycollaboration.Finally,weanalyzeinternationalpatentfilingsthathaveatleastoneChileanassigneeorinventor.We show that only a small fraction among resident patentees also files forpatentprotectionabroad.Nevertheless,theshareincreasedfrom2%in1992toaround10% from 2006 onward. The data also show that half of the inventions underlyinginternationalpatentfamiliesassignedtoChileanresidentsoriginateinChile.Themostimportant foreign offices of first filing are theUS and Europe. Other SouthAmericancountries,incontrast,arerarelythejurisdictionoffirstfiling.China,Mexico,andSouthAfrica emerge from 2000 onward as important destinations for patents by Chileanapplicants. International filings by Chilean residents in most jurisdictions aredominatedbypatentsrelatedtothemining industryandchemicalsaswellaspatentsfiledbyuniversities.Overall,thisstudyoffersanexampleofempiricalresearchthatcanbeconductedontheuseofIPinamiddleincomeeconomyonceanappropriatedatainfrastructurehasbeenputinplace.ItalsoshowstheimportanceofincludingotherIPrightsbeyondpatentsinthistypeofanalysisandofanalyzingtheuseofthedifferentformsofIPincombinationratherthanisolation.ThedescriptiveevidenceprovidedinthisstudyprovidesusefulinsightsinbetterunderstandingtheroleofIPinChile’seconomy.Ofcourse,descriptiveevidencecanonlygosofarinfullyevaluatingtheeffectsofIPpolicychoicesonapplicantbehaviorandeconomicperformance.Deeperanalysisonthebasisofthenewlyavailabledatainfrastructureisneeded.Indeed,twoanalyticalstudies–ontheincidenceandeffectsoftrademarksquattingaswellasontheroleofpatentsinthedomesticpharmaceuticalsector–arecurrentlyunderwayandwillbemadeavailableseparately.
7
1.IntroductionThepastdecadeshaveseenprofoundchangesintheuseoftheintellectualproperty(IP)systemworldwide.Severalforceshavedriventhesechanges.First,investmentinthecreationofintangibleassetshasmarkedlyincreased.Forexample,globalR&Dexpenditurealmostdoubledinrealtermsfrom1993to2009.Availabledatasimilarlysuggestrisinginvestmentinotherintangibleassets,suchasdesignsandbranding.1Second,theincreasedinternationalintegrationofnationaleconomies–oftenreferredtoasglobalization–haspromptedintellectualpropertyholderstomorefrequentlyseekprotectionabroadand,indeed,inagreaternumberofcountries.2Third,nationalintellectualpropertypolicieshaveundergonesubstantialreformswithfar‐reachingimplicationsonthebehaviorofIPapplicants.Internationalagreements–notablytheAgreementonTrade‐RelatedAspectsofIntellectualPropertyRights(TRIPS)–havebeenanimportantdriveroflegalreforms.AsaresultdevelopingcountrieshaveseenasignificantstrengtheningofIPrightsoverthepasttwodecades.Therehavealsobeenincreasedeffortstowardstheharmonizationofproceduralstandardsandthecreationofregionalandinternationalfilingsystems.Technologicaladvanceshaveoftencontributedtolegalreforms,astheycreatedtheneedtoadaptIPpoliciestotheevolvingnatureoftechnologicalprogress.Finally,evolvingbusinessmodels–drivenbytechnologicalopportunitiesandcompetitivepressures–haveledcompaniestoadapttheirinnovationmanagementstrategies,importantlyaffectingthewaytheyusetheIPsystem.TheshiftingIPlandscapeshavepromptednumerousnewquestionsontherolethattheIPsystemplaysintheinnovationprocess.Forexample,howimportantaredifferentIPrightsforfirmstoappropriatereturnstoinvestmentsinnewtechnologyfields?Howdodensepatentlandscapesforcomplextechnologiesaffectinnovativebehaviorandcommercializationstrategies?HowcanIPofficesbestmanagethegrowinginflowsofapplicationsandpromotethedeliveryofqualityservices?Aricheconomicliteraturehasemergedthatoffersimportantempiricalperspectivesontheseandotherquestions.3However,thisliteratureheavilyfocusesonhighincomecountriesand,morerecently,alsoChina.Thisfocusappearstohavetwounderlyingreasons.First,inabsoluteterms,thesecountrieshaveseenthelargestincreasesinIPuseandquestionsofIPprotectionhavegatheredconsiderablepublicinterest.Second,effortsbyIPofficesinhighincomecountriesandacademicresearchershaveledtothecreationofmicro‐levelIPdatabasesthathaveenabledawiderangeofempiricalinvestigations.ThepatentdatabasespublishedbytheNationalBureauofEconomicResearch(NBER)intheUnitedStatesandthePatstatdatabasepublishedbythe
1SeeWIPO(2011a)forareviewoftheavailableevidence.2WIPO(2011b),forexample,showsthatinternationalfilingshavecontributedsubstantiallytothegrowthinpatentapplicationsworldwide.3Chapter2inWIPO(2011a)reviewssomeofthemostimportantstudiesinthefieldofpatents.
8
EuropeanPatentOffice(EPO)aregoodexamplesofsuchefforts.4AdditionaleffortstocombineIPdatawithmicro‐levelinformationonfirmperformanceandinventorbehaviorhavefurtherenrichedthedatainfrastructureavailabletoresearchers.Equivalentstudiesonmiddleincomecountries–exceptChina–remainscarce.5However,suchstudiesareofgreatinterest.ManymiddleincomeeconomieshavesimilarlyseenrapidgrowthinIPuse,oftendrivenbybothforeignanddomesticfilings,eveniftheabsolutenumbersremainsmallinaworldwidecontext.6Relativetothesizeoftheireconomies,certainmiddleincomecountriesevenseemoreintensiveuseofIP–especiallytrademarks–thanmosthighincomecountries.Manymiddleincomeeconomieshavebeenabletoigniteeconomicgrowthonthebackoflowwages,naturalresources,oracombinationofboth.Astheseeconomiescontinuetodevelop,theymaybeginorintensifythedevelopmentofinnovationdomestically.ThequestioniswhichroleIPcanplayinthisprocess–whetheritisgenerateddomesticallyorabroad.7Thedifferentstructureofmiddleincomeeconomies,theevolvingnatureofinnovativeactivity,andtheinstitutionalcontextsuggestthatthisrolediffersfromthatinhighincomeeconomies.PolicymakersinmiddleincomecountriesthuscannotrelyexclusivelyontheevidencegeneratedinadvancedeconomiesindesigningIPandinnovationpolicies.Theystandtobenefitfromempiricalresearchspecifictotheireconomies.OnecriticalconstrainttowardssuchresearchhasbeenthelackofanIPdatainfrastructure.TheEPO’sPatstatdatabaseoffersrichunitrecordpatentdataforalargenumberofmiddleincomecountries,butitisincompleteformanymiddleincomecountriesandcannotbestraightforwardlycombinedwithothermicrodatasources.Inanycase,Patstatonlycoverspatentsandutilitymodels.FullyexploitingthepotentialofIPdatarequiresdedicatedinvestmentsinnewdatabases.ThispaperreportsononesucheffortundertakenforChile.AspartofaprojectunderWIPO’sCommitteeonDevelopmentandIntellectualProperty(CDIP),INAPIincollaborationwithWIPOcreatedadatabasethatcontainsallpatent,trademark,utilitymodel,andregistereddesignfilingsforChileovertheperiod1991‐2010.8Onekey
4Seehttps://sites.google.com/site/patentdataproject/Homeandhttp://www.epo.org/searching/subscription/raw/product‐14‐24.html.5ThepatentsystemoftheRepublicofKoreahasalsoseenconsiderablestudy,butKoreaalreadyreachedhighincomestatusin1995.6SeeWIPO(2012)foranoverview.Chinaagainisanexception,asitemergedasthelargestrecipientofIPfilingsforallmajorformsofIPin2012.7Itisimportanttokeepinmindthatthereisnoone‐to‐onerelationshipbetweenIPandinnovation.Therefore,IPstatisticsprovidelimitedinformationoninnovationandbroadereconomicperformance.EveryIPtitledescribesadifferentintangibleasset.Thereisalargeliteraturepointingtoahighlyskeweddistributionofthoseassets.Fewpatentsyieldhigheconomicreturns.Ontheotherhand,thisdoesnotimplythatIPstatisticshavenouse.IPactivitycorrelatesinmeaningfulwayswithothermeasuresofinnovativeactivity–attheleveloffirms,industries,andeconomies.Indeed,IPstatisticsremainoneofthefewwidelyavailableindicatorsofinnovationavailabletoanalysts.8SeeWIPOdocumentCDIP/5/7.

9
contributionofthedataconstructionworkwastoharmonizeapplicantnamesanduniquelyidentifyapplicantsforallfourformsofIP.Inaddition,thedatawerematchedtofirm‐leveldataoftheNationalStatisticalInstitute(INE)–specifically,themanufacturingcensus(ENIA)aswellasfivewaves(1997‐2008)oftheChileaninnovationsurvey(INNOVACION).9Chileoffersaninterestingexampleofamiddleincomecountrythathasachievedconsiderableeconomicgrowthoverthepastdecades,butthatstillreliesheavilyoncommoditiesandagriculturalproductsasitsexportbase.Chilehasalsoproactivelyintegratedintotheworldeconomythroughalargenumberofbilateralandregionaltradeagreements.IthasmodifieditsIPlawseveraltimesduringthepasttwodecades,strengtheningIPprotectionsignificantly.Shiftingthesourcesofeconomicgrowthtowardsnewsectorsandgainsineconomy‐wideproductivitythroughinnovationisanimportantimperativeforChileanpolicymakers.Accordingly,Chilehasanumberofdedicatedprogramstopromoteinnovation.Forexample,theChileanEconomicDevelopmentAgency(CORFO)currentlyhasover30initiativesdesignedtopromoteinnovation,innovativeentrepreneurship,andtechnologytransfer.Chilealsohasotherdedicatedinnovationfunds,suchastheFundforAgrarianInnovation,whichhasafocusonagriculturalinnovation.Inaddition,thereistheFundofScientificandTechnologicalDevelopment,whichseekstopromoteR&Dprojectsofuniversitiesandpublicresearchinstitutesinconjunctionwithprivatecompanies.AnotherrelevantpolicyistheScientificMillenniumInitiative,whichaimstopromotethedevelopmentofscientificandtechnologicalresearch,throughthecreationandfinancingofscientificresearchinstitutes.ExistingstudiesontheChileaninnovationsystemofferimportantinsightsintothedeterminantsofcompanies’innovativeactivitiesasmeasuredintheChileaninnovationsurveys.However,asformostothermiddleincomecountries,therearefewempiricalstudiesontheuseofIPthatcouldinformpolicy.ExistingstudiestypicallyanalyzequestionsrelatedtoIPonlyinpassing,mostlyasoneaspectamongmanyrelatedtoinnovation,technologytransfer,exportingorproductivity.Chile’sinnovationsurveys,conductedfrom1992onwards,offersomeinformationonIPuse;however,theyrelyonrespondents’self‐reporteduseofIPandcoveronlycertainsegmentsontheChileaneconomy.ThelimitedempiricalliteratureontheChileanIPsystemhasbeenprimarilyconcernedwithpatentsand,inparticular,thelowuseofpatentsbyChileanresidents(OECD,2007;Amorósetal.,2008;KatzandSpence,2008).AccordingtotheOECD(2007),thelowpatentintensityinChilecanlargelybeexplainedbythreefactors.First,thereisalimitedcapabilityinChiletogenerateinnovativeandfirst‐to‐the‐worldproductsandprocesses.Second,Chilehasanindustrialspecializationinsectorswithalowpropensitytopatent,suchasminingandservices.WhilethereisagrowingChileanpharmaceuticalindustry,itislargelyfocusedontheproductionofgenericsandbranddrugsunderlicensingcontracts.Third,whileChilehasanumberofsuccessfulexporters,theyrelymainlyonimportedtechnologiesandhenceareunlikelytorelyon
9ThisreportdoesnotincludeananalysisofthematcheddatabutfocusesonananalysisofIPfilingsmoregenerally.
10
patentsfortheirbusinessmodel.ThelowuseofpatentsbyChileanresidentsstandsinstarkcontrasttotheirheavyuseofthetrademarksystem.However,despitethelargenumberoftrademarkapplicationsinChile,therearenoempiricalstudiesontheuseoftrademarksintheChileaneconomy.Thenewdatabase–henceforththeINAPI‐WIPOdatabase–enablesnewinvestigationsthatcandeepenourunderstandingoftherolethatIPrightsplayinChile’sinnovationsystemandexplorenewquestionsthathavenotbeenconsideredsofar.Asafirststep,thispaperprovidesadescriptiveoverviewofIPuseinChile.Thepaper’sdiscussionisstructuredasfollows.Asbackground,Section2willofferashortintroductionintothemainfeaturesofChile’sIPsystem.ThefollowingsectionswillthendiscussdifferentdimensionsofIPuse–focusing,inparticular,onoveralltrends(Section3),theoriginofIPapplications(Section4),theapplicantdistribution(Section5),applicanttypes(Section6),filingsbytechnologyandclass(Section7),grantratiosandlags(Section8),IPbundles(Section9),co‐assignmentpatternsofpatents(Section10),patentfilingsabroad(Section11),andadditionalperspectivesonthetrademarksystem(Section12).Aconcludingsectionsummarizesthekeyfindingsofthedescriptiveanalysisandpointstopotentialavenuesforfutureresearch.Thepaper’sappendixprovidesadditionaldetailsonthelegalIPregimeinChileaswellasadetaileddescriptionofthemethodologyusedtoconstructthedata.
2.TheIPsysteminChileThe Intellectual property system in Chile is administeredby various institutions. TheMinistry of Education is in charge of the Copyright Register,10the Ministry ofAgriculture is in charge of plant breeder’s rights aswell as in part of appellations oforiginforwinesandspiritsandofundisclosedinformationregardingagrochemicals.11The Ministry of Health is in charge of undisclosed information regardingpharmaceutical products12 and the Ministry of Foreign Affairs is in charge ofinternational negotiations and of the coordination of an inter‐ministerial technicalcommitteefortheimplementationofinternationalcommitments.13INAPIisthemainGovernmentagencyinchargeofindustrialpropertyrightssince2009.Besidesactingastheregisterforpatents,trademarks,industrialdesigns,utilitymodels,andappellationsof origin, INAPIalso functions as a first instance court inoppositionandnullityprocedures. In addition, it has several other important functions: INAPI isadvisor to thePresidentofChileonall issuesconcerning industrialproperty; it is theagencyinchargeofrecommendingtheaccessiontoIPtreaties;anditistaskedwiththe
10TheMinistryofEducationhasanIntellectualPropertyDepartmentwhichispartoftheDirectorateforLibraries,ArchivesandMuseumsoftheMinistry.11ThroughtheCattleandAgriculturalServiceoftheMinistry.12TherelevantbodyisthePublicHealthInstituteoftheMinistry.13ThroughtheIntellectualPropertyDepartment,whichispartoftheGeneralDirectorateforInternationalEconomicRelationsoftheMinistry.

11
promotionof IP and thedisseminationof knowledge,particularly of information thathasfalleninthepublicdomain.Thelawonindustrialproperty(Law19.039),whichcoverstrademarks,inventionpatents,utilitymodels,geographicalindications,appellationsoforigin,integratedcircuittopographies,drawingsandindustrialdesigns,enteredintoforceinOctober1991.Sincethenthelawhasundergonethreemajoramendments.Thefirstamendment(Law19.996)waspublishedinMarch2005andenteredintoforceinDecember,2005.ThislawadaptedChileanlegislationtoTRIPS,mainlythroughchangestooppositionproceedings,trademarkableandpatentablesubjectmatter,andthestatutorylifetimeofpatents.Italsoincorporatedindustrialdrawings,geographicalindications,appellationsoforiginandintegratedcircuittopographiesintonationallegislation.Finally,italsointroducedtradesecrecyandcivilactionsforIPenforcement–before2005,IPinfringementwasonlysanctionedbycriminalcourts.Thesecondmajoramendment(Law20.160)enteredintoforceinJanuary,2007.ItadaptedChileanlegislationtofreetradeagreementssignedsincethe2000s.ThisamendmentcontainsmainlychangesregardingcancellationproceduresforallIPrightsandthedefinitionofsubjectmattereligibleforgeographicalindicationsandappellationsoforigin.Italsoincorporatessoundmarksintothelaw.Thethirdamendment(Law20.569)enteredintoforceinFebruary,2012.ThislawincorporatedcertainprovisionsagreedbyChilethroughthesignatureoftheTrademarkLawTreaty(TLT)andthePatentCooperationTreaty(PCT).Thissectionoffersabriefdescriptionofthelegalregimeapplicabletopatents,trademarks,utilitymodelsandindustrialdesignswhicharecoveredbytheanalysis.14TrademarksTrademarksaredefinedassignsthatdistinguishproducts,services,orindustrialandcommercialestablishmentsinthemarket.Since2007,atrademarkcanalsobeusedtoprotectslogansorsoundsmarks.Atrademarkcanbeclassifiedasaword,figurativeormixedmark.Wordmarksprotectawordorwordswithorwithoutidiomaticmeaningoracombinationoflettersand/ornumbers.Figurativetrademarksarelabelswithpictures,images,symbolsordrawings.Mixedtrademarksareacombinationofbothwordandfigurativetrademarks–thatis,labelsthathaveawordorwordswithorwithoutidiomaticmeaningoracombinationoflettersand/ornumbers,combinedwithpictures,images,symbolsordrawings.ChileisnotpartoftheMadridSystemfortheInternationalRegistrationofMarks,whichmeansthatnon‐residentapplicantshavetofiledirectlywithINAPItoobtainatrademarkinChile.DetailsontheregistrationprocedurefortrademarkscanbefoundinAppendix1.1.Trademarkrightslastforaperiodof10yearsfromthegrantdatebutcanberenewedindefinitely.Unlikesomeothercountries,INAPIdoesnotrequiretheapplicanttoproveactualuseofthetrademark,neitherattheinitialfilingstagenorattherenewalstage.
14Thediscussiondoesnotcovergeographicalindications,appellationsoforiginandintegratedcircuittopographies(thatis,semiconductormaskprotection).
12
Duringtheapplicationprocess,thirdpartiescanfileanoppositionduringa30dayperiodfollowingthepublicationofthemark.INAPIdoesnotnotifythirdpartieswhohaveprevioustrademarkapplicationsorregistrationsthatcouldjustifyanopposition.Ifnooppositioniffiled,thetotalprocessingtimeofanapplicationuntilitsregistrationisapproximatelyninemonths.Ifthereisanopposition,theproceduremaytakeonaveragesevenmonthslonger.Atrademarkcanalsobecancelledpost‐grant.Anypersoncanrequestthecancellationofaregisteredtrademark.Atrademarkcanonlybecancelledwithinfiveyearsafteritwasregistered.Thisrestrictiondoesnotapplywhenatrademarkwasobtainedinbadfaith.DetailsoncancellationproceduresareprovidedinAppendix1.1.IfINAPIcancelsatrademark,thetrademarkisconsideredvoidasofthegrantdate.Ifatrademarkwasdismissedorcancelledduetotheexistenceofafamousandwell‐knowntrademarkabroad,theownerofthetrademarkhas90daystoregisterthetrademark.Oncethe90dayperiodlapses,anyinterestedpartycanapplyforthetrademark.AccordingtoChileanlaw,trademarkcounterfeitingissanctionedbybothcivilandcriminallawdependingonthetypeofinfringement.DetailsabouttheenforcementoftrademarksareprovidedinAppendix1.2.PatentsThemostimportantchangestothescopeofpatentprotectionoccurredintheareaofpharmaceuticals.In1991,activechemicalandpharmaceuticalingredientsbecamepatenteligible,whereasbefore1991onlytheproductionprocesscouldbepatented.Theamendmentin2005restrictedthepatenteligibilityofnewusesofknownsubstances.Priorto2005,newuseswerepatentableiftheysolvedatechnicalproblemorchangedtheessentialqualitiesoftheinvention.Followingtheamendment,thelawrequiresthatbothconditionsbesatisfied.Moreover,tobepatenteligible,thenewusehastobesupportedbyempiricalevidence.InChile,softwareperseisnotpatenteligibleandprotectedbycopyright.15Appendix1.3providesdetailsonpatenteligiblesubjectmatter.Beforethe2005amendment,thestatutorylifetimeofapatentwas15yearsfromthegrantdate.Theamendmentchangedthisinto20yearsfromthedateoffilling.Thistermisnotrenewable.Thereisa45daytermduringwhichthirdpartiescanpresentanoppositiontoapatentapplication.Oppositionispossibleonthegroundsthatanapplicationdoesnotmeetoneormoreofthepatentabilityrequirements.Thegroundsforcancellationhaveremainedthesamesince1991.Anypersoncanrequestthecancellationofagrantedpatent.The2005amendmentreducedthetimeframeduringwhichapatentcanbecancelledfrom10to5yearscountingfromthedateofgrant.Incontrasttotrademarks,badfaithdoesnotsuspendthisrestriction.Appendix1.4providesfurtherdetails.
15Law17336ofIntellectualProperty.
13
Asfortrademarks,patentinfringementcanbesanctionedbybothcivilandcriminallawdependingonthetypeofinfringement.DetailsaboutenforcementareprovidedinAppendix1.2.UtilitymodelsUtilityModelsaresimilartopatents,butgenerallyapplytolesscomplextechnicalinventionsthanpatents.Utilitymodelscanprotectinstruments,apparatus,tools,devicesorobjectswhichcanbedescribedinclaimform.Thelegalprotectionofutilitymodelsappliestoanindividualobject,butprotectionofseveralelementsoraspectsofanobjectcanbeclaimedinasingleapplication(Article56Law19309).Utilitymodelsdifferfrompatentsinthefollowingways:
Utilitymodelsareexemptoftheinventivesteprequirementofinventionpatents. Utilitymodelsonlyneedtobenewandhaveindustrialapplicability. Utilitymodelslastforanon‐renewabletermof10yearscountingfromthe
applicationdate. Theregistrationprocedureforautilitymodelinvolvesthesamestepsand
deadlinesasforapatent(seeAppendix1.4).However,becausethetechnologyinvolvedisgenerallylesscomplexandnoveltyisnotassessed,theprocedureforutilitymodelsisgenerallyfasterandsimplerthaninthecaseofinventionpatents.Allfeesarethesameasforpatents,exceptfortheexaminationfeewhichischeaperforutilitymodelsthanforpatents.16
Utilitymodelscanonlybeobtainedforproducts,notforprocesses.Accordingly,utilitymodelsaremorerelevantforcertaintechnologicalareassuchasmechanicalorelectricalengineering.
IndustrialdesignsanddrawingsIndustrialdesignsareanythree‐dimensionalshapesandindustrialorhandicraftitemsthatcanbeusedasatemplatefortheproductionofotherunits.Industrialdesignsmustbedistinguishablefromsimilarthreedimensionalobjects,eitherbytheirshape,geometricconfiguration,ornamentationoracombinationofthesecharacteristics(Article62Law19309).Industrialdrawingsincludeanysetorcombinationoffigures,linesorcolorsthataredevelopedonaflatsurface.Industrialdrawingsmustbecapableofbeingpartofanindustrialproductandprovideanewlooktotheproduct.Industrialdesignsanddrawingsdifferfrompatentsinthefollowingways:
IndustrialDesignsanddrawingsareexemptoftheinventivestepandindustrialapplicabilityrequirementsofpatents.Theyareonlyrequiredtobenew.Designsanddrawingsareconsiderednewiftheydiffersignificantlyfromknowndrawingsorindustrialdesignsoriftheydifferfromcombinationsof
16Forpatentsthefeeis$427.000Chileanpesos(approx.US$900dollars).Forutilitymodels,thefeeis$343.000(approx.US$730dollars).
14
characteristicsofknowndrawingsandindustrialdesigns(Article62Law19039).ThepriorartsearchisconductedsearchingforindustrialdesignsanddrawingsprotectedunderthesameLocarnoclassificationininternationalofficessuchastheUSPTOortheOfficeforHarmonizationintheInternalMarket(OHIM).Fordrawings,noveltymeansanewphysiognomy,fordesignsanewappearance.
Industrialdesignsanddrawingsarevalidforanon‐renewabletermof10yearsfromthedateoffiling.
Theapplicationprocedureforindustrialdesignsanddrawingsinvolvesthesamestepsanddeadlinesasforpatents(seeAppendix1.4).However,industrialdesignsanddrawingsdonotcontainclaims.
Allfeesarethesameasforpatentsexceptfortheexaminationfeewhichislowerforindustrialdesignsanddrawings.17
3.OveralltrendsOverthepasttwodecades,INAPIhasseenrapidgrowthintheuseofmostIPforms.Figure1presentsthefilingtrendforpatents,utilitymodels,andindustrialdesignsovertheperiod1991‐2010.Patentfilingshavemorethantripledfrom775applicationsperyearin1991toover3,000in2008.Whileitisdifficulttopreciselyquantifythedriversoftheobservedgrowthinpatentfilings,threefactorsappeartostandout:
asdescribedintheprevioussection,Chile’spatentreformin1991expandedthescopeofpatentprotectiontonewsubjectmatter,notablypharmaceuticalproducts;
theChileaneconomyhasexperiencedrobustgrowthsincetheearly1990s,promptinggreaterinterestbyinnovatorsintheChileanmarket;
thepasttwodecadeshaveseengreaterrelianceonthepatentsystemworldwide,andChilehasbecomemorecloselyintegratedintotheglobaleconomy.
Despitetheextensionofthestatutorypatentlifefrom15to20yearsin2005bythefirstamendmenttotheIntellectualPropertyLaw(seeSection2),thereisnovisibletrendbreakinthenumberoffilings.Thenumberoffillingsbeginstorisealreadyin2004aheadoftheamendment.
17Forpatentstheexaminerfeeis$427.000Chileanpesos(approx.US$900dollars)andforindustrialdesignsanddrawingsitis$287.000(approx.US$600dollars).

15
Figure1:#patent,utilitymodel,designfilings(1991‐2010)
01
000
200
03
000
# F
ilin
gs
1991 1995 1999 2003 2007Filing year
PatentsUtility ModelsDesigns
Frommid‐2009to2010,patentfilingsdroppedsharplyduetoChile’saccessiontothePatentCooperationTreaty(PCT),effectiveasofJune2,2009.InsteadofdirectlyfilinginChile,mostnon‐residentapplicantsoptedforaPCTinternationalapplication,affordingthemupto18monthstoformadecisiononwhethertoapplyforprotectioninChile.Thistransitionalfilingdeclinecametoanendatthebeginningof2011,whichisnotcoveredbyourdata,asnon‐residentapplicantsbegantoenterthePCTnationalphaseinChile.ItisimportanttokeepthisPCTaccessioneffectinmindwhenlookingatpatentfilingfiguresfor2009and2010intheremainderoftheanalysis.IndustrialdesignsandutilitymodelsarefarlesspopularinChile.Thenumberofannualutilitymodelandindustrialdesignfilingsincreasedfrom17to62and131to451between1991and2008,respectively.FilingactivityforthesetwoIPformsaremodestnotonlycomparedtopatents,butalsocomparedtoothercountries(seeFigure2).

16
Figure2:Utilitymodelandindustrialdesignfilings,2008‐2010average
0
1'000
2'000
3'000
4'000
5'000
6'000
7'000
8'000
Australia Austria Brazil Chile CzechRepublic
Indonesia Mexico Philippines Thailand Turkey
Utilitymodels Industrialdesigns
Note:Thecountrieswereselectedmainlytoillustrategreateruseofutilitymodelsindifferentpartsoftheworld;theselectionisnotrepresentative;indeed,therearemanycountriesshowinglimiteduseoftheseIPformssimilartoChile.Inaddition,itisimportanttokeepinmindthatcountrysizeinfluencestheleveloffilingactivity.
Source:WIPOStatisticsDatabase.
Inthecaseofutilitymodels,oneexplanationfortheirlimiteduseinChileisthatINAPIsubstantivelyexaminesutilitymodels–asdescribedintheprevioussection.Manyothercountriesoperateasimplerregistrationsystemwithoutsubstantiveexamination;forapplicantsinthosecountries,theutilitymodelsystemthusofferseasy‐to‐obtainprotectionasanalternativetothepatentsystem.Inthecaseofindustrialdesigns,oneexplanationseemstobethatdesignersrely–moresothaninothercountries–onthecopyrightsysteminprotectingtheircreativeoutputs.However,theempiricalimportanceofthissubstitutioneffectisnotclearandotherfactorssuchastherelativelyhighfeesmayalsoplayarole.Figure3presentsthefilingtrendfortrademarks,showingamarkedincreaseofapplicationsfromslightlylessthan30,000peryearin1991tomorethan44,000in2010.ThisisaremarkablylargenumberforacountryofChile’ssize.

17
Figure3:#trademarkfilings(1991‐2010)
300
003
5000
400
004
5000
500
00#
Fili
ngs
1991 1995 1999 2003 2007Filing year
Asinthecaseofpatents,Chile’srapidlygrowingeconomycanpartlyaccountforthemarkedincreaseinfilings.However,thegrowthintrademarkapplicationshasbeenfasterthanthegrowthofrealGDP.Inaddition,Chileexhibitsamongthemostintensiveuseoftrademarksintheworld,ascapturedbytheratiooftrademarkfilingstoGDP(Table1).WhatliesbehindboththegrowingandabsolutepopularityoftrademarksinChilewarrantsfurtherinvestigation.
Table1:TrademarkfilingstoGDPratio,top‐10listin2010
1 Paraguay 43,7982 RepublicofMoldova 35,4153 Mongolia 32,4134 Chile 20,3885 Bulgaria 18,0616 Luxembourg 15,5927 Iceland 13,8288 CostaRica 13,1559 CzechRepublic 13,12410 NewZealand 12,962
Note:Thevaluesshownareresidentclasscountper100US$billionofconstant2005GDPinpurchasingpowerparities,bycountryoforigin.Theuseofclassratherthanapplicationcountsenablesbettercomparisonsacrosscountries,assomecountriesoperateasingle‐classfilingsystemandothers–likeChile–amulti‐classfilingsystem.(Unfortunately,availabledatadonotallowforcountsofuniquemarks).Theuseoforiginratherthanofficedataenablesbettercomparisonforthosecountriesthataremembersofregionalfilingoffices.
Source:WIPOStatisticsDatabase.
18
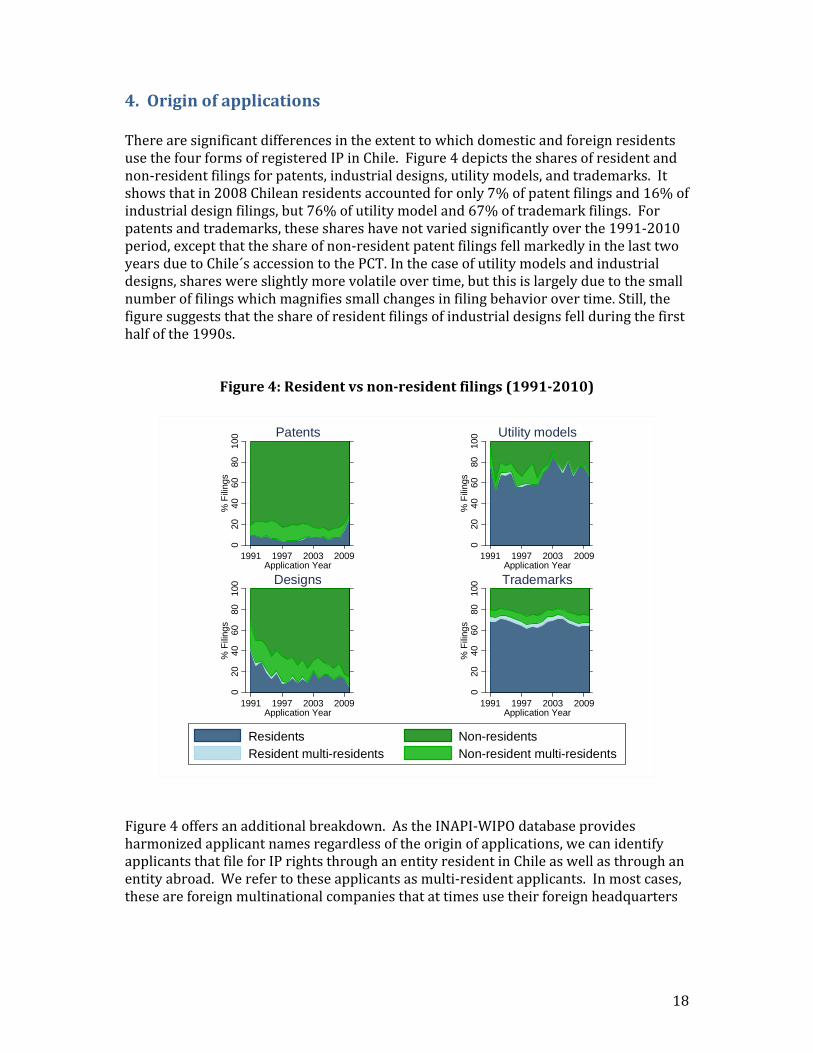
4.OriginofapplicationsTherearesignificantdifferencesintheextenttowhichdomesticandforeignresidentsusethefourformsofregisteredIPinChile.Figure4depictsthesharesofresidentandnon‐residentfilingsforpatents,industrialdesigns,utilitymodels,andtrademarks.Itshowsthatin2008Chileanresidentsaccountedforonly7%ofpatentfilingsand16%ofindustrialdesignfilings,but76%ofutilitymodeland67%oftrademarkfilings.Forpatentsandtrademarks,theseshareshavenotvariedsignificantlyoverthe1991‐2010period,exceptthattheshareofnon‐residentpatentfilingsfellmarkedlyinthelasttwoyearsduetoChile´saccessiontothePCT.Inthecaseofutilitymodelsandindustrialdesigns,shareswereslightlymorevolatileovertime,butthisislargelyduetothesmallnumberoffilingswhichmagnifiessmallchangesinfilingbehaviorovertime.Still,thefiguresuggeststhattheshareofresidentfilingsofindustrialdesignsfellduringthefirsthalfofthe1990s.
Figure4:Residentvsnon‐residentfilings(1991‐2010)
020
4060
8010
0%
Fili
ngs
1991 1997 2003 2009Application Year
Patents
020
4060
8010
0%
Fili
ngs
1991 1997 2003 2009Application Year
Utility models
020
4060
8010
0%
Fili
ngs
1991 1997 2003 2009Application Year
Designs
020
4060
8010
0%
Fili
ngs
1991 1997 2003 2009Application Year
Trademarks
Residents Non-residentsResident multi-residents Non-resident multi-residents
Figure4offersanadditionalbreakdown.AstheINAPI‐WIPOdatabaseprovidesharmonizedapplicantnamesregardlessoftheoriginofapplications,wecanidentifyapplicantsthatfileforIPrightsthroughanentityresidentinChileaswellasthroughanentityabroad.Werefertotheseapplicantsasmulti‐residentapplicants.Inmostcases,theseareforeignmultinationalcompaniesthatattimesusetheirforeignheadquarters
19
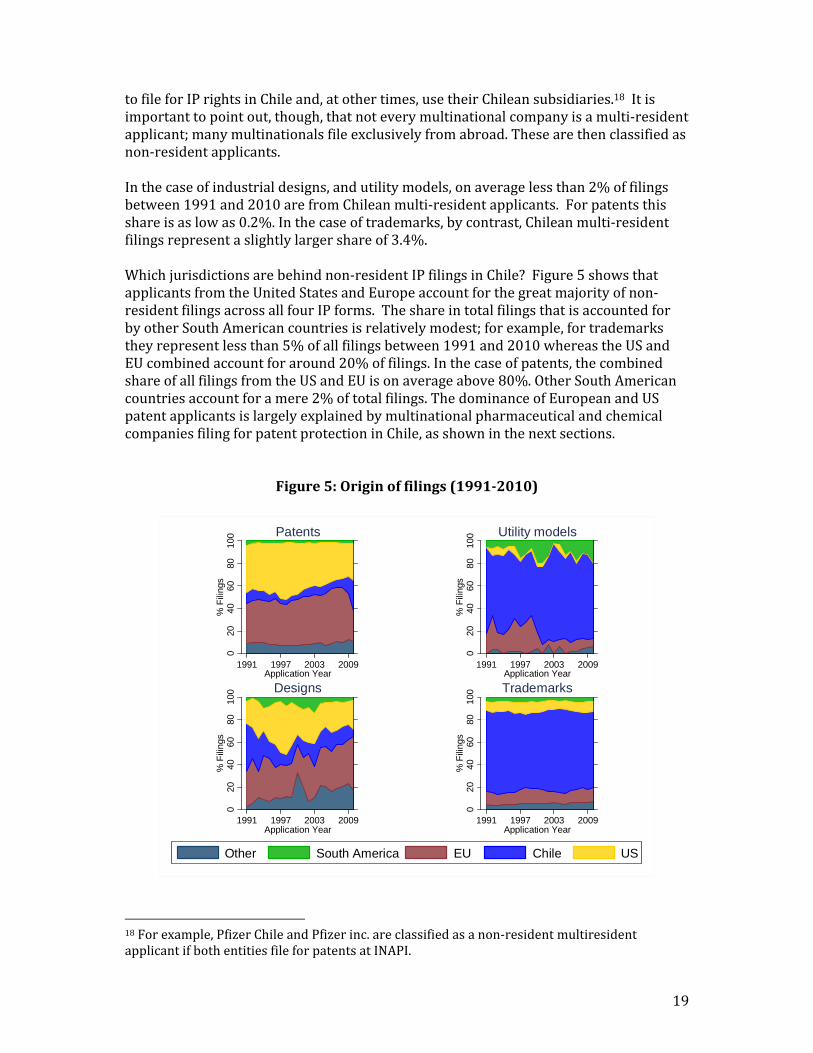
tofileforIPrightsinChileand,atothertimes,usetheirChileansubsidiaries.18Itisimportanttopointout,though,thatnoteverymultinationalcompanyisamulti‐residentapplicant;manymultinationalsfileexclusivelyfromabroad.Thesearethenclassifiedasnon‐residentapplicants.Inthecaseofindustrialdesigns,andutilitymodels,onaveragelessthan2%offilingsbetween1991and2010arefromChileanmulti‐residentapplicants.Forpatentsthisshareisaslowas0.2%.Inthecaseoftrademarks,bycontrast,Chileanmulti‐residentfilingsrepresentaslightlylargershareof3.4%.Whichjurisdictionsarebehindnon‐residentIPfilingsinChile?Figure5showsthatapplicantsfromtheUnitedStatesandEuropeaccountforthegreatmajorityofnon‐residentfilingsacrossallfourIPforms.TheshareintotalfilingsthatisaccountedforbyotherSouthAmericancountriesisrelativelymodest;forexample,fortrademarkstheyrepresentlessthan5%ofallfilingsbetween1991and2010whereastheUSandEUcombinedaccountforaround20%offilings.Inthecaseofpatents,thecombinedshareofallfilingsfromtheUSandEUisonaverageabove80%.OtherSouthAmericancountriesaccountforamere2%oftotalfilings.ThedominanceofEuropeanandUSpatentapplicantsislargelyexplainedbymultinationalpharmaceuticalandchemicalcompaniesfilingforpatentprotectioninChile,asshowninthenextsections.
Figure5:Originoffilings(1991‐2010)
020
4060
8010
0%
Fili
ngs
1991 1997 2003 2009Application Year
Patents
020
4060
8010
0%
Fili
ngs
1991 1997 2003 2009Application Year
Utility models
020
4060
8010
0%
Fili
ngs
1991 1997 2003 2009Application Year
Designs
020
4060
8010
0%
Fili
ngs
1991 1997 2003 2009Application Year
Trademarks
Other South America EU Chile US
18Forexample,PfizerChileandPfizerinc.areclassifiedasanon‐residentmultiresidentapplicantifbothentitiesfileforpatentsatINAPI.

20
5.ApplicantdistributionIPfilingsareunevenlydistributedacrossapplicants.Typically,asmallshareofapplicantsaccountsforalargeshareoffilings.HowconcentratedfilingsareacrossapplicantsdiffersforthefourIPforms.Onewaytoexplorethisistolookatthelistsoftop‐10applicants.19Inthecaseofpatents(Table2),thetop‐10applicantsareallforeignresidents–inparticular,USandEuropeanmultinationals–inlinewiththelargeshareofnon‐residentfilingsdescribedabove.Inaddition,9ofthetop‐10applicantsarefromthechemical,pharmaceutical,andconsumergoodsindustries.TheoneoutlieristheU.S.telecommunicationsequipmentcompanyQualcomm,withatotalof639applicationsbetween1991and2010.Aswillbefurtherdiscussedbelow,thestrongpresenceofacompanyfromtheinformationandcommunicationstechnology(ICT)sectorseemsunusualforasmallmiddle‐incomeeconomywithanindustrialstructurelikeChile;itseemsduetoQualcomm’sspecificbusinessmodelandglobalIPstrategy.Interestingly,Qualcomm’sapplicationsgrewrapidlyfrom2001to2006(withapeakof100filingsin2006),butfellsharplyafter2007–pointingtoachangeinQualcomm’spatentingstrategy.
Table2:Top10applicants‐‐patents(1991‐2010)
Rank Name # Filings % Total Industry Country
1 Procter & Gamble 1,894 4.31% Consumer goods US
2 Unilever 1,402 3.19% Consumer goods NL
3 Pfizer* 1,027 2.34% Pharma US
4 Bayer 940 2.14% Pharma & Chemicals DE
5 Hoffmann‐La Roche 870 1.98% Pharma CH
6 BASF 807 1.84% Chemicals DE
7 Novartis 686 1.56% Pharma CH
8 Wyeth* 683 1.55% Pharma US
9 Boehringer Ingelheim 660 1.50% Pharma DE
10 Qualcomm 639 1.45% Telecommunication US
Total 9,608 21.86%
* Pfizer and Wyeth merged in 2009
19TherankingsshouldnotbeinterpretedtosuggestthatcompanieswithmoreIPfilingsaremoreinnovativethanothers.Thismaynotnecessarilybethecaseascompaniescanchoosebetweenarangeofdifferentmechanismstoprotectandappropriatereturnstoinnovation,registeredIPisonlyonesuchmechanism.Moreover,thereisnoone‐for‐onecorrespondencebetweenthenumberofIPrightsfiledandthecommercialvalueoftheunderlyinginventionsortheircontributiontotechnologicalprogress.
21
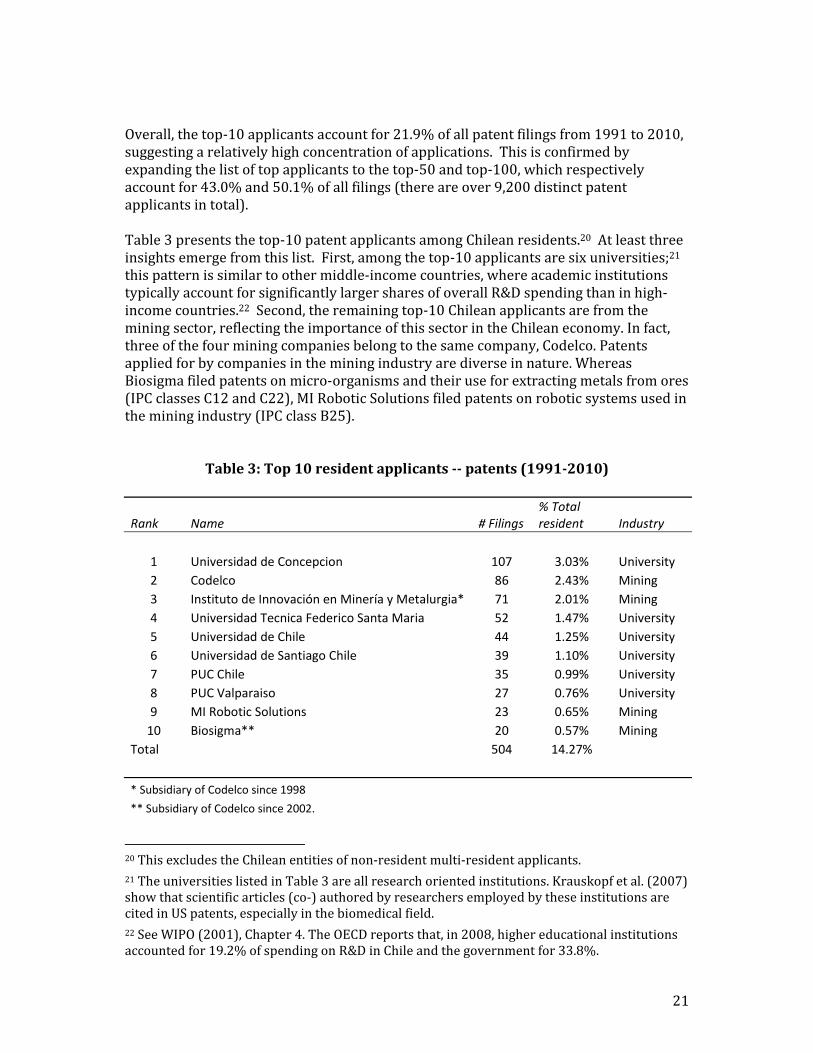
Overall,thetop‐10applicantsaccountfor21.9%ofallpatentfilingsfrom1991to2010,suggestingarelativelyhighconcentrationofapplications.Thisisconfirmedbyexpandingthelistoftopapplicantstothetop‐50andtop‐100,whichrespectivelyaccountfor43.0%and50.1%ofallfilings(thereareover9,200distinctpatentapplicantsintotal).Table3presentsthetop‐10patentapplicantsamongChileanresidents.20Atleastthreeinsightsemergefromthislist.First,amongthetop‐10applicantsaresixuniversities;21thispatternissimilartoothermiddle‐incomecountries,whereacademicinstitutionstypicallyaccountforsignificantlylargersharesofoverallR&Dspendingthaninhigh‐incomecountries.22Second,theremainingtop‐10Chileanapplicantsarefromtheminingsector,reflectingtheimportanceofthissectorintheChileaneconomy.Infact,threeofthefourminingcompaniesbelongtothesamecompany,Codelco.Patentsappliedforbycompaniesintheminingindustryarediverseinnature.WhereasBiosigmafiledpatentsonmicro‐organismsandtheiruseforextractingmetalsfromores(IPCclassesC12andC22),MIRoboticSolutionsfiledpatentsonroboticsystemsusedintheminingindustry(IPCclassB25).
Table3:Top10residentapplicants‐‐patents(1991‐2010)
Rank Name # Filings % Total resident Industry
1 Universidad de Concepcion 107 3.03% University
2 Codelco 86 2.43% Mining
3 Instituto de Innovación en Minería y Metalurgia* 71 2.01% Mining
4 Universidad Tecnica Federico Santa Maria 52 1.47% University
5 Universidad de Chile 44 1.25% University
6 Universidad de Santiago Chile 39 1.10% University
7 PUC Chile 35 0.99% University
8 PUC Valparaiso 27 0.76% University
9 MI Robotic Solutions 23 0.65% Mining
10 Biosigma** 20 0.57% Mining
Total 504 14.27%
* Subsidiary of Codelco since 1998
** Subsidiary of Codelco since 2002.
20ThisexcludestheChileanentitiesofnon‐residentmulti‐residentapplicants.21TheuniversitieslistedinTable3areallresearchorientedinstitutions.Krauskopfetal.(2007)showthatscientificarticles(co‐)authoredbyresearchersemployedbytheseinstitutionsarecitedinUSpatents,especiallyinthebiomedicalfield.22SeeWIPO(2001),Chapter4.TheOECDreportsthat,in2008,highereducationalinstitutionsaccountedfor19.2%ofspendingonR&DinChileandthegovernmentfor33.8%.

22
Third,theoveralllevelofpatentingbythetop‐10Chileanapplicantsappearssmall.Overthe1991‐2010period,thetopChileanapplicant–UniversidaddeConcepcion–filedonlyforatotalofslightlyover100patents.MiningcompanyCodelco,togetherwithitssubsidiaries,filed177patentsintotaloverthe20‐yearperiod.Takentogether,thetop‐10Chileanapplicantsaccountforonlyaround1%ofallpatentapplicationsfiledduring1991‐2010.Yet,theyaccountforasizeable14%ofallfilingsbyChileanresidents,pointingtoaskeweddistributionoffilingsamongresidentssimilartooverallfilings.Itisimportantnottoassumeaone‐to‐onecorrespondencebetweenthelevelofpatentingactivityandthelevelofinnovationinChile.Thepatentoutputofuniversities,forexample,dependsonalargenumberofinstitutionalconditions.Inaddition,littleisknownaboutthepreciseimportanceofpatentprotectionfortheminingsector;technologiesusedinminingareheterogeneousandsecrecymaywellbeaviablealternativeforminingcompaniestoprotectnewtechnologiesfrombeingcopied.Incontrasttopatents,Chileancompaniesdominatethelistoftop‐10trademarkapplicants(Table4).Onlythreeforeignmultinationalsareinthislist.Sixofthetop‐10trademarkapplicantsarefromthepharmaceutical,consumergoods,andfoodproductindustries,whichalsodominatethelistoftop‐10patentapplicants.Inaddition,threeofthetop‐10applicantsareretailers–includingtop‐rankedFalabella–andoneisatelecommunicationsserviceprovider,suggestingmorewidespreaduseoftrademarksacrosseconomicsectors.Thisisalsoreflectedintheslightlymorebalanceddistributionoftrademarkfilings:thetop‐10applicantsonlyaccountfor3.9%ofallfilings;thetop‐50accountfor11.2%andthetop‐100for15.4%.Still,duetolargenumberofapplicants(thereare142,500distinctapplicantsintotal),thedistributionisneverthelessrelativelyskewed.
Table4:Top10applicants‐‐trademarks(1991‐2010)
Rank Name # Filings % Total Industry Country
1 Falabella 4,334 0.57% Retail CL
2 Unilever 3,430 0.45% Consumer goods NL
3 Distribucion y Servicio* 3,344 0.44% Retail CL
4 Laboratorio Chile 2,889 0.38% Pharma CL
5 Laboratorio Recalcine 2,841 0.37% Pharma CL
6 Entel 2,722 0.36% Telecommunication CL
7 Carozzi 2,648 0.35% Food CL
8 Nestle 2,596 0.34% Food CH
9 Cencosud 2,473 0.32% Retail CL
10 Johnson & Johnson 2,359 0.31% Pharma US
Total 29,636 3.87%
* Controlled by Walmart since 2009

23
Finally,Tables5and6presentthetop‐10applicantlistsforutilitymodelsandindustrialdesigns,respectively.Inthecaseofutilitymodels,itisinterestingtonotethatthetop‐3applicantsareforeignmultinationals,eventhoughChileanresidentsaccountformostutilitymodelfilingsoverall(seeabove).However,therelativelylowtotallimitstheextenttowhichonecanderivegeneralizablepatternsfromthistop‐10list.Inthecaseofdesigns,theyconfirmthedominanceofforeignapplicantswithalltop‐10applicants–acrossarelativelywiderangeofsectors–comingfromabroad.
Table5:Top10applicants–utilitymodels(1991‐2010)
Rank Name # Filings % Total Industry Country
1 Telefonica 35 2.84% Telecommunication ES
2 Unilever 16 1.30% Consumer goods NL
3 Multibras 10 0.81% Consumer goods BR
4 Osvaldo Froilan Vilches Perez 7 0.57% CL
5 Falabella 7 0.57% Retail CL
6 Giampaolo Giorgi Guidugli 6 0.49% CL
7 Banco Estado Chile 6 0.49% FIRE* CL
8 Quinones Farfan 6 0.49% Business Services CL
9 Nathurmal Dinani Kishor 6 0.49% CL
10 Alejandro Eduardo Espinoza Gonzalez 6 0.49% CL
Total 105 8.52%
*Finance,insurance,andrealestate
Table6:Top10applicants–industrialdesigns(1991‐2010)
Rank Name # Filings % Total Industry Country
1 Unilever 302 4.94% Consumer goods NL
2 Philips 197 3.22% Electronics NL
3 Honda 190 3.11% Motot vehicles US
4 Sony 165 2.70% Electronics JP
5 Colgate‐Palmolive 164 2.68% Cosmetics DE
6 Telefonica 124 2.03% Telecommunication ES
7 Dart Industries 114 1.87% Manufacturing CH
8 Procter & Gamble 98 1.60% Consumer goods US
9 Bticino 81 1.33% Electronics IT
10 Goodyear 74 1.21% Manufacturing US
11 Nokia 74 1.21% ICT FI
Total 1,583 25.91%
24
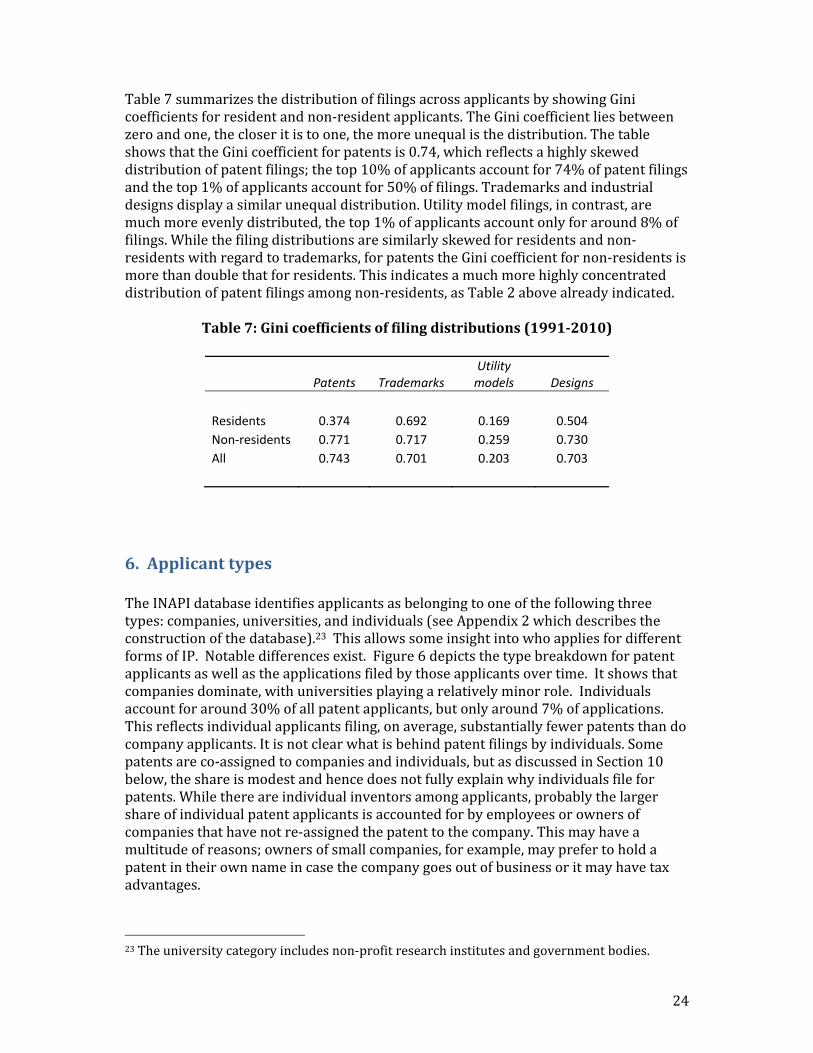
Table7summarizesthedistributionoffilingsacrossapplicantsbyshowingGinicoefficientsforresidentandnon‐residentapplicants.TheGinicoefficientliesbetweenzeroandone,thecloseritistoone,themoreunequalisthedistribution.ThetableshowsthattheGinicoefficientforpatentsis0.74,whichreflectsahighlyskeweddistributionofpatentfilings;thetop10%ofapplicantsaccountfor74%ofpatentfilingsandthetop1%ofapplicantsaccountfor50%offilings.Trademarksandindustrialdesignsdisplayasimilarunequaldistribution.Utilitymodelfilings,incontrast,aremuchmoreevenlydistributed,thetop1%ofapplicantsaccountonlyforaround8%offilings.Whilethefilingdistributionsaresimilarlyskewedforresidentsandnon‐residentswithregardtotrademarks,forpatentstheGinicoefficientfornon‐residentsismorethandoublethatforresidents.Thisindicatesamuchmorehighlyconcentrateddistributionofpatentfilingsamongnon‐residents,asTable2abovealreadyindicated.
Table7:Ginicoefficientsoffilingdistributions(1991‐2010)
Patents Trademarks Utility models Designs
Residents 0.374 0.692 0.169 0.504
Non‐residents 0.771 0.717 0.259 0.730
All 0.743 0.701 0.203 0.703
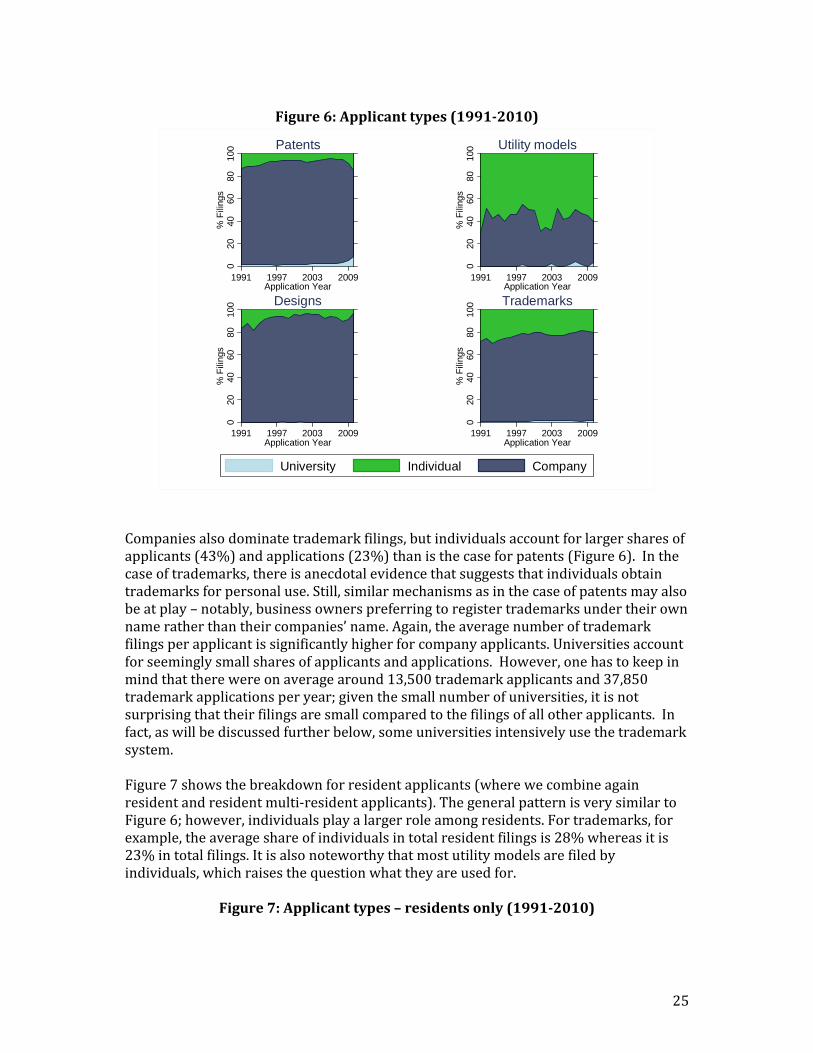
6.ApplicanttypesTheINAPIdatabaseidentifiesapplicantsasbelongingtooneofthefollowingthreetypes:companies,universities,andindividuals(seeAppendix2whichdescribestheconstructionofthedatabase).23ThisallowssomeinsightintowhoappliesfordifferentformsofIP.Notabledifferencesexist.Figure6depictsthetypebreakdownforpatentapplicantsaswellastheapplicationsfiledbythoseapplicantsovertime.Itshowsthatcompaniesdominate,withuniversitiesplayingarelativelyminorrole.Individualsaccountforaround30%ofallpatentapplicants,butonlyaround7%ofapplications.Thisreflectsindividualapplicantsfiling,onaverage,substantiallyfewerpatentsthandocompanyapplicants.Itisnotclearwhatisbehindpatentfilingsbyindividuals.Somepatentsareco‐assignedtocompaniesandindividuals,butasdiscussedinSection10below,theshareismodestandhencedoesnotfullyexplainwhyindividualsfileforpatents.Whilethereareindividualinventorsamongapplicants,probablythelargershareofindividualpatentapplicantsisaccountedforbyemployeesorownersofcompaniesthathavenotre‐assignedthepatenttothecompany.Thismayhaveamultitudeofreasons;ownersofsmallcompanies,forexample,mayprefertoholdapatentintheirownnameincasethecompanygoesoutofbusinessoritmayhavetaxadvantages.
23Theuniversitycategoryincludesnon‐profitresearchinstitutesandgovernmentbodies.
25
Figure6:Applicanttypes(1991‐2010)
020
4060
8010
0%
Fili
ngs
1991 1997 2003 2009Application Year
Patents
020
4060
8010
0%
Fili
ngs
1991 1997 2003 2009Application Year
Utility models
020
4060
8010
0%
Fili
ngs
1991 1997 2003 2009Application Year
Designs
020
4060
8010
0%
Fili
ngs
1991 1997 2003 2009Application Year
Trademarks
University Individual Company
Companiesalsodominatetrademarkfilings,butindividualsaccountforlargersharesofapplicants(43%)andapplications(23%)thanisthecaseforpatents(Figure6).Inthecaseoftrademarks,thereisanecdotalevidencethatsuggeststhatindividualsobtaintrademarksforpersonaluse.Still,similarmechanismsasinthecaseofpatentsmayalsobeatplay–notably,businessownerspreferringtoregistertrademarksundertheirownnameratherthantheircompanies’name.Again,theaveragenumberoftrademarkfilingsperapplicantissignificantlyhigherforcompanyapplicants.Universitiesaccountforseeminglysmallsharesofapplicantsandapplications.However,onehastokeepinmindthattherewereonaveragearound13,500trademarkapplicantsand37,850trademarkapplicationsperyear;giventhesmallnumberofuniversities,itisnotsurprisingthattheirfilingsaresmallcomparedtothefilingsofallotherapplicants.Infact,aswillbediscussedfurtherbelow,someuniversitiesintensivelyusethetrademarksystem.Figure7showsthebreakdownforresidentapplicants(wherewecombineagainresidentandresidentmulti‐residentapplicants).ThegeneralpatternisverysimilartoFigure6;however,individualsplayalargerroleamongresidents.Fortrademarks,forexample,theaverageshareofindividualsintotalresidentfilingsis28%whereasitis23%intotalfilings.Itisalsonoteworthythatmostutilitymodelsarefiledbyindividuals,whichraisesthequestionwhattheyareusedfor.
Figure7:Applicanttypes–residentsonly(1991‐2010)

26
020
4060
8010
0%
Fili
ngs
1991 1997 2003 2009Application Year
Patents
020
4060
8010
0%
Fili
ngs
1991 1997 2003 2009Application Year
Utility models
020
4060
8010
0%
Fili
ngs
1991 1997 2003 2009Application Year
Designs
020
4060
8010
0%
Fili
ngs
1991 1997 2003 2009Application Year
Trademarks
University Individual Company
7.FilingsbytechnologyandclassWhicheconomicsectorsgeneratemostIPrights?IPapplicationsdonotcontaindirectinformationonanapplicant’ssectoralaffiliation,butitispossibletobreakdownIPfilingsbyfieldoftechnology(forpatents)andbygoods/servicesclass(fortrademarks).ThesebreakdownsprovideindirectinformationonthetypeofeconomicactivitybehinddifferentIPapplications.Table2alreadyillustratedthestrongpresenceofthepharmaceuticalandchemicalsectorsamongthetop‐10patentapplicants.Figure8confirmstheprominenceofthetechnologyfieldsassociatedwiththesetwosectorsinoverallpatentfilings.From1991to2010,theyaccountedforaround60%ofallpatentapplications.24
24WemapIPCclasssymbolsintotechnologyclassesemployingtheconcordancetablebySchmoch(2008).

27
Figure8:Patent(IPC)‐technologymapping(1991‐2010)
Electrical Eng.
Instruments
Chemistry/Pharma
Mechanical Eng.
Other
02
04
06
08
01
00%
Fili
ngs
1991 1997 2003 2009Application Year
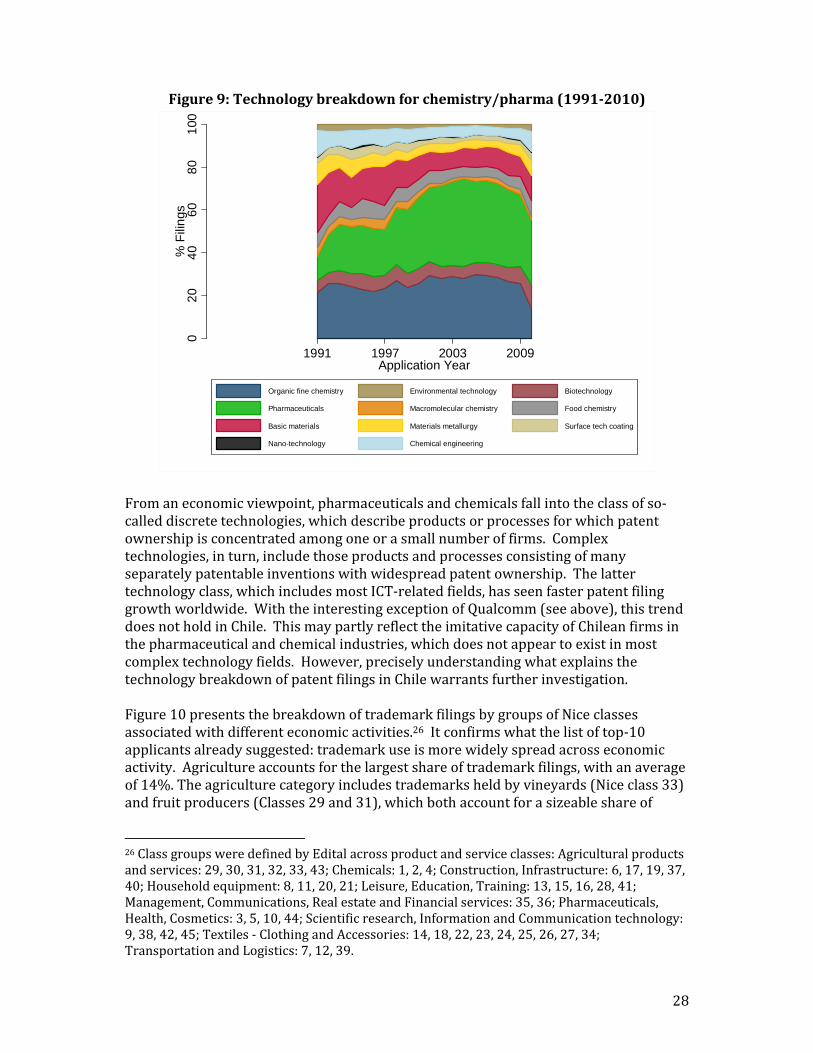
Note:The“Other”categorycontainsfurnitureandgames,otherconsumergoods,andcivilengineering.ThetechnologybreakdowndepictedinFigure8differsmarkedlyfromthatobservedatthepatentofficesofhigh‐incomecountries.Lookingatpatentfilingsworldwide,whicharedominatedbyfilingsathigh‐incomeoffices,thepharmaceuticalandchemicalsectorsaccountforaround23%ofallfilings.25Otherfields–notablythoseassociatedwithinformationandcommunicationstechnologies(ICTs)–haveseencomparativelygreaterfilingactivity.Figure9showsabreakdownforthebroadchemistry/pharmacategoryinto11technologysubcategories.Thefigureshowsthatorganicfinechemistryandpharmaceuticalpatentsaccountforoverhalfofallfilingsoverthe1991‐2010period.Pharmaceuticalpatentsincreasedmarkedlyfromaround11%in1991toover40%in2004reflectingthechangesintheIPlawin1991.
25Thissharereferstoallpatentfilingspublishedbetween1990and2010,asavailableintheWIPOStatisticsDatabase.
28
Figure9:Technologybreakdownforchemistry/pharma(1991‐2010)
02
04
06
08
01
00%
Fili
ngs
1991 1997 2003 2009Application Year
Organic fine chemistry Environmental technology Biotechnology
Pharmaceuticals Macromolecular chemistry Food chemistry
Basic materials Materials metallurgy Surface tech coating
Nano-technology Chemical engineering
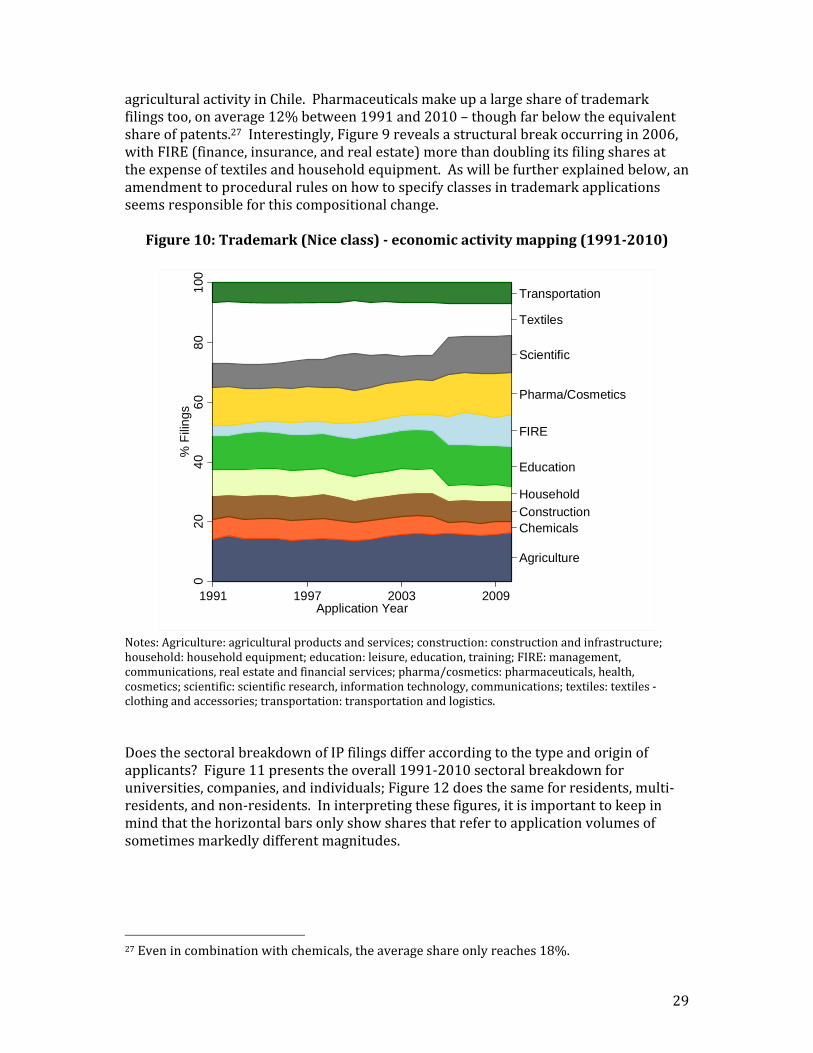
Fromaneconomicviewpoint,pharmaceuticalsandchemicalsfallintotheclassofso‐calleddiscretetechnologies,whichdescribeproductsorprocessesforwhichpatentownershipisconcentratedamongoneorasmallnumberoffirms.Complextechnologies,inturn,includethoseproductsandprocessesconsistingofmanyseparatelypatentableinventionswithwidespreadpatentownership.Thelattertechnologyclass,whichincludesmostICT‐relatedfields,hasseenfasterpatentfilinggrowthworldwide.WiththeinterestingexceptionofQualcomm(seeabove),thistrenddoesnotholdinChile.ThismaypartlyreflecttheimitativecapacityofChileanfirmsinthepharmaceuticalandchemicalindustries,whichdoesnotappeartoexistinmostcomplextechnologyfields.However,preciselyunderstandingwhatexplainsthetechnologybreakdownofpatentfilingsinChilewarrantsfurtherinvestigation.Figure10presentsthebreakdownoftrademarkfilingsbygroupsofNiceclassesassociatedwithdifferenteconomicactivities.26Itconfirmswhatthelistoftop‐10applicantsalreadysuggested:trademarkuseismorewidelyspreadacrosseconomicactivity.Agricultureaccountsforthelargestshareoftrademarkfilings,withanaverageof14%.Theagriculturecategoryincludestrademarksheldbyvineyards(Niceclass33)andfruitproducers(Classes29and31),whichbothaccountforasizeableshareof
26ClassgroupsweredefinedbyEditalacrossproductandserviceclasses:Agriculturalproductsandservices:29,30,31,32,33,43;Chemicals:1,2,4;Construction,Infrastructure:6,17,19,37,40;Householdequipment:8,11,20,21;Leisure,Education,Training:13,15,16,28,41;Management,Communications,RealestateandFinancialservices:35,36;Pharmaceuticals,Health,Cosmetics:3,5,10,44;Scientificresearch,InformationandCommunicationtechnology:9,38,42,45;Textiles‐ClothingandAccessories:14,18,22,23,24,25,26,27,34;TransportationandLogistics:7,12,39.
29
agriculturalactivityinChile.Pharmaceuticalsmakeupalargeshareoftrademarkfilingstoo,onaverage12%between1991and2010–thoughfarbelowtheequivalentshareofpatents.27Interestingly,Figure9revealsastructuralbreakoccurringin2006,withFIRE(finance,insurance,andrealestate)morethandoublingitsfilingsharesattheexpenseoftextilesandhouseholdequipment.Aswillbefurtherexplainedbelow,anamendmenttoproceduralrulesonhowtospecifyclassesintrademarkapplicationsseemsresponsibleforthiscompositionalchange.
Figure10:Trademark(Niceclass)‐economicactivitymapping(1991‐2010)
Agriculture
ChemicalsConstruction
Household
Education
FIRE
Pharma/Cosmetics
Scientific
Textiles
Transportation
02
04
06
08
01
00%
Fili
ngs
1991 1997 2003 2009Application Year
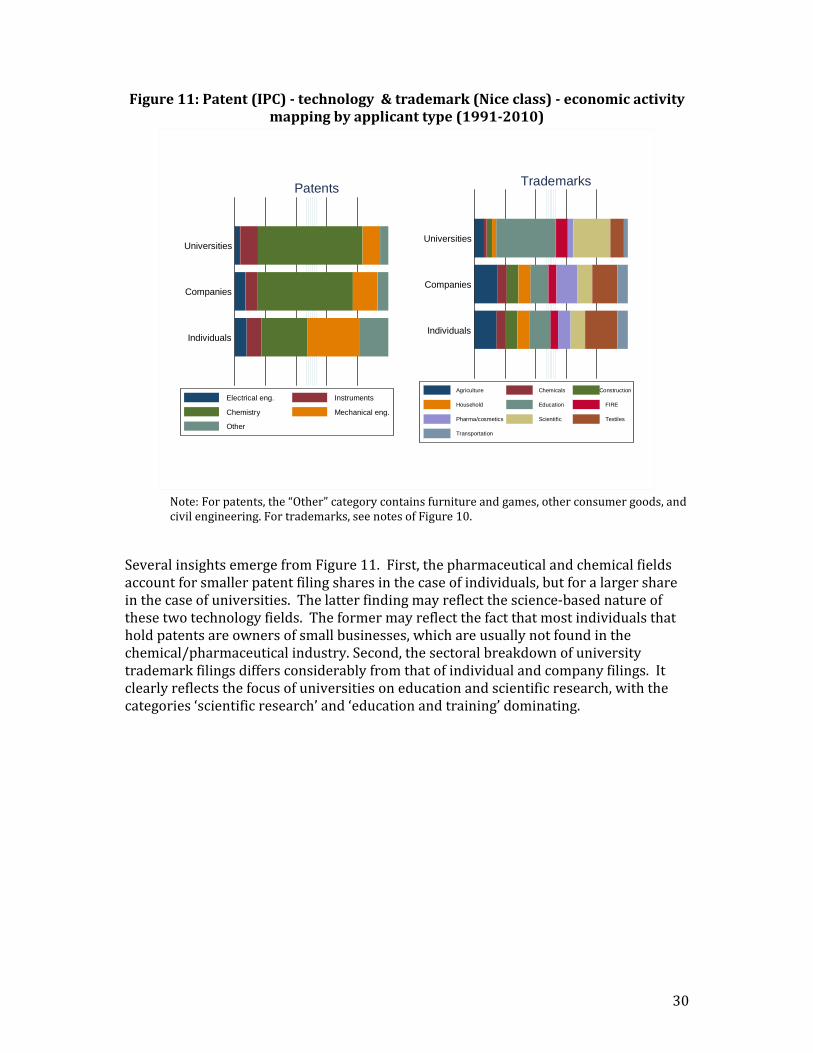
Notes:Agriculture:agriculturalproductsandservices;construction:constructionandinfrastructure;household:householdequipment;education:leisure,education,training;FIRE:management,communications,realestateandfinancialservices;pharma/cosmetics:pharmaceuticals,health,cosmetics;scientific:scientificresearch,informationtechnology,communications;textiles:textiles‐clothingandaccessories;transportation:transportationandlogistics.DoesthesectoralbreakdownofIPfilingsdifferaccordingtothetypeandoriginofapplicants?Figure11presentstheoverall1991‐2010sectoralbreakdownforuniversities,companies,andindividuals;Figure12doesthesameforresidents,multi‐residents,andnon‐residents.Ininterpretingthesefigures,itisimportanttokeepinmindthatthehorizontalbarsonlyshowsharesthatrefertoapplicationvolumesofsometimesmarkedlydifferentmagnitudes.
27Evenincombinationwithchemicals,theaverageshareonlyreaches18%.
30
Figure11:Patent(IPC)‐technology&trademark(Niceclass)‐economicactivitymappingbyapplicanttype(1991‐2010)
Individuals
Companies
Universities
Patents
Electrical eng. Instruments
Chemistry Mechanical eng.
Other
Individuals
Companies
Universities
Trademarks
Agriculture Chemicals Construction
Household Education FIRE
Pharma/cosmetics Scientific Textiles
Transportation
Note:Forpatents,the“Other”categorycontainsfurnitureandgames,otherconsumergoods,andcivilengineering.Fortrademarks,seenotesofFigure10.
SeveralinsightsemergefromFigure11.First,thepharmaceuticalandchemicalfieldsaccountforsmallerpatentfilingsharesinthecaseofindividuals,butforalargershareinthecaseofuniversities.Thelatterfindingmayreflectthescience‐basednatureofthesetwotechnologyfields.Theformermayreflectthefactthatmostindividualsthatholdpatentsareownersofsmallbusinesses,whichareusuallynotfoundinthechemical/pharmaceuticalindustry.Second,thesectoralbreakdownofuniversitytrademarkfilingsdiffersconsiderablyfromthatofindividualandcompanyfilings.Itclearlyreflectsthefocusofuniversitiesoneducationandscientificresearch,withthecategories‘scientificresearch’and‘educationandtraining’dominating.
31
Figure12:Patent(IPC)‐technology&trademark(Niceclass)‐economicactivitymappingbyresident(1991‐2010)
Non-residents
Non-resident multi-resident
Resident multi-residents
Residents
Patents
Electrical eng. Instruments
Chemistry Mechanical eng.
Other
Non-residents
Non-resident multi-residents
Resident multi-residents
Residents
Trademarks
Agriculture Chemicals Construction Household
Education FIRE Pharma Scientific
Textiles Transportation
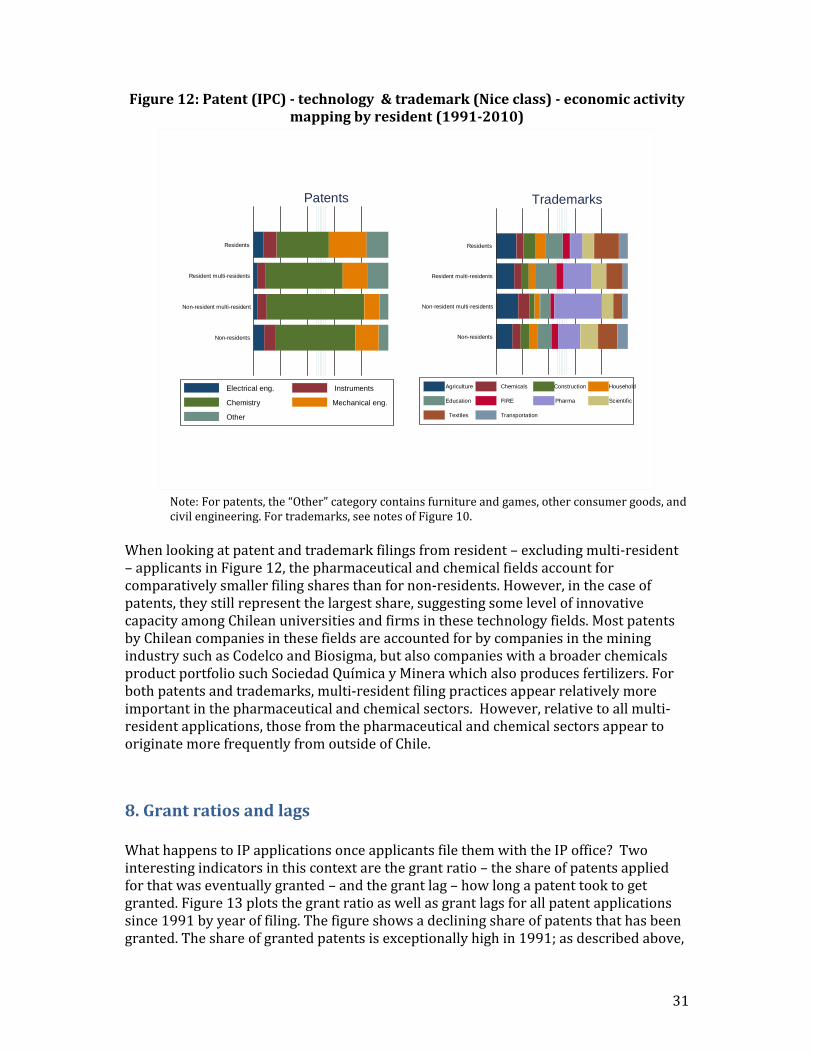
Note:Forpatents,the“Other”categorycontainsfurnitureandgames,otherconsumergoods,andcivilengineering.Fortrademarks,seenotesofFigure10.
Whenlookingatpatentandtrademarkfilingsfromresident–excludingmulti‐resident–applicantsinFigure12,thepharmaceuticalandchemicalfieldsaccountforcomparativelysmallerfilingsharesthanfornon‐residents.However,inthecaseofpatents,theystillrepresentthelargestshare,suggestingsomelevelofinnovativecapacityamongChileanuniversitiesandfirmsinthesetechnologyfields.MostpatentsbyChileancompaniesinthesefieldsareaccountedforbycompaniesintheminingindustrysuchasCodelcoandBiosigma,butalsocompanieswithabroaderchemicalsproductportfoliosuchSociedadQuímicayMinerawhichalsoproducesfertilizers.Forbothpatentsandtrademarks,multi‐residentfilingpracticesappearrelativelymoreimportantinthepharmaceuticalandchemicalsectors.However,relativetoallmulti‐residentapplications,thosefromthepharmaceuticalandchemicalsectorsappeartooriginatemorefrequentlyfromoutsideofChile.
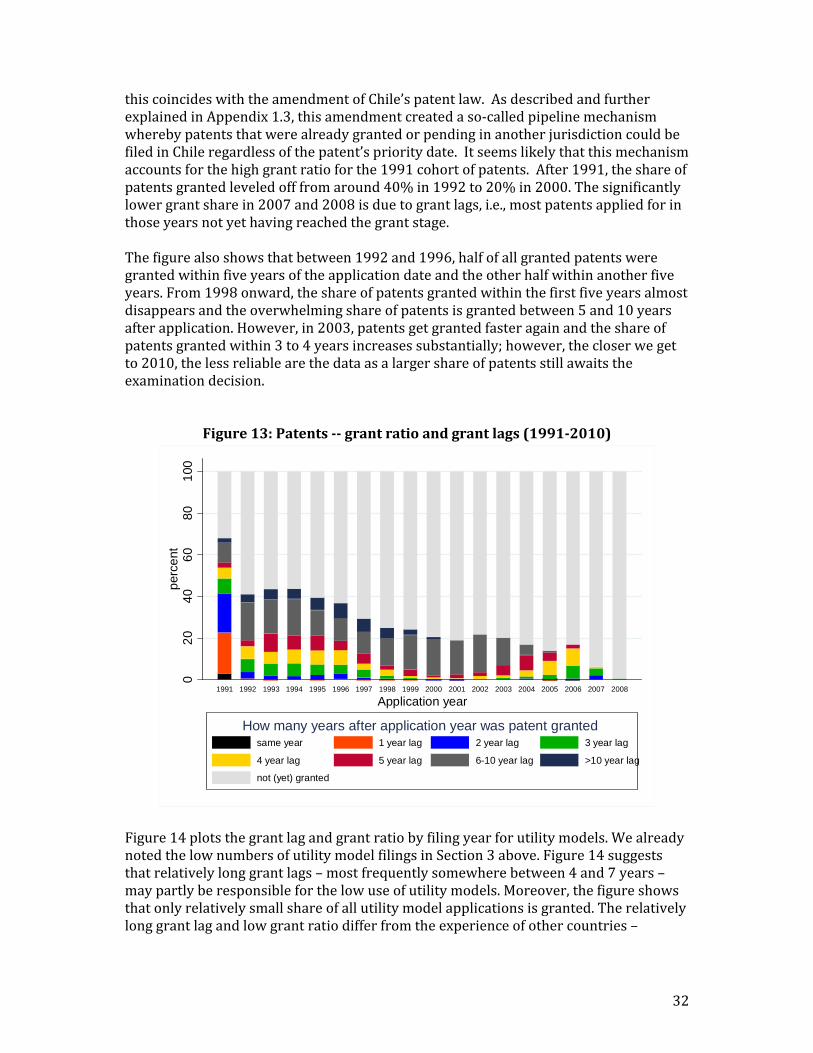
8.GrantratiosandlagsWhathappenstoIPapplicationsonceapplicantsfilethemwiththeIPoffice?Twointerestingindicatorsinthiscontextarethegrantratio–theshareofpatentsappliedforthatwaseventuallygranted–andthegrantlag–howlongapatenttooktogetgranted.Figure13plotsthegrantratioaswellasgrantlagsforallpatentapplicationssince1991byyearoffiling.Thefigureshowsadecliningshareofpatentsthathasbeengranted.Theshareofgrantedpatentsisexceptionallyhighin1991;asdescribedabove,
32
thiscoincideswiththeamendmentofChile’spatentlaw.AsdescribedandfurtherexplainedinAppendix1.3,thisamendmentcreatedaso‐calledpipelinemechanismwherebypatentsthatwerealreadygrantedorpendinginanotherjurisdictioncouldbefiledinChileregardlessofthepatent’sprioritydate.Itseemslikelythatthismechanismaccountsforthehighgrantratioforthe1991cohortofpatents.After1991,theshareofpatentsgrantedleveledofffromaround40%in1992to20%in2000.Thesignificantlylowergrantsharein2007and2008isduetograntlags,i.e.,mostpatentsappliedforinthoseyearsnotyethavingreachedthegrantstage.Thefigurealsoshowsthatbetween1992and1996,halfofallgrantedpatentsweregrantedwithinfiveyearsoftheapplicationdateandtheotherhalfwithinanotherfiveyears.From1998onward,theshareofpatentsgrantedwithinthefirstfiveyearsalmostdisappearsandtheoverwhelmingshareofpatentsisgrantedbetween5and10yearsafterapplication.However,in2003,patentsgetgrantedfasteragainandtheshareofpatentsgrantedwithin3to4yearsincreasessubstantially;however,thecloserwegetto2010,thelessreliablearethedataasalargershareofpatentsstillawaitstheexaminationdecision.
Figure13:Patents‐‐grantratioandgrantlags(1991‐2010)
02
04
06
08
01
00p
erce
nt
1991 1992 1993 1994 1995 1996 1997 1998 1999 2000 2001 2002 2003 2004 2005 2006 2007 2008
Application year
same year 1 year lag 2 year lag 3 year lag
4 year lag 5 year lag 6-10 year lag >10 year lag
not (yet) granted
How many years after application year was patent granted
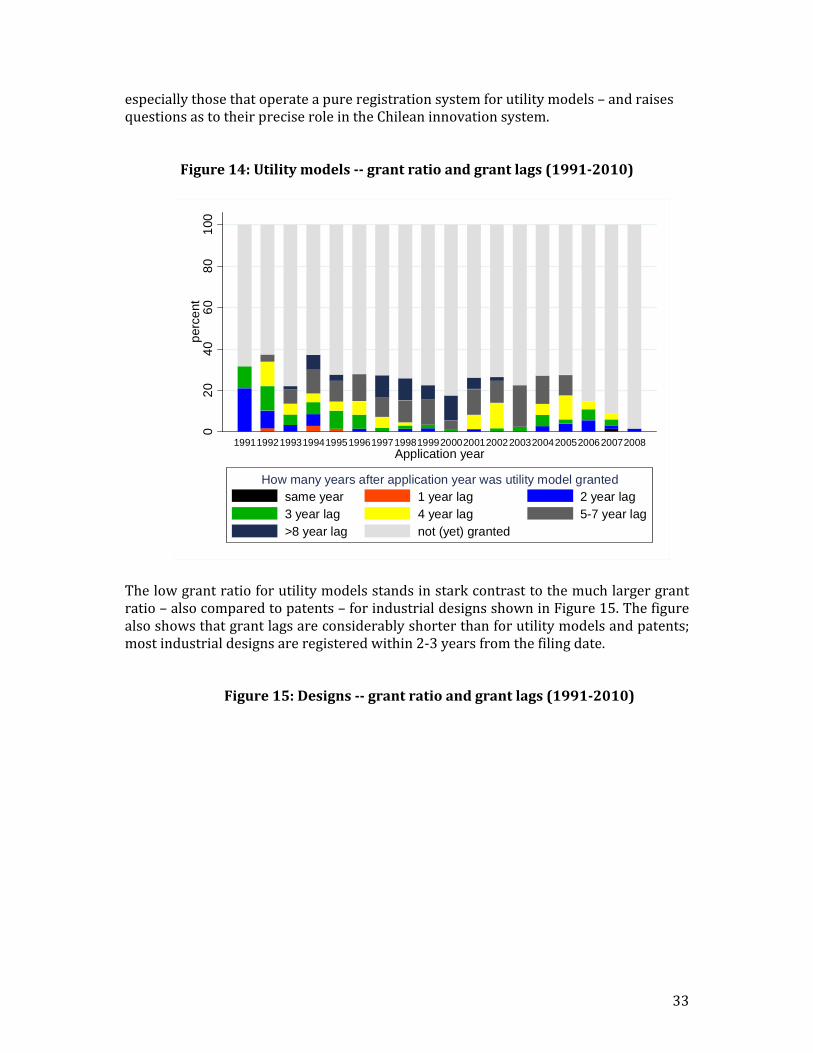
Figure14plotsthegrantlagandgrantratiobyfilingyearforutilitymodels.WealreadynotedthelownumbersofutilitymodelfilingsinSection3above.Figure14suggeststhatrelativelylonggrantlags–mostfrequentlysomewherebetween4and7years–maypartlyberesponsibleforthelowuseofutilitymodels.Moreover,thefigureshowsthatonlyrelativelysmallshareofallutilitymodelapplicationsisgranted.Therelativelylonggrantlagandlowgrantratiodifferfromtheexperienceofothercountries–
33
especiallythosethatoperateapureregistrationsystemforutilitymodels–andraisesquestionsastotheirpreciseroleintheChileaninnovationsystem.
Figure14:Utilitymodels‐‐grantratioandgrantlags(1991‐2010)
02
04
06
08
01
00p
erce
nt
199119921993199419951996199719981999200020012002200320042005200620072008Application year
same year 1 year lag 2 year lag3 year lag 4 year lag 5-7 year lag>8 year lag not (yet) granted
How many years after application year was utility model granted
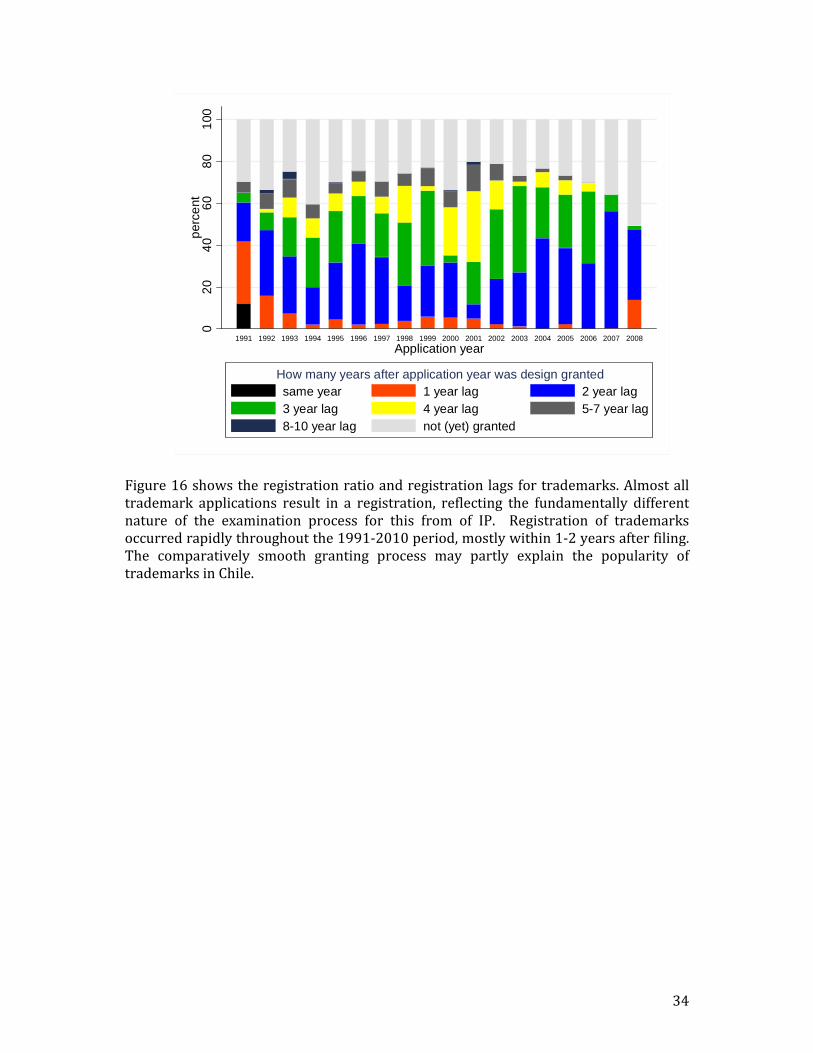
Thelowgrantratioforutilitymodelsstandsinstarkcontrasttothemuchlargergrantratio–alsocomparedtopatents–forindustrialdesignsshowninFigure15.Thefigurealsoshowsthatgrantlagsareconsiderablyshorterthanforutilitymodelsandpatents;mostindustrialdesignsareregisteredwithin2‐3yearsfromthefilingdate.
Figure15:Designs‐‐grantratioandgrantlags(1991‐2010)
34
02
04
06
08
01
00p
erce
nt
1991 1992 1993 1994 1995 1996 1997 1998 1999 2000 2001 2002 2003 2004 2005 2006 2007 2008
Application year
same year 1 year lag 2 year lag3 year lag 4 year lag 5-7 year lag8-10 year lag not (yet) granted
How many years after application year was design granted
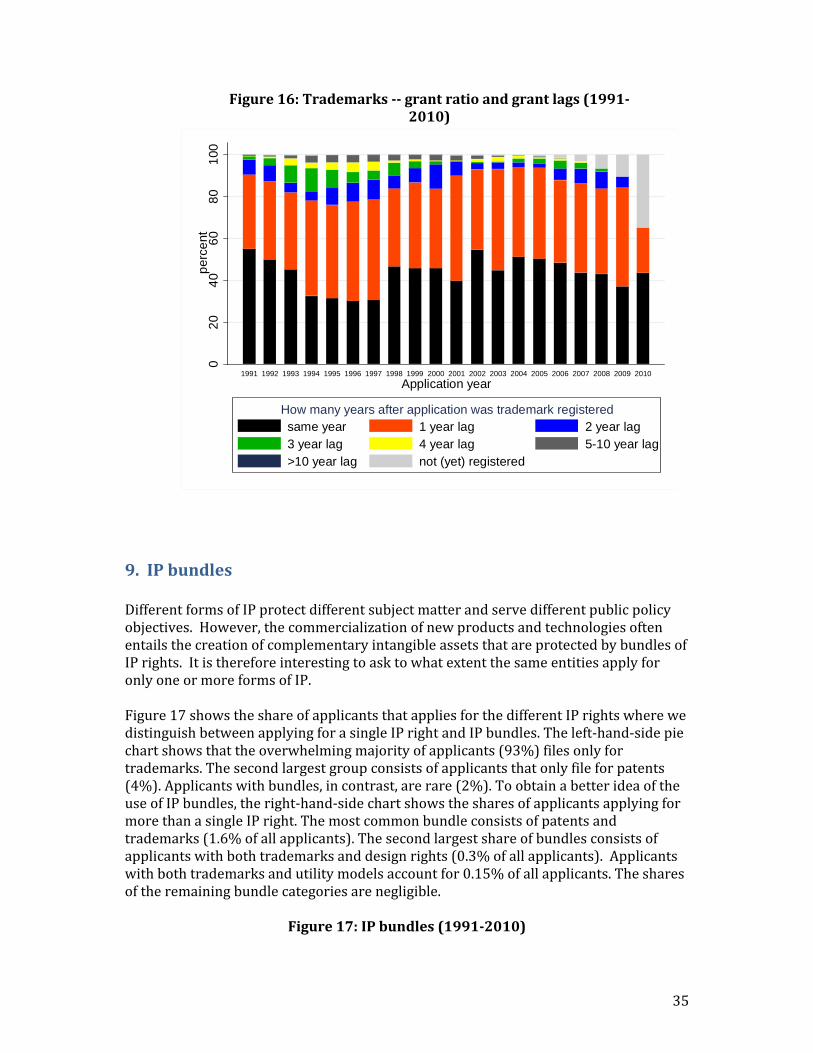
Figure16showstheregistrationratioandregistrationlagsfortrademarks.Almostalltrademark applications result in a registration, reflecting the fundamentally differentnature of the examination process for this from of IP. Registration of trademarksoccurredrapidlythroughoutthe1991‐2010period,mostlywithin1‐2yearsafterfiling.The comparatively smooth granting process may partly explain the popularity oftrademarksinChile.
35
Figure16:Trademarks‐‐grantratioandgrantlags(1991‐2010)
02
04
06
08
01
00p
erce
nt
1991 1992 1993 1994 1995 1996 1997 1998 1999 2000 2001 2002 2003 2004 2005 2006 2007 2008 2009 2010
Application year
same year 1 year lag 2 year lag3 year lag 4 year lag 5-10 year lag>10 year lag not (yet) registered
How many years after application was trademark registered
9.IPbundlesDifferentformsofIPprotectdifferentsubjectmatterandservedifferentpublicpolicyobjectives.However,thecommercializationofnewproductsandtechnologiesoftenentailsthecreationofcomplementaryintangibleassetsthatareprotectedbybundlesofIPrights.ItisthereforeinterestingtoasktowhatextentthesameentitiesapplyforonlyoneormoreformsofIP.Figure17showstheshareofapplicantsthatappliesforthedifferentIPrightswherewedistinguishbetweenapplyingforasingleIPrightandIPbundles.Theleft‐hand‐sidepiechartshowsthattheoverwhelmingmajorityofapplicants(93%)filesonlyfortrademarks.Thesecondlargestgroupconsistsofapplicantsthatonlyfileforpatents(4%).Applicantswithbundles,incontrast,arerare(2%).ToobtainabetterideaoftheuseofIPbundles,theright‐hand‐sidechartshowsthesharesofapplicantsapplyingformorethanasingleIPright.Themostcommonbundleconsistsofpatentsandtrademarks(1.6%ofallapplicants).Thesecondlargestshareofbundlesconsistsofapplicantswithbothtrademarksanddesignrights(0.3%ofallapplicants).Applicantswithbothtrademarksandutilitymodelsaccountfor0.15%ofallapplicants.Thesharesoftheremainingbundlecategoriesarenegligible.
Figure17:IPbundles(1991‐2010)

36
Patent only Trademark only Utility only
Design only Bundle
All
Patent & TM Patent & utility
Patent & design TM & utility
TM & design Design & utility
Patent & design & utility TM & design & utility
Patent & TM & design & utility
Only bundles
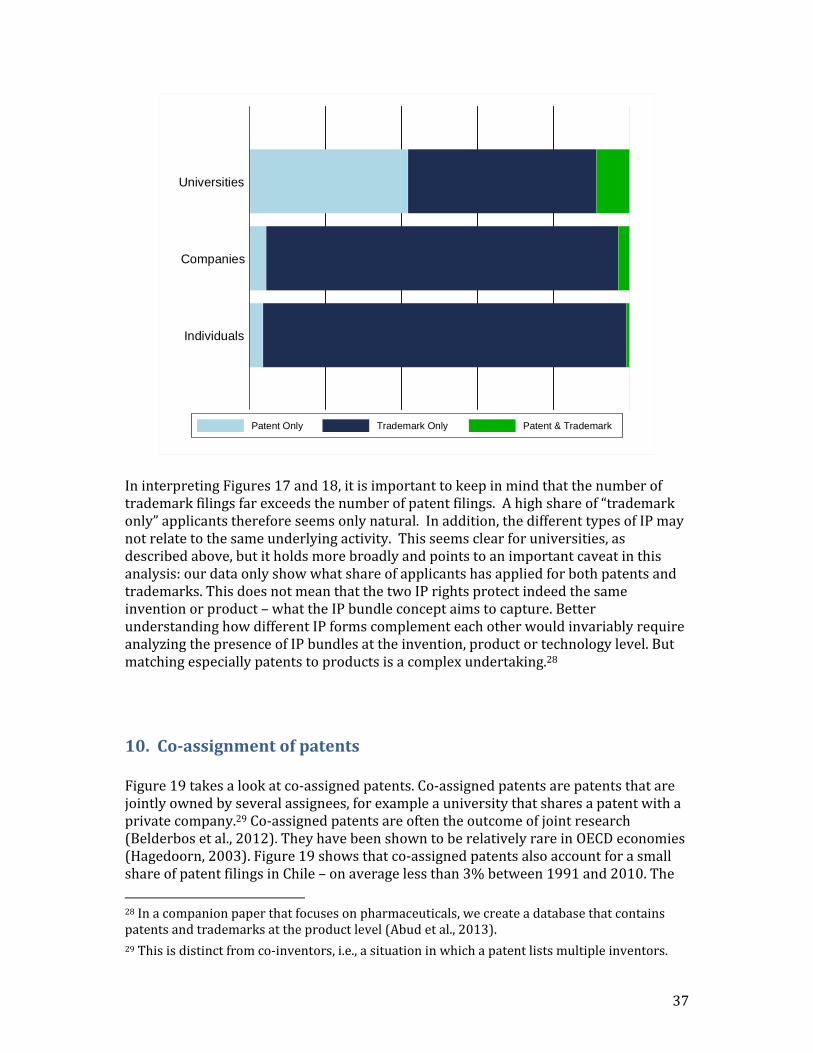
Figure18illustratesthepresenceofIPbundlesbyapplicanttypes.GiventhelimiteduseofutilitymodelsanddesignrightsinChile,Figure18islimitedtopatentsandtrademarks.Itshowsthat9%ofalluniversityapplicantshaveappliedforatleastonetrademarkandonepatentoverthe1991‐2010period.Strikingly,42%ofuniversityapplicantsappliedonlyforpatentsand49%onlyfortrademarks.Theshareofcompaniesorindividualsthatonlyapplyforpatentsisalotsmaller(5%and4%respectively).Assumingthattrademarkslargelyservecommercializationpurposes,thelargeshareofuniversitiesthatonlyfileforpatentsreflectsagaintheresearchmandateofuniversities.Nevertheless,halfofallIPactiveuniversitiesfileonlyfortrademarkprotection.Mostofthesetrademarksrelatetodegreeprogramsandthebrandofuniversitiesmoregenerally.Thiscouldindicatethatsomeuniversitiesspecializeinteachingandadoptabrandingstrategythatincorporatestheuseoftrademarks.TheshareofuniversitieswithIPbundlesis11%.TheIPbundlesshareisconsiderablysmallerforcompanies,standingat3%anditisclosetozeroforindividuals.Figure18:IPbundles(patents&trademarks)byapplicanttype(1991‐2010)
37
Individuals
Companies
Universities
Patent Only Trademark Only Patent & Trademark
IninterpretingFigures17and18,itisimportanttokeepinmindthatthenumberoftrademarkfilingsfarexceedsthenumberofpatentfilings.Ahighshareof“trademarkonly”applicantsthereforeseemsonlynatural.Inaddition,thedifferenttypesofIPmaynotrelatetothesameunderlyingactivity.Thisseemsclearforuniversities,asdescribedabove,butitholdsmorebroadlyandpointstoanimportantcaveatinthisanalysis:ourdataonlyshowwhatshareofapplicantshasappliedforbothpatentsandtrademarks.ThisdoesnotmeanthatthetwoIPrightsprotectindeedthesameinventionorproduct–whattheIPbundleconceptaimstocapture.BetterunderstandinghowdifferentIPformscomplementeachotherwouldinvariablyrequireanalyzingthepresenceofIPbundlesattheinvention,productortechnologylevel.Butmatchingespeciallypatentstoproductsisacomplexundertaking.28
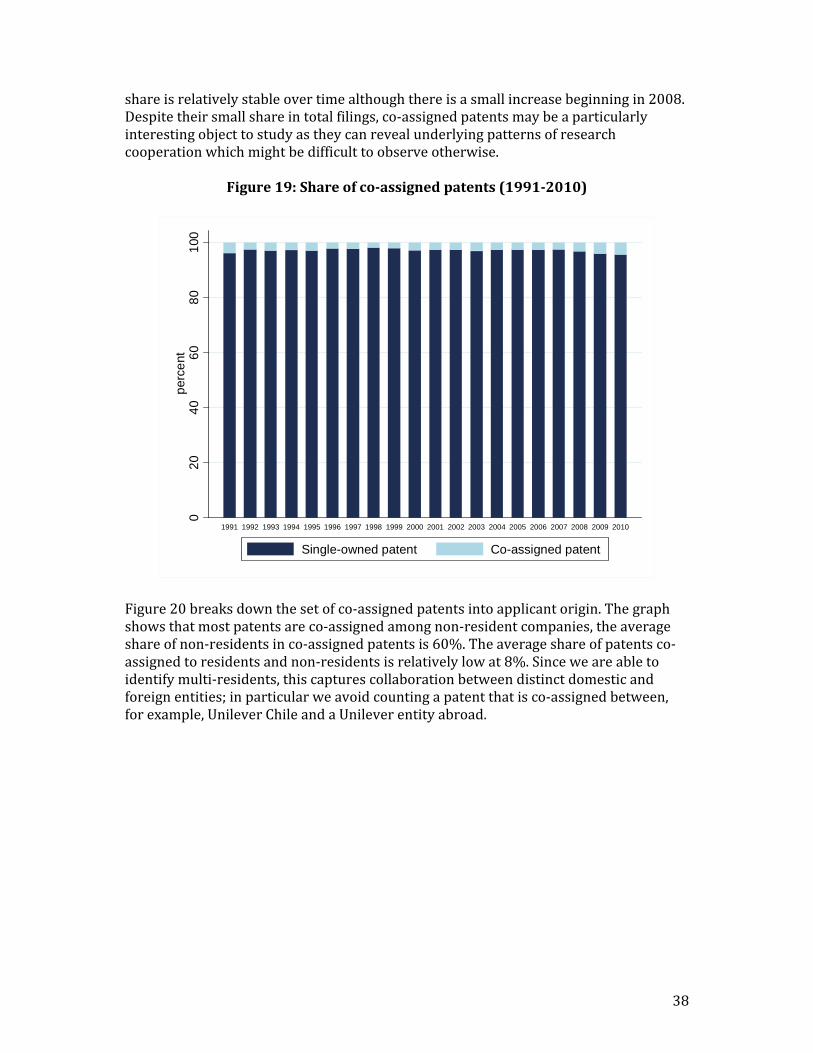
10.Co‐assignmentofpatentsFigure19takesalookatco‐assignedpatents.Co‐assignedpatentsarepatentsthatarejointlyownedbyseveralassignees,forexampleauniversitythatsharesapatentwithaprivatecompany.29Co‐assignedpatentsareoftentheoutcomeofjointresearch(Belderbosetal.,2012).TheyhavebeenshowntoberelativelyrareinOECDeconomies(Hagedoorn,2003).Figure19showsthatco‐assignedpatentsalsoaccountforasmallshareofpatentfilingsinChile–onaveragelessthan3%between1991and2010.The
28Inacompanionpaperthatfocusesonpharmaceuticals,wecreateadatabasethatcontainspatentsandtrademarksattheproductlevel(Abudetal.,2013).29Thisisdistinctfromco‐inventors,i.e.,asituationinwhichapatentlistsmultipleinventors.
38
shareisrelativelystableovertimealthoughthereisasmallincreasebeginningin2008.Despitetheirsmallshareintotalfilings,co‐assignedpatentsmaybeaparticularlyinterestingobjecttostudyastheycanrevealunderlyingpatternsofresearchcooperationwhichmightbedifficulttoobserveotherwise.
Figure19:Shareofco‐assignedpatents(1991‐2010)
02
04
06
08
01
00p
erce
nt
1991 1992 1993 1994 1995 1996 1997 1998 1999 2000 2001 2002 2003 2004 2005 2006 2007 2008 2009 2010
Single-owned patent Co-assigned patent
Figure20breaksdownthesetofco‐assignedpatentsintoapplicantorigin.Thegraphshowsthatmostpatentsareco‐assignedamongnon‐residentcompanies,theaverageshareofnon‐residentsinco‐assignedpatentsis60%.Theaverageshareofpatentsco‐assignedtoresidentsandnon‐residentsisrelativelylowat8%.Sinceweareabletoidentifymulti‐residents,thiscapturescollaborationbetweendistinctdomesticandforeignentities;inparticularweavoidcountingapatentthatisco‐assignedbetween,forexample,UnileverChileandaUnileverentityabroad.

39
Figure20:Shareofco‐assignedpatentsresidentsandnonresidents(1991‐2010)
02
04
06
08
01
00p
erce
nt
1991 1992 1993 1994 1995 1996 1997 1998 1999 2000 2001 2002 2003 2004 2005 2006 2007 2008 2009 2010
Non-residents Residents Residents & non-residents
Togainmoreinsightintoanycollaborationpatternsunderlyingtheco‐assignmentofpatents,Figure21plotstheshareofpatentsco‐assignedbetweendifferentapplicanttypes.Co‐assignmentsinvolvinguniversitiesaccountforaround20%ofco‐assignedpatentsoverthewhole1991‐2010period.Thesharefluctuatesconsiderably–between4%in1992and50%in2010,thoughthePCTtransitionlikelybiasesthesharesfor2010(seeabove).Figure21alsoshowsthatasizeableshareofpatentsisco‐assignedamongindividuals.Itislikelythattheseindividualsarealsoco‐inventors.Mostpatentsareco‐assignedbetweencompaniesreflectingresearchcollaborationacrosscompanies,potentiallyevenproductmarketcompetitors.30
30BenaventeandLauterbach(2007)findfortheirdatafromthe4thwaveoftheChileaninnovationsurveythataround6%ofinnovativecompaniescooperatewithproductmarketcompetitors.Theshareofinnovativecompaniesthatcooperatewithuniversitiesiswith7%slightlylarger.

40
Figure21:Shareofco‐assignedpatentsbyapplicanttype(1991‐2010)
02
04
06
08
01
00p
erce
nt
1991 1992 1993 1994 1995 1996 1997 1998 1999 2000 2001 2002 2003 2004 2005 2006 2007 2008 2009 2010
Company Company & Individual Individual
University University & Company Univ. & Individual
University, Company & Individual
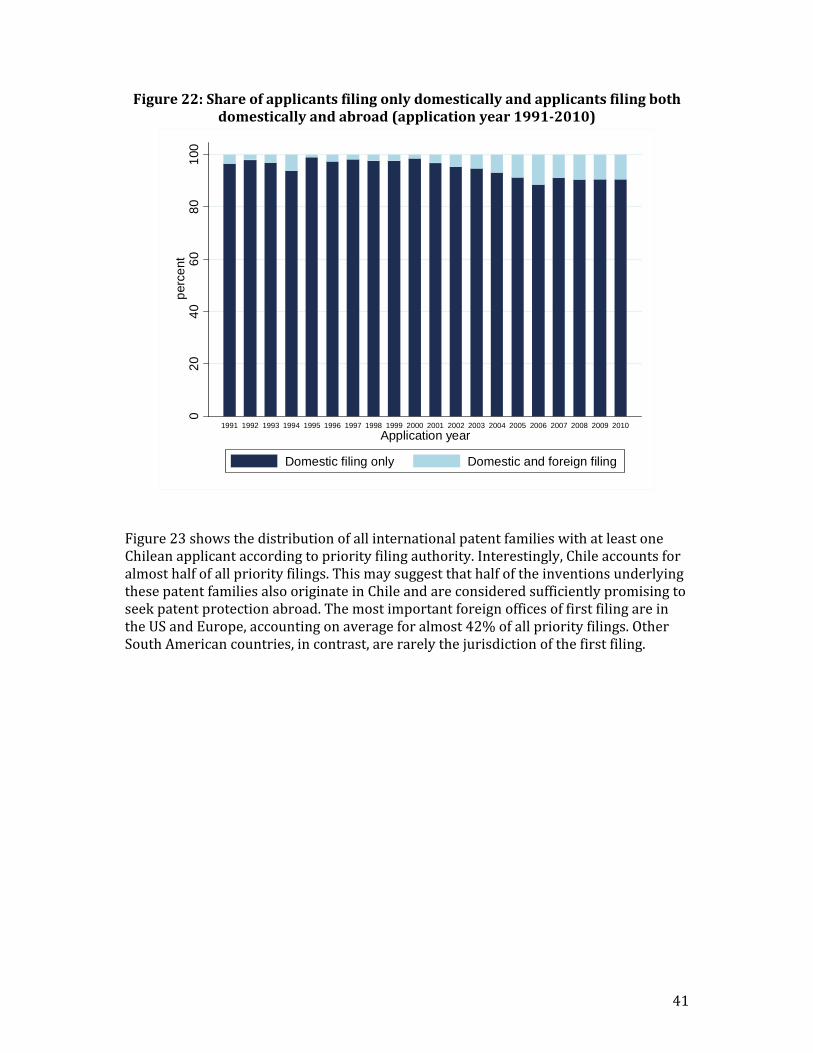
11.PatentfilingsabroadInthissectionwecombinedataonpatentfilingsbyChileanresidentsabroadwiththeINAPIdatabase.WeextractedfromtheEPOPatstatdatabase(versionSeptember2012)allpatentapplicationsthatlistaChileanapplicantorinventor.31Toavoiddoublecounting,welookatinternationalfilingsattheequivalent–orpatentfamily–level.Tobeginwith,wefoundatotalof1,236patentfamiliesthatlistChileanapplicants.Whenwerestrictthedatatofamilieswithaprioritydatebetween1991and2010,weareleftwith903patentfamilies.WethencleanedandharmonizedtheapplicantnamesassociatedwiththesepatentfamiliesandmatchedthemwiththeapplicantnamesintheINAPI‐WIPOdatabase.Figure22plotstheshareofChileanresidentapplicantsthatfileforapatentbothdomesticallyandabroad.Thisshareliesbelow15percentthroughoutthe1991‐2010perdiod,thoughthereisaclearupwardtrendfrom2001onward.ThisislikelytoreflectanincreasinglysuccessfulexportorientationofatleastsomeChileancompanies.
31Notethatthedatacoveragevariesacrossjurisdictions.WhilePatstatprovidescompletecoverageforexamplefortheUS,China,andallmembersoftheEuropeanPatentConvention,filingsareincompleteespeciallyformiddleincomecountriessuchasSouthAfricaorBrazil.
41
Figure22:Shareofapplicantsfilingonlydomesticallyandapplicantsfilingbothdomesticallyandabroad(applicationyear1991‐2010)
02
04
06
08
01
00p
erce
nt
1991 1992 1993 1994 1995 1996 1997 1998 1999 2000 2001 2002 2003 2004 2005 2006 2007 2008 2009 2010
Application year
Domestic filing only Domestic and foreign filing
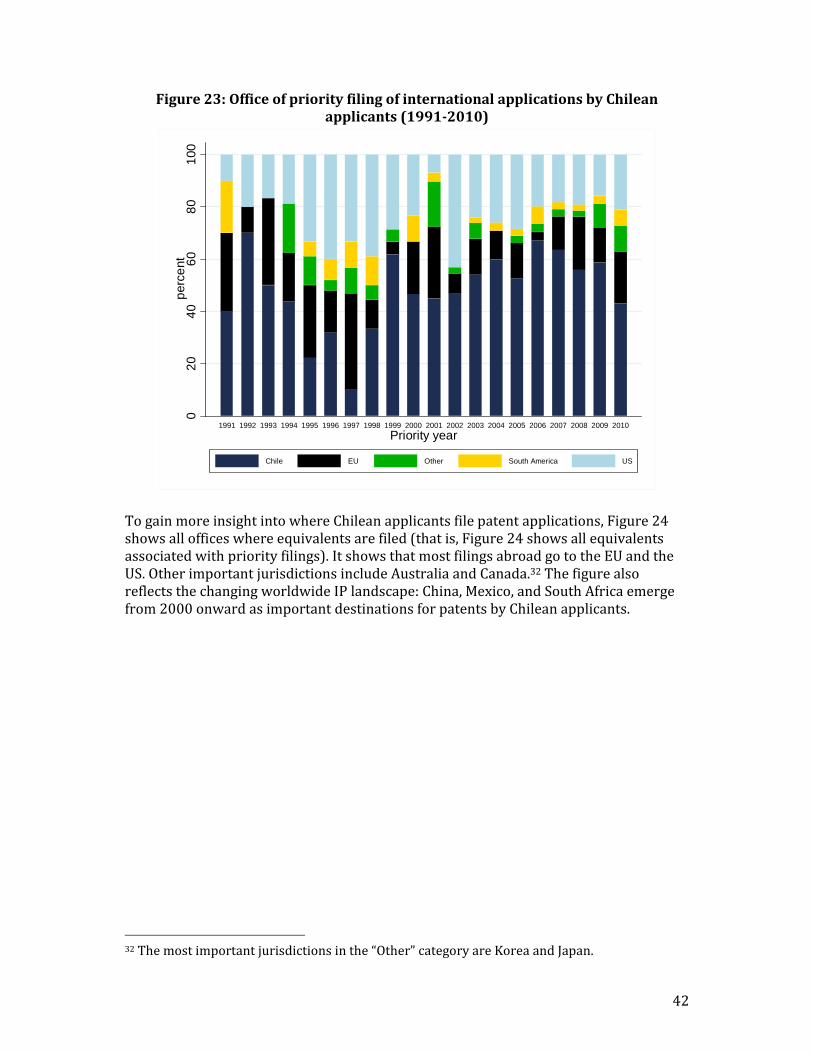
Figure23showsthedistributionofallinternationalpatentfamilieswithatleastoneChileanapplicantaccordingtopriorityfilingauthority.Interestingly,Chileaccountsforalmosthalfofallpriorityfilings.ThismaysuggestthathalfoftheinventionsunderlyingthesepatentfamiliesalsooriginateinChileandareconsideredsufficientlypromisingtoseekpatentprotectionabroad.ThemostimportantforeignofficesoffirstfilingareintheUSandEurope,accountingonaverageforalmost42%ofallpriorityfilings.OtherSouthAmericancountries,incontrast,arerarelythejurisdictionofthefirstfiling.
42
Figure23:OfficeofpriorityfilingofinternationalapplicationsbyChileanapplicants(1991‐2010)
02
04
06
08
01
00p
erce
nt
1991 1992 1993 1994 1995 1996 1997 1998 1999 2000 2001 2002 2003 2004 2005 2006 2007 2008 2009 2010
Priority year
Chile EU Other South America US
TogainmoreinsightintowhereChileanapplicantsfilepatentapplications,Figure24showsallofficeswhereequivalentsarefiled(thatis,Figure24showsallequivalentsassociatedwithpriorityfilings).ItshowsthatmostfilingsabroadgototheEUandtheUS.OtherimportantjurisdictionsincludeAustraliaandCanada.32ThefigurealsoreflectsthechangingworldwideIPlandscape:China,Mexico,andSouthAfricaemergefrom2000onwardasimportantdestinationsforpatentsbyChileanapplicants.
32Themostimportantjurisdictionsinthe“Other”categoryareKoreaandJapan.
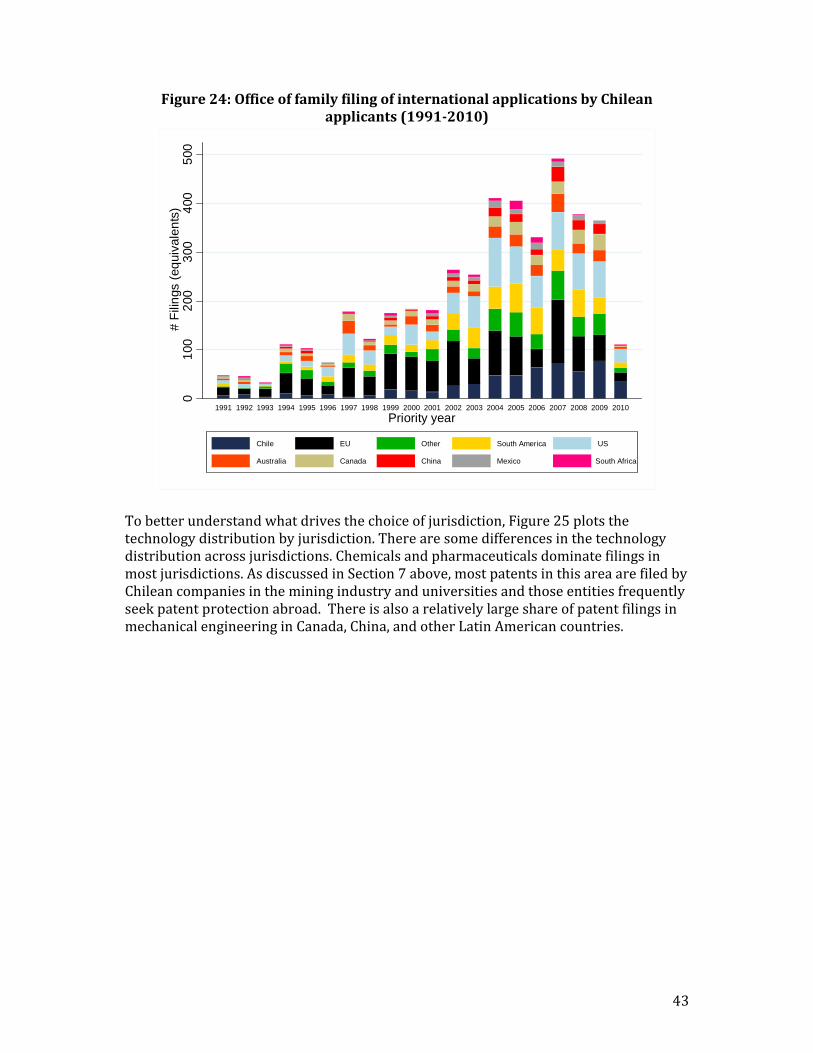
43
Figure24:OfficeoffamilyfilingofinternationalapplicationsbyChileanapplicants(1991‐2010)
01
002
003
004
005
00#
Fili
ngs
(eq
uiva
len
ts)
1991 1992 1993 1994 1995 1996 1997 1998 1999 2000 2001 2002 2003 2004 2005 2006 2007 2008 2009 2010
Priority year
Chile EU Other South America US
Australia Canada China Mexico South Africa
Tobetterunderstandwhatdrivesthechoiceofjurisdiction,Figure25plotsthetechnologydistributionbyjurisdiction.Therearesomedifferencesinthetechnologydistributionacrossjurisdictions.Chemicalsandpharmaceuticalsdominatefilingsinmostjurisdictions.AsdiscussedinSection7above,mostpatentsinthisareaarefiledbyChileancompaniesintheminingindustryanduniversitiesandthoseentitiesfrequentlyseekpatentprotectionabroad.ThereisalsoarelativelylargeshareofpatentfilingsinmechanicalengineeringinCanada,China,andotherLatinAmericancountries.

44
Figure25:IPC‐technologymappingofinternationalapplicationsbyChileanapplicantsbyofficeofpriorityfiling(1991‐2010)
02
04
06
08
01
00p
erce
nt
Australia Canada Chile China EU Mexico Other South America US South Africa
Electric engineering Instruments Chemicals/pharma
Mechanical engineering Other
Table8liststhetop10Chileanapplicantsfilingabroad.Thetablebearssimilaritywiththetop10residentpatentapplicants(Table3).ThesixuniversitiesthatappearedinTable3arealsoamongthetop‐10applicantsfilingabroad.Inaddition,BiosigmaandCodelcoappearinbothlists.VulcoandVirutexIlko,inturn,emergeastopcompanyfilersabroad,eventhoughtheyarenotamongtheresidenttop‐10filers.Vulcoisamechanicalengineeringcompanythatmainlyservestheminingindustry.VirutexIlkoisaconsumergoods/chemicalscompany.
Table8:Top10internationalChileanapplicants‐‐patents(1991‐2010)
Rank Name # Int. families
% Total abroad Industry
1 Universidad de Chile 35 2.17% University
2 Biosigma* 27 1.67% Mining
3 PUC Chile 24 1.49% University
4 Universidad de Concepcion 21 1.30% University
5 Universidad de Santiago Chile 19 1.18% University
6 Universidad Tecnica Federico Santa Maria
15 0.93% University
7 Codelco 15 0.93% Mining
8 Vulco 13 0.81%
Mechanical engineering
9 PUC Valparaiso 11 0.68% University

45
10 Virutex Ilko 9 0.56% Consumer products
Total 189 11.53%
* Subsidiary of Codelco since 2002.
Finally,wealsoextractedfromPatstatallpatentfamiliesthatlistaChileanresidentamongtheinventor(s)listedonapatent.Wefind799suchpatentfamilieswithaprioritydatebetween1991and2010,accountingfor1,698Chileaninventors.Figure26plotsthetechnologydistributionoftheIPCcodeslistedonthesepatents.TheresultingbreakdownissimilartotheoneforpatentfamilieswithChileanapplicants.Thechemicalandpharmaceuticalfieldsaccountforalmosthalfofthetotal.Mechanicalengineeringisthesecondlargestfieldandaccountsforaround18%.Mostpatentsinthelarge“Other”categoryarerelatedtocivilengineering.
Figure26:IPC‐technologymappingofinternationalapplicationswithChileaninventors(1991‐2010)
Electric engineering Instruments Chemicals/pharma
Mechanical engineering Other
12.AcloserlookattrademarkactivityThissectiontakesacloserlookattrademarkfilingsfromvariousangles.Figure27alooksatpersistenceintrademarkfilings.Thegoalofthefigureistoshedlightonthe

46
shareoftrademarkfilingsthatarefiledbyapplicantsthatfrequentlyusethetrademarksystem.Thefiguredistinguishesbetweenthreetypesoffilings:(i)filingsby“one‐time”applicantsthatfileforthefirsttimeinagivenyearandthatdonotfileagainthroughouttheperiodunderstudy,(ii)filingsbyapplicantsthatfileforthefirsttimeinagivenyear–whichcanbeinterpretedas“entry”intotrademarking–andthatfileagaininasubsequentyear,and(iii)filingsinagivenyearbyapplicantsthathavefiledforatrademarkalreadyinapreviousyear.Thefigurehastobeinterpretedwithcautionasitisaffectedbybothleftandrighttruncationofthedata;inparticular,thebarsfortheearlyandlatersampleyearshavelittlemeaning.Still,thefigurerevealsasurprisinglystableshareofone‐timeapplicantsovertimeofaround20%.Thisimpliesthattheobservedgrowthintrademarkfilingsisnotdrivendisproportionatelybyentryofsuchon‐offfilings.Mosttrademarkfilingscomefromrepeat‐filerssuggestingthattheunderlyingtrademarksareusedforsomecommercialpurpose.
Figure27a:Persistenceintrademarkingbehavior(1991‐2010)
02
04
06
08
01
00p
erce
nt
1991 1992 1993 1994 1995 1996 1997 1998 1999 2000 2001 2002 2003 2004 2005 2006 2007 2008 2009 2010
Application year
Trademark in a given year -- and have applied for a trademark before
Trademark for the first time in a given year -- and again some time thereafter
Trademark for the first time in a given year -- but not again any time thereafter
Share of trademarks in a given year by applicants that:
Anotherwaytolookatthisistocalculatetheshareofapplicationsbyapplicantsthatfiledatleastoneapplicationinthepreviousyear.Startingin1992,thissolvesthetruncationproblem,thoughitintroducesastrictercriterionofwhatareconsideredrepeatapplicants.Figure27bshowsthattheshareofapplicationsbypreviousyearapplicantshasconsistentlyincreasedoverthe1992‐2010period,fromjustbelow50%in1992toalmost75%in2010.Inotherwords,repeatapplicantshaveaccountedforfasterfilinggrowththannon‐repeatapplicants.Acloserlookatthedatarevealsthatthisisduetoanincreaseinthenumberofrepeatapplicantsratherthananincreaseintheaveragenumberoffilingspersuchapplicant.
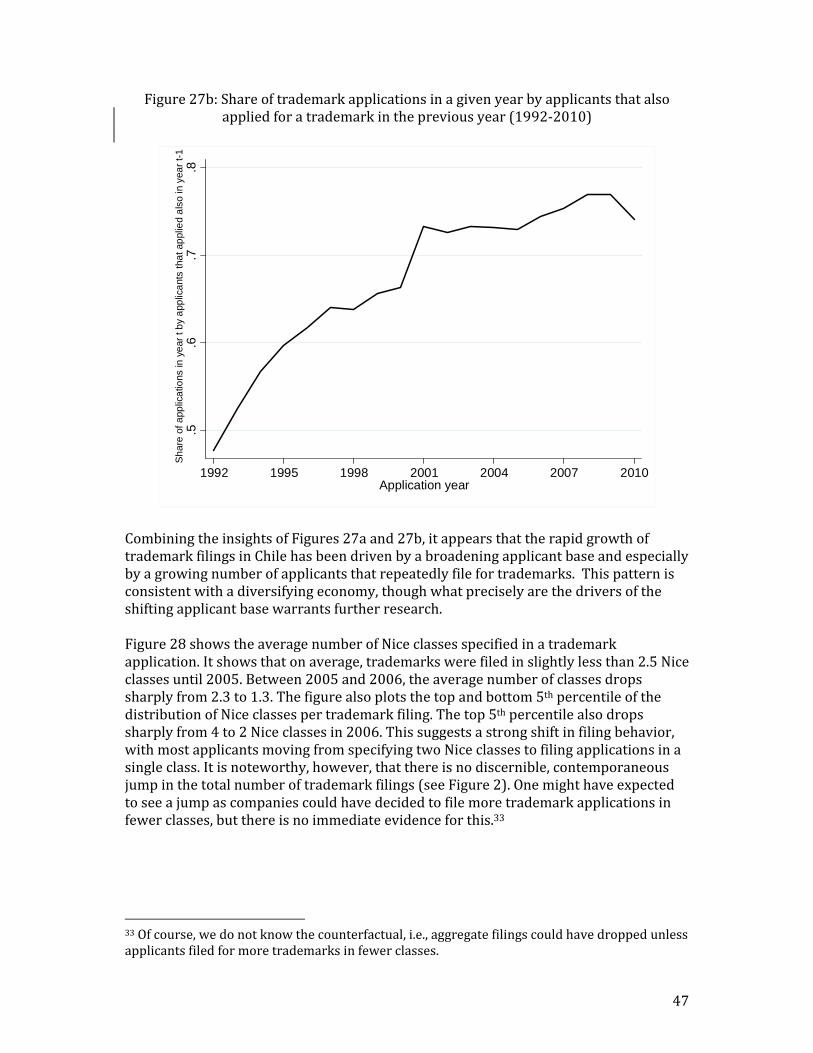
47
Figure27b:Shareoftrademarkapplicationsinagivenyearbyapplicantsthatalsoappliedforatrademarkinthepreviousyear(1992‐2010)
.5.6
.7.8
Sh
are
of a
pplic
atio
ns in
ye
ar t
by
app
lica
nts
tha
t ap
plie
d a
lso
in y
ear
t-1
1992 1995 1998 2001 2004 2007 2010Application year
CombiningtheinsightsofFigures27aand27b,itappearsthattherapidgrowthoftrademarkfilingsinChilehasbeendrivenbyabroadeningapplicantbaseandespeciallybyagrowingnumberofapplicantsthatrepeatedlyfilefortrademarks.Thispatternisconsistentwithadiversifyingeconomy,thoughwhatpreciselyarethedriversoftheshiftingapplicantbasewarrantsfurtherresearch.Figure28showstheaveragenumberofNiceclassesspecifiedinatrademarkapplication.Itshowsthatonaverage,trademarkswerefiledinslightlylessthan2.5Niceclassesuntil2005.Between2005and2006,theaveragenumberofclassesdropssharplyfrom2.3to1.3.Thefigurealsoplotsthetopandbottom5thpercentileofthedistributionofNiceclassespertrademarkfiling.Thetop5thpercentilealsodropssharplyfrom4to2Niceclassesin2006.Thissuggestsastrongshiftinfilingbehavior,withmostapplicantsmovingfromspecifyingtwoNiceclassestofilingapplicationsinasingleclass.Itisnoteworthy,however,thatthereisnodiscernible,contemporaneousjumpinthetotalnumberoftrademarkfilings(seeFigure2).Onemighthaveexpectedtoseeajumpascompaniescouldhavedecidedtofilemoretrademarkapplicationsinfewerclasses,butthereisnoimmediateevidenceforthis.33
33Ofcourse,wedonotknowthecounterfactual,i.e.,aggregatefilingscouldhavedroppedunlessapplicantsfiledformoretrademarksinfewerclasses.
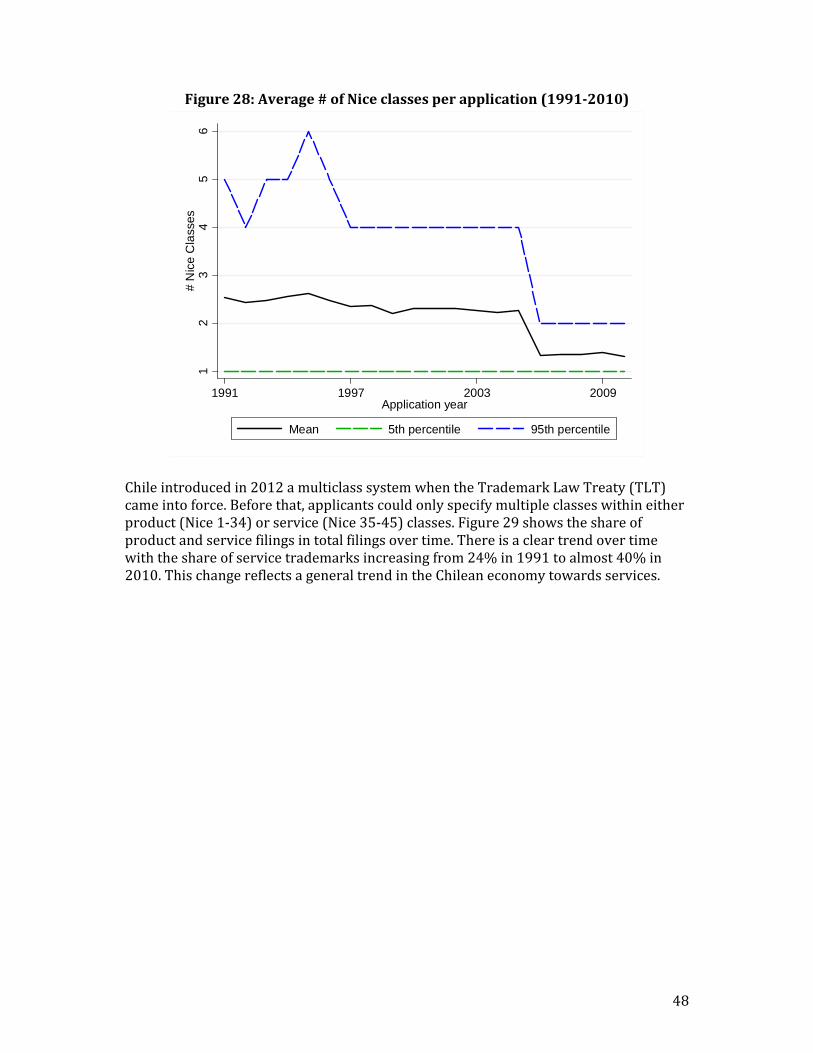
48
Figure28:Average#ofNiceclassesperapplication(1991‐2010)
12
34
56
# N
ice
Cla
sses
1991 1997 2003 2009Application year
Mean 5th percentile 95th percentile
Chileintroducedin2012amulticlasssystemwhentheTrademarkLawTreaty(TLT)cameintoforce.Beforethat,applicantscouldonlyspecifymultipleclasseswithineitherproduct(Nice1‐34)orservice(Nice35‐45)classes.Figure29showstheshareofproductandservicefilingsintotalfilingsovertime.Thereisacleartrendovertimewiththeshareofservicetrademarksincreasingfrom24%in1991toalmost40%in2010.ThischangereflectsageneraltrendintheChileaneconomytowardsservices.
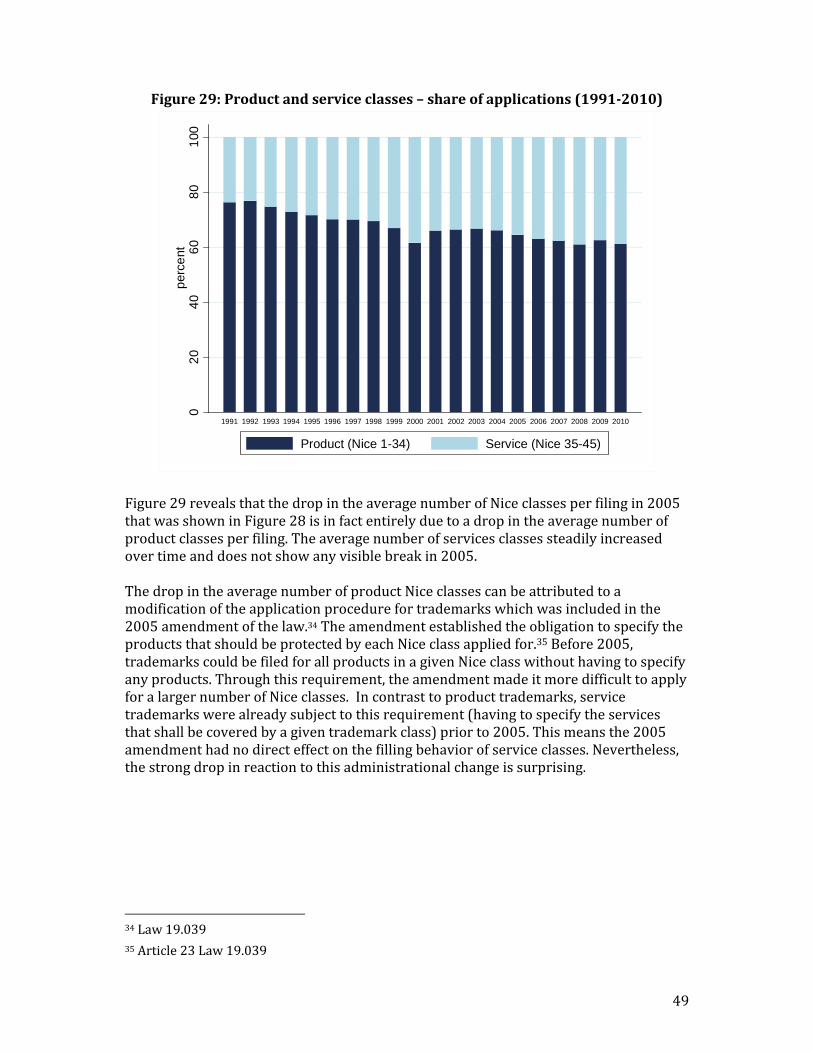
49
Figure29:Productandserviceclasses–shareofapplications(1991‐2010)
02
04
06
08
01
00p
erce
nt
1991 1992 1993 1994 1995 1996 1997 1998 1999 2000 2001 2002 2003 2004 2005 2006 2007 2008 2009 2010
Product (Nice 1-34) Service (Nice 35-45)
Figure29revealsthatthedropintheaveragenumberofNiceclassesperfilingin2005thatwasshowninFigure28isinfactentirelyduetoadropintheaveragenumberofproductclassesperfiling.Theaveragenumberofservicesclassessteadilyincreasedovertimeanddoesnotshowanyvisiblebreakin2005.ThedropintheaveragenumberofproductNiceclassescanbeattributedtoamodificationoftheapplicationprocedurefortrademarkswhichwasincludedinthe2005amendmentofthelaw.34TheamendmentestablishedtheobligationtospecifytheproductsthatshouldbeprotectedbyeachNiceclassappliedfor.35Before2005,trademarkscouldbefiledforallproductsinagivenNiceclasswithouthavingtospecifyanyproducts.Throughthisrequirement,theamendmentmadeitmoredifficulttoapplyforalargernumberofNiceclasses.Incontrasttoproducttrademarks,servicetrademarkswerealreadysubjecttothisrequirement(havingtospecifytheservicesthatshallbecoveredbyagiventrademarkclass)priorto2005.Thismeansthe2005amendmenthadnodirecteffectonthefillingbehaviorofserviceclasses.Nevertheless,thestrongdropinreactiontothisadministrationalchangeissurprising.
34Law19.03935Article23Law19.039
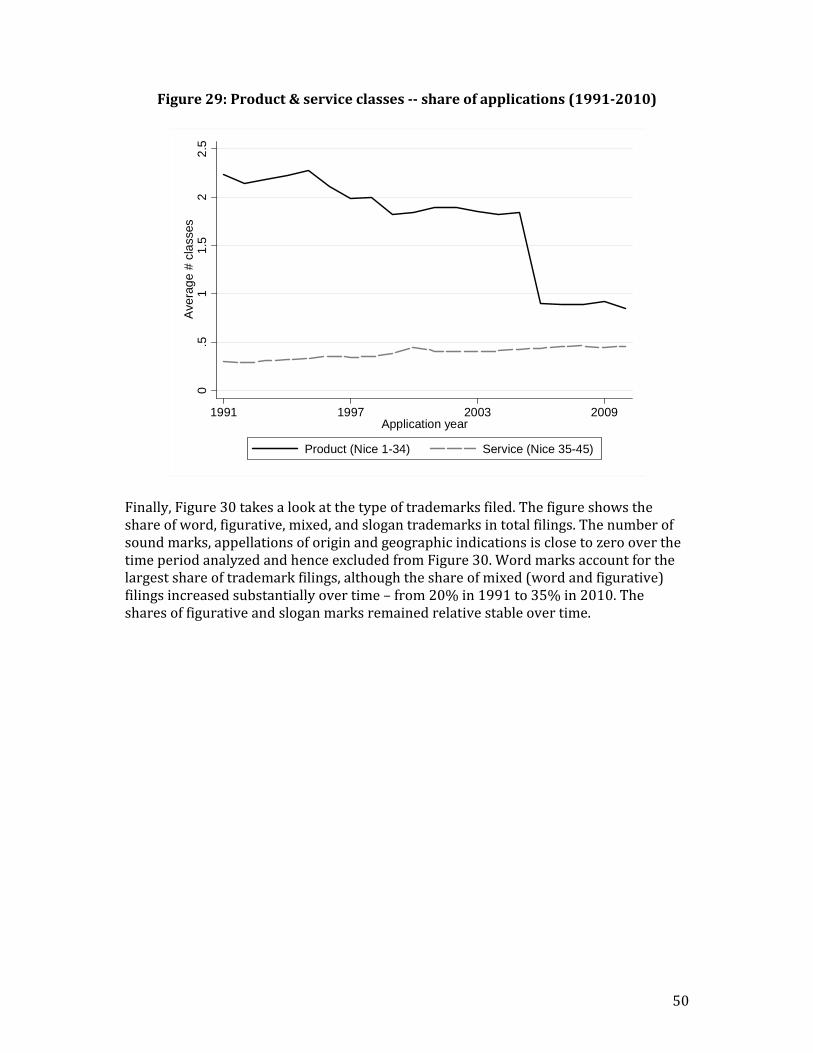
50
Figure29:Product&serviceclasses‐‐shareofapplications(1991‐2010)
0.5
11
.52
2.5
Ave
rag
e #
cla
sses
1991 1997 2003 2009Application year
Product (Nice 1-34) Service (Nice 35-45)
Finally,Figure30takesalookatthetypeoftrademarksfiled.Thefigureshowstheshareofword,figurative,mixed,andslogantrademarksintotalfilings.Thenumberofsoundmarks,appellationsoforiginandgeographicindicationsisclosetozerooverthetimeperiodanalyzedandhenceexcludedfromFigure30.Wordmarksaccountforthelargestshareoftrademarkfilings,althoughtheshareofmixed(wordandfigurative)filingsincreasedsubstantiallyovertime–from20%in1991to35%in2010.Thesharesoffigurativeandsloganmarksremainedrelativestableovertime.
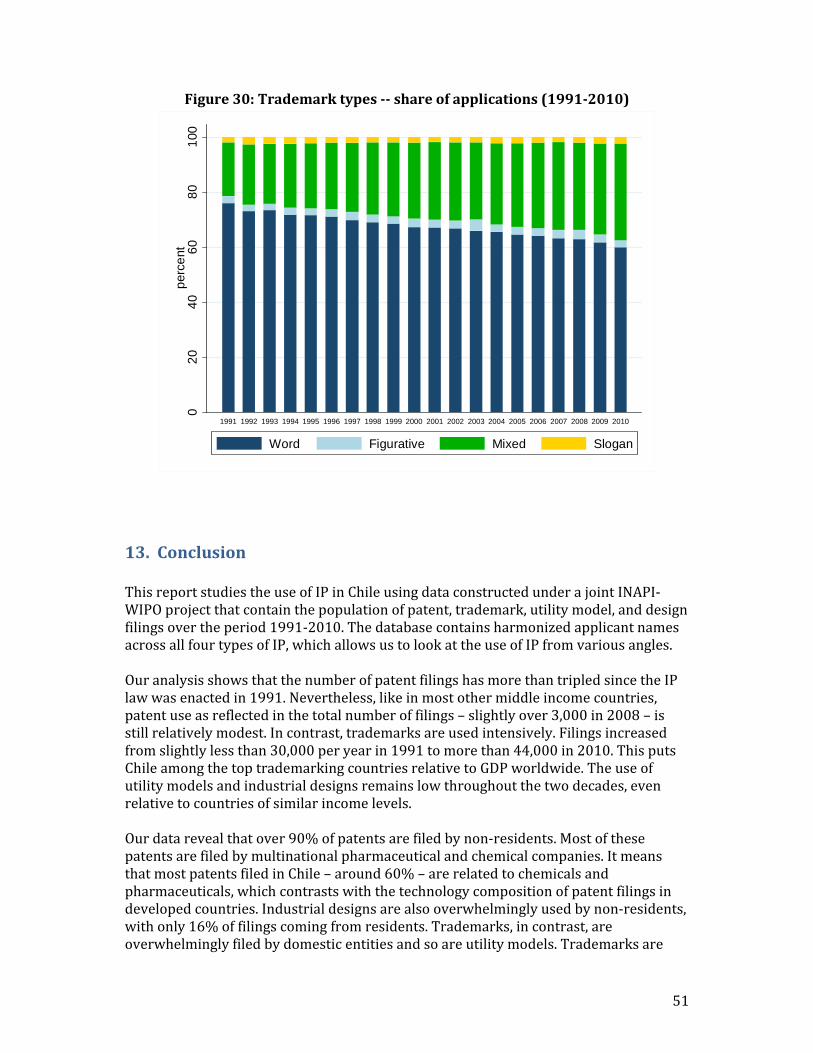
51
Figure30:Trademarktypes‐‐shareofapplications(1991‐2010)
02
04
06
08
01
00p
erce
nt
1991 1992 1993 1994 1995 1996 1997 1998 1999 2000 2001 2002 2003 2004 2005 2006 2007 2008 2009 2010
Word Figurative Mixed Slogan
13.ConclusionThisreportstudiestheuseofIPinChileusingdataconstructedunderajointINAPI‐WIPOprojectthatcontainthepopulationofpatent,trademark,utilitymodel,anddesignfilingsovertheperiod1991‐2010.ThedatabasecontainsharmonizedapplicantnamesacrossallfourtypesofIP,whichallowsustolookattheuseofIPfromvariousangles.OuranalysisshowsthatthenumberofpatentfilingshasmorethantripledsincetheIPlawwasenactedin1991.Nevertheless,likeinmostothermiddleincomecountries,patentuseasreflectedinthetotalnumberoffilings–slightlyover3,000in2008–isstillrelativelymodest.Incontrast,trademarksareusedintensively.Filingsincreasedfromslightlylessthan30,000peryearin1991tomorethan44,000in2010.ThisputsChileamongthetoptrademarkingcountriesrelativetoGDPworldwide.Theuseofutilitymodelsandindustrialdesignsremainslowthroughoutthetwodecades,evenrelativetocountriesofsimilarincomelevels.Ourdatarevealthatover90%ofpatentsarefiledbynon‐residents.Mostofthesepatentsarefiledbymultinationalpharmaceuticalandchemicalcompanies.ItmeansthatmostpatentsfiledinChile–around60%–arerelatedtochemicalsandpharmaceuticals,whichcontrastswiththetechnologycompositionofpatentfilingsindevelopedcountries.Industrialdesignsarealsooverwhelminglyusedbynon‐residents,withonly16%offilingscomingfromresidents.Trademarks,incontrast,areoverwhelminglyfiledbydomesticentitiesandsoareutilitymodels.Trademarksare
52
widelyusedacrosstheeconomy.Agriculturalproductsaccountforthelargestshareoftrademarkfilings,acategorywhichincludeswineandfruitproducts.Thereisalsoalargeshareoftrademarksrelatedtopharmaceuticals.Thegreatmajorityofpatentsareassignedtocompanies;aconsiderablenumberofChileanuniversitiesfileforpatentsandtheyareamongthetopresidentpatentees.Othertopresidentpatenteesarecompaniesintheminingindustry.Trademarkfilingscomefrombothcompaniesandindividuals.Lookingattheoriginofnon‐residentfilings,thedatashowthatthegreatmajorityofnon‐residentfilingsacrossallfourIPformscomefromtheUnitedStatesandEurope.OtherSouthAmericancountries,incontrast,accountforonlyasmallshareoffilings.Forexample,forpatentstheyrepresentonly2%ofallfilingsbetween1991and2010,whereastheUSandEUcombinedaccountformorethan80%offilings.WealsolookatthejointuseofdifferentIPrights.Morethan90%ofapplicantsonlyapplyfortrademarksandlessthan5%ofapplicantsapplyonlyforpatents.ApplicantsthatapplyformorethanasingletypeofIPrightarerare;theyaccountforonly2%ofapplicants.ThejointuseofdifferentIPrightsislimitedtopatentsandtrademarksaswellastrademarksanddesignrights.Abreakdownbyapplicanttypeshowsthatalargeshareofuniversitiesfilesforbothpatentsandtrademarks.Thedatashowthattrademarkswerefiledonaveragein2.5Niceclassesuntil2005.Duetoachangeinthelawin2005,theaveragenumberofclassesdroppedsharplyto1.3classesin2006.ThisdropintheaveragenumberofNiceclassesperfilingisduetoadropintheaveragenumberofproductclassesperfiling.Theaveragenumberofservicesclasses,incontrast,steadilyincreasedovertime.Thisisbecausethelegalchangein2005didnotaffectfilingsinserviceclasses.TheINAPI‐WIPOdatasetalsoallowsustounveilco‐assignmentpatternsinpatentfilings.Co‐assignmentsareinterestingastheyrevealunderlyingresearchco‐operationsbetweenuniversitiesandindustryaswellasamongproductmarketcompetitors.Likeinothercountries,co‐assignedpatentsaccountforasmallshareofpatentfilingsinChile–onaveragelessthan3%between1991and2010.Wefindthatmostpatentsareco‐assignedamongnon‐residentcompaniesandinfactthereislittleevidenceforinternationalcooperation.Theshareofco‐assignedpatentswithresidentandnon‐residentassigneesisonly8%.Co‐assignmentsinvolvinguniversitiesaccountforaround20%ofco‐assignedpatents,whichsuggestsasignificantamountofuniversity‐industrycollaboration.WealsoanalyzeinternationalpatentfilingsthathaveatleastoneChileanassigneeorinventor.WeshowthatforhalfoftheinventionsunderlyingsuchinternationalpatentfamiliestheprioritypatentisfiledwithINAPI.ThemostimportantforeignofficesoffirstfilingaretheUSandEurope.OtherSouthAmericancountries,incontrast,arerarelythejurisdictionofthefirstfiling.China,Mexico,andSouthAfricaemergefrom2000onwardasimportantdestinationsforpatentsbyChileanapplicants.InternationalfilingsbyChileanresidentsinmostjurisdictionsaredominatedbypatentsrelatedtotheminingindustry,chemicalsandpatentsfiledbyuniversities.
53
ThisanalysisprovidesforthefirsttimebroadempiricalevidenceontheuseofIPinChile.ItmayassistpolicymakersinChileintheireffortstobetterunderstandthenatureofinnovativeactivityinChileandtorefineinnovationandIPpolicies.Ouranalysisrevealssomeinnovativecapacityintheminingindustry,whichcoversawiderangeofdifferenttechnologies,andChileanuniversities.Ouranalysisalsorevealslowuseofutilitymodelsandregistereddesigns–evenincombinationwithpatentsortrademarks.WhileutilitymodelsaremainlyassignedtoChileanindividuals,registereddesignfilingsaredominatedbyforeigncompanies.Thereisnoapparentexplanationforthispattern.Thismaymotivatecloserscrutiny,inparticularexploringwhetherthesetwoIPrightsfulfilltheirpurposeorwhethertheyoverlapwithotherIPformsinawaythatofferslittlebenefitstotheirowners.PatentfilingsinChilepredominantlyrelatetopharmaceuticalsandchemicalsandareassignedtolargeUSandEuropeanpharmaceuticalmultinationals.Trademarks,incontrast,arewidelyusedbydomesticcompaniesandindividuals.TheexceptionallylargenumberoftrademarkfilingsforaneconomyofthesizeofChileinvitesfurtherresearch.Morebroadly,thisstudyoffersanexampleofempiricalresearchthatcanbeconductedontheuseofIPinmiddleincomeeconomiesonceanappropriatedatainfrastructurehasbeenputinplace.ItalsoshowstheimportanceofincludingotherIPrightsbeyondpatentsinthistypeofanalysisandofanalyzingtheuseofthedifferentformsofIPincombinationratherthanisolation.ThedescriptiveevidenceprovidedinthisstudyprovidesusefulinsightsinbetterunderstandingtheroleofIPinChile’seconomy.Ofcourse,descriptiveevidencecanonlygosofarinfullyevaluatingtheeffectsofIPpolicychoicesonapplicantbehaviorandeconomicperformance.Deeperanalysisonthebasisofthenewlyavailabledatainfrastructureisneeded.Indeed,twoanalyticalstudies–ontheincidenceandeffectsoftrademarksquattingaswellasontheroleofpatentsinthedomesticpharmaceuticalsector–arecurrentlyunderwayandwillbemadeavailableseparately.
54
ReferencesAlvarezR.(2001)“ExternalSourcesofTechnologicalInnovationinChileanManufacturingIndustry”,EstudiosdeEconomía,junio,año/vol.28,No001,pp.53‐68.AlvarezR.,CrespiG.&RamosJ.(2002)“TheImpactofLicensesona“LaterStarter”LCD:Chileinthe1990s”,WorldDevelopmentVol.30No.8,pp.1445‐1460.Amorós,J.E.&Guerra,M.(2008)“GlobalEntrepreneurshipMonitor:ReporteNacionaldeChile”Belderbos,R.,B.Cassiman,D.Faems,B.Leten,andB.V.Looy(2012).Coownershipofintellectualproperty:Exploringthevaluecreationandappropriationimplicationsofco‐patenting.KULeuvenmimeoBenavente,J.M.&Lauterbach,R.(2007)“R&DCooperationDeterminants,EvidencewithChileanFirms”Hagedoorn,J.(2003).Sharingintellectualpropertyrightsanexploratorystudyofjointpatentingamongstcompanies.IndustrialandCorporateChange12(5),1035–1050.Katz,J.&Spence,R.(2998)“Chile:UniversitiesandtheNationalInnovationSystem,anInitialScopingStudy”,SeriedeDocumentosdeTrabajo287delDepartamentodeEconomíadelaUniversidaddeChile.Krauskopf,M.,Krauskopf,E.&MendezB.(2007)“LowAwarenessoftheLinkBetweenScienceandInnovationAffectsPublicPoliciesinDevelopingCountries:TheChileanCase”,ScientometricsVol.72,No.1,pp.93‐103.OECD.(2007)“OECDReviewsofInnovationPolicy:Chile”.SchmochU.(2008).ConceptofaTechnologyClassificationforCountryComparisons,WIPO.WIPO.(2011a).WorldIntellectualPropertyReport.(Geneva,WIPO).WIPO.(2011b).“TheSurgeinWorldwidePatentApplications.”PatentCooperationTreatWorkingGroup,WIPODocumentPCT/WG/5/4.
55
Appendix1:TheIPsysteminChile
Appendix1.1:ApplicationProcedureforTrademarksTheregistrationofmarksdistinguishesbetweenmarksforgoods,services,commercialestablishments, industrial establishments, slogans, and geographical indications orappellations of origin. Applicants have to provide information about themselves andtheirpotentiallegalrepresentatives.Theapplicationformhastospecifytherequestedtrademark,thedescriptionofthemarkandtherequestedNiceclass(es).Theprocedure for registeringa trademark inChilehas twostages: (i) the filingofanapplication, itsformalityexaminationandpublication intheOfficialGazette;and(ii)asubstantiveexamination.Incaseofopposition,thecaseisevaluatedinparallelwiththesubstantialexaminationstage.Theapplication fee fora trademark isaroundUSD$85perclass.Before2012,applicantscouldonlyapply forproductor serviceclasses,butnotforacombinationofboth.FormalityexaminationTheformalityexaminationensuresthatanapplicationmeetsformalrequirements,butdoesnotprovideanyassessmentoftheapplication’smerits.Ifanapplicationmeetstheformalrequirements,itispublishedintheOfficialGazetteforwhichapublicationfeeischarged.Thepublicationcostdependsonthesizeoftheapplication;onaverageitcostsUSD$38. After publication, third parties have 30 days to file an opposition. If nooppositionisfiled,theprocedurepassesontothesubstantialexaminationstage.OppositionTheopposingpartyhastoberepresentedbyanattorney.Allinformationrelatedtotheoppositionispubliclyavailable.Theapplicanthas30daystorespondtotheopposition.SubstantiveExaminationAfterthe30dayperiodtofileanopposition,theapplicationissubstantivelyexamined.The examiner carries out searches for similarmarkswithin the Nice class forwhichcoverageisrequestedaswellasrelatedclasses.However,asearchcanalsobecarriedout in all related classes to determine the existence of trademarks that can createconfusion.InChile,trademarkexaminersmustidentifyallpossiblecausesforrejection.Different grounds for rejection are not mutually exclusive and can be invoked incombination.However,asinglegroundissufficienttorejectatrademarkapplication.If an application successfully passes the substantive examination, the trademark isregistered. At this point, another fee of around USD$170 per class is payable. If atrademark is rejected, the applicant can file an appeal to the Industrial PropertyTribunalwithin30days.CancellationofTrademarksTheproceduretocancelaregisteredtrademarkissimilartotheoppositionprocedure.Theownerofthetrademarkhas30daystorespond.INAPIopensa30daytermforboth
56
partiestopresentevidence.Thisperiodmaybeextendedfor30days.IfINAPIcancelsthetrademark,itwillbeconsideredinvalidcountingfromitsgrantdate.
Appendix1.2:IntellectualPropertyRightsEnforcementAccordingtoChileanlaw,IPinfringementcanbesanctionedbybothcivilandcriminalcourts,dependingonthetypeofinfringement.IPrightsareenforcedincivilorcriminalcourts.TheChileanindustrialpropertylawconsidersthefollowingasactsofinfringingof:
a) Atrademark:a. Commercial use inbad faith of a trademarkequalor similar to another
trademark that is already registered for the same products, services orestablishmentsrelatedtotheregisteredtrademark;
b. Commercial use of a non‐registered, expired, or cancelled trademark,falselyindicatingthatitisaregisteredtrademark;
c. Commercialuseofpackagingthatcontainsatrademarkwithouttherightto use it or without having deleted the trademark before using thepackaging.
b) Apatent:a. Commercialuseofapatentedinventioninbadfaith.b. Commercialuseofapatentonanon‐patentedobjectorofanexpired,or
cancelledpatent;c) Integratedcircuittopographies,utilitymodels,industrialdesignsanddrawings:
36a. Commercialuseinbadfaithofaregisteredintegratedcircuittopography,
utilitymodel,industrialdesignordrawing.b. Useofanintegratedcircuitstopographyright,utilitymodel,industrial
designordrawingforcommercialpurposesdespiteoftheabsenceofaregisteredright.
CriminalenforcementAll offenses are punishable with fines between US$2,125 and US$85,000. In case ofrepeated offenses, fines can double (they are capped at US$170,000). Bothcompensatory damages and the payment of reasonable attorney and court costs areavailable. Allmaterial that enabled infringement as well as all infringing goods can beseizedanddestroyed.CivilEnforcementTheholderofaninfringedIPrightcan,inallcases,fileacivilclaimrequesting:
thecessationoftheinfringingacts; theadoptionofmeasurestopreventthecontinuationoftheinfringingacts;
36Article61and67Law19309
57
publication of the judgment at the expense of the losingparty in anewspaperchosenbythewinningparty.37
Damages canbe calculatedbasedon tort laworbydetermining them througha) lostprofits,b)profitsearnedbytheinfringerasaresultoftheinfringingacts,orc)forgoneroyalties.38Accordingtothelaw,entitiesthatproduceormarketinfringingproductsareliablefordamagesonlyiftheyareawareofthefactthattheyareinfringinganIPright.Civil remedies,except for thoseconsideredas “restitutionactions”canbeobtained incriminalprocedures.Thisandthefactthatcriminalproceduresaregenerallyfasterandcarried through by a government prosecutor (with or without the help of a privateattorney),makecriminalclaimsmorecommonthancivilclaims.Appendix1.3:Restrictionsonpatentability39
AccordingtoChile´sIndustrialPropertyLaw,inventions,inalltechnicalfieldscanbeprotectediftheyarenew,involveaninventivestepandarecapableofindustrialapplication.Patentprotectionlastsfor20yearsfromthedateofapplicationandcanbeextendedincasesofunreasonabledelaysintheexaminationprocess.Patentscannotbeobtainedfor:
Discoveries,scientifictheoriesandmathematicalmethods. Plantvarieties(althoughprotectionisgrantedthroughaplantvarietyprotection
systeminaccordancewithUPOV91)andanimalbreeds. Economicandmentalmethodsrelatedtopurelymentalorintellectualactivities
ortogames. Methodsofsurgicalortherapeutictreatmentofthehumanbodyoranimals,as
wellasdiagnosticmethods,exceptforproductsintendedtoimplementoneofthesemethods.
Inventionscontrarytothelaw,ordrepublique,andnationalsecurity.The2005amendmentalsoexcludedallthoseinventionsthatharmfultohealth,theenvironmentandthelifeofpersons,animalsandvegetables.
Anewuseunlessitsolvesatechnicalproblemwithnopriorequivalentsolutionandtheinventionisphysicallymodifiedtoachievethissolution.
Livingorganismsasfoundinnatureandbiologicalmaterialasfoundinnatureevenifisolated.Proceduresusingbiologicalmaterialthatisproperlydisclosedarepatentable.
Relevantmodificationstothepatentssystem
37Article107,Law19,03938Article108,Law19,03939MoredetailsinArticles37and38ofLaw19039.
58
Sinceitsenactment,theIndustrialPropertylawhasundergonetwomajoramendments,whichadaptedthenationallegislationtothestandardssetforthintheTRIPSAgreementandseveralFreeTradeAgreementssignedbyChile.
The2005amendmentAlthoughmostofthestandardssetintheTRIPSagreementwhereintroducedin1991withtheenactmentofLawN°19.039,someimportantchangeswereneededandapprovedinthe2005amendment.Thefollowingarethemainmodifications:
Periodofprotection:until2005,patentsweregrantedforaperiodof15yearsfromthedateofgrant.
Eliminationofpipelinepatents:the1991lawmadepatentsavailableinallfieldsoftechnology,includingpharmaceuticals.Pipelinepatensor“revalidas”wereallowed.Accordingtothelaw,andregardlessofthedateofpriority,patentsgrantedorpendinginanotherjurisdictioncouldbefiledinChile,andgrantedfortheremainingstatutoryvalidityperiodinthecountryoforiginor15yearsfromthedateofapprovalwhicheverisshorter.Pipelinepatentswereeliminatedfromthesystemin2005.
Eliminationofso‐calledimprovementpatents:priortothe2005amendment,patentswerealsograntedforimprovementstoinventions,aslongastheywerenew,well‐knownandrelevant.Forimprovementstobepatentedtheauthorizationoftheoriginalinventorwasrequiredandthepatentwasgrantedonlyfortheremaininglifetimeoftheoriginalpatent.
Eliminationofprecautionarypatents:precautionarypatentsweregrantedforaperiodofoneyearincaseswherepublicexperimentationwasrequired.Thesepatentswerereplacedbyagraceperiodofoneyear.Thegraceperiodappliestoallpublicdisclosuresmadeorauthorizedbytheinventororasaconsequenceofunfairpractices.
Internationalexhaustion:the2005amendmentintroducedthepossibilityofparallelimports,givingcontinuitytotheinternationalexhaustiondoctrinethathadbeenappliedbytheantitrustauthorities.
Compulsorylicenses:rulesregardingcompulsorylicenseswhereintroducedtoreflectingtheprovisionsoftheTRIPSAgreement.
Revocationprocedures:the2005amendmentreducedthetimetofileaclaimforrevocationfrom10to5yearssincethedateofgrant.
The2007amendment The2007amendmentincludedextensionsofthepatenttermforunreasonable
delaysintheprocessingofapatentapplicationorintheprocessingofasanitarypermitforpharmaceuticalproductsprotectedbyapatent.Extensionsareavailabletoallpatents,forallunjustifieddelaysprovidedthatthegrantingofthepatentoccurs5yearsafterthefilingdate,ortherequestforexaminationoccurs3yearsafterthefilingdate.TheIndustrialCourtisresponsiblefordecidingonsuchunjustifieddelaysonacasebycasebasis.TheIndustrialCourtisacourtoffirstinstance,whosedecisionscanbeappealed.
The2007amendmentintroducedaso‐calledBolarexemption.
59
Appendix1.4:Applicationprocedureforpatents,utilitymodels,industrialdesigns,drawingsandintegratedcircuittopographiesApplicationrequirementsThereisasingleapplicationformforpatents,utilitymodels,industrialdesigns,drawingsandintegratedcircuits.Inadditiontothisapplicationform,theapplicantmustfileatechnicalform,adescriptivereport,theclaimsandifapplicabletechnicaldrawings.Thetechnicalformmustincludeasummaryoftheinvention,itsscopeandtheproblemthatitaimstosolve.40Inthecaseofintegratedcircuittopographies,industrialdesignsanddrawingsthetechnicalformisnotrequired.Thedescriptivereportisadocumentthatcontainsadetailedandcompletedescriptionofwhatshallbeprotected.Forpatentsandutilitymodels,thisdocumenthastocontainadescriptionofpriorart,adescriptionofanyincludeddrawings,adetaileddescriptionoftheinventionandanexampleofanapplication.41Forindustrialdesigns,thedescriptivereportmustdescribetheindustrialobjectinquestionanditsapplication.Also,adescriptionofthedrawingsandadetaileddescriptionofthegeometricalcharacteristicsofthedesign(describingproportionsordimensions)mustbeenclosed.Inthecaseofdrawings,thedescriptivereportmustdescribetheindustrialdrawing.Theclaimsdescribetheinventionforwhichprotectionissought.42Noclaimsneedtobefiledforindustrialdesigns,drawingsandintegratedcircuittopographies.Thetechnicaldrawingsincludeflowcharts,graphsandschemes.Drawingsmustomitanykindoflabelorexplanatorytext.Theexplanatorytextofeachdrawingmustbeincludedinthedescriptivereport.43Thedrawingsofindustrialdesignsshallcontainatleastatopplanview,elevation,profileandperspective.Otherviewsmayberequired,dependingonthecomplexityofthedesign.44ThereisanapplicationfeeofUSD$85(1UTM).45Thispaymentisthesameforpatents,utilitymodels,industrialdesigns,drawingsandintegratedcircuits.Therearetwostagesintheapplicationprocedure:(i)thefilingofanapplication,formalityexamination,andpublicationintheOfficialGazette;and(ii)substantiveexamination.FormalityExamination
40Seearticle38Law1930941Seearticle39Law1930942Seearticle41‐44Law1930943Article46‐48Law1930944Seearticle54Law1930945UnidadTributariaMensual:anamountofmoneydeterminedbylawandexpressedinChileanpesoswhichispermanentlyupdatedbytheConsumerPriceIndex(IPC)andusedasataxmeasure.

60
Oncetheapplicationissubmitted,INAPIperformsaformalityexaminationoftheapplication,verifyingthattherequireddocumentshavebeenfiledandthattheapplicationsatisfiestheminimumformalrequirements.INAPIinformstheapplicantiftheformalrequirementsarenotmet.Theapplicanthas60workingdaystoamendorcorrecttheapplication.Ifsuchanamendmentorcorrectionisnotmadewithinthisperiod,theapplicationwillbeconsideredasvoid.46.Iftheformalrequirementsaremet,INAPIpublishesanextractoftheapplicationintheOfficialGazette.Inordertodoso,apublicationfeeisrequired.Thecostofthepublicationdependsontheapplication’ssize.Alltherecordsoftheapplicationwillbepublicasfromthepublicationdate.Thereisnolegalrequirementforaminimumdelaybetweenapplicationandpublication.47Ifnorequestforpublicationismadewithinthe60daysperiod,theapplicationisconsideredabandoned.Iftheapplicantwantstoresumetheapplicationafterthe60dayperiod,theapplicantmustrequestthereopeningoftheapplicationandrequestpublicationwithin120workingdays,countingfromthedateonwhichtheapplicationwasdeclaredabandoned.Otherwise,therequestisdefinitelyconsideredabandoned.Afterpublication,thirdpartieshave45daystofileanopposition.Ifnooppositionisfiled,theprocedurepassesontothesubstantialexaminationstage.OppositionTheopposingpartyneeds to be representedby an attorney to file theopposition, soattorneyfeesmayapply.Allinformationrelatedtotheoppositionispubliclyavailable.Theapplicanthas45daystorespondtotheopposition.Iftherearesubstantial,relevantandcontroversialfacts,INAPIwillsendanotificationtotheapplicant.Thecomplainanthas45daystopresentrelevantevidenceandmayobtainanextensionofanother30days.Thepartiesareentitledtopresentanytypeofevidenceexceptfortestimonials.SubstantiveExaminationIfthereisnooppositionoriftheapplicationsurvivesopposition,theapplicanthas60daystopaytheexaminationfee.48Ifthepaymentisnotmade,theapplicationisconsideredabandoned.49Theexaminationfeevariesdependingontheintellectualpropertyright.Inthecaseofpatentsthefeeis$427.000Chileanpesos(approx.US$854
46Article45Law1903947Somecountrieshaveatermof18monthfromtheapplicationdatetothepublicationoftheapplication.48Article8Law1903949Asinthepublicationstageiftheapplicantwantstoresumetheapplicationafterthe60daysperiod,theapplicantmustrequesttheapplication´sreopeningandpaytheexaminationfeewithin120workingdays,countingfromthedatetheapplicationwasconsideredabandoned.Otherwise,therequestisdefinitelyconsideredabandoned.(Art8Law19039).

61
dollars);inthecaseofutilitymodelsitis$343.000(approx.US$686dollars)andforindustrialdesignsanddrawingsitis$287.000(approx.US$574dollars).50
Oncetheexaminationfeehasbeenpaid,INAPIassignstheapplicationtoanexamineraccordingtothetechnicalareaoftheapplication.Theexaminerhas60workingdaystoissuetheexaminationreport.51Theexaminationreportcontainsatechnicalanalysisoftheapplication,intendedtoverifywhethertheapplicationmeetsthestatutorypatentabilityrequirementssetforthinLaw19.039.Iftheexaminercommentsontheapplication,theapplicanthas60daystorespondtheexaminer.Iftherearenocommentsandtheapplicationmeetsthestatutoryrequirements,therightisgranted.Oncetheapplicationhasbeengranted,theapplicanthastopaythegrantfee.ThefinalpaymentdependsontheeffectivetermoftheIPright.Forpatents,theeffectivetermis20years.Oncetheapplicationisgranted,theapplicantmustpay3UTM(approx.US$255dollars).Aftertenyearscountingfromthefillingdatetheapplicantmustpay4UTM(approx.US$340dollars)torenewthepatent.Forutilitymodels,industrialdesigns,anddrawingstheeffectivetermis10years.Oncetheapplicationisgrantedtheapplicanthastopay1UTM(approx.US$85dollars).Afterfiveyearscountingfromthefillingdatetheapplicantmustpay2UTM(approx.US$170dollars)torenewtheright.Incaseofnon‐paymentwithinthatperiod,theapplicationisconsideredabandoned.RevocationofPatentsRequestsforrevocationhavetobesubmittedtoINAPI.Inthecaseofpatentsandutilitymodels,revocationmaybesoughtinrespectofallorindividualclaims.TheIPrightholderhas60daystorespond.INAPIrequestsareportbyoneorseveralexperts.Theexpertsareappointedjointlybythepartiesor,incasethereisnoagreement,byINAPI.Oncetheexpertreporthasbeenissued,thepartieshave60daystorespond.Incasetherearecontroversialissues,thereisanother45daytermtopresentadditionalevidence(withthepossibilityofsecondextensionof45days).IfINAPIrevokestheIPright,itisconsideredvoidabinitio.
50ThesevalueshavebeenadjustedonJanuary2012.51Art7ofLaw19039

62
Appendix2:TheINAPI‐WIPOIntellectualPropertydatabase
Appendix2.1Introduction
Theobjectiveofthisappendixistoexplainhowwetransformedtherawdataprovidedby INAPI into a database that can be used for statistical and economic analysis. Wediscussvariouschallengesposedbythedataandhowwetackledthem.
Appendix2.2DescriptionoftheRawDataThissectiondescribestherawdatathatwereobtainedfromINAPIinJune2011.
2.2.1CharacteristicsoftherawdataTherawdataprovidedbyINAPIcontainthepopulationofpublishedtrademark,patent,industrial design, and utility model applications filed between 01/01/1990 and10/06/2011.Thisincludesallapplicationsthathavebeenpublished,althoughtherearealsorecordswithoutapublicationdate.Structureoffiles:Therawdatawereprovidedin.csvformat.Weobtainedatotalofsixteendatafilesthatcontainthepatent,industrialdesign,utilitymodelandtrademarkdata.Thepatentdatafilescontainpatents,industrialdesigns,andutilitymodels.52Foreaseofexposition,thediscussionandtables, therefore,subsumeutilitymodelsanddesignsunderthepatentcategory(forabreakdownseeTableA15).Forbothpatents and trademarks, the differentdata files can be linkedby a commonidentifier.The most relevant information for the construction of our database is the applicantinformation (contained in “applicants.csv”) and the data on trademark and patentapplications (contained in “trademarks.cvs” and “patents.csv”). Both files contain fivevariableseach: Sol_nro(numeric10):Applicationnumber(uniqueidentifieroffiling) Pro_cod(numeric10):Internalcode Pro_nom(varchar120):Applicantname Pro_paischar(2):Applicantcountry Pro_direccion(varchar150):ApplicantaddressRawDataDescription:52Thedataalsocontainindustrialdrawingsandprecautionarypatents.

63
TablesA1andA2showtherawpatentandtrademarkdatabyapplicationyear.TableA1showsthatthereare778,095trademarkapplicationsbetween1990and2010.Thenumber of applications has increased steadily up to 2008 (the figures for 2009 and2010maybestillincomplete).Thetablealsolooksatapplicants,whicharecountedbyapplicantnames.Theseare the `raw’namesas received from INAPI so theyhavenotbeencleanedorcorrected.ThismeansthefiguresinTableA1arelikelytoover‐countthenumberofuniqueapplicants.Thetableshowsthatthereisatotalof220,064uniqueapplicants,with theirnumberalsosteadily increasing fromaround11,200 in1990 to19,500in2008.Thetabledistinguishesbetweenresidentsandnon‐residentsbasedonacountry identifier in thedata. It ispossiblethat thesameapplicant filesbothwithaChilean and a foreign country identifier, inwhich case the applicantwould show upbothasaresidentandnon‐resident.Inthetrademarkdata, theapplicant’sRUT(tax identifier) isavailable(asreportedbythe applicant), which in principle could serve as a unique identifier of the applicant.TableA3showstherawdatareceivedfromINAPIwhereweclassifyRUTsaccordingtoRUTlength.AccordingtotheModulo11algorithm,correctRUTsshouldhave9digits.Inourrawdata,the lastdigit(“digitoverificador”) isoftenseparatedwithadash,whichmeanscorrectRUTsshouldhave9or10digitsinourdata.Thetableshowsthatabout36% of RUTs have a length different from 9 or 10.Moreover, in principle, RUTs arereported only by domestic entities (although foreign applicantsmay also apply for aRUT), hence the presence of RUTs for a non‐negligible number of foreign applicantspromptsquestions.WhilethelengthofaRUTisanindicatorofwhetheragivenRUTiscorrect,theModulo11algorithmallowsustoverifyifagivenRUTisindeedvalid.TableA4showsthatabout30%ofRUTsareinvalid.Whilethisalsoimpliesthat70%ofRUTsarevalid,thisdoesnotmeanthatavalidRUTcorrespondstotheassociatedapplicant.ThecorrespondencebetweenRUTandapplicantnameisverifiedinaseparatestepasdiscussedfurtherbelow.Asmentionedabove, therearenoRUTsavailable forapplicantsoftheother IP forms.Applicantsareonlyidentifiedthroughthenameprovidedontheapplicationform.
Appendix2.3DatachallengesThemain challenges in the creation of our database are the identification of uniqueapplicants and their RUT as a unique identifier (for entities registered in Chile). Toidentify unique applicants and RUTs, information on applicant names, thecorrespondingcountryoforiginandRUTincaseofdomesticapplicantswasrequired.There is an important difference between the trademark and patent data: whiletrademark applicants are required to provide a RUT, this is not the case for patentapplicants. This implies that there is no information on RUTs in the patent dataregardlessofthenationalityoftheapplicant.Whiletrademarkapplicantsarerequiredto provide a RUT, this does not automatically imply that the RUT provided is validand/or belongs to the applicant name provided on the application form. While in

64
principle the RUT is only applicable to companies registered in Chile,53as shown inTableA3foreigncompaniesmaystillreportaRUT,whichisinmostcaseseitherthatofa Chilean legal representative or an artificial RUT assigned byChilean administrativebodiestoforeigncompanies(thisRUTdoesnotuniquelyidentifytheforeigncompanyinsteaditisthatofforexampleINAPI).Inbothcases,thereisnouniquecorrespondencebetweentheRUTandtheforeignapplicant.Therefore,therearetwodistinctproblems.First,weneedtoidentifyuniqueapplicants.ThesecondproblemconsistsinassigningavalidRUTtoeachdomesticapplicantwheretheRUTisuniqueinthesensethatitisonlyassignedtoauniqueapplicant.However,anapplicantmay still be found to havemore than a single RUT, aswill be explained inmoredetailbelow.
2.3.1IdentificationofuniqueRUTforeachapplicantThefirstproblemconsistsintheidentificationofuniqueapplicants.Theproblemarisesamongotherforthefollowingreasons:a) SamenamewritteninmultiplewaysThereisnostandardformattoenterthenameofanapplicant.Thisimpliesthatitisnotpossible to identify automatically the different applicationsmade by the same entity.Also, there is no unique way of spelling an applicant name or the legal form ofcompanies.Forexample, thesamecompanycanbe registeredas “sociedadanonima”,“sa”or“socanom”.Applicantnamesmayalsoappearinvariousshuffledforms,suchas”Jaime Ignacio Mendez Reveco” who can also be found as ”Mendez Reveco JaimeIgnacio.” A problem also arises in the case of abbreviations and acronyms, such as“PontificiaUniversidadCatolicadeChile”whichcanbefoundalsoas“PUC”.b) SpellingmistakesDue to the lackof anautomatic spell check,applicantnamesmaybemisspelled.Thisapplies equally to foreign and national applicants. Thismay involveminor omissionssuchasintheexampleof“TresmontesLucchettisa”whichalsoappearsas“TresmontesLuchettisa”or“TresmontesLuchetisa”.Itmayalsoinvolvecaseswerenamescanonlybeguessedduetonumerousmisspellings.Forexamplethename“GarridoBadillaAide”wasfoundalsoas“GarridoBadillaHaydee”.c) NamescontainadditionalinformationApplicantnamesmaycontainadditionalinformationbeyondthename.Companiesmayfor example provide information on their legal registration form. A large number offoreign applications contain information about their geographic origin (e.g. “sociedadanonimaorganizadaenconformidada las leyesdelestadodePennsylvania”).Also, insomecasesthereisinformationonthedesignationoftheoriginofatrademarkorthe
53ForeigncompaniescanstillobtainaRUT.

65
percentageofownershipincaseofjointlyownedpatents(e.g.“34UniversidadCatolicaChile36RossanaGinocchio20Cimm10MiguelHerreraMarchant”).d) NamechangesovertimeThereareseveralreasonswhycompanynameschangeovertime.Itcanbetheresultofamerger,theacquisitionbyanothercompanyorsimplyadecisionbythecompanytochange its tradingname. INAPI´sdatabasedoesnotkeeptrackofsuchchangeswhichmeansthatdifferentapplicationsbythesamecompanycannotbe identified incase ithaschangeditsname.Forexample,thecompany“Luchettis.a.”wasboughtby“CorporaTresMontess.a.”in2004.Aftertheacquisitionthecompanywasre‐named“TresmontesLuccettis.a.”.Anotherexampleisthecompany“BellsouthChiles.a.”whichwasrenamed“TelefonicaMovilesChiles.a.”afteritsmergerwith“Telefonica”.e) MultipleapplicantsINAPI´sapplicationformdoesnotallowmorethanoneapplicantname.Thismeansthatinthecaseoftheco‐assignmentofapatentortrademark,thenamesarewritteninthesame field. This situation makes it necessary to separate for each application thedifferentapplicantnamesinordertoidentifyeachuniqueapplicant.Duetothelackofastandardizedwayof separating names (e.g. “Astrazeneca abAstexTherapeutics ltd”),suchfieldshavetobesplitmanually.f) Norecordsofre‐assignmentsofIPright
ThereisnorecordofthechangesofIPowners.Thismeansthatisnotpossibletoknowif an IP right is sold to another companyor individual, andhence inourdatabase, IPrightsremainwiththeoriginalassignee. Thisisadataproblemthatweareunabletoaddresswithoutadditionalinformation.
2.3.2.IdentificationofuniqueRUTforeachapplicantThesecondproblem,whichiscloselyrelatedtothefirst,isthatinprincipleRUTsshoulduniquely identify domestic applicants. This may not be the case inter alia for thefollowingreasons:a) NoRUTThereisnoRUTavailableinthepatentdata.ThisproblemappliestoafewtrademarkapplicationstooasshowninTableA3.b) Invalid/incompleteRUTAt the moment of application, INAPI does not verify that the RUT reported by anapplicantisvalid.Also,thereisnostandardizedformatforreportingRUTs.Forexampleinsomecasesthe”digitoverificador”isseparatedbyadashwhereasinothercasesisnot.ThismakesitdifficulttoverifyandifnecessarycorrectRUTs.
66
c) MultipleRUTTherearesomecasesinwhichthesameapplicanthasreportedmorethanoneRUTindifferent applications. It is possible that Chilean companies have more than a singleRUT, which means that the reporting of several RUTs is not necessarily an error.However,differentRUTsmaybelong todifferententitiesoreven individuals (e.g. theowner of a company using his personal RUT and the company´s RUT in differentapplications).d) “Special”RUTThere are RUTs that are shared by several different applicants. This situation arisesbecause instead of using their own RUT, applicants may use the RUT of their legalrepresentativeor theRUTof an institution (e.g. INAPI,MinisteriodeEconomía).Thisexplains to some degree why the raw data also contain RUTs for foreign applicants.ForeigncompaniesusuallydonothaveaRUTsoinmanycasestheyusetheRUToftheirlegalrepresentative.Forexample,companiessuchas“Merck”,“Xerox”or“Adidas”sharethesameRUTintherawdata,wheretheRUTbelongstothelawfirm“Sargent&Krahnltda”.e) SameRUTsharedbymultipleapplicantsFinally, there are cases were a RUT that is not that of a legal representative orinstitutionissharedbymultipledifferentapplicants.Thismayreflectdataentryerrorssince there isnoapparentexplanation for thispatternas thedifferentapplicants thatsharethesameRUTdonotseemtobelongtogether.
Appendix2.4DataBaseDesignThis section describes the procedure used to construct the INAPI patents andtrademarkdatabase.Weappliedacombinationofautomatedcleaningalgorithmsandextensivemanualcleaningofthedata.Theobjectiveoftheprocedurewastoobtainan“applicant dictionary” that uniquely identifies applicants that may appear in thedatabase in various incarnations and the associated valid RUTs through a uniqueapplicantidentifier(ID).
2.4.1TrademarkDataWebegintheconstructionofthedatabasewiththetrademarkdata.Themainreasonsforproceeding in thiswayare that (a)RUTsareonlyavailable in the trademarkdataand (b) the number of applicants by far exceeds that of the patent data. Since oftenpatentingentitiesalsoobtaintrademarks,bycleaningthetrademarkdatawearelikelyto indirectly clean a substantial part of the patent database. Note that we makesimultaneous use of both applicant names and RUTs to identify unique applicants aswellasuniqueRUTs.
67
a) Cleaningandstandardizationofapplicantnames
Asafirststep,westandardizeapplicantnames.Thismeansforexampleremovingblanks,removingspecialcharacters,correctinggenericspellingmistakes,standardizingcompanyregistrationforms,droppingdesignationsoforiginetc.b) RUTcorrection
Inasecondstep,weapplytheModulo11algorithmtoverifywhetherRUTsarevalid.IncasewefindagivenRUTtobeinvalid,weattempttocorrectit.WealsomarkallRUTsthatbelongto`special’entities(seed)inSection2.2.2above),suchaslawfirmsorINAPIetc.Inthesecases,themarkerindicatesthattheRUTdoesnotbelongtotheapplicantname,butinsteadtoa`special’entity.Forthispurpose,wecompiledalistofsuch`special’entities.c) Identificationofuniqueapplicants
HavingcleanedapplicantnamesandcorrectedRUTs,weproceedwiththeidentificationof“unique”applicants.Uniquemeansthatwhileagivenapplicantnamemayshowupindifferentways,weassociatethedifferentnamestoasingleapplicant.Tohelptheidentificationofuniqueapplicants,wedividethedatainfour“datatypes”:1. Unique “RUT + applicant name + country” combinations; these are seeminglyclean entries. It may still occur, however, that a RUT or applicant name exists in aslightlymodifiedforminthedatabase.2. RUTduplicates,i.e.,caseswhereRUTshavedifferent“applicantname+country”combinations.3. “Applicant name + country” duplicates, i.e., applications with same “applicantname+country”combinations,butthathavedifferentRUTs.4. Applications with same “applicant name + RUT” combination but that reportdifferentcountrycodes.For each data type we create a tailor‐made algorithm that cleans applicant namesfurther and that searches for variations of a given applicant name in the trademarkdatabase. These cleaning and matching algorithms allowed us to identify uniqueapplicantswhosenamesappearinvariousformsinthedatabase.We then create anartificial identifier (ID) tomark thedifferent applicantnames thatbelongtothesameapplicant.d) MisspelledRUTscorrections
We correct RUTs associated with the different incarnations of the same uniqueapplicantduringthecleaningprocessdescribedaboveunderStepc).Forexample,wefind that often RUTs of the same applicant differ slightly,which results in “applicantname + country” duplicates. However, often this is due to differences in few digits,commonlyonlythelastorthetwolastdigitsofagivenRUT.WecorrectsuchmisspelledRUTsatvariousstagesofStepc)describedabove.
68
e) IdentificationofuniqueIDforeachuniqueapplicant
Inalaststep,wecombinethefourdifferentdatatypesandcheckthedatamanuallytoensurethattherewerenocasesinwhichthesamepersonwasassigneddifferentIDs,thatistoensure“ID+RUT”combinationsareunique(uniqueinthesensethatagivenRUTisassociatedonlywithasingleID;agivenIDmayneverthelesshaveseveraluniqueRUTs).WedidthisforallChileanapplicantsandforforeignapplicantsthatappearmostfrequentlyinthedata.TheoutcomeofthisprocedureisadatasetprovidedinTableA5.f) MultipleassigneesInthecaseofjointlyownedtrademarkswesplitnamesmanuallyasthereisnostandardcharacter thatwouldallowseparatingnamesautomatically.This isdoneaswe checkRUTsasexplainedindetailunderb)inSection3.3below.
2.4.2PatentDataAsanextstep,wecleanthepatentdata.Themainchallengewithregardtothepatentdata (which also contain industrial designs & drawings and utility models) is theabsenceofRUTs.Themergingof the INAPIdatabasewiththedifferent INEdatabasesrequires the identificationof applicants byRUT.Thismeans that apart fromcleaningthe patent data and identifying unique applicants, we also had to retrieve RUTs forresidentapplicants.Thepatentdataposesanadditionalchallenge,which isthe frequentco‐assignmentofpatentstoseveralassignees.AsexplainedinmoredetailintheAppendix,whenthereismorethanoneownerofanIPright,allnameswererecordedinthesameapplicantfield.12%ofapplicantnamesintherawpatentdatacontainseveralapplicantnames.Tocleanthedataandtoaddressthesetwochallengesweproceedasfollows:a) Cleaningandstandardizationofapplicantnames
We apply the same procedure as for trademarks, that is, we clean and standardizeapplicantnames.b) Multipleassignees
Inthecaseofjoint/co‐assignedpatentswesplitnamesmanuallyasthereisnostandardcharacterthatwouldallowseparatingnamesautomatically.c) Identificationofuniqueapplicants
Aswithtrademarks,weidentifydifferentincarnationsofthesameapplicantbyusingamatchingalgorithmandcombinethedifferentincarnationsintoauniqueapplicantID.d) RetrieveRUTandIDfromTrademarkData
69
DuetothelackofRUTsinthepatentdata,weretrieveRUTsfromthetrademarkdata.This obviously implies that RUTs are only found for patent applicants that have alsoappliedforatrademark.Wesearchforallnamesofpatentapplicantsinthetrademark`dictionary’describedabove.Wefirstapplyamatchingalgorithmandthensearchforallunmatchedpatentapplicantnamesmanuallyinthetrademarkdictionary.Wheneverapatentapplicantwasfoundinthetrademarkdata,weretrievethecorrespondingRUTaswellastheIDtoensureconsistencybetweenourpatentandtrademarkdatabases.e) AssignIDtouniqueapplicantsnotfoundinthetrademarkdatabase
Patentapplicants thatwerenot found in the trademarkdatawereassignedanew ID(whichdoesnot exist in the trademarkdata),which serves as aunique identifier.AnexampleoftheoutcomeofthisprocedureisprovidedinTableA6.
Appendix2.5CombiningTrademarkandPatentDataHavingcreatedthetrademarkandpatent“dictionaries”,inanextstepwecombinethetwodatabasestocreateasingle“applicantdictionary”inthefollowingway:a) MergeTrademarkandPatentdictionaries
Wecombinethepatentandtrademarkdatasetstocreateasingle filethatcontainsall“ID+applicantname+RUT+country”combinations.Sincewehavealreadysearchedforallapplicantsthatapplyforbothtrademarksandpatentsintheconstructionofthepatentdictionary,inprinciple,nofurtheradjustmentsareneededwhencombiningthetwodatasets.b) RUTverification
So far,we have only applied some corrections to RUTs to ensure they are valid, andmademinor adjustments in the case of relatively obviousmisspellings. However,wehavenotyetverifiedwhetheravalidRUTindeedbelongstotheapplicantnameintheINAPIdatabase.Todothis,weadoptatwo‐prongedapproach:Verificationof“applicantname+RUT”correspondence:RUTsare registeredwith theServiciode Impuestos Internos (SII). Itprovidesaweb‐basedcheckthatallowsverifyingwhetheragivenRUTexistsandwhatthenameisthatisassociatedwiththatRUT.54WecheckallRUTsinourdatabaseusingtheSIIwebsiteandretrievethenameforgivenRUT(whichcorrespondstothe“nombreorazónsocial”associatedwith a givenRUT) from thewebsite. This allows us to verifywhether theapplicant name with a given RUT in our database indeed corresponds to the nameregisteredwithSIIforthesameRUT.Inaddition,thischeckhelpsusidentifycaseswheretrademarkshavebeenappliedforjointly.Thatis,thewebsitereturnsasinglenameforagivenRUT.Thismeansthatcases54https://zeus.sii.cl/cvc/stc/stc.html

70
where trademarks are owned jointly, the list of names will differ from the nameobtainedfromthewebsite.Thishelpsussingleoutcasesofjointlyownedtrademarks,which is an issue thatwehaveneglected so far (we only correctednames for jointlyowned patents). Since the website provides us with an “applicant name + RUT”combination,wecanassociateaRUTwithoneoftheapplicantnamesincasethereareseveral applicant names. This allows us to manually split names in the case of jointtrademark applications.We create new entries for the other names and assign themeitheranexistingIDincasethesamenamealreadyexistsinthedatabase(wesearchedforthemmanually)oranewIDincasethenamedoesnotyetexist.FindingmissingRUTs:Thewebsitecheckisonlyfeasibleforapplicantsthatreporta(valid)RUT.However,wehaveasubstantialnumberofcaseswhereRUTsareeitherinvalidornotavailableatall(mostlypatents).Tocomplementthedata,weobtainedadditionaldatafromaprivatecompany specialized in data provision called Transunion.55We obtained RUTs forapplicant nameswithout (valid) RUT aswell as for all other applicant names in ourdatabase regardless of whetherwe had already verified the “applicant name + RUT”correspondence.Thisprovidesusalsowiththepossibilitytodoublecheckthedataforwhichwehaveverified“applicantname+RUT”combinations.SimilarlytotheSII‐basedcheck,obtainingRUTsfornamesforwhichwepreviouslydidnothaveRUTsallowsustocorrectcasesofjointtrademarkapplications.c) Manualcorrection
Having verified “applicant name + RUT” combinations in these twoways and havingcorrected cases of joint trademark applications,we conduct a final extensivemanualdatachecktoensureourIDidentifiesuniqueapplicants.d) Applicanttype
Finally,wecreateavariablethatidentifiesthe“applicanttype”todistinguishbetweenapplicants that are registered companies, universities, research institutions,governmententities,orindividuals.Theoutcomeofthedataconstructiondescribedaboveisan“applicantdictionary”’thatallows us to uniquely identify applicants and provides their unique RUTs in case ofdomestic applicants (“unique” in the sense that the RUT is not shared by any otherapplicant inthedataset). Anextractofthe“applicantdictionary” isprovidedinTableA7.Table A8 shows the number of unique applicants in the patent and trademarkdictionary.Comparingthese figureswithTablesA1andA2showsthatthecleaningoftherawdataresultedinareductionofaboutathirdinuniqueapplicantnamesinthetrademarkdata(220,064uniqueapplicantnamesintherawdataand146,092uniqueapplicantnamesinthecleaneddata)andofabout28%inuniqueapplicantnamesinthe
55http://www.transunionchile.cl

71
patent data (15,151 unique applicant names in the raw data and 10,943 uniqueapplicantnamesinthecleaneddata).TableA9showstheavailabledataonapplicants’RUTs.Thetableonlycontainsdataonresident applicants as in principle only Chilean applicants report a RUT. The tableshowsthatforabout82%ofChileanapplicantswehaveatleastonevalidandverifiedRUT(seeb)aboveonRUTverification).Thisshareissubstantiallylargerinthecaseoftrademarks than patents, although this is a consequence of the fact that RUTs wereentirelyabsentintherawpatentdata.Havingsaidthis,afterthecleaningofthedata,wehaveavalidandverifiedRUTforaround66%ofpatentapplicants–inonlyabout27%ofcasesistheRUTstillentirelymissingorbelongsknowinglytoanentitydifferentfromtheapplicant(e.g.lawfirm).Finally, Table A10 looks at the cleaning/matching success based on the number offilingsoftrademarksandpatentsforwhichwehaveatleastonevalid/verifiedRUTfortheapplicant.Todetectpossiblepatternsovertime,wetabulatethedatabyapplicationyear. The data on trademark filings show that we have a valid RUT on average foraround87%of all filings. This is above the82%of applicants shown inTableA9, aswouldbeexpected.Moreover,wedetectanincreaseinthenumberoffilingsthatcanbeassignedavalidRUTovertime.Whiletheshareis lessthan80%in1990, itclimbstoover90%by2009.ThepatentdatashowthatweareabletoassignavalidRUTtoevenhigherashareoffilingsbydomesticapplicants(88.3%).ThisisremarkablegiventhatwewereabletoobtainavalidRUTforonly66%ofalldomesticpatentapplicantsandthattherawdatadonotcontainRUTs.Thepatternovertimeis lessconclusive inthecaseofpatents.WhiletheshareoffilingswithavalidRUTincreasesuntil2002,itthendrops to reach in 2010 approximately the same level as in 1990. Overall, Table A10underscoresthattheprocedureadoptedresultsinalmost90%offilingsofbothpatentsandtrademarkswithatleastonevalid/verifiedRUT.TableA11summarizestheoutcomeofthecleaningprocedureintermsofapplicationsof both trademarks and patents. It shows thatwe have a total of 778,095 trademarkapplications over the period 1990‐2010. In the raw data, about 70% of theseapplicationswerefiledbyresidents(546,850applications).Thepercentagesshowthattheapplicationsofresidentsandnon‐residentsexceedthetotalslightlyasthereareafew applicationswith resident and non‐resident applicants. This is not the casewithregardtopatentapplications.Thetableshowsthatintherawdatathereareatotalof49,480applications. In the caseofpatents,more than90%of filings come fromnon‐residents in the rawdata.Whenwe compare these figureswith the cleaneddata,wenotethatthefigureschangesubstantially.Forbothpatentsandtrademarks,thenumberof applications by residents increases substantially. The main reason for this is thatresidency isnowdefinedat the levelof theartificialuniqueapplicant identifier(ID inTableA7).Hence,anyIDthathasatleastoneChileancountrycodeisconsideredtobearesidentandhenceallapplicationsthatbelongtotheIDareconsideredtobeofresidentorigin.Thisincreasesthenumberoftrademarkapplicationsbyresidentsfrom70%toaround77%andthatofpatentapplicationsfromaround10%to23%.56Thetablealso
56Obviouslywestillhavetheinformationatthetrademarkandpatentlevel,thatiswearestillabletodisentanglewithinagivenIDwhichpatentsreportaChileanandwhich
72
containsthenumberofapplicationsforwhichtheapplicantisaresidentandreportsatleastonevalid/verifiedRUT.WeknowfromTableA10thattheseapplicationsaccountforslightlylessthan90%oftrademarkandpatentapplications.TableA11nowshowsthat this corresponds to around 68% of total trademark and 36% of total patentapplications.
Appendix2.6TrademarkDataThissectiondescribestheconstructionofthebibliographictrademarkinformation.Thisinformationisjoinedwiththeapplicantdatathroughauniqueapplicationnumber.
2.6.1NiceclassesTherawdatacontainNiceclasses.Apartfromanumberoferroneousdataentries,thedata also contain two additional classes (50 & 51) that are not part of the Niceclassification.Wedropthesetwoartificialclassesandmapthe45Niceclassesinto10categoriesofeconomicactivity.TableA12showstheclassificationandthenumberoftrademarkapplicationsmappedintotheclassificationofeconomicactivity.
2.6.2PriorityinformationThe raw trademark data provide uswith priority information in the form of prioritynumbers, priority filing dates, and the priority authorities. The main data challengeconsists in the lackof consistent recordingofprioritynumbers.Prioritynumbersareoftenonlypartlyrecordedmakingitextremelydifficultifnotimpossibletoretrievethecorresponding priority filing. This means that we do not include the priority filingnumber in the database. With regard to the priority authority and date, which weincludeinthedatabase,thereareanumberoferroneousentries,whichweattempttocorrect.Priorityinformationisavailableforlessthan2%ofapplications.
2.6.3TrademarktypeanduseThe raw data also provide us with information on the type of trademark. The datadistinguish between Denominativas, Figurativa, Mixta, Propaganda, Sonora, Origen,Geografia (see Table A13). In addition, we also have information on the type ofproduct/servicecoveredbyagiventrademark(seelowerpanelinTableA13).
2.6.4Application,publicationandregistrationdateWehavetheapplication,publication,andregistrationdatesoftrademarks.Thedataonthedifferentdatesdidnot require substantial cleaningother than the correctionof a
aforeignresidency.WhetherthedataisconsideredattheID‐orIP‐leveldependsonthepurposeoftheanalysis.
73
numberoferroneousentries(suchasapplicationswheretheregistrationdatepredatestheapplicationdate).
2.6.5LegalstatusThe data also offer some information on the legal status of trademark filings. TheinformationissummarizedinTableA14.
Appendix2.7PatentDataThis section describes the construction of the patent‐level information.We obtainedraw data from INAPI that contain bibliographic and legal status information at thepatent level. The patent data files contain data on invention patents, utility models,industrial designs and drawings (as well as “patente precausional” and industrialdrawings). These different types can be identified through amarker in the raw data.Table A15 shows that 86% of the applications represent invention patents. Whileindustrialdesignsaccountforalmost12%,utilitymodelsaccountforamere2%.
2.7.1IPCsThe main challenges with regard to IPCs are erroneous data entries and the use ofdifferentversionsof theclassificationsystem.The IPCscontained in the rawdataareclassifiedusingversions4,5,6,7,and8oftheIPCclassificationsystem.In a first step, we separate the invention patent and utility model data from theindustrial designs because industrial designs are classified according to the Locarnoclassification. In a second step, we correct some data entries where the error isrelatively obvious. In a third step, we harmonize all IPC codes to version 8 of theclassification (because the code that maps IPCs into technology classes is based onversion8– seebelow).This isdoneon thebasisofa conversioncode that translatesolderIPCversionsintoVersion8.Wefacetheadditionalproblemthatforsomeentries,therawdataindicateaversion0,whichdoesnotexist.Inthiscase,were‐classifytheseentriesaccordingtothefilingyear.Thatis,filingsbetween1990and1994areclassifiedasversion6,filingsbetween1995and1999asversion7,andfilingsfrom2000onwardasversion8.ThecorrectedandharmonizedIPCclasssymbolsaremappedtotechnologycategoriesusing a concordance table developedby the Fraunhofer ISI and theObservatoire desSciences et des Technologies in cooperation with the French patent office.57Theconcordance table groups IPCs into five broad technology classes: (a) Electricalengineering,(b)Instruments,(c)Chemistry,(d)Mechanicalengineering,(e)Otherfields57SchmochU.(2008):`ConceptofaTechnologyClassificationforCountryComparisons,'WIPO,availableathttp://www.wipo.int/edocs/mdocs/classifications/en/ipc_ce_41/ipc_ce_41_5‐annex1.pdf(accessedFebruary2012)

74
(including (i) furniture, games, (ii) other consumergoods, and (iii) civil engineering).Eachofthesetechnologyclasses isbrokendownintoavaryingnumberofsubclasses.TableA16providesanoverview.
2.7.2PriorityInformationInprinciple, the INAPI rawdataprovides uswith priority information in the formofprioritypatentnumbers,priority filingdates,andthepriorityauthorities.Aswith thetrademarkdata,themaindatachallengeconsistsinthelackofconsistentrecordingofpriority patent numbers. Priority numbers are often only partly recorded making itextremelydifficultifnotimpossibletoretrievethecorrespondingpriorityfiling.Asfortrademarks, due to the lack of reliable information, we drop priority filing numbersfromthedatabase.Withregardtothepriorityauthorityanddate,thereareanumberoferroneousentries,whichweattempttocorrect.
2.7.3Application,grant,andlapsedateWealsoincorporatetheapplication,grant,andlapsedateofpatents,utilitymodels,andindustrial designs (and “patente precausional” and industrial drawings). Theconstruction of the dates required some corrections, in particular to ensure theconsistency of the different dates (i.e., that the lapse date does not predate theapplicationdateetc.). Themain limitationof theavailabledata is the lackof reliableinformationonpublicationdates.Weattemptedtoconstructthepublicationdatefromthe information in the legal status table.This still resulted inerror‐pronedata,whichledustoexcludethepublicationdatefromthedatabase.
2.7.4LegalStatusTable A17 shows the summary legal status information for the patent, utility mode,industrialdesign(and“patenteprecausional”andindustrialdrawings)data.Whilenotshown inTableA17, the full legalstatus table isavailable tous,whichprovidesmoredetailedinformationonthegrantingprocessandrenewaldecisions.

75
Table A1: Trademark Data‐ Raw Data Description
All Residents Non‐residents
Application Year # Applications # Applicants # Applications
# Applicants
# Applications
# Applicants
1990 20,627 11,271 15,206 8,215 5,421 3,069
1991 29,291 14,615 21,351 10,487 7,941 4,145
1992 31,556 14,480 22,840 10,259 8,720 4,236
1993 34,041 15,746 25,321 11,561 8,722 4,200
1994 32,480 15,482 23,977 11,200 8,506 4,302
1995 34,428 15,262 24,860 10,739 9,573 4,533
1996 34,575 15,524 24,151 10,661 10,426 4,883
1997 36,119 16,060 24,788 10,705 11,333 5,372
1998 34,847 15,819 22,826 10,208 12,023 5,626
1999 34,293 14,929 22,847 9,858 11,448 5,080
2000 40,889 16,669 27,273 11,105 13,620 5,579
2001 40,376 16,125 27,735 10,939 12,641 5,195
2002 38,924 15,818 28,273 11,350 10,652 4,483
2003 38,611 15,957 28,126 11,514 10,486 4,466
2004 38,293 16,322 28,570 11,946 9,724 4,396
2005 43,555 18,462 32,391 13,365 11,165 5,119
2006 40,876 17,908 28,755 12,575 12,129 5,356
2007 43,259 18,291 29,662 12,511 13,600 5,802
2008 47,971 19,501 32,013 12,895 15,963 6,628
2009 38,920 17,121 26,378 11,235 12,543 5,903
2010 44,164 18,699 29,507 12,681 14,657 6,044
Total* 778,095 220,064 546,850 154,856 231,293 65,777
* Total of applicants (applicant name) counts each applicant only once

76
Table A2: Patent Data‐ Raw Data Description
All Residents Non‐residents
Application Year # Applications # Applicants
# Applications
# Applicants
# Applications
# Applicants
1990 681 433 104 81 577 353
1991 925 561 144 125 781 437
1992 1,258 713 188 150 1,070 563
1993 1,457 836 195 154 1,262 682
1994 1,727 1,016 227 193 1,500 823
1995 1,884 1,024 187 159 1,697 867
1996 2,181 1,226 215 180 1,966 1,049
1997 2,730 1,233 149 134 2,581 1,100
1998 2,972 1,374 189 172 2,783 1,202
1999 2,951 1,285 200 163 2,751 1,123
2000 3,247 1,370 199 175 3,048 1,199
2001 2,892 1,256 236 198 2,656 1,059
2002 2,552 1,084 249 206 2,303 878
2003 2,407 1,031 249 188 2,158 843
2004 2,884 1,148 263 203 2,621 945
2005 3,075 1,199 307 217 2,768 982
2006 3,419 1,225 277 197 3,142 1,029
2007 3,609 1,377 311 238 3,298 1,139
2008 3,585 1,377 345 238 3,240 1,139
2009 1,938 976 335 250 1,603 726
2010 1,106 674 238 193 868 481
Total* 49,480 15,151 4,807 3,116 44,673 12,050
* Total of applicants (applicant name) counts each applicant only once
Data contains patents, utility models, industrial designs and drawings.
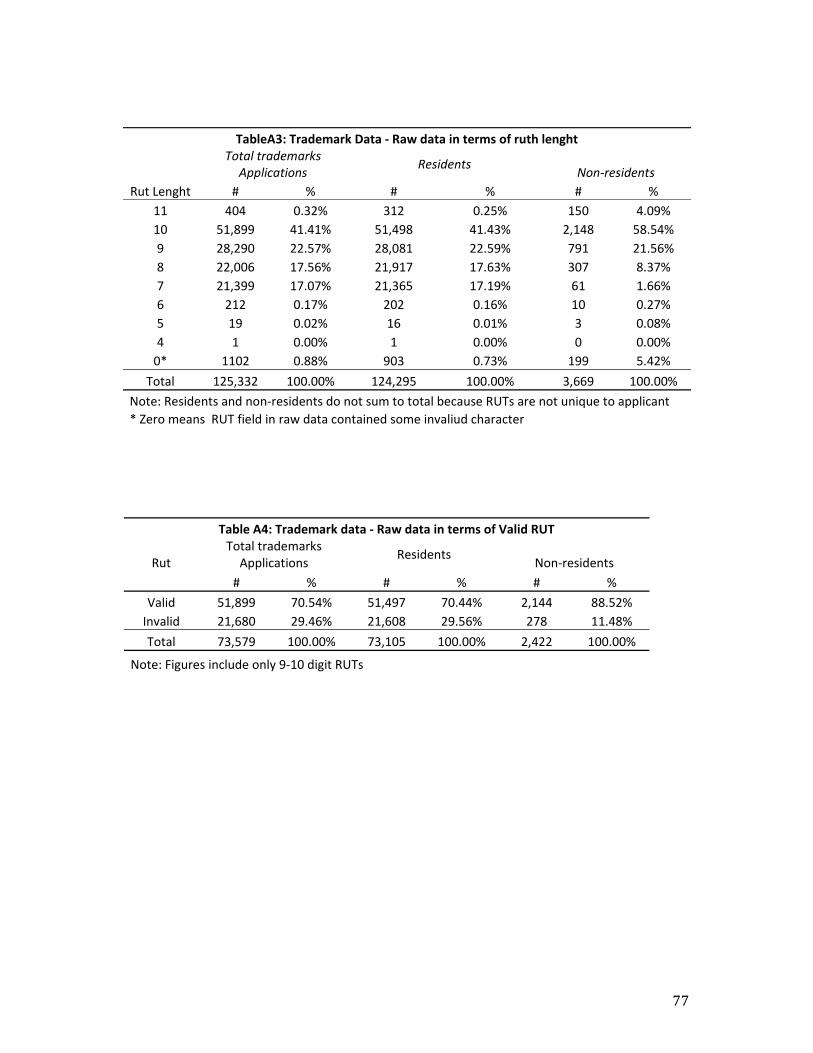
77
TableA3: Trademark Data ‐ Raw data in terms of ruth lenght
Total trademarks Applications
Residents Non‐residents
Rut Lenght # % # % # %
11 404 0.32% 312 0.25% 150 4.09%
10 51,899 41.41% 51,498 41.43% 2,148 58.54%
9 28,290 22.57% 28,081 22.59% 791 21.56%
8 22,006 17.56% 21,917 17.63% 307 8.37%
7 21,399 17.07% 21,365 17.19% 61 1.66%
6 212 0.17% 202 0.16% 10 0.27%
5 19 0.02% 16 0.01% 3 0.08%
4 1 0.00% 1 0.00% 0 0.00%
0* 1102 0.88% 903 0.73% 199 5.42%
Total 125,332 100.00% 124,295 100.00% 3,669 100.00%
Note: Residents and non‐residents do not sum to total because RUTs are not unique to applicant
* Zero means RUT field in raw data contained some invaliud character
Table A4: Trademark data ‐ Raw data in terms of Valid RUT
Rut Total trademarks Applications
Residents Non‐residents
# % # % # %
Valid 51,899 70.54% 51,497 70.44% 2,144 88.52%
Invalid 21,680 29.46% 21,608 29.56% 278 11.48%
Total 73,579 100.00% 73,105 100.00% 2,422 100.00%
Note: Figures include only 9‐10 digit RUTs

78
Table A5: Extract of the `trademark dictionary’
ID Applicant Name RUT
Special RUT Country
182147 zermat internacional sa de cv 60805008* 1 MX
182147 zermat internacional sa de cv 883373006** 1 CL
182147 zermat internacional sa 883373006** 1 CL
112711 blanca alfaro patricio 108191988 CL
112711 patricio blanca alfaro 100746069 CL
111766 xstrata copper chile sa 883258002 CL
111766 xstrata norte exploraciones servicio ltda 766736807 CL
111766 xstrata chile sa 969720701 CL
167056 jaime alcibiades eduardo lavin mosquera CL
167056 lavin mosquera jaime alcibiedes eduardo 2472403 CL
167056 lavin mosquera jaime alcibiades eduardo 24724034 CL
* Tesoreria General Metropolitana
** Serrano Weinstein Vermehren (lawfirm)
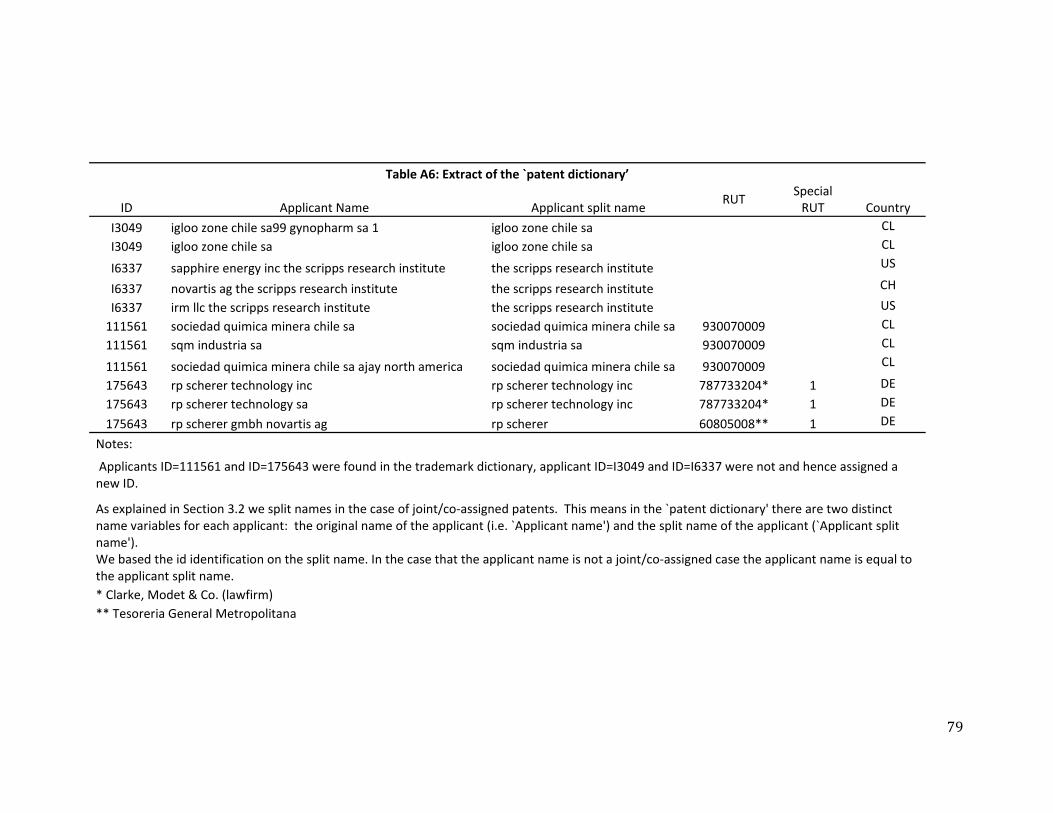
79
Table A6: Extract of the `patent dictionary’
ID Applicant Name Applicant split name RUT
Special RUT Country
I3049 igloo zone chile sa99 gynopharm sa 1 igloo zone chile sa CL
I3049 igloo zone chile sa igloo zone chile sa CL
I6337 sapphire energy inc the scripps research institute the scripps research institute US
I6337 novartis ag the scripps research institute the scripps research institute CH
I6337 irm llc the scripps research institute the scripps research institute US
111561 sociedad quimica minera chile sa sociedad quimica minera chile sa 930070009 CL
111561 sqm industria sa sqm industria sa 930070009 CL
111561 sociedad quimica minera chile sa ajay north america sociedad quimica minera chile sa 930070009 CL
175643 rp scherer technology inc rp scherer technology inc 787733204* 1 DE
175643 rp scherer technology sa rp scherer technology inc 787733204* 1 DE
175643 rp scherer gmbh novartis ag rp scherer 60805008** 1 DE
Notes:
Applicants ID=111561 and ID=175643 were found in the trademark dictionary, applicant ID=I3049 and ID=I6337 were not and hence assigned a new ID.
As explained in Section 3.2 we split names in the case of joint/co‐assigned patents. This means in the `patent dictionary' there are two distinct name variables for each applicant: the original name of the applicant (i.e. `Applicant name') and the split name of the applicant (`Applicant split name'). We based the id identification on the split name. In the case that the applicant name is not a joint/co‐assigned case the applicant name is equal to the applicant split name.
* Clarke, Modet & Co. (lawfirm)
** Tesoreria General Metropolitana

80
Table A7: Extract of the `final dictionary’
ID Applicant Name Applicant new name RUT
Special RUT Country Type
30120 astrazeneca ab nps pharmaceuticals inc astrazeneca ab 797133000* 1 GB company
30120 astrazeneca ab bayer schering pharma ag astrazeneca ab 608050086** 1 SE company
30788 astrazeneca ab bayer schering pharma ag bayer schering pharma ag 797133000 DE company
30788 bayer schering pharma ag epix pharmaceuticals inc bayer schering pharma ag 607010005*** 1 DE company
384 universidad de magallanes universidad de magallanes 711337008
CL university
384 univ de santiago chile 50 univ arturo prat 15 univ de magallanes 10 pontif univ catolica valparaiso 25
universidad de magallanes 711337008
CL
university
3029 ginette c vidal ginette c vidal 88608402 CL individual
3029 vidal rojas ginette c ginette c vidal 88608402 CL individual
3029 ginette c vidal rojas ginette c vidal 88608402 CL individual
3029 vidal rojas ginette cecilia ginette c vidal 88608402 CL individual
* Sargent & Krahn (lawfirm)
** Tesoreria General Metropolitana
*** Subsecretaria de Economia y Empresas de Menor Tamaño

81
Table A8: Trademark & Patent Data ‐ Cleaned Data Description (# Applicants)
All Residents Non‐residents
Application Year Trademarks Patents Trademarks Patents Trademarks Patents
1990 8920 377 6841 94 2119 284
1991 11805 501 8763 134 3097 370
1992 11937 629 8785 156 3201 475
1993 12848 692 9704 154 3196 540
1994 12430 866 9245 201 3240 668
1995 12486 862 9016 174 3517 693
1996 12481 963 8869 186 3664 783
1997 12816 1025 8820 155 4052 872
1998 12774 1094 8573 185 4254 912
1999 12236 1019 8445 178 3842 845
2000 13362 1115 9240 188 4178 932
2001 13371 1042 9403 223 4020 822
2002 13163 906 9757 232 3455 674
2003 13120 864 9774 210 3401 655
2004 13464 945 10104 218 3407 729
2005 14736 1016 11025 212 3771 806
2006 14611 1025 10631 210 4037 817
2007 15075 1183 10590 253 4540 930
2008 16081 1198 10956 238 5188 960
2009 14215 914 9837 270 4427 646
2010 15930 639 11184 211 4808 432
Total* 146,092 10,943 108,071 2,997 38,816 8,010
* Total of applicants (applicant name) counts each applicant only once
** Sum of # resident and # non‐resident applicants exceeds total # applicants as applicants may report a Chilean and foreign residency
Data contains patents, utility models, industrial designs and drawings.

82
Table A9: Trademark & patent data ‐ RUT availability
Rut Applicant Trademarks Patents
# % # % # %
≥ 1 Valid 89,727 81.77% 88,896 82.30% 2,117 66.41%
`Special' 903 0.82% 902 0.84% 62 1.94%
Missing 1,029 0.94% 152 0.14% 879 27.57%
Corrected 17,990 16.40% 17,990 16.65% 128 4.02%
10‐digit 77 0.07% 77 0.07% 2 0.06%
Total 109,726 100.00% 108,017 100.00% 3,188 100.00%
Notes: Resident applicants only
Data contains patents, utility models, industrial designs and drawings.
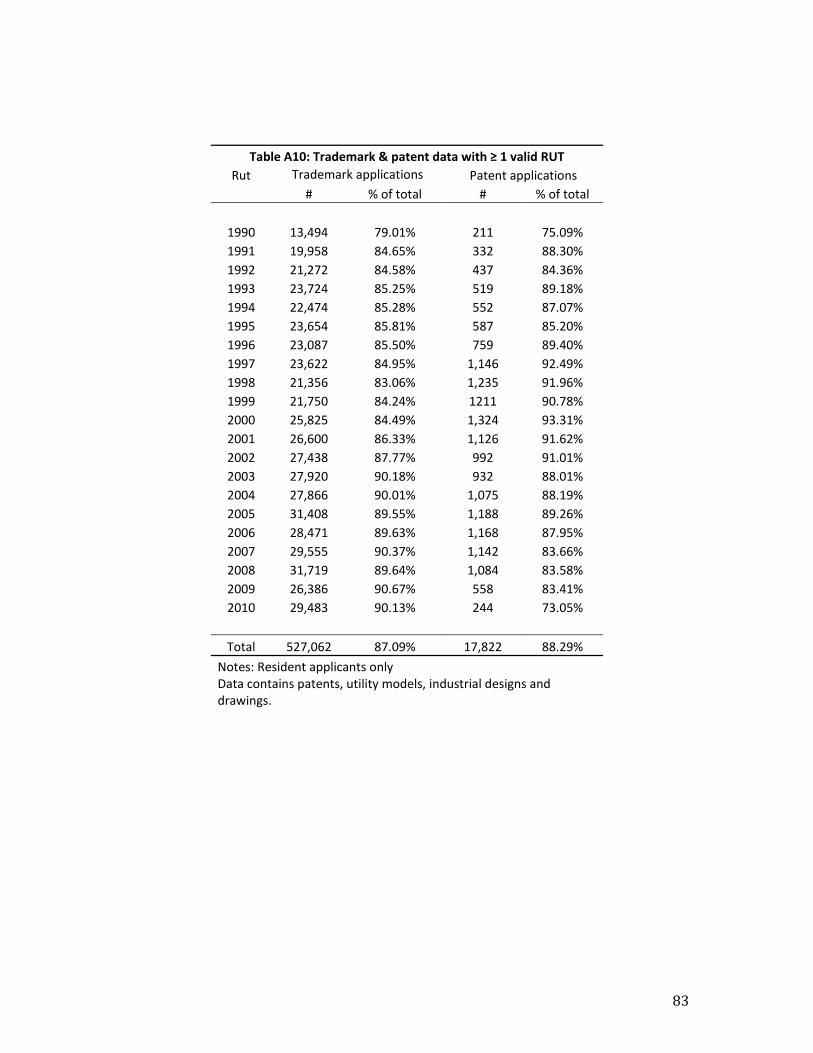
83
Table A10: Trademark & patent data with ≥ 1 valid RUT
Rut Trademark applications Patent applications
# % of total # % of total
1990 13,494 79.01% 211 75.09%
1991 19,958 84.65% 332 88.30%
1992 21,272 84.58% 437 84.36%
1993 23,724 85.25% 519 89.18%
1994 22,474 85.28% 552 87.07%
1995 23,654 85.81% 587 85.20%
1996 23,087 85.50% 759 89.40%
1997 23,622 84.95% 1,146 92.49%
1998 21,356 83.06% 1,235 91.96%
1999 21,750 84.24% 1211 90.78%
2000 25,825 84.49% 1,324 93.31%
2001 26,600 86.33% 1,126 91.62%
2002 27,438 87.77% 992 91.01%
2003 27,920 90.18% 932 88.01%
2004 27,866 90.01% 1,075 88.19%
2005 31,408 89.55% 1,188 89.26%
2006 28,471 89.63% 1,168 87.95%
2007 29,555 90.37% 1,142 83.66%
2008 31,719 89.64% 1,084 83.58%
2009 26,386 90.67% 558 83.41%
2010 29,483 90.13% 244 73.05%
Total 527,062 87.09% 17,822 88.29%
Notes: Resident applicants only Data contains patents, utility models, industrial designs and drawings.

84
Table A11: Summary trademark & patent data
Raw data Cleaned data
Trademark applications Patent applications Trademark applications Patent applications
#ˣ % of total # % of total # % of total # % of total
Total 778,095 100% 49,480 100% 778,095 100% 49,480 100%
Non‐resident 231,293 29.73% 44,673 90.28% 176,745 22.72% 38,340 77.49%
Resident 546,850 70.28% 4,807 9.72% 600,925 77.23% 11,222 22.68%
Valid RUT 527,062 67.74% 17,822 36.02%
Notes:
ˣ Non‐resident and resident applications do not sum to Total because applications may contain resident and non‐resident applicants
Data contains patents, utility models, industrial designs and drawings.

85
Table A12: Trademark Nice Class and Economic Activity
Economic activity % Total Nice classes
Agricultural products and services 29 30 31 32 33 43
% of Total 14.8% 3.2% 3.8% 2.3% 2.3% 2.5% 0.7%
Chemicals 1 2 4
% of Total 6.0% 2.6% 1.7% 1.7%
Construction, Infrastructure 6 17 19 37 40
% of Total 7.8% 2.1% 1.8% 2.0% 1.5% 0.4%
Household equipment 8 11 20 21
% of Total 7.8% 1.7% 2.1% 2.1% 1.9%
Leisure, Education, Training 13 15 16 28 41
% of Total 12.5% 1.3% 1.3% 4.7% 2.2% 2.9%
Management, Communications, Real estate and Financial services 35 36
% of Total 5.3% 3.4% 1.8%
Pharmaceuticals, Health, Cosmetics 3 5 10 44
% of Total 12.1% 3.9% 5.9% 1.9% 0.4%
Scientific research, Information and Communication technology 9 38 42 45
% of Total 9.7% 4.1% 2.2% 3.3% 0.1%
Textiles ‐ Clothing and Accessories 14 18 22 23 24 25 26 27 34
% of Total 17.6% 1.7% 1.9% 1.4% 1.4% 1.9% 4.7% 1.4% 1.5% 1.6%
Transportation and Logistics 7 12 39
% of Total 6.6% 2.3% 2.3% 2.0%
Source of classification: Edital
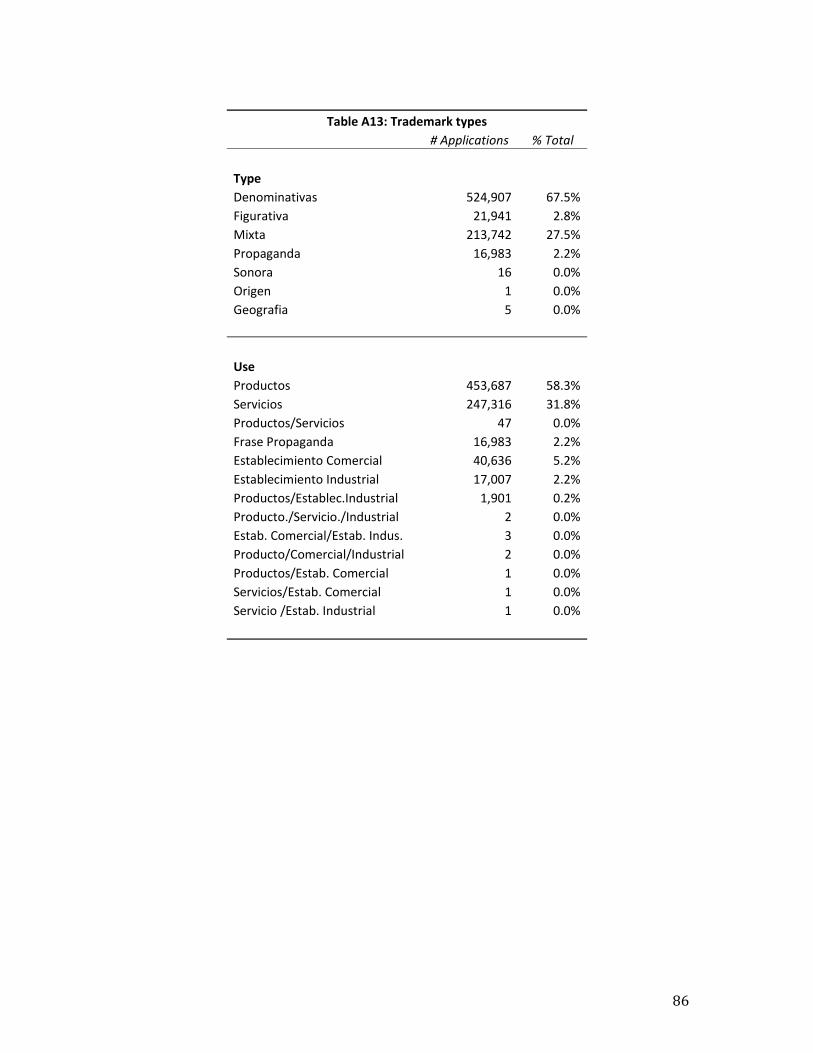
86
Table A13: Trademark types
# Applications % Total
Type
Denominativas 524,907 67.5%
Figurativa 21,941 2.8%
Mixta 213,742 27.5%
Propaganda 16,983 2.2%
Sonora 16 0.0%
Origen 1 0.0%
Geografia 5 0.0%
Use
Productos 453,687 58.3%
Servicios 247,316 31.8%
Productos/Servicios 47 0.0%
Frase Propaganda 16,983 2.2%
Establecimiento Comercial 40,636 5.2%
Establecimiento Industrial 17,007 2.2%
Productos/Establec.Industrial 1,901 0.2%
Producto./Servicio./Industrial 2 0.0%
Estab. Comercial/Estab. Indus. 3 0.0%
Producto/Comercial/Industrial 2 0.0%
Productos/Estab. Comercial 1 0.0%
Servicios/Estab. Comercial 1 0.0%
Servicio /Estab. Industrial 1 0.0%

87
Table A14: Trademark legal status
Legal status # Applications % Total
Abandoned 26,179 3.4%
“Desistida" 1,742 0.2%
Lapsed 3,038 0.4%
Rejected 147,422 18.9%
Expired 115,935 14.9%
Registered 71,627 9.2%
In process 413,396 53.0%
Table A15: IP types
Type # Applications % Total
Patent 42,455 85.8%
Utility model 1,052 2.1%
Industrial design 5,862 11.9% “Precausional” patent 63 0.1%
Industrial drawing 34 0.1%
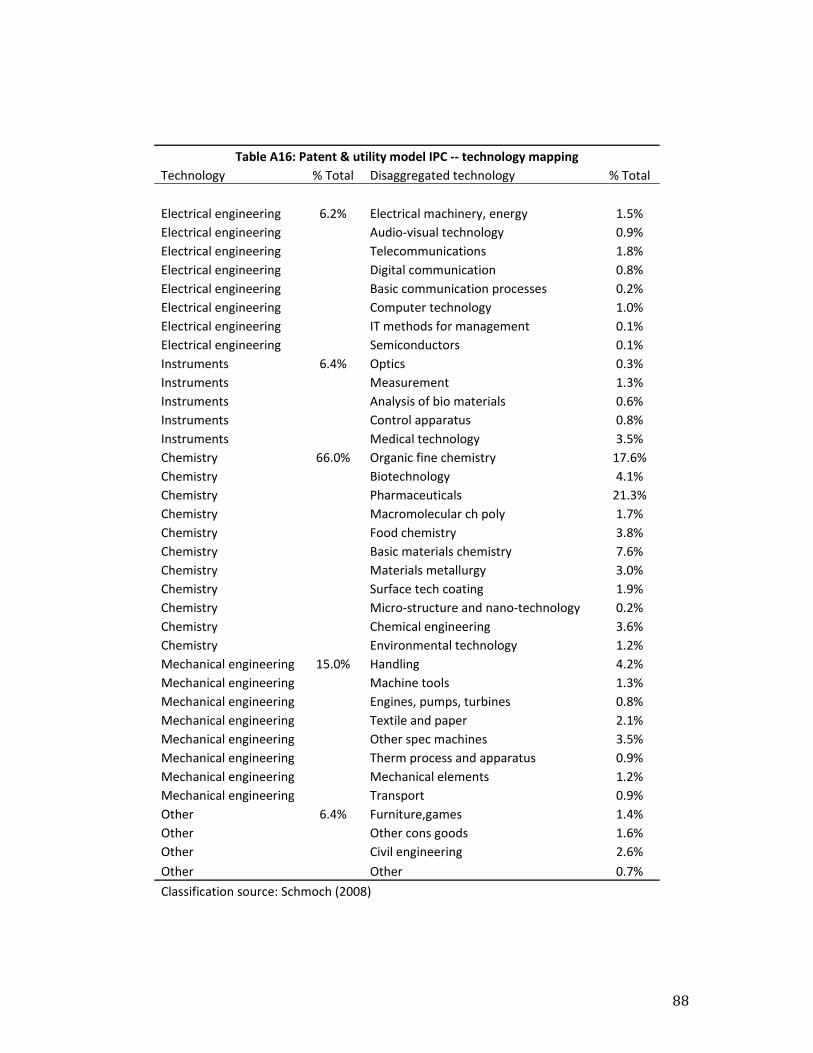
88
Table A16: Patent & utility model IPC ‐‐ technology mapping
Technology % Total Disaggregated technology % Total
Electrical engineering 6.2% Electrical machinery, energy 1.5%
Electrical engineering Audio‐visual technology 0.9%
Electrical engineering Telecommunications 1.8%
Electrical engineering Digital communication 0.8%
Electrical engineering Basic communication processes 0.2%
Electrical engineering Computer technology 1.0%
Electrical engineering IT methods for management 0.1%
Electrical engineering Semiconductors 0.1%
Instruments 6.4% Optics 0.3%
Instruments Measurement 1.3%
Instruments Analysis of bio materials 0.6%
Instruments Control apparatus 0.8%
Instruments Medical technology 3.5%
Chemistry 66.0% Organic fine chemistry 17.6%
Chemistry Biotechnology 4.1%
Chemistry Pharmaceuticals 21.3%
Chemistry Macromolecular ch poly 1.7%
Chemistry Food chemistry 3.8%
Chemistry Basic materials chemistry 7.6%
Chemistry Materials metallurgy 3.0%
Chemistry Surface tech coating 1.9%
Chemistry Micro‐structure and nano‐technology 0.2%
Chemistry Chemical engineering 3.6%
Chemistry Environmental technology 1.2%
Mechanical engineering 15.0% Handling 4.2%
Mechanical engineering Machine tools 1.3%
Mechanical engineering Engines, pumps, turbines 0.8%
Mechanical engineering Textile and paper 2.1%
Mechanical engineering Other spec machines 3.5%
Mechanical engineering Therm process and apparatus 0.9%
Mechanical engineering Mechanical elements 1.2%
Mechanical engineering Transport 0.9%
Other 6.4% Furniture,games 1.4%
Other Other cons goods 1.6%
Other Civil engineering 2.6%
Other Other 0.7%
Classification source: Schmoch (2008)
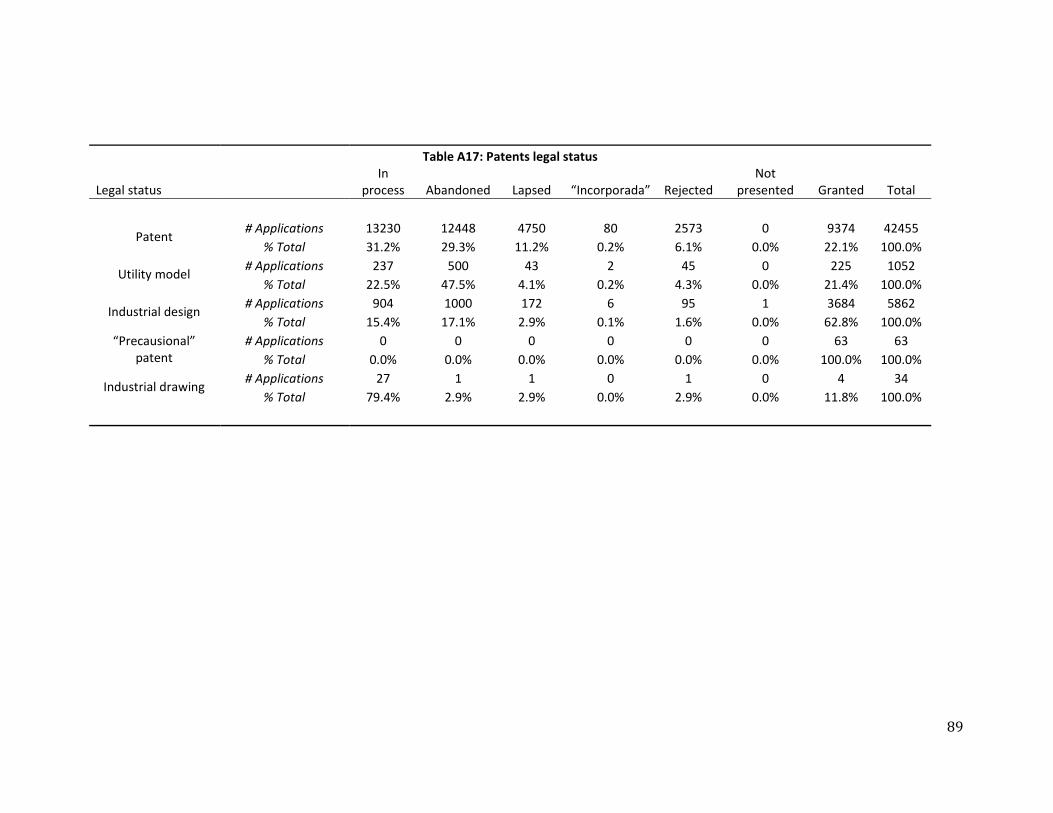
89
Table A17: Patents legal status
Legal status In
process Abandoned Lapsed “Incorporada” Rejected Not
presented Granted Total
Patent # Applications 13230 12448 4750 80 2573 0 9374 42455
% Total 31.2% 29.3% 11.2% 0.2% 6.1% 0.0% 22.1% 100.0%
Utility model # Applications 237 500 43 2 45 0 225 1052
% Total 22.5% 47.5% 4.1% 0.2% 4.3% 0.0% 21.4% 100.0%
Industrial design # Applications 904 1000 172 6 95 1 3684 5862
% Total 15.4% 17.1% 2.9% 0.1% 1.6% 0.0% 62.8% 100.0%
“Precausional” patent
# Applications 0 0 0 0 0 0 63 63
% Total 0.0% 0.0% 0.0% 0.0% 0.0% 0.0% 100.0% 100.0%
Industrial drawing # Applications 27 1 1 0 1 0 4 34
% Total 79.4% 2.9% 2.9% 0.0% 2.9% 0.0% 11.8% 100.0%