the use of environmental indicators for impact assessment ... · the use of environmental...
TRANSCRIPT

THE USE OF ENVIRONMENTAL INDICATORS FOR IMPACT ASSESSMENT IN COMPLIANCE WITH THE NATIONAL
ENVIRONMENTAL POLICY ACT
Prepared for
U.S. Nuclear Regulatory Commission Contract NRC–02–07–006
Prepared by
David R. Turner Larry Canter (Environmental Impact Training, Inc.)
Center for Nuclear Waste Regulatory Analyses San Antonio, Texas
May 2008

ii
CONTENTS Section Page EXECUTIVE SUMMARY .......................................................................................................... iii ACKNOWLEDGMENTS ...........................................................................................................iv 1 INTRODUCTION......................................................................................................... 1-1 1.1 Objectives....................................................................................................... 1-1 1.2 Background on Indicator Uses ....................................................................... 1-1 1.2.1 General Background .......................................................................... 1-1 1.2.2 Definitions .......................................................................................... 1-3 2 CONSIDERATIONS IN USING ENVIRONMENTAL IMPACT INDICATORS ............. 2-1 2.1 Use of Indicators in the NEPA Process—An Historical Perspective............... 2-1 2.2 Role of Impact Indicators in Monitoring and Assessing National Ecological Health............................................................................................ 2-3 2.3 Environmental Indicators in Adaptive Management ....................................... 2-4 2.4 Scientific and Policy Support for the Use of Indicators ................................... 2-5 2.4.1 National Research Council ................................................................ 2-5 2.4.2 A National Conference—Scientific and Policy Support for the Use of Indicators ....................................................................................... 2-8 3 SUMMARY AND CONCLUSIONS.............................................................................. 3-1 4 REFERENCES............................................................................................................ 4-1 APPENDIX A—PROCESS FOR DEVELOPMENT OF INDICATORS APPENDIX B—CASE STUDIES

iii
EXECUTIVE SUMMARY
A useful way to evaluate impact significance within the context of National Environmental Policy Act (NEPA) is to use environmental indicators to characterize the status of different resource areas and monitor their response to potential stresses introduced by the proposed action (i.e., the pressure-state-response framework). Indicators offer the advantage of providing a simple, easy to understand measure of the responses of inherently complex natural and socioeconomic systems. Indicators can also be used to support monitoring and mitigation activities identified in an environmental impact analysis. There is a significant amount of scientific and policy information to support indicator use, both in general ecological analysis and environmental impact assessments related to NEPA compliance. Different agencies and organizations have focused on identifying, selecting, and using environmental indicators and indicator sets to monitor ecological health and set environmental priorities at local, regional, national, and international scales. The National Research Council, the U.S. Environmental Protection Agency, and the U.S. Government Accountability Office in particular have supported using indicators to evaluate the status of the ecosystems in the United States, and to evaluate and monitor the ecological performance of these systems. The Federal court system has supported the concept of indicator usage for NEPA compliance. In evaluating the use of indicators, NEPA analysts should consider several questions: • Are the indicators appropriate to the proposed action and the resource of interest? • Are the indicators clear and understandable to stakeholders and members of the public? • Is the listing of indicators complete and is their complexity appropriate to the resource
of interest? • Can the proposed indicators be measured and the information reasonably gathered? • Is it appropriate to use certain indicators for addressing construction phase impacts and
others for operational phase impacts? • Do pertinent professional societies or other agencies provide information on
recommended indicators for particular resources? Although the details of the processes used in selecting environmental impact indicators vary, most applications have used a systematic process that relies on the judgment of subject matter experts. Development of environmental indicators as part of a NEPA analysis to evaluate potential environmental impacts should be carefully documented, with a traceable rationale for identifying, screening, and selecting the indicators used.

iv
ACKNOWLEDGMENTS This report was prepared to document work performed by the Center for Nuclear Waste Regulatory Analyses (CNWRA) for the U.S. Nuclear Regulatory Commission (NRC) under Contract No. NRC–02–07–006. The activities reported here were performed on behalf of the NRC Office of Nuclear Material Safety and Safeguards, Division of High-Level Waste Repository Safety. The report is an independent product of CNWRA and does not necessarily reflect the views or regulatory position of NRC. The authors would like to thank Bradley Werling and Gordon Wittmeyer for their thoughtful reviews, and Lee Selvey and Lauren Mulverhill for excellent word processing and technical editing support.
QUALITY OF DATA, ANALYSES, AND CODE DEVELOPMENT DATA: All CNWRA-generated data contained in this report meet quality assurance requirements described in the Geosciences and Engineering Division Quality Assurance Manual. Sources of other data should be consulted for determining the level of quality of those data. No original data are generated in this report. ANALYSES AND CODES: No software was used to generate the information presented in this report.

1-1
1 INTRODUCTION Section 102 (A) of National Environmental Policy Act (NEPA) calls for federal agencies, to the fullest extent possible, to “…utilize a systematic, interdisciplinary approach which will insure the integrated use of the natural and social sciences and the environmental design arts in planning and in decisionmaking which may have an impact on man’s environment…” for those federal actions which may significantly affect the quality of the human environment. This statutory basis is at the heart of NEPA and forms the basis for federal agencies to document the potential environmental effects of their decisions in environmental impact statements (EISs) and environmental assessments. Ideally, an assessment of the effects of a given proposed action would include all impacts to the affected environment. Environmental systems tend to be complex, however, with diverse feedbacks mechanisms. It is not possible to examine every impact from a proposed action in detail, and determining the overall impact to the affected environment may not be straightforward. This is particularly true for large-scale projects that involve multiple actions and effects, and extensive geographical areas. One approach to addressing this complexity in impact assessment is to identify a limited set of environmental performance indicators that can be clearly linked to effects of a proposed action on different resources. By appropriately focusing the analysis, this type of approach can help to bound the impacts to different resource areas. In addition, the use of indicators facilitates the prioritization of analyses needed on specific topics or impact issues and may identify areas suitable for mitigation and subsequent monitoring. In this report, a process for identifying and selecting environmental indicators is described in Appendix A. This appendix includes a summary of general steps to develop a framework for an indicator set. Examples of selection criteria used by different federal and international organizations are presented, and traceability issues are discussed. In Appendix B, examples of environmental impact indicators for different resources are presented and case studies where environmental impact indicators have been applied are described. 1.1 Objectives Recent literature suggests that NEPA environmental impact assessments are increasingly using of indicators to evaluate impact significance. To provide NRC and Center for Nuclear Waste Regulatory Analyses staffs with an independent capability to evaluate proposed environmental indicators, the principal objectives of this report are to • Describe the current state-of-practice in identifying, selecting, and using environmental
indicators (e.g., indicator development process, selection criteria); and • Summarize scientific and policy support related to the use of indicators. 1.2 Background on Indicator Uses 1.2.1 General Background In a broad sense, most indicators are developed to establish baselines and monitor environmental, economic, and social changes over time. In preparing EISs or environmental assessments to comply with NEPA requirements, environmental impact indicators have been

1-2
used to describe the affected environment and address potential environmental consequences (effects) in relation to resources and other attributes such as • Land use, • Air quality (nonradiological and radiological), • Hydrology and water use, • Biology and soils, • Cultural resources, • Socioeconomics, • Occupational and public health, • Accidents, • Noise, • Aesthetics, • Utilities, • Waste management, and • Environmental justice. The general concept is that such indicators should encompass measures related to the most important contributing factors to potential impacts and/or to the most important parameters affected by the factors. In practice, selected indicators are typically based on intermediate results that dominate anticipated results. For example, estimates of contaminant concentrations in groundwater may be selected as an indicator rather than completing the pathway assessment and calculating the health effects to an exposed individual. Ideally, such indicators should have a clear causal relationship to impact-causing activities and be sensitive to the resultant effects. Indicators that are directly proportional to the extent of the potential impact are the most straightforward. More complex conceptual models for indicators are possible (EPA, 1994), but these are more difficult to describe in an EIS intended to inform members of the public. Environmental indicators have generally been developed for related, but non-NEPA purposes. For example, indicators may be used to establish the condition of environmental resources, prioritize existing contamination problems and remediation needs, evaluate compliance with regulatory programs and permit requirements, implement environmental monitoring and management systems, and in decisionmaking related to natural resources management. Several recent publications have focused on developing strategies for identifying, implementing, and evaluating suitable ecological indicators (EPA, 2000; National Research Council, 2000; U.S. Government Accountability Office, 2004a). Other terms have been used in context similar to indicators as described previously, but are not strictly equivalent. For example, several types of environmental indices have been proposed to aggregate different measurements and develop an overall rank scoring of the status of a given environmental resource. This type of index approach may be used to assess the health of a large-scale ecosystem, where several different metrics are monitored. For example, a multimetric benthic index to assess the response of
Defining Environmental Impact Indicators As described by the U.S. Environmental Protection Agency (EPA, 2000), an indicator is a “…sign or signal that relays a complex message, potentially from numerous sources, in a simplified and useful manner.” Based on this definition and in the context of NEPA, an environmental indicator, or set of indicators, is a means of characterizing impacts to an environmental resource or one of its important components. The usefulness of indicators depends on the extent to which they can be used to establish a baseline condition, and track or predict changes in the resource in response to a proposed action. Implicit in this definition is the applicability of an indicator or indicator set over relevant spatial and temporal scales.

1-3
estuarine environments to short- and long-term disturbances was evaluated using the U.S Environmental Protection Agency (EPA) evaluation guidelines for ecological indicators (EPA, 2000). Similar quantitative multimetric indices are described in texts on environmental impact assessment (e.g., Canter, 1996, 1977). 1.2.2 Definitions Several definitions are fundamental to the variety of topics addressed in this report. The most basic definition relates to the term “indicator.” Three additional relevant terms are “environmental indicator data sets,” “environmental index,” and “comprehensive key indicator systems”: Indicator—An indicator, comprising a single datum (a variable) or an output value from a set of data (aggregation of variables), describes a system or process that has significance beyond the face value of its components. It aims to communicate information on the system or process (Duque, et al., 2006). The term indicator can be applied to many fields and scientific endeavors. In this report, it will primarily relate to environmental or ecological indicators. Environmental indicator data sets—This term refers to sets (groups of specific indicators) of indicators used to assemble quantitative measures of conditions and trends to assess the state of the environment and natural resources and to gauge progress toward specific goals. In general, indicator sets are designed to provide environmental decisionmakers and the public with comprehensible information to assist developing strategic plans, setting priorities, and assessing which programs are or are not working well (U.S. Government Accountability Office, 2004a). Environmental index—An environmental index refers to a numerical or descriptive categorization of a large quantity of environmental data or information, with the primary purpose being to summarize and simplify such data and information so as to make it useful to decisionmakers and various stakeholders (Canter, 1996, p. 122). Two reference books provide useful initial information on such indices. For example, Inhaber (1976) focused on the development and use of a variety of indices for evaluating environmental conditions. Such indices represented composited information on selected indicators of environmental media and resources. Examples of indices used in numerous countries were presented in chapters on air quality, water quality, land, biological characteristics, and aesthetics. Ott (1978) described the structure of environmental indices based upon functional expressions for subindices (or indicators) and their aggregation into an overall index. Examples of historical indices for air and water pollution were presented, including the process used for their development. Conceptual approaches for development of quality-of-life indices and environmental damage indices were also described. Comprehensive key indicator systems—Systems that pull together only the most essential indicators on a range of economic, environmental, and social and cultural issues as opposed to a group of indicators on one topic. Such systems are diverse and dynamic (U.S. Government Accountability Office, 2004b). Further, these systems can be used to enhance collaboration to address public issues, provide tools to encourage progress, help inform decisionmaking and improve research, and increase public knowledge about key economic, environmental, and social and cultural issues.
2-1
2 CONSIDERATIONS IN USING ENVIRONMENTAL IMPACT INDICATORS 2.1 Use of Indicators in the NEPA Process—An Historical Perspective Environmental indicators have been used in document preparation under the NEPA process since NEPA implementation in January 1970. Section 102(c)(i) of NEPA called for a description of the “environmental impacts of the proposed action,” although no details were provided on the media and resources that should be addressed. Further, the term “environmental indicator” was not included in the Act. However, early EISs began to address selected characteristics related to physical-chemical, biological, cultural, and socioeconomic components of the environment. The components were typically subdivided into specific “indicators,” with the indicators used to describe both the environmental setting and the anticipated consequences (effects) of the proposed action and alternatives. Section 102(c)(iii) of NEPA required a discussion of the “alternatives to the proposed action,” and this section within early EISs was soon characterized by comparative information on the impacts of the alternatives. The impact analyses and displays were based on anticipated changes in the indicators of various environmental components. In 1979, the Council on Environmental Quality (CEQ), which was created by NEPA, promulgated regulations for the NEPA process (40 CFR Parts 1500–1508). One feature of these regulations related to the specification of a typical format for EISs as found in 40 CFR 1502.10–1502.18, but no specific definition for indicators was included in the regulations. Section 1502.15 (Affected Environment) encourages a succinct description, and indicators have been typically used across a broad range of projects, plans, and programs with differing geographical scales. Section 1502.16 (Environmental Consequences) is focused on describing the direct, indirect, and cumulative effects of all analyzed alternatives, including the proposed action. Again, impact-related indicators have typically been used since 1979. Finally, Section 1502.14 (Alternatives Including the Proposed Action), which is described as the “heart of the EIS,” summarizes the comparative impact information for the analyzed alternatives. Summary information from Sections 1502.15 and 1502.16 is typically used in Section 1502.14. As can be seen from these brief descriptions of three sections in a typical EIS, impact study practice for over 25 years has been grounded in the use of appropriately identified indicators. The early years of NEPA practice (the 1970s through the mid 1980s) were also characterized by the development of environmental impact assessment methodologies (Canter, 1996). These matrix and checklist methodologies were typically characterized by the inclusion of environmental categories and lists of associated indicators. Such methodologies have long been used to plan and conduct impact studies and to prepare EISs. These methodologies with their associated indicators have continued to be refined and updated since the mid-1980s. For example, the NRC environmental review guidance for the Office of Nuclear Material Safety and Safeguards licensing actions (NRC, 2003) specifies information on the format and technical content of environmental reports (supplied by license applicants) and EISs (prepared by NRC). Both types of documents list 12 environmental categories that should be included in the section titled Description of the Affected Environment. A total of 13 categories is identified for inclusion in the section titled Environmental Impacts in both

2-2
documents. Environmental justice was added as a category for the environmental impacts section. The common categories for the affected environment and impacts chapters include (i) land use; (ii) transportation; (iii) geology and soils; (iv) water resources; (v) ecology; (vi) meteorology, climatology, and air quality; (vii) noise; (viii) historic and cultural resources; (ix) visual/scenic resources; (x) socioeconomic; (xi) public and occupational health; and (xii) waste management. The impacts chapter lists the word “impacts” after the above categorical headings; further, it includes environmental justice impacts. A careful review of Sections 5.3 (EIS—Description of Affected Environment), 6.3 (environmental report—Description of Affected Environment), 5.4 (EIS—Environmental Impacts), and 6.4 (environmental report—Environmental Impacts) in NUREG–1748 (NRC, 2003) revealed that specific indicators are listed for each environmental description category and each impact category. The indicator specifications provide for an approach that can be used by license applicants and the NRC staff in preparing environmental reports and EISs. Another characteristic of NEPA practice since 1970 has involved litigation regarding inadequacies in the NEPA process or non-compliance with its spirit and intent. Many court cases refer to whether the proponent agencies took a “hard look” at the impacts in relation to site-specific environmental conditions. Accordingly, federal district and appellate courts have typically upheld the use of environmental indicators in EISs and environmental assessments; however, the key issue is often associated with the careful documentation of why the indicators were chosen and explanations of the importance of the findings associated therewith. During the 1990s three CEQ reports related to expanding and/or improving NEPA practice were published. Each report refers to using environmental indicators. For example, one CEQ report supported incorporating biodiversity considerations, as appropriate, within the NEPA process and resulting EISs (CEQ, 1993). Specifically, Appendix B of the report includes examples of biodiversity indicators for inventorying, monitoring, and assessing terrestrial biodiversity at four levels—regional landscape, community-ecosystem, population-species, and generic. For each level, potential indicators are listed to address the relevant composition, structure, and function. The appendix also includes summary information on inventory and monitoring tools (CEQ, 1993, p. 27). In 1997, CEQ issued a report related to the effectiveness of NEPA after 25 years (CEQ, 1997a). Two of five elements identified as critical to the effective and efficient implementation of NEPA were (i) the use of an “interdisciplinary place-based approach to decisionmaking that focuses the knowledge and values from a variety of sources on a specific place” and (ii) the use of “science-based and flexible management approaches once projects are approved” (CEQ, 1997a, p. ix). An interdisciplinary approach requires comprehensive environmental, social, and economic data. Further, it was noted that many federal agencies are using existing or proposed new environmental, social, and economic indicators to provide more consistent information on the status of resources, ecosystems, and human communities over time and various spatial boundaries. The use of follow-on management approaches comprising both monitoring and adaptive management will necessitate the identification of management objectives (goals) and appropriate indicators that could be systematically monitored. To place these management approaches in context, it should be noted that the traditional NEPA model was based upon the concept of “predict, mitigate, and implement.” Accordingly, the traditional model was concluded
2-3
upon the successful completion of an EIS and Record of Decision. Follow-on management approaches are based on a new NEPA model consisting of “predict, mitigate, implement, monitor, and adapt” (CEQ, 1997a, p. 32). This new model, which was advocated by CEQ, extends the NEPA process beyond document preparation (EIS) into longer-term project management. As noted above, indicators have been used in the traditional NEPA model. Follow-on activities associated with the new NEPA process will need to use indicators as a foundation element. In 1997, CEQ also issued guidance on addressing cumulative effects in the NEPA process (CEQ, 1997b). Addressing cumulative effects requires the consideration of larger study areas, longer time frames, and effects contributions from past, present, and reasonably foreseeable future actions. The use of selected indicators can facilitate the analysis of cumulative effects on resources, ecosystems, and human communities. For example, such indicators can be used to describe the historical and current conditions of the affected environment, establish qualitative and/or quantitative connections between various actions and affected resources ecosystems and human communities, and identify collaborative mitigation measures. Further, environmental sustainability may need to be considered relative to potential cumulative effects on already stressed environmental components, thus the use of sustainability indicators may be appropriate. 2.2 Role of Impact Indicators in Monitoring and Assessing National
Ecological Health In 1989, EPA established the Environmental Monitoring and Assessment Program. The main objective of the program was to develop a set of core indicators to evaluate the current status of the nation’s ecological resources, determine trends in the health and integrity of different ecosystems, and monitor the effectiveness of environmental policy at national and regional levels (EPA, 2000, 1994). Early indicator definition strategies under the EPA Environmental Monitoring and Assessment Program and other federal programs were based on identifying indicators that can be used to establish the current status of a given resource and developing indicator databases that could be maintained to develop the continuity necessary to determine ecological trends over time (EPA, 2000, 1994). To further refine the Environmental Monitoring and Assessment Program, EPA enlisted the National Research Council to provide a critical evaluation of the status of scientific bases used to
“…identify criteria for evaluating biological indicators, to evaluate methods of indicator development, to provide examples of indicators that have proven useful, and to identify areas where further research is likely to yield more useful and powerful indicators.” (National Research Council, 2000, Preface).
Subsequent efforts under the EPA Environmental Indicators Initiative were focused on developing indicators that could be used to support the first Report on the Environment (EPA, 2003). For the purposes of this report, EPA considered an indicator to be a quantitative (numerical) value based on actual measured data. The indicators were grouped in a hierarchy based on the EPA report focus on five broad environmental themes: • Cleaner air, • Purer water,
2-4
• Better protected land, • Human health, and • Ecological condition. Indicators appropriate to each of these themes were initially developed by soliciting a number of peer review workshops to propose a series of more detailed questions (e.g., What is the quality of outdoor air in the United States?) and issues that should be addressed in the Report on the Environment. Indicators that can address the questions/issues were identified from the peer review workshops and evaluated based on the availability, quality, and spatial and temporal scales of the necessary measurements. As noted by EPA, the first three of the five themes (cleaner air, purer water, and better protected land) focus on the status of a given resource, while the last two (human health and ecological condition) are further developed as outcomes (EPA, 2003). In a broad sense, the goals of the EPA Report on the Environment are to establish baseline conditions for ecosystems on a national scale, identify human-induced impacts to these ecosystems, and describe trends in the health of these ecosystems as a function of time and space. To support these goals, EPA proposed an indicator framework based on a pressure-state-response structure: • Pressure describes stressors (e.g., human activity) applied to an environmental resource
that may affect the ambient conditions in a given geographic area over time. • State describes the ambient conditions of the environmental resource. Prior to the
application of a pressure, the state of a resource provides a baseline from which to evaluate trends.
• Response describes how the state of the environmental resource changes in response
to the pressure. The response can have both temporal (trend) and spatial (gradient) aspects.
In general, the pressure-state-response structure provides parallels to the environmental impact assessments that are conducted to comply with NEPA. For example, indicators related to pressure are similar to the type of information presented in the description of the alternatives, including the proposed action (40 CFR 1502.14). The baseline developed in describing the state of an ecosystem is similar to the type of information presented in the description of the affected environment (40 CFR 1502.15), while the response is similar to the assessment of environmental consequences that is at the core of NEPA (40 CFR 1502.16). 2.3 Environmental Indicators in Adaptive Management In 2003, a CEQ Task Force issued a report entitled Modernizing NEPA Implementation (CEQ, 2003). One chapter addressed adaptive management and monitoring, thus further advocating the integration of “follow-on” activities in the new NEPA model. To provide a perspective, it is instructive to consider the typical elements of an adaptive management program, whether it is applied to natural resources management or within the NEPA process, or both.

2-5
The National Research Council recently identified six common elements for developing an adaptive management initiative for water resources projects, plans, or programs. The elements include (National Research Council, 2004a, pp. 22–27): • Management objectives (goals) that are regularly revisited and accordingly revised
(indicators can be used to determine attainment or maintenance of the objectives); • A model(s) of the system being managed (could use conceptual models that helped
identify indicators); • A range of management choices (could be identified via the use of diagnostic indicators); • Monitoring and evaluation of outcomes (based upon indicator monitoring, particularly
regarding performance review indicators); • A mechanism(s) for incorporating learning into future decisions (dissemination of
information on monitoring results and use of the results for making adaptations in project management); and
• A collaborative structure for stakeholder participation and learning (public meetings for
sharing information and soliciting stakeholder inputs). Several of these elements are similar to features of environmental management systems. An internationally used environmental management system is ISO–14000 of the International Organization for Standardization. The 2003 Task Force report included recommendations for integrating environmental management systems into the NEPA process, particularly as related to follow-on activities (CEQ, 2003). The ISO–14000 environmental management system includes the use of indicators for project management. Further, Boling (2005) provides a useful summary of how integrating the NEPA process and the environmental management system tool can be mutually beneficial. 2.4 Scientific and Policy Support for the Use of Indicators 2.4.1 National Research Council In recent years, the National Research Council (National Academies) has conducted several studies and generated publications related to the use of environmental indicators. To understand the applicability of the results, a review of the National Research Council process is helpful. Specifically, the process generally contains the following steps: • A governmental agency (e.g., EPA) requests that the National Research Council, through
one of its specific Boards, conduct a needed study with a specifically delineated objective(s). After discussions and negotiations, and assuming that the Council accepts the proposed study, the agency provides the funding.
• The professional staff of the pertinent Board then identifies an appropriate committee of
experts to actually conduct the study and prepare the resultant book. The committee members are typically recognized as national, regional, or local experts related to the defined study objective(s). The selected members are typically from academia, private industry, state or local government, or pertinent nongovernmental organizations. A

2-6
committee chairman is also appointed. A key point is that the committee comprises individual experts who do not necessarily represent the views of the sponsoring agency.
• The committee and pertinent professional staff from the Council hold several meetings.
Focused workshops and hearings related to the study objective(s) can also be used in the information gathering process. Further, each committee member shares his or her own pertinent knowledge and experience. In some instances, summaries of special workshops are published.
• Following information gathering, the committee then meets and plans the resultant book
to be published by the National Academy Press. The book is prepared via the collaborative writing efforts of the committee members. Book contents typically focus on the fundamental scientific principles related to the study objectives, available or needed methodologies and models to address key issues, and the associated policy implications and potential uses in decisionmaking. Committees will also identify gaps in scientific information and provide cautions related to the use of specific methodologies and models. Finally, and prior to its publication, the book is subjected to both internal reviews by the overall committee and Council professional staff, as well as external reviews by subject matter experts.
Based upon this description, it can be seen that National Research Council books do have a scientific foundation, are prepared using a systematic process, and are subject to peer review. Accordingly, these publications can help validate scientific approaches and various tools and techniques used in different aspects of environmental analysis and management. Of specific relevance to the use of environmental indicators in impact studies conducted within the NEPA process, six examples of relevant National Research Council books follow. These address national indicators, local and regional indicators, the use of site-specific indicators for determining the vulnerability of local groundwater resources to contamination, and the use of waterborne pathogens for various geographic scales. (1) Ecological Indicators for the Nation (National Research Council, 2000) studied the critical
scientific evaluation of indicators to monitor ecological changes from either natural or anthropogenic causes. Although the emphasis is on national indicators, their usage at community, watershed, regional, state, and even international scales is advocated. General criteria for evaluating potential indicators are delineated; further, it can be stated that they are similar to numerous other lists of evaluation criteria. Specific recommendations are included for national ecological indicators in three categories (National Research Council, 2000, p. 7):
• As indicators of the extent and status of the nation’s ecosystems—land cover and
land use;
• As indicators of the nation’s ecological capital—total species diversity, native species diversity, nutrient runoff, and soil organic matter; and
• As indicators of ecological functioning or performance—carbon storage,
production capacity, net primary production, lake trophic status, and stream oxygen and for agricultural ecosystems, nutrient-use efficiency, and nutrient balance.

2-7
The above national indicators could also be adapted to regional and local (site-specific study areas) scales. Other types of regional and local indicators could include productivity indicators, and indicators of species diversity, including more localized indices of biotic integrity. The use of ecosystem conceptual models as a basis for indicator identification was also mentioned.
(2) In the summary of a national workshop on key transportation indicators, Norwood and
Casey (2002) advocate using these indicators as measures of change over time in a transportation system or to assess its social, economic, environmental, or other effects. The workshop, which was conducted in June 2002, discussed various existing and potential indicators and related national information gathering and dissemination needs. Indicators were considered in relation to five U.S. Department of Transportation strategic goals—safety, mobility, economic growth and trade, human and natural environments, and national security. Specific recommendations for national transportation indicators were developed for the first three strategic goals.
(3) The summary of a national workshop to explore environmental health indicators and the
development of a national monitoring system was published by Goldman and Coussens (2004). A diverse group of professionals from a variety of fields participated in the workshop, which promoted using environmental health indicators to provide easily interpretable measures of the state of the environment or the health of defined human populations (or age-delineated population groups such as children). Several themes emerged from the workshop: (i) the concept of a national system to monitor environmental health indicators received consistent support, (ii) the critical need for creating an infrastructure for such a system, and (iii) a suggestion to build upon existing national environmental monitoring programs, and improving monitoring coordination among agencies at various governmental levels.
(4) In 2002, a study on data needs for community participation in informed decisionmaking
was commissioned and published by the Bureau of Transportation Statistics and the U.S. Department of Transportation. The study focused on identifying data, including geospatial data, and performance measures needed to make informed local and regional decisions on transportation, land use planning, and economic development (National Research Council, 2002). An underlying theme related to encouraging broad and effective stakeholder participation in the planning of livable communities which are based upon local goals and community-derived indicators. A balanced set of livability indicators could include those related to social, environmental, and economic sectors. Examples of social indicators related to place and connectivity could include community involvement (e.g., volunteerism), number and locations of parks and recreational areas, and access to health care and social services. Many of the identified indicators could be used for addressing potential social and economic impacts of proposed local or regional projects, plans, or programs.
(5) The National Research Council (1993) addressed the use of site-specific indicators for
determining the vulnerability of local groundwater resources to various types of land uses and associated projects. This study was supported by the U.S. Department of Agriculture, EPA, and the U.S. Geological Survey. Groundwater vulnerability to contamination was defined as “the tendency or likelihood for contaminants to reach a specified position in the groundwater system after introduction at some location above the uppermost aquifer” (National Research Council, 1993, p. 1). Available methods for determining vulnerability include (i) overlay and index methods that combine specific
2-8
physical characteristics that affect vulnerability, often giving a numerical score, (ii) process-based methods consisting of mathematical models that approximate the behavior of substances in the subsurface environment, and (iii) statistical methods that draw associations with areas where contamination is known to have occurred. Each of the methods require that indicator data be available on identified influencing factors such as soil properties, hydraulic properties, precipitation patterns, depth to groundwater, and land use and land cover. Index methods could be useful for describing the groundwater resource; indicating its potential vulnerability to project, plan, or program impacts; and identifying and qualitatively evaluating the effectiveness of potential mitigation measures.
(6) Finally, the National Research Council (2004b) published a report on indicators for
waterborne pathogens. For more than 100 years, public health and environmental regulatory professionals have relied on an indicator organism approach to assess the microbiological quality of drinking water and related water supplies. Enteric bacterial indicators (predominately coliforms) are used to detect microbial contamination from human waste. EPA was the study sponsor, with the objective being to report on candidate indicators for microbial pathogen contamination in recreational waters and source waters. Reviews of current and historical practices and related National Academies reports (books) provided the context for the study. Recommendations were developed for continued improvements in current monitoring of indicator pathogens, exploration of new biological measure opportunities, and adoption of a three-level phased approach for monitoring microbial water quality.
In summary, all six of the National Research Council references uphold the indicator concept and support the use of various types of indicators for a variety of environmental management purposes. An underlying theme was the careful evaluation of indicators and documentation of the resulting rationale for their selection. Finally, environmental indicators can be used for several purposes in impact studies. Examples include identifying potential impacts, describing the affected environment, prediction of environmental impacts, comparing the impacts of analyzed alternatives, selecting the preferred alternative, and evaluating mitigation measures. 2.4.2 A National Conference—Scientific and Policy Support for the Use of Indicators A National Conference on Science, Policy, and the Environment was held in December 2000 in Washington, DC. Over 450 scientists and decisionmakers from academia, government, nongovernmental organizations, industry, business, and other groups were in attendance. The attendees heard papers, participated in working groups, and developed Conference recommendations. One of 14 topical themes related to environmental indicators. The specific recommendation related to indicators was (National Council for Science and the Environment, 2000, p. 6): “Congress and the Administration should direct agencies to invest in the development, use, and reporting of environmental indicators that are • Understandable to the public and to policymakers; • Connected to policy and management goals and measured against defined targets; • Meaningful across varying temporal and spatial scales and take response time and
sensitivity into account when measured against the needs of decisionmakers;
2-9
• Aimed at filling gaps in data, analysis, and reporting among existing indicators, and that place more emphasis on ecosystem-level functions among new indicators;
• Targeted toward defined environmental health goals; • Incorporated into integrative models showing feedback among indicators (such models
display predictive scenarios, and incorporate degrees of certainty); • Able to facilitate simulation, which can be useful in examining relationships among
indicators and the relationships between indicators and the environmental systems that they represent; and
• Part of long-term programs with sustained funding that involve comparable analytical
methods across indicators.” The broad-scale nature of this recommendation reflects both the validity of using environmental indicators and the variety of purposes they can serve. Further, needs related to both understanding environmental systems and associated policies for applications are highlighted.

3-1
3 SUMMARY AND CONCLUSIONS A useful way to evaluate impact significance within the context of NEPA is to use environmental indicators to characterize the status of different resource areas and monitor their response to potential stresses introduced by the proposed action (i.e., the pressure-state-response framework). Indicators offer the advantage of providing a simple, easy to understand measure of the responses of inherently complex natural and socioeconomic systems. Indicators can also be used to support monitoring and mitigation activities identified in an environmental impact analysis. As described in Appendixes A and B, different agencies and organizations have focused on identifying, selecting, and using environmental indicators and indicator sets to monitor ecological health and set environmental priorities at local, regional, national, and international scales. For example, ecological indicators form the basis for the 2003 U.S. Environmental Protection Agency (EPA) Draft Report on the Environment (EPA, 2003) and are being reevaluated and revised to update the report in 2007 (EPA, 2006). Depending on the overall resource area of concern, time scales for the application of environmental indicators have typically ranged from months to decades. In general, these efforts and other applications of environmental indicators have centered on ecological systems; indicators are much less well developed to address impacts to cultural and socioeconomic resources. Applications to these types of resources tend to be more site specific, and more general approaches are more difficult. Although the details of the processes used in the different initiatives vary, most have used a systematic process that relies on the judgment of a panel of one or more subject matter experts (e.g., the EPA Monitoring and Assessment Program) to develop criteria and apply them in selecting environmental indicators. Because of the potentially subjective nature of some aspects of these types of judgments, it is important that the process be transparent. Development of environmental indicators as part of a NEPA analysis to evaluate potential environmental impacts should be carefully documented, with a traceable rationale for identifying, screening, and selecting the indicators used. There is a significant amount of scientific and policy information to support indicator use, both in general ecological analysis and environmental impact assessments related to NEPA compliance. The National Research Council, EPA, and the U.S. Government Accountability Office in particular have supported using indicators to evaluate the status of the ecosystems in the United States, and to evaluate and monitor the ecological performance of these systems. The Federal court system has supported the concept of indicator usage for NEPA compliance and has stressed the importance of careful documentation to meet procedural requirements. An understanding of the types of indicators that are appropriate to characterize an affected environment and to evaluate the potential impacts of a proposed action will help NRC and CNWRA staffs conduct or review NEPA assessments. Several questions should be considered to develop this understanding: • Are the indicators appropriate to the proposed action and the resource of interest? For
example, the indicators should be sensitive to potential impacts and representative of changes in affected environmental features. If possible, the indicators should be directly (linearly) proportional to the anticipated impacts. If not, there should be a conceptual model that can characterize the indicator responses.

3-2
• Are the indicators clear and understandable to stakeholders and members of the public? Educating the audience, raising awareness, and communicating complex issues were identified by respondents to a U.S. Government Accountability Office survey as three of the top purposes for developing environmental indicator sets (U.S. Government Accountability Office, 2004a, Figure 3). These responses identify the importance of having clear and understandable environmental indicator sets.
• Is the listing of indicators complete? Too many indicators may overwhelm the intended
audience and confuse decisionmakers. For relatively simple systems, one or two indicators may be adequate, while multiple indicators may need to be considered for more complex resources potentially subjected to several types of effects.
• Can the proposed indicators be measured and the information reasonably gathered?
Indicators are only useful to the extent that the information necessary to characterize them either exists or can be collected. Measurements that are not cost effective, require long times, or rely on less well-established techniques reduce the ability to identify and apply the related environmental indicators.
• Is it appropriate to use different indicators for different phases of a project (e.g., certain
indicators for construction phase impacts and others for operational phase impacts)? For projects involving multiple phases with very different time frames, it may be necessary to develop different indicators and indicator sets. For example, over very long periods of time, indicators for some areas like cultural resources, noise, and socioeconomic resources may become increasingly speculative and less useful to evaluate environmental impacts.
• Do pertinent professional societies or other agencies provide information on
recommended indicators for particular resources? Professional organizations may have established or endorsed environmental indicators or indicator sets that are broadly applicable to a given resource area (e.g., water quality). While an absolute consensus is unlikely given the normal give and take of the scientific process, these types of indicators may be appropriate to evaluate the potential impacts of a proposed action or its alternatives. This type of endorsement provides stakeholders and decisionmakers with additional confidence that there is a strong basis for selecting the environmental indicator(s).
Although the specific criteria used to identify and select indicators and indicator sets have differed among programs, addressing these questions will demonstrate the underlying commonalities that can be used as a general framework for identifying indicators appropriate to NEPA environmental impact assessments.

4-1
4 REFERENCES Boling, E.A. “Environmental Management Systems and NEPA: A Framework for Productive Harmony.” Environmental Law Reporter. Vol. 35. pp. 10,022–10,031. 2005. Canter, L.W. Environmental Impact Assessment. Second Edition. New York City, New York: McGraw-Hill, Inc. 1996. –––––. Environmental Impact Assessment. New York City, New York: McGraw-Hill, Inc. 1977. CEQ. “Modernizing NEPA Implementation.” NEPA Task Force Report. Washington, DC: CEQ. pp. 44–56. 2003. –––––. “The National Environmental Policy Act—A Study of Its Effectiveness After Twenty-five Years.” Washington, DC: CEQ. 1997a. –––––. “Considering Cumulative Effects Under the National Environmental Policy Act.” Washington, DC: CEQ. 1997b. –––––. “Incorporating Biodiversity Considerations Into Environmental Impact Analysis Under the National Environmental Policy Act.” Washington, DC: CEQ. 1993. Duque, S., R. Daniels, K. Crowder, and I. Jimenez. EPA/600/R–06/015, “Strategy for Indicator Development—Border 2012: U.S–Mexico Environmental Program.” Research Triangle Park, North Carolina: EPA, Office of Research and Development. 2006. EPA. “2007 EPA Report on the Environment.” 2006. <http://epa.gov/indicators/>. (December 11, 2006) –––––. EPA 600–R–03–050, “EPA’s Draft Report on the Environment: Technical Document.” Washington, DC: EPA, Office of Research and Development and the Office of Environmental Information. 2003. –––––. EPA/620/R–99/005, “Evaluation Guidelines for Ecological Indicators.” Research Triangle Park North Carolina: EPA, Office of Research and Development. 2000. –––––. EPA/620/R–94/022, “Environmental Monitoring and Assessment Program: Indicator Development Strategy.” M.C. Barber, ed. Research Triangle Park, North Carolina: EPA, Office of Research and Development. 1994. Goldman, L. and C.M. Coussens, eds. “Environmental Health Indicators—Bridging the Chasm of Public Health and the Environment.” Workshop Summary, Roundtable on Environmental Health Sciences, Research, and Medicine, Institute of Medicine of the National Academies. Washington, DC: National Academy Press. pp. 1–5. 2004. Inhaber, H. Environmental Indices. New York City, New York: John Wiley & Sons. 1976. National Council for Science and the Environment. “Recommendations for Improving the Scientific Basis for Environmental Decisionmaking.” First National Conference Report on Science, Policy, and the Environment. Washington, DC: National Academy of Sciences. 2000.

4-2
National Research Council. “Adaptive Management for Water Resources Project Planning.” Washington, DC: National Academies Press. 2004a. –––––. “Indicators for Waterborne Pathogens.” Washington, DC: National Academies Press. pp 1–16. 2004b. –––––. “Community and Quality of Life—Data Needs for Informed Decisionmaking.” Washington, DC: National Academies Press. pp. 1–9. 2002. –––––. “Ecological Indicators for the Nation.” Washington, DC: National Academies Press. 2000. –––––. “Ground Water Vulnerability Assessment—Contamination Potential Under Conditions of Uncertainty.” Washington, DC: National Academies Press. pp. 1–11. 1993. Norwood, J. and J. Casey, eds. “Key Transportation Indicators.” Workshop Summary, Committee on National Statistics, Division of Behavioral and Social Sciences and Education, National Research Council. Washington, DC: National Academies Press. pp. 1–5. 2002. NRC. NUREG–1748, “Environmental Review Guidance for Licensing Actions Associated with NMSS Programs.” Washington, DC: NRC. pp. 5-1 to 6-35. August 2003. Ott, W.R. “Environmental Indices—Theory and Practice.” Ann Arbor, Michigan: Ann Arbor Science Publishers, Inc. 1978. U.S. Government Accountability Office. “Environmental Indicators—Better Coordination is Needed to Develop Environmental Indicator Sets that Inform Decisions.” GAO–05–52. Washington, DC: U.S. Government Accountability Office. pp. 1–53. 2004a. –––––. “Informing Our Nation—Improving How to Understand and Assess the USA’s Position and Progress.” GAO–05–1. Washington, DC: U.S. Government Accountability Office. pp. 1–71. 2004b.

APPENDIX A

A–1
A PROCESS FOR DEVELOPMENT OF INDICATORS If indicators are to be used to evaluate environmental impact significance, a systematic and documented process should be established. Some challenges associated with developing and using indicator data sets in environmental management illustrate the importance of an indicator development process; they include (U.S. Government Accountability Office, 2004a, pp. 5–7) (i) ensuring that a sound process is used to develop the indicator sets, (ii) obtaining sufficient environmental data to report conditions and trends related to the indicators selected, (iii) coordinating and integrating various related indicator sets to develop a more comprehensive understanding of the environment, and (iv) linking specific environmental management actions and program activities to changes in environmental conditions and trends. Independent evaluation of environmental impact indicators for a given proposed action would benefit from an understanding of the processes used by previous studies to develop indicator sets. A.1 Indicator Development—General To illustrate an overall process, two examples will be used. First, a recent United Nations Environment Programme publication has identified a 12-step generic indicator development process, as shown in Table A–1 (United Nations Environment Programme, 2006, p. 18). A second example (Table A–2) is related to nine recommended design features to develop an overall comprehensive indicator system at any level (U.S. Government Accountability Office, 2004b).
Table A–1. Steps in a Generic Indicator Development Process* Step Description
1 Identify themes and issues related to the overarching vision and goal 2 Propose an initial set of candidate indicators 3 Select an analytical framework that links goals to indicators 4 Develop a list of criteria for indicator selection 5 Evaluate indicators according to criteria 6 Define a core set and/or a suite of indicator sets for different users 7 Identify data sources and data gaps 8 Gather data and populate the indicators; standardize measurement wherever possible 9 Compare indicator values to targets, thresholds, and policy goals, as appropriate
10 Disseminate results 11 Assess strengths and weaknesses of indicator set 12 Continue development of superior indicators
*United Nations Environment Programme. “Environmental Indicators for North America.” Nairobi, Kenya: United Nations Environment Programme. p. 18. 2006.

A–2
Table A–2. Recommended Design Features for Overall Comprehensive Indicator System*
Design Feature Description
1 Establish a clear purpose and define target audiences and their needs
2 Ensure independence and accountability
3 Create a broad-based governing structure and actively involve stakeholders
4 Secure stable and diversified funding sources
5 Design effective development and implementation processes
6 Identify and obtain needed indicators or data
7 Attract and retain staff with appropriate skills
8 Implement marketing and communications strategies for target audiences
9 Acquire and leverage information technologies
*U.S. Government Accountability Office. “Informing Our Nation—Improving How to Understand and Assess the USA’s Position and Progress.” GAO–05–1. Washington, DC: U.S. Government Accountability Office. pp. 1–71. 2004.
Three key features of both development processes are the identification of the purpose(s) for indicator usage, the use of an analytical framework (or conceptual model) for an initial identification of candidate indicators, and the recognition that multiple users and stakeholders should be involved in the development process itself. To illustrate these features, in a review of the performance of indicator systems developed by several states in the eastern United States, McElfish and Varnell (2006) noted that three institutional issues potentially affect the usefulness of indicators. First, the selected indicators must be relevant to an identified management purpose(s) [the indicators must be chosen based on the management purpose(s) to be accomplished]. Second, indicator data should be matched to the geographical scale associated with anticipated decisions. Finally, consideration needs to be given to required continuing or new monitoring of the indicators, data analysis and interpretation, and how the information should be provided to the anticipated decisionmakers. Environmental indicator data sets can be used for one or more purposes or to achieve one or more objectives. Examples of purposes (objectives) include (U.S. Government Accountability Office, 2004a, p. 16) • Assess conditions and trends, • Educate various stakeholder groups, • Raise public and decisionmaker awareness, • Communicate information on complex issues, • Track progress toward management goals, • Prioritize environmental issues, • Address identified data gaps, • Identify research needs,

A–3
• Evaluate project, plan, or program performance, and • Develop strategic plans. In some cases, indicator data sets can also be used to comply with legislative mandates. As stated by Cairns, et al. (1993, p. 6) “…basically, everything is an indicator of something but nothing is an indicator of everything.” Accordingly, consideration needs to be given to the use of different indicators for accomplishing different purposes. For example, although some generic indicators might be used for several purposes, in general, unique indicator sets are called for when collecting data to assess the site-specific adequacy of the environment, monitor trends over time, provide early warning of unanticipated impacts or environmental degradation, or diagnose the cause of an existing problem. Regarding monitoring program indicators, three types of indicators have been proposed: compliance indicators, diagnostic indicators, and early warning indicators (Cairns, et al., 1993, pp. 6–8). Compliance indicators are those chosen to judge the attainment and maintenance of management objectives (goals) for environmental quality, natural resources sustainability, and social acceptability (quality of life). Diagnostic indicators are those used to identify causal factors related to environmental degradation and nonattainment of management objectives. Causal factors could be related to the adverse environmental consequences of projects, plans, programs, and/or policies. Further, diagnostic indicators can be used to develop mitigation measures or management responses to preclude further degradation or worsening of nonattainment conditions. Finally, early warning indicators could be a subset of compliance indicators or be based on more frequent usage of all compliance and diagnostic indicators. These indicators should focus on warning signs that could then be addressed with a preventive maintenance strategy. If ecological indicators are used, then an evaluation of existing monitoring programs that might incorporate the indicators should be made. Conversely, it may be necessary to plan an indicator monitoring program; the program might be integrated within an existing program, or it could be implemented as an independent effort. A review of the literature on connecting ecological monitoring with identified indicators contains useful information related to planning an integrated or independent monitoring program (Griffith, 1998). Finally, developers of indicators and indicator sets often use one or more conceptual models to represent the developers’ understanding of how systems operate, and help integrate the different fields of science relevant to address an issue, such as ecosystem management, that cuts across environmental disciplines (U.S. Government Accountability Office, 2004a). Typically used to represent the complex relationships and feedbacks that control some resource areas at long times or large spatial scales, these types of models may range from quantitative numerical simulations to simple trend analyses. Conceptual models used to develop indicators should provide clear links that show how the system of interest responds, and be supported by transparent and traceable data. Similar to the National Environmental Policy Act (NEPA) approach identified in 40 CFR 1502.22, uncertainties that may result from natural heterogeneity or incomplete/unavailable information should be clearly identified; simplifying assumptions or bounding analyses should also be described. An underlying presumption involving evaluation criteria is that candidate indicators must be evaluated based on the criteria. To illustrate, Cloquell-Ballester, et al. (2006) have proposed a three-stage validation methodology (3S Methodology) for potential environmental indicators, which consists of self-validation, scientific validation, and social validation. Self-validation is

A–4
primarily done by the indicator development team. Input from scientific experts could be used in the second validation. Finally, stakeholder input for the third validation could be sought by the development team. McElfish and Varnell (2006) also indicated that multiple users and decisionmakers could be associated with watershed-level environmental indicators. For example, users could include local land use regulatory boards; regional planning entities (e.g., councils of government, planning districts, and metropolitan planning organizations); specialized land or water area agencies (e.g., river basin commissions, coastal zone management districts, and groundwater districts); environmental regulatory agencies (federal and state levels); soil and water conservation districts; water and sewer infrastructure agencies; transportation infrastructure agencies; fish and wildlife management agencies; purchasers and managers of conservation lands; economic development agencies; and legislators. A related issue associated with the above multiple users is that ecological and hydrological indicators may have defined geographical areas that do not necessarily correspond to jurisdictional boundaries for decisionmaking. Further, situations may be encountered where multiple decisionmakers with partial and overlapping jurisdictions can exist in a given area. Accordingly, both initial and continuing coordination will be necessary regarding the interpretation and use of environmental indicator data sets. Different approaches have been used with success by various agencies and organizations to develop environmental indicators and indicator sets. The most important aspect of the different approaches is to ensure that they are open and conducted with a sufficient scientific and technical basis. A.2 Establishing a Framework for Indicators Within the context of NEPA, impact indicators can be selected and applied to meet different requirements, making it important to establish the appropriate framework from which to identify selection criteria for potential impact indicators. As described previously, the pressure-state-response model is a convenient representation of the requirements of NEPA. In this modeling approach, indicators can generally be grouped into three classes: Pressure Indicators: These are indicators that measure the magnitude of the stressor(s) applied to the system by the proposed action (or alternatives) that are to be evaluated in the environmental impact assessment. Status Indicators: These indicators provide information about the baseline conditions of the resources that make up the affected environment. Further, they may include measures of past conditions to establish trends. Consequence Indicators: These indicators provide a measure of the potential impacts and the resultant changes to the affected environment. These types of indicators may also be used to evaluate the effectiveness of mitigation measures identified to reduce adverse impacts (or enhance beneficial impacts). As described by Segnestam (1999), the most useful indicators offer a practical and realistic way to characterize and simplify information such that both the decisionmakers and the public can clearly understand the potential impacts of a proposed action. The indicator should provide a means to evaluate both the direction and magnitude of changes to a given resource area.
A–5
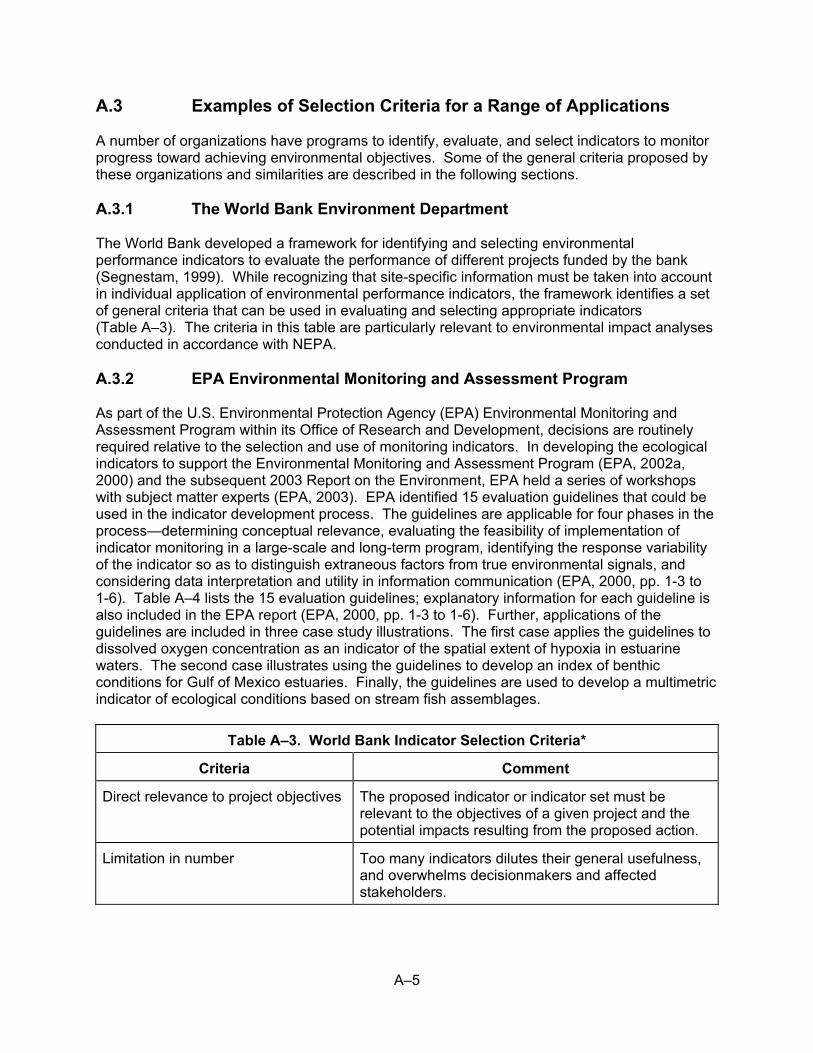
A.3 Examples of Selection Criteria for a Range of Applications A number of organizations have programs to identify, evaluate, and select indicators to monitor progress toward achieving environmental objectives. Some of the general criteria proposed by these organizations and similarities are described in the following sections. A.3.1 The World Bank Environment Department The World Bank developed a framework for identifying and selecting environmental performance indicators to evaluate the performance of different projects funded by the bank (Segnestam, 1999). While recognizing that site-specific information must be taken into account in individual application of environmental performance indicators, the framework identifies a set of general criteria that can be used in evaluating and selecting appropriate indicators (Table A–3). The criteria in this table are particularly relevant to environmental impact analyses conducted in accordance with NEPA. A.3.2 EPA Environmental Monitoring and Assessment Program As part of the U.S. Environmental Protection Agency (EPA) Environmental Monitoring and Assessment Program within its Office of Research and Development, decisions are routinely required relative to the selection and use of monitoring indicators. In developing the ecological indicators to support the Environmental Monitoring and Assessment Program (EPA, 2002a, 2000) and the subsequent 2003 Report on the Environment, EPA held a series of workshops with subject matter experts (EPA, 2003). EPA identified 15 evaluation guidelines that could be used in the indicator development process. The guidelines are applicable for four phases in the process—determining conceptual relevance, evaluating the feasibility of implementation of indicator monitoring in a large-scale and long-term program, identifying the response variability of the indicator so as to distinguish extraneous factors from true environmental signals, and considering data interpretation and utility in information communication (EPA, 2000, pp. 1-3 to 1-6). Table A–4 lists the 15 evaluation guidelines; explanatory information for each guideline is also included in the EPA report (EPA, 2000, pp. 1-3 to 1-6). Further, applications of the guidelines are included in three case study illustrations. The first case applies the guidelines to dissolved oxygen concentration as an indicator of the spatial extent of hypoxia in estuarine waters. The second case illustrates using the guidelines to develop an index of benthic conditions for Gulf of Mexico estuaries. Finally, the guidelines are used to develop a multimetric indicator of ecological conditions based on stream fish assemblages.
Table A–3. World Bank Indicator Selection Criteria*
Criteria Comment
Direct relevance to project objectives The proposed indicator or indicator set must be relevant to the objectives of a given project and the potential impacts resulting from the proposed action.
Limitation in number Too many indicators dilutes their general usefulness, and overwhelms decisionmakers and affected stakeholders.
A–6
Table A–3. World Bank Indicator Selection Criteria* (continued)
Criteria Comment
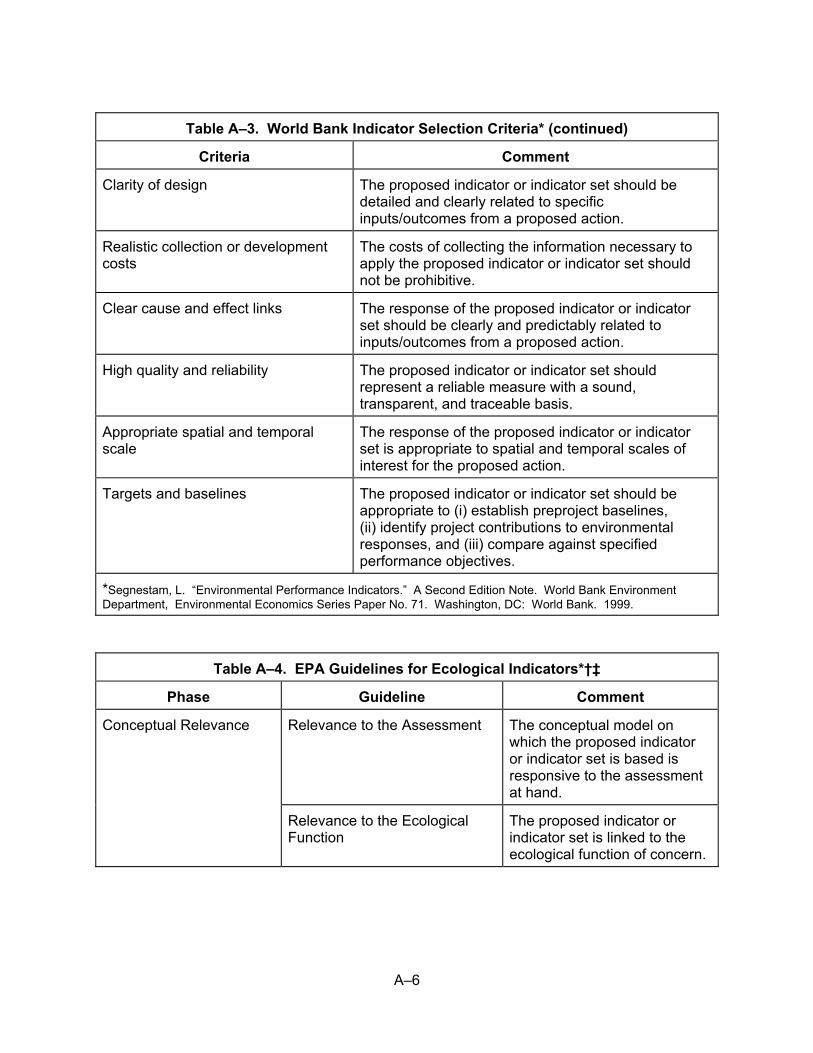
Clarity of design The proposed indicator or indicator set should be detailed and clearly related to specific inputs/outcomes from a proposed action.
Realistic collection or development costs
The costs of collecting the information necessary to apply the proposed indicator or indicator set should not be prohibitive.
Clear cause and effect links The response of the proposed indicator or indicator set should be clearly and predictably related to inputs/outcomes from a proposed action.
High quality and reliability The proposed indicator or indicator set should represent a reliable measure with a sound, transparent, and traceable basis.
Appropriate spatial and temporal scale
The response of the proposed indicator or indicator set is appropriate to spatial and temporal scales of interest for the proposed action.
Targets and baselines The proposed indicator or indicator set should be appropriate to (i) establish preproject baselines, (ii) identify project contributions to environmental responses, and (iii) compare against specified performance objectives.
*Segnestam, L. “Environmental Performance Indicators.” A Second Edition Note. World Bank Environment Department, Environmental Economics Series Paper No. 71. Washington, DC: World Bank. 1999.
Table A–4. EPA Guidelines for Ecological Indicators*†‡
Phase Guideline Comment
Relevance to the Assessment The conceptual model on which the proposed indicator or indicator set is based is responsive to the assessment at hand.
Conceptual Relevance
Relevance to the Ecological Function
The proposed indicator or indicator set is linked to the ecological function of concern.
A–7
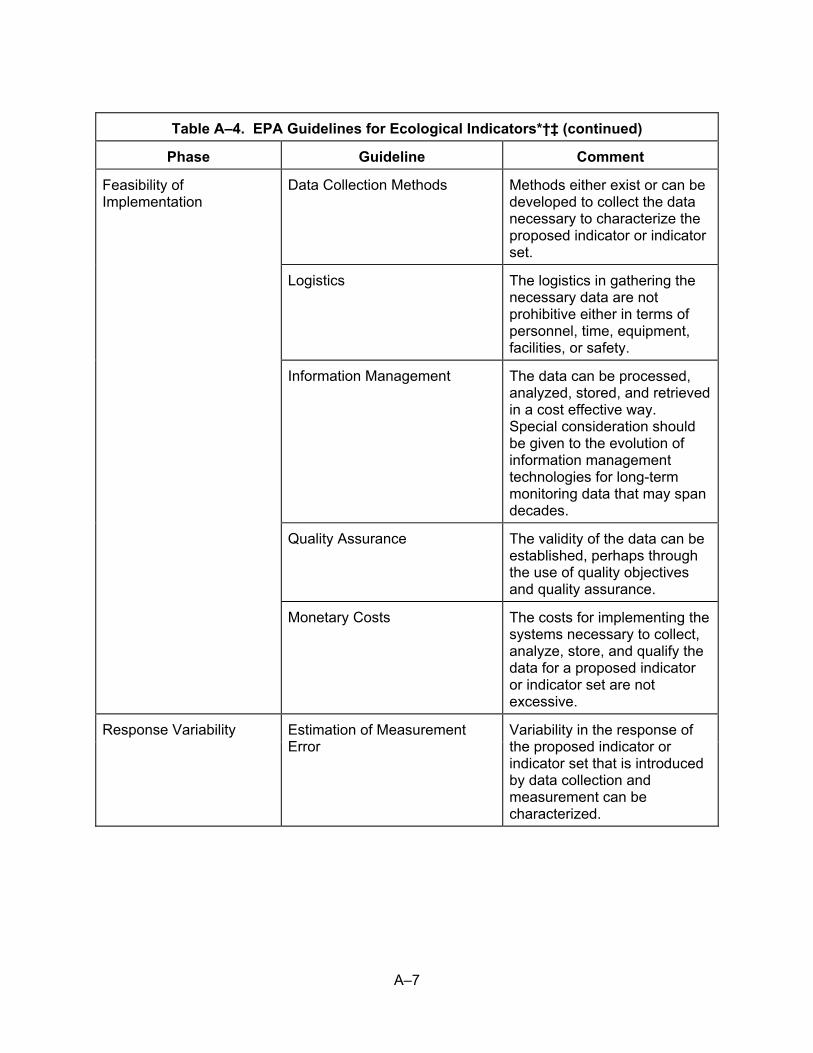
Table A–4. EPA Guidelines for Ecological Indicators*†‡ (continued)
Phase Guideline Comment
Data Collection Methods Methods either exist or can be developed to collect the data necessary to characterize the proposed indicator or indicator set.
Logistics The logistics in gathering the necessary data are not prohibitive either in terms of personnel, time, equipment, facilities, or safety.
Information Management The data can be processed, analyzed, stored, and retrieved in a cost effective way. Special consideration should be given to the evolution of information management technologies for long-term monitoring data that may span decades.
Feasibility of Implementation
Quality Assurance The validity of the data can be established, perhaps through the use of quality objectives and quality assurance.
Monetary Costs The costs for implementing the systems necessary to collect, analyze, store, and qualify the data for a proposed indicator or indicator set are not excessive.
Response Variability
Estimation of Measurement Error
Variability in the response of the proposed indicator or indicator set that is introduced by data collection and measurement can be characterized.

A–8
Table A–4. EPA Guidelines for Ecological Indicators*†‡ (continued)
Phase Guideline Comment
Temporal Variability–Within the Field Season
The response of the proposed indicator or indicator set to capture variability due to seasonal variability (weeks to months) in the resource of interest. Most applicable to ecological and biological resources.
Response Variability (continued)
Temporal Variability–Across Years
The response of the proposed indicator or indicator set is appropriate to capture longer-term variability (or stability) in the resource of interest (years to decades).
Spatial Variability The response of the proposed indicator or indicator set is appropriate to the variability across the monitoring region for the resource of interest.
Discriminatory Ability The response of the proposed indicator or indicator set, including known error components, is such that it is sensitive to differences along a “known condition gradient” (either temporal or spatial).
Interpretation and Utility Data Quality Objectives The response of the proposed indicator or indicator set can be evaluated against recognized data quality objectives, targets, or known environmental standards for a given resource area.

A–9
Table A–4. EPA Guidelines for Ecological Indicators*†‡ (continued)
Phase Guideline Comment
Assessment Thresholds This criteria is similar to significance determination for environmental impacts.
Linkage to Management Actions
The proposed indicator or indicator set provides information that is sufficient to support a management decision related to a given environmental resource or quantify the success of past decisions.
*EPA. EPA 600–R–03–050, “EPA’s Draft Report on the Environment: Technical Document.” Washington, DC: EPA, Office of Research and Development and the Office of Environmental Information. 2003. †EPA. EPA 620/R–02/002, “Research Strategy: Environmental Monitoring and Assessment Program.” Research Triangle Park, North Carolina: EPA, Office of Research and Development. 2002. ‡EPA. EPA/620/R–99/005, “Evaluation Guidelines for Ecological Indicators.” Research Triangle Park, North Carolina: EPA, Office of Research and Development. 2000.
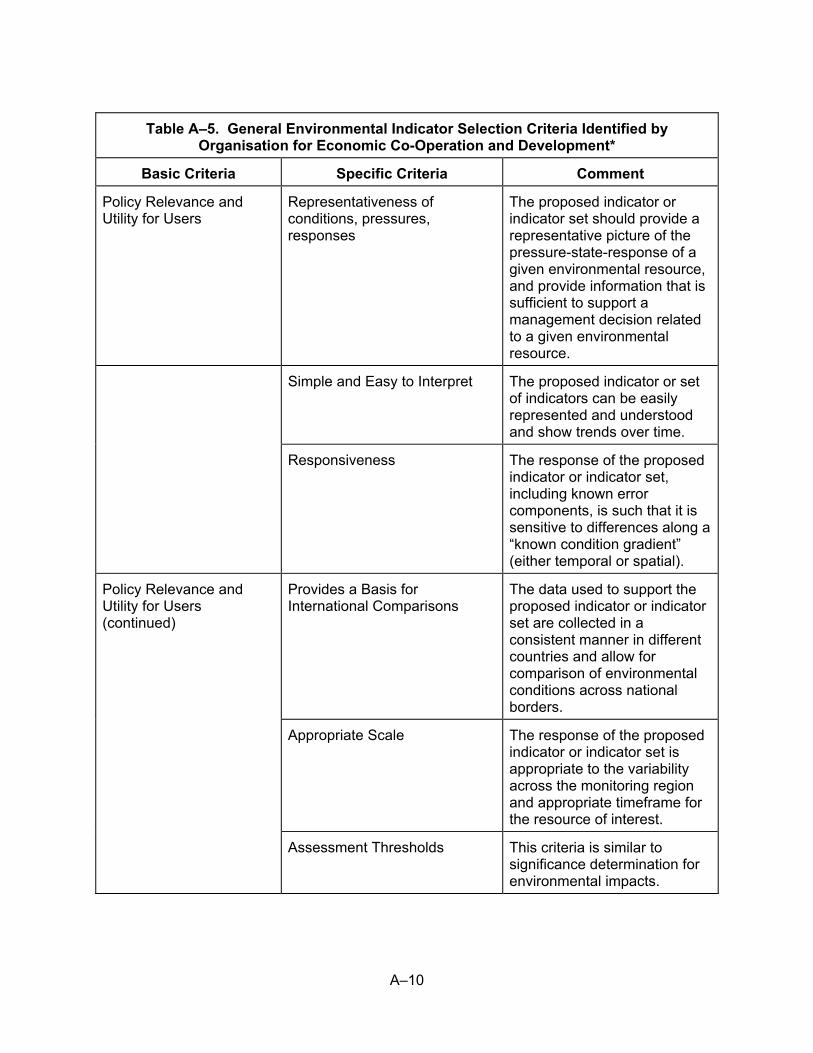
A.3.3 Organisation for Economic Co-Operation and Development Report on Environmental Indicators To support its policy analysis and evaluation work in the European Community, Organisation for Economic Co-Operation and Development established a program to focus on environmental performance indicators at national, international, and global scales (Organisation for Economic Co-Operation and Development, 2003). Local and subnational ecosystem scales were not specifically addressed, but Organisation for Economic Co-Operation and Development indicated that national governments could use the same general approaches to develop environmental indicators at these scales. General selection criteria were organized around a framework of “policy relevance and utility for users, analytical soundness, and measurability” (Organisation for Economic Co-Operation and Development, 2003, Box 2). These were further subdivided into 12 more specific criteria (Table A–5). The multinational nature of the European Community resulted in a more international focus of these criteria than other reports. A.3.4 U.S. Government Accountability Office Report on Environmental Indicators In preparing a report on the use of environmental indicators to enhance environmental resource management, the U.S. Government Accountability Office identified and polled 48 experts (with 23 responses) to identify indicator sets (U.S. Government Accountability Office, 2004a). Based on the survey results, 10 general criteria were identified for use in the selection of indicators (Table A–6).
A–10
Table A–5. General Environmental Indicator Selection Criteria Identified by Organisation for Economic Co-Operation and Development*
Basic Criteria Specific Criteria Comment
Policy Relevance and Utility for Users
Representativeness of conditions, pressures, responses
The proposed indicator or indicator set should provide a representative picture of the pressure-state-response of a given environmental resource, and provide information that is sufficient to support a management decision related to a given environmental resource.
Simple and Easy to Interpret The proposed indicator or set of indicators can be easily represented and understood and show trends over time.
Responsiveness The response of the proposed indicator or indicator set, including known error components, is such that it is sensitive to differences along a “known condition gradient” (either temporal or spatial).
Provides a Basis for International Comparisons
The data used to support the proposed indicator or indicator set are collected in a consistent manner in different countries and allow for comparison of environmental conditions across national borders.
Appropriate Scale The response of the proposed indicator or indicator set is appropriate to the variability across the monitoring region and appropriate timeframe for the resource of interest.
Policy Relevance and Utility for Users (continued)
Assessment Thresholds This criteria is similar to significance determination for environmental impacts.

A–11
Table A–5. General Environmental Indicator Selection Criteria Identified by Organisation for Economic Co-Operation and Development* (continued)
Basic Criteria Specific Criteria Comment
Analytical Soundness Theoretically Well Supported The proposed indicator or indicator set is based on well-established scientific and technical principles and has been broadly accepted by the scientific community.
Based on International Standards and Consensus
The response of the proposed indicator or indicator set can be evaluated against recognized data quality objectives, targets, or known environmental standards for a given resource area.
Capable of Being Linked to Models and Information Systems
The data can be collected, processed, analyzed, stored, and retrieved in a cost effective way to support environmental models and international data systems.
Measurability Availability The logistics in gathering the necessary data are not prohibitive either in terms of personnel, time, equipment, facilities, or safety. The costs for implementing the systems necessary to collect, analyze, store, and qualify the data for a proposed indicator or indicator set are not excessive.
Measurability (continued) Adequately Documented and High Quality
The validity, transparency, and traceability of the data that support the proposed indicator or indicator set can be established, perhaps through the use of quality objectives and quality assurance.

A–12
Table A–5. General Environmental Indicator Selection Criteria Identified by Organisation for Economic Co-Operation and Development* (continued)
Basic Criteria Specific Criteria Comment
Current and Updated The data necessary to support the proposed indicator or indicator set can be collected in a timely manner, can be readily updated at regular intervals using reliable, well-established procedures, and are coherent over time.
*Organisation for Economic Co-Operation and Development. “OECD Environmental Indicators: Development, Measurement, and Use.” Paris, France: OECD Environment Directorate, Environmental Performance and Information Division. 2003.
Table A–6. Environmental Performance Indicator Selection Criteria Identified by Survey Respondents*
Criteria Comment
Measurable The proposed indicator or indicator set is measurable and sufficient to report environmental conditions and trends.
Relevant The conceptual model on which the proposed indicator or indicator set is based is responsive to the assessment at hand.
Appropriate Geographic Scale
The response of the proposed indicator or indicator set is appropriate to spatial scales of interest for the proposed action.
Understandable The proposed indicator or set of indicators can be easily represented and understood.
Data Available Sufficient data to support the use of the proposed indicator or indicator set to establish conditions and trends are either available or readily obtainable.
Data Quality The validity, transparency, and traceability of the data that support the proposed indicator can be established, perhaps through the use of quality objectives and quality assurance.
Importance The proposed indicator or indicator set is focused on the most important parameters that control the response of a given environmental resource. The proposed indicator or indicator set should be detailed and clearly related to specific inputs/outcomes from a proposed action.
Appropriate Temporal Scale The response of the proposed indicator or indicator set is appropriate to temporal scales of interest for the proposed action.

A–13
Table A–6. Environmental Performance Indicator Selection Criteria Identified by Survey Respondents* (continued)
Criteria Comment
Data Comparability The data used to support the proposed indicator or indicator set are collected in a consistent manner and allow for comparison of environmental conditions and responses. The data can be processed, analyzed, stored, and retrieved in a cost-effective way. Special consideration should be given to the evolution of information management technologies for long-term monitoring data that may span decades.
Trend Data Available The response of the proposed indicator or indicator set is appropriate to capture temporal variability (or stability) in the resource of interest. The data necessary to support the proposed indicator or indicator set can be collected in a timely manner, can be readily updated at regular intervals using reliable, well-established procedures, and are coherent over time.
*U.S. Government Accountability Office. “Environmental Indicators—Better Coordination is Needed to Develop Environmental Indicator Sets that Inform Decisions.” GAO–05–52. Washington, DC: U.S. Government Accountability Office. pp. 1–53. 2004.
The U.S. Government Accountability Office report also concludes by noting that ecological indicators have a relatively long and well-established history, but socioeconomic and cultural indicators are much less developed. A.3.5 United Nations Environment Programme A recent United Nations Environment Programme publication identified eight criteria for consideration in selecting indicators; they are listed in Table A–7 (United Nations Environment Programme, 2006, p. 21). A.4 Traceability of Criteria Used to Identify, Develop, and Use Indicators The identification of appropriate criteria and the selection of environmental impact indicators is an evolving area of research. It is anticipated that rapid developments in our understanding of different environmental systems and site-specific issues are likely to have data gaps and uncertainties. NEPA-implementing regulations provide for these types of gaps in information (40 CFR 1502.22). In those cases where it is difficult to explicitly address unavailable information because of limitations such as time and budget constraints, the interpretations and subjective judgments of technical experts (i.e., expert elicitation) can be used to complement and supplement more objective sources of scientific and technical information such as field investigations, analyses, and experimentation to decide which indicator selection criteria are most appropriate to a given resource area. For example, several agencies have relied on questionnaires and surveys of subject matter experts to identify environmental indicators (EPA, 2003; U.S. Government Accountability Office, 2004a).

A–14
Table A–7. Criteria for Selecting Environmental Indicators*
Criteria Comment
Significant/Salient: Will anyone care?
The proposed indicator or indicator set will provide relevant information responding to concerns about change in important ecological and biogeochemical processes and environmental change that affects wide areas and the health and well-being of people and natural resources. The proposed indicator(s) will convey information broader than the parameters measured and help to maintain a focus on this message.
Clear and Easy to Interpret: Will people understand them?
The proposed indicator or indicator set should be limited in number and presented in a clear, straightforward, and appealing manner. The proposed indicator(s) are simple and intuitive to interpret, while maintaining an appropriate level of detail and scientific accuracy.
Policy Relevant: Will they lead to action?
The proposed indicator or indicator set measures progress against policy goals by comparing indicator values to targets. The proposed indicator(s) are part of an iterative and adaptive policy and management cycle, answering pertinent questions, and provoking policy debate and action. They are also flexible, so new information can lead to adjustments in goals, frameworks, and indicators.
Reliable/Credible: Are they scientifically valid?
The proposed indicator or indicator set is measurable and analytically valid and is based on currently sound and internationally accepted theoretical, conceptual, technical, and scientific standards and principles. Data collection is based on statistical integrity; data are from reliable sources on a recurring basis, and are clearly defined, verifiable, and robust to changes in measurement technology; and the indicator(s) allow for consistent interpretation and valid analyses and conclusions.
Neutral and Legitimate: Can they be trusted?
The proposed indicator or indicator set is politically legitimate, with unbiased and transparent selection, analysis, and presentation.
Comparable: Are they compatible with other sets of indicators?
The proposed indicator or indicator set is standardized wherever possible to allow for comparison, especially at the national level of reporting. This may require consensus related to international commitments and targets.
Cost-Effective: Are they affordable?
The proposed indicator or indicator set is limited in number, uses existing or readily available data whenever possible, and is simple to monitor. Explicit links to policy are included to ensure efficient monitoring and data collection (which are expensive). Financial, human, and technical capacities are available to develop and use the indicators.

A–15
Table A–7. Criteria for Selecting Environmental Indicators* (continued)
Criteria Comment
Participatory: Were they selected and developed in a transparent manner?
The proposed indicator or indicator set is developed with the participation of a broad range of stakeholders, including decisionmakers and others in the management cycle. This process should ensure the indicators or indicator sets are tied to policy goals and monitoring programs, as well as include representatives from nongovernmental organizations, professionals, the private sector, and other members of the public to ensure they encompass community visions and values and to promote ownership.
*United Nations Environment Programme. “Environmental Indicators for North America.” Nairobi, Kenya: United Nations Environment Programme. 2006.
These types of elicitation can be conducted either formally or informally, but documentation of the process used should be as objective, complete, and transparent as possible (40 CFR 1502.24). Formal procedures (e.g., NRC, 1996) can help to ensure that the expert elicitations are well documented and the technical reasoning used to reach the necessary decisions is open and traceable. The elicitation process can involve experts outside a given program to lead to fresh insights and identification of alternative technical interpretations. Evaluation of these newly identified interpretations may expose technical limitations and possibly quantify information gaps and uncertainties. The use of a more formal type of elicitation process may also may help groups of experts recognize potential bias and resolve differences by providing a common scale of measurement and a common vocabulary for expressing their judgments (NRC, 1996). A.5 Considerations in Using Environmental Impact Indicators Informed decisions need to be based on the best available information. Natural, cultural, and socioeconomic systems are inherently complex. For this reason, they are not perfectly understood, and there are frequently gaps in the knowledge and data that inform our conceptual models of how these systems operate. At the same time, decisionmakers and affected stakeholders need to be provided with understandable measures of the likely impacts for a given proposed action and reasonable alternatives under consideration. Indicators are one potentially effective means of consolidating information to provide a concise representation of the interactions between pressures, states, and responses that may affect environmental resources. Although impact indicators can be either qualitative or quantitative, they can potentially oversimplify the behavior of a system of interest. For this reason, they should not be developed as a “black box” and used as a substitute for appropriate technical, cultural, and socioeconomic studies. Instead, they should be used in concert with more detailed studies, and the process used to identify and select indicators should be transparent and traceable. A.6 References Cairns, Jr., J.; P.V. McCormick; and B.R. Niederlehner. “A Proposed Framework for Developing Indicators of Ecosystem Health.” Hydrobiologia. Vol. 263. pp. 1–44. 1993.

A–16
Cloquell-Ballester, V., V. Cloquell-Ballester, R. Monterde-Diaz, and M.C. Santamarina-Siurana. “Indicators Validation for the Improvement of Environmental and Social Impact Quantitative Assessment.” Environmental Impact Assessment Review. Vol. 26. pp. 79–105. 2006. EPA. EPA 600–R–03–050, “EPA’s Draft Report on the Environment: Technical Document.” Washington, DC: EPA, Office of Research and Development and the Office of Environmental Information. 2003. –––––. EPA 620/R–02/002, “Research Strategy: Environmental Monitoring and Assessment Program.” Research Triangle Park, North Carolina: EPA, Office of Research and Development. 2002a. –––––. EPA/620/R–99/005, “Evaluation Guidelines for Ecological Indicators.” Research Triangle Park North Carolina: EPA, Office of Research and Development. 2000. Griffith, J.A. “Connecting Ecological Monitoring and Ecological Indicators: A Review of the Literature.” Journal of Environmental Systems. Vol. 26, No. 4. pp. 325–363. 1998. McElfish, Jr., J.M. and L.M. Varnell. “Designing Environmental Indicator Systems for Public Decisions.” Columbia Journal of Environmental Law. Vol. 31, No. 1. pp. 45–86. 2006. NRC. NUREG–1563, “Branch Technical Position on the Use of Expert Elicitation in the High-Level Radioactive Waste Program.” Washington, DC: NRC. November 1996. Organisation for Economic Co-Operation and Development. “OECD Environmental Indicators: Development, Measurement, and Use.” Paris, France: OECD Environment Directorate, Environmental Performance and Information Division. 2003. Segnestam, L. “Environmental Performance Indicators.” A Second Edition Note. World Bank Environment Department, Environmental Economics Series Paper No. 71. Washington, DC: World Bank. 1999. United Nations Environment Programme. “Environmental Indicators for North America.” Nairobi, Kenya: United Nations Environment Programme. 2006. U.S. Government Accountability Office. “Environmental Indicators—Better Coordination is Needed to Develop Environmental Indicator Sets that Inform Decisions.” GAO–05–52. Washington, DC: U.S. Government Accountability Office. pp. 1–53. 2004a. –––––. “Informing Our Nation—Improving How to Understand and Assess the USA’s Position and Progress.” GAO–05–1. Washington, DC: U.S. Government Accountability Office. pp. 1–71. 2004b.

APPENDIX B

B–1
B CASE STUDIES B.1 Introduction—Supplementing an Environmental Impact Statement A draft or final environmental impact statement (EIS) can be supplemented if the agency makes substantial changes to the proposed action or if there are new circumstances or engineering that may result in significant changes in the evaluation of impacts [40 CFR 1502.9(c)] (DOE, 2005). The Council on Environmental Quality (CEQ) recommends examining the need to supplement EISs that are more than five years old if the proposed action has not been implemented or if the EIS is related to an ongoing program (CEQ, 1981, Question 32). Environmental impact indicators represent one way to evaluate the significance of potential impacts that may result from new information or changed circumstances. The U.S. Nuclear Regulatory Commission (NRC) has prepared a generic EIS [NRC, 1996 (NUREG–1437)] for assessing the potential significance of common environmental impacts in a site-specific supplemental EIS for nuclear power plant license renewals. NUREG–1437 examines more than 90 potential impacts using three levels of significance that considered both context and intensity (NRC, 1999): • SMALL: Anticipated environmental effects are not detectable or are so minor that they
will neither destabilize nor noticeably alter any important attribute of the resource. For purposes of assessing radiological impacts, the Commission has concluded that those impacts that do not exceed permissible levels in the Commission’s regulations are considered small.
• MODERATE: Anticipated environmental effects are sufficient to alter noticeably, but not
to destabilize important attributes of the resource. • LARGE: Anticipated environmental effects are clearly noticeable and are sufficient to
destabilize important attributes of the resource. The results of the analyses in NUREG–1437 (NRC, 1996) have been codified in Appendix B to Subpart A of 10 CFR Part 51 and are incorporated in NUREG-1748 (NRC, 2003). A number of sources may be considered in evaluating new and potentially significant information to determine whether an EIS needs to be supplemented. For example, environmental reports and monitoring results may have become available since the original NEPA analysis was prepared. Related scientific and technical literature may point to developments that are relevant to the proposed action. Changes in environmental regulations or permitting requirements, such as the listing (or delisting) of endangered species, may lead to a reassessment of environmental consequences. Finally, ongoing consultations with stakeholders and federal, state, and local agencies may identify new issues of concern that should be evaluated by supplementing the existing NEPA analysis. A supplemental EIS provides a summary of the evaluation of the potential impacts associated with changes to the proposed action and/or new information relative to the previously estimated environmental impacts. Similar to a draft or final EIS, the supplemental EIS is intended to serve as an analytical document to provide decisionmakers and affected stakeholders with an objective evaluation of the significance of potential impacts. The supplemental EIS differs in

B–2
that it should focus on evaluating the potential impacts that may result based on new information or changed circumstances (CEQ, 1993, 1981). To the extent that the previous NEPA analysis is still valid, it can be incorporated by reference (e.g., Federal Highway Administration, 1987). Environmental indicators or indicator sets can be used to evaluate the potential significance of new information presented in a supplemental EIS. Well-designed indicators can provide a way to quantify changes in the estimated impacts in a way that is accessible to the technical community, stakeholders, and decisionmakers. Sections B.2 and B.3 provide examples of a broad range of types of indicators used in environmental management of individual resources (Section B.2) and larger scale ecosystems (Section B.3). B.2 Examples of Types of Indicators B.2.1 Water Availability A directive from the U.S. Congress requested the U.S. Geological Survey respond to “prepare a report describing the scope and magnitude of the efforts needed to provide periodic assessments of the status and trends in the availability and use of freshwater resources” (U.S. Geological Survey, 2002, p. iii). The centerpiece of the resultant report was a proposal that 10 national indicators be used to evaluate freshwater supplies and water quality (listed in Table B–1) (U.S. Geological Survey, 2002, p. 6). B.2.2 Analysis of Watersheds In 1997, EPA published an index of watershed indicators could be used in national comparisons of watershed conditions and vulnerability (EPA, 2002). Watersheds are defined in accordance with the U.S. Geological Survey’s “eight-digit scale” associated with their Hydrologic Unit Classification System. As summarized in Table B–2, the index comprises seven condition indicators and eight vulnerability indicators. Flow charts delineating information sources and requisite analyses for the indicators are included in Version 1.3 of the index (EPA, 2002). B.2.3 Water Quality In 1996, EPA delineated 5 national water quality objectives and 18 indicators that could be used to measure progress toward attaining these objectives (EPA, 1996). These objectives and national indicators are in Table B–3. Inferred from these indicators is the need to compare their temporal trends. Several federal agencies, Native American tribes, and nongovernmental organizations participated with EPA in establishing the 18 indicators. B.2.4 Landscape Indicators for Aquatic Impacts Traditional approaches for predicting or evaluating the impacts of projects, plans, and programs on riverine systems have included the use of chemical and biotic indicators and indices; instream flow methods that integrate flows, water quality, and habitat information with aquatic ecological measures; and physical habitat measures based on hydrogeomorphic features. A common theme of these traditional approaches is their specific focus on the aquatic environment.

B–3
Table B–1. Proposed National Indicators for Water Availability*
Water Resource Indicators Indicator
Streamflow: annual and periodic (5- to 10-year) summaries; assessments of long-term trends Reservoir storage, construction, sedimentation, and removal
Surface Water
Storage in large lakes, perennial snowfields, and glaciers Groundwater-level indices for a range of hydrogeologic environments and land-use settings Changes in groundwater storage due to withdrawals, saltwater intrusion, mine dewatering, and land drainage
Groundwater
Number and capacity of supply wells and artificial recharge facilities Total withdrawals by source (surface water and groundwater) and sector (public supply, domestic, commercial, irrigation, livestock, industrial, mining, thermoelectric power, and hydropower) Reclaimed wastewater Conveyance losses
Water Use
Consumptive uses *U.S. Geological Survey. “Concepts for National Assessment of Water Availability and Use.” Report to Congress, U.S. Geological Survey Circular 1223. Reston, Virginia: U.S. Geological Survey. 2002.
Table B–2. Index of Watershed Indicators*
Class Indicator
Condition Indicators Assessed Rivers Meeting All Designated Uses Established by State or Tribal Water Quality Standards: Information reported by tribes and states on the percentage of waters within the watershed that meet all uses established for those waters as reported in biennial reports to EPA under the Clean Water Act Section 305(b).
Fish and Wildlife Consumption Advisories: Recommendations by tribes or states to restrict consumption of locally harvested fish or game due to the presence of contaminants (information source—National Listing of Fish and Wildlife Consumption Advisories).

B–4
Table B–2. Index of Watershed Indicators* (continued)
Class Indicator
Indicators of Source Water Quality for Drinking Water Systems: Three data sets are combined to provide a partial picture of the condition of rivers, lakes/reservoirs, and groundwaters used by public drinking water systems: (i) state’s assessment of surface waters meeting water supply designated use [Clean Water Act Section (305(b)], (ii) water system treatment and violation data appropriate to use as surrogates of source water condition [Safe Drinking Water Information System (SDWIS)], and (iii) occurrence at significant levels in source water of chemicals regulated under the Safe Drinking Water Act [Storage and Retrieval of Water Quality Data (STORET)].
Contaminated Sediments: The level of potential risk to human health and the environment from sediment chemical analysis, sediment toxicity data, and fish tissue residue data (National Sediment Inventory).
Ambient Water Quality Data—Four Toxic Pollutants: Ambient water quality data showing percent exceedences of national criteria levels, for copper, chromium (hexavalent), nickel, and zinc (STORET) over a 6-year period.
Ambient Water Quality Data—Four Conventional Pollutants: Ambient water quality data showing percent exceedences of national reference levels for ammonia, dissolved oxygen, phosphorous, and pH (STORET) over a 6-year period.
Condition Indicators (continued)
Wetland Loss Index: Percentage losses of wetlands over an historic period (1870–1980) and more recently (U.S. Fish and Wildlife Service National Wetland Inventory and Natural Resources Conservation Service National Resource Inventory).
Vulnerability Indicators
Aquatic/Wetland Species at Risk: Watersheds with high occurrences of species at risk (The Nature Conservancy/State Heritage Database).
Pollutant Loads Discharged Above Permitted Discharge Limits—Toxic Pollutants: Discharges over a 1-year period for toxic pollutants are combined and expressed as a percentage above or below the total discharges allowed under the National Pollutant Discharge Elimination System permitted amount (the EPA Permit Compliance System).
Pollutant Loads Discharged Above Permitted Discharge Limits—Conventional Pollutants: Discharges over a 1-year period for conventional pollutants are combined and expressed as a percentage above or below the total discharges allowed under the National Pollutant Discharge Elimination System permitted amount (the EPA Permit Compliance System).

B–5
Table B–2. Index of Watershed Indicators* (continued)
Class Indicator
Urban Runoff Potential: The potential for urban runoff impacts is estimated based on the percentage of impervious surface in the watershed (e.g., roads, paved parking, roofs).
Index of Agricultural Runoff Potential: A composite index comprised of (i) a nitrogen runoff potential index, (ii) modeled sediment delivery to rivers and streams, and (iii) a pesticide runoff potential index (Natural Resources Conservation Service National Resources Inventory).
Population Change: Population growth rate as a surrogate of many stress-producing activities from urbanization (U.S. Census Bureau).
Hydrologic Modification—Dams: This index shows relative reservoir impoundment volume in the watershed. The process of impounding streams changes their characteristics, and the reservoirs and lakes formed in the process can be more susceptible to pollution stress (U.S. Army Corps of Engineers).
Vulnerability Indicators (continued)
Estuarine Pollution Susceptibility Index: This measures an estuary’s susceptibility to pollution based on its physical characteristics and the propensity to concentrate pollutants (National Oceanic and Atmospheric Administration).
*EPA. “Index of Watershed Indicators: An Overview.” Washington, DC: EPA. pp. 3–5. 2002.
Table B–3. National Water Quality Objectives and Indicators*
Objective Indicator Comment
Conserve and Enhance Public Health
Population served by community drinking water systems violating health-based requirements
Population served by drinking water systems with one or more violations of health-based requirements.
Population served by unfiltered surface water systems at risk from microbiological pollution
Population served by and number of systems that have not met the requirements to filter their water to remove microbiological contaminants.
Population served by drinking water systems exceeding lead action levels
Population served by and number of systems with lead levels in drinking water exceeding the regulatory threshold.

B–6
Table B–3. National Water Quality Objectives and Indicators* (continued)
Objective Indicator Comment
Source water protection Number of community drinking water systems using groundwater that have programs to protect them from pollution.
Fish consumption advisories Percentage of rivers and lakes with fish that states have determined should not be eaten or should be eaten in only limited quantities.
Shellfish growing water classification
Percentage of estuarine and coastal shellfish-growing waters approved for harvest for human consumption.
Biological integrity Percentage of rivers and estuaries with healthy aquatic communities.
Species at risk Percentage of aquatic and wetland species currently at risk of extinction.
Conserve and Enhance Aquatic Ecosystems
Wetland acreage Rate of wetland acreage loss.
Support Uses Designated by the States and Tribes in Their Water Quality Standards
Drinking water supply designated use—Percentage of assessed water bodies that can support safe drinking water supply use, as designated by the states and tribes.
Designated uses in state and tribal water quality standards
Fish and shellfish consumption designated use—Percentage of assessed water bodies that can support fish and shellfish consumption, as designated by the states and tribes.
Recreation designated use— Percentage of assessed water bodies that can support safe recreation, as designated by the states and tribes.

B–7
Table B–3. National Water Quality Objectives and Indicators* (continued)
Objective Indicator Comment
Aquatic life designated use— percentage of assessed water bodies that can support healthy aquatic life, as designated by the states and tribes.
Conserve and Improve Ambient Conditions
Groundwater pollutants Population exposed to nitrate in drinking water. In the future, the indicator will report the presence of other chemical pollutants in groundwater.
Surface water pollutants Trends of selected pollutants found in surface water.
Selected coastal surface water pollutants in shellfish
The concentration levels of selected pollutants in oysters and mussels.
Estuarine eutrophication conditions
Trends in estuarine eutrophication conditions.
Contaminated sediments Percentage of sites with sediment contamination that might pose a risk to humans and aquatic life.
Reduce or Prevent Pollutant Loadings and Other Stressors
Selected point source loadings to (a) surface water and (b) groundwater
Trends for selected pollutants discharged from point sources into surface water and underground injection control wells that are sources of point source loadings into groundwater.
Nonpoint source loadings to surface water
Amount of soil eroded from cropland that could run into surface waters. Future reports will include additional nonpoint source surface water pollutants as well as sources of nonpoint source groundwater pollution.
Marine debris Trends and sources of debris monitored in the marine environment.
*EPA. EPA–841–R–96–002, “Environmental Indicators of Water Quality in the United States.” Washington, DC: EPA. p. iii. 1996.

B–8
To bridge the gap regarding the potential impacts of proposed developments on riverine systems, Gergel, et al. (2002) proposed using landscape indicators to complement traditional approaches. Landscape indicators derive from landscape ecology, with the latter relating to interactions between spatial patterns and ecological processes. Examples of watershed-level landscape indicators for monitoring of human impacts on various components of riverine systems include (i) amount of urban land cover and percentage of impervious surfaces, (ii) percentages of various land uses (e.g., forest, agriculture, nonforest, wetlands), (iii) average buffer width, (iv) average frequency of gaps in the buffer zone, (v) percentages of developed riparian zones, and (vi) patch width in riparian zones. Some potential advantages of using landscape indicators are that they can be linked to other chemical and biotic indicators and indices, and they directly measure human use in a watershed. Landscape indicators can be used to assess local to regional areas, and the communication of this information can be facilitated by using geographic information systems. Further, land usage information throughout the United States is typically available and readily accessible. B.2.5 Air Quality EPA has developed a human health-based index for reporting daily air quality. The index is calculated for five major regulated air pollutants—ground-level ozone, particulate matter, carbon monoxide, sulfur dioxide, and nitrogen dioxide. For each pollutant, an air quality index of 100 denotes that the ambient concentration corresponds to its national air quality standard. Categories of air quality (good, moderate, unhealthy for sensitive groups, unhealthy, very unhealthy, and hazardous) are used, as appropriate, when the index is less than 100 or greater than 100 (EPA, 2003b). Precautionary measures for reducing exposures to each of the five pollutants are specified as a function of the index values. B.2.6 Environmental Risk Screening for Toxic Chemicals Environmental indicators can be used to prioritize problems and to develop comparative risk information useful for program planning. For example, a 1990 report by the EPA Science Advisory Board recommended that the agency reorder its priorities and give as much importance to reducing ecological risk as it does to reducing human health risk (McElfish and Varnell, 2006). The use of indicators is basic to accomplishing comparative risk evaluations and establishing pertinent priorities. As an example, EPA has developed a screening tool, Risk-Screening Environmental Indicators, that can be used to compare the relative risks of toxic chemicals released to the environment from industrial sources (EPA, 2006a). The tool incorporates indicators related to chemical releases to air and water, transport characteristics of the releases, associated toxicity information, and exposure level information. B.3 Performance Indicators for Projects, Plans, and Programs B.3.1 Sustainable Forests The U.S. Forest Service recently released a 2003 national report on sustainable forests. The state-of-the-forests report utilizes 7 management criteria (subgoals) and 67 indicators as measures of national progress toward the overall goal of sustainable forest management (U.S. Forest Service, 2004, p. 1). The criteria and indicators are in consonance with a 12-country “Montreal Protocol” for national reports on sustainable forest management. The

B–9
seven criteria include conservation of biological diversity; maintenance of productive capacity of forest ecosystems; maintenance of forest ecosystem health and vitality; conservation and maintenance of soil and water resources; maintenance of forest contribution to global carbon cycle; maintenance and enhancement of long-term multiple socioeconomic benefits to meet the needs of societies; and legal, institutional, and economic framework for forest conservation and sustainable management. Each of the seven criteria have specified indicators, with the number per criterion ranging from 3 to 20. To illustrate, the conservation and maintenance of soil and water resources criterion includes eight indicators as follows (U.S. Forest Service, 2004, p. 12): • Indicator 18: Area and percent of forest land with significant soil erosion; • Indicator 19: Area and percent of forest land managed primarily for protective functions
(e.g., watersheds, flood protection, avalanche protection, riparian zones); • Indicator 20: Percent of stream kilometers in forested catchments in which stream flow
and timing have deviated significantly from the historic range of variation; • Indicator 21: Area and percent of forest land with significantly diminished soil organic
matter and/or changes in other soil chemical properties; • Indicator 22: Area and percent of forest land with significant compaction or change in soil
physical properties resulting from human activities; • Indicator 23: Percent of water bodies in forest areas (e.g., stream kilometers, lake
hectares) with significant variance of biological diversity from the historic range of variability;
• Indicator 24: Percent of water bodies in forest areas (e.g., stream kilometers, lake
hectares) with significant variance from the historic range of variability in pH, dissolved oxygen, levels of chemicals (electrical conductivity), sedimentation, or temperature change; and
• Indicator 25: Area and percent of forest land experiencing an accumulation of persistent
toxic substances. Rationale for each criterion and its importance in forest management is described in the report. Descriptive information for each specified indicator is included, along with its importance in the analysis. A synopsis of what the indicator shows (or is representing) is included, as well as its relationship to other specified indicators for the criterion. Finally, it should be noted that information from each national forest is aggregated to form the basis for the national report. Accordingly, projects with potential impacts on local national forests could use the forest-specific information in specific impact analyses. B.3.2 Social Indicators Related to Forest Management The U.S. Forest Service has recognized the importance of social science (the human dimensions) in forest planning and policy development based on ecosystem management. To

B–10
provide a human dimensions framework, the following questions could be used to identify specific social indicators for a forest planning effort (Bright, et al., 2003, p. 21): • What are the human uses of natural resources in the assessment area? • Who are users of natural resources in the assessment area? • What are the social and economic characteristics of the geographic region surrounding
the assessment area? • What conflicts exist among various uses, users, stakeholders, and managers of
the ecosystem? • What is the nature of relationships among nearby communities, the forest or other
ecosystems, and the larger encompassing ecosystem? • What are the relevant stakeholder and public perceptions related to ecosystem
management issues driving the social assessment? • What do stakeholders and the public value about the natural environment, natural
resources of that environment, and the uses of those resources? • What recent social and economic trends in the affected regions are relevant to
management of the ecosystem? Based on the above questions, five dimensions of social data that would be relevant were identified: historical background, population characteristics (cultural characteristics, population and demographics, and economic and employment characteristics), community resources (facilities and services, and spatial relationships and ecosystem dependency), social organization structures and processes (economic organization, governmental structure, social diversity, outside linkages, distribution of resources and power, and community resilience), and public perceptions and well-being (perceptions of natural resources, connection to natural resources, and perception of well-being). Specific indicators for each of the dimensions were also identified along with relevant information sources. Such sources can be divided into secondary documentary (existing) sources and primary sources (original) requiring survey research, focus groups, and group interviews, or combinations thereof. Finally, although this report was focused on social indicators for forest planning, the included concepts and structures could be used for other types of planning efforts. B.3.3 Impacts of Forest Roads Construction of timber-haul roads or recreation-related roads in virgin forest areas have often been seen as having undesirable environmental impacts. Such road projects should be considered in forest management and are often the subject of environmental impact studies. Accordingly, Heinimann (1996) proposed a risk structure and related indicators for use in impact studies related to new roads in forested areas. Table B–4 summarizes the risks, indicators, and direction of preference (minimize or maximize).

B–11
Table B–4. Indicators for Impact Studies of Forested Roads*
Element of the Environment Risk Indicator Unit†
Direction of
PreferenceLoss of productive soil Road surface m2 Minimize Erosion Slope surface m2 Minimize
Soil
Disturbance of lithosphere
Volume of earth movement
m3 Minimize
Reduction of infiltration Road surface m2 Minimize Drying up of wetlands Drainage area m2 Minimize
Water
Damaging water sources
Destruction of water source area
m2 Minimize
Habitat loss Destroyed area of valuable habitats
m2 Minimize
Habitat fragmentation Road length per influenced valuable habitat area
m/m2 Minimize
Biosphere
Disturbance of wildlife Frequency days/yr Minimize Atmosphere Indirect impacts [no indicators
considered] — Minimize
Natural Resources
Degradation of nonrenewable resources
Volume extracted m3/yr Minimize
Land use for housing, commerce, and industry
Area taken up m2 Minimize
Loss of open-space areas
Destroyed forest, farm, and reserve land
m2 Minimize
Equity Risk distribution Risk density per unit area
— Minimize

B–12
Table B–4. Indicators for Impact Studies of Forested Roads* (continued)
Element of the Environment Risk Indicator Unit†
Direction of
PreferenceLost jobs Number Minimize Employment change New jobs Number Maximize
Change of personal income
Per capita income Currency Maximize
Change of local or regional economy
Value added per capita Currency Maximize
Socioeconomic Conditions
Change of household characteristics
Number of households living in the area
Number Maximize
Occupational accidents
Number of severe accidents
Number Minimize Health and Safety
Private accidents Number of severe accidents
Number Minimize
Cultural Heritage Destruction of archaeological and historic resources
Dependent on object type
—
Minimize
Visual impacts — — Minimize Unpleasant smell — — Minimize
Aesthetics
Noise — — Minimize *Heinimann, H.R. “Opening-Up Planning Taking Into Account Environmental and Social Integrity.” Proceedings of the Seminar on Environmentally Sound Forest Roads and Wood Transport, Sinaia, Romania, June 17–22, 1996. Rome, Italy: Food and Agriculture Organization, United Nations. 1996. †To convert from m2 to ft2, multiply by 10.7639; to convert from m3 to ft3, multiply by 35.3146.
B.3.4 World Bank Programs Since the mid-1990s, the World Bank has been using environmental performance indicators for their financially supported infrastructure, environmental, and natural resources projects. In 1996, a performance monitoring indicators handbook regarding how to structure indicators within a logical framework, how to develop such indicators, and how to link them to project objectives (Dixon, et al., 1996) was issued. A followup report in 1999 included examples of indicators used in case studies related to forestry management and conservation, biodiversity conservation, agricultural developments, industrial air pollution control and pollution prevention, water pollution control and sanitation services, global environmental problems related to greenhouse gas emissions and reductions in ozone-depleting substances, and institutional capacity building (Segnestam, 1999). Further, Segnestam (2002) has also provided updated information on the World Bank’s use of indicators of the environment and sustainable development.

B–13
B.4 An Emerging Type of Indicator—Sustainability or Sustainable Development In recent years, various governmental levels have defined environmental indicators for specific management purposes. One example is the increasing attention to sustainability indicators or “sustainable development indicators.” It has been suggested that these focused efforts are an outgrowth of the international movement toward sustainable development that arose after the 1992 Earth Summit in Rio de Janeiro (McElfish and Varnell, 2006). These types of indicators are most frequently used at national or international levels; however, they can also be used for specific national or regional resources or for evaluating development plans for local communities or urban areas. For example, over the last decade, several U.S. states and cities have developed indicators for use in environmental evaluations and in determining the effectiveness of various management programs. McElfish and Varnell (2006) review several examples of state, regional, and local initiatives; two international examples and two recent scientific reference books are also summarized. The Organisation for Economic Co-Operation and Development environmental indicators program has three major purposes (Organisation for Economic Co-Operation and Development, 1998, p. 8): (i) to keep track of environmental progress; (ii) to ensure that environmental concerns are taken into account when policies are formulated and implemented for various sectors, such as transport, energy and agriculture; and (iii) to ensure similar integration of environmental concerns into economic policies, mainly through environmental accounting. The Organisation for Economic Co-Operation and Development is an international organization comprising about 30 member countries, including the United States as an original member. Three categories of national environmental indicators are used by the Organisation for Economic Co-Operation and Development—a core set of indicators for tracking environmental progress, sets of sectoral indicators for integrating environmental concerns into sectoral policies, and indicators derived from environmental accounting that are used for integrating environmental concerns into economic policies. Collectively, these three categories are regularly used in environmental performance reviews; thus they also broadly contribute to measuring progress toward sustainable development. The conceptual framework used in developing these overall sustainability indicators was based on the pressure-state-response model (see Section 1.4). In the context of sustainable development, the model considers that human activities exert pressures on the environment and affect its quality and the quantity of natural resources (state); society responds to these changes through environmental, general economic and sectoral policies and through changes in awareness and behavior (societal response). The model has the advantage of highlighting these links and helping decisionmakers and the public see environmental and other issues as interconnected (although this should not obscure the view of more complex relationships in ecosystems, and in environment–economy and environment–social interactions) (Organisation for Economic Co-Operation and Development, 1998, p.108). Specific information on the three categories of national indicators is available from the 1998 Organisation for Economic Co-Operation and Development report; an updated version of this report was issued in 2002 (Organisation for Economic Co-Operation and Development, 2002). The second international example is from a report on the use of a 21-indicator environmental sustainability index applied to 146 countries (Esty, et al., 2005). The index focused on the ability of nations to protect the environment over the next several decades. Five topical

B–14
categories encompass the 21 indicators; the categories include understanding environmental systems, reducing environmental stresses, reducing human vulnerability to environmental stresses, evaluating societal and institutional capacity to respond to environmental challenges, and participating in global stewardship. The 21 indicators relate to the topical categories as follows: (i) air quality, biodiversity, land, water quality, and water quantity are associated with environmental systems; (ii) reducing air pollution, reducing ecosystem stress, reducing population pressure, reducing waste and consumption pressures, reducing water stress, and natural resource management are associated with reducing environmental stresses; (iii) environmental health, basic human sustenance, and reducing environment-related natural disaster vulnerability are associated with reducing human vulnerability; (iv) environmental governance, eco-efficiency, private sector responsiveness, and science and technology are related to social and institutional capacity; and (v) participation in international collaborative efforts, greenhouse gas emissions, and reducing transboundary environmental pressures are measures related to global stewardship. A total of 76 variables represent specific metrics used to define the 21 indicators. A point system is used to characterize the metrics, indicators, and categories; the additive total score reflects the environmental sustainability index for each evaluated country. Finally, two recent scientific reference books highlight both the development of sustainability indicators and provide cautions relative to their usage. Bell and Morse (1999) emphasize the importance of both scientific and policy interpretations of composite scores for sets of indicators. They also note the likelihood of professional disagreements over selected indicators for particular geographic scales and anticipated time periods for their usage. Morse (2004) notes the value of using indicators for simplifying complexity; however, he also cautions that political agendas can influence the indicator selection process. B.5 Illustrations of Indicator Usage (or Potential for Usage) This section will illustrate the actual usage of indicators in several case studies. The first six illustrations are examples of actual usage, while the final three are focused on recommendations for usage in specific situations. The nine illustrations range in spatial scales from binational to national to regional to local. B.5.1 Indicators for North America In 1972, the United Nations Conference on the Human Environment urged member countries of the international community to prepare periodic state-of-the-environment reports on the “state of, and outlook for, the environment” (United Nations Environment Programme, 2006). The United Nations Environment Programme has taken the lead in coordinating various studies and information related to state-of-the-environment reports. Further, the National Indicators and Reporting Office of Environment Canada has noted that state-of-the-environment reporting and indicator development are now internationally endorsed and promoted as key components to effective environmental policy and sustainable development strategies (Bond, et al., 2005, p. 18). Chapters 2 through 5 in the recent Environmental Indicators for North America report prepared by the United Nations Environment Programme address national indicator initiatives in Canada and the United States, including bilateral initiatives (Chapter 2), international environmental indicator initiatives (Chapter 3), lessons learned from developing indicators for North America

B–15
(Chapter 4), and using indicators to track environmental trends in North America (Chapter 5) (United Nations Environment Programme, 2006). Examples of lessons identified within Chapter 4 include (United Nations Environment Programme, 2006, pp. 61–77) • There is difficulty associated with the detailed comparability of environmental standards
due to differences in definitions and methodologies. • The comparability of indicator measurements across local to regional to national scales
and across historical to near term to longer term time scales, is often limited. • There is a tendency to assume that more indicators will yield more complete results,
rather than focusing on a minimal set of indicators. • There are data limitations due to budget constraints. • There is a strong need for intergovernmental collaboration in identifying indicators and
monitoring for the selected ones. B.5.2 EPA 2003 National Report on the Environment In November 2001, EPA launched an Environmental Indicators Initiative. The Initiative seeks to develop better indicators that can be used to measure and track the national state-of-the-environment and support improved decisionmaking (EPA, 2003a, p. i). Challenges associated with the initiative include developing better data to support better indicators, making indicators more understandable and useable, and more fully describing the linkages between environmental pollution and stressors and changes in indicator measurements. An early result of the initiative was the Draft Report on the Environment 2003 (EPA, 2003a). The draft report provided summary information on the status of the nation’s air environment (outdoor air quality, indoor air quality, and global issues such as the stratospheric ozone layer); water quality (waters and watersheds, drinking water, recreation in and on the water, and consumption of fish and shellfish); land resources (land use, chemicals in the landscape, and waste and contaminated lands); human health as related to exposure to environmental contaminants by multiple age groups; and ecological conditions as reflected by chemical and physical disruptions and changes in ecological processes resulting from societal projects and activities. Multiple types of indicators are used in the 2003 draft report. In fact, a “hierarchy” of six levels of measures was described as follows (EPA, 2003a, p. viii): • Levels 1 and 2 include indicators of administrative response. Level 1 includes
measures related to EPA/state/tribal/or other governments’ regulations and activities. Level 2 is focused on measures of actions or responses by regulated and nonregulated parties.
• Levels 3–6 include indicators of environmental change. Level 3 indicators relate to
changes in environmental pressures or stressor quantities; (e.g., increases in nutrient loadings in river systems and increases in toxic air pollutant emissions). Levels 4, 5, and 6 are related to measuring the state of the resource. Level 4 highlights changes in ambient conditions, such as total phosphorus in lakes or estuaries. Level 5 is focused
B–16
on human or animal exposures to various chemical stressors and their resultant body burdens or uptake. Finally, Level 6 reflects ultimate impacts associated with changes in human health or ecological conditions.
An important feature of the 2003 draft report was the included information on limitations of indicators for air, water, and land and the challenges associated with developing human health indicators and ecological condition indicators. Examples of limitations include (EPA, 2003a, pp. 1-13, 2-21, and 3-22) (i) for air, the need for a nationwide monitoring network for air toxics and the need for measures to compare actual and predicted human health and ecological effects related to exposure to air pollutants; (ii) for water, wide variations in monitoring program designs and procedures by different governmental agencies, dependence upon voluntary self-reporting for many measures, for example (e.g., community water system violations, fish consumption advisories, and beach closings due to bacterial water quality concerns); and (iii) for land, gaps in information about land use and cover, absence of pesticide use reporting and pesticide monitoring data, and noncomprehensive historical data on waste applications to land. Challenges related to the development of human health indicators include (EPA, 2003a, p. 4-20) (i) major knowledge gaps in linking environmental pollution to health problems; (ii) addressing additive, synergistic, and antagonistic cumulative effects from multiple pollutants; (iii) limitations on data availability via disease registries; and (iv) the need to better link environmental monitoring data with national-level disease data. Challenges associated with ecological condition indicators include (EPA, 2003a, pp. 5-18 and 5-19) (i) adequate data for determining ecological trends exist for only a few indicators and (ii) the need to tie indicator selection to conceptual models that capture how ecosystems respond to single and multiple stressors at various scales. Finally, as a follow-up to the 2003 draft report, EPA has announced that a 2007 Report on the Environment will be released, along with a supporting technical document (EPA, 2006b). B.5.3 Indicators for the United States–Mexico Border Border 2012 is a binational (United States–Mexico) environmental program managed by EPA and the Mexico Secretariat of Environment and Natural Resources. The mission of the program is to protect the environment and public health in the border region, consistent with the principles of sustainable development (Duque, et al., 2006). A Border Indicators Task Force has been established to develop and implement the usage of both environmental indicators and performance indicators. These indicators will be used to track trends, monitor program progress, and plan next actions. The multistakeholder goals of the Border 2012 program encompass aspects of minimizing air, water, and land contamination; promoting environmental health; reducing chemical exposure via accidental release and terrorism (emergency preparedness and response); and promoting cooperative compliance, enforcement, and environmental stewardship. In the Border 2012 program, environmental indicators will be used to communicate information regarding the border region environmental and health conditions. They will aid in measuring progress toward meeting outlined goals and objectives. Performance indicators will be used to communicate information regarding environmental management activities and targeted response measures. They will also aid in measuring progress toward meeting outlined goals and objectives.

B–17
Selection of both environmental and performance indicators will be based on three tiers of criteria. Core criteria (Tier 1) are of equal importance and should be met by all program indicators. All these indicators should be representative, have policy relevance, exhibit scientific validity and methodological rigor, be sensitive to change, and facilitate public understanding and acceptance. Tier 2 criteria are focused on data availability; they include information availability and information compatibility. Media-specific criteria (Tier 3) include, but are not limited to, consideration of appropriate spatial and temporal scales and feasibility/cost of implementation. Periodic reviews of all indicators are planned within the Border 2012 program. Such reviews are proposed two years after an indicator is first implemented. The review process should develop indicator-specific answers to the following questions (Duque, et al., 2006, p. 11): • Purpose—Why was the indicator developed? • Data collection and management—What protocol was followed? • Data reliability—Is the source reliable? • Quality assurance—How accurate and precise are the data? • Information—What does the indicator convey? Is it true to its purpose? How does the
information compare to the standard? • Limitations—What are the outstanding gaps or limitations of the indicator? • Conclusion—Are the data useful? Should the indicator continue to be used? B.5.4 Watershed Analysis with a Fish Assemblage A regional index of fish assemblage biotic integrity has been proposed for usage in the Occoquan River watershed in northern Virginia (Teels and Danielson, 2001). Further, the index of fish assemblage biotic integrity could be used for other watersheds in northern Virginia and, with appropriate regional and local adjustments, could be used elsewhere in the United States. A key feature of the proposed index of fish assemblage biotic integrity is that it relates land use and stream habitat information into a human disturbance gradient. Fish community data are then summarized into attributes, and attribute performance across the human disturbance gradient is evaluated. The best performing attributes are then aggregated into a fish assemblage index of fish assemblage biotic integrity. The index of fish assemblage biotic integrity scores can be used to evaluate stream zones with minimal to maximum historical human disturbances, and they can also be used in a predictive mode related to the potential impacts of land use changes resulting from proposed projects. Identified indicators were used to develop human disturbance gradients and fish community attributes based on specified metrics and scores. Based upon this case study, it can be concluded that the index of fish assemblage biotic integrity integrates both impact-related information and environmental resource information. Accordingly, it could be a useful model for the NEPA process. B.5.5 Management Indicator Species for a National Forest The U.S. Forest Service recently prepared an environmental assessment to address the environmental consequences of a proposal to change the list of management indicator species (flora and fauna) in the Klamath National Forest Land and Resource Management Plan

B–18
(U.S. Forest Service, 2006). The 1995 approved plan included six individual indicator species and six multispecies assemblages. The current overall list included 32 species; however, some of the species are not responsive to changes in habitat at a measurable level, and others have limited monitoring protocols or are expensive to monitor. Accordingly, proposed changes from the 1995 list were addressed in the environmental assessment. B.5.6 Cumulative Effects on the Sonoran Pronghorn In addition to fulfilling NEPA requirements, indicators have also been used to meet the analysis requirements of the Endangered Species Act. In some cases, EISs will need to address the impacts of proposed projects, plans, and programs on listed species. To accomplish this, indicators for the species may need to be used for appropriate analyses. This case study illustrates the use of species-specific listing criteria and scientific information to identify pertinent indicators and to then use the indicators to describe the affected environment and assess direct, indirect, and cumulative effects. This case study arose as a result of remand from a court case. In February 2001, the U.S. District Court for the District of Columbia ruled that the Yuma Training Range Complex Final EIS prepared by the U.S. Marine Corps in 1997, failed to adequately address the cumulative impacts of range activities on the endangered Sonoran pronghorn located on the Yuma Training Range Complex in southern Arizona. To remedy this deficiency, the court remanded to the U.S. Marine Corps that portion of the Yuma Training Range Complex final EIS that addressed cumulative impacts on the Sonoran pronghorn. In accordance with the court order, the U.S. Marine Corps/Navy prepared a Supplemental EIS (U.S. Department of the Navy, 2001) reconsidering the cumulative impacts of the proposed actions and alternatives, together with other relevant past, present, and reasonably foreseeable future actions, on the Sonoran pronghorn. Nine screening criteria, which also reflect indicators for the Sonoran pronghorn population, were identified based upon the listing criteria for the species, related scientific research studies, and an existing recovery plan. The nine criteria were (U.S. Department of the Navy, 2001, pp. 2-6 and 2-7): • Habitat loss or curtailment, including barriers or impediments to movement or access to
habitat; • Habitat modification or diminished quality of habitat, including habitat fragmentation and
degraded air quality; • Overutilization (e.g., hunting and research activities) of Sonoran pronghorn; • Disease and predation, including the potential of increasing predator populations or
opportunities for predators to prey on Sonoran pronghorn; • Management or regulatory conflicts; • Death or injury of Sonoran pronghorn, including potential death or injury from collisions
with vehicles and munitions delivery or detonations; • Harassment of Sonoran pronghorn, including surface vehicles, human presence,
surface noise sources, overflight noise and visual presence of aircraft;
B–19
• Diminished fawn recruitment; and • Exposure to toxic substances or materials, including toxins found in forage plants or
surface water and exposure to harmful radio frequency energy. The screening criteria were then used to identify which U.S. Marine Corps actions would affect the pronghorn habitat and/or population. The criteria were also used to identify other past, present, and reasonably foreseeable future actions that have or would contribute to cumulative effects on the species. The criteria were then used to provide a species focus to the description of the affected environment. Finally, they were used to develop interaction matrices to display cumulative effects on individual indicators. A final composite matrix for all nine criteria (indicators) was then developed and used to identify U.S. Marine Corps’ responsibilities for mitigation, as well as needed collaborative mitigation efforts from multiple contributors to the cumulative effects problem. B.5.7 Restoration Indicators for the Great Lakes Basin The Great Lakes Basin, including Lakes Superior, Michigan, Erie, Huron, and Ontario, serves as a principal source of drinking water, recreation, and economic livelihood for millions of people. The basin itself encompasses nearly all of the state of Michigan and parts of Illinois, Indiana, Minnesota, New York, Ohio, Pennsylvania, Wisconsin, and the Canadian province of Ontario. Currently, this large basin is plagued by water quality deterioration due to various land uses, with such deterioration also manifested on aquatic ecological resources. In 2003, there were 48 U.S. federal and 51 state programs funding a wide variety of environmental restoration activities in the basin (U.S. General Accounting Office, 2003, p. 4). Because of the numerous restoration activities, limited overall funding, and the absence of an overarching plan for coordination and evaluation, it has not been possible to measure progress toward broad restoration goals. To address this large-scale concern, the General Accounting Office conducted an independent review of the situation and developed several recommendations for Congressional consideration. One recommendation related to the development of environmental indicators and a related monitoring program. This specific recommendation was (U.S. General Accounting Office, 2003, p. 9):
“To fulfill the need for a monitoring system called for in the Great Lakes Water Quality Agreement and to ensure that the limited funds available are optimally spent, the U.S. General Accounting Office recommends that the EPA administrator, in coordination with Canadian officials and as part of an overarching Great Lakes strategy (i) develop environmental indicators and a monitoring system for the Great Lakes Basin that can be used to measure overall restoration progress and (ii) require that these indicators be used to evaluate, prioritize, and make funding decisions on the merits of alternative restoration projects.”
The status of this recommendation is not known at this time; however, the recommendation itself illustrates an increasing interest in using indicators in various environmental management activities. B.5.8 Landscape Metrics for Coastal Wetlands in the Great Lakes Basin The EPA recently proposed using landscape metrics to develop indicators of coastal wetlands conditions in the Great Lakes Basin (Lopez, et al., 2006). Examples of such metrics include the

B–20
areal extent and distribution of coastal wetlands, the proximity of other land cover and land use types to coastal wetlands, the ecological vulnerability of coastal wetlands, and related water quality metrics. Discussions of information sources for these metrics and their relationship to coastal wetlands are included, along with information on using geographic information systems as an analysis tool. Further research and development on landscape metrics is underway. B.5.9 Landscape Indicators for Salmonids The use of landscape indicators based on the principles of landscape ecology and their coupling with stream network information has been advocated for assessing and responding to the decline of native salmonids in the northwestern United States (Bauer and Ralph, 2001). B.6 Information Sources Related to Ecological Indicators As the development and use of ecological indicators increases, greater attention is being given to sources of information for planning various uses or assembling available data. Four examples of information sources will be briefly mentioned. The first two relate to environmental data from monitoring programs. The third example highlights the contents of an ecological indicators handbook. The final example identifies four peer-reviewed journals that routinely include papers illustrating scientific or policy concerns or specific case studies involving the use of ecological (environmental) indicators. The first example is from a recent Government Accountability Office report, which summarized environmental data collected in 20 governmental programs (U.S. Government Accountability Office, 2005). The specific focus of the report was on data collection that has or could support the use of ecological indicators. The 20 reviewed programs included 6 from the Department of Agriculture, 6 from the Department of the Interior (5 from the Geological Survey and one from the U.S. Fish and Wildlife Service), 4 from the Department of Commerce, 2 from EPA, and 1 each from the National Aeronautics and Space Administration, and the Centers for Disease Control and Prevention (Department of Health and Human Services). However, it should be noted that the data from these existing programs may not necessarily meet all data requirements for ecological indicators at various spatial scales. The second example denotes an Environment Canada website, which includes information on a dynamic set of priority environmental indicators for which the agency maintains monitoring programs (Environment Canada, 2006). The website address is <http://ecoinfo.org/ env_ind/indicators_e.cfm>. The third example illustrates the growing body of knowledge on the use of ecological indicators for a variety of purposes related to environmental management. Specifically, a recent handbook by Jorgensen, et al. (2005) classifies indicators in the following eight levels of increasing complexity: (i) presence/absence of specific species; (ii) the ratio between different classes of organisms; (iii) concentrations of specific chemical compounds such as polychlorinated biphenyls; (iv) trophic levels (e.g., producers, primary consumers, secondary consumers such as phytoplankton, plankton-eating fish, and fish-eating carnivores) in an aquatic ecosystem; (v) process rates such as annual growth/mortality rates of particular species; (vi) composite indicators such as respiration/biomass and respiration/production; (vii) holistic indicators such as resistance, resilience, biodiversity, and connectivity of an ecological network; and (viii) thermodynamic indicators such as entropy production (also referred to as super-holistic indicators).

B–21
Individual chapters on 15 case studies are included which consider use of indicators from the different levels in a range of ecosystem types (such as coastal, estuary, lake, marine, agro-environment) and at a range of different scales (such as landscape and regional). Familiarity with this handbook would be valuable for impact assessment professionals considering the use of indicators for describing the affected environment; predicting the potential environmental consequences of proposed projects, plans, or programs; and the conduction of follow-on impact study activities such as adaptive management and monitoring. Several peer-reviewed professional journals include papers related to the general subject of ecological (environmental) indicators and to applications associated with environmental impact studies. Examples of such journals include: • Ecological Indicators—Integrating Sciences for Monitoring, Assessment, and
Management (published by Elsevier, commencing in 2001): • Environmental Impact Assessment Review (published by Elsevier Science,
commencing in the mid-1980s): • Impact Assessment and Project Appraisal (Journal of the International Association for
Impact Assessment, commenced publication under an earlier name—Impact Assessment—in the mid-1980s): and
• Environmental Practice (Journal of the National Association of Environmental
Professionals, commenced publication under an earlier name—The Environmental Professional—in 1978).
B.7 References Bauer, S.B. and S.C. Ralph. “Strengthening the Use of Aquatic Habitat Indicators in Clean Water Act Programs.” Journal of Fisheries. Vol. 26, No. 6. pp. 14–25. 2001. Bell, S. and S. Morse. Sustainability Indicators—Measuring the Immeasurable? London, England: Earthscan Publications, Ltd. pp. 3–32. 1999. Bond, W., D. O’Farrell, G. Ironside, B. Buckland, and R. Smith. “Current Status, Trends, and Perceptions Regarding Environmental Indicators and State of the Environment Reporting in Canada.” Background Paper to an Environmental Indicators and State of the Environment Reporting Strategy, 2004–2009. Gatineau, Quebec: Environment Canada. 2005. Bright, A.D., H.K. Cordell, A.P. Hoover, and M.A. Tarrant. “A Human Dimensions Framework: Guidelines for Conducting Social Assessments.” General Technical Report SRS–65. Asheville, North Carolina: U.S. Forest Service, Southern Research Station. June 2003. CEQ. “Incorporating Biodiversity Considerations Into Environmental Impact Analysis Under the National Environmental Policy Act.” Washington, DC: CEQ. 1993. –––––. “Forty Most Asked Questions Concerning CEQ’s NEPA Regulations.” Federal Register. Vol. 46. p. 18026. 1981.

B–22
Dixon, J., A. Kunte, and S. Pagiola. “Performance Monitoring Indicators Handbook.” Technical Paper No. 334. Washington, DC: World Bank. 1996. DOE. ”Recommendations for the Supplement Analysis Process.” Washington, DC: DOE, Office of NEPA Policy and Compliance. July 2005. Duque, S., R. Daniels, K. Crowder, and I. Jimenez. EPA/600/R–06/015, “Strategy for Indicator Development—Border 2012: U.S–Mexico Environmental Program.” Research Triangle Park, North Carolina: EPA, Office of Research and Development. 2006. Environment Canada. “Environmental Indicators.” 2006. <http://ecoinfo.org/env_ind/ indicators_e.cfm>. (December 12, 2006). EPA. “Risk-Screening Environmental Indicators.” 2006a. <http://www.epa.gov/opptintr/rsei/>. (December 11, 2006). –––––. “2007 EPA Report on the Environment.” 2006b. <http://epa.gov/indicators/>. (December 11, 2006). –––––. EPA 600–R–03–050, “EPA’s Draft Report on the Environment: Technical Document.” Washington, DC: EPA, Office of Research and Development and the Office of Environmental Information. 2003a. –––––. EPA–454/K–03–002, “Air Quality Index—A Guide to Air Quality and Your Health.” Washington, DC: EPA. 2003b. –––––. “Index of Watershed Indicators: An Overview.” Washington, DC: EPA. 2002. –––––. EPA–841–R–96–002, “Environmental Indicators of Water Quality in the United States.” Washington, DC: EPA. 1996. Esty, D., M. Levy, T. Srebotnjak, and A. de Sherbinen. “2005 Environmental Sustainability Index; Benchmarking National Environmental Stewardship.” New Haven, Connecticut: Yale Center for Environmental Law and Policy. 2005. Federal Highway Administration. “Technical Advisory Guidance For Preparing And Processing Environmental And Section 4(F) Documents.” T 6640.8A. Washington, DC: Federal Highway Administration. October 1987. <http://www.section4f.com/pdf_files/tech_advis.pdf> (September 18, 2007). Gergel, S.E., M.G. Turner, J.R. Miller, J.M. Melack, and E.H. Stanley. “Landscape Indicators of Human Impacts to Riverine Systems.” Journal of Aquatic Sciences. Vol. 64. pp. 118–128. 2002. Heinimann, H.R. “Opening-Up Planning Taking Into Account Environmental and Social Integrity.” Proceedings of the Seminar on Environmentally Sound Forest Roads and Wood Transport, Sinaia, Romania, June 17–22, 1996. Rome, Italy: Food and Agriculture Organization, United Nations. 1996.

B–23
Jorgensen, S.E., R. Constanza, and F.L. Xu. Handbook of Ecological Indicators for Assessment of Ecosystem Health. Basingstroke, United Kingdom: Taylor and Francis Group. 2005. Lopez, R.D., D.T. Heggem, D. Sutton, T. Ehli, R. Van Remortel, E. Evanson, and L. Bice. EPA/600/X–06/002, “Using Landscape Metrics to Develop Indicators of Great Lakes Coastal Wetland Condition.” Washington, DC: EPA. 2006. McElfish, Jr., J.M. and L.M. Varnell. “Designing Environmental Indicator Systems for Public Decisions.” Columbia Journal of Environmental Law. Vol. 31, No. 1. pp. 45–86. 2006. Morse, S. “Indices and Indicators in Development—An Unhealthy Obsession with Numbers?” London, England: Earthscan. pp. 1–5. 2004. NRC. NUREG–1748, “Environmental Review Guidance for Licensing Actions Associated with NMSS Programs.” Washington, DC: NRC. pp. 5-1 to 6-35. August 2003. –––––. NUREG–1555, “Standard Review Plan for Environmental Reviews for Nuclear Power Plants.” Washington, DC: NRC. 1999. <http://www.nrc.gov/reading-rm/doc-collections/nuregs/staff/sr1555/>. (January 12, 2007). –––––. NUREG–1437, “Generic Environmental Impact Statement for License Renewal of Nuclear Plants.” Washington, DC: NRC. 1996. <(http://www.nrc.gov/reading-rm/doc-collections/nuregs/staff/sr1437/>. (January 9, 2007). Organisation for Economic Co-Operation and Development. “OECD Environmental Indicators—Towards Sustainable Development 2001.” Paris, France: Organisation for Economic Co-Operation and Development. p. 133. 2002. –––––. “Towards Sustainable Development —Environmental Indicators.” Paris, France: Organisation for Economic Co-Operation and Development. pp. 3–10 and 105–114. 1998. Segnestam, L. “Indicators of Environment and Sustainable Development.” Environmental Economics Series Paper No. 89. Washington, DC: World Bank, Environment Department. 2002. –––––. “Environmental Performance Indicators.” A Second Edition Note. World Bank Environment Department, Environmental Economics Series Paper No. 71. Washington, DC: World Bank. 1999. Teels, B.M. and T.J. Danielson. “Using a Regional Index of Biotic Integrity (IBI) to Characterize the Condition of Northern Virginia Streams, with Emphasis on the Occoquan Watershed: A Case Study.” Technical Note 190-13-1. Laurel, Maryland: U.S. Department of Agriculture, Natural Resources Conservation Service. 2001. United Nations Environment Programme. “Environmental Indicators for North America.” Nairobi, Kenya: United Nations Environment Programme. 2006. U.S. Department of the Navy, Marine Corps Air Station Yuma. “Supplemental Environmental Impact Statement Yuma Training Range Complex.” San Diego, California: Naval Facilities Engineering Command. 2001.

B–24
U.S. Forest Service. “Klamath National Forest Management Indicator Species Environmental Assessment.” 2006. <http://www.fs.fed.us/r5/klamath/projects/projects/mis/index.shtml>. (December 11, 2006). –––––. “National Report on Sustainable Forests—2003.” FS–766. Washington, DC: U.S. Forest Service. 2004. U.S. Geological Survey. “Concepts for National Assessment of Water Availability and Use.” Report to Congress, U.S. Geological Survey Circular 1223. Reston, Virginia: U.S. Geological Survey. 2002. U.S. Government Accountability Office. “Environmental Information—Status of Federal Data Programs That Support Ecological Indicators.” GAO–05–376. Washington, DC: U.S. Government Accountability Office. pp. 1–11. 2005. U.S. General Accounting Office. “Great Lakes—An Overall Strategy and Indicators for Measuring Progress Are Needed to Better Achieve Restoration Goals.” GAO–03–515. Washington, DC: U.S. General Accounting Office. pp. 1–21. 2003.