the u.s. software industry as an engine for economic ... · the u.s. software industry as an engine...
TRANSCRIPT
The U.S. Software IndustryAs an Engine for Economic Growth and Employment
Robert J. Shapiro
September 2014

1
The U.S. Software Industry As an Engine for Economic Growth and Employment
Robert J. Shapiro1
Executive Summary
ver the last 20 years, software has become an essential input for the operations of virtually allbusinesses, across all industries and sectors. As a result, the software industry has haddisproportionate, positive effects on American output, productivity, exports and jobs.
· From 1997 to 2012, software industry production grew from $149 billion to $425 billion;and since this growth outpaced the rest of the economy, the software industry’s directshare of U.S. GDP increased from 1.7 percent to 2.6 percent, or more than 50 percent.
· The use of software also has increased the productivity of other industries, therebycontributing to the growth of their production. Analysis shows that software accountedfor 12.1 percent of all U.S. labor productivity gains from 1995 to 2004 and 15.4 percentof those gains from 2004 to 2012.
· On this basis, we calculate that software accounted for 9.5 percent of all gains in U.S.output from 1995 to 2004, and 15.0 percent of those gains from 2004 to 2012. In 2012,therefore, software and the productivity gains it provides accounted for $101 billion inproduction by other industries.
· All told, the software industry in 2012 contributed $526 billion to GDP -- $425 billion +$101 billion – or 3.2 percent of GDP.
· About 12 percent of U.S. software production is exported, totaling some $50 billion to$57 billion in 2012. Moreover, exports of software and related services have grown by 9percent to 10 percent per-year since 2006, nearly 50 percent faster than all U.S. exports.
· From 1990 to 2012, business investments in software grew at more than twice the rate ofall fixed business investments; and from 2010 to 2012, software accounted for 12.2percent of all fixed investment, compared to 3.5 percent for computers and peripherals.
· Direct employment in the software industry increased from 778,000 jobs in 1990 and1,083,000 jobs in 1995, to 2,095,000 in 2010 and 2,501,000 in 2014. Since software-industry jobs grew faster than other jobs, the industry’s share of all employment rosefrom 0.9% in 1990 and 1.1 % in 1995, to 1.9 % in 2010 and 2.2 % in 2014.
1 The author gratefully acknowledges Doug Dowson of Sonecon, LLC, for his excellent research and analysis, andthe Software and Information Industry Association for its support for our research. The views and conclusions aresolely those of the author.

2
· In addition, software companies purchased $212 billion in goods from other industries in2012, and those purchases supported another 1,080,000 jobs in those industries. All told,therefore, the software industry was responsible for 3.42 million jobs in 2012. Using thesame “employment multiplier,” we estimate that software industry production is directlyresponsible for 3.65 million U.S. jobs in 2014.
· Like other forms of business investment, software in some instances displaces existingjobs – for example, ATM software has displaced some bank teller positions. But the useof software also creates jobs to maintain and operate its systems; and the additionalwealth created by the productivity improvements tied to software also leads to more jobcreation, to produce the goods and services purchased with the additional wealth.
· On balance, there is no correlation between industries that invest most heavily in softwareand net employment losses.
· The software industry has continued to create new jobs at healthy rates throughout thecurrent, difficult business cycle: From 2007 to 2014, as overall private-sectoremployment has declined at an average annual rate of 0.1 percent, software industryemployment grew on average by 3.1 percent per-year.
· Five industries created large numbers of new jobs in this period – in addition to software,home health care, individual and family services, retail and restaurants. The newsoftware workers, however, are paid, on average $86,457, or three times as much asworkers in the other four industries.
I. Introduction
Innovation is a touchstone of the current American economy, exemplified by the rapiddiffusion of successive new generations of information and communication technologies (ICT).For the past generation, these industries have played a disproportionate role in U.S. businessinvestment, personal consumption, and the growth rates of productivity and GDP. This studywill analyze and assess the economic role and significance of software, which provides theoperating systems and applications for ICT, in these larger developments.
Dr. William Raduchel, a Harvard professor and later executive at Sun Microsystems,Xerox and AOL Time Warner, describes software as “the core of most modern organizations,most products and most services.”2 This characterization is supported by the steadily growingdemand for software, defined here as computer systems design and related services, softwarepublishing, and data processing, hosting, and information services. The total value of thesoftware industry’s product increased, for example, from 1.7 percent of GDP in 1997 to 2.6percent in 2012, at which time the software sector directly contributed about $425 billion to U.S.GDP. Over the same period, as we will see, employment in the software industry increased evenmore, from 1.4 million to 2.3 million positions; and these workers on average now earn nearlythree times as much as the average for all other private-sector American workers.
2 Raduchel (2006).
3
The rapid growth of demand for software reflects its character as a genuine “generalpurpose” or enabling technology that has been adopted and adapted by virtually every otherindustry and sector. For more than twenty years – from 1990 to 2012 – business investments insoftware have increased at more than twice the rate of all fixed business investment. Since themid-to-late 1990s, economists have tried to analyze and assess the impact of these software andother ICT investments. Two early studies, for example, found that the use of all forms of ICT byother industries contributed about one-sixth of annual GDP growth from 1990 to 1995/96.3Estimates of ICT’s impact on U.S. productivity in the later-1990s are even larger: Studies tracedhalf or more of U.S. productivity growth in those years to ICT.4 Analysis of the most recentperiod has found similarly large effects, with 41 percent of productivity gains over the years2004 to 2012 attributed to ICT investments.5
This study is part of this line of analyses in assessing the direct and indirect economicbenefits of these technologies, focused here on the software industry rather than the overall ICTsector. To assess the software industry’s general economic impact, we use the Input-Outputtables of the Bureau of Economic Analysis (BEA) to track both the direct value created by theindustry in any year and the flows of goods and services between the software industry and otherindustries. In 2012, for example, the software industry purchased $212 billion in goods andservices from other industries and, in this way, indirectly supported that level of demand acrossthe economy in addition to satisfying business and consumer demand for software. This analysishighlights both the industries on which the software industry depends and the industries thatdepend on software. For example, the industries that sell the most products and services tosoftware providers include professional, scientific and technical services, real estate and rentaland licensing, and manufacturing. And the industries that consume the most software and relatedservices include, in addition to the information industry, finance and insurance, professional,scientific and technical services, and the management of companies and enterprises.
In addition, this study assesses how software affects the operations of other industries bytracking and estimating the share and value of the output of other industries that can be attributedto productivity gains produced by their use of new software. Recent research by economists atthe Federal Reserve Board has traced about 15 percent of U.S. labor productivity growth from2004 to 2012 to the use of software, an increase from the 12 percent share estimated for theperiod from 1995 to 2004.6 By applying this analysis to the growth of nonfarm business outputover these periods, we estimate that software accounted for about 9.5 percent of gains in outputbetween 1995 and 2004 and about 15 percent of that output growth for the years from 2004 and2012. On this basis, we estimate that $101 billion in output in 2012 can be attributed to the useof software and related services by other industries.
All told, therefore, the software industry and its related services were responsible,directly or indirectly, for $526 billion of U.S. GDP in 2012 ($425 billion + $101 billion), or 3.2percent of GDP in that year.
3 Jorgenson and Stiroh (1999); Oliner and Sichel (2000).4 Corrado et al. (2006); Basu et al. (2004).5 Byrne et al. (2013).6 Ibid.

4
This study also assesses the common view and concerns that the spread of ICT and theincreased use of software impair job gains in the United States. These concerns do not involvedirect employment by the software industry, which has increased steadily: From 2002 to 2014,software-related jobs increased from 1.8 million to 2.5 million positions, accounting for 12percent of all net U.S. private sector job gains over those years. Since the software industrydirectly accounts for 2.6 percent of GDP, employment in the industry grew at more than sixtimes (6.3) the rate of the rest of the economy. Instead, concerns about the impact of software onemployment focus on how the use of software has affected employment in other industries.Most business investments in software and ICT generally do involve, unavoidably, some“substitution of capital for labor.” The use of word processing may displace secretarialpositions, as the use of sophisticated engineering software can reduce the need for juniorengineers. In fact, most business investments displace existing jobs to some degree, and thiseffect is often larger when the investments involve disruptive technologies.
That is only half of the story, however, because the same dynamics are associated withnew job creation as well. To begin, all capital investments involve employing people to design,produce, promote and transport the new equipment that others invest in. In addition, whencapital investments are directed to disruptive technologies such as software or the Internet,businesses often also undertake changes in their organizations and ways of doing business, sothey can take better advantage of the new technologies. Many of these changes involve thecreation of new positions, as well as the destruction of obsolete ones. Furthermore, once inplace, most business technologies have to be serviced and maintained as well as operated, taskswhich all require employment. The interplay of the job creation and job losses that accompaniesmost business investment is one of the reasons why the American economy manifests so much“job churn.”7
Most business investments, including those in software, are intended to increase a firm’sproductivity; and the productivity gains associated with the efficient and effective use ofsoftware also create jobs by generating additional wealth and income. Whether these benefits gomainly to workers in higher wages or mainly to shareholders in larger dividends and capitalgains, the macroeconomic result is the same: The additional income and wealth produceadditional demand for goods and services, which in turn leads to additional employment toproduce them.
The heart of many current concerns about the impact of software on jobs involves theextent to which the diffusion of software and IT across the economy imposes wrenching costs onworkers whose skills better matched the needs of pre-IT-based businesses. Many such workershave seen their jobs disappear and found that the new positions available to them pay less, fromretail and administrative workers displaced by automatic systems to taxi drivers forced out bysoftware-enabled competition from Uber and Lyft. Any disruptive development, including thespread of a disruptive technology, will leave some people worse off, and sometimes, a large
7 In 1997, for example, when U.S. employment increased by more than 2.8 million jobs, it involved the creation ofsome 18.5 million new positions and the destruction of some 15.7 million existing positions. More generally, theCensus Bureau reports that from 2000 to 2009, gross job creation averaged 15.8 million positions per-year and grossjob destruction averaged 14.9 million per-year, for annual job gains averaging some 900,000 net new jobs. See Kane(2000) and Haltiwqanger et al. (2001).
5
number of people bear significant costs. The early, disruptive stages of modern globalization inthe late-1970s and 1980s, for example, eliminated millions of manufacturing jobs as new foreigncompetition drove U.S. manufacturers to substitute a great deal of capital for a great deal oflabor. Manufacturing productivity went up, and the economy created large numbers of new jobsin other areas; but many former manufacturing workers never found new positions that paid aswell. A similar dynamic is certainly part of the diffusion of software and IT, and it justifies newprograms to give many more American workers easy access to training for an IT-basedeconomy. However, unlike the disruptive shock from foreign competition in manufacturing, thistransition also involves the creation of many highly-paid new jobs within the software industry,many well-paid new jobs in the industries that support software, and many more new jobsassociated with the productivity gains produced by other industries adopting and applying newsoftware.
Economists cannot directly measure all of these effects with precision, as the NationalResearch Council has noted, “[b]ecause of a lack of a good economic model of software.”8
Nevertheless, we find no evidence that on balance, software destroys jobs. Rather, the datastrongly suggest that software is a significant source of expanded employment. To begin, thedata clearly show that the software industry itself has been a significant source of new jobs.From 2000 to 2013, while total private-sector employment grew at an average annual rate of lessthan 0.4 percent per-year, software-related employment increased by 1.8 percent annually, fromless than 2 million in 2000 to 2.5 million positions today. In addition, we found that every 10jobs in the software industry support another five jobs in other industries that provide inputs forthe software industry. This “employment multiplier” is higher for the software industry than formost sectors, including financial services, construction, transportation, agriculture, health care,retail, education, and accommodations and food services. This tells us that the 2.5 million jobsin the software industry directly support another 1.2 million jobs in other industries.
There remains the more difficult issue of measuring the indirect impact of software onemployment in other industries. To begin, we will show that there is no correlation betweenbusiness purchases of software by industry and net job losses; in fact, there is a modest linkbetween those purchases and job gains by industry. Businesses purchase software, because itseffective use can make businesses more productive. Economists have measured the impact ofsoftware on productivity and found that from 2004 to 2012, software was responsible for morethan 15 percent of productivity gains over that period. Let us consider the combined impact ofthese dynamics in 2012. In that year, direct employment in the software sector grew by 128,000positions. In addition, demand by software companies for goods and services produced by otherindustries increased by about $8.2 billion; and that additional demand supported the creation of43,800 new jobs. Finally, increases in productivity associated with the use of software by otherindustries expanded the GDP produced by other industries by over $100 billion, sufficient tosupport 850,000 new jobs. Therefore, the production and use of software in 2012 was directlyassociated with the creation of more than 163,000 new jobs and indirectly with another 850,000new jobs. While economists cannot yet model with precision the dynamics by which softwarerenders some jobs obsolete, there is no evidence that the use of software by businesses in 2012offset even the 163,000 new jobs associated directly with the production of software, much lessthe 850,000 associated indirectly with its use, through productivity gains.
8 Raduchel (2006).

6
II. The Software Industry’s Increasing Impact on Economic Growth and Job Gains
In a 2011 essay in the Wall Street Journal, software pioneer and venture capitalist MarcAndreessen famously wrote that by spurring innovations that disrupt traditional industries,“software is eating the world.”9 The data confirm that the software industry has had a substantialimpact on the American economy. In 2012, U.S. software companies generated some $425billion in GDP and employed more than 2.3 million workers. In addition to these substantiallevels of direct economic output and employment, the software industry generates additionalemployment through its purchases of goods and services from other industries and additionaloutput through its impact on the innovative capacity, efficiency and productivity of otherindustries that purchase and use software.
The direct economic effects of the software industry are based on the growth andoperations of companies in three sub-industries: computer systems design and related services;software publishing; and data processing, hosting and information services. The computersystems design industry (NAICS code 5415) covers companies that write, modify, test, andprovide support for software, and so would include enterprise software companies such as IBM,Hewlett-Packard, and Oracle, as well as IT consulting companies like Accenture.10 The softwarepublishing industry (NAICS code 5112) covers companies that produce and distribute computersoftware, including the development, publishing and installation of software, as well asproviding support for software customers. This sub-industry is comprised of 1) prepackagedsoftware produced by companies such as Apple and Microsoft (25.6 percent of softwarepublishing); 2) custom software built by companies such as IBM and Hewlett Packard (37.6percent); and 3) software developed by companies in-house for their own use (36.8 percent).Finally, the data processing, hosting, and other information services industry (NAICS codes 518and 519) covers companies that provide web-based software, infrastructure and data storage, aswell as search engines, social networks, auction sites, and web publishing companies. Servicesincluded under this designation include web-based platforms and applications, cloud computingservices, and streaming services. The companies include Google, eBay, Salesforce, and Netflix.
From 1997 to 2002, the value added produced by the three sub-industries increased fromabout $150 billion to just over $425 billion, for average annual growth of more than 7.2 percent.(See Table 1, below)
Table 1. Value-Added Produced by the Software Industry, 1997-2012 ($ millions) 11
Sub-Industry 1997 2000 2005 2010 2012Computer systems design & related services $75,259 $113,596 $134,964 $189,882 $229,792Software publishers $43,831 $66,171 $78,482 $103,958 $115,435Data processing, hosting, & info. services $30,314 $23,970 $71,822 $69,224 $80,186
Total $149,404 $203,737 $285,268 $363,064 $425,413
9 Andreessen (Aug 20, 2011).10 Companies classified as part of the computer systems design industry also includes those which plan and designcomputer systems, manage and operate computer systems, train and support users of these systems, and provideother technical computer-related services.11 Bureau of Economic Analysis

7
The software industry has also consistently grown faster than the rest of the economy. Asa result, its annual value-added as a share of GDP has consistently increased. From 1997 to2012, the share of GDP attributable to the software industry has risen from 1.7 percent to 2.6percent, an increase of more than 50 percent. (Table 2, below)
Table 2. Value-Added Produced by the Software Industry as a Share of GDP, 1997-2012 12
Sub-Industry 1997 2000 2005 2010 2012Computer systems design and related services 0.9% 1.1% 1.0% 1.3% 1.4%Software publishers 0.5% 0.6% 0.6% 0.7% 0.7%Data processing, hosting, and information services 0.4% 0.2% 0.5% 0.5% 0.5%
Total 1.7% 2.0% 2.2% 2.4% 2.6%
Software-related employment has grown nearly as rapidly as overall software production.From 1990 to 2014, the number of combined workforce of U.S. software companies increasedfrom 778,000 to 2.5 million, a 5.0 percent average annual rate. (Table 3, below)
Table 3. Software Industry Employment, 1990-2014 (thousands)13
Sub-Industry 1990 1995 2000 2005 2010 2014Computer systems design and related services 410 611 1,254 1,195 1,449 1,733Software publishers 98 157 261 238 261 299Data processing, hosting, and information services 271 314 473 380 385 471
Total 778 1,083 1,988 1,813 2,095 2,503
Since 1990, software-industry employment has consistently increased faster than overallprivate employment. As a result, the software industry’s share of the total private workforce hasgrown from 0.9 percent in 1990 to 2.2 percent in 2014. (Table 4, below)
Table 4. Software Industry Employment as a Share of Total Private Employment, 1990-201414
Sub-Industry 1990 1995 2000 2005 2010 2014Computer systems design and related services 0.4% 0.6% 1.1% 1.1% 1.3% 1.5%Software publishers 0.1% 0.2% 0.2% 0.2% 0.2% 0.3%Data processing, hosting, and information services 0.3% 0.3% 0.4% 0.3% 0.4% 0.4%
Total 0.9% 1.1% 1.8% 1.6% 1.9% 2.2%
U.S. Exports of Software and Related Services
Domestic demand for U.S. software has been strong for more than two decades, andforeign demand for software exports has been even stronger in recent years. Using data fromthe Service Annual Survey (Census) and the series on Cross-Border Services Trade (BEA), we
12 Bureau of Economic Analysis13 Bureau of Labor Statistics.14 Bureau of Labor Statistics.

8
estimate that U.S. software companies exported $50 billion to $57 billion in software products in2012. The Census Bureau Service Annual Survey provides estimates of export revenues inservice sectors by their NAICS industry codes. This survey found that in 2012, softwarepublishers (NAICS code 5112) generated exports of $25 billion in 2012 and the computersystems design industry (NAICS code 5415) produced exports of $17.7 billion. The most recentCensus data on the information services and data processing services industry (NAICS codes 518and 519) is from 2007. Assuming a conservative five percent growth rate since then, weestimate that information services and data processing services generated exports in 2012 of atleast $7.5 billion. All told, the Census Bureau survey suggests that the U.S. software industrygenerated about $50 billion in exports in 2012.
The survey also provides consistent data on exports by software publishers for the last 15years. These data show that exports by U.S. software publishers grew by 9 percent per-yearsince 1998, compared to a total of 6.4 percent annual growth for all U.S. exports. (Figure 1,below)
BEA data on cross-border services trade, which cover services exports and imports bytype of service, show that U.S. firms generated $39.5 billion in foreign royalties and licensingfees in 2012 for software, plus another $17.3 billion in foreign royalties and fees for computerand information services, for a total of $56.9 billion in export revenues. Since 2006, when theseexport revenues totaled about $33 billion, software exports as tracked by the BEA have grown atan annual rate of 9.6 percent. (Figure 2, below) By comparison, foreign revenues for all U.S.private services grew by 7.6 percent per-year over the same period.
All told, we estimate that U.S. exports of software and related services have risen at anannual rate of 9-to-10 percent since at least 2006, and totaled $50 billion to $57 billion in 2012.
$ US Billions
25
20
15
10
5
01998 2000 2002 2004 2006 2008 2010 2012
Source: U.S. Census Bureau, Service Annual Survey.

9
III. Software’s Major Role in Rising Productivity Gains
Through most of the 1990s, the U.S. economy experienced a sustained period of stronggrowth, unusually low inflation and unemployment, and rising productivity gains. In fact, thecombination of strong growth and low unemployment with modest inflation depended on theacceleration in productivity, and most academic researchers now attribute that accelerationlargely to increased investments in IT. Most of those studies rely on the “neoclassical growthmodel,” in which output is determined by the mix of capital, labor, and technological progress.In these models, three factors drive productivity growth: 1) capital deepening, or increases in theamount of capital (equipment) used, per-hour worked, 2) labor quality, or increases in laborinput, per-hour worked, and 3) total factor productivity (TFP), which captures any remainingproductivity gains and attributes them to technological advances. To measure the role of IT inthese dynamics, researchers had to quantify the contributions of software, computers, andtelecom.
These studies found that each of these industries contributed to the acceleration inproductivity in two ways. First, when companies invest in and use software, computers andtelecom equipment, they contribute to productivity growth through capital deepening. Second,the companies that develop and produce new software, computers and telecom equipmentcontribute to productivity gains through technological advances that increase the power, speedand capacity of their hardware and software.15 Studies covering the second half of the 1990sfound that capital deepening in information technologies accounted for about 45 percent of theincreases in labor productivity over those years, and advances in these technologies accountedfor another 25 percent.16
15 Jorgenson and Stiroh (2000).16 Oliner and Sichel (2000).
Software royalties and license fees
Computer and information services
20122011201020092007of Economic Analysis.
2008
60$ US Billions
50
40
30
20
10
0

Multifactor Productivity (Technological Advance), Adjusted 22 0.50% 1.61% 0.34%IT-Producing Industries 0.36% 0.72% 0.28%
Software 0.06% 0.10% 0.08%Computer Hardware 0.17% 0.17% 0.04%Telecommunications Equipment 0.05% 0.07% 0.02%Semiconductors 0.09% 0.37% 0.14%
Other Nonfarm Industries 0.13% 0.90% 0.06%Software’s Total Contribution to Productivity Growth 0.22% 0.37% 0.24%Software Share of Productivity Growth 14.10% 12.09% 15.36%Software’s Share of Nonfarm Output Growth 6.65% 9.49% 14.98%
10
In addition, other research suggests that IT investments have encouraged firms to investin other forms of “intangible” capital which also have contributed to TFP gains.17 In thisdynamic, firms that invest in computers and software also undertake complementary investmentssuch as human and organizational capital, R&D, and new business processes, all of which canhelp boost productivity.18 Many economists point to TFP growth outside of the IT sector asevidence that software and computers generate productivity gains across industries by changingthe way that firms produce, finance, market and distribute their goods and services.19
The latest academic research has shown that the U.S. software industry continues to boostproductivity across the economy. A recent study by economists at the Federal Reserve Boardfound that software accounted for 12.1 percent of all labor productivity growth from 1995 to2004 and 15.4 percent of labor productivity gains from 2004 to 2012.20 (0.37/3.06 = 12.09; and0.24/1.56 = 15.36) (Table 5, below) Applying these results to BEA data on total U.S. nonfarmbusiness output growth over these periods, we estimate that software accounted for about 9.5percent of all nonfarm output growth from 1995 to 2004 and 15.4 percent of that growth from2004 to 2012. (3.06/3.9 = 0.785 x 12.09 = 9.49; and 1.56/ 1.6 = 0.975 x 15.36 = 14.98)
Table 5. Contributions to U.S. Labor Productivity Growth, Various Periods, 1974-201221
1974-1995 1995-2004 2004-2012Growth of Real Nonfarm Business Output 3.31% 3.90% 1.60%Growth of Labor Productivity 1.56% 3.06% 1.56%
Contribution to Labor Productivity Growth, Per-YearCapital Deepening 0.74% 1.22% 0.74%
IT Capital 0.41% 0.78% 0.36%Software 0.16% 0.27% 0.16%Computer Hardware 0.18% 0.38% 0.12%Telecommunications Equipment 0.07% 0.13% 0.08%
Other Capital 0.33% 0.44% 0.36%Composition of the Workforce (Increased Skills) 0.26% 0.22% 0.34%
17 Corrado et al. (2006).18 Brynjolfsson and Hitt (2000).19 Basu, et al. (2004).20 Byrne et al. (2013).21 Ibid., (2013); Bureau of Economic Analysis; and author’s calculations.22 These data show multifactor productivity, adjusted for utilization and adjustment costs.
11
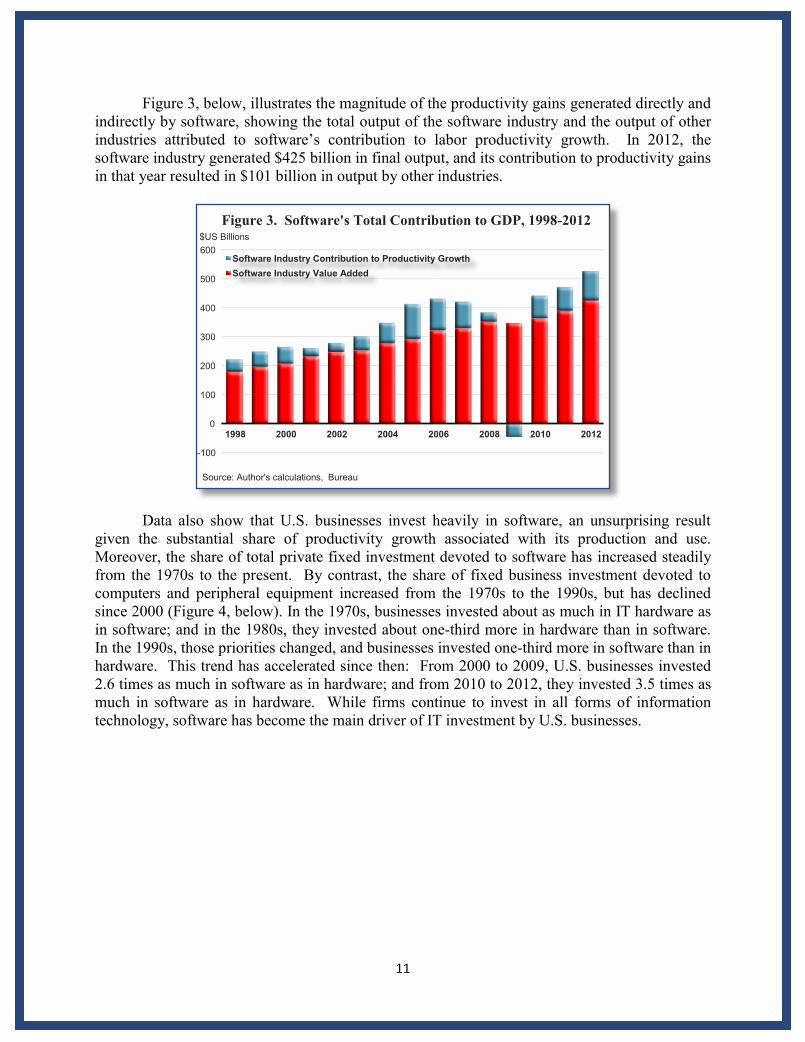
Figure 3, below, illustrates the magnitude of the productivity gains generated directly andindirectly by software, showing the total output of the software industry and the output of otherindustries attributed to software’s contribution to labor productivity growth. In 2012, thesoftware industry generated $425 billion in final output, and its contribution to productivity gainsin that year resulted in $101 billion in output by other industries.
Data also show that U.S. businesses invest heavily in software, an unsurprising resultgiven the substantial share of productivity growth associated with its production and use.Moreover, the share of total private fixed investment devoted to software has increased steadilyfrom the 1970s to the present. By contrast, the share of fixed business investment devoted tocomputers and peripheral equipment increased from the 1970s to the 1990s, but has declinedsince 2000 (Figure 4, below). In the 1970s, businesses invested about as much in IT hardware asin software; and in the 1980s, they invested about one-third more in hardware than in software.In the 1990s, those priorities changed, and businesses invested one-third more in software than inhardware. This trend has accelerated since then: From 2000 to 2009, U.S. businesses invested2.6 times as much in software as in hardware; and from 2010 to 2012, they invested 3.5 times asmuch in software as in hardware. While firms continue to invest in all forms of informationtechnology, software has become the main driver of IT investment by U.S. businesses.
Source: Author's calculations, Bureau
Software Industry Value AddedSoftware Industry Contribution to Productivity Growth
20122010200820062004200220001998
600$US Billions
Figure 3. Software's Total Contribution to GDP, 1998-2012
500
400
300
200
100
0
-100

12
IV. The Software Industry’s Major Impact, Direct and Indirect, on Job Creation
While growth accounting models provide the best insight into the industries and factorsthat drive long-term output growth and productivity gains, academic analysis of an industry orfirm’s impact over shorter periods typically relies on input-output (I-O) models which track thedetailed flows of goods and services between industries. By analyzing the purchases and salesamong and across all industries, input-output analysis can provide valuable insights into theeconomy’s underlying structure, measure the economic relationships between industries, andultimately estimate an industry’s network of effects on the overall economy. Input-outputanalysis relies on a series of statistics issued regularly by the Bureau of Economic Analysistracking the commodity outputs produced by each industry, called the “Make” tables, and thecommodity inputs used by each industry to produce its output, called the “Use” tables. The BEAissues input-output accounts that include data on 65 industries once a year, and benchmarkaccounts that cover 425 industries once every five years.
Input-output analysis is used to estimate the direct effects of an industry or a change indemand for an industry’s goods and services on a variety of aspects of the economy, includingoutput, employment and income. In addition, I-O analysis can track and estimate an industry’sindirect effects on output, employment and income generated by its purchases of intermediateinputs from other industries or supply chains. The sum of these direct and indirect effects is usedto estimate an industry’s “multipliers,” which in turn can be used to estimate the industry’s fulleconomic impact on the economy.
We will next apply input-output analysis to estimate the direct and indirect impact of theU.S. software industry on output and employment. We define the software industry here as thethree, four-digit NAICS categories which, according to the Bureau of Labor Statistics, employthe largest number of software developers and programmers: 1) computer systems designindustry (NAICS code 5415); software publishing (NAICS code 5112); and data processing,hosting, and information services (NAICS codes 518 and 519). As noted earlier, the Bureau of
Figure 4. Computers and Software as aShare of Total Private Fixed Investment
Source: Bureau of Economic Analysis.
Computers and peripheral equipmentSoftware
2010-20122000s1990s1980s1970s1960s
14%
12%
10%
8%
6%
4%
2%
0%
12.2%
9.8%
6.6%
3.5%3.7%
4.8%
3.9%

13
Economic Analysis reports that the output of these three categories in 2012 totaled $425billion.23 Further, the Bureau of Labor Statistics reports that these sub-industries in 2012employed 2.34 million workers, and they earned a total of $308.4 billion.
To estimate the software industry’s indirect employment impact across other industries,we begin with the BEA “Use” table to calculate the amount of each commodity consumed bysoftware companies as intermediate inputs, and the BEA “Make” table identify the source ofthese intermediate inputs by industry. Next, we aggregate the industry totals to estimate thevalue of goods and services consumed by the software industry on an industry-by-industry basis.We find that that in order to produce its $425 billion in output in 2012, U.S. software companiesconsumed $212 billion in goods and services produced by other industries. Further, we estimatethat this economic demand from the software industry supported 1.1 million jobs in otherindustries, including 145,000 workers in the accommodation and food services industry,364,000 workers in the administrative services industry (office administration, clerical services,security, cleaning, and waste disposal services), and 181,000 jobs in the professional, scientific,and technical services industry.
Based on these data, we calculate that every ten jobs in the software industry supportedfive more jobs in other industries – that is, the software industry had an employment multiplierof about 1.5 in 2012. Moreover, the software industry has a greater indirect impact onemployment than many other industries. Using the same methodology, we found, for example,that the employment multiplier of 1.11 for the accommodations and food services industry, 1.14for the retail industry, 1.12 for the education sector, 1.18 for the health care sector, and 1.19 forthe arts, entertainment, and recreation sector.
Since software companies employed 2.34 million workers in 2012, this tells us that thepurchases by software companies supported another 1.08 million jobs. All told, therefore, thesoftware industry was responsible for 3.42 million jobs in 2012 (2.34 + 1.08 = 3.42). Accordingto the most recent data from the Bureau of Labor Statistics, the software industry currentlyemploys about 2.5 million workers. Using the 2012 employment multiplier, we find that in2014, the software industry is responsible for about 3.65 million U.S. jobs.24 A detailedindustry-by-industry analysis of these indirect effects is provided in Appendix A.
While this analysis can be used to estimate the additional jobs supported by the increasein wealth and incomes that follows from the software industry’s contribution to productivitygains, it does not directly address concerns that the same productivity gains lead to job losses bythe companies and industries that make sound use of software. Companies downsize their laborforce for many reasons, from falling demand for their products to more efficient ways ofproducing those products. As noted earlier, when the downsizing is driven by efficiency gains
23 This understates the size of the software industry. Detailed data from the BEA on final sales of software showsales totaling $382.4 billion in 2012. For analytic consistency, however, we use NAICS codes 5415 and 5112 todefine the industry.24 These estimates of the indirect employment effects of the U.S. software industry also understate its full impact,because the analysis does not include “induced effects” associated with the consumption by workers employed bythe software industry: Their earnings create additional demand for goods and services, which in turn requireemployment to satisfy that demand. We do not include these effects, because we cannot determine how many ofthose workers would have been employed elsewhere if the software industry did not exist.

14
associated with business investment, including investments in software and ICT generally, thosejob losses may be largely or entirely offset by new jobs based on additional demand which inturn comes from the higher incomes or wealth created by the efficiency gains. There is noempirical model, however, that can determine whether those offsets are smaller or larger than theoriginal job losses. But if the use of software did tend to destroy jobs, on balance, we wouldexpect to find a correlation, industry by industry, in software investments and employmentlosses. As Figure 5, below, shows, the industries that invested most heavily in software over the15 years from 1997 to 2012 (financial services, scientific and technical services, education) hadrelatively strong rates of job growth, while industries investing the least in software experiencedboth high levels (mining) and low levels (apparel) of job growth. This suggests that far fromdestroying jobs, on a net basis, software investments may have positive effects on employment.
V. The Software Industry’s Singular Success in Creating More Jobs during the2008-2009 Recession and the Current Recovery
Our analysis also found that the software industry has been an unusually strong source ofdemand and employment growth in the Great Recession of 2008-2009 and the current recovery.This finding is part of the larger pattern. From 1997 to 2012, GDP grew at an average annualnominal rate of 4.3 percent. By contrast, the value-added or output of the computer systemsdesign industry (NAICS code 5415) increased from $75 billion in 1997 to $230 billion in 2012,or at an average annual rate of 7.7 percent. Similarly, the output of the software publishingindustry (NAICS code 5112) grew from $44 billion in 1997 to $115 billion in 2012, for averageannual growth of 6.7 percent. Finally, the production of the data processing, hosting, andinformation services industry (NAICS codes 518 and 519) increased from $30 billion in 1997 to$80 billion in 2012, an average annual growth rate of 6.7 percent. All told, the output of thesoftware industry grew from $149 billion in 1997 to $425 billion in 2012, for average annualgrowth of 7.2 percent – a growth rate 67 percent greater than overall economy over the sameperiod.
Apparel
Activities for MiningSupport
fManagement oCompanies
Software Purchases / Total Inputs (19972012)-10.0%8.0%6.0%4.0%2.0%
8.0%
6.0%
4.0%
2.0%
0.0%
-2.0%
-4.0%
-6.0%
-8
Ann
ual E
mpl
oym
ent G
row
th (1
997-
2012
)

15
The relative performance of the software industry, compared to the overall economy, hasbeen even more impressive throughout the recent economic recession and subsequent recovery.Since 2007, the output of the computer systems design industry has increased at an averageannual rate of 6.6 percent, the output of the software publishing industry has grown at an averageannual rate of 3.5 percent, and the output of the data processing, hosting, and informationservices industry has increased at an average annual rate of 4.4 percent (Figure 6, below). Alltold, the software industry has grown at an average annual rate of 5.3 percent since 2012,compared to 2.3 percent for the overall economy: The software industry, therefore, has grown130.4 percent faster than the rest of the economy.
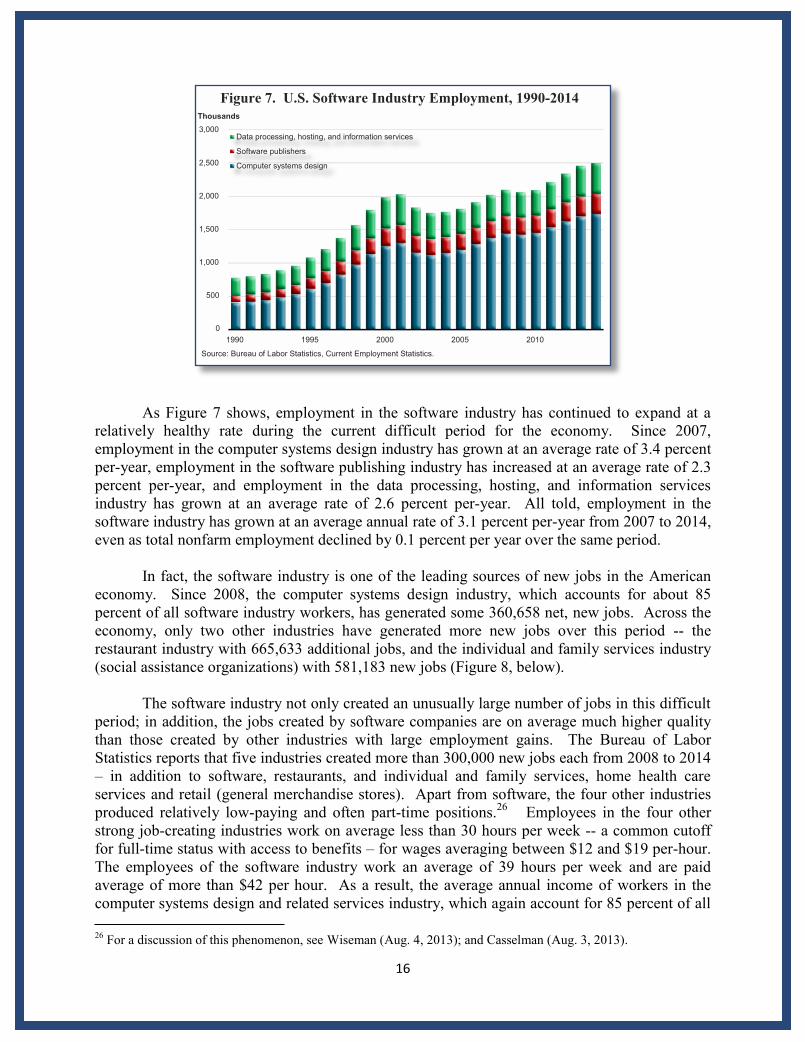
Since the 1990s expansion, the U.S. economy has experienced periods of relativelystrong GDP growth accompanied by only modest job gains, a development often referred to as a“jobless recovery.”25 This phenomenon has been a prominent feature of several of theeconomy’s faster- growing industries. For example, since 2000, the output of the petroleumrefining, oil and gas extraction, and mining industry has grown at an average annual rate of 11percent per year while its total employment has declined by about 1 percent per year. Bycontrast, from 2000 to 2014, employment in the software industry has grown from just under 2million positions to about 2.5 million positions, or about 1.7 percent per-year (Figure 7).
25 See for example Groshen and Potter (2003); and Schreft and Singh (2003).
of Economic Analysis.Source: Bureau
Software PublishersComputer systems design
Data processing, hosting, and information services
Figure 6. U.S. Software Industry Value Added, 1997-2012$US Billions
2012200720021997
450
400
350
300
250
200
150
100
50
0
16
As Figure 7 shows, employment in the software industry has continued to expand at arelatively healthy rate during the current difficult period for the economy. Since 2007,employment in the computer systems design industry has grown at an average rate of 3.4 percentper-year, employment in the software publishing industry has increased at an average rate of 2.3percent per-year, and employment in the data processing, hosting, and information servicesindustry has grown at an average rate of 2.6 percent per-year. All told, employment in thesoftware industry has grown at an average annual rate of 3.1 percent per-year from 2007 to 2014,even as total nonfarm employment declined by 0.1 percent per year over the same period.
In fact, the software industry is one of the leading sources of new jobs in the Americaneconomy. Since 2008, the computer systems design industry, which accounts for about 85percent of all software industry workers, has generated some 360,658 net, new jobs. Across theeconomy, only two other industries have generated more new jobs over this period -- therestaurant industry with 665,633 additional jobs, and the individual and family services industry(social assistance organizations) with 581,183 new jobs (Figure 8, below).
The software industry not only created an unusually large number of jobs in this difficultperiod; in addition, the jobs created by software companies are on average much higher qualitythan those created by other industries with large employment gains. The Bureau of LaborStatistics reports that five industries created more than 300,000 new jobs each from 2008 to 2014– in addition to software, restaurants, and individual and family services, home health careservices and retail (general merchandise stores). Apart from software, the four other industriesproduced relatively low-paying and often part-time positions.26 Employees in the four otherstrong job-creating industries work on average less than 30 hours per week -- a common cutofffor full-time status with access to benefits – for wages averaging between $12 and $19 per-hour.The employees of the software industry work an average of 39 hours per week and are paidaverage of more than $42 per hour. As a result, the average annual income of workers in thecomputer systems design and related services industry, which again account for 85 percent of all
26 For a discussion of this phenomenon, see Wiseman (Aug. 4, 2013); and Casselman (Aug. 3, 2013).
Source: Bureau of Labor Statistics, Current Employment Statistics.
Computer systems design
Software publishers
Data processing, hosting, and information services
20102005200019951990
3,000
Thousands
Figure 7. U.S. Software Industry Employment, 1990-2014
2,500
2,000
1,500
1,000
500
0
17
software industry employment, is $86,457 today, compared to $28,278 for home health careservices workers, $23,394 for workers in the individual and family services industry, $22,502 forretail workers and $15,888 for restaurant workers (Figure 6, below). As a result, softwareworkers earn, on average, three times as much as workers in the other four industries that createdlarge numbers of new jobs.
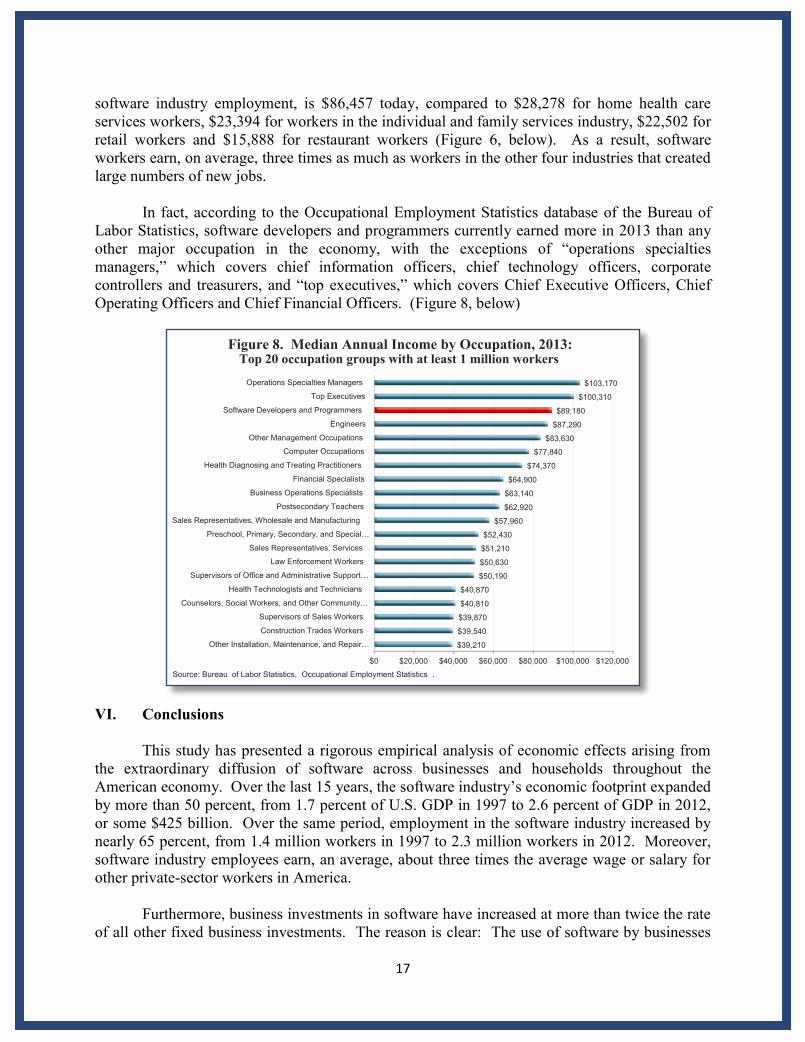
In fact, according to the Occupational Employment Statistics database of the Bureau ofLabor Statistics, software developers and programmers currently earned more in 2013 than anyother major occupation in the economy, with the exceptions of “operations specialtiesmanagers,” which covers chief information officers, chief technology officers, corporatecontrollers and treasurers, and “top executives,” which covers Chief Executive Officers, ChiefOperating Officers and Chief Financial Officers. (Figure 8, below)
VI. Conclusions
This study has presented a rigorous empirical analysis of economic effects arising fromthe extraordinary diffusion of software across businesses and households throughout theAmerican economy. Over the last 15 years, the software industry’s economic footprint expandedby more than 50 percent, from 1.7 percent of U.S. GDP in 1997 to 2.6 percent of GDP in 2012,or some $425 billion. Over the same period, employment in the software industry increased bynearly 65 percent, from 1.4 million workers in 1997 to 2.3 million workers in 2012. Moreover,software industry employees earn, an average, about three times the average wage or salary forother private-sector workers in America.
Furthermore, business investments in software have increased at more than twice the rateof all other fixed business investments. The reason is clear: The use of software by businesses
.Occupational Employment Statisticsof Labor Statistics,Source: Bureau
Figure 8. Median Annual Income by Occupation, 2013:Top 20 occupation groups with at least 1 million workers
Operations Specialties Managers
Top Executives
Software Developers and Programmers
Engineers
Other Management Occupations
Computer Occupations
Health Diagnosing and Treating Practitioners
Financial Specialists
Business Operations Specialists
Postsecondary Teachers
Sales Representatives, Wholesale and Manufacturing
Preschool, Primary, Secondary, and Special…
Sales Representatives, Services
Law Enforcement Workers
Supervisors of Office and Administrative Support…
Health Technologists and Technicians
Counselors, Social Workers, and Other Community…
Supervisors of Sales Workers
Construction Trades Workers
Other Installation, Maintenance, and Repair…
$100,000 $120,000$80,000$60,000$40,000$20,000$0
$89,180
$100,310
$103,170
$83,630
$87,290
$77,840
$74,370
$64,900
$63,140
$62,920
$57,960
$52,430
$51,210
$50,630
$50,190
$40,870
$40,810
$39,870
$39,540
$39,210

18
was responsible for more than 15 percent of all U.S. productivity growth from 2004 to 2012, ormore than one-third of the productivity benefits attributed to all information and communicationstechnologies (ICT) considered as a whole. As a result, some $101 billion in output by otherindustries can also be attributed to the use of software. Therefore, the total U.S. productionattributable to the software industry in 2012 was $526 billion in goods and services ($425 + $101= $526), or 3.2 percent of U.S. GDP.
The software industry also has substantial indirect effects on employment. Much likemany other types of businesses investment, the adoption of new forms of software entails boththe creation of new jobs – for example, to design, produce, install and maintain new software –and the destruction of some old jobs rendered obsolete by the new programs. There arelegitimate public concerns about job losses associated with the increased use of software, butthere is no question that the job gains associated with that use dwarf any such job losses. Forexample, employment in the software industry increased in 2012 by 128,000 positions. Softwareindustry demand for goods and services produced by other industries also increased in 2012 by$8.2 billion, and that additional demand supported another 43,800 new jobs. Beyond those directeffects, the 2012 increases in productivity in other industries attributable to software increasedGDP by some $101 billion, which in turn supported another 850,000 new jobs in that year. So,the production and use of software in 2012 led directly to the creation of an estimated 163,000new jobs – more jobs than could plausibly be linked to job obsolescence associated withsoftware in that year -- plus another 850,000 new jobs linked indirectly to the production and useof software.
This study provides empirical analyses that support the intuition of most Americans,including most economists, that software has changed the operations of nearly every aspect ofthe American economy, and that the consequences of those changes, in the main, areresoundingly positive.

19
Appendix A
Input-Output Analysis of the U.S. Software Industry, 2012
Input-Output Analysis of the U.S. Software Industry, 2012
SectorCode Sector Description
ComputerSystems DesignOutput Demand
SoftwarePublishing
Output Demand
Data Processing,Internet Publishing
Output Demand
Total SoftwareIndustry Output
DemandTotal SectorGross Output
Employment(Thousands)
Employment Attributableto Software Demand
(Thousands)11 Agriculture, Forestry, Fishing and Hunting 7 5 9 20 445,515 2,113 021 Mining, Quarrying, and Oil and Gas Extraction 35 8 122 165 572,306 801 022 Utilities 394 140 698 1,232 378,146 554 223 Construction 35 17 164 216 1,065,881 5,641 131-33 Manufacturing 9,756 3,256 19,297 32,310 5,800,665 11,919 6642 Wholesale Trade 1,762 4,189 2,998 8,950 1,413,058 5,673 3644-45 Retail Trade 620 137 745 1,501 1,478,108 14,875 1548-49 Transportation and Warehousing 3,589 1,508 6,871 11,968 965,255 4,415 5551 Information 5,059 4,507 5,256 14,822 1,377,783 2,678 2952 Finance and Insurance 5,587 2,542 3,221 11,349 1,999,422 5,834 3353 Real Estate and Rental and Leasing 10,899 3,835 11,113 25,848 2,832,376 1,952 1854 Professional, Scientific, and Technical Services 16,531 7,735 15,943 40,209 1,750,594 7,892 18155 Management of Companies and Enterprises 3,199 2,148 1,842 7,189 531,148 2,008 27
56Administrative and Support and WasteManagement and Remediation Services 22,299 5,412 6,070 33,781 746,063 8,030 364
61 Educational Services 515 40 616 1,172 311,727 3,347 1362 Health Care and Social Assistance 189 10 237 436 1,937,585 16,972 471 Arts, Entertainment, and Recreation 832 431 649 1,913 268,584 1,966 1472 Accommodation and Food Services 5,079 1,472 3,380 9,931 806,754 11,780 14581 Other Services (except Public Administration) 1,341 420 1,495 3,257 579,634 6,175 3592 Public Administration 2,458 394 3,322 6,175 3,432,857 21,917 39Total 90,188 38,207 84,049 212,444 28,693,461 136,540 1,077Source: Bureau of Economis Analysis, author's calculations.
20
References
Andressen, Marc (2011). “Why Software Is Eating The World” The Wall Street Journal, August20, 2011.
Basu, Susanto, John G. Fernald, Nicholas Oulton, and Sylaja Srinivasan (2004). “The Case of theMissing Productivity Growth, Or Does Information Technology Explain Why ProductivityAccelerated in the United States But Not in the United Kingdom?” NBER MacroeconomicsAnnual 2003.
Bureau of Economic Analysis, Various data (2014).
Bureau of Labor Statistics, Various data (2014).
Byrne, David M., Stephen D. Oliner, and Daniel E. Sichel (2013). “Is the InformationTechnology Revolution Over?” Finance and Economics Discussion Series Working Paper.Federal Reserve Board, March 2013.
Brynjolfsson, Erik and Lorin M. Hitt (2000). “Beyond Computation: Information Technology,Organizational Transformation and Business Performance,” Journal of Economic Perspectives,vol. 14(4), pages 23–48.
Casselman, Ben (2013). “Low Pay Clouds Job Growth: Unemployment Rate Falls but HiringGrowth Slows; Quality of Positions a Concern,” The Wall Street Journal, August 3, 2013.
Corrado, Carol, Charles Hulten, and Daniel Sichel (2006). “Intangible Capital and EconomicGrowth.” Working Paper 11948. Cambridge, MA: National Bureau of Economic Research.
Groshen, Erica L. and Simon Potter (2003). “Has Structural Change Contributed to a JoblessRecovery?” Current Issues in Economics and Finance, Volume 9, Number 8, Federal ReserveBank of New York. 2003.
Haltiwanger, John, Ron Jarmin, and Javier Miranda. “Business Dynamics Statistics Briefing:Historically Large Decline in Job Creation from Startup and Existing Firms in the 2008–2009Recession.” U.S. Census Bureau Business Dynamics Statistics. 2011https://www.ces.census.gov/docs/bds/plugin-BDS%20March%202011%20single_0322_FINAL.pdf.
Jorgenson, Dale W. and Kevin J. Stiroh (2000). “Raising the Speed Limit: U.S. EconomicGrowth in the Information Age,” Brookings Papers on Economic Activity, The BrookingsInstitution, vol. 31(1), pages 125-236. 2000.
Kane, Tim (2010). “The Importance of Startups in Job Creation and Job Destruction,” KaufmanFoundation Research Series, Firm Formation and Economic Growth, July 2010.http://www.usinnovation.org/files/Firm_Formation-importance_of_startups_to_job_creation.pdf.

21
Oliner, Stephen D. and Daniel E. Sichel (2000). “The Resurgence of Growth in the Late 1990s:Is Information Technology the Story?,” Journal of Economic Perspectives, vol. 14(4), pages 3-22.
Raduchel, William (2006). “The Economics of Software: Technology, Processes, and PolicyIssues,” in Measuring and Sustaining the New Economy: Report of a Symposium, DaleJorgenson and Charles Wessner, eds., Committee on Software, Growth, and the Future of theU.S Economy, Committee on Measuring and Sustaining the New Economy, National ResearchCouncil. 2006.
Schreft, Stacey L. and Aarti Singh (2003). “A Closer Look at Jobless Recoveries” EconomicReview, Volume 88, Issue 2, Federal Reserve Bank of Kansas City.
Wiseman, Paul (2013) “New Jobs Disproportionately Low-Pay or Part-Time,” AssociatedPress, August 4, 2013

22
About the Author
Robert J. Shapiro is the chairman and co-founder of Sonecon, LLC, a private firm that provideseconomic and security-related analysis and advice to senior government officials and seniorexecutives of American and foreign businesses and non-profit organizations. Dr. Shapiro hasadvised, among others, President Bill Clinton, Vice President Al Gore, Jr., British PrimeMinister Tony Blair, Treasury Secretaries Timothy Geithner and Robert Rubin, British ForeignSecretary David Miliband, and many U.S. Senators and Representatives, including HillaryClinton and Barack Obama. He has advised senior executives from such global companies asAT&T, Exxon-Mobil, Amgen, Gilead Science, Google, Elliot Management, and Fugitsu, as wellas non-profit organizations such as PhRMA and the Center for American Progress. Dr. Shapiroalso is a Senior Fellow of the Georgetown University McDonough School of Business, advisorto the IMF, co-chair of American Task Force Argentina, director of the Globalization Initiative atNDN, and on the advisory boards of Gilead Sciences and Core Capital. Before establishingSonecon, he was the Under Secretary of Commerce for Economic Affairs, in which position hedirected economic policy at the Commerce Department and oversaw the operations of theBureau of Economic Analysis and the Census Bureau. Prior to that position, he was a co-founder and the Vice President of the Progressive Policy Institute and, before that, LegislativeDirector and Economic Counsel to Senator Daniel Patrick Moynihan. Dr. Shapiro also served asthe principal economic advisor to Bill Clinton in his 1991-1992 presidential campaign and as aneconomic advisor in the campaigns of Barack Obama, John Kerry and Al Gore. He has been aFellow of Harvard University, the Brookings Institution, and the National Bureau of EconomicResearch; and he holds a Ph.D. and M.A. from Harvard University, a M.Sc. from the LondonSchool of Economics and Political Science, and an A.B. from the University of Chicago.