the us nephrology workforce 2015 - american society of ... · introduction ... wu x, collins a. the...
TRANSCRIPT

Prepared for
The American Society of Nephrology
From
The US Nephrology Workforce 2015Developments and Trends
Edward Salsberg, MPA Leo Quigley, MPHGeorge Washington University School of Nursing
Leah Masselink, PhD Xiaoli Wu, MSMilken Institute School of Public Health
Ashté Collins, MDGeorge Washington University School of Medicine

The views expressed in this report are solely those of the GW researchers and do not reflect the official policy of the American Society of Nephrology or George Washington University.

The Nephrology Workforce 2015 #NephWorkforce | 3
Table of Contents1. Executive Summary ............................................................................................................................................................ 42. Introduction .......................................................................................................................................................................... 93. Distribution of Nephrologists, ESRD Patients, Patients per Nephrologist, and Nephrology Fellowship Programs .......................................................................................................................... 94. Nephrology Fellowship Training Trends ............................................................................................................................ 14 A. Number of Fellows in Training ...................................................................................................................................... 14 B. Nephrology and the NRMP Match: Trends Over Time ................................................................................................ 145. The Job Market for New Nephrologists: Findings from the 2015 Survey of Nephrologists Completing Training .................................................................................................... 186. Focus Groups with Practicing Nephrologists .................................................................................................................... 207. Findings from Interviews with Major Dialysis Providers .................................................................................................... 278. Trends in the Incidence and Prevalence of Kidney Diseases and Injury ........................................................................... 319. Next Steps ......................................................................................................................................................................... 36
References ............................................................................................................................................................................... 37
List of ExhibitsExhibit 1. Number of Nephrologists/100,000 Population by HRR, 2011 ................................................................................ 10Exhibit 2. Number of ESRD Patients per 100,000 Population by HRR, 2011 ........................................................................ 11Exhibit 3. ESRD Patients per Nephrologist by HRR, 2011 ..................................................................................................... 12Exhibit 4. Geographical Distribution of Nephrology Fellowship Programs and ESRD Patients per Nephrologist by HRR, 2011 ................................................................................................... 13Exhibit 5. Trends in Total ACGME Nephrology Fellows .......................................................................................................... 14Exhibit 6. Change in Number of ACGME Nephrology Fellows in AY 2013–14 to AY 2014–15 .............................................. 14Exhibit 7. Number of Filled & Unfilled NRMP Nephrology Fellowship Programs ................................................................... 15Exhibit 8. Number of Filled & Unfilled NRMP Nephrology Fellowship Positions .................................................................... 15Exhibit 9. Number of Matched & Unmatched NRMP Nephrology Fellowship Applicants ..................................................... 15Exhibit 10. NRMP Nephrology Fellowship Match Statistics over Time .................................................................................. 15Exhibit 11. Results of AY 2015–16 NRMP SMS for IM Subspecialties................................................................................... 16Exhibit 12. IM Subspecialty Positions Offered in NRMP SMS AYs 2013–15 ......................................................................... 17Exhibit 13. IM Subspecialty Positions Filled in NRMP SMS AYs 2013–15 ............................................................................. 17Exhibit 14. 6-Year Trend in Nephrology Matches by Education Type ..................................................................................... 18Exhibit 15. Percentage of Nephrology Fellows Having a Difficult Time Finding a Job They Were Satisfied With ................. 19Exhibit 16. Percentage Responding “No jobs” or “Very few jobs” ......................................................................................... 20Exhibit 17. Fellows Who Would Recommend Nephrology to Medical Students & Residents ............................................... 20Exhibit 18. CKD Prevalence in NHANES Population 1998–2012 ........................................................................................... 31Exhibit 19. Unadjusted and Adjusted All-Cause Mortality Rates for Medicare Patients Aged ≥66 Years ............................. 32Exhibit 20. Trends in ESRD Incidence by Age Group 1980–2012 .......................................................................................... 32Exhibit 21. Trends in ESRD Incidence by Race 1980–2012 .................................................................................................... 33Exhibit 22. Trends in ESRD Prevalence by Modality 1980–2012 ............................................................................................ 33Exhibit 23. Trends in ESRD Prevalence by Age Group 1980–2012 ........................................................................................ 34Exhibit 24. Trends in ESRD Prevalence by Primary Cause 1980–2012 .................................................................................. 34Exhibit 25. Awareness, Treatment, and Measures of Control of Risk Factors 1998–2012 .................................................... 35
Suggested Citation: Salsberg E, Quigley L, Masselink L, Wu X, Collins A. The US Nephrology Workforce 2015: Developments and Trends. Washington, DC: American Society of Nephrology; 2015.

4 | The Nephrology Workforce 2015 #NephWorkforce
Nephrology continues to be in transition. While rates of kidney diseases and injury continue to rise in the US, changes in the general health care system and the delivery of kidney care make it unclear how increases in need will be translated into demand for nephrologists. The changes in the delivery system also raise questions as to the future roles and career paths for nephrologists.
There are 5 major interrelated workforce issues to be watched closely.
» How many new nephrologists are needed each year: From the survey of fellows, it is clear that the job market for new nephrologists remains limited. It is also clear from interviews with major dialysis providers that cost pressures and financial incentives may lead to additional steps to try to increase efficiency that could reduce demand for nephrologists. On the other hand, the difficulty of attracting enough well-qualified applicants to fill the available fellowship positions appears to be leading to a reduction in entrants into nephrology. The number of new fellows entering the specialty dropped 8% in academic year (AY) 2014–15 and appears to have dropped further in AY 2015–16. Thus, the growth in both demand and supply may be slowing. While some reduction in supply may be appropriate, nephrology has to be careful not to contract below future need; furthermore, the specialty should try to discourage contractions in areas with high concentrations of patients per nephrologist.
Trends in supply, distribution, and need should be monitored closely.
» The National Resident Matching Program (NRMP) Specialties Matching Service (SMS) “All-In” Nephrology Match: The new “all-in” policy could affect the number and distribution of new fellows. As documented in the report, the number of US allopathic medical school graduates (USMDs) and international medical graduates (IMGs) selecting nephrology over the past several years has been declining. In this regard, the experience of nephrology in the Match has been quite different than most other internal medicine (IM) subspecialties. The new policy is likely to lead to an increase in the number of applicants to nephrology in the Match as some matches that might have been completed outside of the SMS in prior years are likely to be included in the Match for the 2016 appointment year. The critical question will be how the final numbers for AY 2016–17 compare to earlier years.
» The geographic distribution of nephrologists: As indicated in the maps in Chapter 3, the supply of nephrologists is not evenly spread across the country and does not reflect the distribution of patients with kidney diseases as measured by end stage renal disease (ESRD) patients. It is also apparent that location of fellowship programs is not well aligned with the areas of need. This in part reflects the fact that graduates of existing programs have tended to
Executive Summary

stay in the area they trained in. Looking forward, more needs to be done to systematically measure need and access, and to identify areas of high need for nephrologists and to communicate those findings to policy makers and fellows. Any decreases in entrants into the specialty should be monitored closely to make sure that underserved areas are not further disadvantaged.
» Future career paths for nephrologists: One of the takeaway messages from the focus groups with nephrologists and the interviews with representatives of major provider organizations is that the specialty is in transition and there is an undercurrent of uncertainty which sometimes breeds dissatisfaction. Increasing fragmentation of kidney care combined with procedures being ceded to other specialties, including hospitalists, contributes to the uncertainty. Furthermore, the growth of for-profit dialysis providers, increasing time spent overseeing dialysis care, and increasing pressure to generate income all appear to be making the specialty less attractive and rewarding to existing as well as prospective nephrologists. It may be time to look more closely at the roles and opportunities for nephrologists as the health care system attempts to move towards population-based health and greater coordination of care. Attention to this issue could also make nephrology more attractive to well-qualified internists in the future.
» Interprofessional education and practice: The health care system overall is moving to greater use of a whole range of health professionals in part due to the effort to promote population-based health, greater coordination of care, management of the chronically ill, and cost pressures. While nephrology makes some use of nurse practitioners (NPs) and physician assistants (PAs), it appears to do so to a lesser extent than other IM subspecialties. Promoting interprofessional education and practice could be viewed as part of any effort to reassess the career pathways for nephrologists. Hopefully, this will be viewed as a positive development that allows nephrologists to focus on what they are uniquely and best qualified to do. This should also improve the care of patients with kidney diseases and injury.
The Nephrology Workforce 2015 #NephWorkforce | 5

6 | The Nephrology Workforce 2015 #NephWorkforce
This report provides extensive new data and information. Some of the findings are new while others confirm and document trends many in the field are already aware of.
Chapter 3: Distribution of Nephrologists, ESRD Patients, Patients per Nephrologist, and Nephrology Fellowship Programs Using data from the Dartmouth Atlas of Health Care, we present several maps showing the distribution of nephrologists, ESRD patients, the number of patients per nephrologist and location of current fellowship programs using the Hospital Referral Regions (HRRs) developed by the Atlas.
The maps show that the supply of nephrologists, ESRD patients, and nephrology fellowship programs is not evenly distributed across the US. They also show that there are few fellowship programs in HRRs that have the highest number of ESRD patients per nephrologist. These regions are likely to be among the areas with greatest need. Any effort to align the number and location of training of nephrologists should focus on these areas. Not surprisingly, many of the HRRs near clusters of fellowship programs do not have high numbers of ESRD patients per nephrologist. This likely reflects the fact that many physicians locate in areas near where they have trained. A question that needs to be explored is whether nephrologists completing training in relatively rich nephrology supply areas are more likely to move to areas with greater need or stay in the region where the supply is already relatively high.
Chapter 4: Nephrology Fellowship Training TrendsThis chapter reviews trends in the number of fellows in training as well as the experience in recent years in the NRMP SMS. Accreditation Council for Graduate Medical Education (ACGME) data is presented showing an 8% drop in entrants into the AY 2014–15 fellowships. Anecdotal reports suggest a further decrease in the current AY 2015–16. The chapter documents the declining performanceof nephrology both over the past several years and in comparison to other IM subspecialties.
Overview of the Report
Exhibit 6. Change in Number of ACGME Nephrology Fellows in AY 2013–14 to AY 2014–15.
Exhibit 4. Geographical Distribution of Nephrology Fellowship Programs and ESRD Patients per Nephrologist by HRR, 2011
Source: GW Health Workforce Institute analysis of Dartmouth Atlas of Health Care; Fellowship program data from ACGME.
Fellows AY 2013–14
AY 2014–15
Change % Change
First Year 473 436 −37 −7.8%
Second Year 457 459 +2 +0.4%
Total 930 895 −35 −3.8%
Source: ACGME Data Resource Books for Academic Years 2013–14 and 2014–15.

The Nephrology Workforce 2015 #NephWorkforce | 7
Chapter 5: The Job Market for New Nephrologists: Findings from the 2015 Survey of Nephrologists Completing TrainingSurvey findings suggest that the job market for new graduates continues to offer limited opportunities, especially for foreign medical school graduates. In 2015, a higher proportion of both USMDs and IMGs completing nephrology fellowship indicated that it was more difficult to find a satisfactory position than fellows who completed training in 2014. It also appears that increased job applications by the 2015 US nephrology fellowship completers led to a decrease in the percent that had to change their plans due to limited practice opportunities compared to 2014. While IMGs also increased their job applications, an even higher percentage had to change their plans in 2015 than in 2014.
Although a majority of USMD and IMG nephrology fellowship completers continue to indicate they would recommend the specialty to residents and medical students, the proportion doing so decreased slightly between 2014 and 2015.
Chapter 6: Focus Groups with Practicing NephrologistsThis chapter presents key findings from 3 focus groups with practicing nephrologists and includes many of their comments. The focus groups discussed the practitioners’ views of the specialty, how care and their roles have changed, and their sense of the adequacy of the supply to meet the needs for kidney care. Among the key findings are:
» Despite the perceived challenges facing the specialty, participants believe nephrology is a very rewarding specialty; they value the patient relationships developed over many years of frequent contact, and relish its opportunities and intellectual challenges.
» Practicing nephrologists report that nephrology practice has changed significantly in the past 10 years. Nephrologists are less likely to have a direct role in hospital care and many of the conditions and procedures they used to treat have been taken up by other specialties.
» Nephrologists say that working with dialysis providers has helped to standardize care, although they are not convinced that the proliferation of dialysis units is proportionate to need.
» Many nephrologists report working successfully with NPs and PAs serving as “extenders” within nephrology practices and primary care providers for patients also treated by nephrologists. Most nephrologists use NPs or PAs primarily in routine dialysis care.
» Nephrologists’ impressions of whether there is a shortage or surplus of nephrologists depend on where they work. They suggest that the specialty’s low match rate is attributable to perceptions of a high workload, low reimbursement, and changing lifestyle expectations which have fueled trainees’ increased interest in hospital medicine and more procedure-oriented specialties.
Exhibit 15. Percentage of Nephrology Fellows Having a Difficult Time Finding a Job They Were Satisfied With
2014 2015
USMGs 32.6% 43.4%
IMGs 67.7% 72.5%
Total 56.3% 60.6%
2014 2015
USMGs 82.2% 74.4%
IMGs 65.7% 62.7%
Total 71.8% 67.7%
Exhibit 17. Fellows Who Would Recommend Nephrology to Medical Students & Residents

8 | The Nephrology Workforce 2015 #NephWorkforce
Chapter 7: Findings from Interviews with Major Dialysis ProvidersThis chapter presents findings from interviews with several representatives of the large organizations that dominate the delivery of dialysis services in the US. Their decisions on the design of services, staffing levels, recruitment, and retention can directly impact on the demand and use of nephrologists. We interviewed leaders of three major dialysis organizations and present the findings under the themes of: supply and demand; maldistribution; how nephrologists spend their time; gaps in skills and knowledge; NPs and PAs; payment issues; changes anticipated in the future; and redesign of the nephrologist “career.” Among the key findings are the following:» While the organizations believe they could use more
nephrologists, they are also striving (and being pushed) to improve efficiency and they see room to make better use of nephrologists and other health professionals including NPs and PAs.
» While they have an interest in serving underserved communities, they feel constrained by regulations and financing policies which discourage their movement into smaller underserved areas.
» Several expressed concern about the current state of the specialty citing some of the same factors as the practicing nephrologists, such as taking away from the satisfaction and attractiveness of the specialty, including the increasing fragmentation of care for patients with kidney disease. It was suggested that nephrology needs to redesign the specialty to offer a more attractive career option that will attract well-qualified physicians into the specialty.
Chapter 8: Trends in the Incidence and Prevalence of Kidney Diseases and InjuryAssessing the future need for nephrologists requires a careful review of the basic incidence and prevalence of kidney disease and injury of national demographic trends. Relying heavily on the US Renal Data System Annual Data Reports, this chapter reviews some of the high level trends in incidence and prevalence. Among the key findings are the following:
» The prevalence rate of ESRD has been increasing at around 2% per year; overall prevalence has been rising faster than this owing to population increase;
» A continuous fall in mortality rates has been in evidence among CKD patients over the past two decades, a fall even greater than that in mortality rates of non-CKD patients (albeit leaving mortality rates still higher for CKD patients than for non-CKD patients);
» While incidence rates have leveled off for some conditions and population groups, the decrease in mortality rates is leading to continued increases in prevalence rates; and
» The prevalence rate of CKD among African Americans has been consistently higher than for other racial/ethnic groups and increasing over time.
Chapter 9: Next stepsNephrology is facing a number of workforce challenges in the coming years. The GW Health Workforce Institute in consultation with ASN will continue to investigate a range of workforce issues in the coming year. Among the priorities are the following:
1. Assessing results of implementation of the NRMP SMS “all-in” policy;
2. Preparing the Report on the 2015 Survey of Nephrology Fellows Completing Training;
3. Undertaking a more detailed assessment of supply, demand, and distribution of nephrologists over the next decade;
4. Conducting further review of distribution and access issues across the country; and
5. Continuing to assess changes in delivery and financing of kidney care.
Exhibit 22. Trends in ESRD Prevalence by Modality 1980–2012
Source: US Renal Data System 2014 Annual Data Report Fig 1.10 (http://www.usrds.org/2014/download/Vol2_01_Inc-and-Prev_14_slides.pptx)

The Nephrology Workforce 2015 #NephWorkforce | 9
This is the second annual report on the nephrology workforce by the George Washington University Health Workforce Institute research team. Trying to understand future health workforce needs in a rapidly evolving health care delivery system is extremely challenging. The future supply and demand for nephrologists will be impacted by many different factors.
In order to assess key trends and developments impacting on the supply, demand, use and distribution of nephrologists, the GW Health Workforce Institute research team relied on a multifaceted study design. Key components of the design included the following:
» Focus groups with practicing nephrologists;» Interviews with major national provider organizations;» A survey of nephrology fellows;» Review of data from the National Residency Matching
Program (NRMP) and the Accreditation Council for Graduate Medical Education (ACGME);
» A review of the literature including the US Renal Data System;
» Analysis of the Dartmouth Atlas for Health Care; and » Discussions with ASN staff and the ASN Workforce
Committee.
The Health Workforce Institute research team would like to acknowledge and thank the American Society for Nephrology (ASN) staff, particularly Tod Ibrahim and Kurtis Pivert, for their assistance, guidance and support throughout our research on the nephrology workforce and for their assistance in the final editing of the report.
We would also like to thank the Renal Physicians Association for its assistance with hosting a focus group at their annual meeting. In addition, we thank the nephrologists who participated in our 3 focus groups for their time and insights in helping us better understand the current developments and challenges facing practicing nephrologists. Similarly, we appreciate the time taken by the major dialysis provider organizations and representatives of nurses and physician assistants working in nephrology whom we interviewed to learn their view of current and likely future changes in the delivery system and the implications for nephrologists. We also want to thank the hundreds of nephrology fellows who completed our survey on their practice plans and experience in the job market. Finally, we want to thank the Dartmouth Atlas of Health Care for their generous sharing of data and expertise.
Introduction
Analysis of the distribution of the current supply of nephrologists and the distribution of patients with end stage renal disease (ESRD) by regions reveals a significant variation within the US in the number of patients with ESRD per each nephrologist. To understand this variation, we used data from the Dartmouth Atlas of Health Care to compare the number of nephrologists and the number of ESRD cases in each Hospital Referral Region (HRR). (Additional information on the Dartmouth Atlas of Health Care, including HRRs, is available at http://www.dartmouthatlas.org/.) The 457 HRRs in the US delineate regional health care markets, and are established based on patterns of hospital utilization by Medicare patients. Each HRR’s population and geographic size varies
depending on these hospital utilization patterns. HRRs afford logical geographical units for comparing the supply of practitioners with the population needing nephrology services. Although nephrologists provide many services to patients with kidney diseases and injury beyond ESRD care, this analysis uses Medicare ESRD patients as the measure of need for nephrology services. We first mapped the supply of nephrologists per 100,000 population, then the need for kidney care (measured as ESRD patients per 100,000 population). We then mapped the comparison between supply and need (measured as ESRD patients per nephrologist) by HRR. Finally, we overlaid the distribution of nephrology fellowship programs on the comparison of supply and need.
Distribution of Nephrologists, ESRD Patients, Patients per Nephrologist, and Nephrology Fellowship Programs

10 | The Nephrology Workforce 2015 #NephWorkforce
Supply of Nephrologists per 100,000 PopulationExhibit 1 presents the supply of nephrologists per 100,000 population for each HRR. The original source for physician data is the 2011 American Medical Association Physician Masterfile. Counts could not be adjusted for hours worked, thus these data may overcount the supply as some nephrologists are likely to be providing clinical services on a part-time basis or no longer in clinical practice. The map divides HRRs into 5 quintiles (91 or 92 HRRs per quintile). HRRs in the quintile with the lowest ratio have between 0.3 and 1.5 nephrologists per 100,000 population; HRRs in the quintile with the highest ratio have between 2.6 and 4.1 nephrologists per 100,000 population. The map shows the Southeast and East have the greatest concentrations of nephrologists, whereas the Midwest tends to have the fewest nephrologists per population.
Exhibit 1. Number of Nephrologists/100,000 Population by HRR, 2011
Source: Dartmouth Atlas of Health Care Project

Need: ESRD Patients per 100,000 PopulationAs seen in Exhibit 2, the areas with the greatest concentration of ESRD patients per capita are in the Southeast US and the lowest concentrations are again in the Midwest along with the New England. The high ESRD rates in the Southeast could be correlated with a higher prevalence of diabetes and hypertension in these areas.
Exhibit 2. Number of ESRD Patients per 100,000 Population by HRR, 2011
Source: Dartmouth Atlas of Health Care Project
The Nephrology Workforce 2015 #NephWorkforce | 11

12 | The Nephrology Workforce 2015 #NephWorkforce
Exhibit 3. ESRD Patients per Nephrologist by HRR, 2011
Comparing Need and Supply We next compared the ratios of ESRD patients to nephrologists by HRR to compare need with supply of nephrologists. As shown in Exhibit 3, 20% of the areas with the greatest concentration of nephrologists have less than 62 people with ESRD per nephrologist, while areas with the lowest concentration have more than 105 people with ESRD per nephrologist. While our measures of supply and need both have limitations, the map provides an idea of the areas of the country with high and low need relative to the number of nephrologists.
It is important to note that the map in Exhibit 3 reflects the difference between supply and need. The areas with the highest numbers of patients per nephrologist include areas with both relatively low need and relatively high need (as measured by the number of ESRD patients). That is, there are areas with a low prevalence of ESRD but an even lower supply of nephrologists, leading to a high number of patients for the available supply of nephrologists. Some of these are in rural communities. On the other side, some HRRs with high concentrations of nephrologists still have high numbers of patients per nephrologist, suggesting that need outstrips even high supplies of nephrologists in areas with especially high ESRD prevalence.
Source: Dartmouth Atlas of Health Care Project
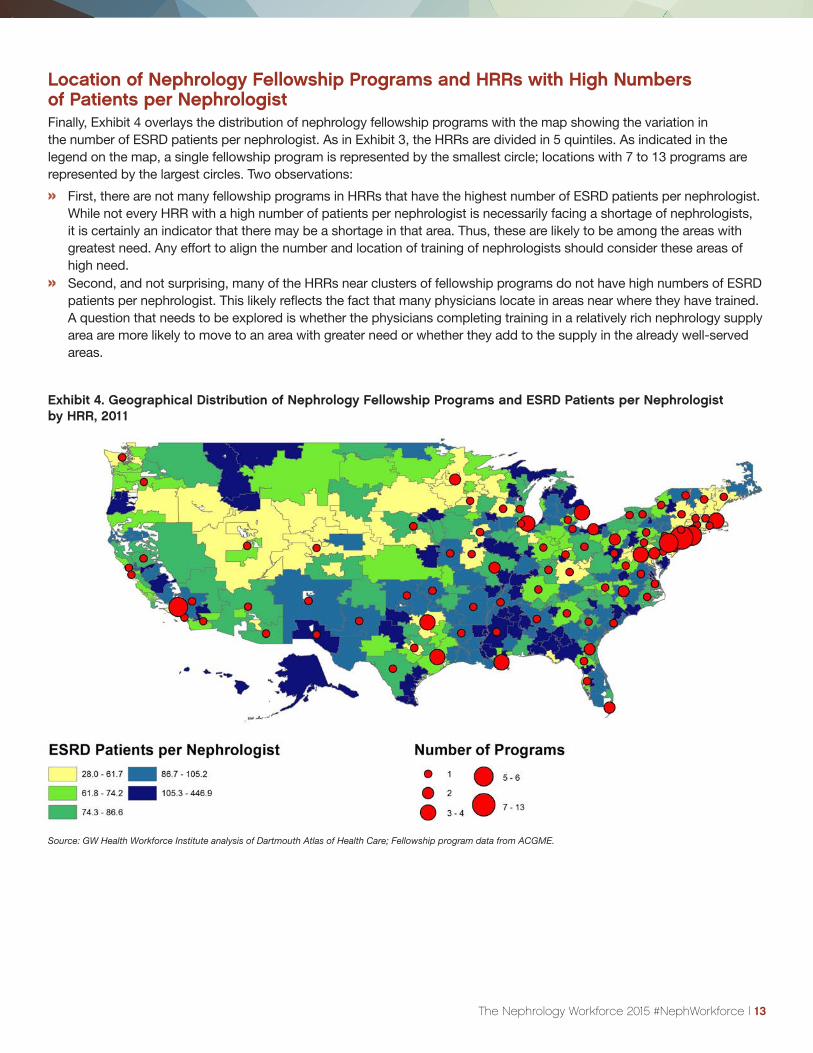
Exhibit 4. Geographical Distribution of Nephrology Fellowship Programs and ESRD Patients per Nephrologist by HRR, 2011
Location of Nephrology Fellowship Programs and HRRs with High Numbers of Patients per NephrologistFinally, Exhibit 4 overlays the distribution of nephrology fellowship programs with the map showing the variation in the number of ESRD patients per nephrologist. As in Exhibit 3, the HRRs are divided in 5 quintiles. As indicated in the legend on the map, a single fellowship program is represented by the smallest circle; locations with 7 to 13 programs are represented by the largest circles. Two observations:
» First, there are not many fellowship programs in HRRs that have the highest number of ESRD patients per nephrologist. While not every HRR with a high number of patients per nephrologist is necessarily facing a shortage of nephrologists, it is certainly an indicator that there may be a shortage in that area. Thus, these are likely to be among the areas with greatest need. Any effort to align the number and location of training of nephrologists should consider these areas of high need.
» Second, and not surprising, many of the HRRs near clusters of fellowship programs do not have high numbers of ESRD patients per nephrologist. This likely reflects the fact that many physicians locate in areas near where they have trained. A question that needs to be explored is whether the physicians completing training in a relatively rich nephrology supply area are more likely to move to an area with greater need or whether they add to the supply in the already well-served areas.
Source: GW Health Workforce Institute analysis of Dartmouth Atlas of Health Care; Fellowship program data from ACGME.
The Nephrology Workforce 2015 #NephWorkforce | 13

14 | The Nephrology Workforce 2015 #NephWorkforce
This section summarizes trends in nephrology fellowship training based on data from the National Residency Match Program (NRMP) and Accreditation Council on Graduate Medical Education (ACGME). Notable findings include the fact that after many years of increase in the number of fellows entering nephrology each year, the number entering in 2014–15 academic year (AY) dropped by 8%. While hard data is not yet available, it would appear that the number entering the specialty declined further for AY 2015–16. Nephrology once again did poorly in the NRMP Specialty Matching Service (SMS) Match, with the number of applicants, number of participating programs, and the number of matches continuing their recent downward slide. As indicated in this section, most other internal medicine (IM) subspecialties performed better in the Match than nephrology. While this may be discouraging for some observers looking to attract more fellows to nephrology, it also demonstrates the potential of IM subspecialties to draw more US medical graduates (USMGs) and other applicants through the NRMP Match.
A. Number of Fellows in TrainingAcademic year 2014–15 saw the first decline in first- and second-year fellows in nephrology in 8 years (Exhibit 5). While there have been short-term declines over the past 20 years (in 1995, 2000, and 2006) these prior downturns were short lived. Given the experience in the NRMP Match for AY 2015–16 and anecdotal evidence, it is likely that the decline has continued into the current training year.
An examination of ACGME data indicates that the number of first-year fellows entering the specialty in AY 2014–15 declined by nearly 8% from 473 new fellows in AY 2013–14 to 436 in AY 2014–15. (Exhibit 6).
B. Nephrology and the NRMP Match: Trends Over TimeThe experience of nephrology in the NRMP SMS Match reflects in part the attractiveness of the specialty to physicians who have completed IM training. It also provides a picture of the future nephrology workforce. This section presents the results of the NRMP SMS Match for the 2015–16 appointment year from two perspectives. The first is the experience of nephrology in the SMS Match over the past 6 years; the second is how nephrology compares to other IM subspecialties in the SMS Match.
This analysis of the NRMP SMS for IM subspecialists in the 2015 appointment year confirms that nephrology did poorly in the Match. Not only did the number of US allopathic medical school graduates (USMDs) applying for nephrology fellowship slots decline, the number of international medical graduates (IMGs) declined as well. Nephrology’s experience stands in contrast to most other IM subspecialties that maintained higher match rates and recruited a higher percentage of USMDs. In fact, nephrology had the lowest fill rate of any IM subspecialty in the 2015 SMS Match and the lowest match rate for those with USMDs. The decrease comes at a time when the number of physicians completing IM residencies has been increasing slightly.
Exhibit 5. Trends in Total ACGME Nephrology Fellows
Source: Annual ACGME Data Resource Book for AY 2000–14.
Nephrology Fellowship Training Trends
Exhibit 6: Change in Number of ACGME Nephrology Fellows in AY 2013–14 to AY 2014–15
Source: ACGME Data Resource Books for Academic Years 2013–14 and 2014–15.
Fellows AY 2013–14
AY 2014–15
Change % Change
First Year 473 436 −37 −7.8%
Second Year 457 459 +2 +0.4%
Total 930 895 −35 −3.8%

The Nephrology Workforce 2015 #NephWorkforce | 15
Recent Trends Exhibit 7 shows the number of nephrology fellowship programs (overall, filled, and unfilled/partially filled) from 2010 through 2015. While the number of nephrology fellowship programs participating in the NRMP SMS has remained nearly steady between 2010 and 2015, the figure shows a sharp increase in the number of unfilled or partially filled programs, from 15 programs (10.6% of 142) in 2010 to 68 programs (50.7% of 134) in 2015.
The same trend is demonstrated in unfilled nephrology fellowship positions with the proportion of unfilled positions increasing from 5.9% in 2010 (22 unfilled positions of 374) to 31.1% in 2015 (120 unfilled positions of 374). The number of unfilled fellowship program positions doubled from 47 in 2013 to 97 in 2014, and increased by a further 24% to 120 in 2015.
This increase in unfilled positions corresponded to a decline in the number of fellowship applicants—from 576 in 2010 to 276 in 2015. Only 276 individuals applied for 374 nephrology fellowship positions in 2015, a ratio of 0.74 applicants per position. Nephrology fellowship programs have become significantly less selective since 2010, when only 61.1% of applicants matched into programs. In 2015, the figure was 92%, with only 22 applicants failing to match and 120 unfilled positions.
Exhibit 7. Number of Filled & Unfilled NRMP Nephrology Fellowship Programs
Exhibit 9. Number of Matched & Unmatched NRMP Nephrology Fellowship Applicants
Exhibit 10. NRMP Nephrology Fellowship Match Statistics over Time
Exhibit 8. Number of Filled & Unfilled NRMP Nephrology Fellowship Positions
Source: National Resident Matching Program, Results and Data: Specialties Matching Service 2015 Appointment Year; National Resident Matching Program, Washington, DC. 2015.
Source: National Resident Matching Program, Results and Data: Specialties Matching Service 2015 Appointment Year; National Resident Matching Program, Washington, DC. 2015.
Source: National Resident Matching Program, Results and Data: Specialties Matching Service 2015 Appointment Year; National Resident Matching Program, Washington, DC. 2015
Source: National Resident Matching Program, Results and Data: Specialties Matching Service 2015 Appointment Year; National Resident Matching Program, Washington, DC. 2015.

16 | The Nephrology Workforce 2015 #NephWorkforce
Comparison with Other IM SubspecialtiesSince not all new nephrology fellows in the past were selected through the SMS, it only provides a partial picture of the new entrants into nephrology. For example, in AY 2014–15 70% of the new ACGME nephrology fellows came through the SMS (306 of 436) while the other 30% (130 fellows) were recruited outside the SMS. The percent in the SMS represents a decline from 78% (369 of 473) of nephrology fellows recruited through the SMS in AY 2013–14. Since the number of nephrology matches has been falling over the past several years, the results for AY 2015–16 may be less representative of the most recent cadre of fellows; nevertheless, the results of the SMS are informative of current trends. The findings are presented in 3 sections:
» Analysis of AY 2015–16 results in comparison with other IM subspecialties;
» Trends over the past 3 years in comparison with other IM subspecialties; and
» Analysis of 6-year trend in nephrology matches by type of education.
Exhibit 11 presents a summary of the results of the SMS for the AY 2015–16 for IM subspecialties. A few key findings include:
» The 68% fill rate for nephrology is well below most other IM subspecialties which generally matched in the >90% range. Only infectious disease (ID) was close (70% match). Geriatrics, which is not in the SMS, was the only specialty with an even lower match rate (44%).
» Of all IM subspecialties, nephrology had the lowest success in matching USMDs measured as a percentage of all matched. Only 31% of nephrology matches were USMDs compared to 50% for all IM subspecialties.
» Nephrology did slightly better than average with osteopathic graduates, with DOs accounting for 9% of the matches.
» Nephrology had the highest percent of matches both for US citizen IMGs (17%) and non-US IMGs (42%)—a total of 59%.
Exhibit 11. Results of AY 2015–16 NRMP SMS for IM Subspecialties
* Percentage of filled positions (not offered).†”Hem and Onc” and “Pulmonary and Critical Care” include combined and separate programs. ‡Geriatrics is not in the SMS.
IM Specialty Offered Slots
Filled Slots
% Filled USMD % USMD*
% DO* % US IMG*
% Non-US IMG*
Total % IMG*
Cardiovascular 835 824 99% 431 52% 5% 11% 32% 43%
Endocrine, Diabetes
271 252 93% 99 39% 10% 12% 40% 52%
Gastroenterology 464 457 98% 298 65% 5% 9% 21% 30%
ID 327 228 70% 112 49% 8% 12% 30% 42%
Nephrology 374 254 68% 79 31% 9% 17% 42% 59%
Hem and Onc† 555 544 98% 300 55% 4% 9% 31% 40%
Pulmonary and Critical Care†
542 534 99% 258 48% 9% 16% 26% 42%
Rheumatology 209 190 91% 69 36% 12% 14% 37% 51%
Geriatrics‡ 353 155 44% 65 42% 8% 16% 32% 48%
IM Subtotal 3930 3438 87% 1711 50%
Source: National Resident Matching Program, Results and Data: Specialties Matching Service 2015 Appointment Year; National Resident Matching Program, Washington, DC. 2015.

The Nephrology Workforce 2015 #NephWorkforce | 17
Trends Over the Past 3 years in Comparison with Other IM Subspecialties» Over the past 3 years, the number of nephrology
positions offered in the SMS was down by 10%—from 416 to 374—but the number of applicants declined by 34%—from 421 to 276. This contributed to a 31% decrease in matches over the 3 years. The most recent drop was largely driven by the drop in IMGs matching, as the decrease in USMD matches was only down 16% over the period (Exhibits 12–14).
» Nephrology’s decline in matches in the SMS is atypical among other IM subspecialties in the SMS. Over the past 3 years only ID also experienced a loss in its match
rate—a 15.6% drop compared to nephrology’s 31% decline. Nephrology and ID were also the only two IM subspecialties to experience a notable decrease in USMD matches. While the rate of drop was greater for ID over the 3 years (22% compared to 16% for nephrology) in AY 2015–16, ID matched 112 USMDs compared to 79 in nephrology.
» While some IM subspecialties saw a modest drop in applicants, others saw an increase. None experienced a decrease in total applicants to the same extent as nephrology.
» Most IM subspecialties had an increase in USMD matches with the exception of nephrology, ID, and rheumatology.
Exhibit 12. IM Subspecialty Positions Offered in NRMP SMS AYs 2013–2015
Exhibit 13. IM Subspecialty Positions Filled in NRMP SMS AYs 2013–2015
IM SpecialtyNRMP Offered Slots
Change%
ChangeAY 2013 AY 2014 AY 2015
Cardiovascular 781 800 835 54 6.9%
Endocrine, Diabetes 251 261 271 20 8.0%
Gastroenterology 433 461 464 31 7.2%
ID 334 328 327 −7 −2.1%
Nephrology 416 403 374 −42 10.1%
Hem and Onc Combined and Separate 554 561 555 1 0.2%
Pulmonary and Critical and Pulmonary Alone 485 511 542 57 11.8%
Rheumatology 195 206 209 14 7.2%
SMS IM Subtotal 3449 3531 3577 128 3.7%
1st-Year IM 3-years prior 7110 7312 7274 164 2.3%
IM SpecialtyNRMP Offered Slots
Change%
ChangeAY 2013 AY 2014 AY 2015
Cardiovascular 771 797 824 53 6.9%
Endocrine, Diabetes 238 238 252 14 5.9%
Gastroenterology 418 452 457 39 9.3%
ID 270 254 228 −42 −15.6%
Nephrology 369 306 254 −115 −31.2%
Hem and Onc Combined and Separate 540 546 544 4 0.7%
Pulmonary and Critical and Pulmonary Alone 481 508 534 53 11.0%
Rheumatology 186 189 190 4 2.2%
SMS IM Subtotal 3273 3290 3283 10 0.3%
Source: National Resident Matching Program, Results and Data: Specialties Matching Service 2015 Appointment Year; National Resident Matching Program, Washington, DC. 2015.
Source: National Resident Matching Program, Results and Data: Specialties Matching Service 2015 Appointment Year; National Resident Matching Program, Washington, DC. 2015.

18 | The Nephrology Workforce 2015 #NephWorkforce
Analysis of 6-Year Trend in Nephrology Matches by Type of EducationExhibit 14 presents the actual number of physicians by type of education that matched with nephrology through the SMS over the past 6 years.
» The number of USMD matches has been declining for the past 6 years and fell even further in AY 2015.
» The number of DOs has grown slightly, consistent with the growing number of DO graduates in general.
» US citizen IMGs have been an important source of new entrants into nephrology, but their numbers have declined over the past 3 years from 69 to 44.
» The number and proportion of non–US citizen IMGs in AY 2015–16 was down significantly from earlier years—from 192 (56% of matches) in AY 2011–12 to 107 (42.5%) of matches in AY 2015–16. This may reflect the sharp drop in overall applicants for nephrology positions, which declined by 46% during the same period (from 510 in AY 2011–12 to 276 in AY 2015–16).
Exhibit 14. 6-Year Trend in Nephrology Matches by Education Type*
AY 2010 AY 2011 AY 2012 AY 2013 AY 2014 AY 2015
USMD 122 (34.7%)
92 (26.8%)
98 (27.2%)
94 (25.6%)
90 (29.5%)
79 (31.3%)
DO 8 (2.2%)
15 (4.4%)
19 (5.3%)
15 (4.1%)
22 (7.2%)
22 (8.7%)
US IMG 46 (13.1%)
44 (12.8%)
56 (15.6%)
69 (18.8%)
59 (19.3%)
44 (17.5%)
Non-US IMG 176 (50.0%)
192 (56.0%)
186 (51.8%)
189 (51.5%)
134 (43.9%)
107 (42.5%)
All 352 343 359 367 305 252
*Note: Percentages reflect the distribution in the academic year (i.e., column percentage).
Nephrology Fellowship Training Trends The Job Market for New Nephrologists: Findings from the 2015 Survey of Nephrologists Completing Training
The job market for new graduates continues to offer limited opportunities especially for foreign medical school graduates. In 2015, a higher percentage of both US graduates and IMGs completing nephrology fellowship indicated that it was more difficult to find a satisfactory position than fellows who completed training in 2014. It also appears that increased job applications by the 2015 US nephrology fellowship completers led to a decrease in the percent that had to change their plans due to limited practice opportunities compared to 2014. While IMGs also increased their job applications, an even higher percentage had to change their plans in 2015 than in 2014. While a majority of US and IMG nephrology fellowship completers continue to indicate they would recommend the specialty to residents and medical students, this percent decreased slightly between 2014 and 2015.
The 2015 Nephrology Fellows SurveyIn May and June of 2015, the GW Health Workforce Institute with assistance from ASN surveyed all nephrology fellows training in the US. Among the estimated 895 fellows in their first or second year of training, we received 313 valid responses from first and second year fellows for a 35% response rate. We also received 50 responses from fellows in their third year or beyond. To try to understand the job market for nephrologists, for the following analysis we focus on the 219 respondents who were completing their second year of fellowship or beyond (169 fellows completing their second year of training plus the 50 fellows completing a third year or beyond). A more complete analysis of the results of the survey will be presented in a separate report later in 2015.

The Nephrology Workforce 2015 #NephWorkforce | 19
Exhibit 15. Percentage of Nephrology Fellows Having a Difficult Time Finding a Job They Were Satisfied With
We compared the responses of the 2015 cohort on the job market experience questions to those of the fellows completing their second year or beyond who responded to the 2014 Nephrology Fellows Survey to try to assess any changes from last year. Given the relatively small numbers and having only two points of comparison, it is not possible to draw conclusions as to whether any changes are the beginning of a trend.
“Did you have difficulty finding a nephrology job you were satisfied with?”
Of the 132 respondents who had actively searched for a position, 60.6% indicated they had a difficult time finding a satisfactory nephrology job, a slight increase from the 56.3% who reported having a difficult time in 2014. A higher proportion (72.5%) of IMGs reported having difficulty finding a satisfactory nephrology job than graduates of US schools (USMGs, 43.4%). Compared with the 2014 cohort, a higher percentage of both USMGs and IMGs reported having difficulty finding a satisfactory job.
For comparison purposes, a 2014 survey of residents and fellows completing training in New York State found that 28% of the USMGs responded they had difficulty finding a satisfactory position, 43% of temporary visa holders had a difficult time, and 32% of the other IMGs had a difficult time (Center for Health Workforce Studies, 2014).
For USMGs having a difficult time, the most frequently cited reason was inadequate salary/compensation (34.8%). This was a change from 2014, when lack of jobs in desired locations was most cited. In 2015, USMGs also cited lack of jobs in desired practice setting (17.4%) and an overall lack of jobs/practice opportunities (17.4%) as reasons for difficulty finding a satisfactory nephrology job. For IMGs, as in 2014, the most frequently cited reason in 2015 for having a difficult time was lack of opportunities meeting visa requirements (34.5%), followed by lack of positions in desired locations (31%).
“How many jobs did you apply for?” and “How many job offers did you receive?”
USMGs reported a higher number of job applications in 2015 compared with 2014. The percentage reporting that they applied for 5 or more positions increased from 28.6% in 2014 to 43.5% in 2015. This is likely to have contributed to the decrease in the percentage that reported receiving no job offers, which went from 16.3% in 2014 to 3.8% in 2015.
IMGs also reported applying for more jobs in 2015 compared with 2014, with the percentage applying to 5 or more jobs rising from 47.4% in 2014 to 63.3% in 2015. This includes 35.4% that reported applying to more than 10 positions. The increase in applications for IMGs did not appear to change the percentage receiving no job offers, which remained steady at about 10%.
“Did you have to change your plans because of limited nephrology job opportunities?”
Overall, the percentage of respondents indicating that they had changed their plans because of limited nephrology job opportunities was the same (43%) in 2014 and 2015. However, the responses of USMGs and IMGs changed in opposite directions between the two cohorts. For USMGs, the percentage reporting that they had to change plans decreased from 34.9% to 22.6%; for IMGs, the percentage increased from 46.8% to 56.3%. USMGs may have been less likely to report changing their plans in 2015 because more of them applied for high numbers of jobs. While the job search may have been more difficult, in the end they may have been able to find satisfactory positions so as to not have to change their plans.
For IMGs, the fact that over half had to change their plans due to limited job opportunities is likely a reflection of the need for many IMGs to find a practice in a designated Health Professional Shortage Area in order to remain in the US. This may help explain the decrease in IMGs seeking a nephrology fellowship in the NRMP match (see Chapter 4).
2014 2015
USMGs 32.6% 43.4%
IMGs 67.7% 72.5%
Total 56.3% 60.6%

20 | The Nephrology Workforce 2015 #NephWorkforce
Perceptions of the local and national job marketSurvey respondents were asked to indicate their perceptions of the local job market (within 50 miles of where they trained) and the national job market. Response options ranged from no jobs to many jobs. Key findings include:
» Perceptions of the local and national job markets were slightly more positive in 2015 (vs. 2014) for both USMGs and IMGs;
» As in 2014, the 2015 fellows were more likely to indicate that there were few or no job opportunities in the local job market compared to the national market; and
» USMGs have a far more favorable view of the local and national market than IMGs. About 50% of respondents in both groups reported that there were “no jobs” or “very few jobs” in their local job markets in both 2014 and 2015.
“Would you recommend nephrology to current medical students and residents?”
While the percentage that would recommend nephrology to current medical students and residents is high, especially among USMGs, it decreased slightly from 2014 to 2015. As in 2014, IMGs were less likely to recommend the specialty.
To gain insight into the health system changes influencing the work lives of practicing nephrologists, we conducted three focus groups with nephrologists in March 2015. We conducted two of the focus groups via telephone and one in person at the Renal Physicians Association Annual Meeting. A total of 17 nephrologists consented to participate. Focus group discussion topics included the following:
» Changes to nephrology practice in the past 10 years;» Impact of reimbursement changes (e.g., bundled
payments) on nephrology practice;» Nephrologists’ interactions with dialysis providers;» Role of nurse practitioners (NPs) and physician
assistants (PAs) in providing nephrology care; and» Nephrologists’ impressions of supply and demand (or
shortage/surplus) of nephrologists.
We recorded each focus group discussion with participants’ permission and had the recordings transcribed. We conducted thematic analysis of the transcripts using ATLAS.ti, a qualitative analysis software program. We describe the findings of the analysis below.
Shifting Role of Nephrologists in the Health Care SystemParticipants described several ways that nephrologists’ role in the health care system has changed in the past 10 years. First, they noted that nephrologists are less likely to be involved directly in hospital care than in the past. Admissions that would have been handled by nephrologists are now more likely to be handled by hospitalists and intensivists. While this “compartmentalization” (as one participant called it) reduces the day-to-day burden for nephrologists in some cases, it also gives them less discretion over care provided to their patients.
One participant described negotiating treatment decisions with hospitalists or intensivists as a “tug of war”:
“If I, as a nephrologist, had to admit the patient, I controlled what went on and I dictated the care for the patient, versus having to go through an intermediary. Unless you decide to usurp what they’re doing or trump what they’re doing, you go through them. For example, if you need a different consultant involved, you can’t really call the consultant without speaking to the hospitalist. If they don’t agree with you, then you’re into a bit of a tug of war.”
USMGs IMGs
2014 2015 2014 2015
Local 50.1% 46.9% 54.6% 53.8%
National 13.1% 3.9% 28.3% 19.5%
2014 2015
USMGs 82.2% 74.4%
IMGs 65.7% 62.7%
Total 71.8% 67.7%
Focus Groups with Practicing Nephrologists
Exhibit 16. Percentage Responding “No jobs” or “Very few jobs”
Exhibit 17. Fellows Who Would Recommend Nephrology to Medical Students & Residents

The Nephrology Workforce 2015 #NephWorkforce | 21
Other participants suggested that some hospitalists and intensivists tend to overuse tests or to consult nephrologists more frequently than necessary when dealing with kidney conditions, likely because of their high workload:
“Sometimes they’ll do stuff like start ordering tests that I have to cancel because they’re completely worthless tests that they’re doing. Some of them, especially the hospitalists, order entire panels of test without any thought involved. They just figure they order every test that’s possibly related to the disease state, without regard to whether they’re needed or not.”
“What we’ve seen from a specialty standpoint, and certainly from a nephrology standpoint, over the last five years, we are getting a lot more consults in the hospital for things that typically we wouldn’t have been consulted for five years ago... Now, and this is my hypothesis only, the hospitalists are so overwhelmed with the workload that they’re calling on specialists for any little abnormality… In some ways, that’s been good for us, because it’s made us a little bit busier. With revenues, in essence, going down, it’s helped keep our revenues stable.”
Another participant attributed the reduced role of nephrologists in hospital care to the overwhelming demands of other aspects of nephrology practice, suggesting that being less visible in the hospital meant that nephrologists were less likely to be consulted than other specialists who were able to respond more quickly:
“The problem ends up being one of time management. The typical nephrologist, 12 years ago, was taking care of 30–40 dialysis patients, and he’s now taking care of 70–90 dialysis patients. He’s also going to his clinic, and his CKD clinic, and perhaps transplant clinic, and other issues. An academic center is a whole lot different than what we’re seeing our physicians who are in practice having to deal with. This is all about presence. This is all about availability. A nephrologist who is running around town tending to all of these other things is not the most present person in practice. The intensivist, or the pulmonologist, or someone like that is there, is ready to see a consult within minutes to an hour or so, whereas the typical response of a nephrologist is, ‘I’ll get to it later this afternoon’ or, ‘Can it wait until tomorrow?’ In and of itself, the time management and the emphasis on chronic care has moved the nephrologist away from the ICU and private practice.”
Participants noted that in addition to the shrinking of their role in hospital care, nephrologists have also allowed their professional “territory” to shrink considerably, with other specialties taking over responsibilities historically held by nephrologists:
“I would agree with you that that used to be the case where the nephrologist was the intellectual giant who was the intensivist and they allowed the dialysist, the pulmonologist and others to usurp that responsibility and are no longer has that same presence in the same cachet. I not am saying that its absolute, but it certainly appears to be diminishing.”
One participant suggested that in addition to losing procedures to other specialties, nephrologists have “shot themselves in the foot” by ceding the treatment of pre-ESRD conditions to other providers:
“I have a big worry about that because nephrologists have routinely shot ourselves in the foot. Not cardiology. They kept cath. They kept echo. They kept nuclear. They kept everything. They didn’t give all that away. Nephrologists routinely just say, ‘I don’t want to be bothered with that.’ In New York, there are hospitals…where in the ICU, all the dialysis is ordered initially by appointment, where all CVHD is done by non-nephrologists. The nephrologists don’t want to be bothered. They don’t want to get called. I don’t know how they are living. I don’t why they feel that way but that’s happened. They only do ESRD. They do hemo. Their ICUs, it’s all CRT and then CVHD…. That’s crazy. I don’t know why they want to do that. I urge the generations behind us to focus on where we can make an impact, prevent progression which is CKD, not just with dialysis.”
Another participant described this shift of responsibilities from nephrologists to a variety of other providers as a “fragmentation of responsibility” given the more procedure-focused orientation of other specialties:
“I would agree that you’re looking at the chart, the patient, and saying, ‘I’m the protector of the patient from all the other physicians.’ Most of the other medical consultants don’t really view it in the same way. They’re asked to do a specific task—scope a patient, do an echocardiogram, et cetera—except for the intensivist, which is a different situation. I would agree there’s been much more fragmentation of responsibility. Somebody has to take overall responsibility for the patient. That’s sometimes frustrating, too.”

22 | The Nephrology Workforce 2015 #NephWorkforce
Health Information Technology and CommunicationParticipants described the growing use of health information technology, particularly electronic health records (EHRs), as another trend that has significantly changed nephrology practice in the past 10 years. Their assessments of the utility of EHRs and other technologies for supporting communication between providers were mostly negative. One participant called the situation a “nightmare,” particularly because of the burden of learning multiple EHR systems across different hospitals and dialysis providers:
“We’re all having problems with computers. We’re all having problems with regulatory. There’s just so much burden now that there’s less communication. Nobody has time to communicate, because everybody’s too busy going to Epic classes. And so now, we’re trying to get more and more ways to communicate, but it’s just becoming a bigger and bigger nightmare of a problem.”
Participants reported using EHR systems more for quality reporting and billing than information sharing between providers:
“We used to [use] the medical chart to communicate with each other...What the nephrologists think, what the cardiologists think, what the internists think. That’s not true anymore. It’s just a billing and coding [mechanism]...”
Several participants suggested that EHRs have become a substitute for in-person or telephone conversations between physicians, which causes breakdowns in continuity of care—especially (but not exclusively) between nephrologists and hospitalists. Physicians write information in patient charts with the assumption that other physicians will read it instead of calling, which limits the exchange of information and makes it more difficult for nephrologists to know what other providers know (or do not know):
“The hospital based doctors, they don’t want to call you. They want to leave a note in the record and assume you’re going to read it. Then you have to track them down. Some of them leave relatively early, much earlier than we might show up. But even outside of the hospital, I have a small cadre of doctors that I know will get on the phone and say, ‘Hey [name], I’m sending a patient your way.’ Or, ‘I’ve got a problem. This needs to be handled sooner rather than later,’ versus just having somebody call. A very small cadre. Otherwise, it’s just, no. You hope that they send you just a bunch of information.”
“There’s no communication. At some points, it’s time to go. They send you a bunch of labs and expect you to figure it out. And that’s even with older doctors. People just want to do their work and be done with it and not actually communicate in any meaningful way or in a proactive way. And that’s even outside of the hospital.”
“People sit by the computer, and they do their own work, and they move to the next patient. You can make rounds and go back to your office and document. It happens every day. It’s perfectly legal, but it changes the entire workflow and the entire communications. We don’t necessarily know any more about what someone knows, either about that patient or even in general.”
A few participants noted that new forms of communication such as secure texting apps make it possible for providers to communicate directly with each other outside of patient charts, which most of them agreed were mostly useful for billing and coding rather than exchanging of information to support patient care. One described his experience using text messages to communicate with other providers as very positive:
“…We all text each other very, very regularly. It’s a very different form of communication. It’s not left in the chart anymore, because the chart is all about billing and PQRS and all the other forms of regulatory rules. Much so now that the hospital has actually investing in secure texting apps, and I’ve actually found it to be quite useful, because it’s very easy for me to just get a quick text from the hospitalist or the hospital down there...It doesn’t interrupt my workflow. I know exactly what’s going on with that patient, and secure websites allow you to know that the text was read so there’s not the concern of it just being lost in cyberspace. It’s certainly different than it was when I trained, and certainly even before that. But it is one way that technology is keeping up or starting to catch up with what the needs of the physician are.”
On the other hand, participants noted that even these new tools may not allow the level of in-depth dialogue needed to take best care of patients. One participant noted that the reduction of communication between providers to “sound bites” was not specific to nephrology:
“When someone texts me, ‘Blah, blah, blah,’ I have eight questions. And I’m used to saying, ‘What about blah? Did you blah?’ That doesn’t happen anymore. They just text back and forth, and they’re done. I got what I need. “Everything has become a sound bite. Nobody sees the movie. Personally, that has been an enormous erosion of the world of nephrology and the world of health care. People are now taking care of patients based on a sound bite, and no one watches the movie.”

The Nephrology Workforce 2015 #NephWorkforce | 23
Reimbursement and Financial Constraints Participants noted that nephrology is more dependent on Medicare than any other specialty, and because nearly all nephrologists also accept Medicaid patients they end up treating Medicaid patients with very complex needs. They also stated that reimbursement for services such as acute dialysis has declined significantly over the years. One participant said that while some of the reduction in fee is merited because of advances in dialysis treatment, payments have not kept pace with inflation and regulatory demands:
“There’s much less work involved in acute dialysis than there was 30 years ago, because it was much more complex and more difficult to do. Some of that’s a deserved reduction in fee, but…there are no increases, even against inflation. There are no cost of living increases to practices. We have increases in overhead. That is not covered in Medicare reimbursement. The salaries of the people we pay to work for us, they were looking for increases. There are no increases in reimbursement. If we want to avoid cuts to what hasn’t increased, we have to spend more time adding the value. But not necessarily the true value, adding the regulated value, the PQRS, the value based purchasing, meaningful use stuff, that takes times and resources. At least for meaningful use, if you got the money, at least you got paid up front, although that’s going to dissipate. Everything else, you’re all looking at, at some point, penalties, penalties, penalties, cuts, cuts, cuts, to something that’s not increasing…It’s a very difficult environment to come out to, especially in a small, private practice.”
Bundled payments affect reimbursement to dialysis units more than to physicians, but have changed what physicians can do in dialysis units. An academic nephrologist added that because academics now rely heavily on clinical dollars to make their practices run, they have very little time left for teaching, supervision, administrative and fellowship oversight:
“From the practice’s perspective, the major change has been the need to really rely heavily on clinical dollars to make the practice run. There’s very little money left for teaching, supervision, and oversight. Those dollars are very tight now, and they’re very tight in terms of service contacts of the hospital, in terms of teaching, supervision, and administrative oversight of the fellowship programs. In years past, we had time to do a lot more research.”
A participant described how the nephrologists’ reduced of involvement in hospital care has shifted their sources of income. As reimbursement for hospital-based care has declined, outpatient dialysis entry fees and medical directorships at dialysis facilities have taken on increasing importance:
“The other big change is in the distribution of our gross income. It used to be that nephrologist got about a third from their outpatient practice and a third from their dialysis practice and a third from the hospital. Then the medical director fee if they were getting that from one of the dialysis organization was lenient. More and more, I’m seeing that…nephrologists…now have a very little income from hospitals and that they are deferring a significant number of their admissions to hospitalists. And their income has changed distribution to outpatient dialysis entry fee and the medical director’s fee being the largest sources and the hospital side of it drying up.”
Even as settings of care and sources of income change for nephrologists, the role of Medicare and other public insurance programs in paying for kidney care remains—exposing nephrologists to intense and constantly changing regulations. One participant described the burden of meeting regulatory criteria as follows:
“I’ve noticed…the time we have to spend on regulatory issues. Every time we turn around the corner, someone slaps you with another thing you have to try to take care of. Some of them are redundant, and then with current conversion to the electronic medical record, it slows the practice down. The biggest thing is, every time you turn around they change...Once you get to a standard, they suddenly change the standard on you, or decide to do something else on how they measure something. It’s always a moving target that you can never quite reach. They’re always pulling the rug out from under you.”
Interaction with Dialysis ProvidersParticipants stated that the involvement of large corporations like DaVita and Fresenius has made dialysis care more consistent, but they were uncomfortable with their orientation toward maximizing profits without necessarily keeping patients “front and center”:
“The corporate practice of dialysis has changed the way dialysis is practiced in the country. In some ways it’s for better. There’s more consistency of care in dialysis. On the other hand, it is frustrating to have to deal with people whose goals are to make more money, first of all, and the patient is not necessarily always at the front and center.”

24 | The Nephrology Workforce 2015 #NephWorkforce
They were not convinced that the proliferation of dialysis units necessarily reflected increased need:
“There’s a proliferation of dialysis units. In a county that hasn’t changed that much in population, we went from certainly less than half a dozen units to more than a dozen units in the same general geography. Some of that’s growth and some of that’s just...building clinics because they wanted clinics, regardless of the need.”
Participants also suggested that dialysis providers sometimes employed questionable practices such as buying nephrology practices or hiring nephrologists to improve their competitive position. One participant also noted that relationships with dialysis providers can create competition between nephrologists, who may seek to move patients to other dialysis units when given the opportunity:
“At least in my city, we have more [nephrologists] than we need. They’re running over each other, they’re under your feet. You have a patient, goes into the hospital. The patient will call you and say, ‘Hey, I want to come back to you, and the doctor in the hospital said I needed to go into his dialysis unit.’”
Participants noted that the role of medical director in dialysis facilities was a challenging one for nephrologists, as they were held responsible for a range of outcomes despite limited time at the facility and limited control over staffing and process of care:
“The medical director responsibility with the final rule is also a pretty big burden. [I think] about it a lot. I don’t know about other medical directors, but the fact that, if anything happens, it’s only your responsibility. For those of us who work with for-profit companies, it’s being sometimes caught between a rock and hard place because we have little control over what gets done and the staffing. Yet we’re responsible for all the outcomes.”
They also mentioned that spending adequate time with patients was often impossible given their heavy workloads, and those with multiple directorships often spent more time on the road than with patients:
“We have one physician of the month assigned to do the outpatient dialysis. That guy just drives all day long. We spend more time on the road than seeing patients. If you want to spend more than two or three minutes on a patient, then you’re going to miss the shift at the next dialysis center that you’re supposed to see.”
Another participant mentioned a study that suggested that most medical directors spent less than one minute per patient in “true” eye-to-eye contact during rounds despite efforts to devote more time.
Despite these challenges, participants noted that dialysis providers’ job placement services were a very helpful, low-cost support for their efforts to recruit new nephrologists:
“We use the help of another stakeholder, which [are] the large dialysis organizations. Both DaVita and Fresenius have huge placement services. It’s in their best interest because they want nephrology practices to be ongoing and thriving to send them patients to the dialysis unit. They provide that service for a minimal cost.”
Working with NPs and PAsMost participants stated that they worked more closely with NPs and Pas than in the past, both in nephrology and with NPs and PAs acting as primary care providers for their patients. Most participants who had worked with NPs and PAs in their practices stated that their value was mostly in freeing up the physician’s time, enabling nephrologists to focus on office-based patient care and education, by conducting routine dialysis care visits:
“We have utilized nurse practitioners and physician assistants. It has helped the amount of time that we spend in the outpatient dialysis unit because we’ll have them do three out of the four visits a month. We also will have them do a CKD clinic, as well as have office hours where they’ll see patients if I’m booked and the patient needs to have an emergency visit.”
“I just love them. I have a PA who’s worked for me for years…She’s incredible, brilliant. It’s just like having an extra pair of hands. And we now have a nurse practitioner…who does a lot of the dialysis. She and I alternate seeing the dialysis patients. We talk constantly on the phone about each patient. She’s part of my team and I just love working with my PA. I don’t need them in the office. In the office, I want to spend my time talking to the patient. My job in the office is to keep the patient away from dialysis. I do a lot of my own CKD education in the office. I don’t need to send them to some CKD factory. I take care of them myself. I educate them myself…I don’t need a nurse practitioner for that, but I love them in the dialysis area.”
“Some practices find it difficult to figure out whether they can generate enough income to make it worth their while…It is a difficult situation, because in a dialysis setting you can’t generate more reimbursement. The only thing that the nurse practitioner does in the dialysis setting is free up the physician’s time. It doesn’t increase the compensation. It’s a little bit different than a nurse practitioner working in a primary care office, where they can generate just as much as a physician can, in some respects.”

The Nephrology Workforce 2015 #NephWorkforce | 25
Another participant who worked in an academic practice suggested that hiring NPs was not an economically viable option in that setting because of lower reimbursement rates:
“In our academic practice, for dialyzing right now, it’s not economical for us to hire nurse practitioners. The reimbursement is at a lower rate, and we just can’t do it. That’s been our experience. That is the problem with the academic setting I’m in.”
Participants also noted a few challenges of working with NPs and PAs in addition to lower reimbursement rates. One participant noted that some patients are less comfortable being seen by NPs or PAs instead of physicians:
“One thing I found, they’re very useful. But I’ve had patients tell me when they’ve come, when they’ve transferred in from units that had nurse practitioners is they’d rather see me, the doctor or something. Sometimes, some patients would really like to see the doctor, not the nurse practitioner. I don’t know what the issue is sometimes for dialysis rounds. It’s not a big difference in what we do, but maybe it’s something in the mind of the patients.”
Others stated that the increasing roles of NPs and PAs in primary care can present new communication challenges for nephrologists, especially when they do not work together regularly:
“The other thing, outside of the hospital that we’re seeing a lot more primary care being provided by nurse practitioners. We’re getting referrals for 85 year old people with creatinines of 1.2 from nurse practitioners who are doing primary care. You don’t tend to develop the same relationships with nurse practitioners that you did with primary care physicians.”
“For us, it’s been harder when we get referrals or we have to reach out to have conversations with the NPs and PAs, that’s sometimes a little challenging because we don’t know what they don’t know. You’re on the phone with somebody, you don’t really know them well, and you don’t know where to pitch the conversation…That’s going to be challenging because you don’t always know if you’re hitting the right spot and if what you’re saying to them is, if they know how to translate that back. We could all use a little more education on how to best do that.”
Shortage or surplus of nephrologists? Participants’ assessments of whether there is a shortage or surplus of nephrologists depended heavily on geography. They suggested that there are enough nephrologists in urban and suburban areas, but possibly a shortage in rural areas—which is likely to grow as the economy improves and more nephrologists retire. They were not convinced that PAs and NPs could fill the gaps, as they are no more interested in going into nephrology than physicians:
“There’s going to be a wave of people. When they finally get to the point that their retirement plans have recovered from 2008 and they get tired enough, there’s going to be a wave of people leaving. Based on what we’re seeing, in terms of filling the programs, there’s not going to be people behind them. As much as people would like to replace nephrologists and all doctors with advanced practice nurses and PAs, I don’t think there are enough of those people, either. It appears that those people are not necessarily any more interested in going into nephrology than internal medicine residents.”
Participants acknowledged the low match rate on the most recent fellowship Match, suggesting that trainees are more likely to be attracted to other specialties that offer higher reimbursement and a more attractive lifestyle:
“The number of nephrology fellowship positions that went unfilled this year was unprecedented, and I don’t think that’s going to improve any time soon. New trainees, because of their debt burden in many cases, or because of their lifestyle expectations, don’t perceive nephrology as a profession that they should pursue. They’re much more likely to become a hospitalist, emergency room physician, or a proceduralist than they are a nephrologist. Reimbursement for cognitive work in medicine lags far behind procedural work. It is going to be an issue.”
“I don’t know that we have too many spots. But, certainly, it doesn’t look good. If you look at cardiology or if you look at gastroenterology, which are highly reimbursed medical subspecialties, those virtually every spot filled. People are voting with their wallets as to where they want to go and what medical subspecialty they get. The manpower issue is chiefly being driven by the fact that, as a nephrologist, you’re underpaid and you’re overworked. Why would you want to go do this? Several years ago, I went to a career day… The Chief of Medicine got up and said, ‘You know, we’re looking for people that wanna work 24/7, this, that, and the other thing.’ He said, ‘If you wanna make a million dollars a year, go ahead and go into ophthalmology.’ The entire medical school class is saying, ‘Oh, ophthalmology?’”

26 | The Nephrology Workforce 2015 #NephWorkforce
Participants noted several factors that likely contribute to potential fellows’ lack of interest in pursuing careers in nephrology:
» Perception of nephrology as “boring” and heavily focused on chronic dialysis care• “The average internal medicine rotating person in
an academic program, if he or she is at a program where the nephrology program is not a popular consult service and is not a presence in the ICU, nephrology is not viewed as a very cognitive field. If it’s oriented towards the chronic dialysis as their major resident there, it’s considered to be boring. Lucrative but boring.”
» Perception of nephrology as too difficult• “Part of the reason why we have trouble attracting
fellows is they don’t think they can hack it. They don’t think they can understand nephrology.”
» Residents’ perceptions of intense nephrology fellowship workload• “If it is a heavily inpatient oriented service, it creates
problems of its own because the residents see that the renal fellows are extremely overworked as opposed to other fellows. It becomes less of an attraction to them.”
» Residents’ perceptions of heavy workload for practicing nephrologists (especially faculty)• “Another thing that is a turn off to applicants, is
that they say the nephrology faculty themselves are working so hard, almost as hard as a private practitioner…there’s such little time devoted or given to academic matters like free social teaching. I typically spend ten months of the year on a clinical service and yet I am supposed to produce papers and teach and do other thing. The fellows and the residents feel that. Not too many people are keen on staying back in academics after they finish their fellowship.”
» Lure of hospitalist jobs and salaries• “Part of the issue is that the salaries that nephrology
attendings are starting at and finishing at compared with hospital salaries which have gone up markedly in the last number of years. Hospitalist medicine is very, very attractive to residents right now, especially residents with loans.”
Several participants also discussed the growing influence of a “shift work” mentality in medicine—an emphasis on predictable schedules and avoiding burnout, reinforced by limited duty hours for medical residents. They suggested that while not unique to nephrology, fellows’ expectations of predictable schedules make it more difficult to train them and may not set them up for successful practice:
“I find the shift and the expectations of the fellows in terms of their responsibilities and their willingness to sit around and learn about the basics of nephrology as opposed to get out of the hospital on time.”
“…If you look at what’s evolved over the last 5 or 6 years with the new work hours and stuff, residents are not what they used to be. They do this on and off 16 hours, 20 hours, 24 hours, depending on their PGY level, and even that keeps changing every couple of years. I doubt that many of our current residents who graduate will be able to face the workload once they come out in the private world, especially as hospitalists. Unfortunately, the mindset has changed over the last few years. The standards have gone down and with those lower standards, intensive fellowships are no longer that much.”
“I do notice, there’s a definite shift in the attitude of nephrologists coming out of training and expecting a particular lifestyle. They want to leave at 5:00. They don’t like coming in at night. When they take call at night, I end up coming in early in the morning because I know that there are going to be admissions left over that they haven’t seen during the night, which is something that I would have never done.”
Rewards of Working as a NephrologistDespite the many challenges they perceived facing the specialty, participants stated that nephrology was also a very rewarding specialty. They especially valued the deep relationships they have formed with patients through many years of frequent contact:
“Although you hear grousing, I love what I do. They have made it harder to do what I do, but I love it. It is very rewarding to have the longitudinal, week to week relationship [with patients]. This is important to transmit to the next generation.”
The Nephrology Workforce 2015 #NephWorkforce | 27
“It’s a very rewarding specialty. I have followed patients for 20 years and you see them with their transplants and back on dialysis and all their comorbidities. They’re so appreciative. I’m glad I chose this career and hopefully other people that are really motivated and want to do good will continue to choose it. It’s hard now because of the finances and all the regulatory things and everything that’s going on. I’m happy I chose what I did. There’s a lot of opportunity.”
They also touted several other advantages of being a nephrologist relative to other specialties, including continuity of patient care (especially relative to hospital medicine), variety of opportunities, and intellectual challenge.
“There are all kinds of seeming advantages to hospital medicine. But continuity of patient care is not one of them. The nephrologists, particularly with CKD…and dialysis [patients], we have more continuity of care than any hospitalist ever sees.”
“It’s hard to understand why young people aren’t going into nephrology when you hear that there are more slots than applicants, which is heartbreaking because it’s such a great field. There’s probably no other area that’s so rewarding, where you can have so many choices. You can do acute care medicine. You can work in the office. You can do the thing you want. You can go into hospital administration because you have a whole breadth of knowledge. I don’t think we understand actually why people aren’t choosing nephrology.”
One even suggested that these features may help the specialty to recruit hospitalists when they tire of the pace and constantly changing patient population in hospital medicine:
“…We could make a lot of inroads into recruiting hospitalists, because they do burn out. They get tired of seeing patients one time and then out. They’re interested in the more lasting relationships that we get. They also see nephrologists in the hospital, where we shine in terms of our intellectual property.”
Several large organizations dominate the delivery of kidney dialysis services in the U.S. Their decisions on the design of services, staffing levels, recruitment and retention can directly impact on the demand and use of nephrologists. We interviewed leaders of three major dialysis organizations and present the findings under the themes of: supply and demand; maldistribution; how nephrologists spend their time; gaps in skills and knowledge; NPs and PAs; payment issues; changes anticipated in the future; and redesign of the nephrologist “career.”
Supply and Demand for NephrologistsNone of the three organizations anticipated a fall in their demand for nephrologists going forward.
“Yes, we could place 25 nephrologists tomorrow. [The current fellowship graduation rate of] 450 is adequate based on the number of retirees.”
“The need for nephrologists is not diminishing—not using them less, but using them differently.”
“[It’s a] small population we’re concentrating on. If you carve out those nephrologists who are going to stay in academic settings or pharma, we have a growing need given expected retirements. So I think there is a need for more nephrologists, not less.” One organization suggested that, given the relevant specialized nephrologist skillset, demand could grow a lot more “[and then] we could use all 450 [annual fellowship graduates]!”
There was also a view that the specialty was changing, influencing demand in subspecialty areas:
“[We] can expect more subspecialty needs for nephrologists—e.g. palliative care, interventionists, medical directorships.”
When asked whether the specialty had a hard time attracting high quality applicants, one response was:
“Yes. The ability to monetize the specialty is going away, but there are also lifestyle issues with working hard to cover multiple dialysis units.”
Findings from Interviews with Major Dialysis Providers
28 | The Nephrology Workforce 2015 #NephWorkforce
DistributionThe different job markets across the nation were seen as qualifying ideas about demand:
“There are three markets: tier 1 (i.e., NYC, Chicago, Miami, etc.), which is saturated; tier 2, which is 80% saturated (i.e., Boise Idaho, Charleston SC); and tier 3, the rural markets, which are wide open. Many nephrologists will accept less income to go to tier 1—e.g., they have spouses who are also physicians.”
“I agree there is maldistribution. Our dialysis system is a universal one, yet there is not the same degree of opportunity for nephrologists.”
The distributional issues would be even worse but for IMGs:
“IMGs are much more willing to go into rural areas and make a name for themselves.” Although, “We don’t know what to make of [the numbers] trend yet. We may need to wait a few years and see where it goes.”
All the dialysis organizations used incentives to recruit to less desirable areas. Nevertheless, it was unclear how much of an impact even the large dialysis organizations could have on maldistribution:
“Yes, we usually offer a 2–3 year guaranteed salary as well as quality bonuses (private dialysis doesn’t do this). The overall quality package is extremely robust and competitive but it gets back to the lifestyle issues for US graduates.”
“Yes, all kinds of guarantees and incentives.”
“We try to target areas where there is poor access to care (mainly rural areas)—it has been difficult to get coordinated teams in some of these markets.”
“Where nephrologist supply is limited, hospitalist is a popular career and easy to recruit to.” “In the past [we have] looked to put nephrologists in underserved areas but couldn’t achieve this. The new strategy is based on choosing areas where they believe they can be successful. We were accused by government of packing the market to make more money from dialysis. We’re now forced to follow the free market. We would love to [be playing an important role in this] but there is no support for nephrologists in rural communities and payers are as much at fault. Wyoming, Nebraska, Idaho—nephrologists can’t make a living there, there is not enough population to keep them going. In the past they used to split work between nephrology and internal medicine, but new nephrologists are not willing to do that.”
How do nephrologists spend their time and how is this changing?There was a strong view that the nephrologist’s role was changing rapidly. Much of this was attributed to changes in the way the specialty saw itself:
“The percentage of nephrologist time used to be 1/3 each for dialysis, outpatient and hospital, but dialysis time is increasing (though extenders help), and now dialysis is up to 50% as they have abdicated responsibility for the ICU.”
“Changes observed include using fewer nephrologists and those still working are working harder to maintain their income, leaving less time for dialysis patients. Face time with patients at centers is 54 seconds per visit. They have developed a set of algorithms that everyone accepts so that dieticians, etc. are spending most of the care with patients, driven by protocols, doing workarounds.”
“[Non-kidney care by nephrologists is a] mix between nephrology and cardiology (electrolytes etc.). Nephrologists are not taking care of these complex conditions as they used to—they were the white knight who showed up to take care of the complicated patient.”
Opportunities existed to define nephrologist roles better or extend into areas where they could make a difference to care quality:
“In integrated care you need to define the roles of the practitioners. There is more opportunity to coordinate if they want to go beyond a care delivery role.”
“I think we have poor involvement in nephrology-related end-of-life care.”
The view was that nephrologists needed not to work harder but to work smarter:
“From our analysis of how a nephrologist spends their time they spend 70% of time with CKD and other time not well spent.”
Gaps in Skills and KnowledgeThe changing role of nephrologists exposed gaps in skills and knowledge:
“Being a leader of a team requires interdisciplinary training, but new nephrologists are not well prepared for this role. Nephrologists need greater awareness of population health and tools more associated with epidemiology and public health.”

The Nephrology Workforce 2015 #NephWorkforce | 29
“The degree to which nephrologists become more competent at managing cardiovascular aspects of care—[there’s a] big training gap there.”
“Physicians we work with need to have an expectation of looking at how their clinical care is delivered efficiently, not just what the care is. Our medical directors recognize they can’t give that up to anyone else—they have already given up a lot, e.g., biopsy, line placement.”
Dialysis organizations were concerned about the adequacy of current training:
“They are not being taught adequately. Would we be better off with fewer training programs of higher quality? I don’t know, I tend to blame academic institutions for lack of mentoring. The giants in nephrology aren’t doing the teaching, they are diverted into other things as grants have dried up, meaning academics have to spend more time in clinics and less in teaching.”
“Nephrologists do manage a complex population—are we training people for this role (e.g., are they chronic care managers, nephrologists, or cardiologists?) We don’t have a clear plan for getting ready for this.”
NPs and PAsThere was strong evidence of widespread use of NPs and PAs as physician extenders and support for further expansion of this role. This was seen as having the potential to make the nephrology profession more efficient and more attractive:
“There’s lots of room to grow the use of extenders. A more productive use of extenders could improve salaries of nephrologists.”
“Rounds that were 2 [times] weekly are now 1 [time] weekly, or even monthly now using extenders. This is not leading to push back from nephrologists.”
“Yes, if 8 arms are needed, 6 of them will be from advanced practitioners. Then the nephrologists can manage the outliers while the NPs/PAs manage the standard pathway patients.”
“I would prefer 1 nephrologist and 3 NPs/PAs rather than 4 nephrologists. PAs and NPs are roughly equivalent.”
“NPs can do the CKD work. If you link a financial model to physician extenders nephrologists get real happy…Nephrologists say it is a quality issues but really it’s also a hubris issue. They need to get over this…We are one of the last specialties to do this, we are among the lowest users of NPs. It’s a generational issue. Younger docs see more NPs in the academic setting so are less resistant.”
Although NPs and PAs had training needs, these were easily overcome:
“NPs and PAs are better prepared, but we have to teach them the practice and then they get it right—it’s a better model.”
Greater use of extenders was seen as one way to address maldistribution problems:
“Nephrologists created the market one or two generations ago when the market was saturated. We could take the tier 1 markets and utilize physician extenders to drive nephrologists into tier 2 or 3. NPs can do the CKD work.”
There was a possible role for dialysis organizations in encouraging nephrologists to make more use of extenders, but there was also evidence of resistance to this change:
“[We are] helping them find NPs, PAs, etc. to help with rounds, and offering them training as physician extenders. The aim is for nephrologists to take care of the things the protocol doesn’t cover—e.g., depression.”
“From our analysis of how a nephrologist spends their time they spend 70% of it with CKD and other time not well spent. They could allocate that work to a physician extender except that (i) there aren’t enough extenders available, and (ii) not enough nephrologists are convinced about that business model, so most practice don’t utilize extenders widely.”
“Protocols can free up nephrologists to do the exciting stuff, and we have been sending guys to practices to assist and write protocols, but few are taking up the offer.”
Payment issuesThere was concern about the perceived mismatch between payment models and incentivizing improvements in nephrology practice:
“The nephrologist gets a monthly capitation fee, based on geographic area, around $300 per patient. The payment requires weekly rounds by the nephrologist or extender. The payment is the same regardless of time spent with patients.”
“Bundle regulations were good as it led to a push for measures they hadn’t looked at before and has improved quality. I didn’t like the 1973 change, which stunted where they could have been, but I really do like the bundle.”

30 | The Nephrology Workforce 2015 #NephWorkforce
“If payment is the same regardless of advancement in technology, then technology will not advance. There has been no real breakthrough in technology for nephrology.”
Changes anticipated in the futureAnticipated future changes included a continued upward trend in home dialysis and more interest in population health and other changes driven by value-based payment, some good and some less good.
Home therapy
“We expect more home therapy. It helps drive down the cost of the bundle.”
“We have gone from 9% home care to 18% and still rising.”
Value-based payment
“The fundamental and accelerating change in how practice is provided through value-based payment ... requires much greater awareness of patient behavior. [Patients are] only in clinical contact for 7% of their day so their own decisions impact 93%, with huge implications for outcomes. This means we have to build care around how a chronically ill patient avoids going into crisis. This requires an enormous degree of coordination e.g. between medical specialties – every medical decision has impact on the patient’s renal disease. The ability to diagnose and treat is only part of the issue of care.”
“Management of clinical algorithms will expand—we are not training people to manage this.”
Population Health
“I think the population needing care is growing, and I expect larger care teams under that model.”
“I see a lot of insurers managing general populations and trying to avoid managing the high-cost population.”
Participants had less expectation of changes in technology and transplants.
Technology
“The likelihood is thin for major technological advances in 5 years, and not much better over 10 years. Innovation in care delivery, everything is moving towards integrated chronic care. The barrier is that patients are under Medicare, so we’re waiting for them to allow this change. Biosimilars may have an important impact on total cost of care, but not much impact on quality.”
“Don’t see any earth-shaking technology changes coming in dialysis. But, there is movement of patients into the home or other more local things. Online monitoring technology is coming. Home care is now 11%, but we expect this to go to 20%–25% in next 5–10 years. Other technology changes will happen over longer timescales.”
Transplants
“There have been efforts to increase transplants for a long time, but not much progress. Transplants are good for patients and it would lead to a need for strong, community-based care coordination for transplant patients. However, failing transplant patients don’t do any better than new patients and that number is large. Did 4700 transplants last year and 3500 were returning, so almost at net zero. [Improved technology may help, but] the payment system is not yet designed to desensitize patients very well, but once we have a full bundled payment environment there may be more opportunities.”
The nephrologist “career” needs to be redesignedOne of the strongest messages from the dialysis organizations was the need for a fundamental redesign of the nephrologist career:
“I’m very disappointed with where nephrology has gone. They used to take full responsibility for complex and very sick patients both in hospital and at home. Now nephrologist hands admitting patients over to the hospitalist; some patients he hands to the pulmonary specialist. Now just takes care of chronic patients—fellows are not seeing management of complicated, really sick patients—the hero model is not there. It is becoming a different specialty.”
“This is not the career that I had, but how does a nephrology career look attractive to a graduate now?”
“We need to redesign the nephrology career. Demand has gone down for a reason, and the career doesn’t look like it should. We need to think through what a nephrology career looks like for a new graduate.”
“The concern is that nephrologists may give up their leadership role in the care of that portion of the population.”

The Nephrology Workforce 2015 #NephWorkforce | 31
IntroductionOverall data on the need for nephrology services suggests a modest growth rate for ESRD services, based on rising prevalence rates, and likely larger if population increases are also taken into account. CKD, although of greater prevalence than ESRD, does not place the same demands on nephrologists’ time. Expected increases in supply and productivity may be enough to compensate for increasing need due to higher prevalence of kidney disease, though this does not on its own address the maldistribution problems identified elsewhere in this report.
Prevalence of CKDCDC estimates that more than 20 million US adults aged 20 years or older have CKD (Centers for Disease Control and Prevention, 2015). As Exhibit 18 shows, US CKD prevalence rates during the period 2007–12 were 5.7% for individuals aged 20–39 years, 8.9% in individuals aged 40–59 years, and 33.2% in individuals aged ≥60 years. Prevalence rates have increased in all age groups from the 1988–94 period when the corresponding prevalence figures for the three age groups were 5.1%, 8.4%, and 32.2%, respectively. However, prevalence of CKD in all three age groups has fallen since the 1999–2004 period (when the corresponding figures were 5.9%, 9.8% and 37.5%). The prevalence rate of CKD among African Americans has been consistently higher than for other racial/ethnic groups and has increased over time. In 2012, the prevalence of CKD for African Americans across age groups was 15.9%.
Trends in the Incidence and Prevalence of Kidney Diseases and Injury
Exhibit 18. CKD Prevalence in NHANES Population 1998–2012
Source: US Renal Data System 2014 Annual Data Report Table 1.3 (http://www.usrds.org/2014/download/vol1_01_GenPop_14_slides.pptx)The data reported here have been supplied by the United States Renal Data System (USRDS). The interpretation and reporting of these data are the responsibility of the author(s) and in no way should be seen as an official policy or interpretation of the U.S. government.

32 | The Nephrology Workforce 2015 #NephWorkforce
Trends in Mortality in CKD PatientsMortality rates for CKD patients have declined continuously over the past 2 decades, a fall even greater than that of mortality rates in non-CKD patients (albeit leaving mortality rates still higher for CKD Medicare patients than for non-CKD Medicare patients).
Incidence of ESRDIncidence rates for ESRD, which were trending rapidly upwards in the later years of the 20th century, have flattened and even reversed during the 21st century. Incidence rates in the 45–64 years and 65–74 years age groups reached a peak around the year 2000; rates for the ≥75 years age group reached a peak around 2008. Nevertheless, the number of new cases of ESRD has continued to trend upwards in the 45–64 years age group and, to a lesser extent, in the 65–74 years age group.
Exhibit 19. Unadjusted and Adjusted All-Cause Mortality Rates for Medicare Patients Aged ≥66 Years
Exhibit 20. Trends in ESRD Incidence by Age Group 1980–2012
Source: US Renal Data System 2014 Annual Data Report Fig. i.7 (http://www.usrds.org/2014/download/vol1_i_CKDIntro_14_slides.pptx)
Source: US Renal Data System 2014 Annual Data Report Fig. 1.4(a & b) (http://www.usrds.org/2014/download/Vol2_01_Inc-and-Prev_14_slides.pptx)
(b) Incidence Rates
(a) Incident Cases
(a) Unadjusted
(b) Adjusted

Prevalence of ESRDPrevalence of ESRD is a result of changes in incidence rates, population growth (particularly of the African American population, which has two to three times the incidence rate of other racial groups), and improvement in survival rates.
The number of prevalent cases of ESRD in the U.S. reached almost 637,000 in 2012, showing a continuous upward trend from well below 100,000 in 1980. Of the prevalent cases, 409,000 were receiving hemodialysis, 186,000 were transplant survivors, and 41,000 were receiving peritoneal dialysis.
Exhibit 21. Trends in ESRD Incidence by Race 1980–2012
Exhibit 22. Trends in ESRD Prevalence by Modality 1980–2012
Source: US Renal Data System 2014 Annual Data Report Fig. 1.5 (http:// www.usrds.org/2014/download/Vol2_01_Inc-and-Prev_14_slides.pptx) The line for Native Americans has a discontinuity because of unreliable data for that year. Abbreviations: Af Am= African American; Blk=black; ESRD=end stage renal disease; N Am=Native American.
Source: US Renal Data System 2014 Annual Data Report Fig 1.10 (http://www.usrds.org/2014/download/Vol2_01_Inc-and-Prev_14_slides.pptx)
(b) Incidence Rates
(a) Incident Cases
The Nephrology Workforce 2015 #NephWorkforce | 33
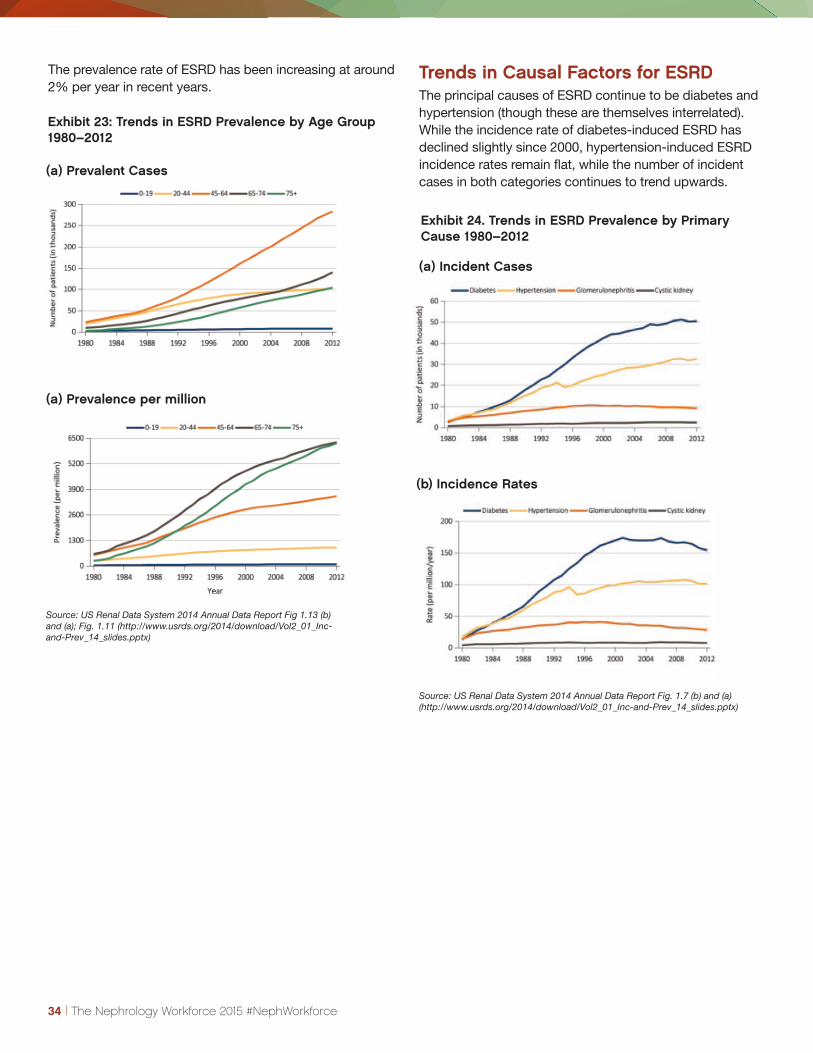
34 | The Nephrology Workforce 2015 #NephWorkforce
The prevalence rate of ESRD has been increasing at around 2% per year in recent years.
Trends in Causal Factors for ESRDThe principal causes of ESRD continue to be diabetes and hypertension (though these are themselves interrelated). While the incidence rate of diabetes-induced ESRD has declined slightly since 2000, hypertension-induced ESRD incidence rates remain flat, while the number of incident cases in both categories continues to trend upwards.
Exhibit 23: Trends in ESRD Prevalence by Age Group 1980–2012
Exhibit 24. Trends in ESRD Prevalence by Primary Cause 1980–2012
Source: US Renal Data System 2014 Annual Data Report Fig 1.13 (b) and (a); Fig. 1.11 (http://www.usrds.org/2014/download/Vol2_01_Inc-and-Prev_14_slides.pptx)
Source: US Renal Data System 2014 Annual Data Report Fig. 1.7 (b) and (a) (http://www.usrds.org/2014/download/Vol2_01_Inc-and-Prev_14_slides.pptx)
(b) Incidence Rates
(a) Incident Cases
(a) Prevalent Cases
(a) Prevalence per million

The Nephrology Workforce 2015 #NephWorkforce | 35
Impact of the Affordable Care ActThe impact of the ACA on kidney disease incidence and prevalence is not yet clear. In the longer term the increase in insurance coverage for low-income adults brought about by the ACA may lead to better control of diabetes and hypertension, reducing incidence rates (and future prevalence) of ESRD. More immediately, increased insurance may improve survival rates for ESRD patients, which may also contribute to an increase in prevalence. Additionally, the ACA creates incentives for efficiency improvements in care delivery, which may result in nephrologists’ practice being concentrated on those
patients where their expertise is most needed and can make the greatest difference. The balance between these three impact factors of the ACA is uncertain, and in any case would have to be considered alongside population increases in order to fully assess future demand for nephrologists.
Some of the impact of improved health care delivery can be seen in historical improvements in kidney disease risk factors. For example, the percentage of people with untreated hypertension (Unaware and Aware, not treated) decreased from 48.1% in 1988–1994 to 29.0% in 2007–12.
Exhibit 25. Awareness, Treatment, and Measures of Control of Risk Factors 1998–2012
Source: US Renal Data System 2014 Annual Data Report Vol. 1 Table 1.4 - slide 16 (http://www.usrds.org/2014/download/vol1_01_GenPop_14_slides.pptx)

36 | The Nephrology Workforce 2015 #NephWorkforce
Next StepsNephrology is facing a number of workforce challenges in the coming years. The GW Health Workforce Institute in consultation with ASN will be continuing to investigate a range of workforce issues in the coming year. Among the priorities are the following.
1. Assess results of implementation of the NRMP SMS “all-in” policy: The GW research team will be reviewing closely the impact of the new all-in policy on the number and location of physicians entering nephrology, as well as the background of the new entrants. In all likelihood it will take several years to assess the impact. Another closely related development is the decrease in entrants over the past 2 years. If this trend continues it could make it challenging for many programs to fill their positions but it could also allow the specialty to be more selective in selecting fellows. The impact of the change in policy needs to be monitored closely.
2. Report on 2015 Survey of Nephrology Fellows Completing Training: While this report includes preliminary findings related to their experience in the job market, the Health Workforce Institute will prepare a more complete report on the findings from the survey. This will include additional information on the demographics of the fellows and their plans. It will also include an assessment of migration patterns of fellows from their fellowship into practice, which will help us better understand the relationship between location of fellowship program and location of practice.
3. Undertake a more detailed assessment of supply, demand, and distribution of nephrologists over the next decade: There are a number of developments, including the new Match policy and potential changes in delivery and financing, that could impact the supply and demand for nephrologists. The GW research team will collaborate with the Sheps Center at the University of North Carolina, which has been developing a new model to project physician supply and demand, to better assess likely future needs.
4. Further review distribution and access issues across the country: As indicated in Chapter 3 of this report, there is great variation in the number of ESRD patients per nephrologist in different HRRs. The Health Workforce Institute will explore approaches to assessing whether HRRs with high ratios of patients per nephrologist experience greater difficulty accessing nephrology services. This may include a review of Medicare claims data.
5. Continue to assess changes in delivery and financing of kidney care: Efforts to change the delivery system for kidney care through changes in Medicare policies have the potential to have a significant impact on the nephrology workforce.
ACGME. Data Resource Book for Academic Year 2013-2014. Chicago, IL: ACGME, 2014.
American Medical Association Physician Masterfile. Accessed April 15, 2014.
Armstrong D, Chung R, Forte GJ. 2014 New York Residency Training Outcomes: A Summary of Responses to the 2014 New York Resident Exit Survey. Rensselaer, NY: Center for Health Workforce Studies, School of Public Health, SUNY Albany; 2015.
Centers for Disease Control and Prevention. Chronic Kidney Disease: Issue Brief. Atlanta, GA: US Department of Health and Human Services, Centers for Disease Control and Prevention; 2015. Available at http://www.cdc.gov/diabetes/pdfs/programs/CKDBrief.pdf.
Centers for Disease Control and Prevention (CDC). Chronic Kidney Disease Initiative–Protecting Kidney Health. Atlanta, GA: US Department of Health and Human Services, Centers Disease Control and Prevention; 2015.
NRMP. National Resident Matching Program, Results and Data: Specialties Matching Service 2015 Appointment Year. Washington, DC: National Resident Matching Program, 2015.
Saran R, Li Y, Robinson B, et al. US Renal Data System 2014 annual data report: epidemiology of kidney disease in the United States. Am J Kidney Dis. 2015;66(1)(suppl 1):S1-S306.
References
The Nephrology Workforce 2015 #NephWorkforce | 37
