australian nephrology workforce reportfor anzsn · australian nephrology workforce survey: 2007 i...
TRANSCRIPT
AUSTRALIAN NEPHROLOGY WORKFORCE SURVEY: 2007
i
THE AUSTRALIAN
NEPHROLOGY WORKFORCE
SURVEY 2007
A REPORT FOR THE
AUSTRALIAN & NEW ZEALAND SOCIETY OF NEPHROLOGY
Cathie Lane
Funding Support
ANZSN
NH&MRC Scholarship (#351031)
© Cathie Lane 2008.
ISBN: 978-0-9805689-0-5
AUSTRALIAN NEPHROLOGY WORKFORCE SURVEY: 2007
ii
TABLE OF CONTENTS
THE AUSTRALIAN NEPHROLOGY WORKFORCE SURVEY 2007 i
A REPORT FOR THE i
AUSTRALIAN & NEW ZEALAND SOCIETY OF NEPHROLOGY i
TABLE OF CONTENTS ii
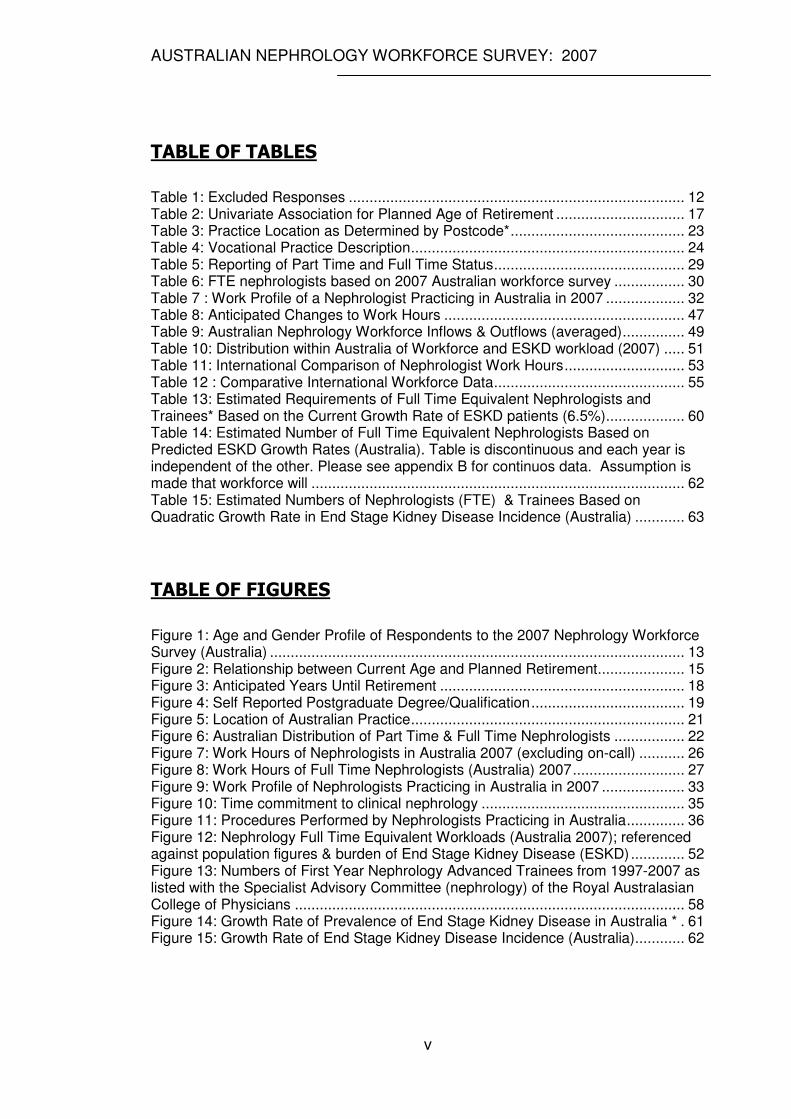
TABLE OF TABLES v
TABLE OF FIGURES v
Key issues in this report: vi
Australian Nephrology Workforce Survey 2007 1
ACKNOWLEDGEMENTS 1
INTRODUCTION 2
Aims and Objectives 3
Limitations 3
METHODS 4
Ethics Approval 4
Subjects 6
Instrument 6
Procedure 6
Preparation of Results and Exclusions: 8
Geographical Classifications of Work Location 8
Statistical Analysis 10
RESULTS 11
Response Rate and Exclusions 11
Participant Demographics 12
AUSTRALIAN NEPHROLOGY WORKFORCE SURVEY: 2007
iii
Age and Gender 12
Family Situation and Dependents 14
Retirement Plans 14
Training and Qualifications 18
Specialisation 20
Site of Practice 21
Geographical Provision of Nephrology Services 22
Rural and Remote Clinical Service 23
Work Hours 24
Practice Description 24
Hours Worked 24
On-Call Requirements 27
Work Type – full time & part time workers 27
Disagreement within Work Type 28
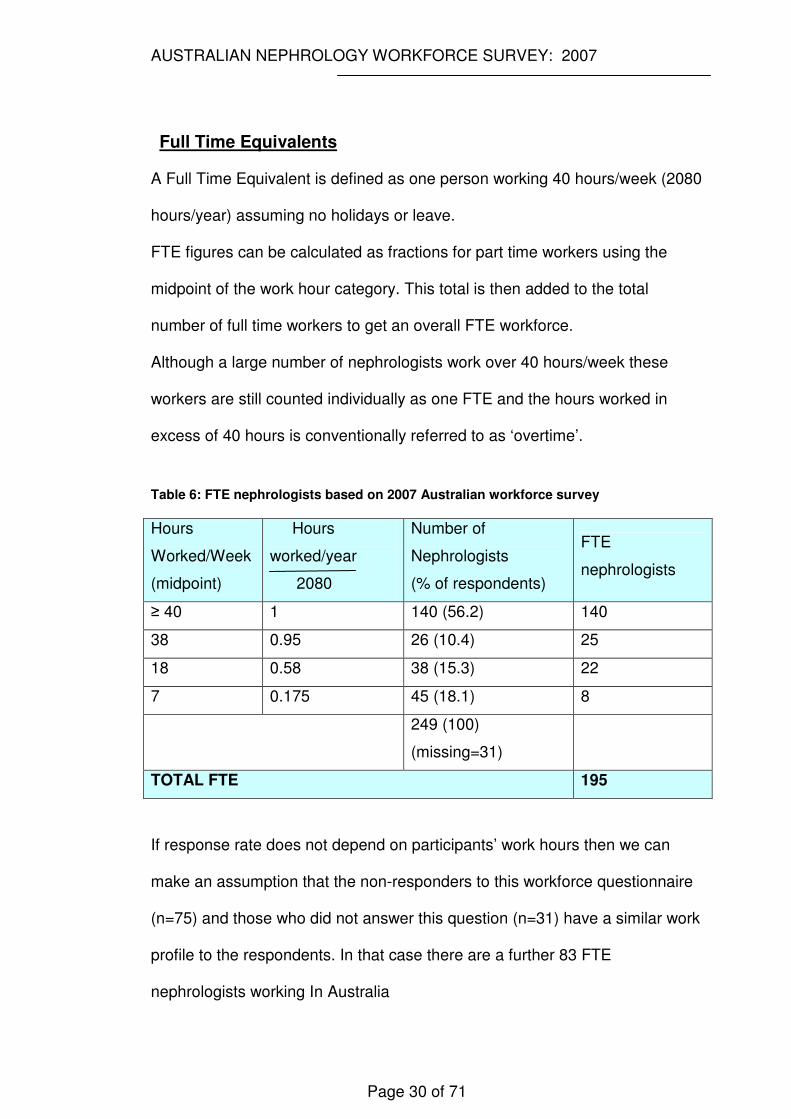
Full Time Equivalents 30
Future Work Plans 31
Ability to Control Work Hours 31
Job Description 32
Clinical Nephrology 35
Procedures 36
Qualitative Responses 37
Do you feel able to control your work hours? –Respondents who felt
unable to control work hours were requested to provide an explanation.
37
AUSTRALIAN NEPHROLOGY WORKFORCE SURVEY: 2007
iv
What do you see as the greatest issues impacting on nephrology
service provision? 39
Do any current regulations impact negatively on the care you are able
to provide to your patients? 42
DISCUSSION 44
Basic Anticipated Workforce Flow: 44
Workload 49
Hours Worked 53
Work Type 56
FUTURE NEPHROLOGY REQUIREMENTS IN AUSTRALIA 56
Advanced Trainee Requirements 57
Predicting Required Numbers of Future Nephrologists (FTE) in
Australia 59
CONCLUSION AND RECOMMENDATIONS 64
REFERENCES I
APPENDIX A III
APPENDIX B X
AUSTRALIAN NEPHROLOGY WORKFORCE SURVEY: 2007
v
TABLE OF TABLES
Table 1: Excluded Responses ................................................................................. 12 Table 2: Univariate Association for Planned Age of Retirement ............................... 17 Table 3: Practice Location as Determined by Postcode*.......................................... 23 Table 4: Vocational Practice Description.................................................................. 24 Table 5: Reporting of Part Time and Full Time Status.............................................. 29 Table 6: FTE nephrologists based on 2007 Australian workforce survey ................. 30 Table 7 : Work Profile of a Nephrologist Practicing in Australia in 2007 ................... 32 Table 8: Anticipated Changes to Work Hours .......................................................... 47 Table 9: Australian Nephrology Workforce Inflows & Outflows (averaged)............... 49 Table 10: Distribution within Australia of Workforce and ESKD workload (2007) ..... 51 Table 11: International Comparison of Nephrologist Work Hours............................. 53 Table 12 : Comparative International Workforce Data.............................................. 55 Table 13: Estimated Requirements of Full Time Equivalent Nephrologists and Trainees* Based on the Current Growth Rate of ESKD patients (6.5%)................... 60 Table 14: Estimated Number of Full Time Equivalent Nephrologists Based on Predicted ESKD Growth Rates (Australia). Table is discontinuous and each year is independent of the other. Please see appendix B for continuos data. Assumption is made that workforce will .......................................................................................... 62 Table 15: Estimated Numbers of Nephrologists (FTE) & Trainees Based on Quadratic Growth Rate in End Stage Kidney Disease Incidence (Australia) ............ 63
TABLE OF FIGURES
Figure 1: Age and Gender Profile of Respondents to the 2007 Nephrology Workforce Survey (Australia) .................................................................................................... 13 Figure 2: Relationship between Current Age and Planned Retirement..................... 15 Figure 3: Anticipated Years Until Retirement ........................................................... 18 Figure 4: Self Reported Postgraduate Degree/Qualification..................................... 19 Figure 5: Location of Australian Practice.................................................................. 21 Figure 6: Australian Distribution of Part Time & Full Time Nephrologists ................. 22 Figure 7: Work Hours of Nephrologists in Australia 2007 (excluding on-call) ........... 26 Figure 8: Work Hours of Full Time Nephrologists (Australia) 2007........................... 27 Figure 9: Work Profile of Nephrologists Practicing in Australia in 2007 .................... 33 Figure 10: Time commitment to clinical nephrology ................................................. 35 Figure 11: Procedures Performed by Nephrologists Practicing in Australia.............. 36 Figure 12: Nephrology Full Time Equivalent Workloads (Australia 2007); referenced against population figures & burden of End Stage Kidney Disease (ESKD)............. 52 Figure 13: Numbers of First Year Nephrology Advanced Trainees from 1997-2007 as listed with the Specialist Advisory Committee (nephrology) of the Royal Australasian College of Physicians .............................................................................................. 58 Figure 14: Growth Rate of Prevalence of End Stage Kidney Disease in Australia * . 61 Figure 15: Growth Rate of End Stage Kidney Disease Incidence (Australia)............ 62
AUSTRALIAN NEPHROLOGY WORKFORCE SURVEY: 2007
vi
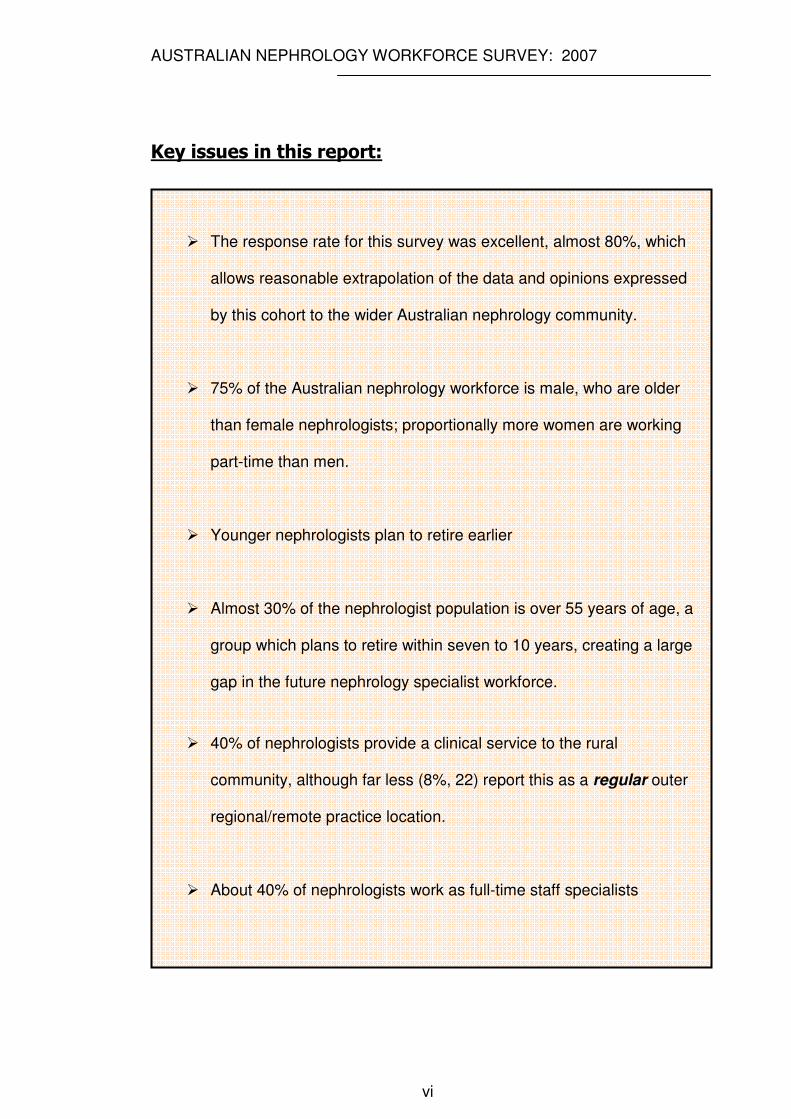
Key issues in this report:
� The response rate for this survey was excellent, almost 80%, which
allows reasonable extrapolation of the data and opinions expressed
by this cohort to the wider Australian nephrology community.
� 75% of the Australian nephrology workforce is male, who are older
than female nephrologists; proportionally more women are working
part-time than men.
� Younger nephrologists plan to retire earlier
� Almost 30% of the nephrologist population is over 55 years of age, a
group which plans to retire within seven to 10 years, creating a large
gap in the future nephrology specialist workforce.
� 40% of nephrologists provide a clinical service to the rural
community, although far less (8%, 22) report this as a regular outer
regional/remote practice location.
� About 40% of nephrologists work as full-time staff specialists
AUSTRALIAN NEPHROLOGY WORKFORCE SURVEY: 2007
vii
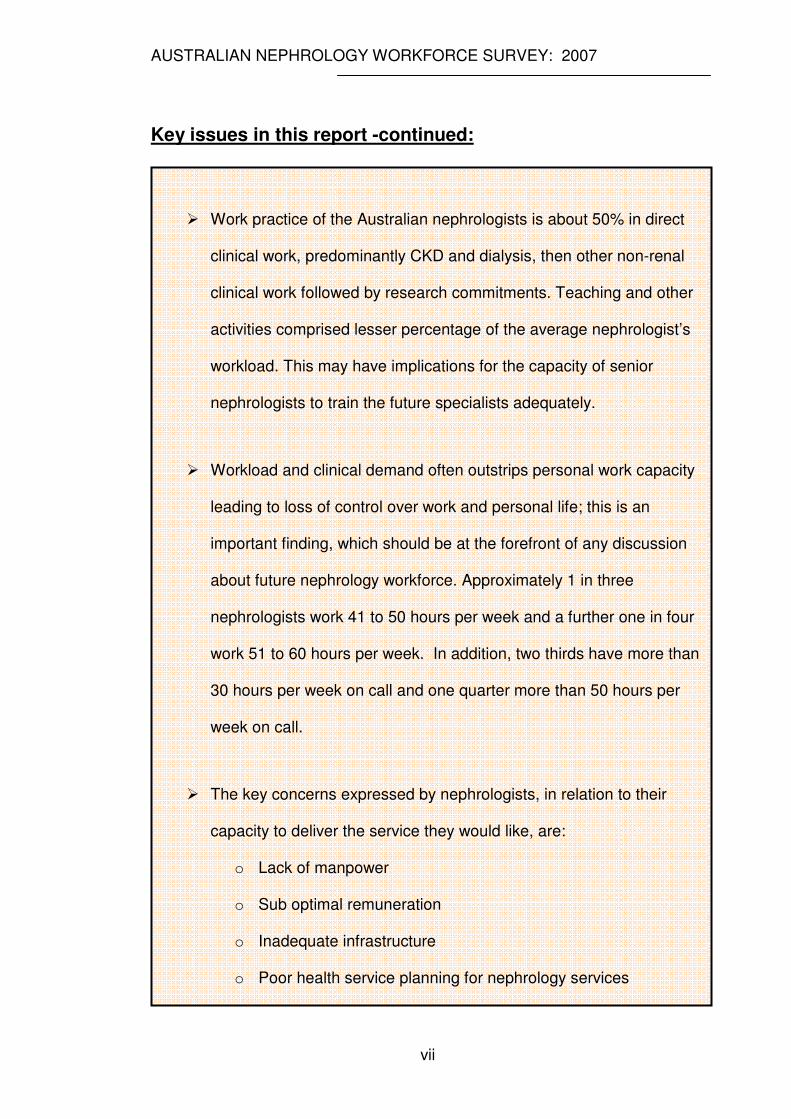
Key issues in this report -continued:
� Work practice of the Australian nephrologists is about 50% in direct
clinical work, predominantly CKD and dialysis, then other non-renal
clinical work followed by research commitments. Teaching and other
activities comprised lesser percentage of the average nephrologist’s
workload. This may have implications for the capacity of senior
nephrologists to train the future specialists adequately.
� Workload and clinical demand often outstrips personal work capacity
leading to loss of control over work and personal life; this is an
important finding, which should be at the forefront of any discussion
about future nephrology workforce. Approximately 1 in three
nephrologists work 41 to 50 hours per week and a further one in four
work 51 to 60 hours per week. In addition, two thirds have more than
30 hours per week on call and one quarter more than 50 hours per
week on call.
� The key concerns expressed by nephrologists, in relation to their
capacity to deliver the service they would like, are:
o Lack of manpower
o Sub optimal remuneration
o Inadequate infrastructure
o Poor health service planning for nephrology services
AUSTRALIAN NEPHROLOGY WORKFORCE SURVEY: 2007
viii
Key issues in this report -continued:
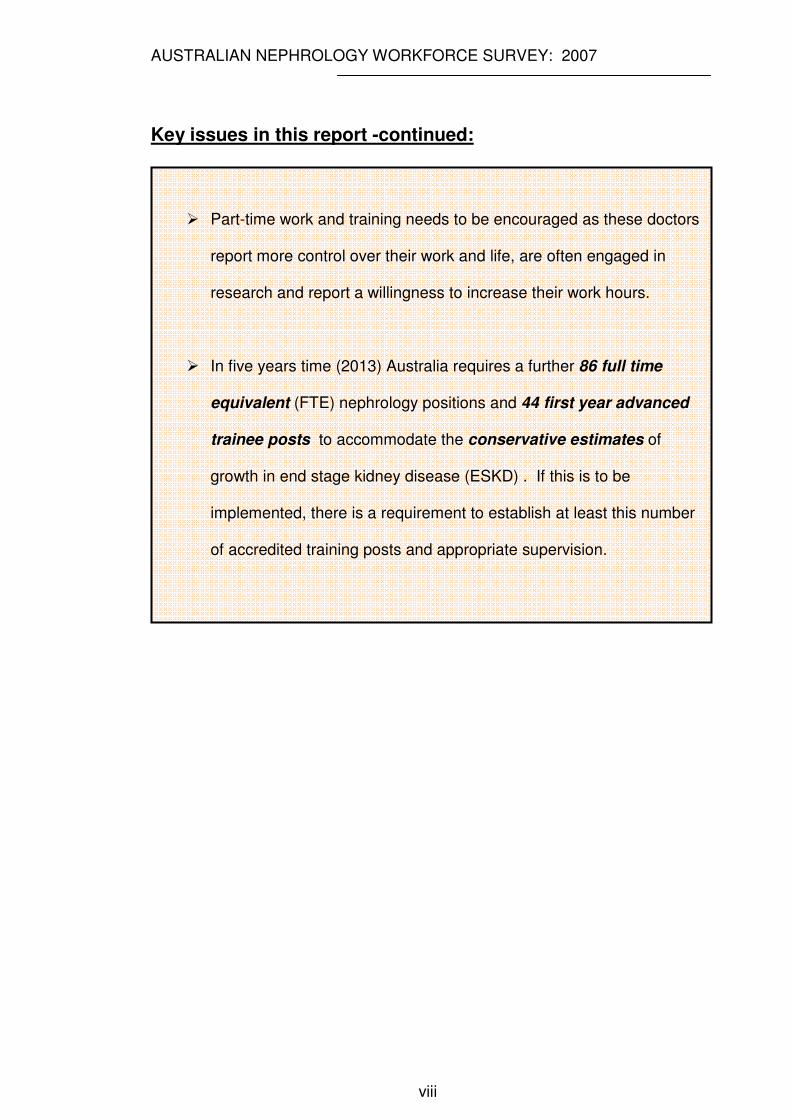
� Part-time work and training needs to be encouraged as these doctors
report more control over their work and life, are often engaged in
research and report a willingness to increase their work hours.
� In five years time (2013) Australia requires a further 86 full time
equivalent (FTE) nephrology positions and 44 first year advanced
trainee posts to accommodate the conservative estimates of
growth in end stage kidney disease (ESKD) . If this is to be
implemented, there is a requirement to establish at least this number
of accredited training posts and appropriate supervision.

AUSTRALIAN NEPHROLOGY WORKFORCE SURVEY: 2007
Page 1 of 71
Australian Nephrology
Workforce Survey 2007
ACKNOWLEDGEMENTS
Scholarship funding from the National Health and Medical Research Council
of Australia (# 351031)
Support both financial and in spirit from ANZSN. Special thanks to A/Prof
Randall Faull, Dr Helen Pilmore and Mrs Aviva Rosenfeld.
Mr Luc Betbeder-Matibet from the medicine computing support unit, faculty of
medicine, University of New South Wales.
Professor Mark Brown (PhD supervisor) and A/Prof Maria-Theresa Ho (PhD
Co-Supervisor)
Staff of the Royal College of Physicians. Special thanks to Ms Joan Wong,
nephrology Specialist Advisory Committee support.
Md Bayzidur Rahman -Statistical support.
Special thanks to all nephrologists who took the time to complete the
workforce survey
Some of the data reported have been supplied by the Australia and New
Zealand Dialysis and Transplant Registry. The interpretation and reporting of
these data are the responsibility of the author and in no way should be seen
as an official policy or interpretation of the Australia and New Zealand Dialysis
and Transplant Registry.
AUSTRALIAN NEPHROLOGY WORKFORCE SURVEY: 2007
Page 2 of 71
INTRODUCTION
This survey arose from work related to a PhD thesis examining the nephrology
training program in Australia. From an earlier questionnaire in the basic
physician trainee population, examining motivators and detractors surrounding
a career in nephrology, the issue of excessive workloads and insufficient
manpower was highlighted. This was reinforced by a general perception in the
nephrology community that workloads were increasing and a concern that
nephrology recruitment did not seem to be keeping pace with the workload
demands. To deliver good health care there must be an adequate workforce.
In a specialty under workforce pressure both locally and internationally, two
central themes emerge from the nephrology literature: the inadequacy (and in
some cases non-existence) of workforce and workload data and the need for
urgent solutions stemming from a combination of improved work-practice
design and efficiency and increasing nephrology trainee numbers. 1 2. Without
an accurate assessment of the current workforce it will be impossible to
accurately project future workforce requirements. In Australia, prior to this
research, the only available nephrology workforce data was from an Australian
Medical Workforce Advisory Committee, (AMWAC) 3 4 which apparently
(although not explicitly) based the nephrology workforce statistics on
information from the ANZSN; and three questionnaire sources, (1) a personal
survey undertaken in 2004, by Associate Professor Randall Faull5, on behalf
of the ANZSN, as part of a 2005 submission to the Commonwealth
Productivity Commission 6, (2) a workforce analysis of the 2006 census data,
and (3) the 2005 data from the Australian Medical Labour Force Surveys
AUSTRALIAN NEPHROLOGY WORKFORCE SURVEY: 2007
Page 3 of 71
collected by the various medical boards on behalf of the Australian Institute
of Health and Welfare. Subspecialty listings were not routinely documented in
these latter two questionnaires leading to reporting errors with the nephrology
workforce clearly underestimated.
Aims and Objectives
The aim of this survey was to describe the current nephrology workforce in
Australia and to accurately represent its socio-demographic profile.
The research sought to be comprehensive, detailing planned retirements and
anticipated increases or decreases to workforce participation.
Qualitative information was sought to examine nephrologists’ ability to control
their work hours and their perception of issues impacting on the workforce in
this specialty area.
In Australia there have been some attempts to project the nephrology
workload (ANZdata registry reports and AIHW reports 7). However, without an
accurate assessment of the current workforce it will be impossible to
accurately project future workforce requirements and develop a
comprehensive strategy for tackling this workforce problem.
Limitations
No database exists which accurately captures all practicing nephrologists (or
generalist physicians with a nephrology component to their practice). For this
reason the total nephrologist population can only be estimated.
AUSTRALIAN NEPHROLOGY WORKFORCE SURVEY: 2007
Page 4 of 71
The Royal Australasian College of Physicians’ (RACP) first began recording
subspecialty listings with the implementation of the specialist advisory
committees (SACs) in the early 1970’s; as a result RACP databases only have
accurate specialty listings for the last 15-20 years and all fellows entering the
college prior to that were not specialty classified. Also fellows admitted to the
College as overseas trained physicians do not appear within the SAC
databases 8.
Likewise the various state/territory Medical Boards do not uniformly record or
require specialty listings.
It is considered the most complete listing of nephrologists is located with the
Australian and New Zealand Society of Nephrology (ANZSN), but it is
recognised that membership is voluntary and it is possible the database is not
a complete representation of the Australian Nephrology Community.
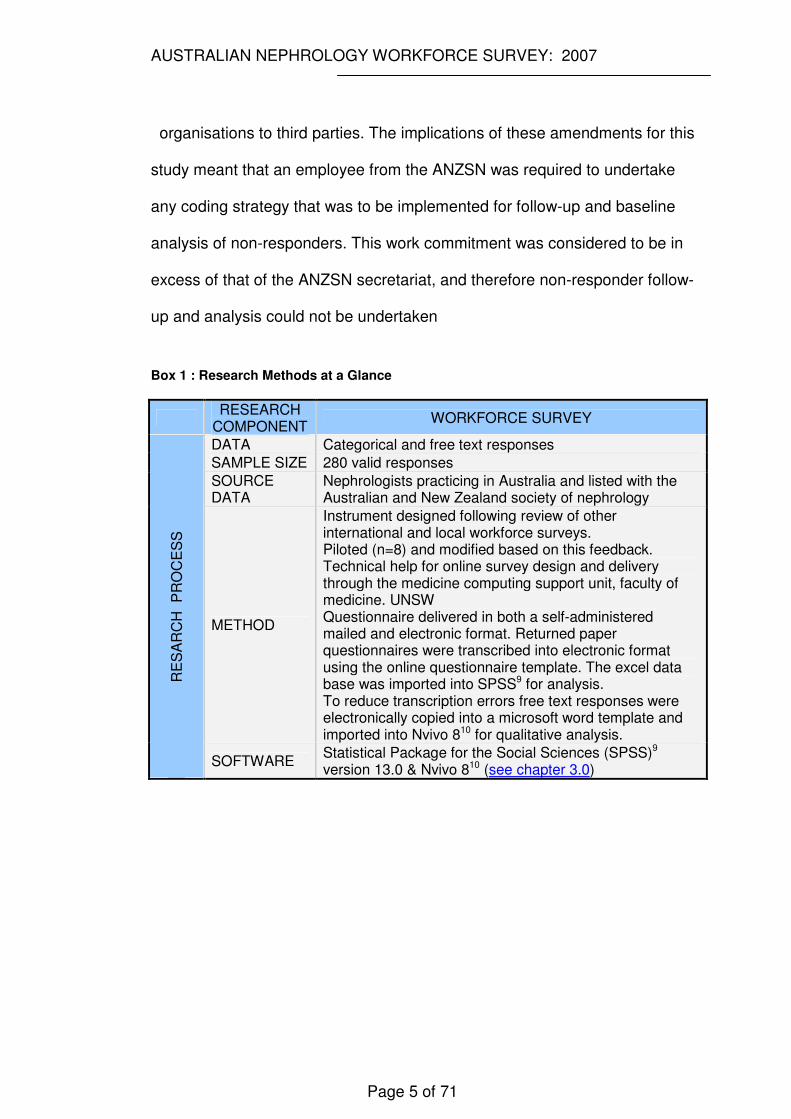
METHODS
A summary of the research method is provided in box 1.(page 5)
Ethics Approval
Ethics approval was obtained through the University of New South Wales.
(HREC 04155). The target of the questionnaire was Australian nephrologists.
The most accurate record of the target population was considered to be the
Australian and New Zealand Society of Nephrology (ANZSN). Although
supportive of this research endeavour, the amendments to the 2001 National
Privacy Act restricted disclosure of personal details recorded by private
AUSTRALIAN NEPHROLOGY WORKFORCE SURVEY: 2007
Page 5 of 71
organisations to third parties. The implications of these amendments for this
study meant that an employee from the ANZSN was required to undertake
any coding strategy that was to be implemented for follow-up and baseline
analysis of non-responders. This work commitment was considered to be in
excess of that of the ANZSN secretariat, and therefore non-responder follow-
up and analysis could not be undertaken
Box 1 : Research Methods at a Glance
RESEARCH
COMPONENT WORKFORCE SURVEY
DATA Categorical and free text responses
SAMPLE SIZE 280 valid responses
SOURCE DATA
Nephrologists practicing in Australia and listed with the Australian and New Zealand society of nephrology
METHOD
Instrument designed following review of other international and local workforce surveys. Piloted (n=8) and modified based on this feedback. Technical help for online survey design and delivery through the medicine computing support unit, faculty of medicine. UNSW Questionnaire delivered in both a self-administered mailed and electronic format. Returned paper questionnaires were transcribed into electronic format using the online questionnaire template. The excel data base was imported into SPSS9 for analysis. To reduce transcription errors free text responses were electronically copied into a microsoft word template and imported into Nvivo 810 for qualitative analysis.
RE
SA
RC
H
PR
OC
ES
S
SOFTWARE Statistical Package for the Social Sciences (SPSS)9 version 13.0 & Nvivo 810 (see chapter 3.0)
AUSTRALIAN NEPHROLOGY WORKFORCE SURVEY: 2007
Page 6 of 71
Subjects
Members of the ANZSN fulfilling the following criteria
� Living, residing and currently working in Australia as a nephrologist.
� Financial member of ANZSN
� Not retired
� Not a trainee/student member
� Not a corporate sponsor
� Not a life member/Honorary member unless continuing to practice as a
nephrologist.
Instrument
The instrument was designed by the principle researcher (Dr Cathie Lane)
after reviewing similar surveys delivered to medical practitioners both locally
and internationally.
Piloting was undertaken with seven nephrologists and one non-nephrologist
from various demographic profiles including members with known workforce
interests. Modifications to the instrument were made based on this feedback.
The time taken to complete the questionnaire ranged from 7 to 15 minutes
with an average of 8.5 minutes.
Procedure
Respondents were invited to participate by offering either a self administered
paper copy of the questionnaire or the opportunity to complete the
questionnaire electronically
(http://notes1-med.med.unsw.edu.au/surveys/renal.nsf/RecordPrefs?OpenForm)
AUSTRALIAN NEPHROLOGY WORKFORCE SURVEY: 2007
Page 7 of 71
Technical help for on-line survey design and delivery was provided by the
medicine computing support unit, faculty of medicine, University of New South
Wales. The self administered questionnaire was printed, collated and inserted
as a supplement with the proposed agenda for the annual general meeting for
the ANZSN – to be held during the annual scientific meeting. As
recommended by researchers in the area of questionnaire design, 11 12 13
project association with a respected organisation, in this case ANZSN, was
hoped to facilitate the response rate.
Both the initial email and postal questionnaires were sent on the 14th August
2007. To conform to privacy requirements, from the UNSW ethics committee
and the ANZSN, the principle researcher was not permitted to review email
lists or postal addresses from the ANZSN. Coding was therefore not
undertaken as it was felt to place an excessive strain on limited staff
resources of the ANZSN. The secretariat of the ANZSN (Mrs Aviva Rosenfeld)
posted all email requests and delivered postal addresses to printers. The
initial email posting was inadvertently sent to the total ANZSN membership
and was recalled from those members not eligible to participate in the study.
Despite the immediate recall, ineligible responses were posted and several
exclusions occurred. (see below)
When the response rate had fallen to two/day, an email reminder was sent
(22.08.07) to non-responders and those responders who had chosen not to
identify themselves. The reminder included the link to the electronic version
and apologised to members who had already responded, reminding them this
was inevitable if anonymity was to be preserved.
AUSTRALIAN NEPHROLOGY WORKFORCE SURVEY: 2007
Page 8 of 71
A further reminder occurred in September 2007 by inserting a copy of the
questionnaire and a reminder note into the conference bag of all delegates of
the 43rd Annual Scientific Meeting of the Australian and New Zealand Society
of Nephrology with instructions to be completed only by Australian
nephrologists. A collection counter was set up at the conference.
The survey went offline on 30.11.07; One hundred and seven days after
survey delivery. One further postal reply occurred after this date and was
included in the analysis.
Preparation of Results and Exclusions:
All categorical responses were automatically numerically coded and uploaded
into the database. Free text responses were uploaded unchanged. All
electronic results were exported into an excel spreadsheet by the medicine
computing support unit. A total of 82 participants (27%) replied using a postal
questionnaire. Postal questionnaire results were transferred into the electronic
database once by one support staff member using the online survey
instrument. The database was then reviewed for nonsensical entries and
multiple variable combinations [names (if provided), birthdates and site of
practice] were examined to exclude multiple responses from the same
respondent.
Geographical Classifications of Work Location
Geographical classifications of work locations were initially collected as
postcodes and then further defined based on the Australian Bureau of
AUSTRALIAN NEPHROLOGY WORKFORCE SURVEY: 2007
Page 9 of 71
Statistics (ABS), Australian Standard Geographical Classification (ASGC)
scheme. 14
The ASGC does not have a definition for metropolitan, outer-metropolitan,
rural or remote Australia, instead structures such as Section of State (SOS),
Urban Centres and Localities (UC/L) and Remoteness Areas (RA) can be
used to create these values. The ABS' Postal Areas (POA).are an
approximation of Australia Post Postcodes based on Census Collection
Districts (CDs) which are at the moment the smallest geographical unit in the
current Australian Standard Geographical Classification (ASGC). Postcodes
do not fit the ABS' ASGC so the ABS created POA to help match postcode
data to ABS geographies as best as possible. Concordance tables supplied by
the ABS, were used to convert postal areas which are an approximation of
postcodes into areas defined as Major City, Inner and Outer Regional,
Remote and Very Remote. The ABS does not currently have an official
definition of 'metropolitan', 'non-metropolitan'. Some sections within the ABS
have been using the current statistical geography to create their own version
of 'metropolitan/non metropolitan' however; these definitions are not official
ABS geographical definitions. The ABS is currently (2008) undertaking a
review of statistical geography and the definition of 'metropolitan/non-
metropolitan' is part of this review 15.
AUSTRALIAN NEPHROLOGY WORKFORCE SURVEY: 2007
Page 10 of 71
Statistical Analysis
The on-line results (incorporating electronic and the postal responses - see
‘Preparation of Results and Exclusions’) were converted into an excel
spreadsheet which was imported into SPSS (version 15.0) and analysed using
descriptive statistics. For convenience, SYSTAT was used to display two
graphics in preference to SPSS.
Simple frequency and percentage were reported for important variables.
Relevant univariate associations are presented through bar charts and line
graphs. To demonstrate differences of characteristics between two groups,
independent sample t-test was used to see whether the group means were
equal. If comparisons of means between more than two groups were required
the one way analysis of variance (ANNOVA) method was used. Wherever the
outcome data did not meet normality assumption non parametric equivalent of
t-test and ANNOVA were used to do the analysis (Mann-Whitney U test and
Kruskal-Wallis).
Simple and multiple linear regression analyses were used to investigate the
association between two variables while adjusting for the effect of others.
Unless non-responses were greater than 10%, the frequency percentage
calculations did not incorporate missing values.
Qualitative responses were thematically coded and analysed with NVIVO 7
software support.
AUSTRALIAN NEPHROLOGY WORKFORCE SURVEY: 2007
Page 11 of 71
RESULTS
Response Rate and Exclusions
The ANZSN membership includes practicing nephrologists, advanced
trainees, sponsors, honorary members and other interested clinicians (eg
endocrinologists and vascular surgeons). This survey was designed for
nephrologists both clinical and non-clinical. Of the total membership (659) at
the time, 355 respondents were eligible to participate. Respondents
totalled 301, however, as the initial email was posted to all members and then
recalled from those ineligible to participate there were 21 responses which
were subsequently excluded from the analysis. This resulted in 280 valid
responses providing a response rate of 79%.
Excluded entries incorporated six postal exclusions (four retirees, one
surgeon and one incomplete response converted to a complete electronic
response) and 15 electronic exclusions (two responses from New Zealand, six
nephrologists currently practicing outside Australia, one incomplete response,
four retirees and two nephrology advanced trainees)
Five respondents identified themselves as permanently leaving the workforce
but went on to describe various duties they still performed and so were
retained in the analysis, all other retirees who did not nominate duties related
to the nephrology workload were excluded from the analysis.
Exclusions were made on the following basis:
AUSTRALIAN NEPHROLOGY WORKFORCE SURVEY: 2007
Page 12 of 71
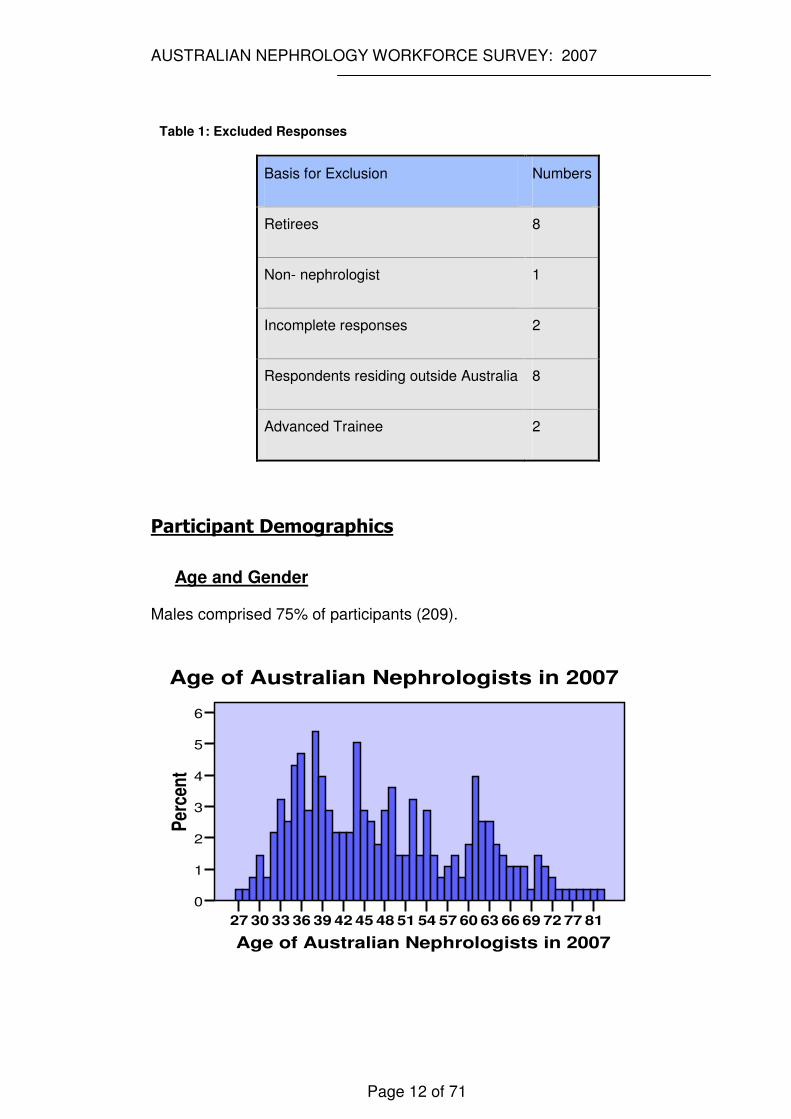
Table 1: Excluded Responses
Basis for Exclusion Numbers
Retirees 8
Non- nephrologist 1
Incomplete responses 2
Respondents residing outside Australia 8
Advanced Trainee 2
Participant Demographics
Age and Gender
Males comprised 75% of participants (209).
Age of Australian Nephrologists in 2007
817772696663605754514845423936333027
Per
cen
t
6
5
4
3
2
1
0
Age of Australian Nephrologists in 2007
AUSTRALIAN NEPHROLOGY WORKFORCE SURVEY: 2007
Page 13 of 71
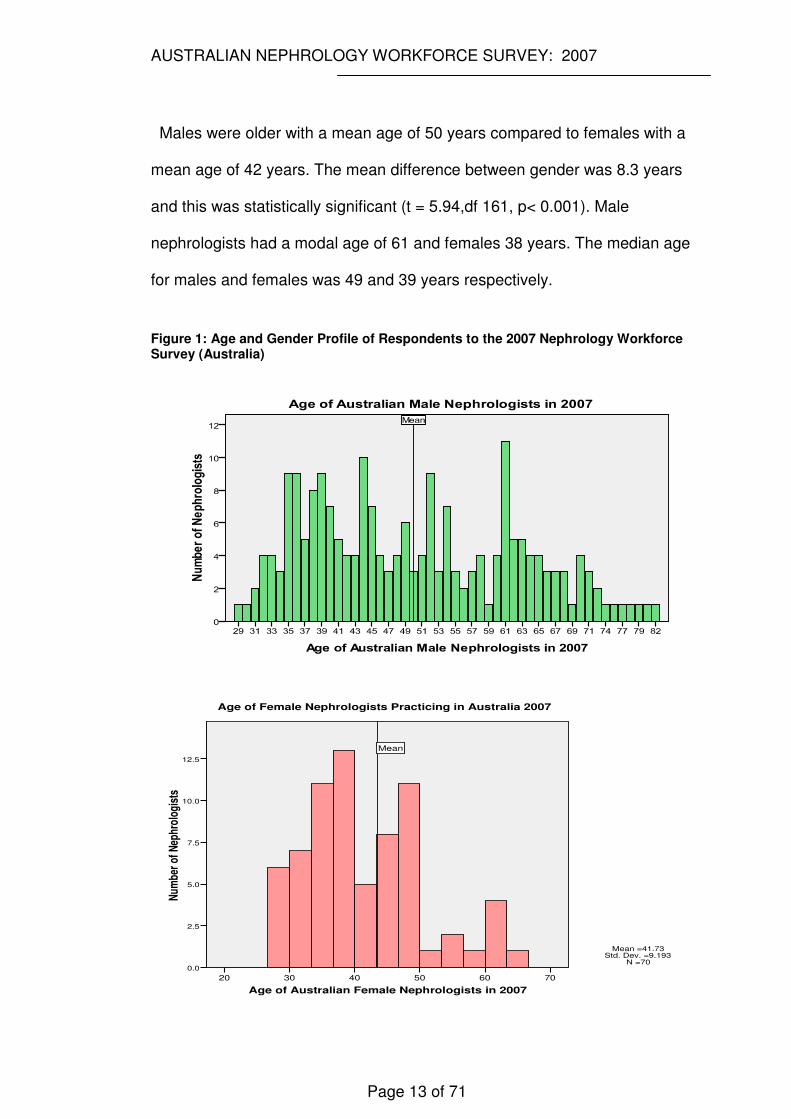
Males were older with a mean age of 50 years compared to females with a
mean age of 42 years. The mean difference between gender was 8.3 years
and this was statistically significant (t = 5.94,df 161, p< 0.001). Male
nephrologists had a modal age of 61 and females 38 years. The median age
for males and females was 49 and 39 years respectively.
Figure 1: Age and Gender Profile of Respondents to the 2007 Nephrology Workforce Survey (Australia)
Age of Australian Female Nephrologists in 2007
706050403020
Num
ber
of N
ephr
olog
ists
12.5
10.0
7.5
5.0
2.5
0.0
Mean
Age of Female Nephrologists Practicing in Australia 2007
Mean =41.73�Std. Dev. =9.193�
N =70
AUSTRALIAN NEPHROLOGY WORKFORCE SURVEY: 2007
Page 14 of 71
Family Situation and Dependents
The majority of respondents 253 (92%) were married or in a long term
relationship of these 76% of partners have working responsibilities. The
majority, 227 (83%) also have children.
Of those with children 168 (75%) still had dependents living with them at
home. Sixty (27%) had young children requiring day-care facilities and 127
(56%) had school age children; around one third (71) felt that family
responsibilities for their children impacted on their work hours.
Retirement Plans
When requested to nominate a retirement age, 25 (9%) respondents declined
to answer. Three respondents identified themselves as ‘retired’ but went on to
identify teaching, research, administration or small private practice loads and
so were not excluded from the analysis.
The average age of planned retirement was nominated as 65 by 43% of
respondents with 60 years the next most nominated age by 21% of
respondents.
Younger respondents anticipated retiring earlier than older nephrologists. The
data shows a statistically significant positive correlation between current age
of the nephrologist and the planned age of retirement (pearson correlation
coefficient = 0.52, p<0.001). Two outliers were excluded from this analysis as
they reported their planned age of retirement to be 99 and 100 years, having a
current age of 55 and 57 years respectively.
AUSTRALIAN NEPHROLOGY WORKFORCE SURVEY: 2007
Page 15 of 71
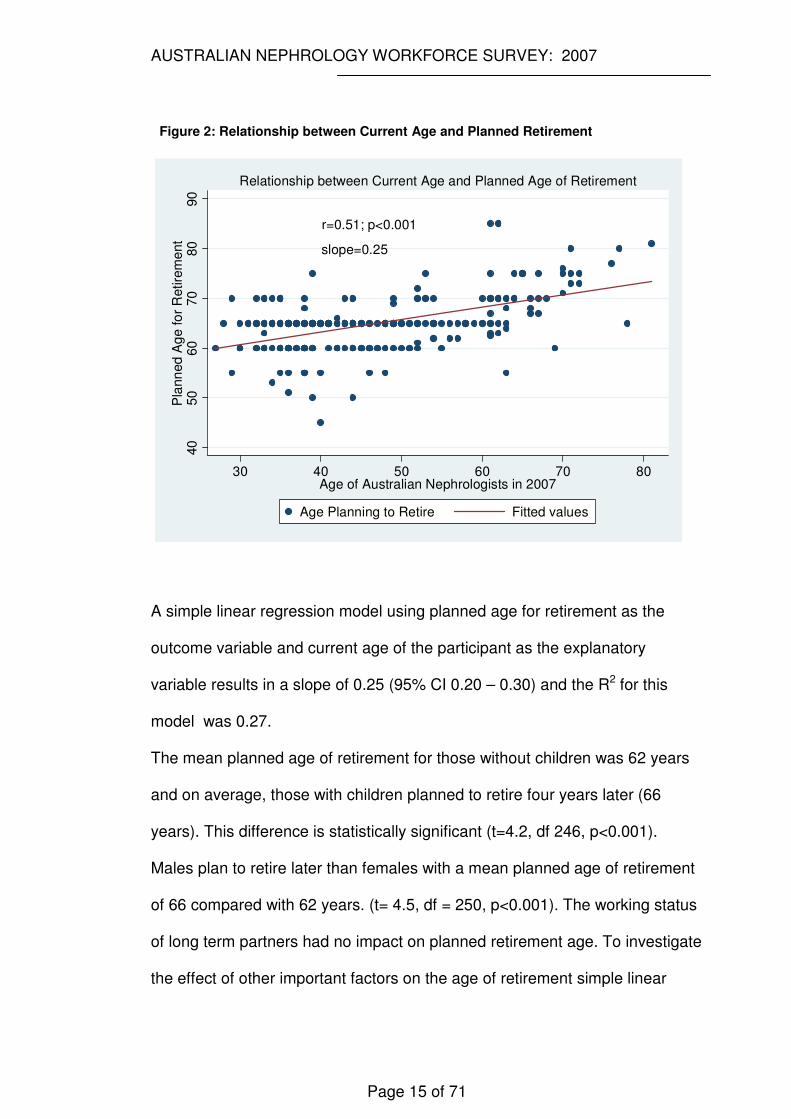
Figure 2: Relationship between Current Age and Planned Retirement
r=0.51; p<0.001
slope=0.25
40
50
60
70
80
90
Pla
nn
ed
Ag
e fo
r R
etire
me
nt
30 40 50 60 70 80Age of Australian Nephrologists in 2007
Age Planning to Retire Fitted values
Relationship between Current Age and Planned Age of Retirement
A simple linear regression model using planned age for retirement as the
outcome variable and current age of the participant as the explanatory
variable results in a slope of 0.25 (95% CI 0.20 – 0.30) and the R2 for this
model was 0.27.
The mean planned age of retirement for those without children was 62 years
and on average, those with children planned to retire four years later (66
years). This difference is statistically significant (t=4.2, df 246, p<0.001).
Males plan to retire later than females with a mean planned age of retirement
of 66 compared with 62 years. (t= 4.5, df = 250, p<0.001). The working status
of long term partners had no impact on planned retirement age. To investigate
the effect of other important factors on the age of retirement simple linear
AUSTRALIAN NEPHROLOGY WORKFORCE SURVEY: 2007
Page 16 of 71
regression was fitted separately for each factor. In the regression model, the
variables “weekly hours of work” and “state where most of work is done” were
fitted as categorical variables.
When all these variables were examined together (by fitting in a single model)
the variable that accounted for the majority of the variance was the
“participants’ current age”, all other factors were no longer significant. That is,
the association between planned age of retirement and the current age of
nephrologist was not confounded by any of these other factors.
AUSTRALIAN NEPHROLOGY WORKFORCE SURVEY: 2007
Page 17 of 71
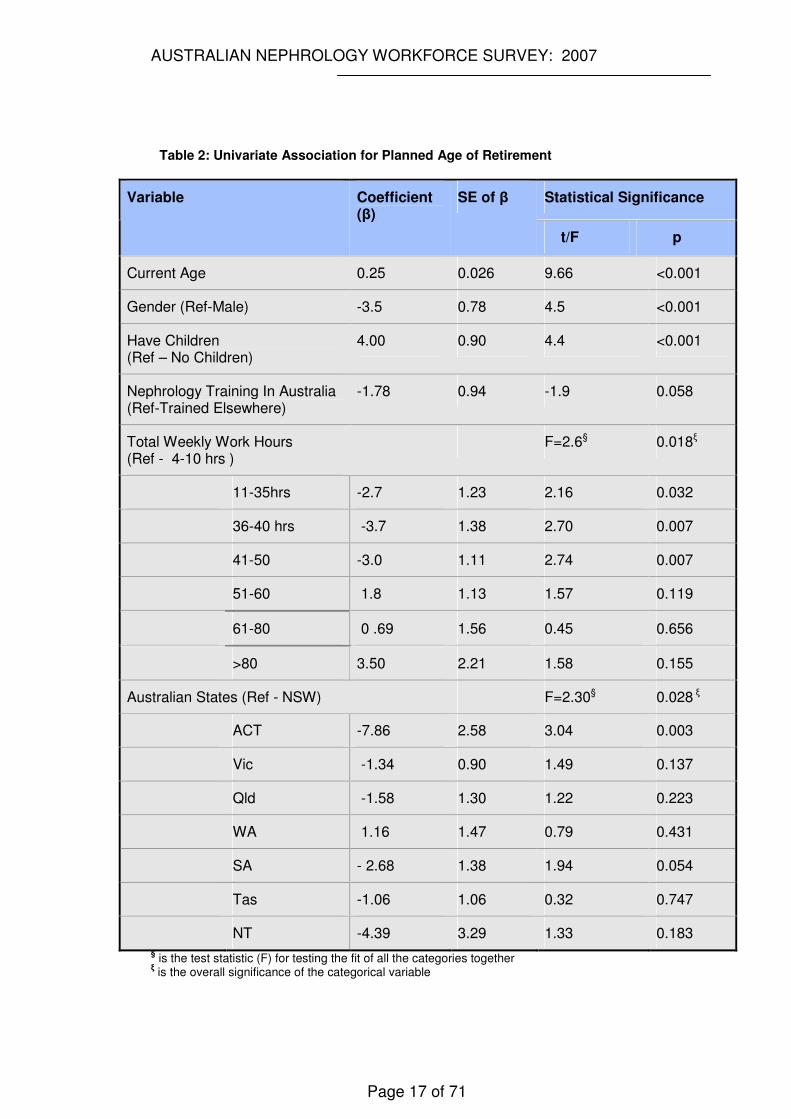
Table 2: Univariate Association for Planned Age of Retirement
Statistical Significance Variable Coefficient (β)
SE of β
t/F p
Current Age 0.25 0.026 9.66 <0.001
Gender (Ref-Male) -3.5 0.78 4.5 <0.001
Have Children (Ref – No Children)
4.00 0.90 4.4 <0.001
Nephrology Training In Australia (Ref-Trained Elsewhere)
-1.78 0.94 -1.9 0.058
Total Weekly Work Hours (Ref - 4-10 hrs )
F=2.6§ 0.018ξ
11-35hrs -2.7 1.23 2.16 0.032
36-40 hrs -3.7 1.38 2.70 0.007
41-50 -3.0 1.11 2.74 0.007
51-60 1.8 1.13 1.57 0.119
61-80 0 .69 1.56 0.45 0.656
>80 3.50 2.21 1.58 0.155
Australian States (Ref - NSW) F=2.30§ 0.028 ξ
ACT -7.86 2.58 3.04 0.003
Vic -1.34 0.90 1.49 0.137
Qld -1.58 1.30 1.22 0.223
WA 1.16 1.47 0.79 0.431
SA - 2.68 1.38 1.94 0.054
Tas -1.06 1.06 0.32 0.747
NT -4.39 3.29 1.33 0.183
§ is the test statistic (F) for testing the fit of all the categories together ξ is the overall significance of the categorical variable
AUSTRALIAN NEPHROLOGY WORKFORCE SURVEY: 2007
Page 18 of 71
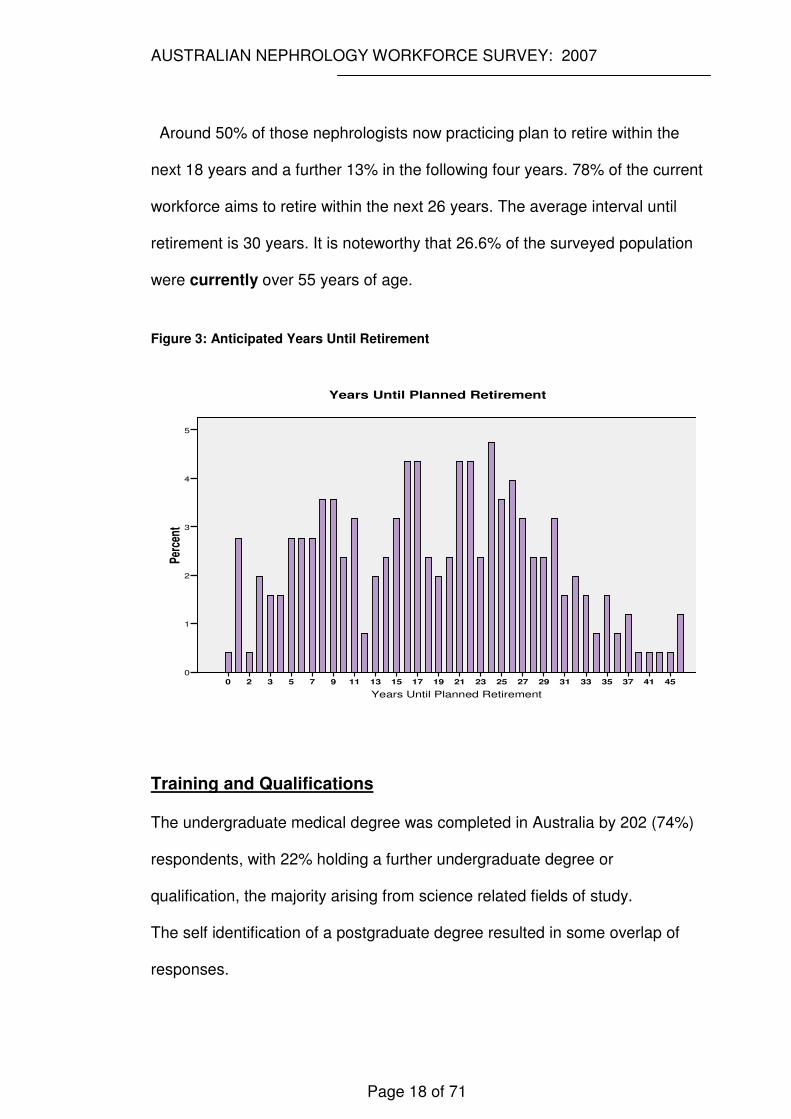
Around 50% of those nephrologists now practicing plan to retire within the
next 18 years and a further 13% in the following four years. 78% of the current
workforce aims to retire within the next 26 years. The average interval until
retirement is 30 years. It is noteworthy that 26.6% of the surveyed population
were currently over 55 years of age.
Figure 3: Anticipated Years Until Retirement
Years Until Planned Retirement
45413735333129272523211917151311975320
Per
cent
5
4
3
2
1
0
Years Until Planned Retirement
Training and Qualifications
The undergraduate medical degree was completed in Australia by 202 (74%)
respondents, with 22% holding a further undergraduate degree or
qualification, the majority arising from science related fields of study.
The self identification of a postgraduate degree resulted in some overlap of
responses.
AUSTRALIAN NEPHROLOGY WORKFORCE SURVEY: 2007
Page 19 of 71
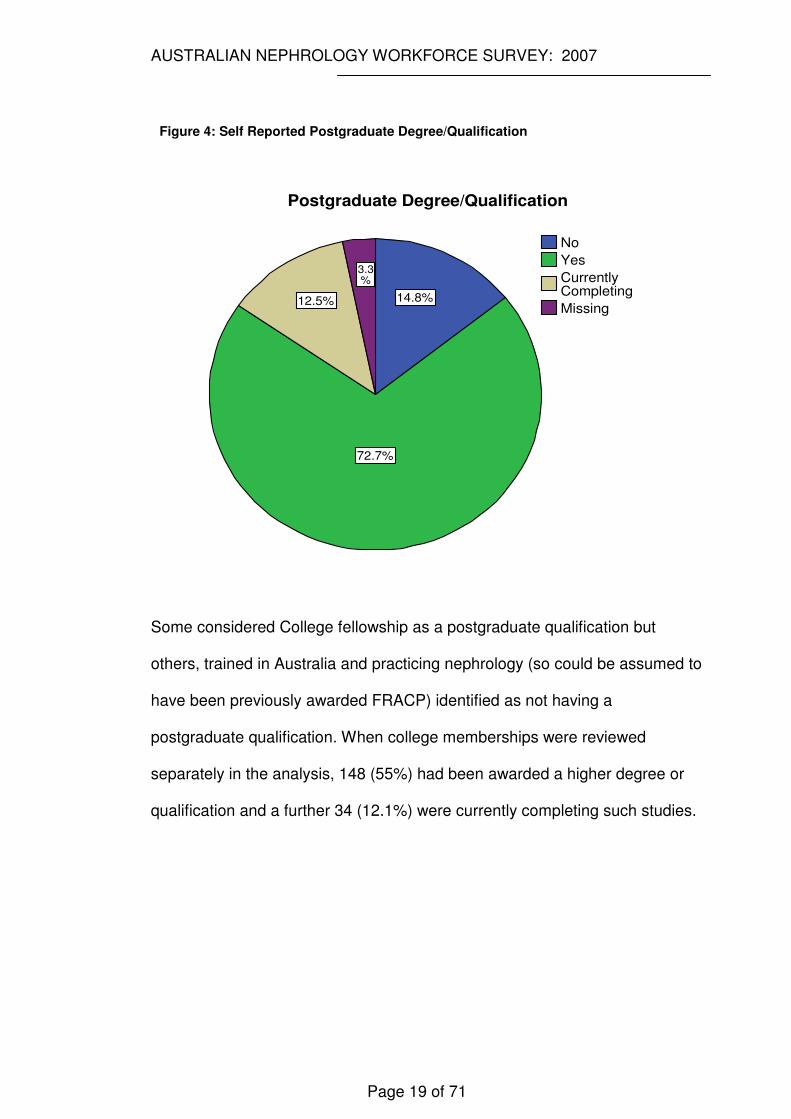
Figure 4: Self Reported Postgraduate Degree/Qualification
3.3%
12.5%
72.7%
14.8%Missing
Currently Completing
Yes
No
Postgraduate Degree/Qualification
Some considered College fellowship as a postgraduate qualification but
others, trained in Australia and practicing nephrology (so could be assumed to
have been previously awarded FRACP) identified as not having a
postgraduate qualification. When college memberships were reviewed
separately in the analysis, 148 (55%) had been awarded a higher degree or
qualification and a further 34 (12.1%) were currently completing such studies.
AUSTRALIAN NEPHROLOGY WORKFORCE SURVEY: 2007
Page 20 of 71
49�17.50%
9�…
34�12.14%
40�14.29%
18�6.43%
15�5.36%
115�41.07%
Degree/Qual.nominated as College(s) fellowship alone
Missing
Currently Completing
No postgrad.degree/qual.
Other degree/qual.
Degree/Qual.nominated but not specified
PhD or MD
Characteristics of Postgraduate Degree/Qualification
Specialisation
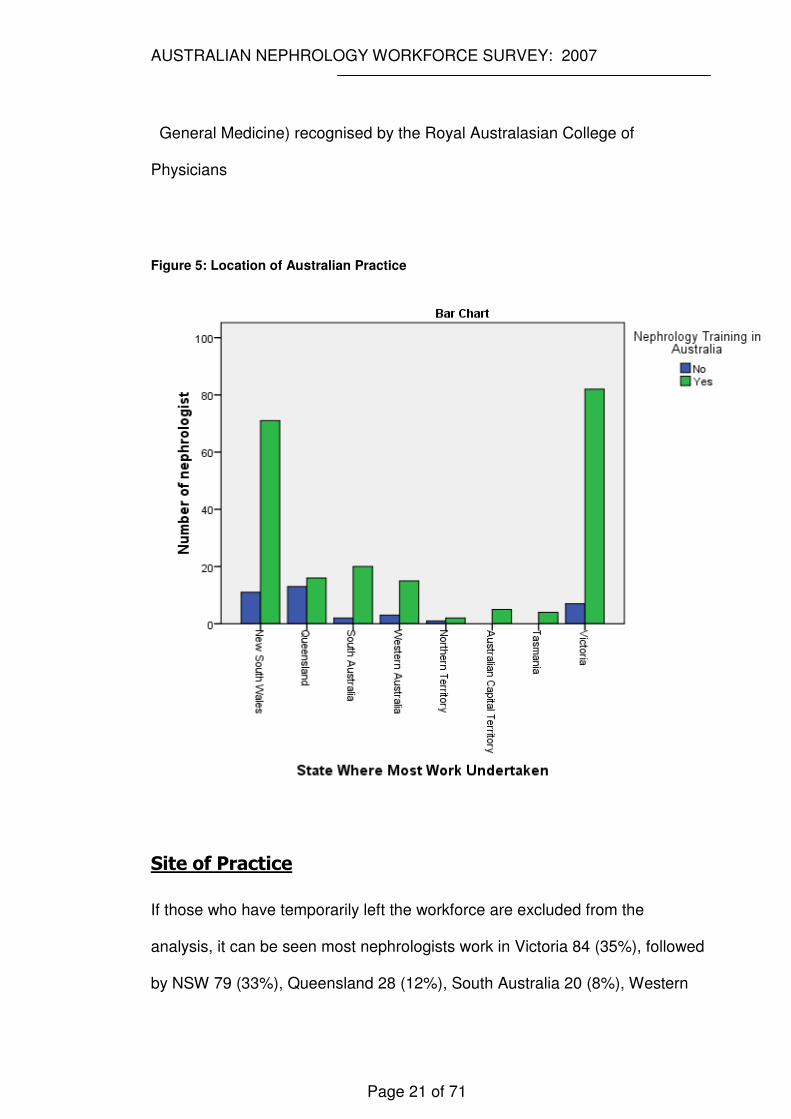
Two hundred and twenty two (82%) respondents had undertaken their
nephrology training in Australia, with nine respondents declining to answer this
question and 49 (18%) stating they received nephrology training outside
Australia. However, this percentage differs significantly among states
(X2=27.432 with 7 df, p<0.001) with Queensland standing out as having a
much higher proportion (44.8%) of overseas trained nephrologists. The
following bar chart shows the distribution of nephrologists having training in
Australia by state.
Only 34 (12.5%) state they have specialty training in another field (excluding
AUSTRALIAN NEPHROLOGY WORKFORCE SURVEY: 2007
Page 21 of 71
General Medicine) recognised by the Royal Australasian College of
Physicians
Figure 5: Location of Australian Practice
Site of Practice
If those who have temporarily left the workforce are excluded from the
analysis, it can be seen most nephrologists work in Victoria 84 (35%), followed
by NSW 79 (33%), Queensland 28 (12%), South Australia 20 (8%), Western
AUSTRALIAN NEPHROLOGY WORKFORCE SURVEY: 2007
Page 22 of 71
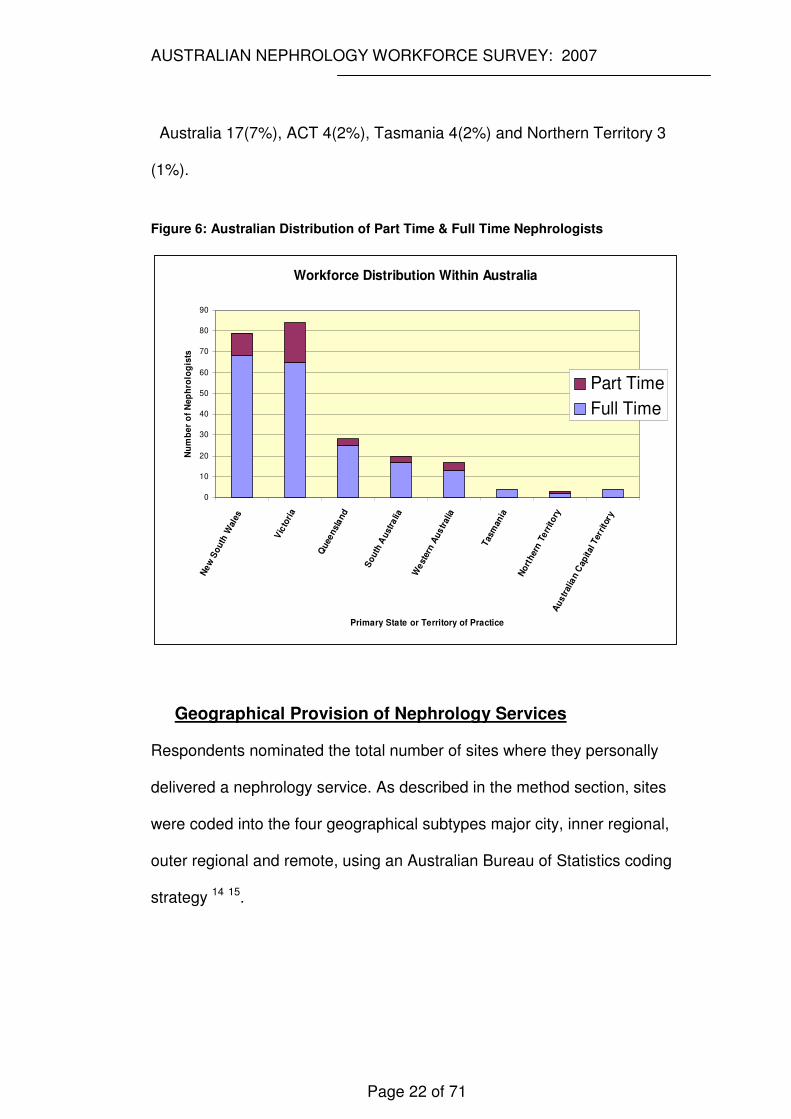
Australia 17(7%), ACT 4(2%), Tasmania 4(2%) and Northern Territory 3
(1%).
Figure 6: Australian Distribution of Part Time & Full Time Nephrologists
Workforce Distribution Within Australia
0
10
20
30
40
50
60
70
80
90
Ne
w S
outh
Wal
es
Vic
tori
a
Quee
nsl
and
So
uth
Aust
ralia
We
ster
n A
us
tral
ia
Tas
man
ia
No
rther
n T
err
ito
ryA
ustr
alia
n C
apital
Ter
rito
ry
Primary State or Territory of Practice
Nu
mb
er
of
Ne
ph
rolo
gis
ts
Part Time
Full Time
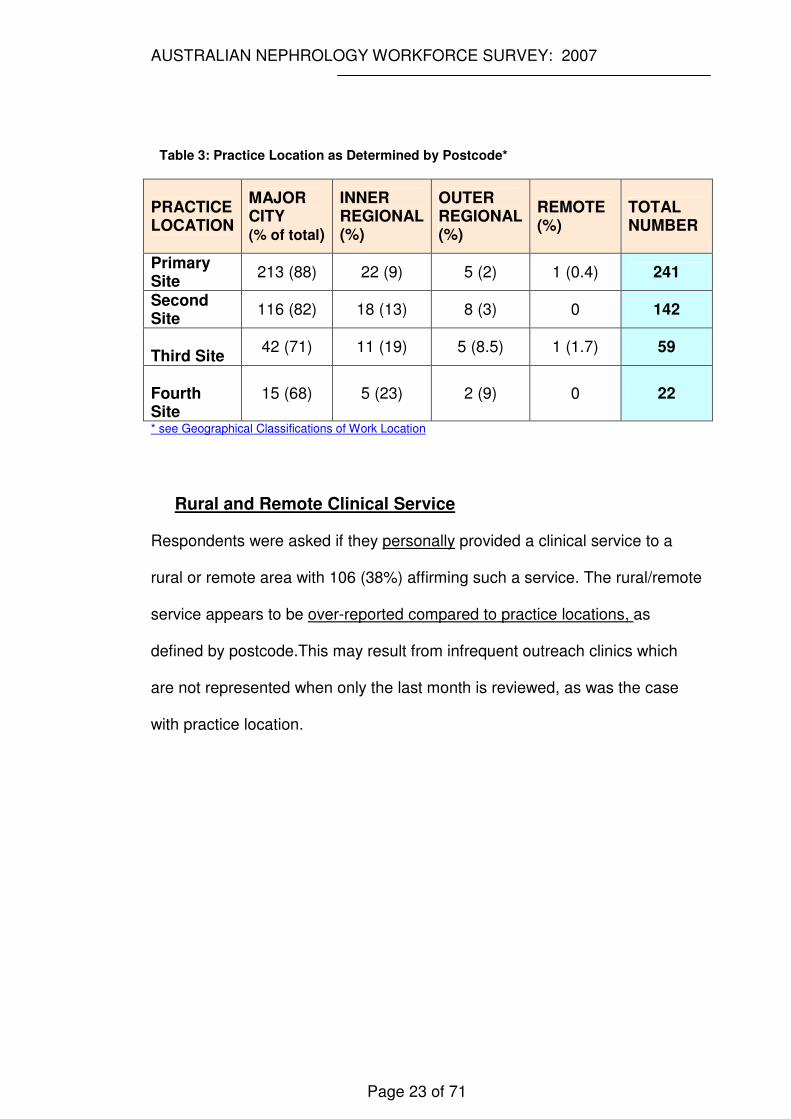
Geographical Provision of Nephrology Services
Respondents nominated the total number of sites where they personally
delivered a nephrology service. As described in the method section, sites
were coded into the four geographical subtypes major city, inner regional,
outer regional and remote, using an Australian Bureau of Statistics coding
strategy 14 15.
AUSTRALIAN NEPHROLOGY WORKFORCE SURVEY: 2007
Page 23 of 71
Table 3: Practice Location as Determined by Postcode*
PRACTICE LOCATION
MAJOR CITY (% of total)
INNER REGIONAL (%)
OUTER REGIONAL (%)
REMOTE (%)
TOTAL NUMBER
Primary Site
213 (88) 22 (9) 5 (2) 1 (0.4) 241
Second Site
116 (82) 18 (13) 8 (3) 0 142
Third Site
42 (71) 11 (19) 5 (8.5) 1 (1.7) 59
Fourth Site
15 (68) 5 (23) 2 (9) 0 22
* see Geographical Classifications of Work Location
Rural and Remote Clinical Service
Respondents were asked if they personally provided a clinical service to a
rural or remote area with 106 (38%) affirming such a service. The rural/remote
service appears to be over-reported compared to practice locations, as
defined by postcode.This may result from infrequent outreach clinics which
are not represented when only the last month is reviewed, as was the case
with practice location.
AUSTRALIAN NEPHROLOGY WORKFORCE SURVEY: 2007
Page 24 of 71
Work Hours
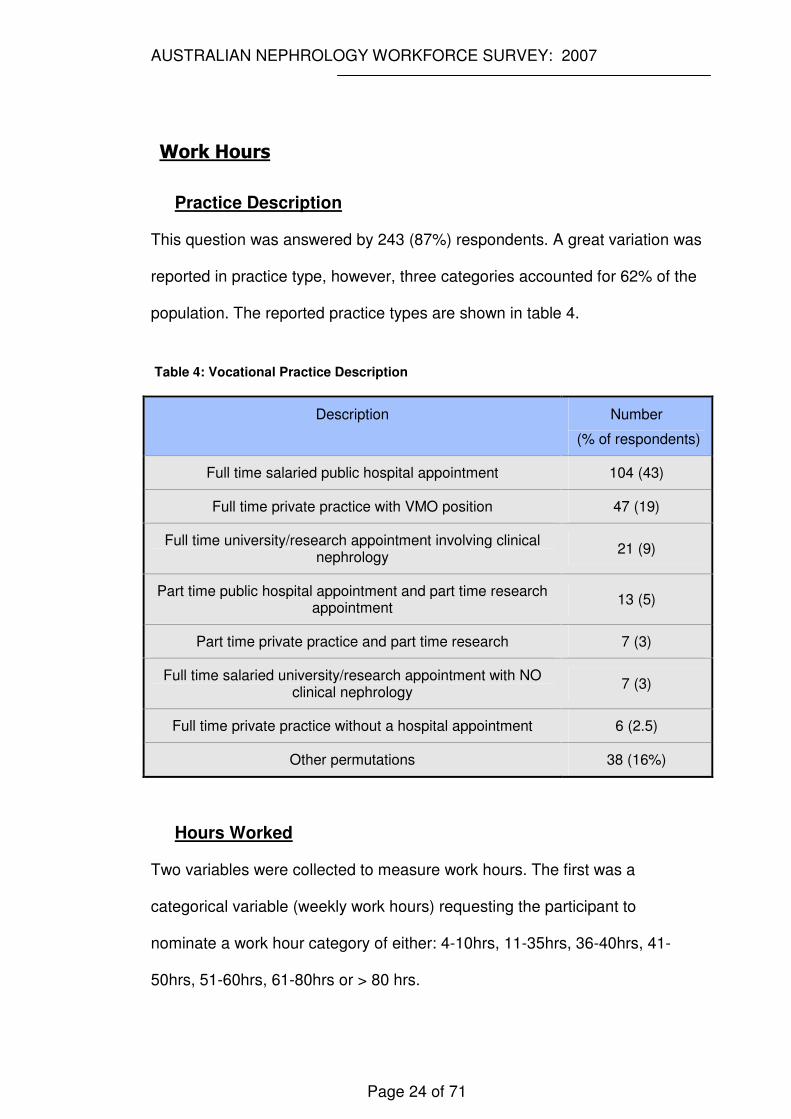
Practice Description
This question was answered by 243 (87%) respondents. A great variation was
reported in practice type, however, three categories accounted for 62% of the
population. The reported practice types are shown in table 4.
Table 4: Vocational Practice Description
Description Number
(% of respondents)
Full time salaried public hospital appointment 104 (43)
Full time private practice with VMO position 47 (19)
Full time university/research appointment involving clinical nephrology
21 (9)
Part time public hospital appointment and part time research appointment
13 (5)
Part time private practice and part time research 7 (3)
Full time salaried university/research appointment with NO clinical nephrology
7 (3)
Full time private practice without a hospital appointment 6 (2.5)
Other permutations 38 (16%)
Hours Worked
Two variables were collected to measure work hours. The first was a
categorical variable (weekly work hours) requesting the participant to
nominate a work hour category of either: 4-10hrs, 11-35hrs, 36-40hrs, 41-
50hrs, 51-60hrs, 61-80hrs or > 80 hrs.
AUSTRALIAN NEPHROLOGY WORKFORCE SURVEY: 2007
Page 25 of 71
The second variable was continuous and requested the participant to
nominate hours worked during the last month and, citing postcode or name of
town/city, identify the different sites in which work was undertaken. It was
anticipated the composite of these work sites would give a total monthly value
which when divided by four (to give a comparable weekly value) would
approximate the value of the first categorical variable (as determined by its
midpoint value).
To investigate how well these two measures of work hours correlated with
each other we calculated reliability statistics in terms of the interclass
correlation coefficient (ICCR) (the measure of exact agreement between two
measures).
The mean weekly work hours reported from the first variable (categorical) was
39.1hrs and from the continuous variable 29.5hrs with an ICCR of 0.441 (95%
CI 0.22 to 0.59). This shows poor agreement.
For subsequent analysis, the categorical variable was used as the measure of
weekly work hours. This decision was made because on review of the
continuous variable results it appeared that many participants had most likely
reported weekly hours rather than monthly hours. It was also felt that the
categorical data better reflected the participants’ review of their personal
weekly workload and was not relying on a particular monthly report with its
inherent potential to describe an idiosyncratic month not reflective of the usual
workload.
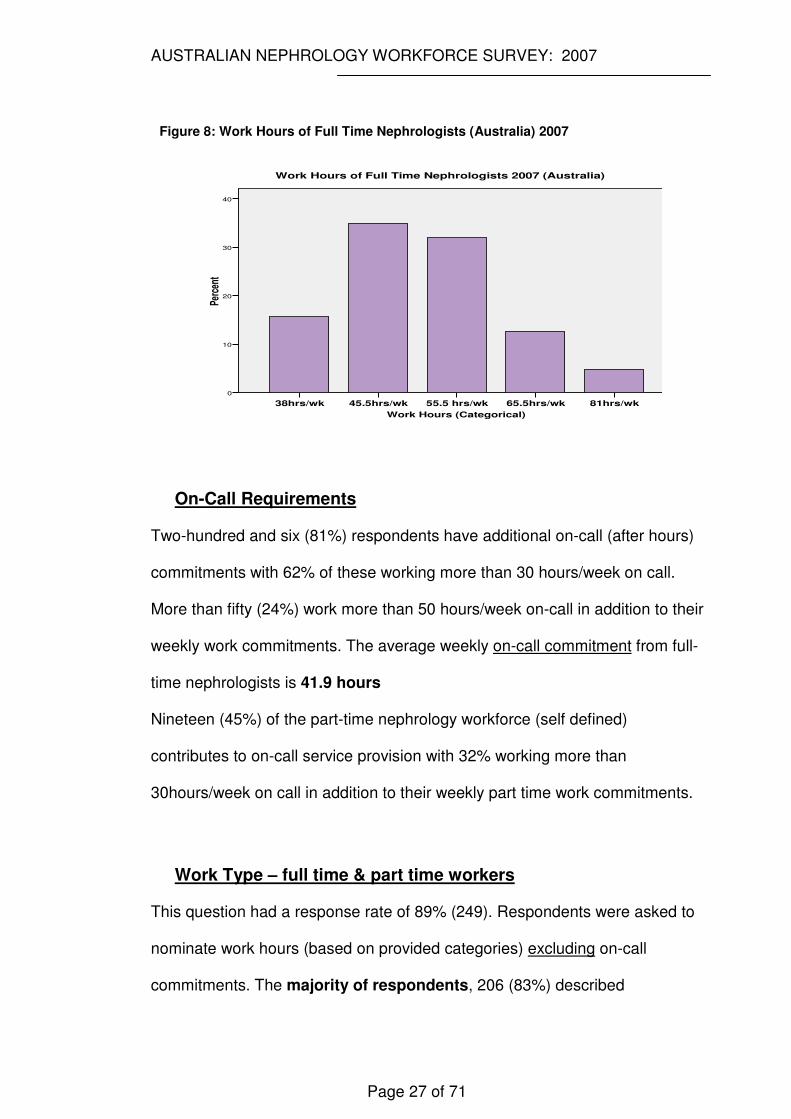
Most full time nephrologists in Australia in 2007 worked between 41-50
AUSTRALIAN NEPHROLOGY WORKFORCE SURVEY: 2007
Page 26 of 71
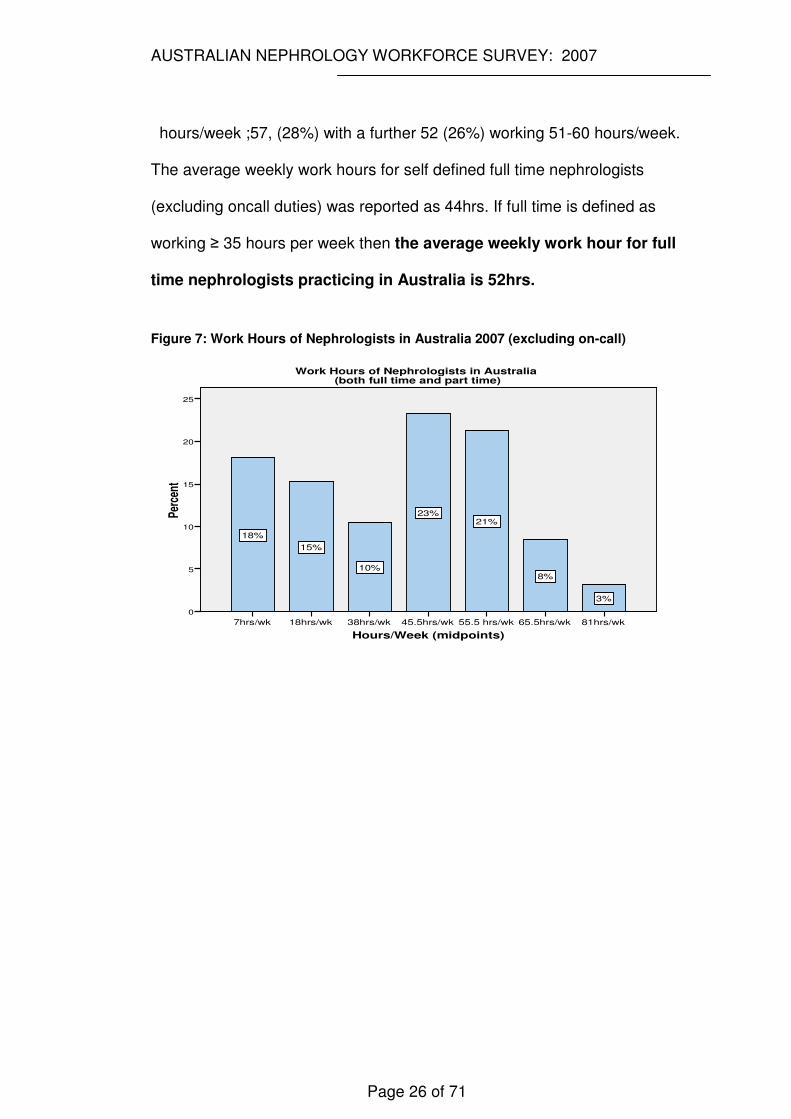
hours/week ;57, (28%) with a further 52 (26%) working 51-60 hours/week.
The average weekly work hours for self defined full time nephrologists
(excluding oncall duties) was reported as 44hrs. If full time is defined as
working ≥ 35 hours per week then the average weekly work hour for full
time nephrologists practicing in Australia is 52hrs.
Figure 7: Work Hours of Nephrologists in Australia 2007 (excluding on-call)
Hours/Week (midpoints)
81hrs/wk65.5hrs/wk55.5 hrs/wk45.5hrs/wk38hrs/wk18hrs/wk7hrs/wk
Per
cent
25
20
15
10
5
0
3%
8%
21%23%
10%
15%
18%
Work Hours of Nephrologists in Australia (both full time and part time)
AUSTRALIAN NEPHROLOGY WORKFORCE SURVEY: 2007
Page 27 of 71
Figure 8: Work Hours of Full Time Nephrologists (Australia) 2007
Work Hours (Categorical)
81hrs/wk65.5hrs/wk55.5 hrs/wk45.5hrs/wk38hrs/wk
Perc
ent
40
30
20
10
0
Work Hours of Full Time Nephrologists 2007 (Australia)
On-Call Requirements
Two-hundred and six (81%) respondents have additional on-call (after hours)
commitments with 62% of these working more than 30 hours/week on call.
More than fifty (24%) work more than 50 hours/week on-call in addition to their
weekly work commitments. The average weekly on-call commitment from full-
time nephrologists is 41.9 hours
Nineteen (45%) of the part-time nephrology workforce (self defined)
contributes to on-call service provision with 32% working more than
30hours/week on call in addition to their weekly part time work commitments.
Work Type – full time & part time workers
This question had a response rate of 89% (249). Respondents were asked to
nominate work hours (based on provided categories) excluding on-call
commitments. The majority of respondents, 206 (83%) described
AUSTRALIAN NEPHROLOGY WORKFORCE SURVEY: 2007
Page 28 of 71
themselves as undertaking full time work, forty-two (16%) as part time and
seven (3%) state they have temporarily left the workforce and a further five
(2%) stated they had permanently left the workforce. (see ‘Preparation of
Results and Exclusions’ )
Based on this self reported work type (full or part time), there were no
significant differences between the groups with respect to respondent’s age,
children (all categories), marital status, partner’s employment status, post
graduate degree, Australian specialty training, age of planned retirement,
performing procedures (renal biopsy &/or vascular access) or provision of
rural/remote services. Proportionally (but not numerically) more females
(25% vs 14%) participated in part time work (X2=4.22, df1 p<0.05).
Part time workers were more likely to report control over their work hours
(X2=9.27, p=0.002) and be engaged in research (t=-3.50, p=0.002) They were
also more likely to report a willingness to increase work hours (X2=2,p<0.001).
When full time workers are analysed separately, weekly work hours were
similar between genders with males working an average of 43.6 hrs and
females 45.4hrs. Among part time workers the average weekly work hours for
males were 14hrs and 16hrs for females. None of these differences were
statistically significant.
Disagreement within Work Type
Although only 42 (15%) of respondents had described themselves as working
in a ‘part time’ capacity; when asked to nominate weekly work hours within
AUSTRALIAN NEPHROLOGY WORKFORCE SURVEY: 2007
Page 29 of 71
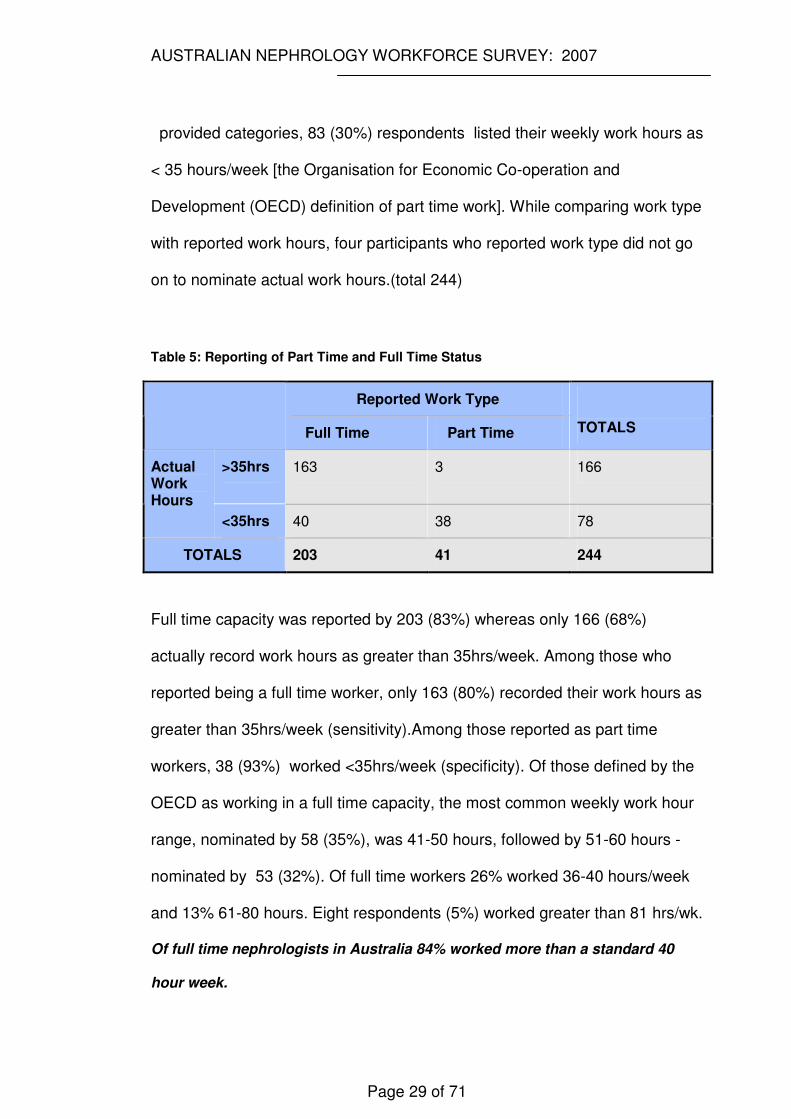
provided categories, 83 (30%) respondents listed their weekly work hours as
< 35 hours/week [the Organisation for Economic Co-operation and
Development (OECD) definition of part time work]. While comparing work type
with reported work hours, four participants who reported work type did not go
on to nominate actual work hours.(total 244)
Table 5: Reporting of Part Time and Full Time Status
Reported Work Type
Full Time Part Time
TOTALS
>35hrs 163 3 166 Actual Work Hours
<35hrs 40 38 78
TOTALS 203 41 244
Full time capacity was reported by 203 (83%) whereas only 166 (68%)
actually record work hours as greater than 35hrs/week. Among those who
reported being a full time worker, only 163 (80%) recorded their work hours as
greater than 35hrs/week (sensitivity).Among those reported as part time
workers, 38 (93%) worked <35hrs/week (specificity). Of those defined by the
OECD as working in a full time capacity, the most common weekly work hour
range, nominated by 58 (35%), was 41-50 hours, followed by 51-60 hours -
nominated by 53 (32%). Of full time workers 26% worked 36-40 hours/week
and 13% 61-80 hours. Eight respondents (5%) worked greater than 81 hrs/wk.
Of full time nephrologists in Australia 84% worked more than a standard 40
hour week.
AUSTRALIAN NEPHROLOGY WORKFORCE SURVEY: 2007
Page 30 of 71
Full Time Equivalents
A Full Time Equivalent is defined as one person working 40 hours/week (2080
hours/year) assuming no holidays or leave.
FTE figures can be calculated as fractions for part time workers using the
midpoint of the work hour category. This total is then added to the total
number of full time workers to get an overall FTE workforce.
Although a large number of nephrologists work over 40 hours/week these
workers are still counted individually as one FTE and the hours worked in
excess of 40 hours is conventionally referred to as ‘overtime’.
Table 6: FTE nephrologists based on 2007 Australian workforce survey
Hours
Worked/Week
(midpoint)
Hours
worked/year
2080
Number of
Nephrologists
(% of respondents)
FTE
nephrologists
≥ 40 1 140 (56.2) 140
38 0.95 26 (10.4) 25
18 0.58 38 (15.3) 22
7 0.175 45 (18.1) 8
249 (100)
(missing=31)
TOTAL FTE 195
If response rate does not depend on participants’ work hours then we can
make an assumption that the non-responders to this workforce questionnaire
(n=75) and those who did not answer this question (n=31) have a similar work
profile to the respondents. In that case there are a further 83 FTE
nephrologists working In Australia
AUSTRALIAN NEPHROLOGY WORKFORCE SURVEY: 2007
Page 31 of 71
Future Work Plans
Almost a third (82) of respondents plan to reduce their work hours by 20%
with a further 34 (13%) considering this as a possibility. This was to be
implemented immediately by 16 (6%) nephrologists and within 2-5 years by 37
(13%).
Only 22 (8%) were planning to increase work hours with a further 18 (6%)
considering this option. Ten (4%) planned to do this immediately and 12
(4.3%) in 2-5 years time.
Ability to Control Work Hours
One hundred and one (40%) respondents (44% if analysis restricted to full
time workers) felt unable to control their work hours. More participants (114)
provided reasons to explain why work hours were difficult to control. (Please
see ‘Qualitative Responses’ below for detailed explanation of these results.)
Interestingly males were more likely than their female counterparts to report
control over their work hours. This was evident in both the total cohort
(X2=3.67, p=0.05) and when restricted to full time workers (X2=5.17, p< 0.05).
The ANZSN nephrology workforce practicing in Australia in 2007 is
therefore estimated as 278 FTE.
AUSTRALIAN NEPHROLOGY WORKFORCE SURVEY: 2007
Page 32 of 71
Job Description
The average time nephrologists spent on various duties is summarised in
table 7 and graphically in figure 10
Nearly all nephrologists were involved in delivering clinical nephrology
services (see page 33) and, with the average just under 50% of total work
hours, this area consumes the major component of a nephrologists’ time.
Teaching consumed no more than 10% of work time for 220 (85%) with an
average of 8% and only 3 nephrologists (1.2%) spent more than 30% of their
time teaching.
The average time spent on administrative tasks was similar to the teaching
average at 8.4%. Ninety -seven nephrologists (38%) spent between 10 and
20% of their time on administrative tasks.
Table 7 : Work Profile of a Nephrologist Practicing in Australia in 2007
Duties of a Nephrologist Percentage of Time (Mean)
Clinical Nephrology 48.7
Research 13.7
Other Clinical Specialty Work (non-nephrology) 10
Administration 8.4
Teaching 8.3
Continuing Medical Education 5.7
Other Professional Duties 2.5
Medicolegal Duties 0.2
Other Duties 2.6
Total 100
Only 78 nephrologists spent time practicing other subspecialties and about
AUSTRALIAN NEPHROLOGY WORKFORCE SURVEY: 2007
Page 33 of 71
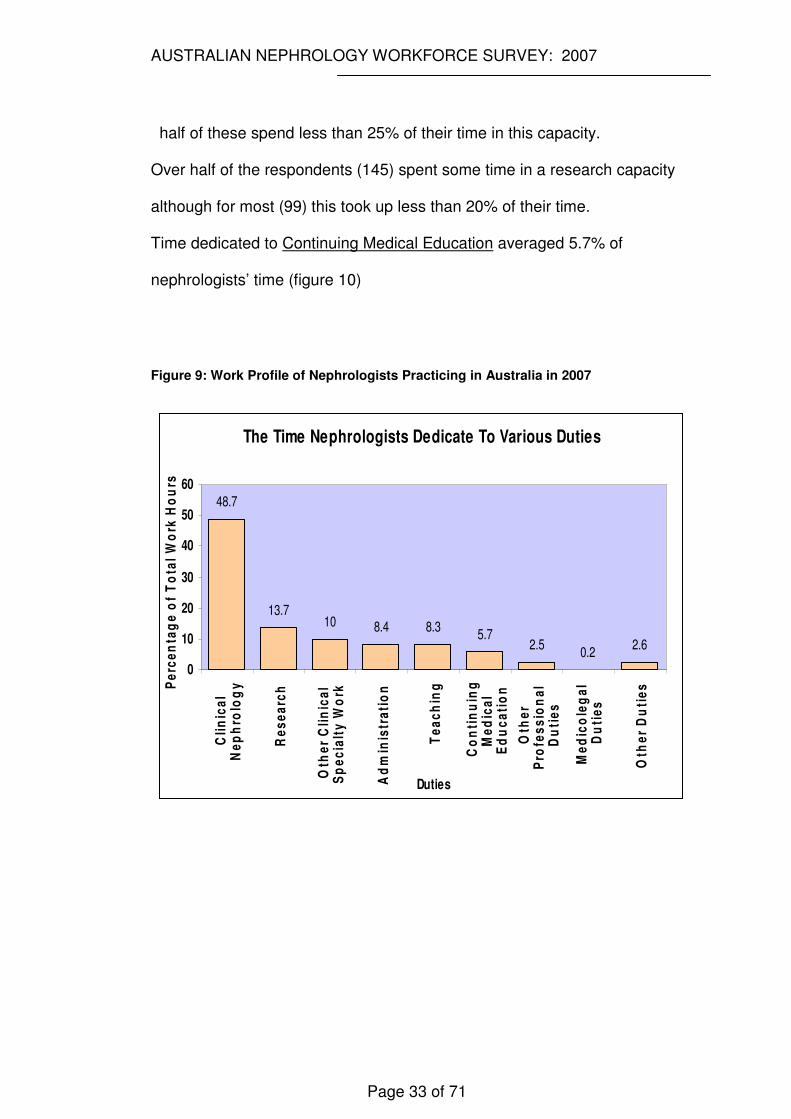
half of these spend less than 25% of their time in this capacity.
Over half of the respondents (145) spent some time in a research capacity
although for most (99) this took up less than 20% of their time.
Time dedicated to Continuing Medical Education averaged 5.7% of
nephrologists’ time (figure 10)
Figure 9: Work Profile of Nephrologists Practicing in Australia in 2007
The Time Nephrologists Dedicate To Various Duties
10 8.4 8.35.7
2.50.2
2.6
13.7
48.7
0
10
20
30
40
50
60
Cli
nic
al
Ne
ph
rolo
gy
Re
se
arc
h
Oth
er
Cli
nic
al
Sp
ec
ialt
y W
ork
Ad
min
istr
ati
on
Te
ac
hin
g
Co
nti
nu
ing
Me
dic
al
Ed
uc
ati
on
Oth
er
Pro
fes
sio
na
lD
uti
es
Me
dic
ole
ga
lD
uti
es
Oth
er
Du
tie
s
Duties
Pe
rce
nta
ge
of
To
tal
Wo
rk H
ou
rs

AUSTRALIAN NEPHROLOGY WORKFORCE SURVEY: 2007
34
AUSTRALIAN NEPHROLOGY WORKFORCE SURVEY: 2007
Page 35 of 71
Clinical Nephrology
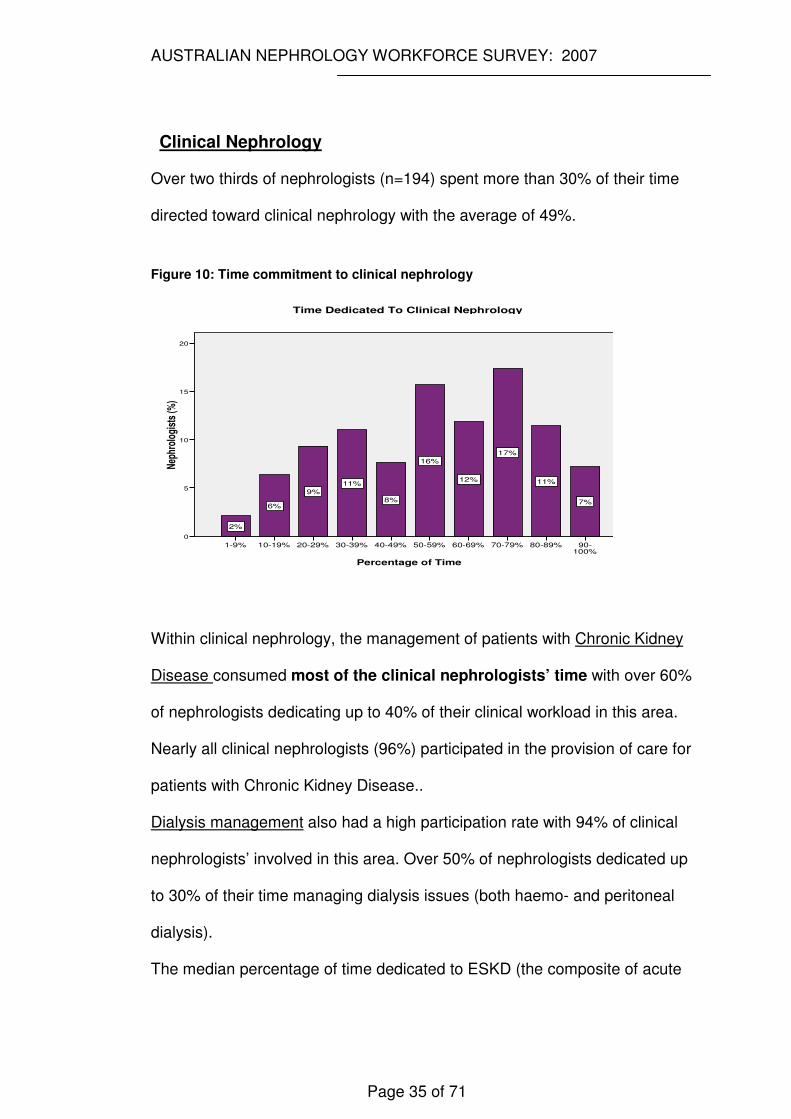
Over two thirds of nephrologists (n=194) spent more than 30% of their time
directed toward clinical nephrology with the average of 49%.
Figure 10: Time commitment to clinical nephrology
Percentage of Time
90-100%
80-89% 70-79% 60-69% 50-59% 40-49% 30-39% 20-29% 10-19% 1-9%
Nep
hrol
ogis
ts (%
)
20
15
10
5
0
7%
11%
17%
12%
16%
8%
11%
9%
6%
2%
Time Dedicated To Clinical Nephrology
Within clinical nephrology, the management of patients with Chronic Kidney
Disease consumed most of the clinical nephrologists’ time with over 60%
of nephrologists dedicating up to 40% of their clinical workload in this area.
Nearly all clinical nephrologists (96%) participated in the provision of care for
patients with Chronic Kidney Disease..
Dialysis management also had a high participation rate with 94% of clinical
nephrologists’ involved in this area. Over 50% of nephrologists dedicated up
to 30% of their time managing dialysis issues (both haemo- and peritoneal
dialysis).
The median percentage of time dedicated to ESKD (the composite of acute
AUSTRALIAN NEPHROLOGY WORKFORCE SURVEY: 2007
Page 36 of 71
and chronic transplantation and dialysis) was 41% of clinical work hours,
which represented 20% of the total workload of a nephrologist in this
study.
Eleven percent of clinical nephrologists participated in other areas of
nephrology identifying these as including lipidology, metabolic nephrology
including stone and bone disease, incontinence and urology, pathology and
general paediatric nephrology.
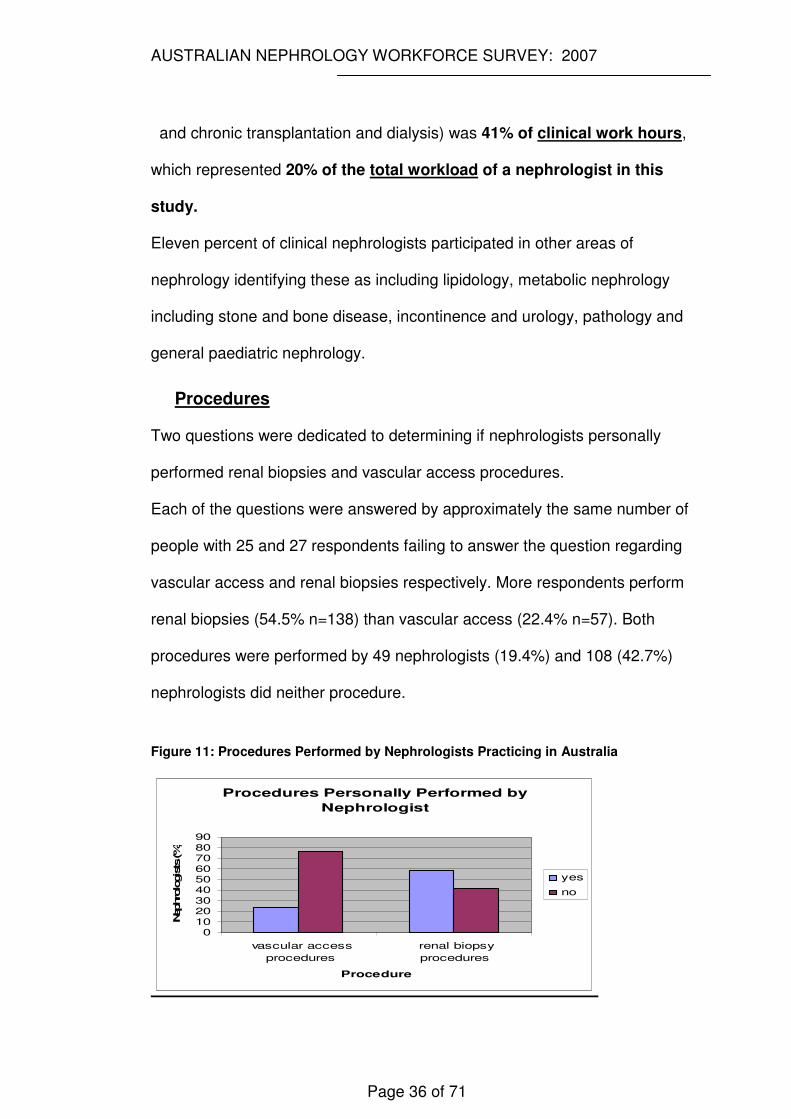
Procedures
Two questions were dedicated to determining if nephrologists personally
performed renal biopsies and vascular access procedures.
Each of the questions were answered by approximately the same number of
people with 25 and 27 respondents failing to answer the question regarding
vascular access and renal biopsies respectively. More respondents perform
renal biopsies (54.5% n=138) than vascular access (22.4% n=57). Both
procedures were performed by 49 nephrologists (19.4%) and 108 (42.7%)
nephrologists did neither procedure.
Figure 11: Procedures Performed by Nephrologists Practicing in Australia
Procedures Personally Performed by
Nephrologist
0102030405060708090
vascular access
procedures
renal biopsy
procedures
Procedure
Nephro
logists (%
)
yes
no
AUSTRALIAN NEPHROLOGY WORKFORCE SURVEY: 2007
Page 37 of 71
Qualitative Responses
As is typical of questionnaires with an emphasis on categorical data collection,
the free text responses were quite brief and did not lend themselves to
extensive qualitative analysis. Some responses were so brief (eg ‘public
hospitals’ as an answer to why work hours were difficult to control) as to be
meaningless without overlying extensive researcher interpretation and so
were deleted from the analysis.
Participants were asked to provide free text responses to three questions:
Do you feel able to control your work hours? –Respondents
who felt unable to control work hours were requested to provide
an explanation.
More participants (114) gave an explanation as to why work hours were
difficult to control than had nominated this area as problematic in the
preceding yes/no stem (101).
The most common reason offered was that workload and clinical demand
outstripped personal work capacity. Participants cited unacceptable patient
waiting periods (>3 months) before review in private practice and one
participant calculated their workload to be 120 ESRF pts/nephrologist.
Many cited lack of other staff particularly other nephrologists, as the primary
reason for lack of control of work hours.
Personal qualities were seen to also impact on control of work hours,
particularly the inability to say 'no' to requests on time. Several described a
AUSTRALIAN NEPHROLOGY WORKFORCE SURVEY: 2007
Page 38 of 71
professional obligation to provide teaching and other duties such as
committee and board memberships, which then further impacted on their time
to provide direct patient care.
A tension was evident between the personal burden associated with service
delivery and the commitment and responsibility for patient care. Reference
was made to the need to take work home. Inflexibility of other commitments
such as collecting children from day-care/school resulted in personal stress
with the recognition that the latter part of the day also corresponded to the
return of results/investigations.
Particular skill sets such as skill in research was seen to increase demands on
time from other colleagues.
The structure of the renal departments within the hospital, eg subservient to
department of General Medicine, reduced some units’ autonomy.
Large on-call requirements impacted negatively on control of work hours. Lack
of predictability in workload led to a perceived lack of control by several
participants.
Poor clerical support was mentioned by several respondents with the
comment that administrative work was then required to be undertaken at
home at the expense of continuing medical education.
Several stated the excessive workload meant it was impossible to introduce a
work practice change and although the workload was impacting negatively on
personal life, to introduce any work practice change (eg reduce on-call
commitment) would be unfair to colleagues.
AUSTRALIAN NEPHROLOGY WORKFORCE SURVEY: 2007
Page 39 of 71
What do you see as the greatest issues impacting on nephrology
service provision?
Participants (213) identified four central concerns felt to be impacting on the
provision of optimal renal services.
The greatest concern, with 170 references, was the inadequacy of the
current workforce to cope with the demand for renal services.
Participants described the lack of manpower (96 references) more often than
the excessive workload (74 references) although many respondents identified
an association between these two variables.
Workforce shortages mostly were made in reference to nephrologists although
shortfalls in renal nursing and allied health were also recognised. The fact that
the nephrology workforce was also ageing was concerning. Within the smaller
paediatric nephrologist population, maintaining a critical mass of skilled
nursing staff was seen as problematic. The difficulty attracting renal trainees
was identified as a direct contributor to the inadequacy of the workforce.
Ability to dedicate time to supervision and training was a concern to
nephrologists and several suggested that this role have greater recognition. It
was proposed training emphasis should not be toward training academics but
toward training clinicians to provide clinical services.
“Current nephrology training in Australia is training academics when the demand is for clinical nephrologists-hence the increased employment of overseas trained doctors” respondent no. 123
Several respondents suggested the current hospital employment model
requires reform and that appointments move from a research to service
AUSTRALIAN NEPHROLOGY WORKFORCE SURVEY: 2007
Page 40 of 71
delivery focus.
The ageing population, increasing prevalence of diabetes and earlier referrals
as a result of eGFR reporting were identified as specific contributors to
workload. Mention was made of the medical complexity of patients with renal
disease particularly as a result of the ageing population and prevalence of
much co-morbidity.
The discrepancy between available workforce and workload was identified as
impacting on lifestyle and contributed to 'burn-out'. Several participants felt
such a situation displayed nephrology to potential trainees in a poor light and
impacted further on trainee recruitment. Lack of time to complete all tasks and
still respond to non-work commitments was the major factor impacting on
service provision (additional 12 references).
The second issue highlighted as detracting from optimal service provision was
poor remuneration (28 references). Inadequate remuneration was cited as
the reason for workforce shortages (deterring trainees) and nephrology
income was compared unfavourably with the earning potential of other
physician and surgical subspecialties.
Service provision was hampered by lack of sufficient infrastructure (24
references) and dialysis facilities and beds (including satellite units) were the
most frequent exemplars. Other examples included insufficient secretarial and
administrative support, lack of access to preventive programs, inadequate
theatre time for vascular access procedures and inadequate outpatient
AUSTRALIAN NEPHROLOGY WORKFORCE SURVEY: 2007
Page 41 of 71
facilities and services.
Thirty-five references were coded as inadequate resources and funds; these
comments referred to generic funding deficits in renal medicine. State and
federal funding was cited as insufficient. Research and paediatric services
were mentioned although often these responses did not expand on the theme
further.
Other issues impacting on service provision included the maldistribution of
renal services between states and between metropolitan and rural regions
with poor services to regional Australia (14 references) and particular
populations (eg indigenous Australians). Lack of kidney donors were cited by
several as an important issue.
The planning and health care delivery models were identified as the major
problem by several respondents. A tension was identified in the ability to
deliver renal services which are generally provided in the hospital setting but
should be serviced through a chronic disease management model which has
a focus in the community setting. In the NSW setting institution focussed
delivery of care was potentially inequitable and inefficient compared to a more
patient or population based focus.
AUSTRALIAN NEPHROLOGY WORKFORCE SURVEY: 2007
Page 42 of 71
"Delivery is institution-focused rather than patient focused. Services are slow to respond to changes in disease prevalence, population location,etc. and when they do respond [it] is framed through the lens of the interests of a single institution. An approach that centred on the most efficient and equitable delivery of renal services to the population of NSW would, I imagine, deliver quite a different model. “
Respondent 255
Do any current regulations impact negatively on the care you
are able to provide to your patients?
Respondents to this question (101) described at least one regulation as
impacting negatively on patient care.
The main factor identified by over a third of respondents was restricted access
(or the requirement of time consuming paperwork) to required
pharmaceuticals under the Pharmaceutical Benefits Scheme (PBS)/Authority
Scheme. (36 references). Restrictions mentioned included access to
mycophenolate mofetil for treatment of lupus nephritis, agents to control
calcium-phosphate balance such as cinacalcet, sevelamer, lanthanum and
authority requirements around calcitriol use.
Prescribing restrictions to hospital based services (eg erythropoietin and
several immunosuppressants) interferes with the ability to provide private
nephrology services. This necessitates that patients who could otherwise be
managed in the private sector are forced to remain attending public hospital
based clinics.
Another restrictive regulation was noted to be the restriction of peritoneal
AUSTRALIAN NEPHROLOGY WORKFORCE SURVEY: 2007
Page 43 of 71
dialysis to the public sector. One recommendation was to list peritoneal
dialysis fluids and other consumables as PBS items. Hospital restrictions
limiting the ability to offer nocturnal haemodialysis as an in-centre service
were cited along with dialysis bed shortages limiting patients’ dialysis modality
choice.
Poor remuneration was seen to be impacting on the provision of care to the
regional and rural sectors with current compensation felt to be insufficient for
the additional ‘after-care’ work required. Remuneration associated with
dialysis was identified as a separate issue, particularly surrounding the
Medicare billing system for dialysis patients and the lack of adequate funding
for dialysis supervision. (recent Medicare amendments have come some way
in addressing this situation)
Several nephrologists felt that treatment costs (medications, travel) were
placing a substantial burden on patients with renal disease and felt greater
reimbursement was required for particular groups.
AUSTRALIAN NEPHROLOGY WORKFORCE SURVEY: 2007
Page 44 of 71
DISCUSSION
The aim of this research was to describe the current nephrology workforce in
Australia. From this research, which had an excellent response rate of almost
80%, it is hoped that the Australian nephrology community can gain an insight
into aspects of the workforce which are impacting on the capacity of renal
physicians to provide optimal patient care. It is also anticipated that this work
will inform workforce planning in such areas as renal advanced trainee
recruitment and overseas trained nephrologist immigration targets.
Finally, marrying these workforce results to workload indices as reported by
ANZDATA (ie ESKD) provide the opportunity for preliminary benchmarking of
Australian data to countries with similar health care systems.
Basic Anticipated Workforce Flow:
Workforce Additions
Trainees
The main source of additions to the nephrologist workforce is the entry of
advanced trainees into the workforce. Absolute trainee numbers are
misleading since if trainees interrupt training (eg maternity leave) they may be
counted year to year but represent only one potential addition to the
workforce. From a workforce planning perspective, it would be most
informative if that group of final year trainees intending to proceed directly into
clinical nephrology practice could be identified; as this is not practical, first
year trainee numbers are the next most informative, since although there will
AUSTRALIAN NEPHROLOGY WORKFORCE SURVEY: 2007
Page 45 of 71
be a lag time before entering the workforce these trainees are only being
‘counted once’ in any calculation and represent an eventual workforce
addition.
11
5
8
12
1819
12
9
15
21
13
24
0
5
10
15
20
25
Number of
Trainees
1997 1999 2001 2003 2005 2007 2009
Year
NEPHROLOGY TRAINEES
1st Year Trainee
Source :Provided by the Royal Australasian College of Physicians16
.2008 data unavailable.
Since 1997 the average intake of first year trainees has been 13 and as can
be seen from the above graphical display, there has not been a constant
growth in first year trainee numbers despite a documented growth in renal
replacement therapy of around 5.9%/year since 1990 17
Although the overall numbers of medical students will increase exponentially
this increased medical student output won’t have impact on specialty numbers
for 10-12 yrs after intake. The first increase in medical graduates in Australia
occurred in January 2007; even with uninterrupted progress to specialty
practice over seven years post graduation, the impact of this new cohort on
AUSTRALIAN NEPHROLOGY WORKFORCE SURVEY: 2007
Page 46 of 71
the nephrologist workforce will not be experienced until at least 2014.
Trainees with Occupational Training Visas (OTV’s)
During 2006 & 2007 there were 15 & 7 trainees respectively with Occupational
Training Visas – these trainees are in addition to the College of Physicians
Specialist Advisory Committee (SAC) trainee cohort. It is as yet unclear what
impact the new Commonwealth of Australian Governments (COAG)
regulations for national registration will have on the recruitment of OTV
doctors 18
Migration (Overseas Trained Doctors)
According to the Programme Statistics and Monitoring Section Support
Branch of the Department of Immigration and Citizenship 19, occupation
information of all passengers is collected using the "Australian Standard
Classification of Occupations" as recorded on the passenger card. Occupation
level is recorded down to a 4 digits unit group level. The author has been
advised that Nephrologists would be recorded under the 4 digit unit group
level as ‘Specialist Medical Practitioners’ and no further classification
regarding subspecialty is available. As such, at the time of writing this report, it
is impossible to determine how many OTDs are recruited to Australia as
specialist nephrologists.
Workforce Re-entry
Seven nephrologists had temporarily left the workforce during the 2007
nephrology workforce questionnaire. This has a relatively small effect on total
workforce calculations
AUSTRALIAN NEPHROLOGY WORKFORCE SURVEY: 2007
Page 47 of 71
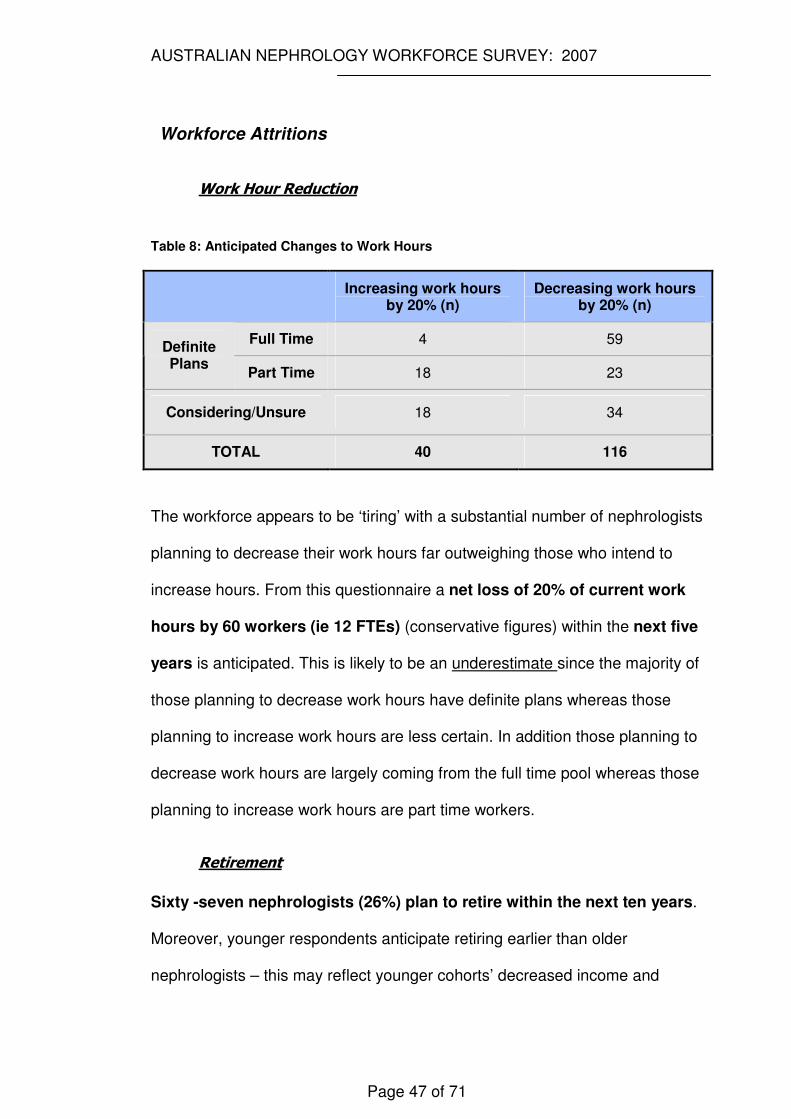
Workforce Attritions
Work Hour Reduction
Table 8: Anticipated Changes to Work Hours
Increasing work hours by 20% (n)
Decreasing work hours by 20% (n)
Full Time 4 59 Definite Plans
Part Time 18 23
Considering/Unsure 18 34
TOTAL 40 116
The workforce appears to be ‘tiring’ with a substantial number of nephrologists
planning to decrease their work hours far outweighing those who intend to
increase hours. From this questionnaire a net loss of 20% of current work
hours by 60 workers (ie 12 FTEs) (conservative figures) within the next five
years is anticipated. This is likely to be an underestimate since the majority of
those planning to decrease work hours have definite plans whereas those
planning to increase work hours are less certain. In addition those planning to
decrease work hours are largely coming from the full time pool whereas those
planning to increase work hours are part time workers.
Retirement
Sixty -seven nephrologists (26%) plan to retire within the next ten years.
Moreover, younger respondents anticipate retiring earlier than older
nephrologists – this may reflect younger cohorts’ decreased income and
AUSTRALIAN NEPHROLOGY WORKFORCE SURVEY: 2007
Page 48 of 71
personal commitments, a greater emphasis placed on lifestyle and/or
difficulty anticipating and predicting a distant event. However, almost one
third of the surveyed population are currently over 55 years and retirement
plans of this group are likely to be more reliable with 28 nephrologists (over
40% of this older group) planning to retire within the next 5 years.
It is also relevant to note that over 80% of this older group (>55 years) are
working in a full time capacity and represent a component of the workforce
with a large base of experience, it is estimated by the Australian Medical
Association 20 that 1.6 physicians are required to replace 1 departing
physician from this experienced workforce cohort. This estimation has not
been incorporated into table 8 and so represents a conservative estimation of
workforce attrition.
Death and Migration
These variables are not known for nephrology but will be expected to have a
small impact on overall numbers The ANZSN has data on those living
overseas who maintain membership, the list is not a complete representation
of all renal physician migrants and there is no time frame to the duration of
expatriation but it provides some reference point and perspective to the
potential magnitude of this variable. In 2007 there were only 21 full members
in the ANZSN database living outside Australia/New-Zealand.
AUSTRALIAN NEPHROLOGY WORKFORCE SURVEY: 2007
Page 49 of 71
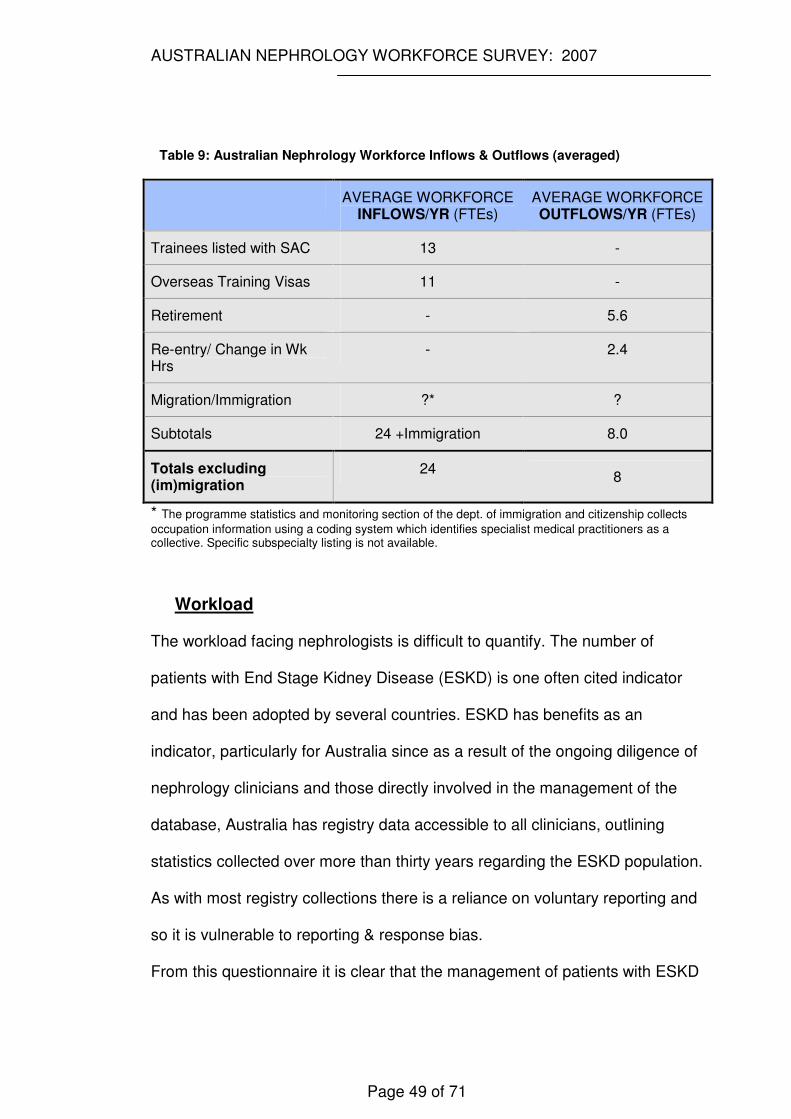
Table 9: Australian Nephrology Workforce Inflows & Outflows (averaged)
AVERAGE WORKFORCE INFLOWS/YR (FTEs)
AVERAGE WORKFORCE OUTFLOWS/YR (FTEs)
Trainees listed with SAC 13 -
Overseas Training Visas 11 -
Retirement - 5.6
Re-entry/ Change in Wk Hrs
- 2.4
Migration/Immigration ?* ?
Subtotals 24 +Immigration 8.0
Totals excluding (im)migration
24 8
* The programme statistics and monitoring section of the dept. of immigration and citizenship collects
occupation information using a coding system which identifies specialist medical practitioners as a collective. Specific subspecialty listing is not available.
Workload
The workload facing nephrologists is difficult to quantify. The number of
patients with End Stage Kidney Disease (ESKD) is one often cited indicator
and has been adopted by several countries. ESKD has benefits as an
indicator, particularly for Australia since as a result of the ongoing diligence of
nephrology clinicians and those directly involved in the management of the
database, Australia has registry data accessible to all clinicians, outlining
statistics collected over more than thirty years regarding the ESKD population.
As with most registry collections there is a reliance on voluntary reporting and
so it is vulnerable to reporting & response bias.
From this questionnaire it is clear that the management of patients with ESKD
AUSTRALIAN NEPHROLOGY WORKFORCE SURVEY: 2007
Page 50 of 71
is only one component of workload, forming around 40% of the clinical
workload and a fifth of the total workload. Any international comparison makes
the potentially erroneous assumption that nephrologists have the same ESKD
workload distribution across various health systems. This is highlighted if the
United States report of nephrologist work practices is reviewed. This often
cited paper ,published in 1997 21,.found that 35% of a nephrologists’ time was
dedicated to the management of ESKD, quite different from the Australian
experience, eleven years later, reporting 20% of work time dedicated to this
aspect of nephrology
If ESKD is used as a benchmark then in Australia in 2007, it is estimated, 278
(FTE) nephrologists provide care for 16 751 (797 per million population)
patients with ESKD 22 or 60 ESKD patients/nephrologist (2.9 patients per
million population/nephrologist)
AUSTRALIAN NEPHROLOGY WORKFORCE SURVEY: 2007
Page 51 of 71
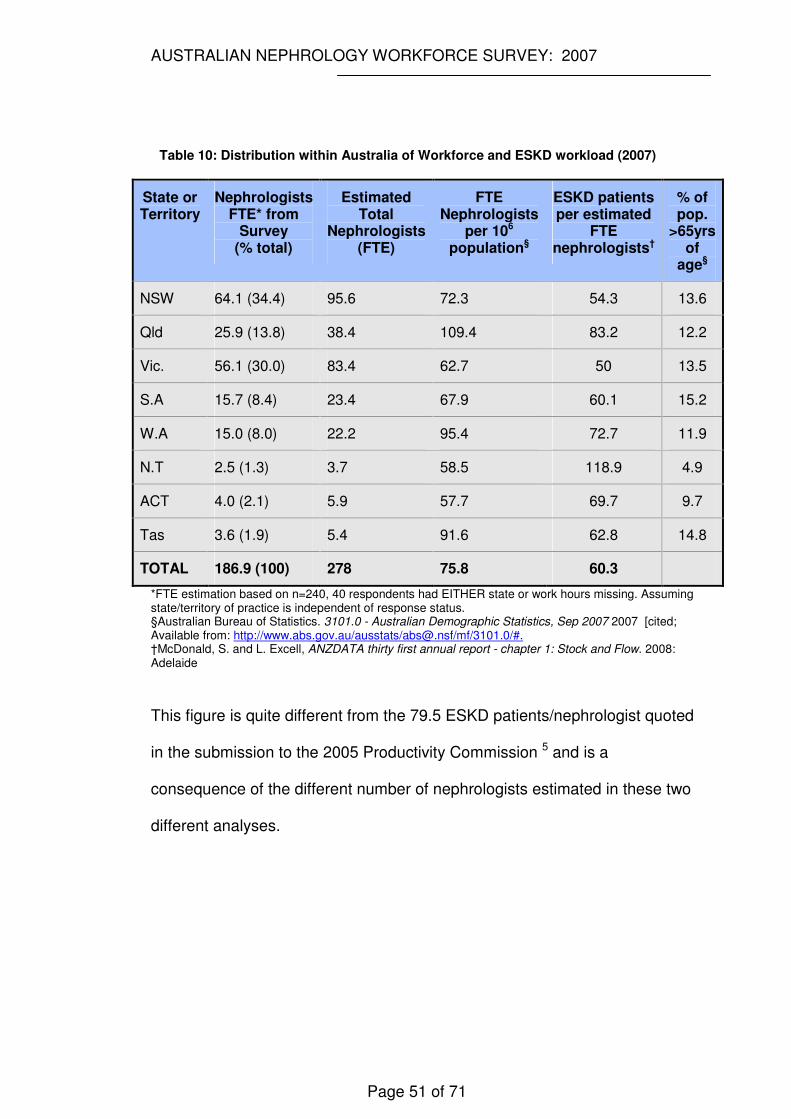
Table 10: Distribution within Australia of Workforce and ESKD workload (2007)
State or Territory
Nephrologists FTE* from
Survey (% total)
Estimated Total
Nephrologists (FTE)
FTE Nephrologists
per 106 population§
ESKD patients per estimated
FTE nephrologists†
% of pop.
>65yrs of
age§
NSW 64.1 (34.4) 95.6 72.3 54.3 13.6
Qld 25.9 (13.8) 38.4 109.4 83.2 12.2
Vic. 56.1 (30.0) 83.4 62.7 50 13.5
S.A 15.7 (8.4) 23.4 67.9 60.1 15.2
W.A 15.0 (8.0) 22.2 95.4 72.7 11.9
N.T 2.5 (1.3) 3.7 58.5 118.9 4.9
ACT 4.0 (2.1) 5.9 57.7 69.7 9.7
Tas 3.6 (1.9) 5.4 91.6 62.8 14.8
TOTAL 186.9 (100) 278 75.8 60.3
*FTE estimation based on n=240, 40 respondents had EITHER state or work hours missing. Assuming state/territory of practice is independent of response status. §Australian Bureau of Statistics. 3101.0 - Australian Demographic Statistics, Sep 2007 2007 [cited; Available from: http://www.abs.gov.au/ausstats/[email protected]/mf/3101.0/#. †McDonald, S. and L. Excell, ANZDATA thirty first annual report - chapter 1: Stock and Flow. 2008: Adelaide
This figure is quite different from the 79.5 ESKD patients/nephrologist quoted
in the submission to the 2005 Productivity Commission 5 and is a
consequence of the different number of nephrologists estimated in these two
different analyses.
AUSTRALIAN NEPHROLOGY WORKFORCE SURVEY: 2007
Page 52 of 71
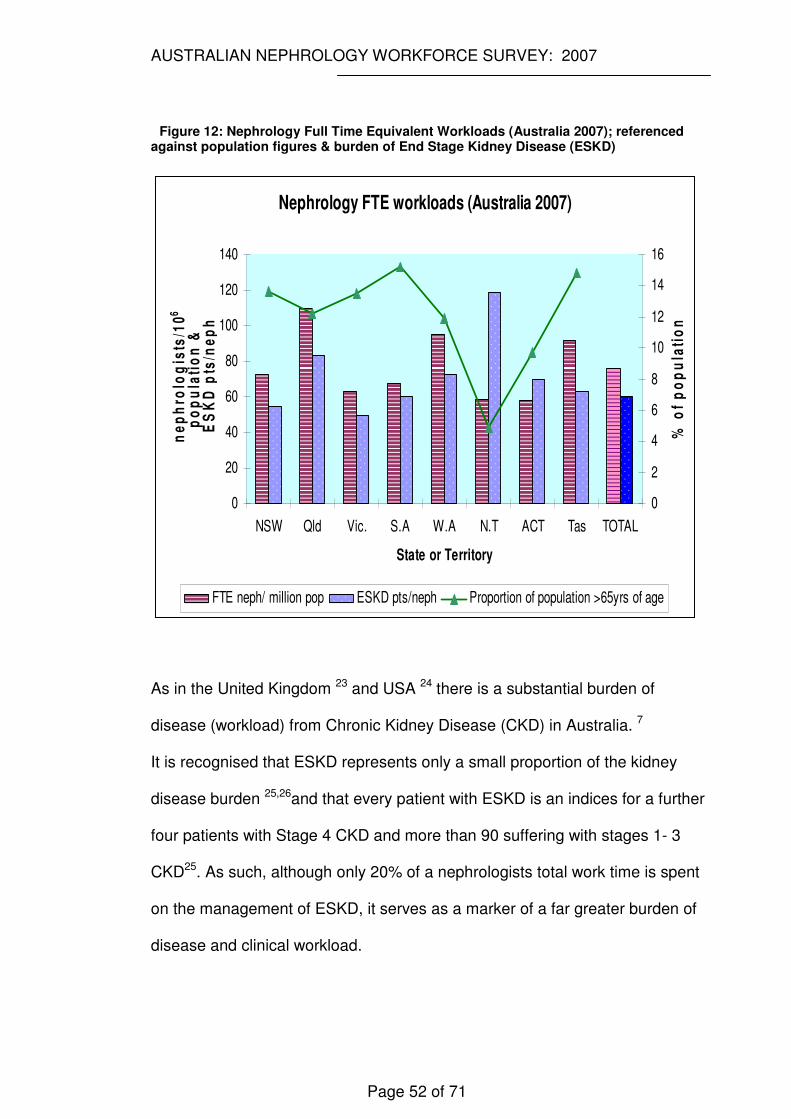
Figure 12: Nephrology Full Time Equivalent Workloads (Australia 2007); referenced against population figures & burden of End Stage Kidney Disease (ESKD)
Nephrology FTE workloads (Australia 2007)
0
20
40
60
80
100
120
140
NSW Qld Vic. S.A W.A N.T ACT Tas TOTAL
State or Territory
ne
ph
rolo
gis
ts/1
06
po
pu
lati
on
& E
SK
D p
ts/n
ep
h
0
2
4
6
8
10
12
14
16
% o
f p
op
ula
tio
n
FTE neph/ million pop ESKD pts/neph Proportion of population >65yrs of age
As in the United Kingdom 23 and USA 24 there is a substantial burden of
disease (workload) from Chronic Kidney Disease (CKD) in Australia. 7
It is recognised that ESKD represents only a small proportion of the kidney
disease burden 25,26and that every patient with ESKD is an indices for a further
four patients with Stage 4 CKD and more than 90 suffering with stages 1- 3
CKD25. As such, although only 20% of a nephrologists total work time is spent
on the management of ESKD, it serves as a marker of a far greater burden of
disease and clinical workload.

AUSTRALIAN NEPHROLOGY WORKFORCE SURVEY: 2007
Page 53 of 71
Any projections of workload also need to incorporate expected changes to
patient survival brought about by advances in health care and the impact of an
ageing population and changing disease profile (increasing incidence of
diabetes mellitus) will have on the prevalence of kidney disease in our
community. An estimate of the impact that the increasing incidence of ESKD
will have on workforce is described. (see Future Nephrology Requirements)
though more extensive projections, however, are beyond the scope of this
report.
Hours Worked
Of full time nephrologists working in Australia, 140 (84%) work more than a
standard 40 hour week without taking into account further on-call (after
hours) commitments. The average weekly work hour of the full time
nephrologist is 52hrs/week.. This compares similarly, perhaps favourably,
with the situation in the UK, USA or Canada
International Comparative Data of Work Hours
Table 11: International Comparison of Nephrologist Work Hours
Country Weekly Work Hours
Australia 521
% of full time Australian nephrologists exceeding 50hrs/week
35
UK 56
% of UK nephrologists exceeding 48hrs/week
412
USA 57.63
AUSTRALIAN NEPHROLOGY WORKFORCE SURVEY: 2007
Page 54 of 71
Canada 56.954
1: Full time workers (defined as working ≥35hrs/week). Part time workers excluded 2: Data from 27 English and Welsh units participating in the UK Renal Registry during a five year period from 2002 3: Ad-hoc Committee on nephrology manpower needs 1997. Executive Summary 4: Royal College of Physicians and Surgeons of Canada
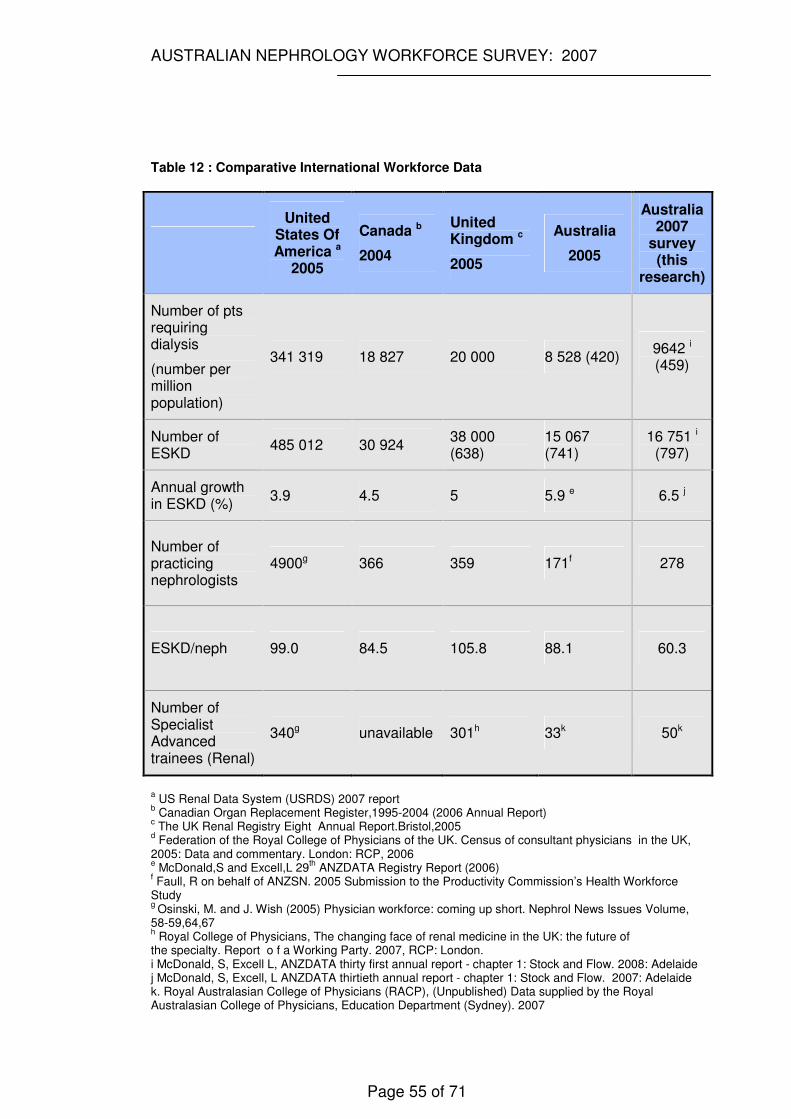
AUSTRALIAN NEPHROLOGY WORKFORCE SURVEY: 2007
Page 55 of 71
Table 12 : Comparative International Workforce Data
United States Of America a
2005
Canada b
2004
United Kingdom c
2005
Australia
2005
Australia 2007
survey (this
research)
Number of pts requiring dialysis
(number per million population)
341 319 18 827 20 000 8 528 (420) 9642 i (459)
Number of ESKD
485 012 30 924 38 000 (638)
15 067 (741)
16 751 i (797)
Annual growth in ESKD (%)
3.9 4.5 5 5.9 e 6.5 j
Number of practicing nephrologists
4900g 366 359 171f 278
ESKD/neph 99.0 84.5 105.8 88.1 60.3
Number of Specialist Advanced trainees (Renal)
340g unavailable 301h 33k 50k
a US Renal Data System (USRDS) 2007 report
b Canadian Organ Replacement Register,1995-2004 (2006 Annual Report)
c The UK Renal Registry Eight Annual Report.Bristol,2005
d Federation of the Royal College of Physicians of the UK. Census of consultant physicians in the UK,
2005: Data and commentary. London: RCP, 2006 e McDonald,S and Excell,L 29
th ANZDATA Registry Report (2006)
f Faull, R on behalf of ANZSN. 2005 Submission to the Productivity Commission’s Health Workforce Study g
Osinski, M. and J. Wish (2005) Physician workforce: coming up short. Nephrol News Issues Volume, 58-59,64,67 h Royal College of Physicians, The changing face of renal medicine in the UK: the future of
the specialty. Report o f a Working Party. 2007, RCP: London. i McDonald, S, Excell L, ANZDATA thirty first annual report - chapter 1: Stock and Flow. 2008: Adelaide j McDonald, S, Excell, L ANZDATA thirtieth annual report - chapter 1: Stock and Flow. 2007: Adelaide k. Royal Australasian College of Physicians (RACP), (Unpublished) Data supplied by the Royal Australasian College of Physicians, Education Department (Sydney). 2007
AUSTRALIAN NEPHROLOGY WORKFORCE SURVEY: 2007
Page 56 of 71
Work Type
The part time workforce is a highly skilled and valuable asset contributing to
the after-hours workload, they are more likely to be engaged in research than
the full time cohort, and have the potential to contribute to future workforce
productivity. At present they represent around 15% of the workforce. 14% of
male nephrologists and 25% of females work part time. Growth in demand for
part time work is likely and the nephrology community needs to proactively
tailor opportunities to retain this subgroup and capitalise on recruitment
opportunities.
FUTURE NEPHROLOGY REQUIREMENTS IN AUSTRALIA
In the USA in 1993, the nephrology community, which was heavily dependent
on overseas trained doctors27 formed the ‘ad hoc committee on nephrology
manpower needs’ with representation from the American Society of
Nephrology and four other major nephrology societies (later forming the
Council of American Kidney Societies- CAKS). The committee commissioned
a workforce study with an aim of determining accurate information predicting
future workforce requirements of Nephrologists21,28 29.
This study remains the most detailed predictive workforce study in nephrology
and our analysis drew heavily on the methodology employed in this earlier
research.
As outlined in the results (p30-31), there are 278 FTE nephrologists estimated
AUSTRALIAN NEPHROLOGY WORKFORCE SURVEY: 2007
Page 57 of 71
to be practicing in Australia in 2007. In this survey, 20% of the total working
hours of the nephrologist were devoted to treating ESKD. i.e. among the 278
FTE nephrologists, 56 are theoretically fully dedicated to the care of ESKD
patients.
Taking this as the standard, projections are made to accommodate the future
number of ESKD patients for the years of 2010, 2013, 2018 and 2028.
Prediction of future ESKD burden is made in two ways:
1. Using the average yearly growth rate in ESKD
2. Considering the trend in the growth rate over years
From 1983 to 2006 30the average annual growth rate of ESKD was 6.5%
(prevalence), giving a projected prevalence for 2008 of 18178 patients
needing renal replacement therapy. Using this scenario, the projections are
furnished in tables 13-15 (for the extended time continuous projections see
appendix B).
Advanced Trainee Requirements
Predictions of future nephrology advanced trainee requirements have been
made using three variables:-
1. The anticipated year of retirement of current nephrologists as reported in
this research (the 2007 Australian Nephrology Workforce Questionnaire).
2. The anticipated first year nephrology advanced trainee numbers,
extrapolated from existing recruitment statistics provided by the Specialist
Advisory Committee (nephrology) of the Royal Australasian College of
Physicians. (see Workforce Additions: Trainees)
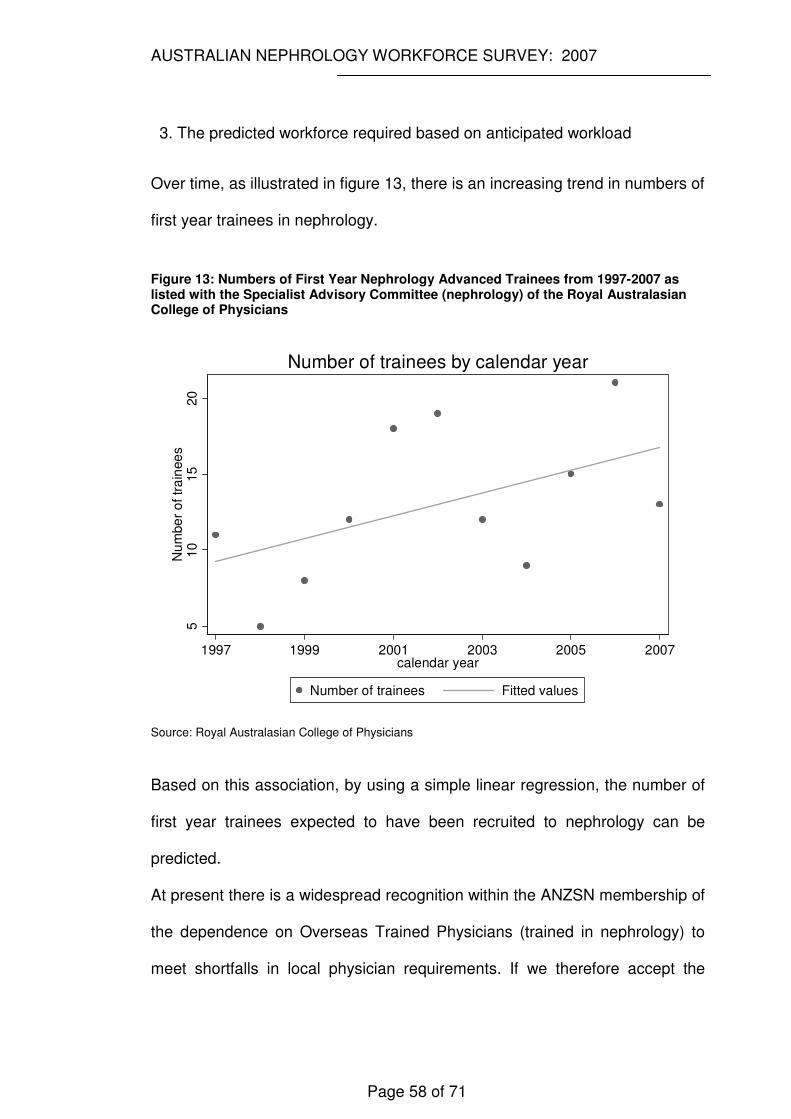
AUSTRALIAN NEPHROLOGY WORKFORCE SURVEY: 2007
Page 58 of 71
3. The predicted workforce required based on anticipated workload
Over time, as illustrated in figure 13, there is an increasing trend in numbers of
first year trainees in nephrology.
Figure 13: Numbers of First Year Nephrology Advanced Trainees from 1997-2007 as listed with the Specialist Advisory Committee (nephrology) of the Royal Australasian College of Physicians
510
15
20
Nu
mbe
r o
f tr
ain
ee
s
1997 1999 2001 2003 2005 2007calendar year
Number of trainees Fitted values
Number of trainees by calendar year
Source: Royal Australasian College of Physicians
Based on this association, by using a simple linear regression, the number of
first year trainees expected to have been recruited to nephrology can be
predicted.
At present there is a widespread recognition within the ANZSN membership of
the dependence on Overseas Trained Physicians (trained in nephrology) to
meet shortfalls in local physician requirements. If we therefore accept the
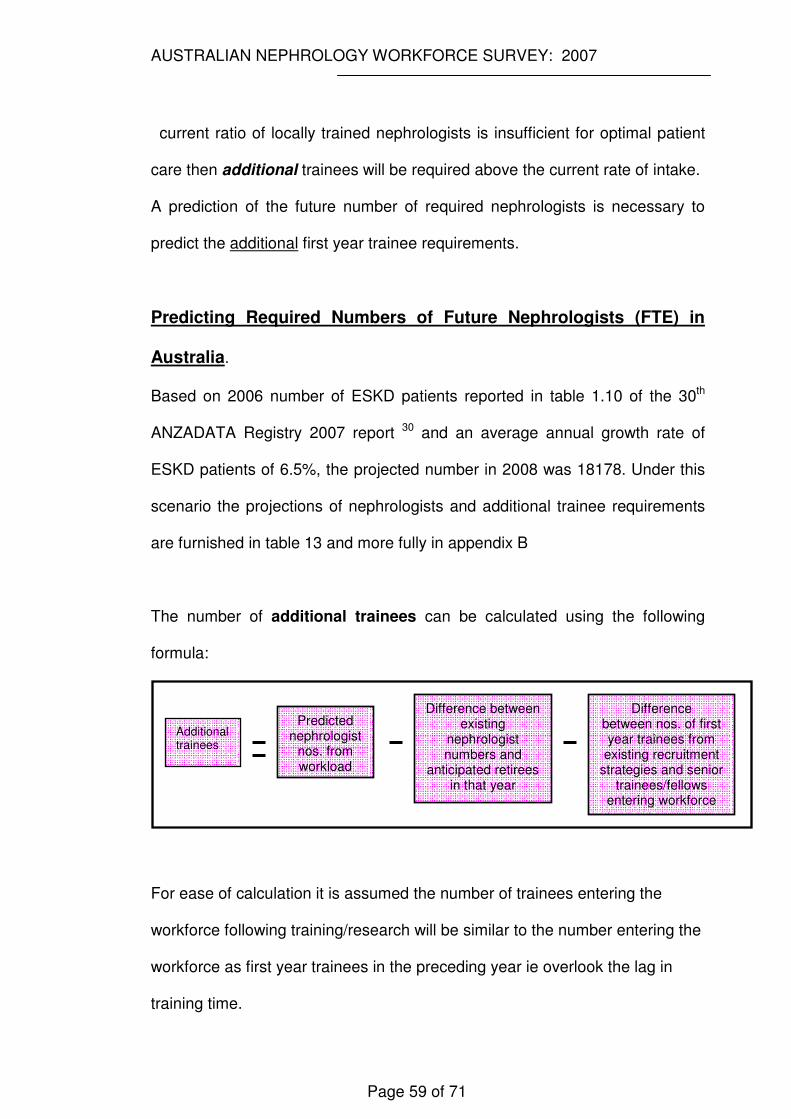
AUSTRALIAN NEPHROLOGY WORKFORCE SURVEY: 2007
Page 59 of 71
current ratio of locally trained nephrologists is insufficient for optimal patient
care then additional trainees will be required above the current rate of intake.
A prediction of the future number of required nephrologists is necessary to
predict the additional first year trainee requirements.
Predicting Required Numbers of Future Nephrologists (FTE) in
Australia.
Based on 2006 number of ESKD patients reported in table 1.10 of the 30th
ANZADATA Registry 2007 report 30 and an average annual growth rate of
ESKD patients of 6.5%, the projected number in 2008 was 18178. Under this
scenario the projections of nephrologists and additional trainee requirements
are furnished in table 13 and more fully in appendix B
The number of additional trainees can be calculated using the following
formula:
For ease of calculation it is assumed the number of trainees entering the
workforce following training/research will be similar to the number entering the
workforce as first year trainees in the preceding year ie overlook the lag in
training time.
Predicted nephrologist
nos. from workload
Difference between existing
nephrologist numbers and
anticipated retirees in that year
Difference between nos. of first year trainees from
existing recruitment strategies and senior
trainees/fellows entering workforce
Additional trainees
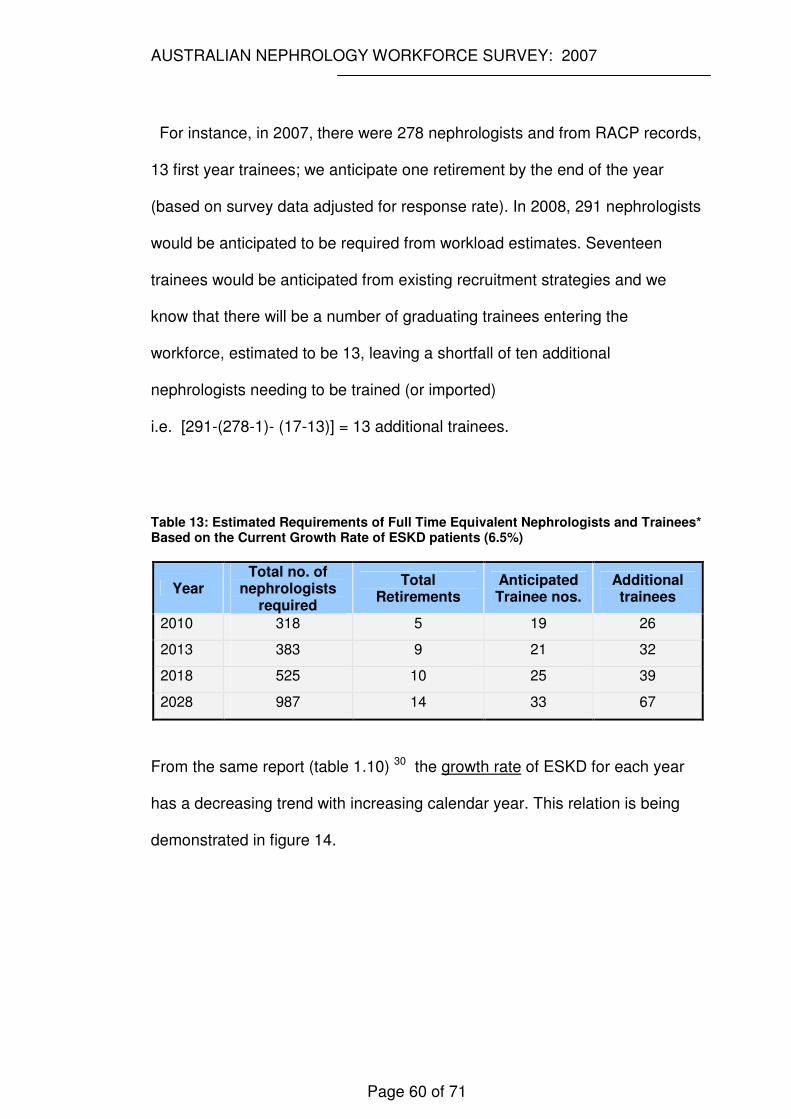
AUSTRALIAN NEPHROLOGY WORKFORCE SURVEY: 2007
Page 60 of 71
For instance, in 2007, there were 278 nephrologists and from RACP records,
13 first year trainees; we anticipate one retirement by the end of the year
(based on survey data adjusted for response rate). In 2008, 291 nephrologists
would be anticipated to be required from workload estimates. Seventeen
trainees would be anticipated from existing recruitment strategies and we
know that there will be a number of graduating trainees entering the
workforce, estimated to be 13, leaving a shortfall of ten additional
nephrologists needing to be trained (or imported)
i.e. [291-(278-1)- (17-13)] = 13 additional trainees.
Table 13: Estimated Requirements of Full Time Equivalent Nephrologists and Trainees* Based on the Current Growth Rate of ESKD patients (6.5%)
Year Total no. of
nephrologists required
Total Retirements
Anticipated Trainee nos.
Additional trainees
2010 318 5 19 26
2013 383 9 21 32
2018 525 10 25 39
2028 987 14 33 67
From the same report (table 1.10) 30 the growth rate of ESKD for each year
has a decreasing trend with increasing calendar year. This relation is being
demonstrated in figure 14.
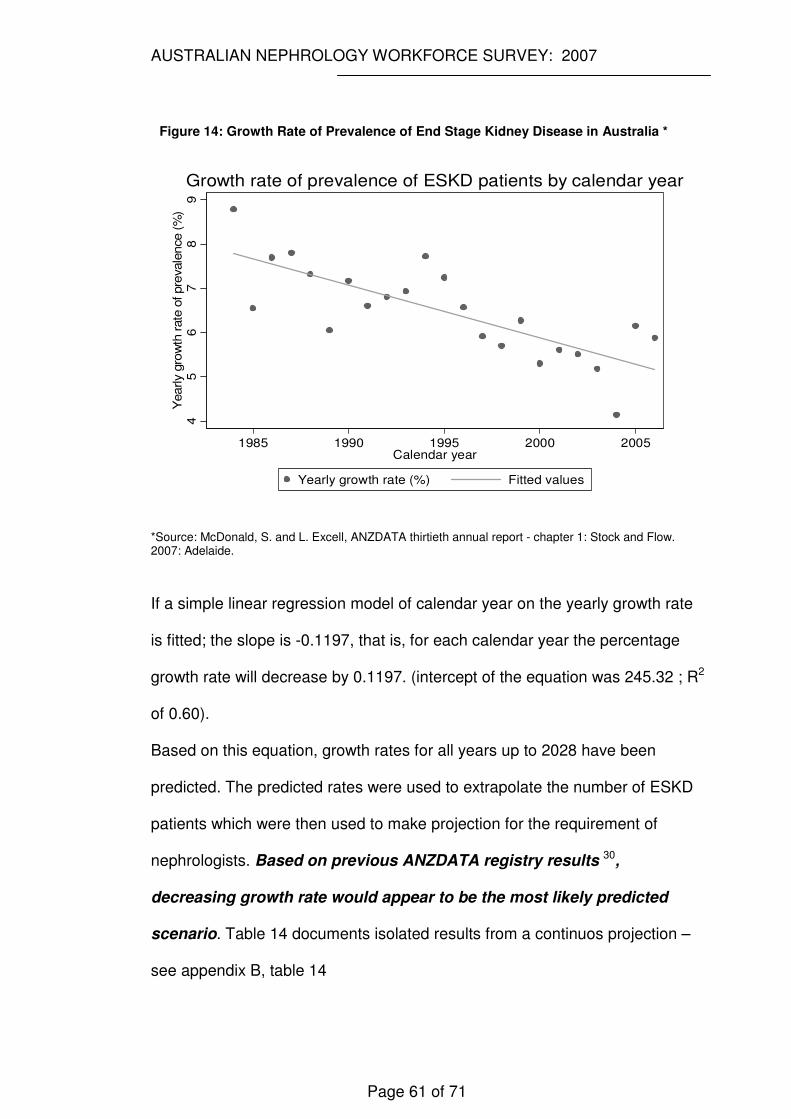
AUSTRALIAN NEPHROLOGY WORKFORCE SURVEY: 2007
Page 61 of 71
Figure 14: Growth Rate of Prevalence of End Stage Kidney Disease in Australia *
45
67
89
1985 1990 1995 2000 2005Calendar year
Yearly growth rate (%) Fitted values
Yearly g
row
th r
ate
of pre
vale
nce (
%)
Growth rate of prevalence of ESKD patients by calendar year
*Source: McDonald, S. and L. Excell, ANZDATA thirtieth annual report - chapter 1: Stock and Flow. 2007: Adelaide.
If a simple linear regression model of calendar year on the yearly growth rate
is fitted; the slope is -0.1197, that is, for each calendar year the percentage
growth rate will decrease by 0.1197. (intercept of the equation was 245.32 ; R2
of 0.60).
Based on this equation, growth rates for all years up to 2028 have been
predicted. The predicted rates were used to extrapolate the number of ESKD
patients which were then used to make projection for the requirement of
nephrologists. Based on previous ANZDATA registry results 30,
decreasing growth rate would appear to be the most likely predicted
scenario. Table 14 documents isolated results from a continuos projection –
see appendix B, table 14
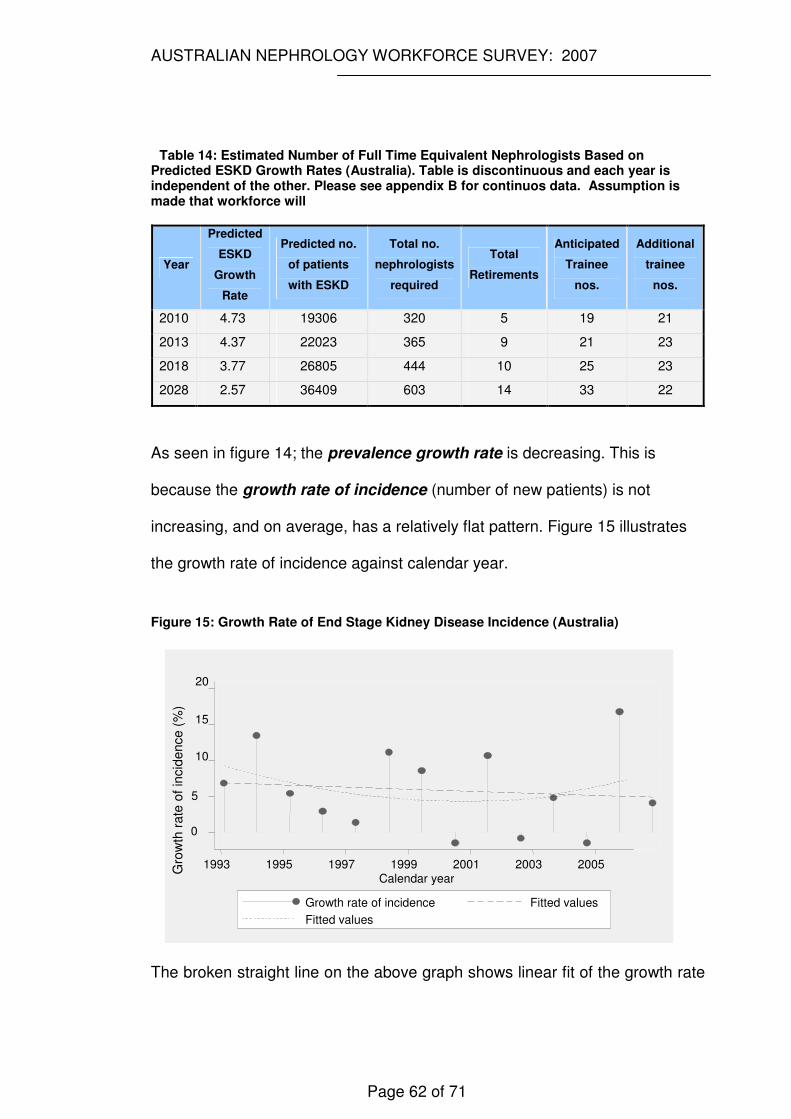
AUSTRALIAN NEPHROLOGY WORKFORCE SURVEY: 2007
Page 62 of 71
Table 14: Estimated Number of Full Time Equivalent Nephrologists Based on Predicted ESKD Growth Rates (Australia). Table is discontinuous and each year is independent of the other. Please see appendix B for continuos data. Assumption is made that workforce will
Year
Predicted
ESKD
Growth
Rate
Predicted no.
of patients
with ESKD
Total no.
nephrologists
required
Total
Retirements
Anticipated
Trainee
nos.
Additional
trainee
nos.
2010 4.73 19306 320 5 19 21
2013 4.37 22023 365 9 21 23
2018 3.77 26805 444 10 25 23
2028 2.57 36409 603 14 33 22
As seen in figure 14; the prevalence growth rate is decreasing. This is
because the growth rate of incidence (number of new patients) is not
increasing, and on average, has a relatively flat pattern. Figure 15 illustrates
the growth rate of incidence against calendar year.
Figure 15: Growth Rate of End Stage Kidney Disease Incidence (Australia)
The broken straight line on the above graph shows linear fit of the growth rate
0
5
10
15
20
1993 1995 1997 1999 2001 2003 2005Calendar year
Growth rate of incidence Fitted values Fitted values
Gro
wth
rate
of
incid
ence (
%)
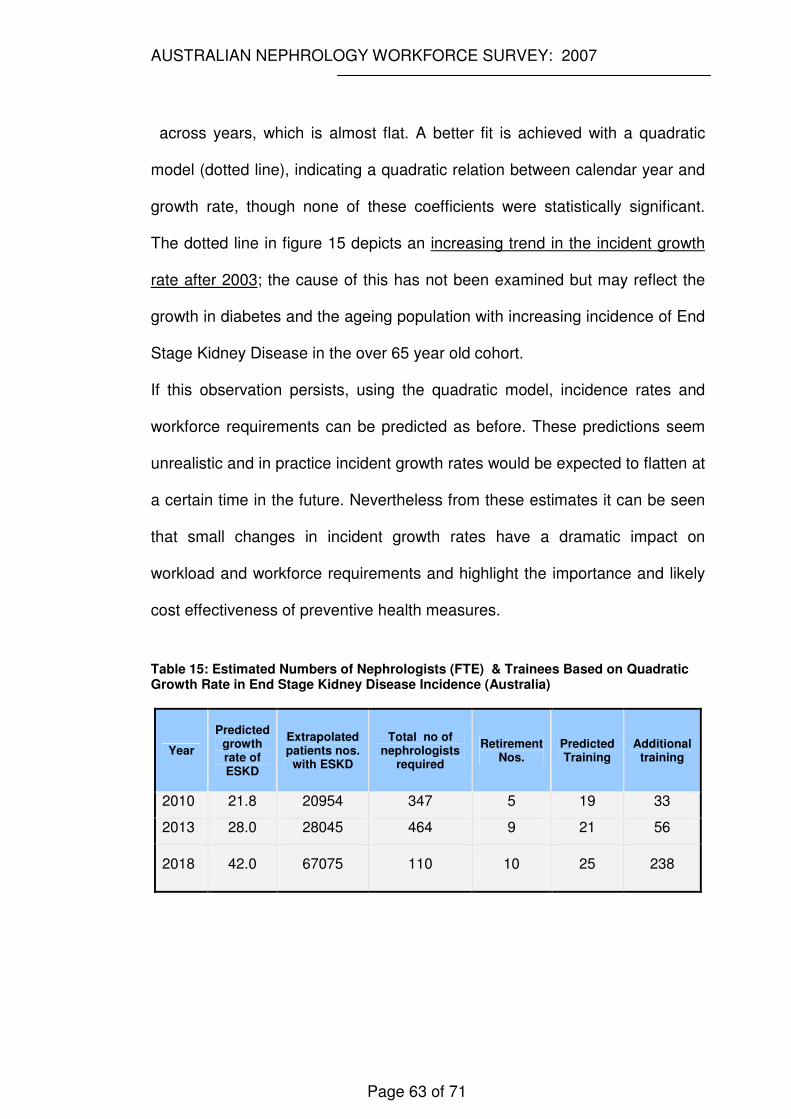
AUSTRALIAN NEPHROLOGY WORKFORCE SURVEY: 2007
Page 63 of 71
across years, which is almost flat. A better fit is achieved with a quadratic
model (dotted line), indicating a quadratic relation between calendar year and
growth rate, though none of these coefficients were statistically significant.
The dotted line in figure 15 depicts an increasing trend in the incident growth
rate after 2003; the cause of this has not been examined but may reflect the
growth in diabetes and the ageing population with increasing incidence of End
Stage Kidney Disease in the over 65 year old cohort.
If this observation persists, using the quadratic model, incidence rates and
workforce requirements can be predicted as before. These predictions seem
unrealistic and in practice incident growth rates would be expected to flatten at
a certain time in the future. Nevertheless from these estimates it can be seen
that small changes in incident growth rates have a dramatic impact on
workload and workforce requirements and highlight the importance and likely
cost effectiveness of preventive health measures.
Table 15: Estimated Numbers of Nephrologists (FTE) & Trainees Based on Quadratic Growth Rate in End Stage Kidney Disease Incidence (Australia)
Year
Predicted growth rate of ESKD
Extrapolated patients nos.
with ESKD
Total no of nephrologists
required
Retirement Nos.
Predicted Training
Additional training
2010 21.8 20954 347 5 19 33
2013 28.0 28045 464 9 21 56
2018 42.0 67075 110 10 25 238
AUSTRALIAN NEPHROLOGY WORKFORCE SURVEY: 2007
Page 64 of 71
CONCLUSION AND RECOMMENDATIONS
The above discussion has focussed on unavoidably imprecise manpower
predictions. Unforseen and poorly predictable variables inevitably mean such
predictions can only seek to estimate future workforce requirements. This
should not distract from those elements which have been established from this
study, namely:-
1. The solution to the current nephrology workforce ‘crisis’ must
incorporate a focus toward recruitment - more young doctors need to be
attracted into a career in nephrology. Using the conservative model of
decreasing growth rate– see table 13 and appendix B ; it is necessary to
attract approximately 20 additional first year advanced trainees (ie
approximately 40 first year trainees) into nephrology per year to simply
maintain a workforce status quo. This does not consider ongoing losses
due to decreasing participation rates. Our previous research has clearly and
statistically shown that to attract more trainees into nephrology we must not
only expose them to renal medicine early in their postgraduate career but
also ensure this exposure is enjoyable and interesting and that trainees feel
incorporated into the department. The influence of a strong mentor and role
model can not be understated.
2. Some areas have a full complement of trainees but this may still be
insufficient for service needs. Regardless of modelling techniques employed
it is clear that the growth in End Stage Renal Failure is increasing at a
AUSTRALIAN NEPHROLOGY WORKFORCE SURVEY: 2007
Page 65 of 71
greater rate than our current recruitment. Additional training posts are
required and such posts require funding. Increases in training posts need to
be undertaken in areas with established service needs and in areas with
high proportions of patients with End Stage Renal Failure and Chronic
Kidney Disease. A national approach to facilitating such training posts may
be more efficient and easier to coordinate than individual state based
endeavours given the recognised funding difficulties within the various state
& territory based health services. Funding of posts needs to incorporate the
increased supervisory requirements which must accompany increased
trainee numbers if the training is to be educationally successful and meet
educational credentialing criteria.
3. Although part time training and specialist positions appear to reduce the
available workforce in the short term the long term benefits of such
workpractices should not be overlooked as they feed positively into
recruitment of trainees (particularly given the changing demographics and
greater demands for maternity/paternity leave) . From this research part time
workers report greater control of their workhours (?satisfaction) and a
willingness to reenter the workforce. Opportunities must be proactively
tailored to attract and retain this valuable workforce subgroup.
4. Improving remuneration, particularly for those nephrologists providing renal
services to rural and remote Australia may assist in improving equity of renal
health service delivery, qualitative results from this questionnaire describe a
AUSTRALIAN NEPHROLOGY WORKFORCE SURVEY: 2007
Page 66 of 71
perception that current compensation is insufficient for the additional ‘after-
care’ work required in these rural/remote sites. Remuneration associated
with dialysis was identified as a separate issue, particularly surrounding the
Medicare billing system for dialysis patients and the perceived lack of
adequate funding for dialysis supervision. Recent changes in Medicare
billing around this issue may have provided some level of relief to this
problem.
5. Improving the efficiency of the existing nephrologists. Inadequate
secretarial and administrative support, along with issues such as restricted
access (or the requirement of time consuming paperwork) to required
pharmaceuticals under the Pharmaceutical Benefits Scheme (PBS)/Authority
Scheme limits the efficiency of the current workforce. Insufficient renal
donors, forcing dialysis as a modality over transplantation further exacerbate
the workload and costs associated with renal health care
.
6. Although not specific to nephrology, there is some evidence 31 that specialty
practice location is related to training exposure. This raises the possibility of
providing rural practice exposure within the nephrology training program as
one possible method of encourageing future rural/ remote nephrology
service delivery. Such an option is not without short term barriers. At present
insufficient supervisory capacity exists in these sites and would require
remote supervision or an increase in remuneration to attract supervisors to
these areas. Another barrier is the relative unattractiveness of these
AUSTRALIAN NEPHROLOGY WORKFORCE SURVEY: 2007
Page 67 of 71
rotations when compared with metropolitan sites in both renal and other
subspecialties. This has particular import for nephrology, already
experiencing recruitment difficulties. Such an option would only be palatable
for nephrology if all subspecialties agreed to implement this component to
training
7. Consideration needs to be given to restructuring the way renal health
services are delivered. At present there is still a heavy reliance on hospital
based, rather than a chronic disease management model with a focus on
community based health care delivery. Institution based health care is likely
to be more costly and far more inefficient compared to a community based
model.
8. Trainees need to be exposed to research yet whether their final year should
be non-clinical based is questionable from both an educational and
workforce perspective. Increasing clinical exposure and enhancing clinical
service delivery with research undertaken post fellowship may be a more
effective strategy and would have the additional benefit of increasing
effective trainee numbers and providing some relaxation of the clinical
demands on consultants, enabling better supervision of these clinically
active trainees. A research focus should not be lost and should be delivered
utilising the current project requirements.
9. Re evaluation of the curriculum is timely and emphasis should be given to
AUSTRALIAN NEPHROLOGY WORKFORCE SURVEY: 2007
Page 68 of 71
areas reflected by the vocational needs of the nephrologist. Areas such as
clinical nephrology particularly dialysis and chronic kidney disease and
research are areas currently consuming a large amount of a nephrologists’
time. The curriculum must reflect these needs along with training in
administration/managerial issues and basic principles of how to teach
efficiently eg teaching on the run courses
10. Opportunities exist for workforce redesign with the development of
supportive roles such as the ‘Career Medical Officer’ or ‘Hospitalist’ position
in nephrology. Such doctors can become trained alongside nephrology
advanced trainees but remain in hospital based practice covering areas such
as dialysis units and outpatient clinics.
11. Policy need to be developed at a Commonwealth level to ensure:-
a. The workforce and workload predictions in this report are more formally
developed and reassessed on a biannual basis, thereafter in
consultation with ANZSN
b. Funding is planned now for the additional nephrologist positions and for
the additional first year advanced trainees required by 2018.
c. Discussion and decision around the ethics of recruiting overseas
trained nephrologists from countries less affluent than Australia.
The results from this survey and analysis provide new insights into the current
state of the nephrology workforce in Australia. It is hoped this report will be of

AUSTRALIAN NEPHROLOGY WORKFORCE SURVEY: 2007
Page 69 of 71
assistance to the ANZSN and feedback is welcome.
2007 Australian Nephrology Workforce Questionnaire
Appendix page I
REFERENCES
1. Couser WG. The Nephrology Manpower Study: what does it mean and what do we
do now? J Am Soc Nephrol 1997;8(5):843-845.
2. Mitch W, McClellan W. Patterns of patient care reported by nephrologists:
Implications for nephrology training. American Journal of Kidney Diseases
1998;32(4):551-556.
3. Australian Medical Workforce Advisory Committee (AMWAC). Sustainable
Specialist Services: A Compendium of Requirements, 1998.
4. Australian Medical Workforce Advisory Committee (AMWAC). Sustainable
Specialist Services: A Compendium of Requirements - 2004 Update. Sydney, 2004:1
- 127.
5. Faull R. Submission to the Productivity Commission's Health Workforce Study, on
behalf of the Australia and New Zealand Society of Nephrology 2005.
6. Productivity Commission. Australia's Healthworkforce. Canberra, 2005.
7. Australian Institute of Health and Welfare. Chronic kidney disease in Australia.
Canberra: AIHW, 2005.
8. Royal Australasian College of Physicians (RACP). SAC and recording of specialist
details. Email from Lynny Groshinski ed, 2006.
9. SPSS Statistics 17.0 [program]. Chicago, 2008.
10. NVivo qualitative data analysis software [program]. 8 version, 2008.
11. Dillman DA. The Design and Administration of Mail Surveys. Annual Review of
Sociology 1991;17:225-249.
12. Fox RJ, Crask MR, Kim J. Mail Survey Response Rate; A meta-anlysis of
selected techniques for inducing response. Public Opinion Quarterly 1988;52(4):467 -
491.
13. Goyder J. Further evidence on factors affecting response rates to mailed
questionnaires. American Sociological Review 1982;47:550-553.
14. Australian Bureau of Statistics. 1216.0 - Australian Standard Geographical
Classification (ASGC), 2006.
15. Hooton K. Geographical Classifications used by the Australian Bureau of
Statistics: Personal Communication. Geography Section - Australian Bureau of
Statistics ed: Geography Section - Australian Bureau of Statistics, 2008.
16. Royal Australasian College of Physicians ED. Nephrology Trainee numbers 1997-
2009. Data from the Royal Australasian College of Physicians, 2005.

2007 Australian Nephrology Workforce Questionnaire
Appendix page II
17. McDonald S, Excell L, Chang S. ANZDATA thirtieth annual report - contents and
summary, 2007.
18. Council of Australian Governments (COAG). COAG Communique 26 March
2008. http://www.coag.gov.au/coag_meeting_outcomes/2008-03-
26/index.cfm#health. Adelaide, 2008.
19. Australian Commonwealth Department of Immigration and Citizenship;
Programme Statistics and Monitoring Section. Overseas Trained Nephrologists;
Personal Communication. Canberra, 2008.
20. Australian Medical Association. Australian Medical Association Response to the
Productivity Commission’s Position Paper On Australia’s Health Workforce. canberra:
ama, 2005.
21. Ad Hoc Committee on Nephrology Manpower Needs. Estimating workforce and
training requirements for nephrologists through the year 2010. . JAm Soc Nephrol
1997;8[Suppl 9]:1-32.
22. McDonald S, Excell L. ANZDATA thirty first annual report - chapter 1: Stock and
Flow. Adelaide, 2008.
23. Ahmad A, Roderick P, Ward M, Steenkamp R, Burden R, O'Donoghue D, et al.
Current chronic kidney disease practice patterns in the UK: a national survey. Qjm
2006;99(4):245-251.
24. U.S. Renal Data System. (USRDS) 2007. U.S. Renal Data System, USRDS 2007
Annual Data Report: Atlas of End-Stage Renal Disease in the United States,National
Institutes of Health, National Institute of Diabetes and Digestive and Kidney
Diseases, Bethesda, MD, 2005.
. Annual Data Report: Atlas of End-Stage Renal Disease in the United States,.
Bethesda, MD.: National Institutes of Health, National Institute of Diabetes and
Digestive and Kidney Diseases, , 2007.
25. Chadban S, Briganti EM, Kerr PG, Dunstan DW, Welborn TA, Zimmet PZ, et al.
Prevalence of Kidney Damage in Australian Adults: The AusDiab Kidney Study. J Am
Soc Nephrol 2003;14(S131-S138).
26. Mathew TH, Corso O. Review article: Early detection of chronic kidney disease in
Australia: Which way to go? Nephrology 2009;14:367-373.
27. Graduate medical education [Appendix II, Table I ]. JAMA 1996;276:739-748.
28. Ad Hoc Committee on Nephrology Manpower Needs. Estimating workforce and
training requirements for nephrologists through the year 2010. Ad Hoc Committee on

2007 Australian Nephrology Workforce Questionnaire
Appendix page III
Nephrology Manpower Needs: Executive Summary. J Am Soc Nephrol 1997;8(5
suppl 9):S9-S13,i-xxii, 1-32 passim.
29. Neilson E, Hull A, Wish J, Neylan JF, Sherman D, Suki WN, et al. Ad Hoc
Committee Report on Estimating the Future Workforce and Training Requirements
for Nephrology. Journal of American Society of Nephrology 1997;8(5 (Suppl 9)):S1-
S4.
30. McDonald S, Excell L. ANZDATA thirtieth annual report - chapter 1: Stock and
Flow. Adelaide, 2007.
31. Ward A, Kamien M, Lopez D. Medical career choice and practice location: early
factors predicting course completion, career choice and practice location. Med Educ
2004;38:239-248.
APPENDIX A
Two versions of the Australian Nephrology Workforce Survey exist; the
electronic version.
notes1-med.med.unsw.edu.au/surveys/renal.nsf/RecordPrefs?OpenForm
and hardcopy version appendix page II

2007 Australian Nephrology Workforce Questionnaire
Appendix page II
DEMOGRAPHICS
1. Are you
� Male
� Female
2. What is your year of birth? _ _ _ _
3. Are you married or in a permanent long term relationship?
� No
� Yes If Yes: 3b. Does your spouse/partner work?
� Yes, works in full time paid employment
� Yes, works in part time paid employment
� No does not work in paid employment
4. Do you have children?
� No
� Yes If Yes: 4b. Do they live with you?
� Yes
� No
Nephrology is currently suffering a widespread workforce shortage that is likely to be exacerbated by demands from an increasing patient burden (aging population with increasing incidence of diseases with known renal associations such as diabetes and obesity) and a current undersupply of physicians who are not driven to pursue nephrology. As increasing levels of undergraduates emerge from new medical schools it is likely there will be a competitive recruitment drive amongst subspecialties. Successful government lobbying to increase training numbers and sites (private practice) will depend on the provision of accurate figures regarding workloads. The key performance indicator of waiting time is unlikely to be regarded as reliable in the future and has previously been shown to be open to manipulation. Please assist by providing the most accurate and reliable information you can. Your comments will be incorporated into the final analysis and report. In piloting, this questionnaire has only taken 9 minutes to complete. For your convenience, it is also available on-line at http://www.med.unsw.edu.au/surveys/renal.nsf/RecordPrefs PLEASE ONLY COMPLETE ONE
SURVEY Cathie Lane. On behalf of New South Wales Renal Services Network (Workforce, Education and

2007 Australian Nephrology Workforce Questionnaire
Appendix page III
5. Do any of your children require day care?
� Yes
� No
6. Are any of your children attending school?
� Yes
� No
7. If you have children do day-care or school commitments reduce the hours you are able to work?
� Yes
� No
8. At what age do you intend to completely retire from nephrology
practice? _______ years
TRAINING
9. Did you complete your undergraduate medical degree in Australia?
� No � Yes
10. Do you have another undergraduate degree/qualification?
� Yes. Please specify ________________________
� No.
11. Do you have a postgraduate degree/qualification?
2007 Australian Nephrology Workforce Questionnaire
Appendix IV
� Yes. Please specify ________________________
� Currently completing
� No.
12. Did you undertake nephrology specialty training in Australia?
� No � Yes
13. Do you have specialty training in another field (excluding general medicine) recognised by the Royal Australasian College of Physicians?
� No � Yes
SITE OF PRACTICE
14. In which Australian state do you undertake the majority of your work? Please select only one category
� QLD
� NT
� NSW
� VIC
� TAS
� ACT
� SA
� WA
15. What are the main locations where you have worked in the last 4 weeks? Please indicate the postcode (or name of the town/suburb & state) and the hours worked.
Postcode Total Hours Worked
Location
First Location
Second Location
Third Location
Fourth Location

2007 Australian Nephrology Workforce Questionnaire
Appendix V
WORK HOURS
16. 'Part time' work is defined as less than 36hrs/week. Would you describe your usual working week as
� Full Time
� Part Time (<36 hours/week)
� Temporarily Not Working
� Permanently Left Workforce
17. On average, please indicate how many hours a week you work as a nephrologist (EXCLUDE ON-CALL).
� 4-10
� 11-35
� 36-40
� 41-50
� 51-60
� 61-80
� 81-100
� >100
18. Do you have on-call duties during your usual working week?
� No
� Yes If Yes 18b: How many hours are worked on-call/week
(please average rosters out to a weekly quota)
� <5
� 5-10
� 11-
3
0
� 31-40
� 41- 50
� 51- 70
� 71 -100
� >100
� Unable to calculate
2007 Australian Nephrology Workforce Questionnaire
Appendix VI
TYPE OF PRACTICE
19. Please indicate the practice mix that best describes your usual working week
� Full time salaried university/research appointment with no clinical
nephrology
� Full time salaried university/research appointment involving
clinical nephrology
� Full time salaried public hospital appointment involving clinical
nephrology
� Part time Public hospital and part time research
� Part time private practice and part time research
� Full time private practice with a public/private hospital VMO
position
� Full time private practice without a hospital appointment.
� Other. Please specify _________________________
20. Do you intend to permanently reduce the hours you work by > 20%?
� Unsure
� No
� Yes If Yes 20b. When do you plan to do this?
� Now
� In 2-5 years
� In 6 -10
� In 11-15 years
� >15 years from now

2007 Australian Nephrology Workforce Questionnaire
Appendix VII
21. Do you intend to permanently increase the hours you work by > than 20%?
� Unsure
� No
� Yes If Yes 21b. When do you plan to do this?
� Now
� In 2-5
� In 6-10 years
� In 11-15 years
� >15 years from now
22. Do you feel able to control your work hours?
� Yes
� No If No PLEASE indicate the reason(s) for this
23. Please indicate the percentage of your work dedicated to the following categories
Proportion of weekly work time (%)
Administration
Teaching
Continuing Medical Education
Clinical Nephrology
Other Clinical Specialty Work eg
General Medicine, Nuclear Med
Research
Other professional duties
Medicolegal
Other (please specify)
TOTAL 100
2007 Australian Nephrology Workforce Questionnaire
Appendix VIII
24. Do you personally perform central vascular access procedures?
� No � Yes
25. Do you personally perform renal biopsy procedures?
� No � Yes
CLINICAL NEPHROLOGY
If you do not provide a clinical service please go to question 28.
26. If you undertake clinical nephrology. Please indicate the percentage of your clinical workload spent with each patient group.
Proportion of Clinical
Workload %
Dialysis (both HD and PD)
Hypertension
Chronic Kidney Disease (CKD)
Acute Renal Transplantation
Long Term Follow-Up of Renal Transplant
Renal Donor Suitability
Obstetric Medicine
General Medicine in the non-nephrology
patient
OTHER - Please Specify
TOTAL 100
27. If you undertake clinical nephrology are you personally involved in providing clinical care to rural or remote areas?
� No
� Yes

AUSTRALIAN NEPHROLOGY WORKFORCE SURVEY: 2007
IX
28. What do you see as the greatest issues impacting on nephrology service provision?
29. Do any current regulations impact negatively on the care you are able to provide to your patients?
� No
� Yes. Please indicate what these are.
THANK YOU FOR YOUR TIME IN FILLING IN THIS SURVEY
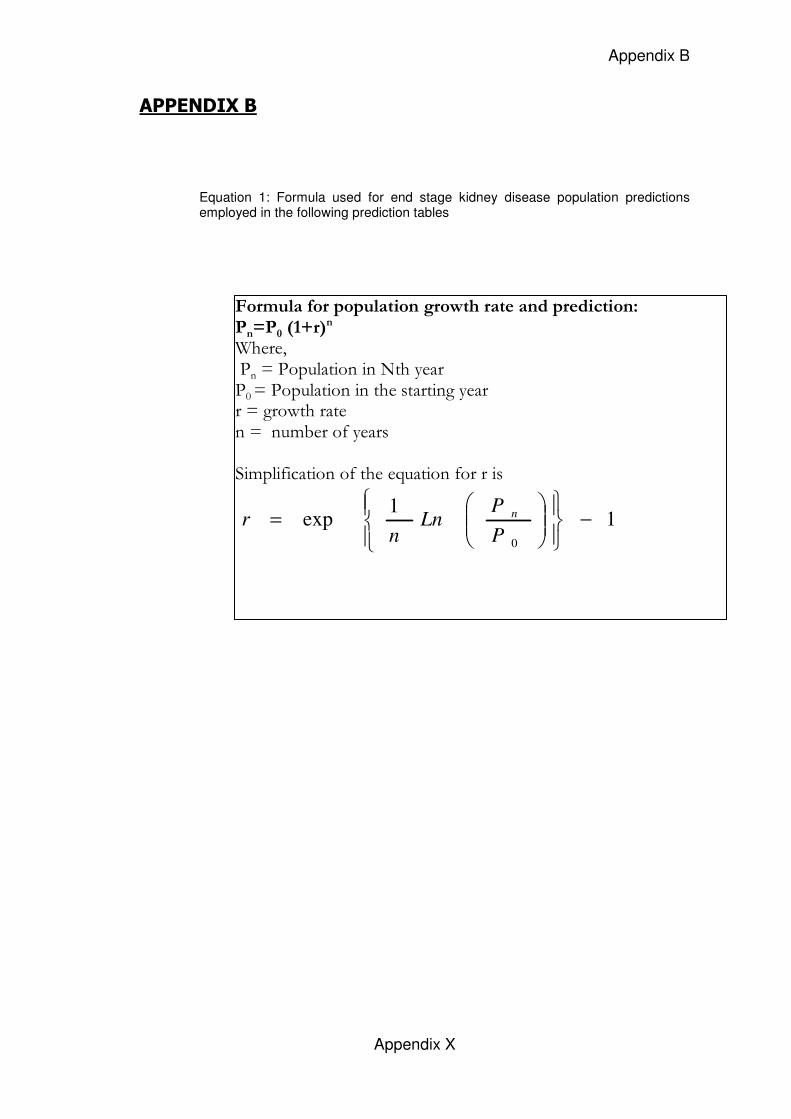
Appendix B
Appendix X
APPENDIX B
Equation 1: Formula used for end stage kidney disease population predictions employed in the following prediction tables
Formula for population growth rate and prediction:
Pn=P0 (1+r)n
Where, Pn = Population in Nth year P0 = Population in the starting year r = growth rate n = number of years Simplification of the equation for r is
−
= 1
1exp
0P
PLn
nr
n
Appendix B
Appendix XI
Table 13: Continuous Data Explanatory Notes Predictions if End Stage Kidney Disease growth rate fixed at 6.5%pa
The first row of figures is based on direct report from the survey results (eg
anticipated retirement) or from figures from the 2008 ANZSN yearly report.
These figures are used as the baseline in the subsequent calculations.
Predicted rate (%) = the growth rate of ESKD patients predicted by using the
simple linear regression model graphically presented in Figure 14 of the
report. The equation is: growth rate= 245.3233-0.1197x (calendar year)
Predicted ESKD population =No of ESKD patients predicted from the
previously predicted growth rate according to the equation: ESKD population
in the year=ESKD population in the previous year(1+ growth rate); where
16027 is the ESKD population in 2006 as reported in table 1.10 of chapter 1:
Stock and Flow. 2007
N_ESKD_Req = Number of nephrologists required only for ESKD patients,
calculated according to the equation: N_ESKD_Req=56/17678.36x(ESKD
population in that year); where 17678.36 is the predicted ESKD population in
2008 for which there are 56 nephrologists.
N_Tot_Req. = Total number of nephrologists required, calculated assuming
that 20% time of the total time of the nephrologists is spent on ESKD
patients.
Predicted Trainees = number of nephrologists requiring training predicted
from the simple linear regression model graphically presented in Figure 13 of
the report. The equation is : training= -1497.6+0.7545455x(calendar year)
Additional trainees required = training required on top of the predicted
training, calculated from the equation: additional training=Total nephrologists
required -Total nephrologists required in the previous year-adjusted number
of anticipated retirement in the previous year_ first year trainees in previous
year-predicted number of first year trainees
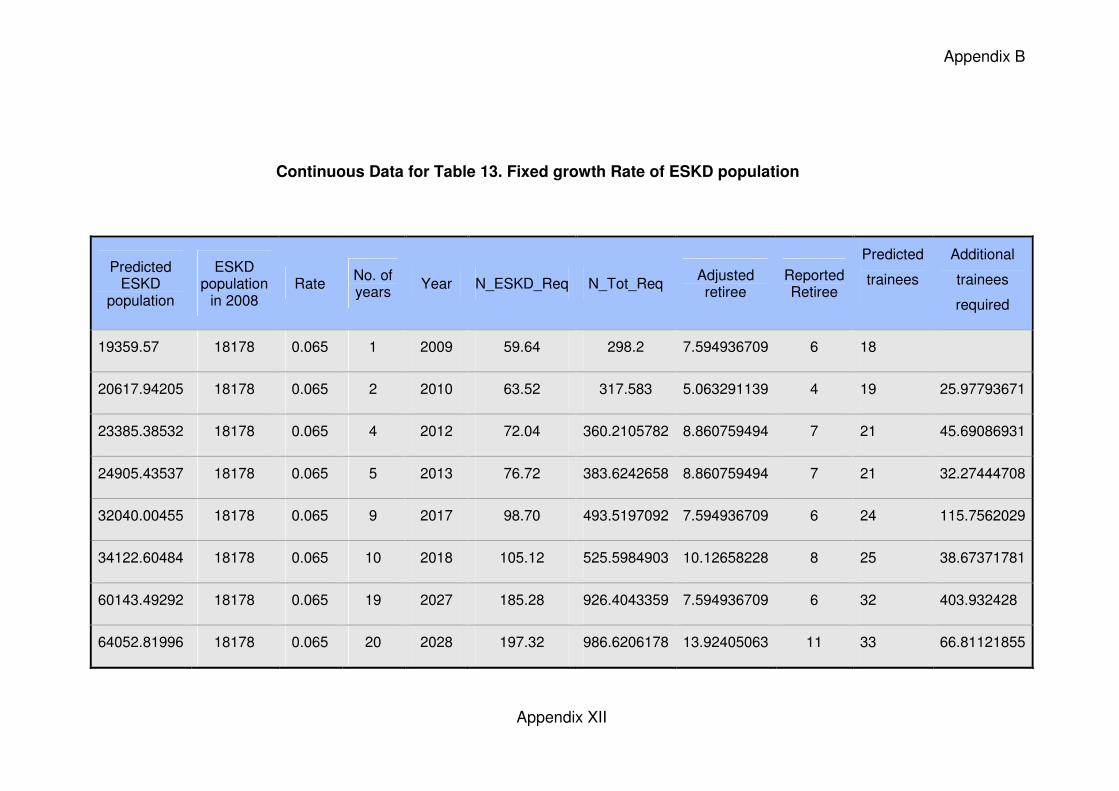
Appendix B
Appendix XII
Continuous Data for Table 13. Fixed growth Rate of ESKD population
Predicted ESKD
population
ESKD population
in 2008 Rate
No. of years
Year N_ESKD_Req N_Tot_Req Adjusted retiree
Reported Retiree
Predicted
trainees
Additional
trainees
required
19359.57 18178 0.065 1 2009 59.64 298.2 7.594936709 6 18
20617.94205 18178 0.065 2 2010 63.52 317.583 5.063291139 4 19 25.97793671
23385.38532 18178 0.065 4 2012 72.04 360.2105782 8.860759494 7 21 45.69086931
24905.43537 18178 0.065 5 2013 76.72 383.6242658 8.860759494 7 21 32.27444708
32040.00455 18178 0.065 9 2017 98.70 493.5197092 7.594936709 6 24 115.7562029
34122.60484 18178 0.065 10 2018 105.12 525.5984903 10.12658228 8 25 38.67371781
60143.49292 18178 0.065 19 2027 185.28 926.4043359 7.594936709 6 32 403.932428
64052.81996 18178 0.065 20 2028 197.32 986.6206178 13.92405063 11 33 66.81121855
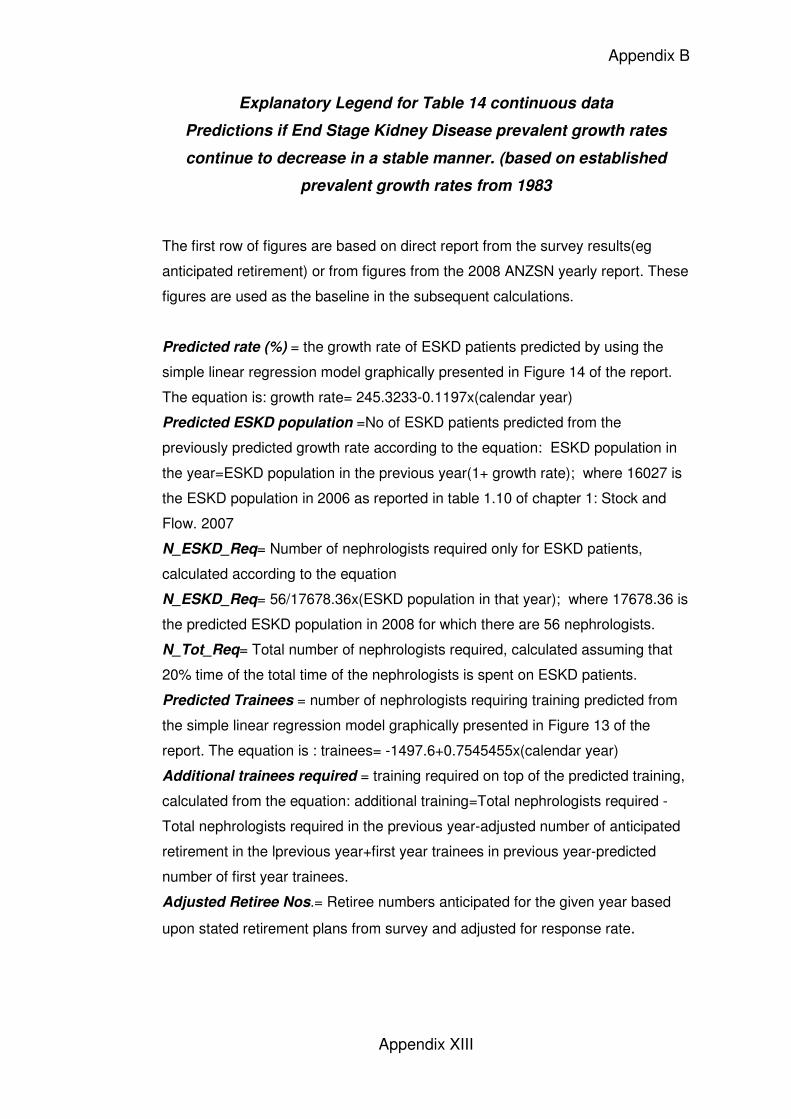
Appendix B
Appendix XIII
Explanatory Legend for Table 14 continuous data
Predictions if End Stage Kidney Disease prevalent growth rates
continue to decrease in a stable manner. (based on established
prevalent growth rates from 1983
The first row of figures are based on direct report from the survey results(eg
anticipated retirement) or from figures from the 2008 ANZSN yearly report. These
figures are used as the baseline in the subsequent calculations.
Predicted rate (%) = the growth rate of ESKD patients predicted by using the
simple linear regression model graphically presented in Figure 14 of the report.
The equation is: growth rate= 245.3233-0.1197x(calendar year)
Predicted ESKD population =No of ESKD patients predicted from the
previously predicted growth rate according to the equation: ESKD population in
the year=ESKD population in the previous year(1+ growth rate); where 16027 is
the ESKD population in 2006 as reported in table 1.10 of chapter 1: Stock and
Flow. 2007
N_ESKD_Req= Number of nephrologists required only for ESKD patients,
calculated according to the equation
N_ESKD_Req= 56/17678.36x(ESKD population in that year); where 17678.36 is
the predicted ESKD population in 2008 for which there are 56 nephrologists.
N_Tot_Req= Total number of nephrologists required, calculated assuming that
20% time of the total time of the nephrologists is spent on ESKD patients.
Predicted Trainees = number of nephrologists requiring training predicted from
the simple linear regression model graphically presented in Figure 13 of the
report. The equation is : trainees= -1497.6+0.7545455x(calendar year)
Additional trainees required = training required on top of the predicted training,
calculated from the equation: additional training=Total nephrologists required -
Total nephrologists required in the previous year-adjusted number of anticipated
retirement in the lprevious year+first year trainees in previous year-predicted
number of first year trainees.
Adjusted Retiree Nos.= Retiree numbers anticipated for the given year based
upon stated retirement plans from survey and adjusted for response rate.
Appendix B
Appendix XIV
Continuous Data for Table 14. Decreasing Growth Rate of ESKD
Predicted rate (%)
Year Predicted ESKD
population
growth rate
N_ESKD_Req N_Tot_Req Adjusted retiree
Reported retiree
Predicted Trainees
Additional trainees
5.0854 2007 16751 56 278 1.26582278 1 13
4.9657 2008 17582.80441 0.04966 64.029077 291.0412591 8.86075949 7 17.527364 9.779717876
4.846 2009 18434.86711 0.04846 67.13192607 305.1451185 7.59493671 6 18.2819095 22.21007341
4.7263 2010 19306.15423 0.04726 70.30478229 319.5671922 5.06329114 4 19.036455 21.26246494
4.6066 2011 20195.51153 0.04607 73.54344239 334.2883745 5.06329114 4 19.7910005 19.02992792
4.4869 2012 21101.66394 0.04487 76.84326311 349.2875596 8.86075949 7 20.545546 19.30793072
4.3672 2013 22023.21581 0.04367 80.1991621 364.5416459 8.86075949 7 21.3000915 23.3603003
4.2475 2014 22958.6519 0.04247 83.60562151 380.0255523 8.86075949 7 22.054637 23.5901204
4.1278 2015 23906.33913 0.04128 87.05669435 395.7122471 11.3924051 9 22.8091825 23.79290874
4.0081 2016 24864.52911 0.04008 90.54601372 411.5727896 11.3924051 9 23.563728 26.49840214
3.8884 2017 25831.36146 0.03888 94.06680492 427.576386 7.59493671 6 24.3182735 26.64145592
3.7687 2018 26804.86798 0.03769 97.61190059 443.6904572 10.1265823 8 25.072819 22.95446247
3.649 2019 27782.97761 0.03649 101.1737588 459.880722 2.53164557 2 25.8273645 25.56230156
3.5293 2020 28763.52224 0.03529 104.7444843 476.1112923 6.32911392 5 26.58191 18.00767039
3.4096 2021 29744.2433 0.0341 108.3158523 492.344783 7.59493671 6 27.3364555 21.80805905
3.2899 2022 30722.79916 0.0329 111.8793355 508.542434 10.1265823 8 28.091001 23.03804222
3.1702 2023 31696.77334 0.0317 115.4261342 524.6642462 13.9240506 11 28.8455465 25.49384902
3.0505 2024 32663.68341 0.03051 118.9472084 540.6691291 13.9240506 11 29.600092 29.17438796
2.9308 2025 33620.99064 0.02931 122.4333132 556.5150599 7.59493671 6 30.3546375 29.01543597
2.8111 2026 34566.11031 0.02811 125.875036 572.1592547 6.32911392 5 31.109183 22.48458606
2.6914 2027 35496.4226 0.02691 129.2628368 587.5583489 7.59493671 6 31.8637285 20.97366261
2.5717 2028 36409.2841 0.02572 132.5870891 602.668587 13.9240506 11 32.618274 21.95062927
Appendix B
Appendix XV
Legend for Table 15
Predictions if End Stage Kidney Disease incident growth rates were to
continue to increase as they have since 2003 see page 61 of report.
The first row of figures is based on direct report from the survey results
(eg anticipated retirement) or from figures from the 2008 ANZSN yearly
report. These figures are used as the baseline in the subsequent
calculations.
Predicted incidence rate= the incidence rate of ESKD patients predicted
by using the quadratic equation graphically presented in Figure 15 of the
report. the equation is :
rate= 3666.739 +(calendar year)x(-3.666104)+(calendar
year)2x0.0009164
Predicted incidence= the incidence (number) of ESKD patients calculated
from the previously predicted rate according to the equation: incidence
=incidence in the previous year(1+ growth rate); here 2378 is the incidence
of ESKD patient in 2006 as reported in table 1.9 of chapter 1: Stock and
Flow. 2007.
Predicted existing rate = the growth rate of existing ESKD population
(total ESKD population - the new cases developed in the year). It was
calculated by using the equation: = 2.257167 +(Calendar year)x-0.0010991,
this equation was obtained for the existing ESKD population (not shown in
the report)
Predicted existing population = Existing population predicted from the
previously calculated growth rate. The equation: existing population=
existing population in the previous year (1+growth rate); here the existing
population for year 2006 was used as 13649 which was obtained by
subtracting the figures for 2006 in table 1.9 from that in table 1.10 of
chapter 1: Stock and Flow. 2007.
NB: other variables defined previously
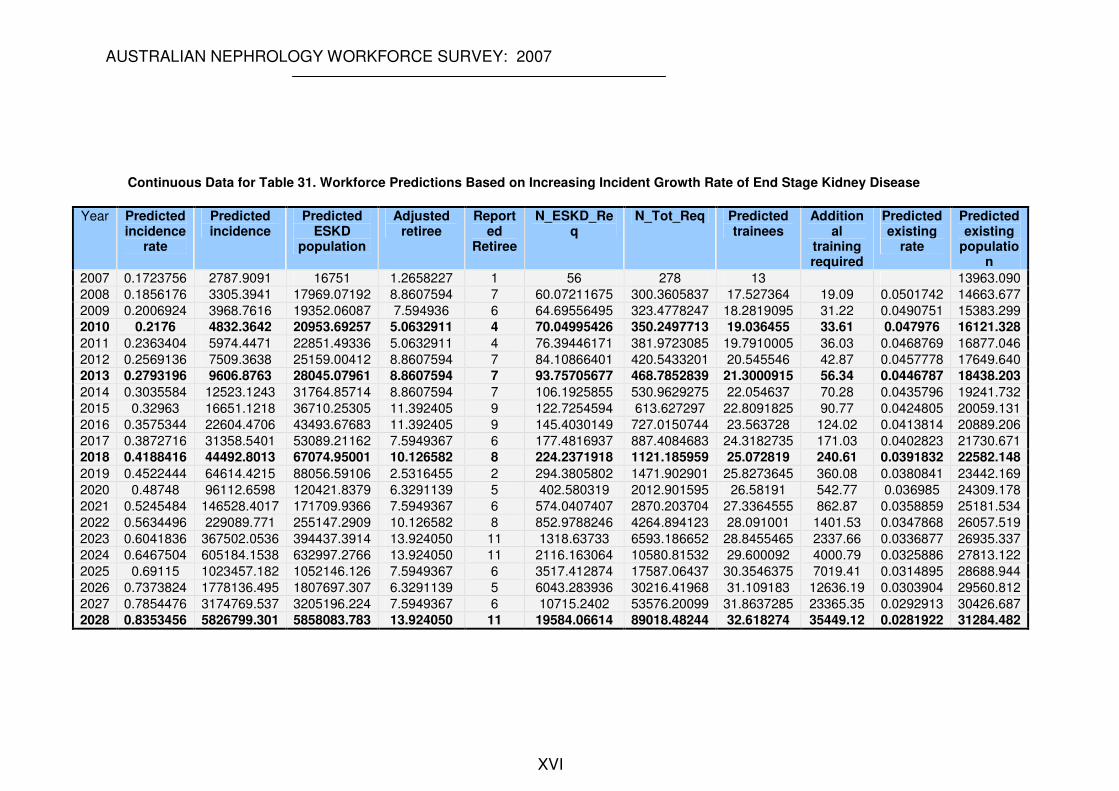
AUSTRALIAN NEPHROLOGY WORKFORCE SURVEY: 2007
XVI
Continuous Data for Table 31. Workforce Predictions Based on Increasing Incident Growth Rate of End Stage Kidney Disease
Year Predicted incidence
rate
Predicted incidence
Predicted ESKD
population
Adjusted retiree
Reported
Retiree
N_ESKD_Req
N_Tot_Req Predicted trainees
Additional
training required
Predicted existing
rate
Predicted existing
population
2007 0.1723756 2787.9091 16751 1.2658227 1 56 278 13 13963.090
2008 0.1856176 3305.3941 17969.07192 8.8607594 7 60.07211675 300.3605837 17.527364 19.09 0.0501742 14663.677
2009 0.2006924 3968.7616 19352.06087 7.594936 6 64.69556495 323.4778247 18.2819095 31.22 0.0490751 15383.299
2010 0.2176 4832.3642 20953.69257 5.0632911 4 70.04995426 350.2497713 19.036455 33.61 0.047976 16121.328
2011 0.2363404 5974.4471 22851.49336 5.0632911 4 76.39446171 381.9723085 19.7910005 36.03 0.0468769 16877.046
2012 0.2569136 7509.3638 25159.00412 8.8607594 7 84.10866401 420.5433201 20.545546 42.87 0.0457778 17649.640
2013 0.2793196 9606.8763 28045.07961 8.8607594 7 93.75705677 468.7852839 21.3000915 56.34 0.0446787 18438.203
2014 0.3035584 12523.1243 31764.85714 8.8607594 7 106.1925855 530.9629275 22.054637 70.28 0.0435796 19241.732
2015 0.32963 16651.1218 36710.25305 11.392405 9 122.7254594 613.627297 22.8091825 90.77 0.0424805 20059.131
2016 0.3575344 22604.4706 43493.67683 11.392405 9 145.4030149 727.0150744 23.563728 124.02 0.0413814 20889.206
2017 0.3872716 31358.5401 53089.21162 7.5949367 6 177.4816937 887.4084683 24.3182735 171.03 0.0402823 21730.671
2018 0.4188416 44492.8013 67074.95001 10.126582 8 224.2371918 1121.185959 25.072819 240.61 0.0391832 22582.148
2019 0.4522444 64614.4215 88056.59106 2.5316455 2 294.3805802 1471.902901 25.8273645 360.08 0.0380841 23442.169
2020 0.48748 96112.6598 120421.8379 6.3291139 5 402.580319 2012.901595 26.58191 542.77 0.036985 24309.178
2021 0.5245484 146528.4017 171709.9366 7.5949367 6 574.0407407 2870.203704 27.3364555 862.87 0.0358859 25181.534
2022 0.5634496 229089.771 255147.2909 10.126582 8 852.9788246 4264.894123 28.091001 1401.53 0.0347868 26057.519
2023 0.6041836 367502.0536 394437.3914 13.924050 11 1318.63733 6593.186652 28.8455465 2337.66 0.0336877 26935.337
2024 0.6467504 605184.1538 632997.2766 13.924050 11 2116.163064 10580.81532 29.600092 4000.79 0.0325886 27813.122
2025 0.69115 1023457.182 1052146.126 7.5949367 6 3517.412874 17587.06437 30.3546375 7019.41 0.0314895 28688.944
2026 0.7373824 1778136.495 1807697.307 6.3291139 5 6043.283936 30216.41968 31.109183 12636.19 0.0303904 29560.812
2027 0.7854476 3174769.537 3205196.224 7.5949367 6 10715.2402 53576.20099 31.8637285 23365.35 0.0292913 30426.687
2028 0.8353456 5826799.301 5858083.783 13.924050 11 19584.06614 89018.48244 32.618274 35449.12 0.0281922 31284.482