the u.s. biodiesel/renewable diesel market - usda.gov · 2008 2006 2011-12 2010 2013 2016 2000-04...
TRANSCRIPT

2008
2006
2011-12
2010
2013
2016
2000-04
2014
2017
2015
0
2.9 Bil Gals 11 Bil Ltrs
The U.S. Biodiesel/Renewable Diesel Market
Factors Driving Change Through 2017
Ernest Carter Senior Economist - Biofuels
Office of Global Analysis Foreign Agriculture Service, USDA
Washington, D.C. [email protected]
June 2018

USDA’s Interest in Biofuels USDA Programs and Activities Support Industry
USDA Interests Advance the biomass economy to support rural communities.
Report on biofuel markets & demand for grains & oilseeds to support market efficiency.
USDA Programs & Activities 2014 Farm Bill Energy Title IX has $694 million in ‘mandatory’ funding (loans &
payments) covering crop research & biomass handling technologies for cellulosic fuels, biorefinery redesign to produce advanced fuels and bio-based products, and education. Additional ‘discretionary’ funding supports research. Grants to build market infrastructure to expand delivery of high ethanol blends.
Office of the Chief Economist supports biofuel market studies & research.
FAS market reports on the EU and 14 other countries; interagency monthly, near-term forecasts on US corn & soyoil use in biofuels, and annual, long-term projections on US and foreign agricultural markets.
FAS overseas market promotion to expand the global ethanol market.
FAS foreign policy engagement on barriers to biofuel trade.
0
200
400
600
800
1,000
1,200
1,400
1,600
1,800
2,000
2,200
2,400
2,600
2,800
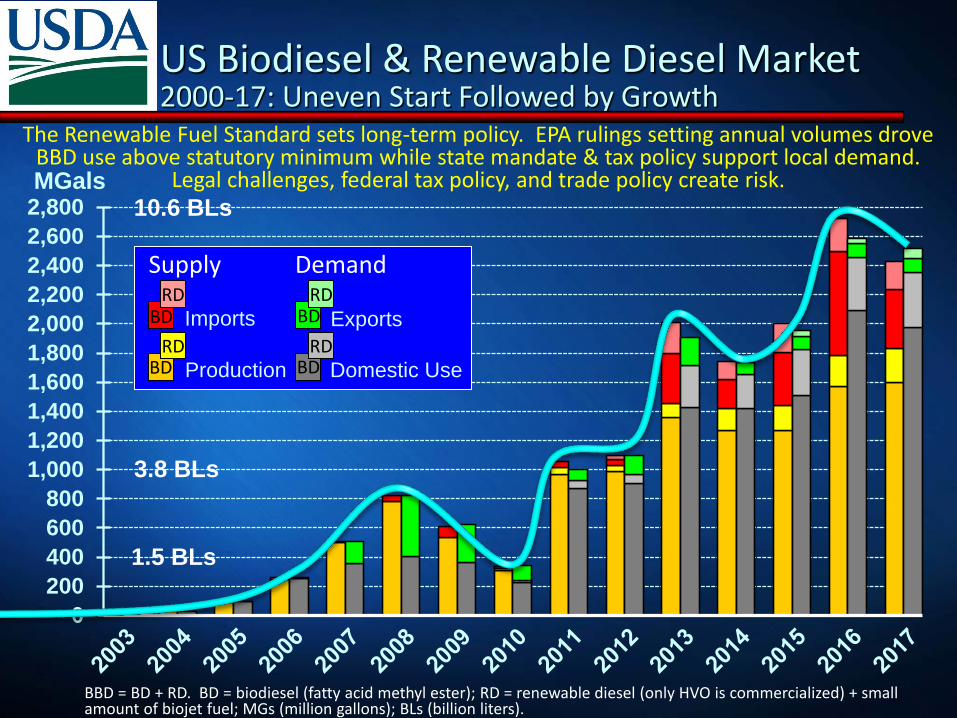
US Biodiesel & Renewable Diesel Market 2000-17: Uneven Start Followed by Growth
The Renewable Fuel Standard sets long-term policy. EPA rulings setting annual volumes drove BBD use above statutory minimum while state mandate & tax policy support local demand.
Legal challenges, federal tax policy, and trade policy create risk.
BBD = BD + RD. BD = biodiesel (fatty acid methyl ester); RD = renewable diesel (only HVO is commercialized) + small amount of biojet fuel; MGs (million gallons); BLs (billion liters).
MGals
Supply
Production
Exports Imports
Domestic Use
Demand
BD BD
BD BD RD RD
RD RD
3.8 BLs
1.5 BLs
10.6 BLs

0
200
400
600
800
1,000
1,200
1,400
1,600
1,800
2,000
MGals
Early Years 2000-04: Limited Production and Use; No Trade
Production Domestic Use
federal support limited to feedstock subsidy (shared with ethanol) and education program no state mandates/incentives captive fleets create limited demand very limited production capacity
CCC Bioenergy Prog (2000-6)
Nat Biodiesel Ed. Prog (2003 – today)
Supply Demand
BD BD
BBD = BD + RD. BD = biodiesel (fatty acid methyl ester); RD = renewable diesel (only HVO is commercialized) + small amount of biojet fuel; MGs (million gallons); BLs (billion liters).
0
200
400
600
800
1,000
1,200
1,400
1,600
1,800
2,000
MGals
Production
Exports Imports
Domestic Use
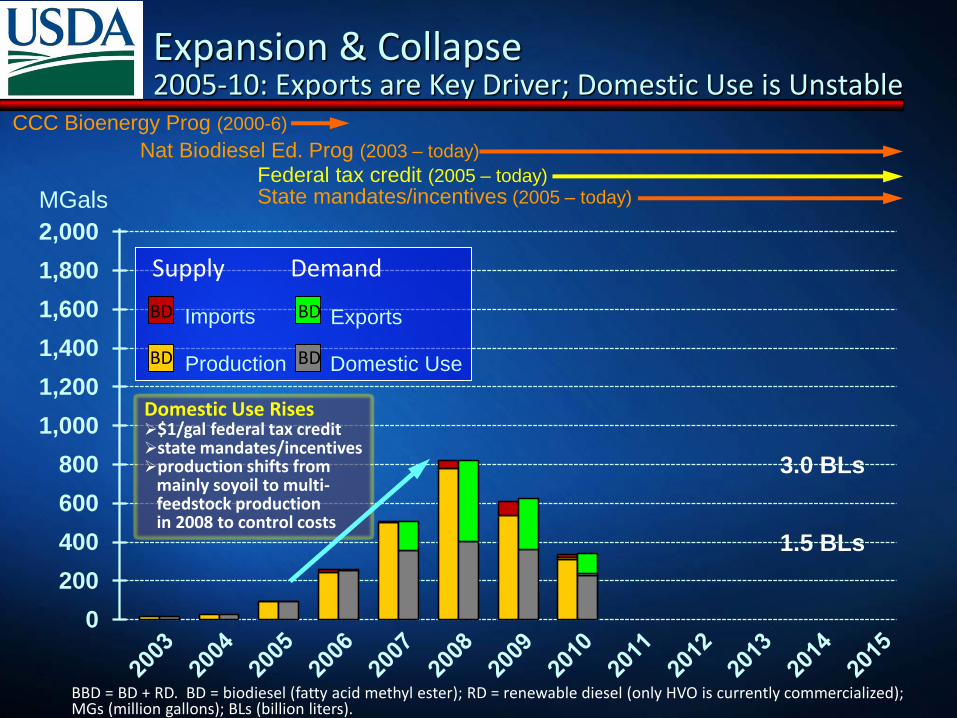
Expansion & Collapse 2005-10: Exports are Key Driver; Domestic Use is Unstable
Domestic Use Rises $1/gal federal tax credit state mandates/incentives production shifts from mainly soyoil to multi- feedstock production in 2008 to control costs
Federal tax credit (2005 – today) State mandates/incentives (2005 – today)
CCC Bioenergy Prog (2000-6)
Nat Biodiesel Ed. Prog (2003 – today)
3.0 BLs
1.5 BLs
Supply Demand
BD
BD
BD
BD
BBD = BD + RD. BD = biodiesel (fatty acid methyl ester); RD = renewable diesel (only HVO is currently commercialized); MGs (million gallons); BLs (billion liters).

0
200
400
600
800
1,000
1,200
1,400
1,600
1,800
2,000
MGals
50% of production exported by 2008 (mostly Europe) production capacity swells to 2.5 BGs
Exports Drive Two-thirds of Production Expansion
Production
Exports Imports
Domestic Use
1.5 BLs
3.0 BLs
Supply Demand
BD
BD
BD
BD
Expansion & Collapse 2005-10: Exports are Key Driver; Domestic Use is Unstable
Federal tax credit (2005 – today) State mandates/incentives (2005 – today)
CCC Bioenergy Prog (2000-6)
Nat Biodiesel Ed. Prog (2003 – today)
BBD = BD + RD. BD = biodiesel (fatty acid methyl ester); RD = renewable diesel (only HVO is commercialized) + small amount of biojet fuel; MGs (million gallons); BLs (billion liters).

0
200
400
600
800
1,000
1,200
1,400
1,600
1,800
2,000
MGals
Production
Exports Imports
Domestic Use
Supply Demand Exports Collapse Europe imposes Cv/AD duties Domestic Use Collapses RFS2 ruling delayed 20 months to June 2010 12-month lapse in blenders credit (2009) Financial Crises of 2008 freezes credit markets, and ensuing severe recession causes on-road diesel use to drop 9% from 2008 to 2009
BD
BD
BD
BD
Expansion & Collapse 2005-10: Exports are Key Driver; Domestic Use is Unstable
Federal tax credit (2005 – today) State mandates/incentives (2005 – today)
CCC Bioenergy Prog (2000-6)
Nat Biodiesel Ed. Prog (2003 – today)
1.5 BLs
3.0 BLs
BBD = BD + RD. BD = biodiesel (fatty acid methyl ester); RD = renewable diesel (only HVO is commercialized) + small amount of biojet fuel; MGs (million gallons); BLs (billion liters).

0
200
400
600
800
1,000
1,200
1,400
1,600
1,800
2,000
MGals
Production
Exports Imports
Domestic Use
Expansion Resumes on Surer Footing 2011-12: RFS 2 Builds Domestic Use; Trade is Limited
First RFS2 rulings impacting BD and RD use are finalized in June 2010 (20 months late); BBD & UAB obligations (mandates) reach 1 BGs & 490 MGs by 2012, respectively.
BBD = biomass-based diesel (BD+RD); UAB = undifferentiated (non-cellulosic) advanced biofuels (measured in ethanol vols).
3.8 BLs
Supply Demand
BD
BD
BD
BD
RD RD
RD
RFS2, EPA rulings, RINs (2009 – today)
Federal tax credit (2005 – today) State mandates/incentives (2005 – today)
CCC Bioenergy Prog (2000-6)
Nat Biodiesel Ed. Prog (2003 – today)
1.5 BLs
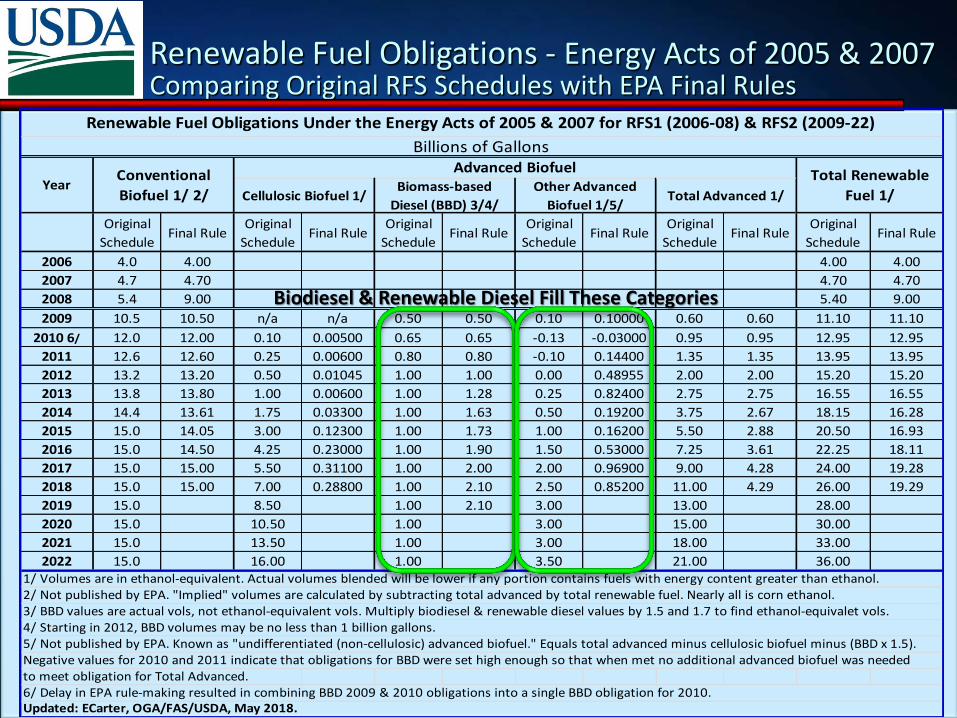
Renewable Fuel Obligations - Energy Acts of 2005 & 2007 Comparing Original RFS Schedules with EPA Final Rules
Original
ScheduleFinal Rule
Original
ScheduleFinal Rule
Original
ScheduleFinal Rule
Original
ScheduleFinal Rule
Original
ScheduleFinal Rule
Original
ScheduleFinal Rule
2006 4.0 4.00 4.00 4.00
2007 4.7 4.70 4.70 4.70
2008 5.4 9.00 5.40 9.00
2009 10.5 10.50 n/a n/a 0.50 0.50 0.10 0.10000 0.60 0.60 11.10 11.10
2010 6/ 12.0 12.00 0.10 0.00500 0.65 0.65 -0.13 -0.03000 0.95 0.95 12.95 12.95
2011 12.6 12.60 0.25 0.00600 0.80 0.80 -0.10 0.14400 1.35 1.35 13.95 13.95
2012 13.2 13.20 0.50 0.01045 1.00 1.00 0.00 0.48955 2.00 2.00 15.20 15.20
2013 13.8 13.80 1.00 0.00600 1.00 1.28 0.25 0.82400 2.75 2.75 16.55 16.55
2014 14.4 13.61 1.75 0.03300 1.00 1.63 0.50 0.19200 3.75 2.67 18.15 16.28
2015 15.0 14.05 3.00 0.12300 1.00 1.73 1.00 0.16200 5.50 2.88 20.50 16.93
2016 15.0 14.50 4.25 0.23000 1.00 1.90 1.50 0.53000 7.25 3.61 22.25 18.11
2017 15.0 15.00 5.50 0.31100 1.00 2.00 2.00 0.96900 9.00 4.28 24.00 19.28
2018 15.0 15.00 7.00 0.28800 1.00 2.10 2.50 0.85200 11.00 4.29 26.00 19.29
2019 15.0 8.50 1.00 2.10 3.00 13.00 28.00
2020 15.0 10.50 1.00 3.00 15.00 30.00
2021 15.0 13.50 1.00 3.00 18.00 33.00
2022 15.0 16.00 1.00 3.50 21.00 36.00
Negative values for 2010 and 2011 indicate that obligations for BBD were set high enough so that when met no additional advanced biofuel was needed to meet obligation for Total Advanced.
Renewable Fuel Obligations Under the Energy Acts of 2005 & 2007 for RFS1 (2006-08) & RFS2 (2009-22)
Billions of Gallons
YearTotal Advanced 1/
Total Renewable
Fuel 1/
Advanced Biofuel
6/ Delay in EPA rule-making resulted in combining BBD 2009 & 2010 obligations into a single BBD obligation for 2010.Updated: ECarter, OGA/FAS/USDA, May 2018.
Conventional
Biofuel 1/ 2/ Cellulosic Biofuel 1/Biomass-based
Diesel (BBD) 3/4/
Other Advanced
Biofuel 1/5/
1/ Volumes are in ethanol-equivalent. Actual volumes blended will be lower if any portion contains fuels with energy content greater than ethanol.2/ Not published by EPA. "Implied" volumes are calculated by subtracting total advanced by total renewable fuel. Nearly all is corn ethanol.3/ BBD values are actual vols, not ethanol-equivalent vols. Multiply biodiesel & renewable diesel values by 1.5 and 1.7 to find ethanol-equivalet vols.4/ Starting in 2012, BBD volumes may be no less than 1 billion gallons.5/ Not published by EPA. Known as "undifferentiated (non-cellulosic) advanced biofuel." Equals total advanced minus cellulosic biofuel minus (BBD x 1.5).
Biodiesel & Renewable Diesel Fill These Categories

0
3
6
9
12
15
18
21
24
27
30
33
36
Advanced biofuels remain far behind original schedule due to lack of cellulosic fuels. EPA rulings increased the “space” for BD/RD above the original schedule thru 2014,
reduced it slightly below in 2015-17, and lowered it still further below in 2018. BGals
Conventional Biofuel (mainly corn ethanol)
Co
nve
ntio
na
l A
dva
nce
d
*BBD can also fill the “conventional” biofuel category but this is rare. Schedule for RFS 2 ends in 2022.
Biodiesel (BD) & Renewable Diesel (RD) fill this “space” (categories)*
Undifferentiated Advanced Biofuel (BD + RD + cane ethanol)
Cellulosic Biofuel (mainly landfill biogas, some ethanol)
Biomass-based Diesel (BD + RD)
Renewable Fuel Obligations - Energy Acts of 2005 & 2007 Comparing Original RFS Schedules with EPA Final Rules
0
200
400
600
800
1,000
1,200
1,400
1,600
1,800
2,000
2,200
2,400
2,600
2,800
MGals
Supply
Production
Exports Imports
Domestic Use
RD
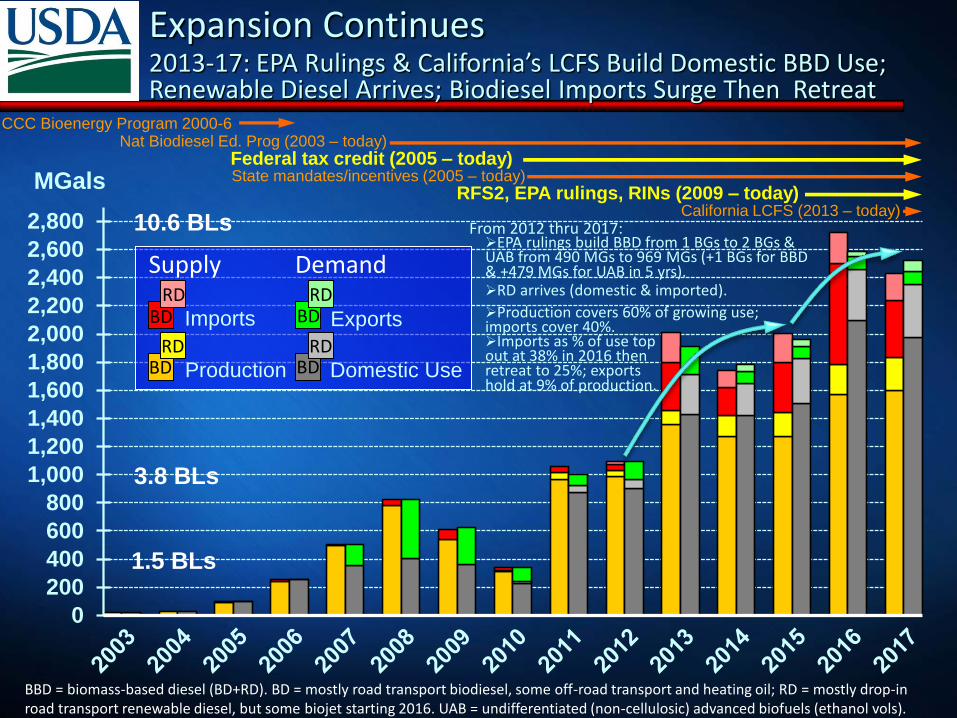
BBD = biomass-based diesel (BD+RD). BD = mostly road transport biodiesel, some off-road transport and heating oil; RD = mostly drop-in road transport renewable diesel, but some biojet starting 2016. UAB = undifferentiated (non-cellulosic) advanced biofuels (ethanol vols).
CCC Bioenergy Program 2000-6
Federal tax credit (2005 – today) State mandates/incentives (2005 – today)
Nat Biodiesel Ed. Prog (2003 – today)
RFS2, EPA rulings, RINs (2009 – today)
Demand
Expansion Continues 2013-17: EPA Rulings & California’s LCFS Build Domestic BBD Use; Renewable Diesel Arrives; Biodiesel Imports Surge Then Retreat
EPA rulings build BBD from 1 BGs to 2 BGs & UAB from 490 MGs to 969 MGs (+1 BGs for BBD & +479 MGs for UAB in 5 yrs). RD arrives (domestic & imported).
Production covers 60% of growing use; imports cover 40%. Imports as % of use top out at 38% in 2016 then retreat to 25%; exports hold at 9% of production.
From 2012 thru 2017:
3.8 BLs
1.5 BLs
10.6 BLs
BD BD
BD BD RD RD
RD
California LCFS (2013 – today)

US Biodiesel & Renewable Diesel Market Annual Supply/Demand Balances
US Biomass-based Diesel (BBD) Supply/Demand, MGals BBD = Biodiesel (FAME) + Renewable Diesel (RD); RD = drop-in renewable diesel (transport & heating oil) + biojet fuel
SUPPLY DEMANDBEGIN STOCKS PRODUCTION IMPORTS DOMESTIC USE EXPORTS END STOCKS Exp Imp Exp Imp
Year FAME RD TOTAL FAME RD TOTAL FAME RD TOTAL FAME RD TOTAL FAME RD TOTAL FAME RD TOTAL
2000 2.0 2.0 2.0 2.0
2001 8.1 8.1 8.1 8.1
2002 13.8 13.8 13.8 13.8
2003 17.6 17.6 17.6 17.6
2004 28.0 28.0 28.0 28.0
2005 91.2 91.2 4.2 4.2 95.0 95.0 0.5 0.5 0% 4% 0% 4%
2006 243.4 243.4 14.4 14.4 252.4 252.4 5.5 5.5 2% 6% 2% 6%
2007 499.7 499.7 5.0 5.0 357.3 357.3 147.3 147.3 29% 1% 29% 1%
2008 780.6 780.6 40.3 40.3 402.8 402.8 418.1 418.1 54% 10% 54% 10%
2009 44.0 0.0 44.0 536.3 536.3 74.8 74.8 360.9 360.9 264.2 264.2 29.9 29.9 49% 21% 49% 21%
2010 29.9 0.0 29.9 310.4 9.7 320.1 18.5 18.5 229.4 9.7 239.2 101.1 101.1 28.2 0.0 28.2 33% 8% 32% 8%
2011 28.2 0.0 28.2 967.5 50.3 1,017.8 37.5 37.5 873.3 50.0 923.3 75.7 75.7 84.2 0.3 84.5 8% 4% 7% 4%
2012 84.2 0.3 84.5 990.0 42.0 1,032.0 39.3 25.4 64.7 905.6 63.7 969.3 124.6 124.6 83.3 3.9 87.3 13% 4% 12% 7%
2013 83.3 3.9 87.3 1,358.0 95.4 1,453.4 346.1 212.9 559.0 1,428.9 283.2 1,712.0 198.5 198.5 160.0 29.0 189.0 15% 24% 14% 33%
2014 160.0 29.0 189.0 1,271.0 147.7 1,418.7 202.7 120.7 323.4 1,418.6 232.3 1,650.9 83.6 50.4 134.0 131.5 14.7 146.2 7% 14% 9% 20%
2015 131.5 14.7 146.2 1,268.0 171.4 1,439.4 361.3 203.7 564.9 1,506.5 318.8 1,825.3 88.7 44.4 133.1 165.6 26.6 192.2 7% 24% 9% 31%
2016 165.6 26.6 192.2 1,569.0 211.5 1,780.5 718.4 222.8 941.2 2,093.5 364.6 2,458.1 90.8 41.1 131.9 268.7 55.2 323.9 6% 34% 7% 38%
2017 268.7 55.2 323.9 1,595.0 239.4 1,834.4 403.4 189.4 592.8 1,972.5 378.0 2,350.5 95.1 74.4 169.5 199.5 31.6 231.1 6% 20% 9% 25%
Prepared by: Ernest Carter, Office of Global Analysis, Foreign Agricultural Service/USDA, Washington, DC. Export reliance = exports/production
Sources: Fame Production: 2000-05 (CCC Bioenergy Program, USDA); 2006-10 DOC Industry Survey (Rpt M311K); 2011-forward (DOE/EIA) Import reliance = imports/dom. use
Fame Trade: DOC/US Census Bureau, B30-100 Chapt. 38 HTS codes (assume B100) plus Petroleum Oils Containing Biodiesel (>B30) Chapter. 27 HTS codes (assume average B5 content) beginning 2012. Include errata updates thru 2017.
RD Production and Exports (includes biojet): Ryan Ruikka of PRX (ProExporter Network) using EPA RIN & company reports (REG Geismar Dynamic Fuels, Darling Corp Diamond Green, AltAir Fuels, UOP Honeywell), updated March 2018.
RD Imports: DOE/EIA "Company Level Imports" from Petroleum and Other Liquids, product code = 205
Fame & RD Domestic Use: derrived by balancing all other elements of supply and demand.
Fame Stocks: DOE/Energy Information Agency (EIA), Monthly Energy Review (MER), Table 10.4 RD Stocks: EIA Monthly Petroleum Supply Report (PSM) minus MER
FAME + RDFAME
Reliance Reliance

US Biodiesel (BD) & Renewable Diesel (RD) Imports Imports Target California & Other Coastal Deficit Regions
Euro
pe
0
50
100
150
200
250
300
350
400
450Argentina BDSingapore RDIndonesia BDCanada BDKorea BDEU RDEU BD
Sin
gap
ore
K
ore
a
MGals
Canada
Argentina
Flows illustrates 2017 situation
Imports from Argentina were shut down beginning Sept 2017 with the imposition of anti-dumping and countervailing duties. Imports from Indonesia ended in 2017 before duties were imposed.

US Biodiesel/Renewable Diesel Market Final Observations for This 2.35 Billion Gallon Market (2017)
Future Market Expansion Through Higher Blending, Not Fuel Pool Growth Distillate fuel oil use was 60.8 BGs in 2016, of which 40.2 BGs was used on-highway and 5.6 BGs for
heating oil. EIA projects the on-highway pool will decline thru 2035 assuming fleet efficiency gains. Biodiesel use of 2.35 BGs (2017) equals a national average blend rate close to B4 for markets now
blending, so there is a lot of room to expand from a technical standpoint since nearly all OEMs approve the use of B20. By comparison, Brazil, Argentina & Indonesia are near or just above B10.
B10 for US nationwide on-highway plus the Northeast heating oil market currently equals about 4.4 BGs of biofuel; extending B10 to the entire distillate market raises the figure to 6 BGs.
EIA (US Energy Information Administration); OEMs (original equipment manufacturers); LCFS (Low-Carbon Fuel Standard); CI (carbon intensity); AD (anti-dumping); Cv (countervailing).
State Policies Create Regional Pools of Demand Beginning 2013, California’s LCFS & carbon market have raised the use of BBD, and pushed the
state’s blending rate to three times the national average or 13% by 2017. As an aside, biogas rose to 67% of the state’s LNG/CNG market in 2017. Oregon has more recently adopted a similar program .
Other state tax credits and blend mandates create regional pools of demand. Following California, in descending order of size, are Texas, Illinois, Oregon, Minnesota, New York (residential/commercial heating), Iowa, and Pennsylvania.
Earlier BBD Trade Surplus Has Become a Trade Deficit Small trade deficit in 2005-6, was followed by a surplus in 2007-12 which was especially large (140-
380 MGs) in 2007-9 with biodiesel exports to EU peaking prior to the EU imposition of AD/Cv duties. Since 2013, the trade balance has remained negative peaking at (-)810 MGs in 2016 due to 1) little
overall growth in exports (EU duties applied in 2009 were extended in 2015), and 2) expanding imports, mainly biodiesel from Argentina (Indonesia as well) and renewable diesel from Singapore.
From 2016 to 2017, the deficit fell by half as imports declined due to the imposition of US AD/Cv duties on Argentina & Indonesia.