the ups and downs of populations -...
TRANSCRIPT

Heather Miller Printed on 3/21/2016
The Ups and Downs of Populations page 1
The Ups and Downs of Populations
Based on Oh Deer by Project WILD By Heather Miller
Focus on Inquiry The student will collect and analyze data, read, create and interpret graphs, and model population dynamics in a population of 100 deer as they encounter various limiting factors.
Lesson Content Overview Students will analyze population graphs, collect data to generate their own population graph, and experience limiting factors and their impact on carrying capacity in a small deer population. Students will be able to identify, explain, and evaluate the impact that different limiting factors have on the population of organisms including food, water, shelter, predation, human interference, changes in birth and death rate, changes in immigration and emigration, disease, and reproduction.
Duration
80 minutes
Setting
Classroom
Grouping
2-4 students
PTI Inquiry Subskills 1.3, 3.1, 4.2, 4.4, 5.8, 7.3, 7.5
Lesson Components
Estimated Time
Inquiry Subskills
Used
Technology Used
Level of Student
Engagement Brief Description
Engage 10
minutes 1.3, 4.2, 4.4, 7.5
Student personal electronic devices (BYOT)
2
Students will analyze 2 different deer population graphs and make hypotheses about what accounts for the differences in the populations. Students will conduct background research on what deer need to survive in the ecosystem.
Explore 20
minutes 3.1 None 3
Students will randomly draw cards to explore how different limiting factors cause changes to their population of deer.
Explain 20
minutes 4.2, 4.4, 5.8, 7.3
None 2 Students will graph their data and respond to follow up questions about their deer population changes.
Expand/Elaborate 20
minutes 4.4, 5.8,
7.3 None 2
Students will choose a different animal and identify the limiting factors in their ecosystem, graphically model the population of their animal and explain the cause of changes in their population.
Evaluate 10
minutes 7.3 None 1
Students will complete a summative assessment on population dynamics.
Level of Student Engagement 1 Low Listen to lecture, observe the teacher, individual reading, teacher demonstration, teacher-centered instruction
2 Moderate Raise questions, lecture with discussion, record data, make predictions, technology interaction with assistance
3 High Hands-on activity or inquiry; critique others, draw conclusions, make connections, problem-solve, student-centered
Next Generation Science Standards – Inquiry NGSS Practice 2: Developing and Using Models NGSS Practice 3: Planning and Carrying Out Investigations NGSS Practice 4: Analyzing and Interpreting Data NGSS Practice 6: Constructing Explanations NGSS Practice 8: Obtaining, Evaluating and Communicating Information
Heather Miller Printed on 3/21/2016
The Ups and Downs of Populations page 2
Next Generation Science Standards – Life Science Content HS-LS2-1.: Use mathematical and/or computational representations to support explanations of factors that affect carrying capacity of ecosystems at different scales.
LS2.A: Interdependent Relationships in Ecosystems LS2.C: Ecosystem Dynamics, Functioning, and Resilience
Florida Science Standards – Nature of Science SC.7.N.1.1: Define a problem in the 7th grade curriculum and do the following: use appropriate reference materials to support scientific understanding, plan and carry out scientific investigation of various types, such as systematic observations or experiments, identify variables, collect and organize data, interpret data in charts, tables, and graphics, analyze information, make predictions, and defend conclusions.
Florida Science Standards – Life Science Content SC.7.L.17.3: Describe and investigate various limiting factors in the local ecosystem and their impact on native populations, including food, shelter, water, space, disease, parasitism, predation, and nesting sites.
Materials and Advance Preparation Materials List
Group set:
Ups & Downs of Populations Cards (1 set per group)
Ups & Downs of Populations Student Worksheets (1 paper per group or student, as preferred)
Deer Population A and B Graphs (1 set per group)
Blackline Masters 1. Ups & Downs of Populations Cards – Blackline Master 1 2. Deer Population A and B Graphs – Blackline Master 2 3. Ups & Downs of Populations Student Worksheet – Blackline Master 3 4. Ups & Downs of Populations Assessment – Blackline Master 4 5. Ups & Downs of Populations Answer Keys – Blackline Master 5
Advance Preparation 1. Print enough copies of the Population Cards for each group/pair to have a set of cards. 2. Put cards in an envelope for each group. 3. Print enough copies of the Deer Population Graphs A & B for each group/pair to have a set. 4. Print enough copies of the Student Worksheets for each group/student to have one.
Lesson Information Learning Objectives
1. The student will be able to identify, explain, and evaluate the impact that different limiting factors have on the population of organisms including food, water, shelter, predation, human interference, changes in birth and death rate, changes in immigration and emigration, disease, and reproduction.
2. The student will be able to collect and analyze data, read, create and interpret graphs, and model population dynamics in a population of 100 deer as they encounter various limiting factors.
Prior Knowledge Needed by the Students
Students should have a general understanding of predator-prey relationships and factors that affect living things in their environment.
Students should have a general understanding of how to read and create line graphs.
No specific knowledge is required for this activity as students will uncover the concepts throughout the activity.

Heather Miller Printed on 3/21/2016
The Ups and Downs of Populations page 3
Background Information
Limiting factors are biotic (living) and abiotic (non-living) things in an ecosystem that prevent a population from growing any larger. For example, 100 deer may live in an ecosystem that has enough water, cover and space to support 200 deer, but if there is only enough food for 100 deer, the population will not grow any larger. In this example, food is the limiting factor.
Food is not the only factor that can limit population growth. For example, sometimes there is enough food in an ecosystem for a large population, but only a small amount of suitable shelter for the organism. Or maybe there is plenty of food, water, shelter and space to support a larger population in an area, but there are so many predators that it limits the amount of that organism.
Limiting factors are very closely tied to carrying capacity. Carrying capacity is the maximum number of a species that can be sustained by a given ecosystem. In the examples above, the carrying capacity of the deer would be 100 since there is only enough of all the resources for 100 deer to feasibly survive. Many animals can increase in numbers very quickly, and may temporarily exceed the carrying capacity of their ecosystem. When there are too many of a species in an ecosystem, this results in stress, starvation, disease, predation and parasites, poor reproductive success and damage to the habitat. For example, multiplying rabbits can very quickly eat all the vegetation in a grassland ecosystem. With the vegetation gone, food becomes the limiting factor and the rabbits may starve or move to another area (immigration). The grassland now has a reduced carrying capacity for rabbits until the vegetation grows back again.
Increasing or decreasing the limiting factors in an ecosystem will result in an increase or decrease in populations. Some of the limiting factors that are explored in this lesson include food, water, shelter, mates, too many males, too many females, drought, fire, hunters, car traffic, immigration, emigration, predators, dangerous organisms, parasites, and disease.
Lesson Procedure Engage (Potential student responses can be found in the answer key)
1. Students are introduced to the lesson’s focus question: How is population size affected by different environmental factors?
2. Looking at the patterns in two different graphs, students will predict what they think could account for the differences between the two populations of the deer and write these predictions on their worksheet.
3. With their face partner, students will rally robin (share back and forth) one idea each that they wrote for what is accounting for the differences between the two graphs. They will continue sharing back and forth until the teacher calls time (1-2 minutes).
4. With their shoulder partner, students will research the following questions (BYOD) (5-10 minutes): a. What do deer need to survive? b. What interferes with a deer’s survival?
5. Students will then complete the following hypothesis: If a population experiences ____________ then it will ____________ because _______________________________________________.
a. EX: If a population experiences (an abundance of food, a lack of water, harsh weather, hunting season, etc) then it will (increase, decrease, stay the same) because (deer need to eat a lot of food every day to sustain a healthy weight, deer need water to survive, the severe weather will cause some deer to die from exposure, etc).
***Units are intentionally left off the Deer Population A & B graphs so that students can interpret them in a way that makes sense to them. This could generate good discussion about what would be an appropriate unit to label this axis with. For example, days would not likely be appropriate because populations don’t typically change that much from day to day. Years or decades might be a more appropriate time label.***

Heather Miller Printed on 3/21/2016
The Ups and Downs of Populations page 4
Explore 1. Students will conduct their own population study with a population size of 100 deer. They will be
exposing their deer to factors that they commonly encounter in their natural ecosystems and will be evaluating how it impacts the deer population.
Procedure: 1. Draw one card out of the envelope at a time. 2. Read what the card says and record the results in your data table.
For example, if the card says that aliens have invaded and have killed 10 deer, subtract 10 deer from your population, record the new number of deer in your population, and then carry the new number into the row below for the next turn.
3. DO NOT put the card back in the envelope. 4. Draw the next card and continue drawing and recording data until you have drawn 20 cards and
completed all 20 trials. 5. When you are finished with your trials, put all cards back in the envelope.
Explain 1) Some questions you might ask students while they are working include:
a) Which factor(s) has/have had the most dramatic effect on your population so far? Student responses will vary but may include drought, mating, etc.
b) What is the highest your population has reached so far? Student responses will vary c) Looking at your data so far, do you think your population is more like graph A or graph B?
Student responses will vary d) Have you picked any cards that have surprised you? Student responses will vary
2) The questions that are included on the student worksheet include: Possible student responses are included in the answer key. a) Give an overall description of your graph/data. Explain what factors accounted for the major
increases or decreases in your population. b) Based on the cards that you chose, and using your data table as a reference, what do you think a
“limiting factor” is? c) Biotic factors are the living things in an ecosystem. What were some of the biotic limiting
factors in the deer’s ecosystem? d) Abiotic factors are the non-living factors in an ecosystem. What were some of the abiotic
limiting factors in the deer’s ecosystem? e) Choose two limiting factors that had a positive effect on your population and explain why they
had an impact on your population. f) Choose two limiting factors that had a negative effect on your population and explain why they
had an impact on your population. g) Carrying capacity is the maximum number of organisms that an ecosystem can support.
Looking at your data table and graph, what would you predict is the carrying capacity for your ecosystem? Explain your choice.
h) How is your graph similar or different than the graph of another group? Expand/Elaborate
1. Now that students know a little about deer and the limiting factors that affect their population sizes, they will think about one of their favorite animals or plant species and what might affect their population.
2. They will create a simulated population study of their animal based on a little research and their knowledge of limiting factors.

Heather Miller Printed on 3/21/2016
The Ups and Downs of Populations page 5
3. Students will complete their analysis of the animal’s/plant’s biotic factors, abiotic factors, factors that will increase the population, and factors that will decrease the population.
4. Lastly, they will interpret a graph that could represent their animal’s population and its changes over time.
5. They will explain the graph in terms of what caused the changes in the population fluctuations (increases, decreases, etc).
Evaluate FORMAL EVALUTION Students will complete the Ups and Downs of Populations Assessment. Students can turn in their lab sheet or their Expand/Elaborate activity for Formal Observation and feedback. INFORMAL or OPTIONAL EVALUTIONS 1) Teacher Observation – Teacher should be watching students during the Explore for:
a) Students properly acquiring and recording data. b) Student understanding of their data through use of the Explain questions during and after the
Explore activity. c) Students properly graphing their data
WRAP UP.
Bring the lesson to a conclusion by discussing Explain questions in small groups or as a whole class.
Have students share their Expand/Elaborate assignment in their groups or do a whole class gallery walk.
Watch the Limiting Factors Carrying Capacity Biotic Potential Video (5:40) found at: https://www.youtube.com/watch?time_continue=174&v=JptytfaO_3s or if you cannot access YouTube:
Supplementary Resources Teachers Crash Course. (2012). Population Ecology: The Texas Mosquito Mystery - Crash Course Ecology #2.
Retrieved from https://www.youtube.com/watch?v=RBOsqmBQBQk. International Hunter Education Association. (2002). Limiting Factors. Retrieved from
http://homestudy.ihea.com/wildlife/09limits.htm. MrsMetlis. (2013). Limiting Factors Carrying Capacity Biotic Potential Video. Retrieved from
https://www.youtube.com/watch?time_continue=174&v=JptytfaO_3s Students Andrew Raider Studios. (2015) Geography4kids.com: Populations. Retrieved from
http://www.geography4kids.com/files/land_population.html Ecology. (2015). In Compton's by Britannica. Retrieved from http://kids.britannica.com/comptons/article-
273221/ecology CITATION OF SOURCES.
Colorado Parks and Wildlife. (n.d.) Oh Deer! Retrieved from http://cpw.state.co.us/learn/Pages/ProjectWildOhDeer.aspx
Crash Course. (2012). Population Ecology: The Texas Mosquito Mystery - Crash Course Ecology #2.
Retrieved from https://www.youtube.com/watch?v=RBOsqmBQBQk.

Heather Miller Printed on 3/21/2016
The Ups and Downs of Populations page 6
International Hunter Education Association. (2002). Limiting Factors. Retrieved from http://homestudy.ihea.com/wildlife/09limits.htm.
MrsMetlis. (2013). Limiting Factors Carrying Capacity Biotic Potential Video. Retrieved from
https://www.youtube.com/watch?time_continue=174&v=JptytfaO_3s Parker, C. (1999). Oh Deer! Retrieved from http://www.beaconlearningcenter.com/documents/313_01.pdf All pictures are copyright free and retrieved from: Ups and Downs of Populations Cards: Flame: https://pixabay.com/get/9732887a5bc608483fc8/1441312505/fire-30276_1280.png?direct Drought: https://www.flickr.com/photos/oxfameastafrica/5758386784/ Snake: https://pixabay.com/get/66595badd7fa9a966102/1441312162/rattlesnake-32693_1280.png?direct Wolf: http://www.freestockphotos.biz/stockphoto/14950 Bear: http://www.freestockphotos.biz/stockphoto/13322 Buck: : www.public-domain-image.com%2Ffree-images%2Fart%2Fline-art-illustration-pictures%2Fwhite-tailed-deer-head-illustration%2Fattachment%2Fwhite-tailed-deer-head-illustration&psig=AFQjCNF-0XvP6VQAiiCVaKGn79NibGF_Ig&ust=1441470873659269 Doe: https://pixabay.com/get/a4b6fbfb70b5a7d10c89/1441384611/female-48231_1280.png?direct Skull: http://www.sketchport.com/drawing/5684992466223104/ol-alfred Shelter: http://www.freestockphotos.biz/stockphoto/15119 Water: http://www.public-domain-image.com/free-images/flora-plants/flowers/water-lily-lotus-flower/aquatic-environments-plants-water-lilies-leaves/attachment/aquatic-environments-plants-water-lilies-leaves Food: http://www.torange.us/Plants/fruit-and-berries/currants-in-isolation-33142.html Hunter: https://pixabay.com/get/a0a3a77e989458d58353/1441383050/hunter-160297_1280.png?direct Biting Fly: https://commons.wikimedia.org/wiki/File:Biting_Midge.png Car: http://www.freestockphotos.biz/stockphoto/15049 Doe & Buck: http://www.public-domain-image.com/free-images/fauna-animals/deers/mule-deer-in-california/attachment/mule-deer-in-california Ups and Downs of Populations Assessment: Food Web: https://commons.wikimedia.org/wiki/File:TrophicWeb.jpg Four Animal Populations Graph: https://stangbio.wikispaces.com/Ecology All pre-made charts, tables, and graphs created by Heather Miller. Ups and Downs of Populations Student Worksheet: All pre-made charts, tables, and graphs created by Heather Miller. Student graph paper: http://www.texample.net/tikz/examples/graph-paper/
____ Yes, I cited all materials and resources used in this lesson. Heather Miller
Lesson author signature

Heather Miller Printed on 3/21/2016
The Ups and Downs of Populations page 7
Photo Credit:
https://pixabay.com/get/9732887a5bc608483fc8/1441312505/fire-
30276_1280.png?direct
Photo Credit: https://www.flickr.com/photos/oxfameastafrica/5758386784/
Photo Credit:
https://pixabay.com/get/66595badd7fa9a966102/1441312162/rattlesnake-
32693_1280.png?direct
A fire has engulfed a large section of the forest. 25 deer have died
as a result.
It hasn’t rained in weeks and your ecosystem is suffering a
drought. As a result, half of your current population dies.
A new family of rattlesnakes are living in your area and have
bitten 5 deer in your population. As a result, all 5 deer have died.
Photo Credit:
https://pixabay.com/get/66595badd7fa9a966102/1441312162/rattlesnake-
32693_1280.png?direct
Photo Credit: http://www.freestockphotos.biz/stockphoto/14950 Photo Credit: http://www.freestockphotos.biz/stockphoto/14950
A new family of rattlesnakes are living in your area and have
bitten 5 deer in your population. As a result, all 5 deer have died.
You share your habitat with wolves and they are your predator. 5 deer in your
population have died to feed the wolves.
You share your habitat with wolves and they are your predator. 5 deer in your
population have died to feed the wolves.
Photo Credit: http://www.freestockphotos.biz/stockphoto/14950
Photo Credit: http://www.freestockphotos.biz/stockphoto/14950
Photo Credit: http://www.freestockphotos.biz/stockphoto/13322
You share your habitat with wolves and they are your predator. 5 deer in your
population have died to feed the wolves.
You share your habitat with wolves and they are your predator. 5 deer in your
population have died to feed the wolves.
The local bear family can’t find any more fish so they have turned to the deer in your
population as a food source. 5 deer in your population have been killed to feed the bears.
Blackline Master 1

Heather Miller Printed on 3/21/2016
The Ups and Downs of Populations page 8
Photo Credit: www.public-domain-image.com%2Ffree-
images%2Fart%2Fline-art-illustration-pictures%2Fwhite-tailed-deer-head-illustration%2Fattachment%2Fwhite-tailed-deer-head-
illustration&psig=AFQjCNF-0XvP6VQAiiCVaKGn79NibGF_Ig&ust=1441470873659269
Photo Credit:
https://pixabay.com/get/a4b6fbfb70b5a7d10c89/1441384611/female-48231_1280.png?direct
Photo Credit: http://www.sketchport.com/drawing/5684992466223104/ol-
alfred
There are too many males in your population and not enough
females. Decrease your population by 20 deer.
There are too many females in your population and most are of age to reproduce. Increase your
population by 20 deer.
It was a harsh winter and all of your infant and elderly deer die. Decrease your population by 20
deer.
Photo Credit: http://www.freestockphotos.biz/stockphoto/15119
Photo Credit: http://www.freestockphotos.biz/stockphoto/15119 Photo Credit: http://www.freestockphotos.biz/stockphoto/15119
You’ve found SHELTER!
Increase your population by 10 deer.
You’ve found SHELTER!
Increase your population by 10 deer.
You’ve found SHELTER!
Increase your population by 10 deer.
Photo Credit: http://www.freestockphotos.biz/stockphoto/15119
Photo Credit: http://www.public-domain-image.com/free-images/flora-
plants/flowers/water-lily-lotus-flower/aquatic-environments-plants-water-lilies-leaves/attachment/aquatic-environments-plants-water-lilies-leaves
Photo Credit: http://www.public-domain-image.com/free-images/flora-
plants/flowers/water-lily-lotus-flower/aquatic-environments-plants-water-lilies-leaves/attachment/aquatic-environments-plants-water-lilies-leaves
You’ve found SHELTER!
Increase your population by 10 deer.
You’ve found WATER!
Increase your population by 10 deer.
You’ve found WATER!
Increase your population by 10 deer.

Heather Miller Printed on 3/21/2016
The Ups and Downs of Populations page 9
Photo Credit: http://www.freestockphotos.biz/stockphoto/13322
Photo Credit:
https://pixabay.com/get/a0a3a77e989458d58353/1441383050/hunter-
160297_1280.png?direct
Photo Credit:
https://pixabay.com/get/a0a3a77e989458d58353/1441383050/hunter-
160297_1280.png?direct The local bear family can’t find
any more fish so they have turned to the deer in your
population as a food source. 5 deer in your population have been killed to feed the bears.
There are hunters in your area. 10 deer in your population have
been shot and killed.
There are hunters in your area. 10 deer in your population have
been shot and killed.
Photo Credit: https://commons.wikimedia.org/wiki/File:Biting_Midge.png
Photo Credit: https://commons.wikimedia.org/wiki/File:Biting_Midge.png
Photo Credit: http://www.freestockphotos.biz/stockphoto/15049
The biting fly population is booming this year! As a result,
many of the deer in your population have contracted
Hemorrhagic Disease and 5 have died.
The biting fly population is booming this year! As a result,
many of the deer in your population have contracted
Hemorrhagic Disease and 5 have died.
There is a highway near your habitat that your population
often crosses. Many are hit by cars. Decrease your deer
population by 10.
Photo Credit: http://www.public-domain-image.com/free-images/flora-
plants/flowers/water-lily-lotus-flower/aquatic-environments-plants-water-
lilies-leaves/attachment/aquatic-environments-plants-water-lilies-leaves
Photo Credit: http://www.torange.us/Plants/fruit-and-berries/currants-
in-isolation-33142.html
Photo Credit: http://www.freestockphotos.biz/stockphoto/15119
You’ve found WATER!
Increase your population by 10 deer.
You’ve found FOOD!
Increase your population by 10 deer.
You’ve found SHELTER!
Increase your population by 10 deer.

Heather Miller Printed on 3/21/2016
The Ups and Downs of Populations page 10
Photo Credit: http://www.public-domain-image.com/free-images/flora-
plants/flowers/water-lily-lotus-flower/aquatic-environments-plants-water-lilies-leaves/attachment/aquatic-environments-plants-water-lilies-leaves
Photo Credit: http://www.public-domain-image.com/free-images/flora-
plants/flowers/water-lily-lotus-flower/aquatic-environments-plants-water-lilies-leaves/attachment/aquatic-environments-plants-water-lilies-leaves
Photo Credit: http://www.torange.us/Plants/fruit-and-berries/currants-
in-isolation-33142.html
You’ve found WATER!
Increase your population by 10 deer.
You’ve found WATER!
Increase your population by 10 deer.
You’ve found FOOD!
Increase your population by 10 deer.
Photo Credit: http://www.torange.us/Plants/fruit-and-berries/currants-
in-isolation-33142.html Photo Credit: http://www.torange.us/Plants/fruit-and-berries/currants-
in-isolation-33142.html Photo Credit: http://www.torange.us/Plants/fruit-and-berries/currants-
in-isolation-33142.html
You’ve found FOOD!
Increase your population by 10 deer.
You’ve found FOOD!
Increase your population by 10 deer.
You’ve found FOOD!
Increase your population by 10 deer.
Photo Credit: http://www.public-domain-image.com/free-images/fauna-
animals/deers/mule-deer-in-california/attachment/mule-deer-in-california
Photo Credit: http://www.public-domain-image.com/free-images/fauna-
animals/deers/mule-deer-in-california/attachment/mule-deer-in-california
Photo Credit: http://www.public-domain-image.com/free-images/fauna-
animals/deers/mule-deer-in-california/attachment/mule-deer-in-california
You’ve found a MATE!
Increase your population by 5 deer.
You’ve found a MATE!
Increase your population by 5 deer.
You’ve found a MATE!
Increase your population by 5 deer.

Heather Miller Printed on 3/21/2016
The Ups and Downs of Populations page 11
Blackline Master 2

Heather Miller Printed on 3/21/2016
The Ups and Downs of Populations page 12

Heather Miller Printed on 3/21/2016
The Ups and Downs of Populations page 13
Engage Problem: How is population size affected by different environmental factors? Based on the patterns in the graphs, what do you think could account for the differences between the two populations of the deer? With your face partner, rally robin (share back and forth) one idea each that you wrote for the question above. Continue sharing back and forth until your teacher calls time. With your shoulder partner, research the following questions (BYOD):
What do deer need to survive? What interferes with a deer’s survival?
Hypothesis: If a population experiences _______________________ then it will ____________ because ___________________________________________________________________________________.
Explore You will be conducting your own population study with a population size of 100 deer. You will be exposing your deer to factors that they commonly encounter in their natural ecosystems and will be evaluating how it impacts their population.
Procedure:
1. Draw one card out of the envelope at a time. 2. Read what the card says and record the results in your data table.
For example, if the card says that aliens have invaded and have killed 10 deer, subtract 10 deer from your population, record the new number of deer in your population, and then carry the new number into the row below for the next turn.
3. DO NOT put the card back in the envelope. 4. Draw the next card and continue drawing and recording data until you have drawn 20 cards and
completed all 20 trials. 5. When you are finished with your trials, put all cards back in the envelope.
Population Limiting Factor Effect on Population
New Population
100 aliens invaded -10 90
90
Blackline Master 3
Heather Miller Printed on 3/21/2016
The Ups and Downs of Populations page 14
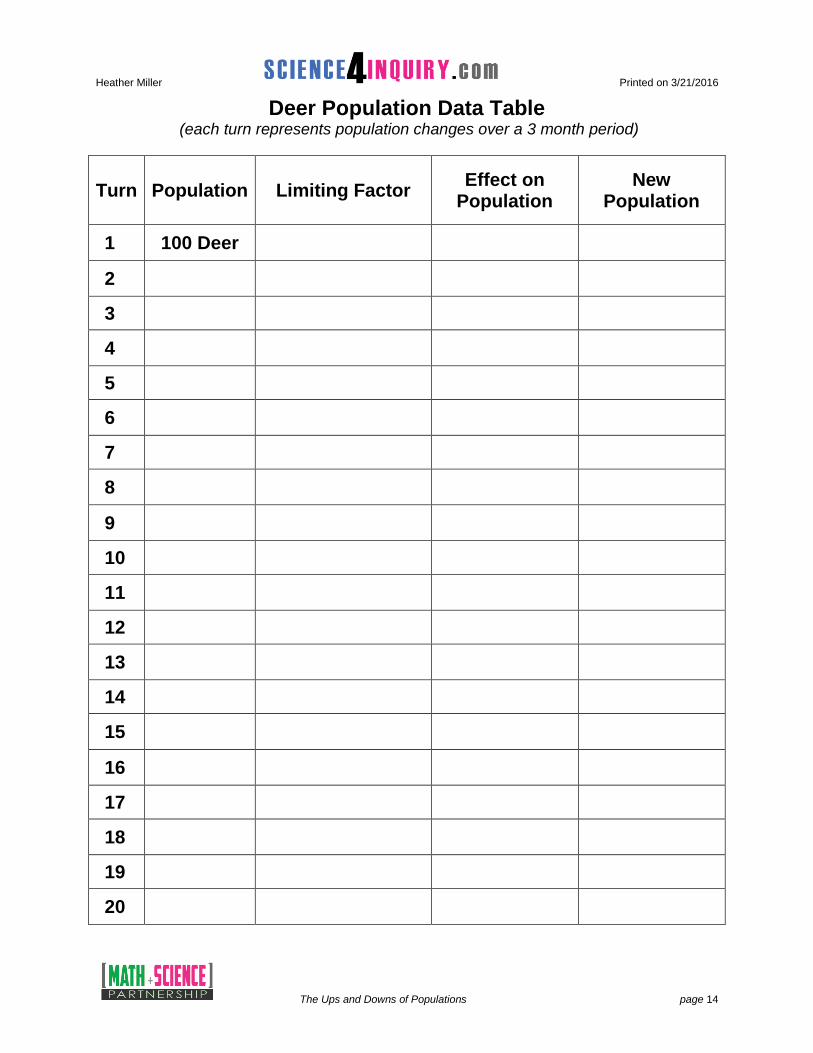
Deer Population Data Table (each turn represents population changes over a 3 month period)
Turn Population Limiting Factor Effect on
Population New
Population
1 100 Deer
2
3
4
5
6
7
8
9
10
11
12
13
14
15
16
17
18
19
20
Heather Miller Printed on 3/21/2016
The Ups and Downs of Populations page 15
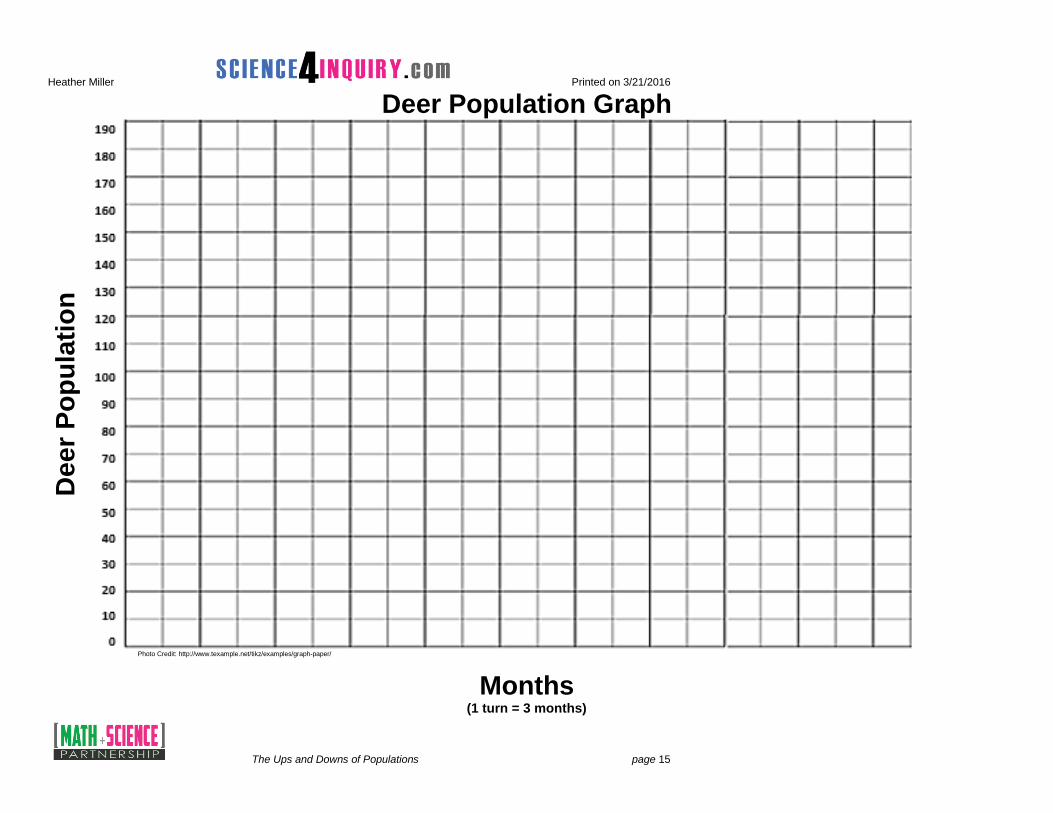
Deer Population Graph
Photo Credit: http://www.texample.net/tikz/examples/graph-paper/
Months (1 turn = 3 months)
De
er
Po
pu
lati
on

Heather Miller Printed on 3/21/2016
The Ups and Downs of Populations page 16
Explain Use your data and your graph to help you answer the following questions. 1. Give an overall description of your graph/data. Explain what factors accounted for the major
increases or decreases in your population.
2. Based on the cards that you chose, and using your data table as a reference, what do you think a “limiting factor” is?
3. Biotic factors are all of the living things in an ecosystem. What were some of the biotic limiting
factors in the deer’s ecosystem?
4. Abiotic factors are all of the mom-living things in an ecosystem. What were some of the abiotic limiting factors in the deer’s ecosystem?
5. Choose two limiting factors that had a positive effect on your population and explain why they had an impact on your population.
6. Choose two limiting factors that had a negative effect on your population and explain why they had
an impact on your population. 7. Carrying capacity is the maximum number of organisms that an ecosystem can support. Looking at
your data table and graph, what would you predict is the carrying capacity for your ecosystem? Explain your choice.
8. How is your graph similar or different than the graph of another group?

Heather Miller Printed on 3/21/2016
The Ups and Downs of Populations page 17
Expand/Elaborate Now that you know a little about deer and the limiting factors that affect their population sizes, think about one of your favorite animal or plant species and what might affect their population. You will be creating a simulated population study of your animal based on a little research and your knowledge of limiting factors.
Animal: ___________________________
Biotic Factors
Abiotic Factors
Factors that will increase the population:
Factors that will decrease the population:
The graph below represents your organism’s population and its changes over time. Explain the graph in terms of what caused the changes in the population fluctuations (increases, decreases, etc) for your specific organism.
Graph created by Heather Miller
Explanation of the graph:

Heather Miller Printed on 3/21/2016
The Ups and Downs of Populations page 18
Assessment
1. Aphids are a small insect that feed on plant material. Aphids are a popular food source for Ladybug Beetles. How would Ladybug Beetles be affected by a drought? (SC.7.L.17.3)
a. The Ladybug population would not be affected by the drought. b. The Ladybug population would increase because there would be less plants. c. The Ladybug population would decrease because there would be less aphids. d. The Ladybug population would decrease because there would be more aphids.
2. The graph shown represents the population of two different species of organisms, A and B. What is a
valid prediction based on this graph? (SC.7.L.17.3) (PTI 4,4. 5.8)
Photo Credit: Drawn by Heather Miller
a. Species A will eliminate species B after 1 year. b. Species A will not be present in the winter months. c. Species B will increase each autumn due to a decrease in temperature. d. Species B will decrease after a decrease in the population size of species A.
3. The food web below shows the relationship between different factors in a forest ecosystem. (SC.7.L.17.3) (PTI 5.8)
Photo Credit: https://commons.wikimedia.org/wiki/File:TrophicWeb.jpg
Identify an abiotic factor that could decrease the snake population.
a. disease in the trees b. a decrease in air and soil quality c. an increase in the fox population d. a decrease in the number of frogs
Blackline Master 4

Heather Miller Printed on 3/21/2016
The Ups and Downs of Populations page 19
4. Goatfish are fish that move in schools and feed on plankton and plant matter. Natural predators of the goatfish include sea trout, sharks, pelicans and dolphins. The graph below shows how the number of goatfish in an area has changed over time. (SC.7.L.17.3) (PTI 4.4, 5.8)
Photo Credit: Created by Heather Miller in Excel
Based on the data, one student concludes that a new predator was introduced into the area during this time period. Which of the following is a likely alternate explanation for the change in the goatfish population?
a. goatfish prey increased in the area b. aquatic plants in the area decreased c. the temperature of the area increased d. goatfish parasites decreased in the area
5. Squirrels eat acorns. Good acorn production happens when there are good growing conditions for the
oak trees that make acorns. Often, there are many acorns produced one year but very few acorns the next year. What is the most likely impact on the squirrel population in years when fewer acorns are produced? (SC.7.L.17.3)
a. Nest size will increase. b. Competition will increase. c. Predation risks will increase. d. Reproduction rates will increase.
6. Like the success of animals, the success of plants is limited based on the resources available to each
individual. In the tropical rainforest, plants are especially limited by the space they have available to grow and reproduce. Which of these statements describes a way that limited space will impact the success of a plant in the rainforest? (SC.7.L.17.3)
a. A plant without enough space will face increased predation from herbivores b. A plant without enough space will not have as many parasites and diseases. c. A plant without enough space will be more likely to be impacted by air quality. d. A plant without enough space will not be able to capture enough light to grow.

Heather Miller Printed on 3/21/2016
The Ups and Downs of Populations page 20
Engage:
Based on the patterns in the graphs…Student responses will vary.
What do deer need to survive? Student responses will vary but could include food, water, shelter, space, and mates.
What interferes with a deer’s survival? Student responses will vary but could include disease, hunters, lack of food, water, shelter, space, and mates.
Hypothesis: If a population experiences (a hardship, lack of food, lack of water, too many predators, an abundance of food, a stable ecosystem, etc) then it will (increase, decrease, stay the same, etc) because (organisms need food to survive, organisms need to mate to carry on the population, etc.)
***Units are intentionally left off the Deer Population A & B graphs so that students can interpret them in a way that makes sense to them. This could generate good discussion about what would be an appropriate unit to label this axis with. For example, days would not likely be appropriate because populations don’t typically change that much from day to day. Years or decades might be a more appropriate time label.*** Explore:
Student data & graphs will vary. Explain:
1. Give an overall description of your graph/data. Explain what factors accounted for the major increases or decreases in your population. Student responses will vary based on their graphs. Students should be able to identify what caused the increases and decreases in their population of deer.
2. Based on the cards that you chose, and using your data table as a reference, what do you think a “limiting factor” is? Student response should indicate that a limiting factor is anything in an organisms’ environment that can have a positive or negative impact on their population size.
3. What were some of the biotic limiting factors in the deer’s ecosystem? Food, hunters, bears, wolves, mates, biting flies, disease (if not viral), shelter (if trees and brush), snakes, and bears. Students may have additional responses that are correct as long as they are LIVING things.
4. What were some of the abiotic limiting factors in the deer’s ecosystem? Water, air, cars, fire, drought, guns, and seasons. Students may have additional responses that are correct as long as they are NON-LIVING things.
5. Choose two limiting factors that had a positive effect on your population and explain why they had an impact on your population. Food, water, shelter, mates, too many females all had a positive impact on the population. These allowed the deer to be healthy and reproduce which increased their numbers.
6. Choose two limiting factors that had a negative effect on your population and explain why they had an impact on your population. Drought, fire, snake bites, predators, disease, too many males, hunters, bad weather, and car traffic all had a negative impact on the population. These factors caused death or heightened competition which led to a decrease in numbers.
7. Carrying capacity is the maximum number of organisms that an ecosystem can support. Looking at your data table and graph, what would you predict is the carrying capacity for your ecosystem? Explain your choice. Student responses will vary depending on their graphs
Blackline Master 5: Answer Keys

Heather Miller Printed on 3/21/2016
The Ups and Downs of Populations page 21
and data. The carrying capacity should be represented somewhere around their maximum population. Once deer reach a certain population size, the resources in their ecosystem become stretched too thin amongst the deer and deer begin dying or are not born.
8. How is your graph similar or different than the graph of another group? Student responses will vary depending on their graph and the graph they choose for comparison.
Extend/Elaborate: Student animals, biotic factors, abiotic factors, factors that will increase or decrease the population, and explanations will vary depending on their chosen organism. Generally speaking, their graph explanation should state something along the lines of the population starting off relatively stable and then there was a huge jump in numbers. This could be due to available resources that year like excessive food, water, shelter, or mates. The following year the population crashed likely due to unavailability of those same or other resources. In the end, the population appears to return to the stable population which we can assume is near its carrying capacity. Evaluate: 1. C 2. D 3. B 4. B 5. B 6. D