the university sciences building chris dunlay report 3 – 11.16.2011 6 the university sciences...
TRANSCRIPT

Technical Report 3 – 11.16.2011
1 The University Sciences Building Chris Dunlay
Technical Report 3
Chris Dunlay – Structural
Faculty Consultant: Dr. Boothby
11.16.2011
THE UNIVERSITY SCIENCES BUILDING
NORTHEASTERN, USA

Technical Report 3 – 11.16.2011
2 The University Sciences Building Chris Dunlay

Technical Report 3 – 11.16.2011
3 The University Sciences Building Chris Dunlay
Table of Contents
Executive Summary ................................................................................................................................................. 4
Structural Overview ................................................................................................................................................ 6
Foundations......................................................................................................................................................... 6
Floor Systems ...................................................................................................................................................... 7
Framing System ................................................................................................................................................... 7
Lateral System ..................................................................................................................................................... 8
Roof System ........................................................................................................................................................ 9
Design Codes ....................................................................................................................................................... 9
Materials Used .................................................................................................................................................. 10
Gravity Loads ......................................................................................................................................................... 11
Dead and Live Loads .................................................................................................................................. 11
Building Weight ......................................................................................................................................... 12
Snow Loads........................................................................................................................................................ 15
Lateral Loads ......................................................................................................................................................... 17
Wind Loads ........................................................................................................................................................ 17
Seismic Loads .................................................................................................................................................... 22
Lateral Load Distribution ....................................................................................................................................... 24
ETABS Computer Model ........................................................................................................................................ 27
Load Combinations................................................................................................................................................ 29
Building Torsion ..................................................................................................................................................... 31
Member Checks .................................................................................................................................................... 32
Conclusion ............................................................................................................................................................. 34
Appendix ............................................................................................................................................................... 35
Appendix A: Wind Calculations ........................................................................................................................ 35
Appendix B: Seismic Calculations ...................................................................................................................... 37
Appendix C: Stiffness Calculations ................................................................................................................... 39
Appendix D: Member Checks ............................................................................................................................ 41
Appendix E: Typical Plans .................................................................................................................................. 44

Technical Report 3 – 11.16.2011
4 The University Sciences Building Chris Dunlay
Executive Summary
The purpose of Technical Report 3 is to analyze and evaluate the effectiveness of the existing lateral
system of the University Sciences Building (USB). The USB is a 209,000 square foot dual sciences
building located in Northeast, USA. It houses 300+ offices, multiuse classrooms, laboratories, and
open collaborative spaces. The USB took nearly 3 ½ years to construct under a construction
manager at risk method. The building’s atriums are the main focus in the core design of the building,
including a 3 story helical ramp atrium. The USB’s unique materials and one of kind cantilevers
provide an interesting appeal.
This report includes the analysis of dead, live, snow loads that were provided on the structural
drawings. Also, wind and seismic loads were calculated per chapters 6 and 12 of ASCE 7-05. It was
determined that the seismic loads control by a factor of 1.6.
Furthermore, a computer model of the lateral system was constructed using ETABS. The model
included line elements representing columns, beams and bracing members. Meshed areas were
used to represent the walls in the lateral system. Rigid diaphragms were also put into the model,
introducing mass at each level.
After the completion of the model, modal information was documented and determined to be accurate.
Eight braced frames were then analyzed to check the adequacy of their design. The relative stiffness
of each frame was found to understand how much load each frame experiences compared to the
others. Direct, torsional, and total shear were calculated for both wind and seismic in the North-South
and East-West directions. Next, story displacements and drifts were calculated under the same
loading conditions. These values were then compared to the industry standard H/400 maximum drift
value. Building torsion, inherent and accidental, was also calculated to gain an understanding of how
much torsion the building may experience. Finally, three members from different braces frames were
analyzed through hand calculations. These members include a HHS diagonal brace, a wide flanged
column, and a concrete column.
With an accurate ETABS model with verified hand calculations, it can be determined that the lateral
system is capable of resisting the lateral loads. As the thesis procedure continues, this technical
report provides valuable information in considering a redesign proposal.

Technical Report 3 – 11.16.2011
5 The University Sciences Building Chris Dunlay
Figure 2 – Helical ramp
Building Introduction
The University Sciences Building is a pioneering sciences
facility pushing the envelope on innovative research and
education. The 209,000 square foot dual building is
strategically nested on a 5.6 acre site on the urban university in
Northeastern, USA. The building includes 300+ offices, state-
of-the-art laboratories, classrooms, lecture halls, a 250 seat
auditorium, and a 147 space parking garage. The University’s
standard building aesthetics include a symmetrical layout and
typically a beige brick veneer. The USB’s extravagant
cantilevers and complex building enclosures express the
University’s commitment to innovative architecture and
sustainability.
The building was designed around the common idea of atrium
space and the majority of other open spaces exposed to light,
predominately through curtain wall systems. The intent was to
let these open areas serve as collaborative spaces for
interaction among students, researchers, and professors. The
featured atrium of the building is its 3 story helical structure,
which serves as a ramp to levels 3–5 with classrooms
intermediately located through its core (Figure 2).
The sophisticated and ‘edgy’ design of the façade expresses
the University’s movement to push the envelope for not only
the sciences but also its architecture. The material used to
clad the building is a unique zinc material. Both the black zinc
molded squares and the sliver aluminum window trim give the
building a different and uneven appearance which sparks
interest towards the building.
Figure 1 – Google Maps aerial view of site
Figure 3 – South Cantilever

Technical Report 3 – 11.16.2011
6 The University Sciences Building Chris Dunlay
Each floor’s different floor plans presents one of a kind overhangs and cantilevers which really
express the structure of the building (Figure 3). The placement of key structural components are
carefully placed to preserve optimal structural function from floor to floor.
Structural Overview
The University Sciences Building sits upon a Site Class C (Geotechnical Report verified with ASCE 7-
05 Chapter 11) with drilled 30’’ caissons, caisson caps, spread, continuous, stepped footings, grade
beams and column footings. Levels 1-3 of Building 1 and level 4 of Building 2 use concrete beams
and slabs with a combination of concrete columns and steel encased columns. The upper floors of
both buildings use a composite beam/slab system and continue with steel and encased columns. The
lateral systems consists of shear walls and braced steel frames. The shear/retaining walls start from
the grade and end at various heights around the building. The braced frames are composed of wide
flange chords with HSS diagonals that also reach various heights.
The design and analysis of foundations are in accordance with the geotechnical report provided by
Construction Engineering Consultants, Inc and ASCE 7-05. Schematic and design development
stages were conducted with a safe assumpiton that the soil class was solid rock. The majority of the
University’s soil has been geologic lly tested to show this. As time proceeded and the geotechincal
report was released, it was found that the site class was different than anticipated, was a site class C
was determined appropreiate. This induced a complete redesign of Building 2’s foundation along with
using a new ‘flowable fill’ for backfill for Building 1. Flowable fill is entrained with fly ash, cement, and
other agents to generate negliable lateral pressure on surrounding foundation walls but maintains a
compressive strength of 500 psi (Calculations for this are not provided in this technical report).
In has been concluded from the structural drawings that the allowable soil/rock bearing pressures for
spread footings on weathered shale are 6000 psf. Likewise for siltstone/sandstone allowable
pressures are 12000 psf. In addition, caissons socketed 5’ into siltstone/sandy stone are to have an
allowable pressure of 50 ksf.
The building load path initiated from the floor systems to columns and then to their respective
caissons or interior column footings. For exterior perimeter caissons, they are connected with grade
beams to interior caissons or grade column foundations. The slab on grade (SOG) is to be poured
onto compacted soil to withstand 500 psf and a minimum of 6” of compacted Penn DOT 2A or 2B

Technical Report 3 – 11.16.2011
7 The University Sciences Building Chris Dunlay
material. Furthermore, the fill must be compacted to 95% of the dry density per ASTM D 1557. A
vapor barrier is then required to be placed between the fill and the slab.
Expansion joints should be used between the footings and floor slabs to minimize differential
settlement stresses. The slab on grade is designed to have an f’c of 4500 psi of normal weight
concrete and a mix class C.
Due to the complexity of the floor layouts, typical bays occur irregularly and are comprised of a variety
of beam sizes and lengths (Refer to appendix E for floor plans). In Building 1, floors 1 - 3 utilize
concrete reinforced beams that range in size from 50”x24” to 10”x12”, integral with formed 6”
reinforced slabs. The upper floors utilize composite and non-composite beam construction. These
floor systems range from 1” x 20 gauge metal deck with 5” reinforced concrete topping to 2” x 18
gauge metal deck with 4.5” reinforced concrete topping. The most recurring slab is a composite 2”x18
GA deck with 4.5” normal weight concrete topping, which is found in both building 1 and 2 on floor 4-
roof. Areas on levels 4 and 5 of Building 1 brace the metal decking between beams and girders with
L4x4x3/8”.
The composite and non-composite decks are placed with the ribs of the deck perpendicular to the infill
beams to maintain the rigidity of the system. This proved to be a conflict to construct with the
placement of shear studs. Where it is efficient to place studs along the length of the beam uniformly
normal to the valley and peaks of the deck, it was extremely difficult to maintain this layout with the
odd angling placement of particular beams (Figure 4).
The USB has three different types of columns, reinforced concrete, encased A992 steel with concrete,
and A992 wide flange steel. Reinforced concrete columns vary in size from 24” to 18” diameter
circular columns and 16”x18” to 33”x37” rectangular columns. Also, wide flange columns range from
W12x40 to W21x210. Levels 1 and 2 of Building 1 have both circular and rectangular concrete
columns. Level 3 of Building 1 uses circular/rectangular encased steel and circular reinforced doesn’t
hold true for three shear walls that start with a connection to a caisson cap at grade and rise 72’ to
Figure 4. Perpendicular Decking
Section – Case 3
Technical Report 3 – 11.16.2011
8 The University Sciences Building Chris Dunlay
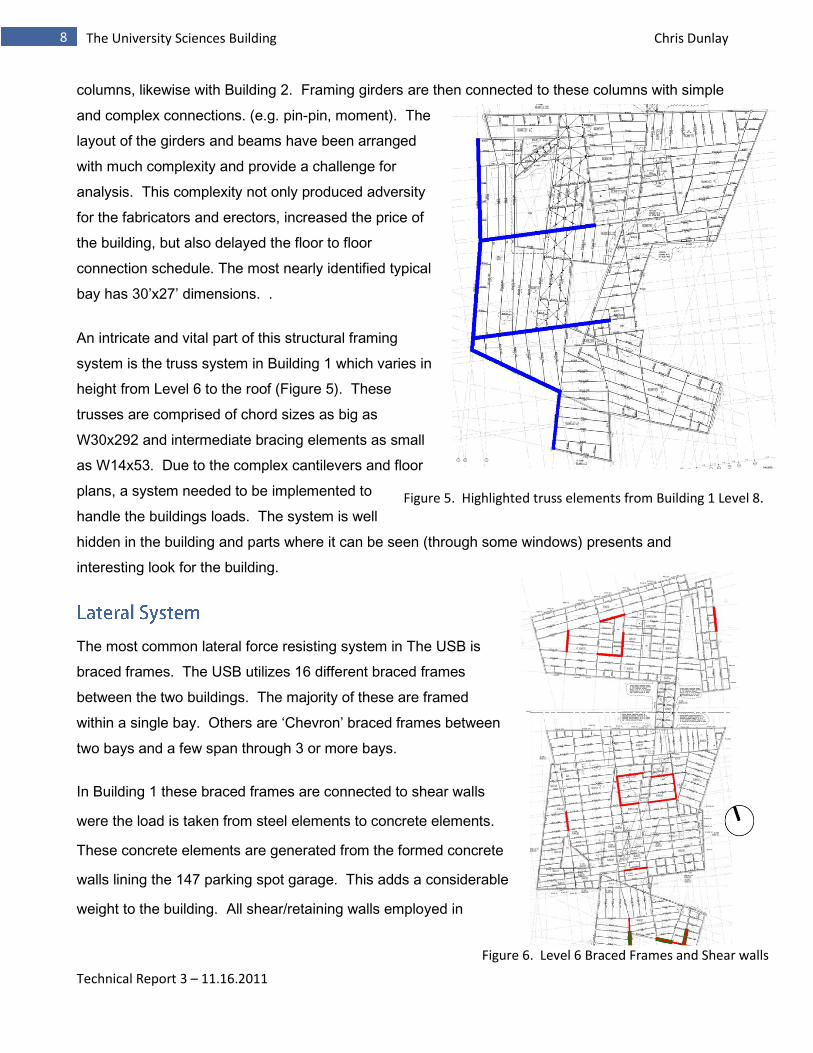
Figure 5. Highlighted truss elements from Building 1 Level 8.
Figure 6. Level 6 Braced Frames and Shear walls
columns, likewise with Building 2. Framing girders are then connected to these columns with simple
and complex connections. (e.g. pin-pin, moment). The
layout of the girders and beams have been arranged
with much complexity and provide a challenge for
analysis. This complexity not only produced adversity
for the fabricators and erectors, increased the price of
the building, but also delayed the floor to floor
connection schedule. The most nearly identified typical
bay has 30’x27’ dimensions. .
An intricate and vital part of this structural framing
system is the truss system in Building 1 which varies in
height from Level 6 to the roof (Figure 5). These
trusses are comprised of chord sizes as big as
W30x292 and intermediate bracing elements as small
as W14x53. Due to the complex cantilevers and floor
plans, a system needed to be implemented to
handle the buildings loads. The system is well
hidden in the building and parts where it can be seen (through some windows) presents and
interesting look for the building.
The most common lateral force resisting system in The USB is
braced frames. The USB utilizes 16 different braced frames
between the two buildings. The majority of these are framed
within a single bay. Others are ‘Chevron’ braced frames between
two bays and a few span through 3 or more bays.
In Building 1 these braced frames are connected to shear walls
were the load is taken from steel elements to concrete elements.
These concrete elements are generated from the formed concrete
walls lining the 147 parking spot garage. This adds a considerable
weight to the building. All shear/retaining walls employed in

Technical Report 3 – 11.16.2011
9 The University Sciences Building Chris Dunlay
building are kept on the lower floors, which has been assumed to
level 6. Refer to Figure 6 for the layout of brace frames (red) and shear walls (green) on Level 6. The
challenge for Technical Report 3 will be to figure out how these lateral force resisting systems receive
force on all floors of the building.
This dual building system has 5 different roof heights which take
into account mechanical penthouses. Figure 7
gives a discription of these varying heights in reference to grade
elevation of 0’-0” (+880’). The framing of the roof is composed of
wide flange framing with a 3” x 18 GA metal roof deck. The
construction of the roof includes a modified bituminous roof
system. This systems ranges in size from 3” to 12”. This system
is to undergo a flood test with 2” of ponding water for 24 hours to
test for adaquacy.
In accordance with the specifications of structural drawing S0.01 the original design is to comply with
the following codes:
2006 International Building Code with local amendments (IBC 2006)
2006 International Fire Code with local amendments (IFC 2006)
Minimum Design Loads for Building and other structures (ASCE 7-05)
Building Code Requirements for Structural Concrete (ACI 318)
AISC Manual of Steel Construction LRFD 3rd Edition
These codes were also used in hand calculations and verifications in this Technical Report and those
forthcoming.
72’
100’
114’
128’
142’

Technical Report 3 – 11.16.2011
10 The University Sciences Building Chris Dunlay
The materials used for the construction of The USB are described in the following tables including
relevant specifications:
Structural Steel
Type ASTM Standard Grade Fy (ksi)
Wide Flange A992 50 50
Channels A572 50 50
Rectangular and Round HSS A500 B 46
Pipes A53 E 35
Angles A572 50 50
Plates A572 50 50
Tees A992 50 50
Concrete
Location in the Structure f’c Weight Mix Class
Footings, Caissons, Grade Beams 4000 Normal A
Slab On Grade 4500 Normal C
Walls and Columns 4500 Normal C
Beams and Slabs 4500 Normal C
Slab on Metal Deck 4000 Normal C
Equipment Pads and Curbs 4000 Normal B
Lean Concrete 3000 Normal E
Aggregate
Type ASTM Standard
Normal Weight C33
Light Weight C330 and C157
f’c is the concrete compressive strength at 28 days or at 7 days
for high early strength concrete.
Mix class as defined by project specifications
Figure 8. Summary of Materials used on The USB Project with applicable specifications

Technical Report 3 – 11.16.2011
11 The University Sciences Building Chris Dunlay
Gravity Loads
Per the requirements of Technical Report 1, dead, live, and snow loads are to be calculated and
verified to those provided on the structural drawings. Alongside these calculations and verifications
spot check calculations of gravity members for adequacy are also provided. These calculations can
be found in appendix A.
Provided Superimposed Dead Loads and Live Loads
Locations Superimposed Dead Load
(psf)
Live Loads
(psf)
Garage 35 50
Planetary Robotics 15 150
Loading Dock 5 250
Storage 35 125
Classroom 35 40
Halls, Assembly, Public Areas 35 80
Office, Meetings Rooms 35 50
Mechanical and Machine Room 75 100
Roof 35 30
Green Roof 1 35 30
Garage Roof 200 100
Green Roof 2 200 30
Mechanical Roof 35 50
Bridge 1 75 100
Roof Pavers 50 100
Roof River Rocks 55 30
The structural drawings provide a schedule of superimposed dead and live loads for
particular areas (Figure 9). Calculations of certain loads verify those provided in the table
and in some cases are found to be conservative. This was perhaps a consideration due the
complexity of the floor layout. Self-weights were also calculated to be applied in addition to
the given dead and live loads.
Figure 9. Table of provided superimposed dead loads and live loads

Technical Report 3 – 11.16.2011
12 The University Sciences Building Chris Dunlay
The building weight was calculated considering superimposed dead loads, self-weights of
columns, shear walls, braced frames, roofs, and exterior wall loads. This section is intended
to provide weights for seismic calculations to generate total base shear. This value is then
compared to the value provided on the drawings (See Seismic Section). Without the
assistance of computer software to generate accurate weights, overall assumptions had to
be made. First, from the provided schedules, pounds per square foot of reinforced concrete
beams were tabulated considering weight of normal weight concrete (145 pcf) and
supplemental reinforcement bars. Secondly, formed slab and metal deck slab pounds per
square foot were calculated. Next linear takeoffs of steel beams were tabulated on floors 3-
6 of building 1. This process reoccurred for floors 5-6 in building 2. Also counts of columns
from the column schedule were made. A weight per lineal foot was noted per column. Next,
the building enclosure is broken up into two groups; curtain walls and stud build out system.
From assembly weight estimates it was assumed 15 psf for the curtain wall and 30 psf for
the stud build out. Finally, the provided superimposed dead loads was summated and
yielded a total pound per square foot for the floor. With all of the slabs, concrete beams,
steel beams, columns, façade, and superimposed dead loads calculated to either a pound
per square foot or linear foot, they are ready to be multiplied by its respective dimensions to
result a total kilo pound per floor.
With a weight of kips per floor, it was then divided by that floor’s square footage resulting in
a kip per square foot (ksf) for that floor. As stated before, level 3-6 in building 1 and levels 5-
6 in building 2 were calculated with detailed member calculation. After investigation and
grouping of these numbers per their typical floor layout, an average ksf was calculated to be
applied to similar levels. This ksf was then applied to the remaining floors square footage
once again resulting in kips per floor. The individual kips per floor were then summed to
yield a total building weight. The following tables show numerical calculation. It is important
to note that Technical Report 3 with provide a more detailed calculation of the building
weight.

Technical Report 3 – 11.16.2011
13 The University Sciences Building Chris Dunlay
Building 1
Level ~ Square Footage Weight (K) KSF
3 33,676 5,180.689 0.153839
4 20,983 2,644.86 0.126048
5 22,359 3,190.55 0.142697
6 27,633 3795.15 0.137342
7 21,018 2,592.60 0.123352
8 25,697 3,455.30 0.134463
9 21,970 2,954.15 0.134463
Total 173,336 23,813.32 0.137382
Building 2
Level ~ Square Footage Weight (K) KSF
5 13413 1,654.52 0.1234 *
6 14,103 1,739.609 0.1234
7 13,438 1,657.604 0.1234
8 14,492 1,787.617 0.1234
Roof 14,915 1,839.795 0.1234
Total 70,361 8,679 0.1234
Figure 10. Table of floor approximate square footage, weights (K),
and KSF.
* Note: Level 5 of Building 2 was calculated with member weight
accuracy and its respective KSF was used as an average for the
remaining floors.

Technical Report 3 – 11.16.2011
14 The University Sciences Building Chris Dunlay
Live Loads
Location
Design
Live Load
(psf)
ASCE 7-05
Live Load
(psf)
Notes
Garage 50 40 May be from storage during construction
Planetary Robotics 150 200 N/A
Loading Dock 250 N/A N/A
Storage 125 125 Anticipated light storage
Classroom 40 40 N/A
Halls, Assembly, Public Areas 80 80 N/A
Office, Meetings Rooms 50 (+20) 50 (+20) +20 for Partition load
Mechanical and Machine Room 100 100 N/A
Roof 30 20 N/A
Green Roof 1 100 100 N/A
Garage Roof 30 30 N/A
Green Roof 2 50 60 Project green roof specifications may cause
discrepancy
Mechanical Roof 100 N/A N/A
Bridge 100 100 Serves as a corridor
Roof Pavers 100 100 N/A
Roof River Rocks 30 N/A N/A
From the structural loading diagrams, Live Loads were noted and compared to those
provided in ASCE 7-05. Most of these values were verified by the code and others were
found to be very conservative. A summary of these results can be found in Figure 11.
Figure 11. Comparison table of live loads from design documents and ASCE 7-05
Technical Report 3 – 11.16.2011
15 The University Sciences Building Chris Dunlay
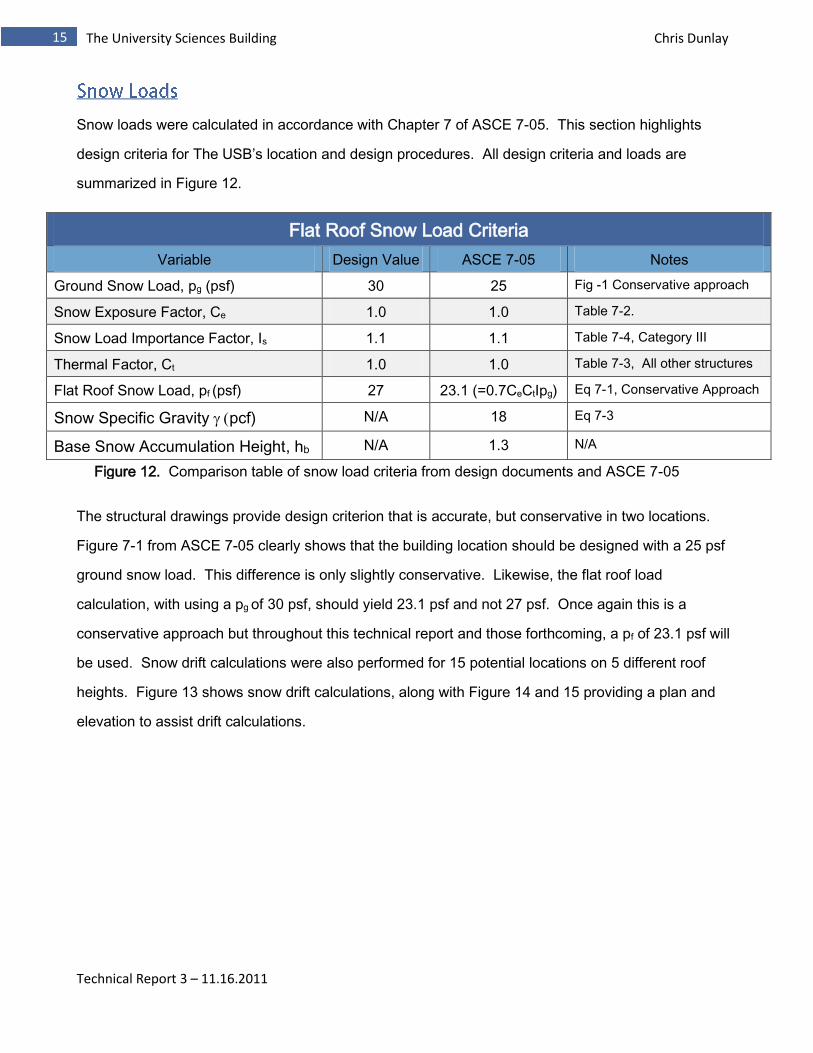
Snow loads were calculated in accordance with Chapter 7 of ASCE 7-05. This section highlights
design criteria for The USB’s location and design procedures. All design criteria and loads are
summarized in Figure 12.
Flat Roof Snow Load Criteria
Variable Design Value ASCE 7-05 Notes
Ground Snow Load, pg (psf) 30 25 Fig -1 Conservative approach
Snow Exposure Factor, Ce 1.0 1.0 Table 7-2.
Snow Load Importance Factor, Is 1.1 1.1 Table 7-4, Category III
Thermal Factor, Ct 1.0 1.0 Table 7-3, All other structures
Flat Roof Snow Load, pf (psf) 27 23.1 (=0.7CeCtIpg) Eq 7-1, Conservative Approach
Snow Specific Gravity pcf) N/A 18 Eq 7-3
Base Snow Accumulation Height, hb N/A 1.3 N/A
The structural drawings provide design criterion that is accurate, but conservative in two locations.
Figure 7-1 from ASCE 7-05 clearly shows that the building location should be designed with a 25 psf
ground snow load. This difference is only slightly conservative. Likewise, the flat roof load
calculation, with using a pg of 30 psf, should yield 23.1 psf and not 27 psf. Once again this is a
conservative approach but throughout this technical report and those forthcoming, a pf of 23.1 psf will
be used. Snow drift calculations were also performed for 15 potential locations on 5 different roof
heights. Figure 13 shows snow drift calculations, along with Figure 14 and 15 providing a plan and
elevation to assist drift calculations.
Figure 12. Comparison table of snow load criteria from design documents and ASCE 7-05

Technical Report 3 – 11.16.2011
16 The University Sciences Building Chris Dunlay
Snow Drift Calculations
General Windward Leeward
Location hr hc hc/hb Lu (ft) hd (ft) wd (ft) pd (psf) Lu (ft) hd (ft) wd (ft) pd (psf)
1 14 12.71 9.85 25 1.25 4.99 22.3 28.5 1.35 5.41 24.2
2 14 12.71 9.85 26.75 1.30 5.20 23.3 25 1.25 4.99 22.3
3 14 12.71 9.85 VOID VOID
4 14 12.71 9.85 68 2.19 8.74 39.1 25 1.25 4.99 22.3
5 14 12.71 9.85 25 1.25 4.99 22.3 39.5 1.64 6.55 29.3
6 14 12.71 9.85 25 1.25 4.99 22.3 25 1.25 4.99 22.3
7 14 12.71 9.85 25 1.25 4.99 22.3 54.75 1.95 7.82 35.0
8 56 54.71 42.39 35.25 1.53 6.14 27.5 41 1.67 6.69 29.9
9 56 54.71 42.39 37 1.58 6.31 28.2 70 2.22 8.87 39.7
10 28 26.71 20.70 25 1.25 4.99 22.3 35.25 1.53 6.14 27.5
11 28 26.71 20.70 25 1.25 4.99 22.3 99.5 2.63 10.53 47.1
12 14 12.71 9.85 25 1.25 4.99 22.3 25 1.25 4.99 22.3
13 14 12.71 9.85 43.75 1.73 6.93 31.0 25 1.25 4.99 22.3
14 14 12.71 9.85 25 1.25 4.99 22.3 25 1.25 4.99 22.3
15 14 12.71 9.85 58.5 2.02 8.09 36.2 25 1.25 4.99 22.3
72’
100’
114’
128’
142’
1
2
5
6 3
4 9
8
10
11
12
13 15
14
7
Figure 13. Table of Snow Drift Calculations. Note: Snow Drift Loads are in addition to flat
roof snow load. Total Snow @ max drift location = 23.1 psf + 47.1 psf = 70.2 psf
Figure 14. Plan of varying roof elevations with
potential drift locations
Figure 15. Elevation looking NE detailing roof elevations

Technical Report 3 – 11.16.2011
17 The University Sciences Building Chris Dunlay
Lateral Loads
As part of technical report 1, wind and seismic loads were calculated to retain a better understanding
of the lateral systems to be further elaborated in Technical report 3. Without the assistance of
modeling the whole structure in a structural software, it is uncertain to evaluate how much force is
being distributed among the different lateral components. Assumptions were made to provide a
simplified basis for calculations. For this Technical Report, hand calculations were performed in
accordance with ASCE 7-05 and can be found in the Appendices B (wind) and C (seismic).
Wind load calculations were conducted in accordance with Method 2 Main Wind Force Resisting
System (MWRFS) procedure from Chapter 6 of ASCE 7-05. Once again, due to the complexity of
floor plans and elevations which produce an undulating façade, assumptions have been made in
order to perform basic calculations. Building 1 was simplified by taking the most extreme dimensions
(length, base, and height) and using them to generate a box building. This allowed wind to be
analyzed on a planar surface normal to the wind in both the North-South and East-West directions of
Building 1. This initially would trigger the belief of a conservative approach but further investigation in
Technical Report 3 may show otherwise. It is to be noted that for N-S wind, the south wind will be
conservative for its elevation changes. Similarly, E-W wind has a gradual change in grade but these
calculations have implemented the conservative approach.
The wind follows are particular load path which essentially drives the design of the lateral systems.
The wind encounters the components and cladding of the façade which are then taken by the floor
slabs. Next, the slabs carry the load to the shear walls and brace frames which deliver the load to the
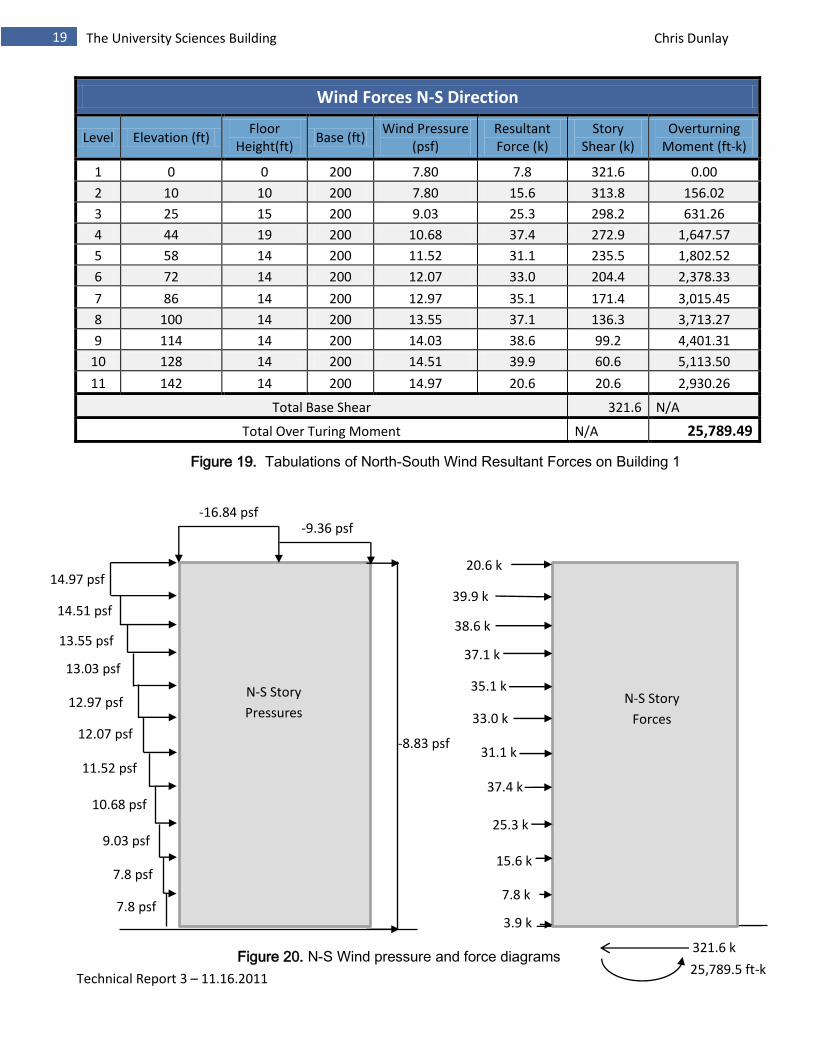
foundation of the building. The following tables (Figures 18-23) show resulting wind pressures and
forces in both the North-South and East-West directions of Building 1.

Technical Report 3 – 11.16.2011
18 The University Sciences Building Chris Dunlay
Figure 18. Tabulations of North-South Wind Pressures on Building 1
Wind Pressures - N-S Direction
Type Floor Height Wind Pressure
(psf)
Internal Pressure Net Pressure
(+) (-) (+) (-)
Windward
1 0 7.80 3.74 -3.74 11.54 4.06
2 10 7.80 3.74 -3.74 11.54 4.06
3 25 9.03 3.74 -3.74 12.77 5.29
4 44 10.68 3.74 -3.74 14.42 6.94
5 58 11.52 3.74 -3.74 15.26 7.78
6 72 12.07 3.74 -3.74 15.81 8.33
7 86 12.97 3.74 -3.74 16.71 9.23
8 100 13.55 3.74 -3.74 17.29 9.81
9 114 14.03 3.74 -3.74 17.77 10.29
10 128 14.51 3.74 -3.74 18.25 10.77
11 142 14.97 3.74 -3.74 18.71 11.23
Leeward All Floors -8.83 3.74 -3.74 -5.09 -12.57
Side Walls All Floors -13.10 3.74 -3.74 -9.36 -16.84
Roof
0-57 -16.84 3.74 -3.74 -13.10 -20.58
57-144 -16.84 3.74 -3.74 -13.10 -20.58
144-228 -9.36 3.74 -3.74 -5.62 -13.10
>228 -5.61 3.74 -3.74 -1.87 -9.35
Technical Report 3 – 11.16.2011
19 The University Sciences Building Chris Dunlay
Figure 19. Tabulations of North-South Wind Resultant Forces on Building 1
Figure 20. N-S Wind pressure and force diagrams
Wind Forces N-S Direction
Level Elevation (ft) Floor
Height(ft) Base (ft)
Wind Pressure (psf)
Resultant Force (k)
Story Shear (k)
Overturning Moment (ft-k)
1 0 0 200 7.80 7.8 321.6 0.00
2 10 10 200 7.80 15.6 313.8 156.02
3 25 15 200 9.03 25.3 298.2 631.26
4 44 19 200 10.68 37.4 272.9 1,647.57
5 58 14 200 11.52 31.1 235.5 1,802.52
6 72 14 200 12.07 33.0 204.4 2,378.33
7 86 14 200 12.97 35.1 171.4 3,015.45
8 100 14 200 13.55 37.1 136.3 3,713.27
9 114 14 200 14.03 38.6 99.2 4,401.31
10 128 14 200 14.51 39.9 60.6 5,113.50
11 142 14 200 14.97 20.6 20.6 2,930.26
Total Base Shear 321.6 N/A
Total Over Turing Moment N/A 25,789.49
14.97 psf 20.6 k
13.55 psf
13.03 psf
12.97 psf
12.07 psf
11.52 psf
10.68 psf
9.03 psf
7.8 psf
7.8 psf
15.6 k
7.8 k
25.3 k
37.4 k
31.1 k
33.0 k
psf
35.1 k
37.1 k
38.6 k
39.9 k
3.9 k
-16.84 psf -9.36 psf
14.51 psf
321.6 k
25,789.5 ft-k
-8.83 psf
N-S Story
Forces
N-S Story
Pressures

Technical Report 3 – 11.16.2011
20 The University Sciences Building Chris Dunlay
Figure 21. Tabulations of East-West Wind Pressures on Building 1
Similar calculations were performed for wind in the East-West direction (Figure 20). As the elevation
and grade vary on the west and east elevations, it has been assumed to simplify this by using floors 3
to 11 (penthouse roof) in the calculations. The West Elevation incorporates elaborate overhangs
which will be an interesting topic of investigation in Technical Report 3. The overall assumptions of a
planar elevation are intuitive at this point to be conservative but suction and lift may prove to increase
the wind pressures over the initial assumptions.
Wind Pressures - E-W Direction
Type Floor Height Wind
Pressure (psf)
Internal Pressure Net Pressure
(+) (-) (+) (-)
Windward
3 25 8.99 3.74 -3.74 12.73 5.25
4 44 10.62 3.74 -3.74 14.36 6.88
5 58 11.47 3.74 -3.74 15.21 7.73
6 72 12.01 3.74 -3.74 15.75 8.27
7 86 12.91 3.74 -3.74 16.65 9.17
8 100 13.48 3.74 -3.74 17.22 9.74
9 114 13.96 3.74 -3.74 17.70 10.22
10 128 14.44 3.74 -3.74 18.18 10.70
11 142 14.90 3.74 -3.74 18.64 11.16
Leeward All Floors
-9.31 3.74 -3.74 -5.57 -13.05
Side Walls All Floors
-13.04 3.74 -3.74 -9.30 -16.78
Roof
0-57 -16.76 3.74 -3.74 -13.02 -20.50
57-144 -16.76 3.74 -3.74 -13.02 -20.50
144-228 -9.31 3.74 -3.74 -5.57 -13.05
>228 -5.59 3.74 -3.74 -1.85 -9.33

Technical Report 3 – 11.16.2011
21 The University Sciences Building Chris Dunlay
Figure 22. Tabulations of East-West Wind Story Forces on Building 1
Figure 23. E-W Wind pressure and force diagrams
Wind Forces E-W Direction
Level Elevation
(ft) Floor
Height(ft) Base (ft)
Wind Pressure
(psf)
Resultant Force (k)
Story Shear
(k)
Overturning Moment
(ft-k)
1 0 0 228 7.76 8.9 379.4 0.00
2 10 10 228 7.76 22.1 370.6 1,358.95
3 25 15 228 8.99 34.8 348.5 1,757.22
4 34 19 228 10.62 40.0 313.6 2,377.57
5 48 14 228 11.47 36.6 273.7 3,544.71
6 62 14 228 12.01 38.3 237.0 4,304.37
7 86 14 228 12.91 41.2 198.7 5,080.46
8 100 14 228 13.48 43.0 157.5 5,899.15
9 114 14 228 13.96 44.6 114.4 2,782.58
10 128 14 228 14.44 46.1 69.9 5,899.15
11 117 14 228 14.90 23.8 23.8 2,782.58
Total Base Shear 379.4 N/A
Total Over Turing Moment N/A 27,105.01
14.90 psf
14.44 psf
13.96 psf
13.48 psf
12.91 psf
12.01 psf
11.47 psf
10.62 psf
8.99 psf
7.76 psf
7.76 psf
14.90 psf 14.90 psf
23.8 psf
46.1 psf
44.6 psf
43.0 psf
41.2 psf
38.3 psf
36.6 psf
40.0 psf
34.8 psf
22.1 psf
8.9 psf
4.4 psf
379.4 k
27,105 k
E-W Story
Forces
E-W Story
Pressures
-13.9 psf

Technical Report 3 – 11.16.2011
22 The University Sciences Building Chris Dunlay
Figure 23. Seismic Design Criterion
The seismic loads calculated in Technical Report 1 comply with the
Equivalent Lateral Force Procedure in Chapters 11 and 12 from
ASCE 7-05. Similar to the wind calculations, assumptions were
made to generate proper calculations without modeling the building
in structural software. Seismic loads are dependent on the building
weight, which is more accurate, whereas wind assumptions are
based on the dependency of the footprint and surface areas.
Therefore, the seismic calculations represent a more accurate
depiction of the actual structure. The structural drawings provide
design criteria for this structure which can be found in Figure 23.
The intent of these calculations was to compare base shears of
Building 1 and Building 2 from the structural drawings with those
calculated. All provided criteria was noted and found to be
adequate in accordance with ASCE 7-05. The only discrepancy was
the Seismic Response Coefficient, Cs. The drawings provide this value as 0.0265. Under the code, the
calculated value of Cs was found to be 0.0256, which will be used to calculate the base shear in this technical
report and those to follow. The approximate building period and frequency were calculated to gain an
understanding of buildings characteristics.
The concept of how seismic loads impact a building structure is vital to the understanding of how to employ
lateral force resisting systems. The weight of the building is a direct correlation of what the building experiences
during seismic activity. The weight of each floor is transferred into lateral structural elements which form into the
foundations. All structural components in the ground (below grade) are assumed to be rigid with the ground
itself, resulting with only the weight above grade impacting base shear (refer to the Building Weights section for
representative building weights). It is to be noted that level 3 of building 1 has 50% of its floor weight below
grade which means 50% of level 3’s building weight was considered for the total weight of the building above
grade. This is the same logic noted in Wind for the East-West direction The following diagrams summarize the
seismic calculations.
General Seismic Information
Site Class D
Importance Factor (Ie) 1.25
Short Spectral Response Acceleration 0.128
1 Sec Spectral Response Acceleration 0.06
Site Coefficient (Fa) 1.2
Site Coefficient (Fv) 1.7
Response Modification Coefficient 5
Long Period (seconds) 12
Modified Short S.R.A - SMS 0.1536
Modified 1 Sec S.R.A. - SM1 0.1020
Design Short S.R.A. - SDS 0.1024
Design 1 Sec S.R.A. - SD1 0.0680
Seismic Design Category B

Technical Report 3 – 11.16.2011
23 The University Sciences Building Chris Dunlay
Distribution of Seismic Forces
Level H (ft) Elevation (ft) Weight (k) whk Cvx fi (k) Vi (k) Overturning
Moment (ft-k)
3 19 19 33,676 794,443 .057 35 610 662
4 14 33 20,938 893,429 .064 39 575 1,292
5 14 47 22,539 1,405,826 .101 62 536 2,896
6 14 61 27,633 2,280,235 .164 100 474 6,097
7 14 75 21,018 2,171,239 .156 95 374 7,138
8 14 89 25,697 3,180,919 .229 139 279 12,409
9 14 103 21,970 3,181,345 .229 139 139 14,363
Total Story Forces (Base Shear, V=CsW) 610 N/A N/A
Total Overturning Moment 44,857
NOTE: Seismic loading controls on base shear and overturning moment.
139 k
139 k
95 k
100 k
62 k
39 k
35 k
610 k
44,857 ft-k
Building 1
Seismic Story
Forces
Figure 24. Table of Distributed Floor Seismic Forces
Figure 25. Seismic Force Distribution Loading Diagram

Technical Report 3 – 11.16.2011
24 The University Sciences Building Chris Dunlay
Lateral Load Distribution
The lateral loads are resisted by the combination of the steel braced frames and shear walls. The shear walls
are more commonly found in the lower levels and the braced frames rise through the height of the building. In
this report, the floor diaphragms were modeled as rigid diaphragms in ETABS. The lateral loads are transferred
through the façade to the floor systems and then to the lateral system. These systems will ultimately take the
loads to the foundation of the building. In the
interest of this providing an accurate technical
report with respect to the complexity of the
building, the braced frames of interest in this
section are the ones highlighted below. From
these frames the stiffness’ are found from
applying a 100 kip load at the top of each frame.
After compiling that information, a ratio of each
stiffness to the total stiffness is found to define a
relative stiffness of each frame. This again was
accomplished by applying a 100 kip load to the
top of each frame. ETABS generated the
following relative stiffness’s (Figure 26)
Braced Frame Stiffness
Frame Displacement K
(k/in) Relative Stiffness K
BF6 1.513373 66.08 18.69
BF7 0.959372 104.23 29.49
BF8 2.109039 47.41 13.41
BF9 6.204556 16.12 4.56
BF10 2.185491 45.76 12.94
BF11 3.801471 26.31 7.44
BF12 4.786888 20.89 5.91
BF13 3.744502 26.71 7.55
Figure 26. Table of relative stiffness of highlighted
braced frames

Technical Report 3 – 11.16.2011
25 The University Sciences Building Chris Dunlay
Of these eight braced frames, hand calculations, supplemented with excel spreadsheet calculations
were performed to determine the distribution of the lateral loads in the particular frames. These
calculations included wind loads in both the North-South and East-West directions and likewise with
seismic loads. Direct and torsional shear were calculated under these conditions which yielded a total
shear for each braced frame. The torsional shear was calculated per the eccentricity generated
between the offset of the center of mass and rigidity with respect to the loading direction. For
simplicity and conservation, the eccentricity was calculated at the 8th level, of which all of the brace
frames exist. Furthermore, as explained earlier, only these eight braced frames were evaluated for
because they were either normal or parallel to the loading directions, the others were at odd angles
and not evaluated in this report. These calculations can be found below, as well in the Appendix C.
E-W Wind Load Distribution to Braced Frames
Frame K (k/in) Total Lateral
Load e (ft) d (ft) k*d^2 Direct Shear (k) Torsional Shear (k) Total Shear (k)
BF6 66.08 379.4 1.921 11.214 8309.811 0 1.12 1.12
BF7 104.23 379.4 1.921 37.9432 150058.5 0 6.09 6.09
BF8 47.41 379.4 1.921 51.6307 126382.2 114.65 3.70 118.35
BF9 16.12 379.4 1.921 23.714 9065.143 38.98 0.58 39.56
BF10 45.76 379.4 1.921 46.938 100817.3 110.66 3.25 113.91
BF11 26.31 379.4 1.921 37.9432 37878.15 0 1.51 1.51
BF12 20.89 379.4 1.921 23.714 11747.57 50.52 0.75 51.27
BF13 26.71 379.4 1.921 -37.536 37633.09 64.59 -1.52 63.08
N-S Wind Load Distribution to Braced Frames
Frame K (k/in) Total Lateral
Load e (ft) d (ft) k*d^2 Direct Shear (k) Torsional Shear (k) Total Shear (k)
BF6 66.08 321.6 15.611 3.095 632.982 108.08 4.27 112.35
BF7 104.23 321.6 15.611 21.3242 47395.62 170.48 46.42 216.91
BF8 47.41 321.6 15.611 35.012 58117.08 0 34.67 34.67
BF9 16.12 321.6 15.611 7.095 811.4651 0 2.39 2.39
BF10 45.76 321.6 15.611 30.319 42064.5 0 28.98 28.98
BF11 26.31 321.6 15.611 21.3242 11963.72 43.03 11.72 54.75
BF12 20.89 321.6 15.611 7.095 1051.582 0 3.10 3.10
BF13 26.71 321.6 15.611 -54.155 78334.13 0 -30.21 -30.21

Technical Report 3 – 11.16.2011
26 The University Sciences Building Chris Dunlay
E-W Wind Load Distribution to Braced Frames
Frame K (k/in) Total Lateral
Load e (ft) d (ft) k*d^2 Direct Shear (k) Torsional Shear (k) Total Shear (k)
BF6 66.08 610 1.921 11.214 8309.811 0 1.80 1.80
BF7 104.23 610 1.921 37.9432 150058.5 0 9.79 9.79
BF8 47.41 610 1.921 51.6307 126382.2 184.33 5.95 190.29
BF9 16.12 610 1.921 23.714 9065.143 62.68 0.93 63.61
BF10 45.76 610 1.921 46.938 100817.3 177.92 5.22 183.14
BF11 26.31 610 1.921 37.9432 37878.15 0 2.43 2.43
BF12 20.89 610 1.921 23.714 11747.57 81.22 1.20 82.43
BF13 26.71 610 1.921 -37.536 37633.09 103.85 -2.44 101.41
N-S Wind Load Distribution to Braced Frames
Frame K (k/in) Total Lateral
Load e (ft) d (ft) k*d^2 Direct Shear (k) Torsional Shear (k) Total Shear (k)
BF6 66.08 610 15.611 3.095 632.982 205.01 8.10 213.11
BF7 104.23 610 15.611 21.3242 47395.62 323.37 88.05 411.42
BF8 47.41 610 15.611 35.012 58117.08 0 65.76 65.76
BF9 16.12 610 15.611 7.095 811.4651 0 4.53 4.53
BF10 45.76 610 15.611 30.319 42064.5 0 54.96 54.96
BF11 26.31 610 15.611 21.3242 11963.72 81.62 22.23 103.85
BF12 20.89 610 15.611 7.095 1051.582 0 5.87 5.87
BF13 26.71 610 15.611 -54.155 78334.13 0 -57.30 -57.30
Figure 27: Wind and seismic distribution to 8 braced frames

Technical Report 3 – 11.16.2011
27 The University Sciences Building Chris Dunlay
ETABS Computer Model
As previously stated, due to the complexity of the building, the scope and time table of the report, only
building 1 was modeled in ETABS. This is a feasible action because the connection of the two buildings is not
adequate to distribute loads between buildings. Building 1 includes 11 braced frames, 3 multistory (4+ stories)
shear walls and other foundation shear walls in the basement, all of which were assigned material properties
specific to the project. The braced frames were modeled as line elements that per AISC edition 13. The braced
frames included wide flange columns and beams and HHS tubes for diagonal bracing. The 4500 psi f’c shear
walls were modeled as shell elements and meshed into areas of 24”x24”. All concrete walls were assigned a
rigid end offset of 0.5 to ensure a rigid connection among members. Diaphragms were also modeled as rigid
members with assigned mass to account for its weight. The following figures represent the ETABS Model.
Figure 28: 3D ETABS Model showing braced frames and shear walls

Technical Report 3 – 11.16.2011
28 The University Sciences Building Chris Dunlay
N
N
Figure 29: Top: 3D ETABS model with diaphragms
Bottom: Level 3 and Level 7 floor plans

Technical Report 3 – 11.16.2011
29 The University Sciences Building Chris Dunlay
Load Combinations
ASCE 7-05 section 2.3 designates load combinations per strength design, which were considered for this
report. The combinations include both lateral and gravity loads. These loads were imported into ETABS and
evaluated per the displacement and forces of particular members. It is important to note that different load
cases govern depending on which member was analyzed. Therefore, the worst case scenario for deflections
and displacement was used in evaluating member forces and displacements. The following are the
combinations defined by ASCE 7-05.
The following charts display the displacement and story drifts for wind and seismic in both the North-South
and East-West directions.
E-W Wind Displacements and Story Drifts
Level Displacement (in) Allowable Displacement
(in) Ok?
Roof 1.066 3.9 Yes
9 0.89 3.48 Yes
8 0.748 3.06 Yes
7 0.541 2.64 Yes
6 0.319 2.22 Yes
5 0.155 1.8 Yes
4 0.073 1.38 Yes
3 0.0015 0.75 Yes
2' 0.0006 0.45 Yes
2 0.0003 0.3 Yes
Figure 30: Wind and seismic displacements and story drifts

Technical Report 3 – 11.16.2011
30 The University Sciences Building Chris Dunlay
N-S Wind Displacements and Story Drifts
Level Displacement (in) Allowable Displacement
(in) Ok?
Roof 0.374 3.9 Yes
9 0.323 3.48 Yes
8 0.271 3.06 Yes
7 0.215 2.64 Yes
6 0.158 2.22 Yes
5 0.115 1.8 Yes
4 0.0618 1.38 Yes
3 0.0026 0.75 Yes
2' 0.0008 0.45 Yes
2 0.0004 0.3 Yes
E-W Seismic Displacements and Story Drifts
Level Displacement (in) Story Drift (in) Allowable
Displacement (in) Ok?
Roof 2.3447 0.2261 3.9 Yes
9 2.1186 0.2998 3.48 Yes
8 1.8189 0.2655 3.06 Yes
7 1.5534 0.3865 2.64 Yes
6 1.1668 0.2812 2.22 Yes
5 0.8856 0.3126 1.8 Yes
4 0.5730 0.3864 1.38 Yes
3 0.1866 0.1123 0.75 Yes
2' 0.0743 0.0536 0.45 Yes
2 0.0208 0.0208 0.3 Yes
N-S Seismic Displacements and Story Drifts
Level Displacement (in) Story Drift (in) Allowable
Displacement (in) Ok?
Roof 1.73 0.09 3.9 Yes
9 1.64 0.22 3.48 Yes
8 1.42 0.28 3.06 Yes
7 1.15 0.35 2.64 Yes
6 0.80 0.11 2.22 Yes
5 0.69 0.34 1.8 Yes
4 0.34 0.24 1.38 Yes
3 0.10 0.06 0.75 Yes
2' 0.04 0.03 0.45 Yes
2 0.01 0.01 0.3 Yes

Technical Report 3 – 11.16.2011
31 The University Sciences Building Chris Dunlay
Building Torsion
Due to the resulting difference in locations of the center of the mass and the center of rigidity, the lateral
seismic loads will act at the center of mass generating torsion with a moment arm as the eccentricity between
the center of mass and rigidity. ETABS has calculated the center of mass and center of rigidity for each floor
allowing for accurate calculations of the building’s torsion. Furthermore, the building has been modeled with
the applied seismic loads accounting for 5% accidental torsion that may occur in the building. These
calculations are important to keep in mind while considering a redesign, in that a slight variation can change
the torsion the building experiences. The following calculations show the building torsion from both inherent
and accidental torsion in the North-South and East-West directions.
Building Torsion E-W Direction - Seismic Loading
Level Story Force (k) COR COM ex (ft) Mt (ft-k) Ma (ft-k) Mtotal (ft-k)
Roof 139 105.396 87.283 18.11 2517.707 1584.6 4102.307
9 139 103.793 109.275 5.48 761.998 1584.6 2346.598
8 95 100.786 102.707 1.92 182.495 1083 1265.495
7 100 95.562 105.519 9.96 995.7 1140 2135.7
6 62 86.193 102.046 15.85 982.886 706.8 1689.686
5 39 99.116 109.6 10.48 408.876 444.6 853.476
4 35 101.924 109.6 7.68 268.66 399 667.66
3
Below Grade 2
2'
Total 13060.92
Building Torsion N-S Direction - Seismic Loading
Level Story Force (k) COR COM ex (ft) Mt (ft-k) Ma (ft-k) Mtotal (ft-k)
Roof 139 116.196 109 7.20 1000.244 1390 2390.244
9 139 116.751 103.286 13.47 1871.635 1390 3261.635
8 95 117.405 101.794 15.61 1483.045 950 2433.045
7 100 119.626 109.629 10.00 999.7 1000 1999.7
6 62 123.908 108.168 15.74 975.88 620 1595.88
5 39 116.499 102.798 13.70 534.339 390 924.339
4 35 111.995 102.798 9.20 321.895 350 671.895
3
Below Grade 2
2'
Total 13276.74
Figure 31: Building Torsion charts.

Technical Report 3 – 11.16.2011
32 The University Sciences Building Chris Dunlay
Member Checks
Three individual member calculation checks were performed to verify that the members are adequate for the
gravity and lateral loads. The loads of each particular member were obtained from the ETABS model. Each
member had a different load case that gave it is worst case scenario. The three members considered were a
HSS diagonal brace, a wide flange column, and a concrete column (verified in spColumn). The following
diagrams show these members.
Figure 32: Highlight members of braced frames that are checked for adequacy

Technical Report 3 – 11.16.2011
33 The University Sciences Building Chris Dunlay
Figure 33: spColumn output for the concrete column

Technical Report 3 – 11.16.2011
34 The University Sciences Building Chris Dunlay
Conclusion
Technical Report 3 was a thorough investigation into the lateral system of the University Sciences
Building (USB). Upon the analysis of multiple elements of this system, it has been determined that
the lateral system is adequate to carry the lateral loads it is likely to experience. This can be
concluded from the combination of an elaborate ETABS computer model and supplemental hand
calculations to verify the models accuracy. The wind forces were calculated using the Main Wind
Force Resisting System method from ASCE 7-05. Similarly, the seismic forces were calculated by
Equivalent Lateral Force method. It has been determined that seismic loads will control by nearly
38% over wind but both wind and seismic were both considered in the lateral system to produce the
worst case loading scenario.
Due to the complexity of the building and the scope of this technical report, only one building was
model. This was determined feasible as the connection of the two buildings is not adequate to
transfer loads. The modeled consisted to line elements representing columns, beams and bracing. In
addition, area meshes were utilized to represent shear walls accurately. Rigid diaphragms were also
inserted to represent the floor systems and to induce mass into the system. After implementing
multiple load combinations, the system was found to adequately carry the loads. Furthermore, hand
calculations were performed and verified the models output.
Eight individual brace frames were analyzed to determine their relative stiffness. This was then used
to help determine how much each frame received direct, torsional shear, and total shear. In addition,
story displacements and drifts were calculated with respect to the controlling load cases.
Finally three individual members of the lateral system were checked through hand calculations to
verify their adequacy. These members included a HHS diagonal bracing member, a wide flange
column, and a concrete column. All three members were found to be more than adequate to carry the
appropriate loads.
Technical Report 3 has valuable information about the University Sciences Building that will be useful
in writing a proposal for the redesign process.

Technical Report 3 – 11.16.2011
35 The University Sciences Building Chris Dunlay
Appendix

Technical Report 3 – 11.16.2011
36 The University Sciences Building Chris Dunlay

Technical Report 3 – 11.16.2011
37 The University Sciences Building Chris Dunlay

Technical Report 3 – 11.16.2011
38 The University Sciences Building Chris Dunlay

Technical Report 3 – 11.16.2011
39 The University Sciences Building Chris Dunlay

Technical Report 3 – 11.16.2011
40 The University Sciences Building Chris Dunlay

Technical Report 3 – 11.16.2011
41 The University Sciences Building Chris Dunlay

Technical Report 3 – 11.16.2011
42 The University Sciences Building Chris Dunlay

Technical Report 3 – 11.16.2011
43 The University Sciences Building Chris Dunlay

Technical Report 3 – 11.16.2011
44 The University Sciences Building Chris Dunlay

Technical Report 3 – 11.16.2011
45 The University Sciences Building Chris Dunlay
Level 1 Foundation Plan

Technical Report 3 – 11.16.2011
46 The University Sciences Building Chris Dunlay
Level 3

Technical Report 3 – 11.16.2011
47 The University Sciences Building Chris Dunlay
Level 4

Technical Report 3 – 11.16.2011
48 The University Sciences Building Chris Dunlay
Level 5

Technical Report 3 – 11.16.2011
49 The University Sciences Building Chris Dunlay
Level 6

Technical Report 3 – 11.16.2011
50 The University Sciences Building Chris Dunlay
Level 7

Technical Report 3 – 11.16.2011
51 The University Sciences Building Chris Dunlay
Level 8

Technical Report 3 – 11.16.2011
52 The University Sciences Building Chris Dunlay
Level 9