the university of oklahoma - amazon s3s3.amazonaws.com/zanran_storage/ · the university of...
TRANSCRIPT

The University of Oklahoma
COLLEGE OF CONTINUING EDUCATION
Center for Business and Economic Development, McCarter Hall, Room 600, 1610 Asp Avenue
Norman, Oklahoma 73072-6405 Phone: (405) 325-7331 FAX : (405) 325-7329
HOUSING MARKET ANALYSIS REAL ESTATE CONSULTATION Rogers County Market Analysis Rogers County, Oklahoma Effective Analysis: September 6, 2001 Date of Report: September 30, 2001
Prepared For: Oklahoma Housing Finance Agency Oklahoma Department of Commerce 100 N.W. 63rd, Suite 200 Oklahoma City, Oklahoma 73116
Prepared By: The University of Oklahoma Center for Business and Economic Development 1610 Asp Avenue, Suite 600 Norman, Oklahoma 73072 - 6405 Francine Gissy, Contract Manager In consultation with: Mr. Owen S. Ard, MAI INTEGRA REALTY RESOURCES 6940 South Utica Avenue, Suite 100 Tulsa, Oklahoma 74136
The attached Rogers County Residential Housing Market Analysis is part of a Statewide Affordable Housing Market Study and was financed in whole or in part by funds from the U.S. Department of Housing and Urban Development as administered by the Oklahoma Department of Commerce.
The University of Oklahoma
COLLEGE OF CONTINUING EDUCATION
Center for Business and Economic Development, McCarter Hall, Room 600, 1610 Asp Avenue
Norman, Oklahoma 73072-6405 Phone: (405) 325-7331 FAX : (405) 325-7329
September 30, 2001 Mr. Dennis Shockley, Executive Director Oklahoma Housing Finance Agency 100 NW 63rd, Suite 200 P.O. Box 26720 Oklahoma City, Oklahoma 73126-0720 RE: Housing Market Analysis Rogers County Residential Housing Market Analysis Dear Mr. Shockley: As per our Agreement with Oklahoma Housing Finance Agency (OHFA), we have completed a Statewide (77 counties) residential housing market analysis (the “Analysis”) for use by OHFA and the Oklahoma Department of Commerce (ODOC). Per our Agreement, OHFA and ODOC shall have unrestricted authority to publish, disclose, distribute and otherwise use, in whole or in part, the study and reports, data or other materials included in the Analysis or otherwise prepared pursuant to the Agreement and no materials produced in whole, or in part, under the Agreement shall be subject to copyright in the United States or any other country. The University of Oklahoma Center for Business and Economic Development (the “Center”) will cause the Analysis (or any part thereof) and any other publications or materials produced as a result of the Agreement with the assistance of the Center to include substantially the following statement on the first page of said document:
This “Statewide Affordable Housing Market Study” was financed in whole or in part by funds from the U.S. Department of Housing and Urban Development as administered by the Oklahoma Department of Commerce.
Attached hereto, please find the Rogers County Residential Housing Market Analysis (the “Rogers County Market Analysis”). The Rogers County area was inspected in September, 2001 in order to collect the data used in the preparation of the Rogers County Market Analysis. Mr. Owen S. Ard, MAI with Integra Realty Resources provided consultation, assemblage and analysis of the data for the Center and prepared the final Rogers County Market Analysis and conclusions.
The Rogers County Market Analysis describes the methods and data used in the investigation, analysis and conclusions contained therein. The Rogers County Market Analysis is written to comply with the Uniform Standards of Professional Appraisal Practice of the Appraisal Foundation.

The summary report is intended to comply with the reporting requirements set forth under Standards Rule 5 of the Uniform Standards of Professional Appraisal Practice. This standard rule defines procedures and principles of developing a real estate consultation. Conditions pertinent to or indicative of the market were investigated. Please note the Contingent and Limiting Conditions.
If you have any questions regarding this analysis or require additional information or services please contact our office. Respectfully submitted, Francine Gissy Contract Manager The University of Oklahoma Center for Business and Economic Development

HOUSING MARKET ANALYSIS REAL ESTATE CONSULTATION Rogers County Market Analysis Rogers County, Oklahoma Effective Analysis: September 6, 2001 Date of Report: September 30, 2001 INTEGRA Report Number: M0701125 Prepared For The University of Oklahoma Center for Business and Economic Development 1610 Asp Avenue, Suite 600 Norman, Oklahoma 73072 - 6405 Prepared By Mr. Owen S. Ard, MAI INTEGRA REALTY RESOURCES 6940 South Utica Avenue, Suite 100
6940 South Utica Avenue, Suite 100, Tulsa, Oklahoma 74136 Phone: 918/492-4844; Fax: 918/493-7155;
Web Sites: www.gla-inc.com or www.irr.com - Email: [email protected] or [email protected]
September 30, 2001 Ms. Francine Gissy The University of Oklahoma Center for Business and Economic Development 1610 Asp Avenue, Suite 600 Norman, Oklahoma 73072 - 6405 RE: Housing Market Analysis Rogers County Residential Housing Market Analysis Dear Ms. Gissy: At your request, I have completed a residential housing market analysis regarding Rogers County, Oklahoma. The attached report describes the methods and gives the pertinent data used in the investigation, analysis, and conclusions. This report is prepared for The University of Oklahoma Center for Business and Economic Development, and is written to comply with the Uniform Standards of Professional Appraisal Practice of the Appraisal Foundation. This summary report is intended to comply with the reporting requirements set forth under Standards Rule 5 of the Uniform Standards of Professional Appraisal Practice. This standard rule defines procedures and principles of developing a real estate consultation. The Rogers County area was personally inspected during the month of September 2001. Conditions pertinent to or indicative of the market were investigated. Please note the Contingent and Limiting Conditions. If you have any questions regarding this analysis or require additional services please contact our office.
Respectfully submitted, INTEGRA REALTY RESOURCES ______________________________ Owen S. Ard, MAI Oklahoma Certificate #11245

PART I: PREFACE
Page 1
TABLE OF CONTENTS
Letter of Transmittal PART I: PREFACE
Table of Contents .............................................................................. 1 Executive Summary .......................................................................... 2 Contingent and Limiting Conditions................................................. 4 Effective Date of Consultation.......................................................... 6 Purpose of the Analysis..................................................................... 6 Scope of the Assignment................................................................... 6
PART II: PROPERTY CHARACTERISTICS
Rogers County Analysis.................................................................... 8 Rogers County Map Claremore Map Catoosa Map Housing Supply Characteristics ...................................................... 22 Claremore Single Family Sales Activity......................................... 24 Claremore Rental Data.................................................................... 27 Claremore Infill Lot Inventory........................................................ 29 Claremore Substandard Housing..................................................... 29 Catoosa Single Family Sales Activity............................................. 29 Catoosa Rental Data........................................................................ 32 Catoosa Infill Lot Inventory............................................................ 33 Catoosa Substandard Housing......................................................... 33 Anticipated Future Demand ............................................................ 33 Summary and Conclusions.............................................................. 36 Certification..................................................................................... 39
PART III: ADDENDA
Engagement Letter Analyst Qualifications
Owen S. Ard, MAI

Page 2
EXECUTIVE SUMMARY Investment Opportunities: Anticipated need of 2,200 new owner units and 513
new rental units in the county over the next 5 years. Most need in Claremore and Catoosa areas. Single family housing demand greatest below $80,000 in city of Claremore and rural areas.
Consultation Area: Rogers County, Oklahoma General Location: Northeastern Oklahoma bordering the northeast side
of Tulsa. Current Economic Conditions: Rogers County has significant growth occurring in the
central area surrounding Claremore and southwestern areas close to Tulsa. The remainder of the county includes high growth areas around eastern Owasso and in Chelsea. Most other areas have stable growth patterns. Economic factors driving growth are access to Tulsa, inexpensive development land, and growing employment opportunities in the area.
Population Indications: Rogers County population has grown at a rate of
approximately 2.8% annually since 1990. Catoosa, Chelsea, and Inola have had high growth rates while Oologah has grown moderately. Approximately 37% of the county population lives in a city or town. Much of the remainder of the population is located around Claremore or in sporadic developments in the western portions of the county close to Owasso.
Income Levels: Median 2001 Household income in Rogers County is
$42,599. Income is anticipated to increase approximately 2.0 % per year over the next 5 years.
Single Family Development: New single family development has occurred in the
county for several years. Most development has occurred in and around Claremore and Catoosa.
Rental Market: Sporadic new rental development has occurred in the
county during the past several years. This has included market rate and affordable housing developments in Claremore and Chelsea. Rental rates have increased moderately and occupancy levels are consistently well above 95%. However, additional rental housing is needed in all population centers of the county.
Page 3
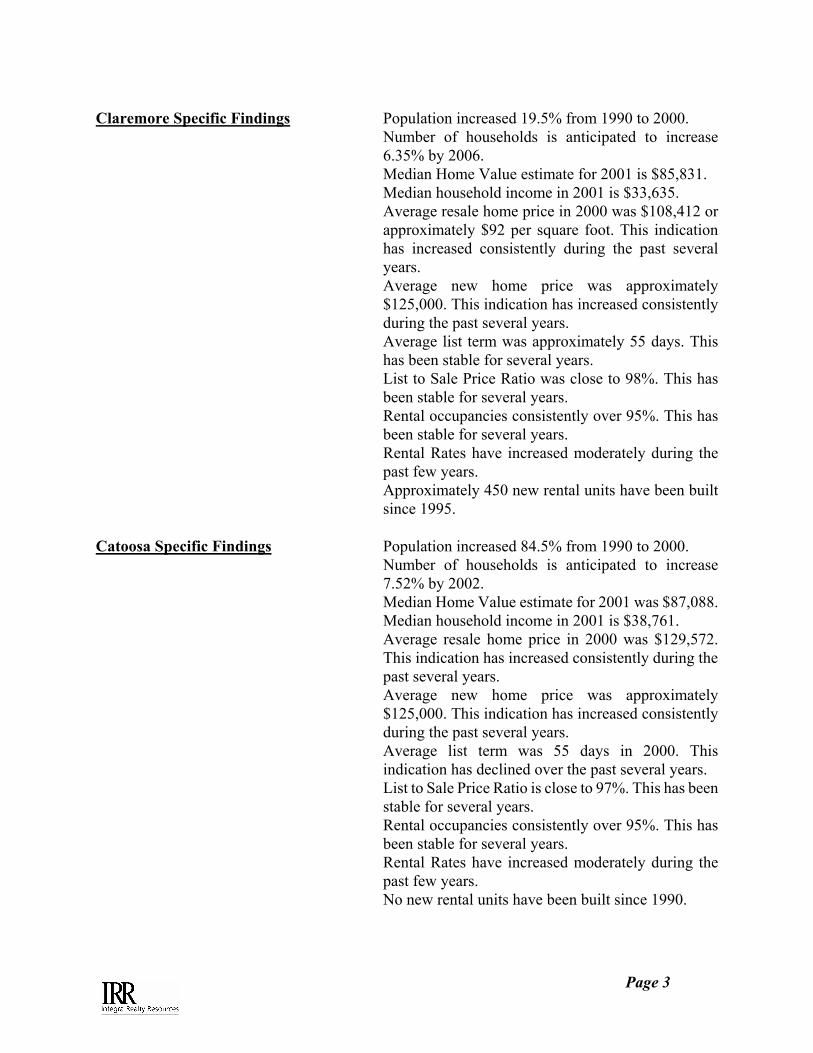
Claremore Specific Findings Population increased 19.5% from 1990 to 2000.
Number of households is anticipated to increase 6.35% by 2006.
Median Home Value estimate for 2001 is $85,831. Median household income in 2001 is $33,635. Average resale home price in 2000 was $108,412 or
approximately $92 per square foot. This indication has increased consistently during the past several years.
Average new home price was approximately $125,000. This indication has increased consistently during the past several years.
Average list term was approximately 55 days. This has been stable for several years.
List to Sale Price Ratio was close to 98%. This has been stable for several years.
Rental occupancies consistently over 95%. This has been stable for several years.
Rental Rates have increased moderately during the past few years.
Approximately 450 new rental units have been built since 1995.
Catoosa Specific Findings Population increased 84.5% from 1990 to 2000. Number of households is anticipated to increase
7.52% by 2002. Median Home Value estimate for 2001 was $87,088. Median household income in 2001 is $38,761. Average resale home price in 2000 was $129,572.
This indication has increased consistently during the past several years.
Average new home price was approximately $125,000. This indication has increased consistently during the past several years.
Average list term was 55 days in 2000. This indication has declined over the past several years.
List to Sale Price Ratio is close to 97%. This has been stable for several years.
Rental occupancies consistently over 95%. This has been stable for several years.
Rental Rates have increased moderately during the past few years.
No new rental units have been built since 1990.
Page 4
CONTINGENT AND LIMITING CONDITIONS The conduct of any consultation is guided and its results influenced by the terms of the assignment and the assumptions, which together form the basis of the study. The following conditions and assumptions, together with lesser assumptions embodied in the report, constitute the framework of the analysis and conclusions.
1. This report expresses the opinion of the analyst as to the conclusions of the stated issues as of the date of the report. The conclusions are in no way contingent upon the reporting of a specific finding, nor were any other limitations imposed by the client.
2. The various sketches and exhibits included in this analysis are placed herein to assist the reader in visualizing the property under analysis. These drawings are not based on actual surveys and no responsibility is assumed for their cartographic accuracy.
3. Possession of this report does not carry the right of publication, duplication, or reproduction of it, or any part of it, nor may it be used by anyone other than the party for whom it is made without prior consent of the analyst. The report can only be considered true and valid with the original signature of the analyst and the seal affixed to the letter of transmittal. This report has been prepared for the benefit of the University of Oklahoma, Center for Business and Economic Development (the “Center”). However, the preparer understands that this report will be included in a Statewide Affordable Housing Market Study prepared by the Center for Oklahoma Housing Finance Agency (“OHFA”) and was financed in whole or in part by funds from the U.S. Department of Housing and Urban Development as administered by the Oklahoma Department of Commerce and specifically agrees to the inclusion of this report therein. It may not be used or relied upon by any other party. Any party who uses or relies upon any information in this report, without the preparer's written consent, does so at his own risk.
4. This analysis is based upon present conditions of the national and local economics, the present purchasing power of the dollar, and present financing rates and terms as of the date of this analysis.
5. The information, documentation, and market data reported in this analysis is believed to be reliable, but no responsibility is assumed for accuracy as much of it was furnished by others and assembled by the analyst. Wherever possible, the information was checked, verified or confirmed by the appropriate available means.
6. This analysis must be used in whole and not in part. The distribution of sections or pieces of the report may be misleading. No part of this analysis shall be used in

Page 5
conjunction with any other analysis, and all opinions expressed herein are invalid if so used.
7. The analyst will not be required to give testimony or attendance in court or before other legal authority by reason of this analysis without agreement and arrangement between the Center and the analyst.
8. Disclosure of the contents of this report is governed by the By-Laws and Regulations of the Analysis Institute.
9. Neither all nor any part of the contents of this, the identity of the analyst or the firm with which he is connected, or any reference to the Analysis Institute or the MAI designation, shall be disseminated to the public through advertising media, public relations media, news media, sales media, prospectus for securities, or any other public means of communication without prior written consent and approval of the undersigned.
10. This report was prepared by INTEGRA Realty Resources - Tulsa and consists of trade secrets and commercial or financial information, which is privileged and confidential and exempted from disclosure under 5 U.S.C. 552 (b) (4).
Page 6
EFFECTIVE DATE OF CONSULTATION The Rogers County area was inspected and researched performed during June, 2001. The effective date of this analysis is September 6, 2001. PURPOSE OF THE ANALYSIS The purpose of this analysis is to define the extent and general condition of the supply and forecast the likely demand for residential housing in Rogers County, Oklahoma. SCOPE OF THE ASSIGNMENT This analysis is a complete narrative report written in compliance with the Uniform Standards of Appraisal Practice published by the Appraisal Foundation, and the Professional Ethics and Standards of the Appraisal Institute. The analyst’s adherence to these requirements involves the following. 1. The Rogers County area was inspected during June, 2001. The inspection
included visits to all significant population centers in the county and portions of the rural county areas.
2. Regional, city and neighborhood data is based on information retained from
national, state, and local government entities; various Chambers of Commerce, news publications, and other sources of economic indicators.
3. Specific economic data was collected from all available public agencies.
Population and household information was collected from national demographic data services as well as available local governments. Much data was gathered regarding market specific items from personal interviews.
4. Development of the applicable analysis involved the collection and
interpretation of verified data from local property owners/managers, realtors, and other individuals active within the area real estate market.
5. The analyst's assemblage and analysis of the defined data provided a basis
from which conclusions as to the supply of and demand for residential housing were made.
Page 7
PART II: DEMOGRAPHIC CHARACTERISTICS
Page 8
ROGERS COUNTY ANALYSIS The purpose of this section of the report is to provide a basis for analyzing and estimating trends relating to Rogers County. The primary emphasis is concentrated on those factors which are of significance to residential development users. Residential and commercial development in the community is influenced by the following factors:
1. Population and economic growth trends. 2. Existing commercial supply and activity. 3. Natural physical elements. 4. Political policy and attitudes toward community
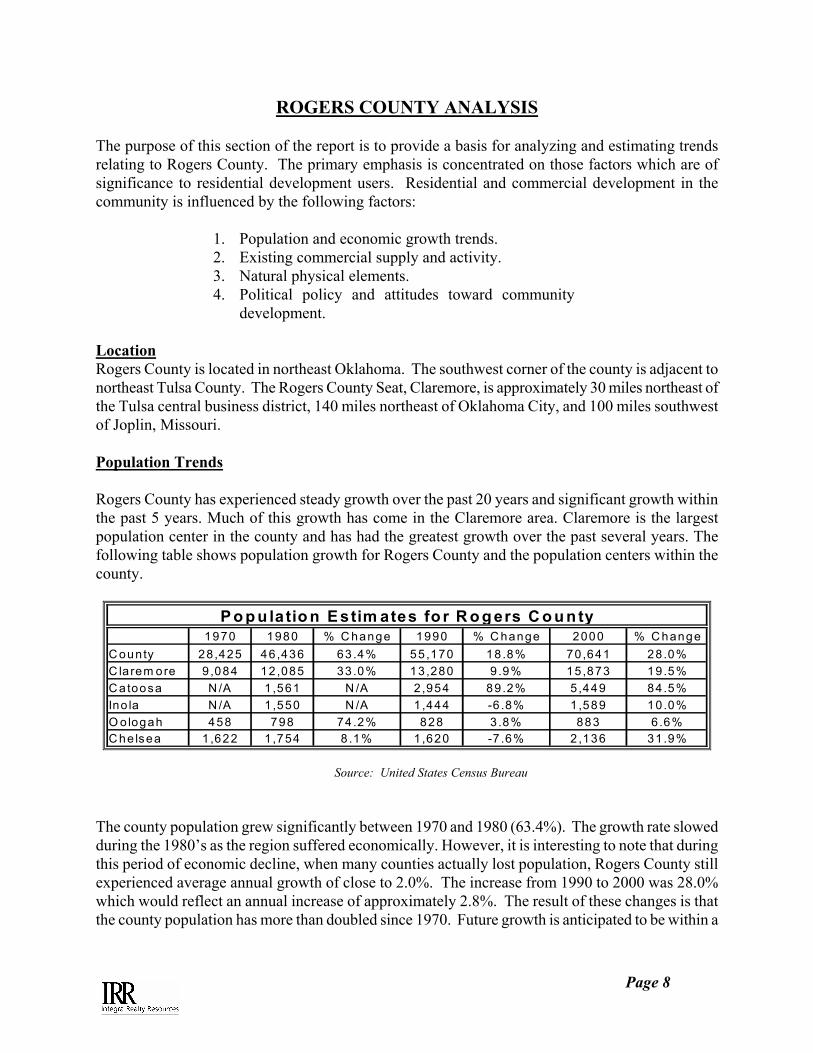
development. Location Rogers County is located in northeast Oklahoma. The southwest corner of the county is adjacent to northeast Tulsa County. The Rogers County Seat, Claremore, is approximately 30 miles northeast of the Tulsa central business district, 140 miles northeast of Oklahoma City, and 100 miles southwest of Joplin, Missouri. Population Trends Rogers County has experienced steady growth over the past 20 years and significant growth within the past 5 years. Much of this growth has come in the Claremore area. Claremore is the largest population center in the county and has had the greatest growth over the past several years. The following table shows population growth for Rogers County and the population centers within the county.
1970 1980 % C hange 1990 % C hange 2000 % C hangeC ounty 28,425 46 ,436 63 .4% 55,170 18 .8% 70,641 28.0%C larem ore 9 ,084 12 ,085 33 .0% 13,280 9 .9% 15,873 19.5%C atoosa N /A 1 ,561 N /A 2 ,954 89 .2% 5,449 84.5%Ino la N /A 1 ,550 N /A 1 ,444 -6 .8% 1,589 10.0%O ologah 458 798 74 .2% 828 3.8% 883 6.6%C he lsea 1 ,622 1 ,754 8 .1% 1,620 -7 .6% 2,136 31.9%
P o p u latio n E stim ates fo r R o g ers C o u n ty
Source: United States Census Bureau The county population grew significantly between 1970 and 1980 (63.4%). The growth rate slowed during the 1980’s as the region suffered economically. However, it is interesting to note that during this period of economic decline, when many counties actually lost population, Rogers County still experienced average annual growth of close to 2.0%. The increase from 1990 to 2000 was 28.0% which would reflect an annual increase of approximately 2.8%. The result of these changes is that the county population has more than doubled since 1970. Future growth is anticipated to be within a
Page 9
range of two to three percent annually. This is realistic based on the availability and cost benefit of developable land in the area as compared to tracts within the Tulsa metropolitan area. Claremore is the largest population center in the county. The changes in population in Claremore mirrored the county. Significant increases in the 1970’s (33.0%) with a reduced rate of increase in the 1980’s (9.9%). During the 1990’s, the city had a total population increase of 19.5% or 2.0% annually. This high rate of growth is due to a very strong local and area economy, convenience of Claremore to Tulsa, and availability and cost benefit of vacant developable land. Based on the current economic climate and comparative alternatives, a realistic future estimate of annual population growth for the City of Claremore would be the in the three to four percent range. However, significant changes in the regional economy or local governmental decisions could quickly impact future growth. The remaining county cities with populations close to or in excess of 1,000 include Chelsea, Catoosa, Oologah, and Inola. Catoosa has had explosive growth since 1970. This is likely a result of its location between Tulsa and Claremore. Chelsea and Inola had declines in population between 1980 and 1990 but have both shown moderate to good increases during the past several years. Oologah had slight gains in the 1980’s and good gains in the 1990’s. It is evident from the previous chart that the largest portion of population growth has occurred in Claremore. This trend within the county is likely to continue. Based on county and city information, the population in the remainder of the county (outside of the identified population areas) grew approximately 22% during the 1980’s and 27.6% from 1990 through 2000. This growth includes rural homes on acreages and growth in small communities of less than 1,000 persons. It is likely that a significant portion of this growth has occurred in the western portion of the county close to the city of Owasso. The largest percentage growth in population has occurred in the cities rather than in the rural areas in the 1990’s. This suggests that primary population movement in the county in the 1990’s has been into the cities with secondary movement into the rural areas. Population by Age The following tables provide a breakdown of Claremore and Catoosa population by age in 2001 with a 2006 estimate. The greatest percentage in Claremore in 2001 is in the 40-44 year band. However, the age bands are spread relatively evenly from 25 to 54 years. The median age is just over 35 in 2001. The median is not anticipated to change significantly over the next 5 years. This is a comparatively young median as compared to state and national averages. The greatest percentage in Catoosa in 2001 is also in the 40-44 year band. However, the age bands are spread relatively evenly from 25 to 54 years. The median age is just under 35 in 2001. The median is not anticipated to change significantly over the next 5 years. This is a comparatively young median as compared to state and national averages.

Page 10
Number % of Total Number % of TotalTOTAL POPULATION 15,873 100.00% 16,662 100.00% 4.97% UNDER 5 YEARS 1,156 7.28% 1,171 7.03% 1.28% 5 TO 9 YEARS 1,190 7.50% 1,214 7.29% 2.00% 10 TO 14 YEARS 1,180 7.43% 1,255 7.53% 6.38% 15 TO 17 YEARS 717 4.52% 807 4.85% 12.62% 18 TO 20 YEARS 684 4.31% 756 4.54% 10.57% 21 YEARS 208 1.31% 230 1.38% 10.35% 22 TO 24 YEARS 533 3.36% 621 3.73% 16.60% 25 TO 29 YEARS 1,102 6.94% 1,132 6.79% 2.73% 30 TO 34 YEARS 1,003 6.32% 865 5.19% -13.76% 35 TO 39 YEARS 1,189 7.49% 1,039 6.23% -12.64% 40 TO 44 YEARS 1,082 6.82% 1,114 6.69% 2.96% 45 TO 49 YEARS 944 5.95% 1,151 6.91% 21.97% 50 TO 54 YEARS 931 5.87% 1,030 6.18% 10.68% 55 TO 59 YEARS 696 4.38% 923 5.54% 32.63% 60 TO 64 YEARS 574 3.62% 747 4.48% 30.16% 65 TO 69 YEARS 651 4.10% 580 3.48% -10.88% 70 TO 74 YEARS 632 3.98% 606 3.64% -4.15% 75 TO 84 YEARS 961 6.05% 934 5.60% -2.83% 85 + YEARS 440 2.77% 472 2.83% 7.25%
Claremore City Population by Age: 2000 Census and 2005 ProjectionSource: U.S. Census Bureau and CLARITAS, Inc.
2000 Census 2005 Projection % Change 2000 to 2005
Number % of Total Number % of TotalTOTAL POPULATION 5,449 100.00% 5,793 100.00% 6.31% UNDER 5 YEARS 417 7.65% 420 7.25% 0.66% 5 TO 9 YEARS 455 8.35% 475 8.21% 4.48% 10 TO 14 YEARS 443 8.13% 466 8.04% 5.17% 15 TO 17 YEARS 301 5.52% 356 6.15% 18.41% 18 TO 20 YEARS 243 4.46% 267 4.61% 9.87% 21 YEARS 59 1.08% 66 1.14% 12.01% 22 TO 24 YEARS 161 2.95% 184 3.18% 14.47% 25 TO 29 YEARS 327 6.00% 363 6.26% 10.98% 30 TO 34 YEARS 358 6.57% 339 5.85% -5.32% 35 TO 39 YEARS 456 8.37% 341 5.88% -25.25% 40 TO 44 YEARS 462 8.48% 437 7.54% -5.48% 45 TO 49 YEARS 359 6.59% 463 8.00% 29.09% 50 TO 54 YEARS 335 6.15% 352 6.08% 5.07% 55 TO 59 YEARS 245 4.50% 364 6.28% 48.46% 60 TO 64 YEARS 210 3.85% 215 3.72% 2.55% 65 TO 69 YEARS 182 3.34% 192 3.31% 5.43% 70 TO 74 YEARS 165 3.03% 143 2.46% -13.52% 75 TO 84 YEARS 196 3.60% 269 4.65% 37.37% 85 + YEARS 75 1.38% 89 1.53% 18.53%
Catoosa City Population by Age: 2000 Census and 2005 ProjectionSource: U.S. Census Bureau and CLARITAS, Inc.
2000 Census 2005 Projection % Change 2000 to 2005
Page 11
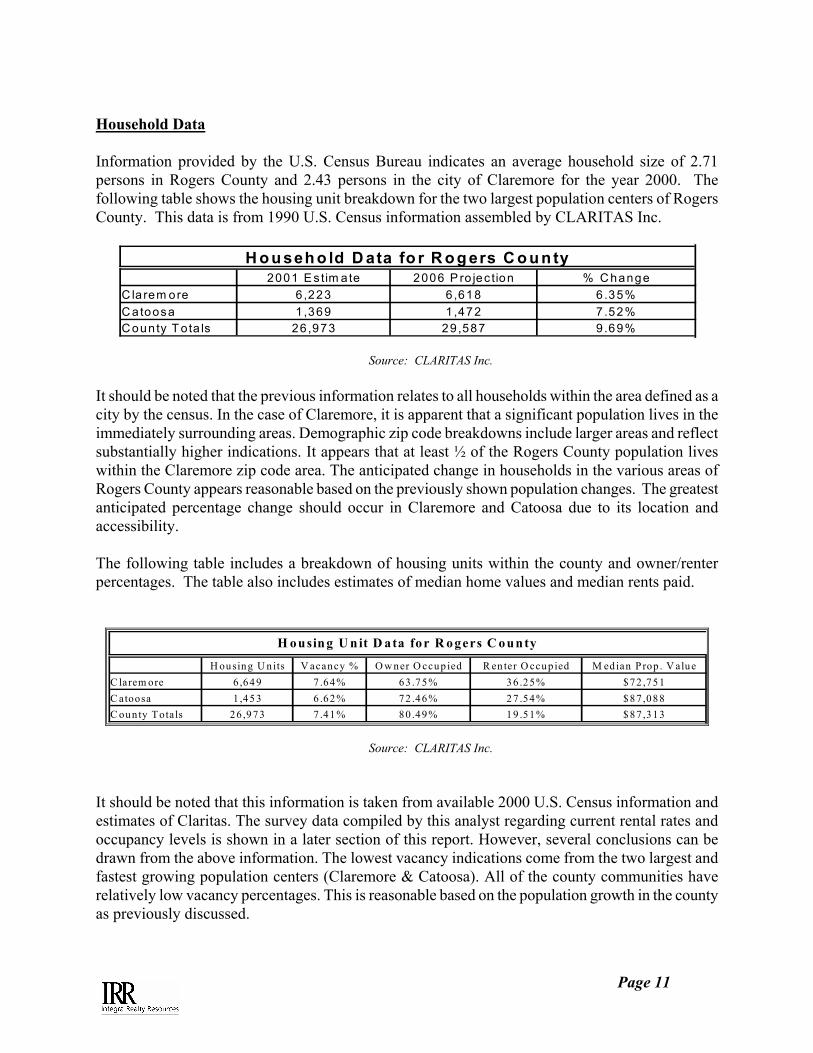
Household Data Information provided by the U.S. Census Bureau indicates an average household size of 2.71 persons in Rogers County and 2.43 persons in the city of Claremore for the year 2000. The following table shows the housing unit breakdown for the two largest population centers of Rogers County. This data is from 1990 U.S. Census information assembled by CLARITAS Inc.
2001 E s tim ate 2006 P ro jec tion % C hangeC la rem ore 6 ,223 6 ,618 6 .35%C atoosa 1 ,369 1 ,472 7 .52%C ounty T ota ls 26 ,973 29 ,587 9 .69%
H o u seh o ld D ata fo r R o g ers C o u n ty
Source: CLARITAS Inc.
It should be noted that the previous information relates to all households within the area defined as a city by the census. In the case of Claremore, it is apparent that a significant population lives in the immediately surrounding areas. Demographic zip code breakdowns include larger areas and reflect substantially higher indications. It appears that at least ½ of the Rogers County population lives within the Claremore zip code area. The anticipated change in households in the various areas of Rogers County appears reasonable based on the previously shown population changes. The greatest anticipated percentage change should occur in Claremore and Catoosa due to its location and accessibility. The following table includes a breakdown of housing units within the county and owner/renter percentages. The table also includes estimates of median home values and median rents paid.
H ousing U nits V acancy % O w ner O ccu p ied R en ter O ccup ied M edian P rop . V alueC larem ore 6 ,64 9 7 .64% 63 .75% 3 6.25% $72 ,751C atoosa 1 ,45 3 6 .62% 72 .46% 2 7.54% $87 ,088C oun ty Totals 26 ,9 73 7 .41% 80 .49% 1 9.51% $87 ,313
H ousin g U nit D ata for R ogers C ounty
Source: CLARITAS Inc.
It should be noted that this information is taken from available 2000 U.S. Census information and estimates of Claritas. The survey data compiled by this analyst regarding current rental rates and occupancy levels is shown in a later section of this report. However, several conclusions can be drawn from the above information. The lowest vacancy indications come from the two largest and fastest growing population centers (Claremore & Catoosa). All of the county communities have relatively low vacancy percentages. This is reasonable based on the population growth in the county as previously discussed.

Page 12
Claremore has the greatest percentage of rental units and the highest median home values. Claremore is the employment center of the county and Catoosa benefits from being built around a highway between Claremore and Tulsa. As will be discussed later, a significant amount of new single family detached housing has occurred recently in Claremore. This new development increases the median home value for the area. Median rental rates for Claremore and the remainder of the county are relatively low. This is due to the lack of new rental unit development in the county recently. Rental rates since the census have increased significantly. This will be shown later in the report. The smaller communities tend to have a lower percentage of renter occupied housing. Much of the population of these communities tend to commute to larger employers in population centers. Renters tend to locate in close proximity to employment, if units are available for reasonable prices. Claremore has several large employers and Catoosa has a significant employment base as well as having the benefit of good accessibility to employment centers. Income Characteristics The following table shows income levels for different areas of Rogers County. This information is defined on a city area basis. The first column identifies 2001 median household income. The second column estimates median household income in 2006. The 3rd and 4th columns show median per capita income levels for the same period.
2001 HH Income 2006 HH Income 2001 Per Capita Income 2006 Per Capita IncomeClaremore $33,635 $36,853 $17,271 $18,204Catoosa $38,761 $42,201 $16,578 $18,186County $42,599 $46,933 $16,233 $19,971
Income Levels in Rogers County
Source: CLARITAS Inc. Household income is anticipated to increase in all areas of Rogers County over the next several years. It is interesting to note that Catoosa has a median household income level much higher than that of Claremore. This may reflect Catoosa’s position as a bedroom community of Tulsa, rather than an independent economic entity like Claremore. The per capita indications reflect similar current and trend indications. Household income throughout the County is anticipated to increase approximately 10% during the next 5 years. The following chart reflects household income banding in Rogers County.
Page 13
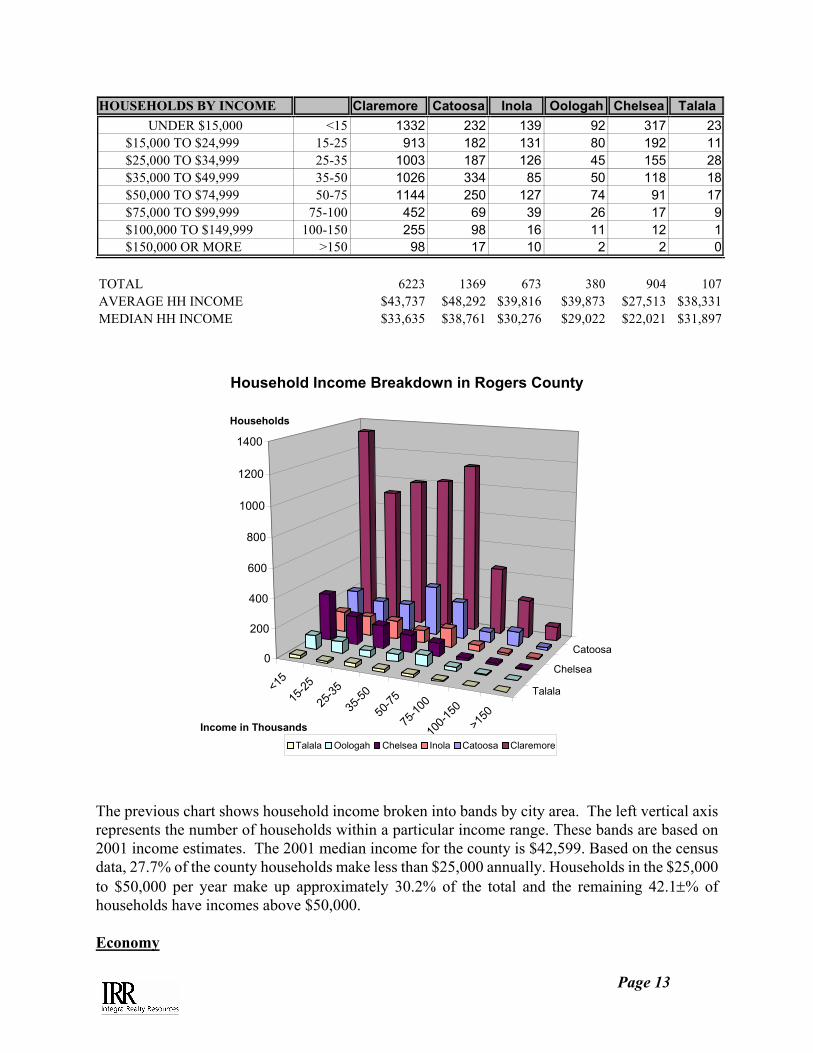
HOUSEHOLDS BY INCOME Claremore Catoosa Inola Oologah Chelsea TalalaUNDER $15,000 <15 1332 232 139 92 317 23
$15,000 TO $24,999 15-25 913 182 131 80 192 11 $25,000 TO $34,999 25-35 1003 187 126 45 155 28 $35,000 TO $49,999 35-50 1026 334 85 50 118 18 $50,000 TO $74,999 50-75 1144 250 127 74 91 17 $75,000 TO $99,999 75-100 452 69 39 26 17 9 $100,000 TO $149,999 100-150 255 98 16 11 12 1 $150,000 OR MORE >150 98 17 10 2 2 0
TOTAL 6223 1369 673 380 904 107AVERAGE HH INCOME $43,737 $48,292 $39,816 $39,873 $27,513 $38,331MEDIAN HH INCOME $33,635 $38,761 $30,276 $29,022 $22,021 $31,897
<15
15-25
25-35
35-50
50-75
75-10
0
100-1
50>1
50
Talala
Chelsea
Catoosa0
200
400
600
800
1000
1200
1400
Households
Income in Thousands
Household Income Breakdown in Rogers County
Talala Oologah Chelsea Inola Catoosa Claremore
The previous chart shows household income broken into bands by city area. The left vertical axis represents the number of households within a particular income range. These bands are based on 2001 income estimates. The 2001 median income for the county is $42,599. Based on the census data, 27.7% of the county households make less than $25,000 annually. Households in the $25,000 to $50,000 per year make up approximately 30.2% of the total and the remaining 42.1±% of households have incomes above $50,000. Economy

Page 14
The Rogers County area economic base is primarily concentrated in agriculture, petroleum, industry, and education. Because of its advantage as the county seat and excellent highway system connections, Claremore is the primary trade center for Rogers County. Historical economic growth for the area has been slow but steady. Claremore's relatively close proximity to City of Tulsa, Port of Catoosa, and Tulsa International Airport also provide additional employment opportunities for local residents. Based on June 2001 data, the county unemployment rate was 2.5%. The rate has been consistently below 3% since the beginning of 2000. The total number employed was 36,210 for the same time period. This indicator has increased annually since 1989.
0
5000
10000
15000
20000
25000
30000
35000
40000
# of
Per
sons
1980
1981
1982
1983
1984
1985
1986
1987
1988
1989
1990
1991
1992
1993
1994
1995
1996
1997
1998
1999
2000
2001
Year
Persons Employed and Unemployed in Rogers County2000 Data Provided by U.S. Census Bureau
Employed Unemployed

Page 15
Unemployment Rates for Rogers County and Oklahoma: Monthly Time Series for Jan. 1980 - Apr. 2001
0
2
4
6
8
10
12
14
Jan-8
0
Jan-8
1
Jan-8
2
Jan-8
3
Jan-8
4
Jan-8
5
Jan-8
6
Jan-8
7
Jan-8
8
Jan-8
9
Jan-9
0
Jan-9
1
Jan-9
2
Jan-9
3
Jan-9
4
Jan-9
5
Jan-9
6
Jan-9
7
Jan-9
8
Jan-9
9
Jan-0
0
Jan-0
1
Month/Year
Une
mpl
oym
ent R
ate
%
Rogers County Unemployment RateState of Oklahoma Unemployment Rate
Several important issues are presented by the previous tables. The number of persons employed in Rogers County has increased steadily since 1990. The rate of increase appears to have slowed since 1999. During this period, the percentage of unemployed has consistently decreased, reaching a low of 2.2% in December, 2000. The second chart graphically displays the change in unemployment rate for Rogers County and the state of Oklahoma. Rogers County had higher unemployment rates until the beginning of 1995. Since that time the county unemployment has been lower than statewide averages. With a stable local economy and increasing population, the demand for housing and retail/commercial facilities should increase. The following chart lists the major employers impacting the labor market in the area.

Page 16
Major Employers in Rogers County
Company Name Product Employment U.S. Marine Boat Trailers 160 UPCO Inc. Sucker & Pony Rods 250 Advance Research Chemicals Fluoride Chemicals 250 Allied Signal Auto Catalysts 350 Centerlift-Hughes Oil Field Pumps 800-1200 Worthington Cylinders Refrigerant Gas Containers 151 Erlanger Tubular Corp. Pipe 100 GEA Rainey Heat Exchangers 200 Howmet Engine Repair 205 Nupar Metal Stamping 110 Pro-Quip Refinery Processing Equipment 150 Public Service Company Public Utility 180 Terra Nitrogen Liquid Fertilizer 163 The previous list of major employers does not include public schools systems, universities, or hospitals. These categories also include several large employers in Rogers County. The majority of the above noted employers have been located in Rogers County for several years and many have expanded their workforce. Most of the large employers are located in close proximity to Claremore or at the Port of Catoosa. The Port of Catoosa is a part of the Arkansas River Navigation Channel providing barge service to points as far south as New Orleans. This industrial area is just west of Catoosa and is the primary industrial area in Rogers County. Employment has been expanding in the county for the past few years and this trend is anticipated to continue as the economy grows. Information from the Center for Economic and Management Research, based on data provided by the Oklahoma Employment Security Commission, indicated a total workforce in Rogers County in June 2001 of 37,130 with 36,210 employed. This reflects a unemployment rate of 2.5%. This rate is well below statewide indications and reflects the economic growth of the area. The unemployment rate for the Tulsa Metropolitan Area in April 2001 was estimated at 2.4% and 2.7% for the state, according to data provided by the Bureau of Labor Statistics. The national average unemployment rate in April 2001 was 4.5%, also according to the BLS.

Page 17
NAICS INDUSTRY 1999 NO. EMPLOYED
1998 NO. EMPLOYED
TOTAL CHANGE
% CHANGE
1999 PAYROLL
($1000's)
1998 PAYROLL
($1000's)
1999 AVG PAYROLL
1998 AVG PAYROLL
1999 STATE AVG
PAYROLL
11 Forestry, fishing, hunting, and agriculture support 0-19 0-19 N/A N/A N/A N/A N/A N/A $21,115
21 Mining 113 138 (25) -18.12% 3639 5750 $32,204 $41,667 $38,95722 Utilities 100-249 100-249 N/A N/A N/A N/A N/A N/A $49,69923 Construction 1018 1043 (25) -2.40% 28,865 27,380 $28,355 $26,251 $27,591
31-33 Manufacturing 5016 4865 151 3.10% 171,016 158,587 $34,094 $32,598 $32,61642 Wholesale trade 605 579 26 4.49% 22,033 19,683 $36,418 $33,995 $33,117
44-45 Retail trade 2080 2028 52 2.56% 34931 32217 $16,794 $15,886 $16,62848-49 Transportation & warehousing 368 417 (49) -11.75% 7989 10059 $21,709 $24,122 $30,386
51 Information 117 97 20 20.62% 4,665 3,564 $39,872 $36,742 $35,74752 Finance & insurance 458 447 11 2.46% 12,224 11,262 $26,690 $25,195 $33,14953 Real estate & rental & leasing 192 197 (5) -2.54% 4354 3715 $22,677 $18,858 $21,461
54 Professional, scientific & technical services 279 308 (29) -9.42% 8426 7914 $30,201 $25,695 $35,357
55 Management of companies & enterprises 20-99 100-249 N/A N/A N/A N/A N/A N/A $54,226
56 Admin, support, waste mgt, remediation services 607 992 (385) -38.81% 8640 14139 $14,234 $14,253 $18,134
61 Educational services 14 0-19 N/A N/A 158 N/A $11,286 N/A $17,28962 Health care and social assistance 1790 1968 (178) -9.04% 44,340 43,356 $24,771 $22,030 $25,26271 Arts, entertainment & recreation 347 301 46 15.28% 5,013 4,177 $14,447 $13,877 $14,23772 Accommodation & food services 1375 1442 (67) -4.65% 12,018 11,720 $8,740 $8,128 $9,746
81 Other services (except public administration) 724 742 (18) -2.43% 10,092 11,219 $13,939 $15,120 $15,922
95 Auxiliaries (exc corporate, subsidiary & regional 46 35 11 31.43% 1658 1346 $36,043 $38,457 $43,211
99 Unclassified establishments 41 8 33 412.50% 328 62 $8,000 $7,750 $23,954
Rogers County Employment and Payroll by Major Industry Category: 1999 and 1998Source: U.S. Census Bureau County Business Patterns
The previous table identifies county employment and payroll by major industry in 1998 and 1999. The largest employment group is manufacturing followed by retail trade and health care. Manufacturing and retail trade had increases in employment from 1998 to 1999 while health care had a 9% decline. Most industry groups had increases in income levels. The Rogers County 1999 average annual payroll is higher than the state average in several categories including construction, manufacturing, wholesale trade, and information but lower in categories including transportation and warehousing, finance & insurance, professional services, and health care services. Transportation The county is well located in relationship to state and national highway systems. U.S. Highway 412 traverses the southern edge of the county. Interstate 44, a major regional expressway, allows access throughout the southeast portion of the county. State Highway 66 crosses the county from southwest to northeast and U.S. Highway 169 and State Highway 88 allow north/south travel. Access to the Tulsa metropolitan area, Claremore, and most rural parts of the county is easily accessible from the various state and federal highways. Additionally, the county has a well maintained interior road system. The area is serviced by the Greyhound Bus Lines. Local rail service is provided daily by the Missouri-Pacific, and Burlington Northern Railroad with an average of four local trains per day. Motor freight carriers providing service on a daily basis include B & B Lines and C & P Lines.
Page 18
Other carriers include Campbell "66" Express, Riss International, Lee Way Motor Freight, Chief Freight Lines, Roadway Express, Yellow Transit, and Consolidated Freightways. Express lines include United Parcel, Magic Empire, and Mistletoe Express. The nearest commercial airport (Tulsa International) is located in Tulsa 25± miles southwest of Claremore. This airport offers regional, national and international carriers. City Governments The City of Claremore operates under a Mayor/Council form of government. The city provides a full time police department with 35 employees and a full time fire department with 21 employees. Both departments have fully qualified and equipped personnel. The local government utilizes a Comprehensive City Plan and zoning classifications are in force in the city limits. The smaller communities in the county typically have a combination of volunteer and/or full-time police and fire department personnel. Most have a mayor-council form of government. Most also have water and sanitary sewer facilities. Rural areas are dependent upon rural water supply and onsite septic systems for sanitary sewer. Medical Facilities County medical services are provided by the newly expanded Claremore Regional Health Center and the Claremore Indian Hospital, a federally operated institution. Professional services are offered by local physicians and dentists. Claremore also has a full time city/county health department providing health services to the community. The smaller county communities typically have either small out patient medical services or doctors officing in the community. Educational Facilities All of the county communities have public school facilities. In addition, the Northeastern Oklahoma Area Vo-Tech is located 10 miles east of Claremore on Highway 20. Rogers State College is a four year institution located in Claremore. Several other colleges and universities are accessible to students including Tulsa University, Rogers University, Oral Roberts University and Tulsa Community College. Each of these higher level institutions are located in Tulsa. Oklahoma State University is located in Stillwater, 90 miles from Claremore, and Oklahoma University is located in Norman, 150 miles southwest of Claremore. Conclusions The Rogers County economy experienced a recession as a result of the declines in the agricultural and energy sectors of the State's economy from 1983-1985. The depressed conditions persisted through the late 1980's to early 1990's. Recent economic indicators have improved significantly. The beginning of a recovery is evidenced by declining unemployment rates, increasing per capita income levels, increased real estate sales activity, declining vacancy rates, and gradual stabilization of both rental rates and market values in all real estate sectors. Although the economic recovery is expected to continue, it is reasonable to assume that the rate of growth will not continue at current levels.

Page 19
Page 20
Page 21
Page 22
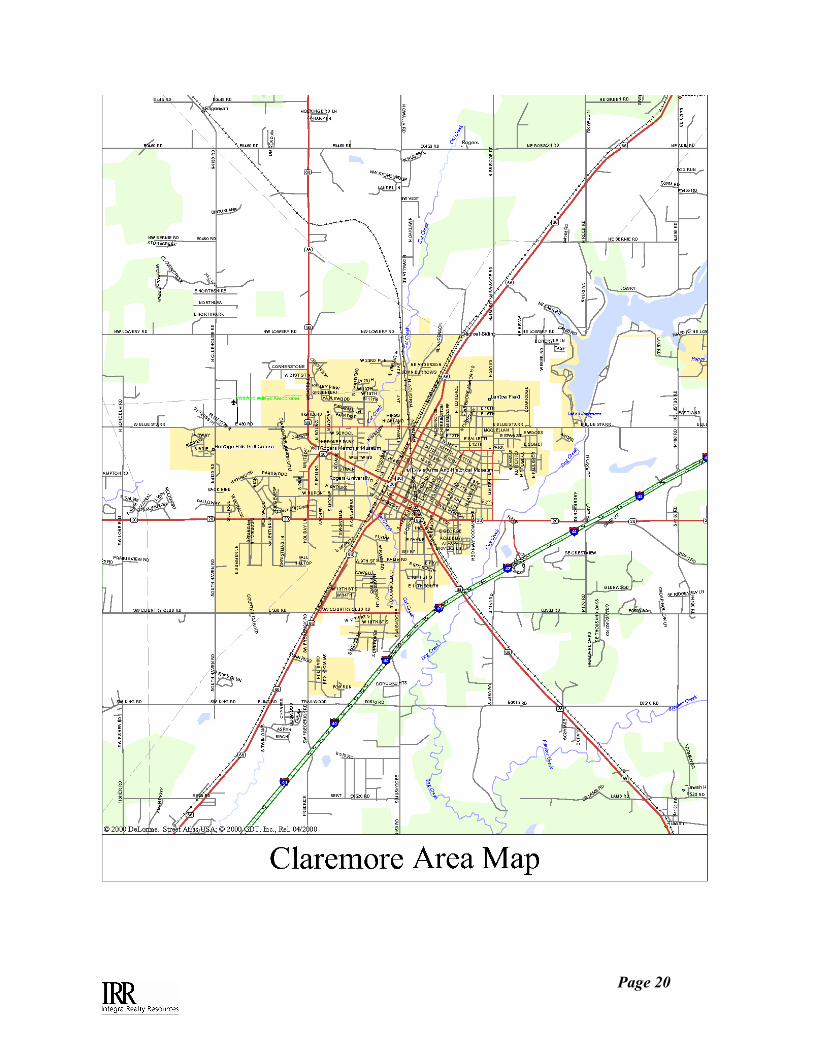
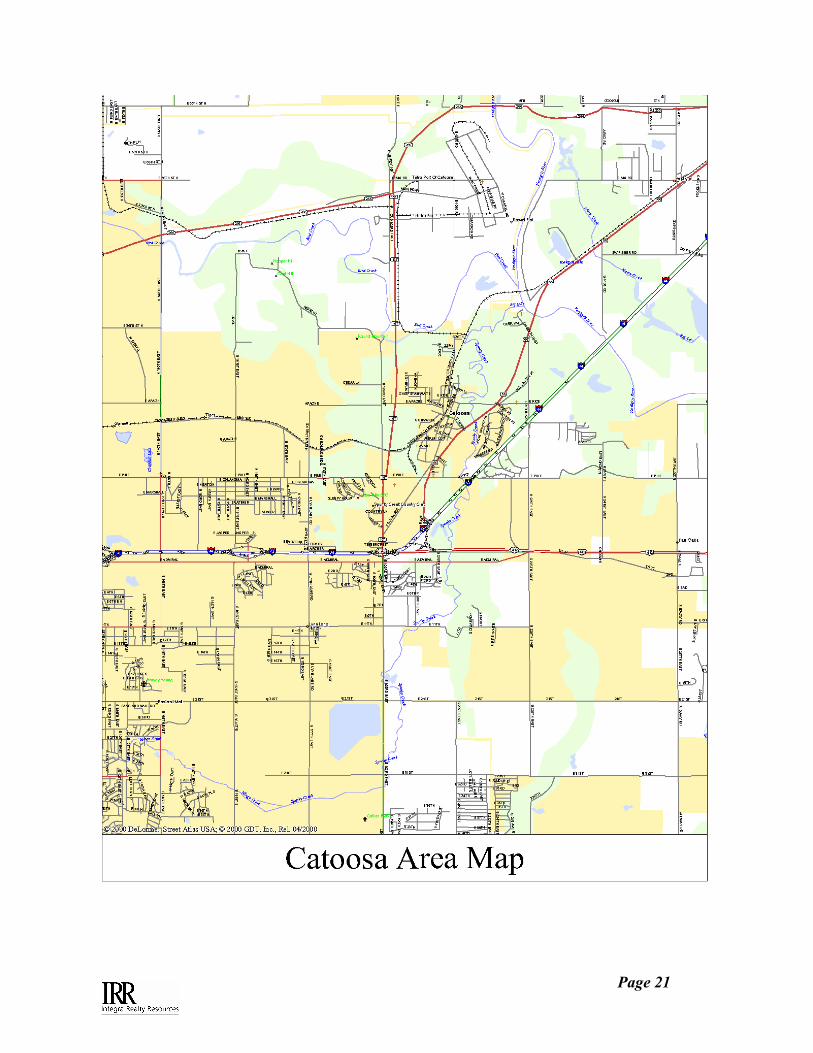
Housing Supply Characteristics This section of the report will discuss the Rogers County housing market. Information in this section was gathered from the available public information, U.S. Census information, and Claritas, Inc. Claritas uses census information in conjunction with growth trends to estimate demographic changes in most cities nationwide. This analysis is concerned with the population centers of Claremore and Catoosa with an overview of the remainder of the county. Housing Supply Available 2000 Census information reflected 27,476 housing units in Rogers County. This included single and multifamily units that were owner occupied and rentals. The following chart reflects changes in the number of building permits in Rogers County since 1996. The figures for 1996 do not include data for the months of January or February for lack of information. This is the most recent information available. Building permit information is not available from 1990 to 1995. However, it is reasonable to assume, based on the 1996-2000 indications that the number of single family permits from 1990 to 1995 averaged around 250.
1996 1997 1998 1999 2000 YTD 2001*Single Family Permits 275 310 411 524 412 83Duplex Units 4 14 20 6 4 10Apartment Units 0 38 0 312 96 0Average Single Family Permit Value $90,684 $94,587 $98,751 $108,296 $111,397 $116,650
Rogers County Building Permit Activity
* Through March, 2001 The previous table shows new housing in Rogers County during the previous several years. The majority of new development has occurred in the single family residential market. The number of new single family permits increased in 1996 from the previous two years. The number of new single family permits represent an approximate increase of 1.5% in the total number of housing units based on the 2000 Census. The period of time between 1996 and 2000 saw a total increase of approximately 9% in the number of housing units just based on new single family development. The number of duplex and apartment units developed during this period was limited. A total of 13 duplexes (26 units) and 466 multifamily units have been developed since 1994. The highest concentration of new duplex development occurred in 1994. All apartment development has occurred in Claremore. New apartment development has consisted of a 20 unit expansion of an existing complex, a 38 unit rehabilitation of a downtown hotel for elderly living, a 312 unit market rate development, and a 96 unit affordable housing development. All of these developments were well received by the market and maintain high occupancy levels. The average single family permit value gives an indication in the change of cost during the past several years. The average permitted value has increased every year since 1995. It should be noted that the permit value does not include land cost and is estimated by the builder. These indications historically are low. The range of new home cost varies from approximately $50,000 to close to
Page 23
$500,000. The majority of new homes appear to be owner occupied. The exception is a large number of homes built in 1996 by the Cherokee Housing Authority in an addition just south of Claremore. These homes had an average cost of $55,000 and are for rent or purchase. The average cost of a new home in Rogers County during 2000, including land cost, appears to be close to $125,000. This represents a significant increase from prior years. The average in 1994 was $80,091 and in 1995 was $81,977. However, it is also apparent that overall, new single family housing is more expensive to build than in previous years. This may be due to increased materials costs or increased demand for construction employees which in turn has increased labor costs. It should also be noted that the 2000 median home values for the county (shown on page 11) reflect lower indications than the current average construction costs. The 1990 median home value for Rogers County was $53,985. This increased to just over $87,313 in 2001, a 61.7% increase. This indication is still well below the new home cost averages of the past few years. It is apparent that the majority of new single family residential development involves custom building for specific buyers rather than speculative building available to a wide market. This analyst spoke with several real estate professionals throughout the county. Custom and speculative new single family residential development is occurring in Claremore as well as other areas of the County. The growth in housing in the county has not kept pace with the growth in population since 1990 which has increased at an average rate of 2.8% annually. The number of new housing units, based on building permit data, has increased at an average of approximately 1.5% annually during the past 10 years. Although only a portion of the population will be single family home occupants, the growth in single family housing has increased at a slower pace than the growth of owner occupants. The anticipated growth in households from 2001 to 2006 was previously estimated at 9.69% for the county. This is approximately 2.0% annually. As the population continues to increase, the gap between housing supply and demand will continue to widen. Previous information indicated that 81.1% of the housing units in the county are owner occupied with the remaining 18.9% renter occupied. While single family residential development has expanded at a rate of approximately 1.5% per year for the past several years, multifamily development has only recently occurred in Claremore. No other communities have new multifamily development. It is reasonable to assume that as the population has increased, the number of potential renters has expanded. While new single family development has attempted to satisfy expanding area population, the expansion of renters has not been provided similar supply. County population growth, based on the rental household percentage would indicate a need for approximately 1,300 rental units countywide during the past 10 years. As mentioned previously, less than 500 multifamily units have been added to the market. Until 1998, the cost of new market rate apartment development was not financially feasible in Oklahoma due to low rental rate levels. Rental rates significantly increased in the large metropolitan areas in the late 1990's, spurring large numbers of new rental unit development. However, while some rental rate growth has also occurred in rural communities, the degree of increase has not been sufficient to economically justify new market rate rental housing. Most new multifamily development in rural communities has been with the assistance of government support including

Page 24
federal tax credits. One new market rate development has occurred in Claremore. This development has rents well above the other market rate alternatives, but still well below new properties in the city Tulsa. However, it has performed very well, maintaining high occupancy levels. New garden developments in Tulsa with good property amenities typically have a cost of over $60,000 per unit. Rental rates must be high enough to justify the cost in order to support new market based development. Claremore Single Family Sales Activity The following table shows single-family housing sales listed with a member of the Claremore Board of Realtors in Claremore during the past 4 years. It is reasonable to assume that these sales are primarily resales of existing housing stock since most new building permits involve custom homes built by a builder for a specific owner.

Page 25
Year 1997 1998 1999 2000# of Units Sold 31 39 34 47Average List Price $49,912 $66,361 $61,461 $53,845Average Sale Price $46,433 $63,138 $60,857 $52,552% List to Sale Price 93.0% 95.1% 99.0% 97.6%Average Square Feet 896 786 927 775Average Price/SF $51.82 $80.33 $65.65 $67.81Days on Market 60 47 38 48
Year 1997 1998 1999 2000# of Units Sold 219 285 266 245Average List Price $86,414 $90,416 $95,891 $103,656Average Sale Price $83,435 $87,629 $93,526 $101,742% List to Sale Price 96.6% 96.9% 97.5% 98.2%Average Square Feet 1293 1240 1097 1088Average Price/SF $64.53 $70.67 $85.26 $93.51Days on Market 58 54 56 54
Year 1997 1998 1999 2000# of Units Sold 55 65 66 66Average List Price $125,919 $133,576 $133,556 $161,903Average Sale Price $120,176 $130,226 $129,095 $157,612% List to Sale Price 95.4% 97.5% 96.7% 97.3%Average Square Feet 1666 1800 1796 1696Average Price/SF $72.13 $72.35 $71.88 $92.93Days on Market 88 68 63 69
Year 1997 1998 1999 2000# of Units Sold 310 395 376 363Average List Price $90,347 $97,349 $100,123 $110,741Average Sale Price $86,780 $94,280 $97,552 $108,412% List to Sale Price 96.1% 96.8% 97.4% 97.9%Average Square Feet 1336 1275 1230 1181Average Price/SF $64.96 $73.95 $79.31 $91.80Days on Market 65 56 55 56
Single Family Sales ActivityTwo Bedroom Units
Single Family Sales ActivityThree Bedroom Units
Single Family Sales ActivityFour Bedroom Units
Single Family Sales ActivityTwo or More Bedroom Units
Several market conclusions can be drawn from the previous tables. Overall the Claremore single family market is active and healthy. The average list term is relatively short for all categories and the list price to sale price ratios reflect high demand for housing. As with the building permit
Page 26
indications, most categories reflect increasing sale prices over the past four years. The total sales of 2 to 4 bedroom units has increased in per unit price 24.9% since 1997. The number of 2 bedroom homes sold during 1997 through 1999 remained relatively stable with an increase in 2000. The average sale price increased significantly from 1997 to 1998 but dropped in 1999 and again in 2000. The average sale price increased 13.2% from 1997 to 2000. The ratio of list to sale price has consistently been above 90%, peaking at 99% in 1999. The average days on market has been less than 2 months with shortest indication of just over 1 month in 1999. Although the sale price indication has declined, the number of sales is recently increased and the ratio of sale price to list price is close to 100% indicating a strong market. The average size is reasonable for this floorplan. It should be noted that the average price per square foot increased from 1999 to 2000. This reflects the smaller average size of the unit sizes in 2000. Hence, the more reliable market indicator of value trends is the price/SF which accounts for differences in unit size as well as price. The number of 3 bedroom homes sold during 1997 through 2000 remained relatively stable. This floorplan is most common and most heavily traded. The average sale price increased in each year. The average sale price increased 21.9% from 1997 to 2000. The ratio of list to sale price has consistently been above 95%, peaking at 98.2% in 2000. The average days on market has been less than 2 months every year. It is apparent that a high demand exists for these homes based on the increase in sale price and the small amount of downward negotiation from the list price. The average size appears somewhat small for 3 bedroom units, but the resulting price per square foot indication is approaching $100 per foot. The per square foot indication has increased approximately 45% since 1997. The number of 4 bedroom homes sold during 1997 through 2000 remained relatively stable. The average sale price increased in 2000 after leveling in 1999. The average sale price increased 31.1% from 1997 to 2000. The ratio of list to sale price has consistently been above 95%, peaking at 97.5% in 1998. The average days on market has been approximately 2 months in 1998 through 2000 with a slightly longer period in 1997. It is apparent that a high demand exists for these homes based on the increase in sale price and the small amount of downward negotiation from the list price. It is interesting to note that the price per square foot indication was relatively level from 1997 through 1999 and increased significantly in 2000. The previous information is taken from available multiple listing service information of the Claremore Board of Realtors. Sales of single-family units for 1996 and year-to-date 1997 are reflected. The information involves primarily existing housing stock as custom homes are not listed on the market. In all cases, the number of sales has remained relatively stable, while the average unit price has increased. The number of units sold includes houses sold by a member of the Claremore Board of Realtors. It does not include sales by homeowners, non-Realtor members or sales of custom homes by builders. It is apparent from the above information that 3 bedroom homes are preferred by the market. In the information shown, approximately 67% of all sales were 3 bedroom homes.
Page 27
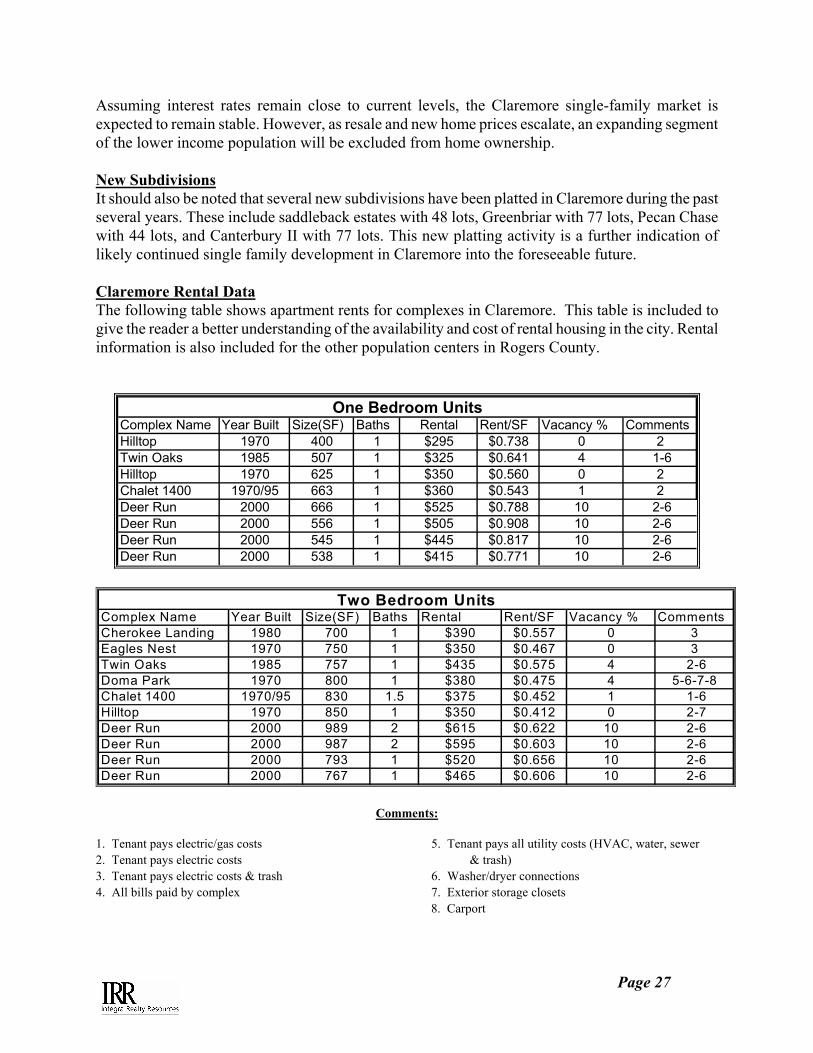
Assuming interest rates remain close to current levels, the Claremore single-family market is expected to remain stable. However, as resale and new home prices escalate, an expanding segment of the lower income population will be excluded from home ownership. New Subdivisions It should also be noted that several new subdivisions have been platted in Claremore during the past several years. These include saddleback estates with 48 lots, Greenbriar with 77 lots, Pecan Chase with 44 lots, and Canterbury II with 77 lots. This new platting activity is a further indication of likely continued single family development in Claremore into the foreseeable future. Claremore Rental Data The following table shows apartment rents for complexes in Claremore. This table is included to give the reader a better understanding of the availability and cost of rental housing in the city. Rental information is also included for the other population centers in Rogers County.
Complex Name Year Built Size(SF) Baths Rental Rent/SF Vacancy % CommentsHilltop 1970 400 1 $295 $0.738 0 2Twin Oaks 1985 507 1 $325 $0.641 4 1-6Hilltop 1970 625 1 $350 $0.560 0 2Chalet 1400 1970/95 663 1 $360 $0.543 1 2Deer Run 2000 666 1 $525 $0.788 10 2-6Deer Run 2000 556 1 $505 $0.908 10 2-6Deer Run 2000 545 1 $445 $0.817 10 2-6Deer Run 2000 538 1 $415 $0.771 10 2-6
One Bedroom Units
Complex Name Year Built Size(SF) Baths Rental Rent/SF Vacancy % CommentsCherokee Landing 1980 700 1 $390 $0.557 0 3Eagles Nest 1970 750 1 $350 $0.467 0 3Twin Oaks 1985 757 1 $435 $0.575 4 2-6Doma Park 1970 800 1 $380 $0.475 4 5-6-7-8Chalet 1400 1970/95 830 1.5 $375 $0.452 1 1-6Hilltop 1970 850 1 $350 $0.412 0 2-7Deer Run 2000 989 2 $615 $0.622 10 2-6Deer Run 2000 987 2 $595 $0.603 10 2-6Deer Run 2000 793 1 $520 $0.656 10 2-6Deer Run 2000 767 1 $465 $0.606 10 2-6
Two Bedroom Units
Comments:
1. Tenant pays electric/gas costs 5. Tenant pays all utility costs (HVAC, water, sewer 2. Tenant pays electric costs & trash) 3. Tenant pays electric costs & trash 6. Washer/dryer connections 4. All bills paid by complex 7. Exterior storage closets
8. Carport
Page 28
The previous rent surveys encompass several hundred rental units in seven complexes. These properties are located throughout the community and provide a good indication of the availability and rental structure of multifamily property. The comparables were constructed mostly prior to the mid-1980's, except for the Chalet 1400 expansion in 1995 and Deer Run which was new in 2000. Most of the older apartment complexes have similar physical characteristics. The following property characteristics were identified as the major variables which directly affect market rental rates. Although this analyst recognizes other minor differences or characteristics would require an appropriate adjustment, an empirical dollar amount is not discernable from the market. The city also has 200± units in three, Section 8 or HUD-Seniors projects
New Construction $25 Exterior Storage Closets $5 Washer/Dryer Hookups $20 Carports $10 Special Complex Features $10
Concessions such as free rent or no deposit were not evident in the competitive market survey. These inducements appear to have phased out over the market, and appear only sporadically at individual complexes to induce leasing activity in a particular unit type. Review of historical rental data indicates the comparable rental rates have increased in a predominant range of $10 to $20 per unit per month annually over the past 36 months. Occupancy levels in the Claremore area have continued to increase to its present level in the upper 90% range. Rental rates also increased during this same period. The area should continue to show good rental rate and occupancy support due to proximity to the employment centers and limited number of new available units. A rental market factor in Claremore is Rogers State University. Rogers recently expanded its curriculum to 4 years. The university is currently building a residence hall which will house up to 250 students. Prior to this addition, the university had no residence hall capacity. This addition to the market may slightly soften the overall Claremore multifamily market. Based on the number of units identified as rentals by the 1990 Census, it is reasonable to assume that a significant number of single family residences are rentals as well as smaller complexes (under 20 units) not surveyed by this analyst. This analyst also spoke to a property manager with approximately 30 single family houses and/or duplexes which rent in Claremore. These units are 2, 3, and 4 bedroom floorplans and rent in the $500 to $650 per month range. Some of the older 2 bedroom duplexes rent for $350 to $375 per month. The property manager noted that the units are typically 100% occupied and can be rented as quickly as the vacancy occurs. She receives several calls a day inquiring about available units. Increasing occupancy and rental rates during the early 1990's supports the demand for new apartments in Claremore. Based on the success of the available units, well diversified economy, and continued growth of the business base, it is apparent that additional supply will be needed in the future Market Vacancy This section will discuss the trends of vacancy in the rental market over the past few years. The developments outlined previously report occupancy levels typically above 95%. These occupancy levels are typical of well maintained and poorly maintained properties alike. The ability of older, physically deteriorating facilities to maintain high occupancy levels reflects the lack of superior alternatives in the Claremore market. The Section 8 units, according to property managers, typically

Page 29
stay well occupied. The overall market vacancy of total housing units was reported at 7.4% by the 2000 U.S. Census. A portion of this percentage is attributable to single family residences which are typically owner occupied. As noted above, the majority of complexes in Claremore report occupancy levels above 95%. Although this analyst’s survey does not include all rental units in Claremore, it represents a reasonable market sample of available units. It is the opinion of this analyst that the overall vacancy rate will remain at minimal levels if no new units are added. It is also obvious that new moderately priced well managed apartment developments would be quickly absorbed and not have a significant negative impact on existing properties. Infill Lot Inventory The city of Claremore does not maintain an inventory of infill lots. It is apparent that some infill lots are available in older areas close to the downtown district. These lots which are vacant or occupied by vacant deteriorated housing, are a good source for affordable housing. Infill lots have all services provided and typically are relatively inexpensive. It is the recommendation of this report, that the city of Claremore gather an inventory of infill lots. Substandard Housing The city of Claremore does not have an inventory of substandard housing. Substandard housing is defined by HUD to have incomplete kitchen or plumbing facilities. Although the 2000 census information regarding this issue is not yet available, the 1990 census for Claremore identified 45 housing units lacking complete kitchen facilities and 56 housing units lacking complete plumbing facilities. It also is noted that 63 housing units are heated by wood. This also is considered to be a substandard item. It is unknown if some of these units have both kitchen and plumbing deficiencies. However, it is apparent that less than 100 units in Claremore were considered substandard in 1990. It is reasonable to assume that this number has remained relatively level as units have been demolished and other units have fallen in disrepair.
Number Percent Number Percent Number PercentClaremore 5590 63 1.13% 45 0.81% 56 1.00%Rogers County Total 21455 1683 7.84% 273 1.27% 266 1.24%
Inadequate Kitchen Inadequate Plumbing
Substandard Housing in Claremore and Rogers County
Source: U.S. Census BureauTotal Housing
UnitsUse Wood for Fuel
Catoosa Single Family Sales Activity The following table shows single-family housing sales listed with a member of the Board of Realtors in Catoosa during the past 4 years. It is reasonable to assume that these sales are primarily resales of existing housing stock since most new building permits involve custom homes built by a builder for a specific owner.
Page 30
Year 1997 1998 1999 2000# of Units Sold 2 3 2 6Average List Price $62,450 $86,166 $74,450 $71,183Average Sale Price $55,000 $80,266 $72,950 $67,853% List to Sale Price 88.1% 93.2% 98.0% 95.3%Average Square Feet 632 999 1622 770Average Price/SF $87.03 $80.35 $44.98 $88.12Days on Market 9 87 85 40
Year 1997 1998 1999 2000# of Units Sold 18 25 25 24Average List Price $83,572 $92,064 $111,032 $116,613Average Sale Price $81,058 $89,278 $107,065 $111,783% List to Sale Price 97.0% 97.0% 96.4% 95.9%Average Square Feet 913 1098 812 1390Average Price/SF $88.78 $81.31 $131.85 $80.42Days on Market 78 83 62 46
Year 1997 1998 1999 2000# of Units Sold 1 8 4 15Average List Price $186,900 $124,483 $184,912 $166,286Average Sale Price $186,900 $118,746 $173,850 $163,526% List to Sale Price 100.0% 95.4% 94.0% 98.3%Average Square Feet 3587 1174 1267 1943Average Price/SF $52.10 $101.15 $137.21 $84.16Days on Market 49 95 58 74
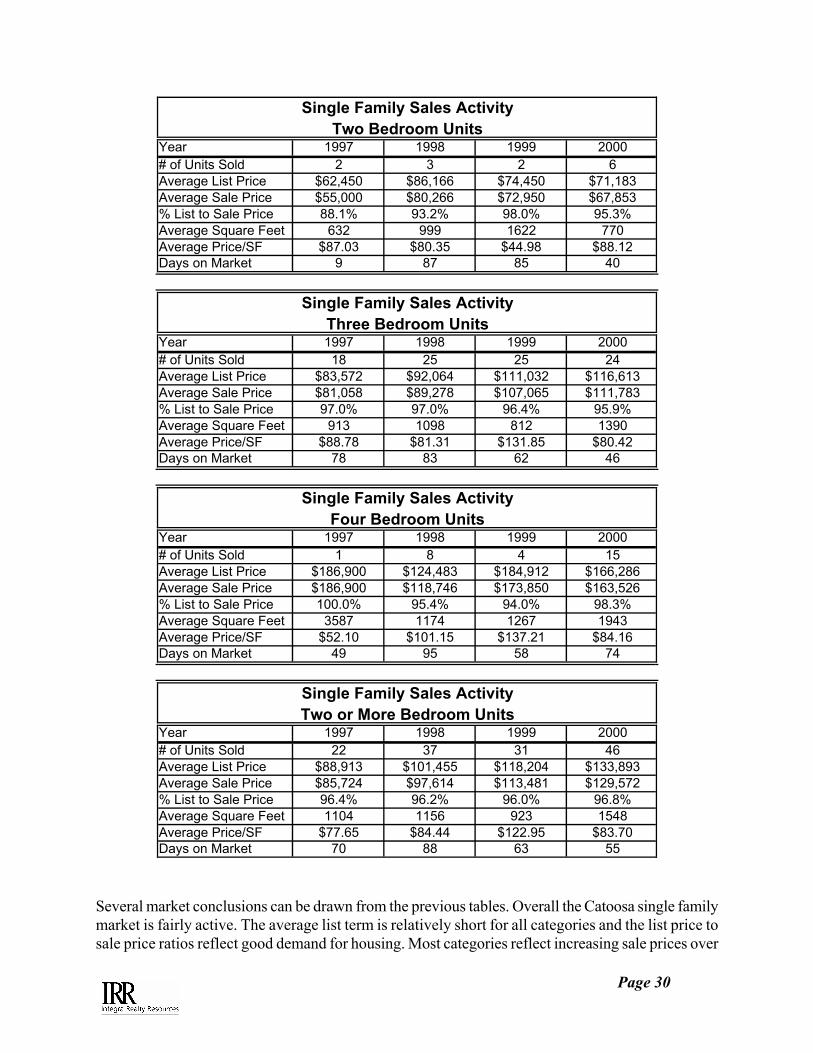
Year 1997 1998 1999 2000# of Units Sold 22 37 31 46Average List Price $88,913 $101,455 $118,204 $133,893Average Sale Price $85,724 $97,614 $113,481 $129,572% List to Sale Price 96.4% 96.2% 96.0% 96.8%Average Square Feet 1104 1156 923 1548Average Price/SF $77.65 $84.44 $122.95 $83.70Days on Market 70 88 63 55
Single Family Sales ActivityFour Bedroom Units
Single Family Sales ActivityTwo or More Bedroom Units
Single Family Sales ActivityTwo Bedroom Units
Single Family Sales ActivityThree Bedroom Units
Several market conclusions can be drawn from the previous tables. Overall the Catoosa single family market is fairly active. The average list term is relatively short for all categories and the list price to sale price ratios reflect good demand for housing. Most categories reflect increasing sale prices over
Page 31
the past four years. The total sales of 2 to 4 bedroom units has increased in per unit price 24.9% since 1997. The number of 2 bedroom homes sold during 1997 through 1999 remained relatively stable with an increase in 2000. The average sale price increased significantly from 1997 to 1998 but dropped in 1999 and again in 2000. The average sale price increased 23.4% from 1997 to 2000. With the exception of 1997, the ratio of list to sale price has consistently been above 90%, peaking at 98% in 1999. The average days on market has fluctuated from 9 days in 1997 to 87 days in 1999. The year 2000 indication was 40 days. Although the sale price indication has declined, the number of sales is recently increased and the ratio of sale price to list price is close to 100% indicating a strong market. The decline in sale price may be a reflection of available inventory. Additionally, the averages are significantly affected by single sales due to the small number of sales in the calculation. The number of 3 bedroom homes sold during 1997 through 2000 remained relatively stable. This floorplan is most common and most heavily traded. The average sale price increased in each year. The average sale price increased 37.9% from 1997 to 2000. The ratio of list to sale price has consistently been above 95%, peaking at 97.0% in 1998. The average days on market has ranged from 46 to 83 days with the shortest indication in 2000. It is apparent that a high demand exists for these homes based on the increase in sale price and the small amount of downward negotiation from the list price. The average indications appear to be questionable due to the relatively small number of sales. The average size dropped significantly in 1998 which results in a very high price per square foot indication. The averages in 2000 appear reasonable based on available information. The number of 4 bedroom homes sold during 1997 through 2000 fluctuated from 1 to 15 with the highest number in 2000. This may reflect available inventory. The average sale price has fluctuated, but this indication is inconclusive due to the small number of sales. However, it is interesting to note that the average sale price for a 4 bedroom home in Claremore during 2000 was under $158,000 as compared to $163,500 for Catoosa. This suggests that the larger homes in Catoosa are a good quality product with strong demand. The ratio of list to sale price has consistently been above 94%, peaking at 98.3% in 2000. The average days on market has been approximately 2 to 3 months in 1998 through 2000. It is apparent that a high demand exists for these homes based on the recent average sale price and the small amount of downward negotiation from the list price. The averages are significantly affected by the small number of sales and may not be representative of the overall market. The previous information is taken from available multiple listing service information of the Board of Realtors. The information involves primarily existing housing stock as custom homes are not listed on the market. In most cases, the number of sales has remained relatively stable, while the average unit price has increased. The number of units sold includes houses sold by a member of the local Board of Realtors. It does not include sales by homeowners, non-Realtor members or sales of custom homes by builders. It is apparent from the above information that 3 bedroom homes are preferred by the market. In the information shown, approximately 67% of all sales were 3 bedroom homes. Assuming interest rates remain close to current levels, the Catoosa single-family market is expected
Page 32
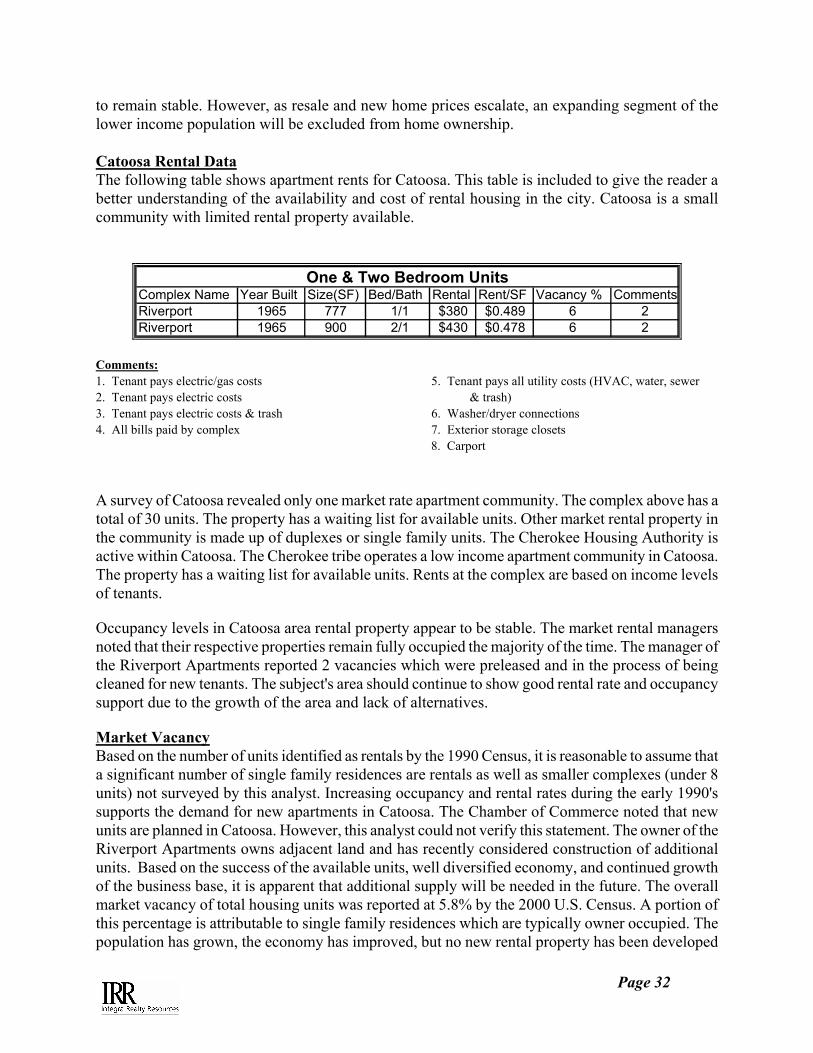
to remain stable. However, as resale and new home prices escalate, an expanding segment of the lower income population will be excluded from home ownership. Catoosa Rental Data The following table shows apartment rents for Catoosa. This table is included to give the reader a better understanding of the availability and cost of rental housing in the city. Catoosa is a small community with limited rental property available.
Complex Name Year Built Size(SF) Bed/Bath Rental Rent/SF Vacancy % CommentsRiverport 1965 777 1/1 $380 $0.489 6 2Riverport 1965 900 2/1 $430 $0.478 6 2
One & Two Bedroom Units
Comments: 1. Tenant pays electric/gas costs 5. Tenant pays all utility costs (HVAC, water, sewer 2. Tenant pays electric costs & trash) 3. Tenant pays electric costs & trash 6. Washer/dryer connections 4. All bills paid by complex 7. Exterior storage closets
8. Carport A survey of Catoosa revealed only one market rate apartment community. The complex above has a total of 30 units. The property has a waiting list for available units. Other market rental property in the community is made up of duplexes or single family units. The Cherokee Housing Authority is active within Catoosa. The Cherokee tribe operates a low income apartment community in Catoosa. The property has a waiting list for available units. Rents at the complex are based on income levels of tenants. Occupancy levels in Catoosa area rental property appear to be stable. The market rental managers noted that their respective properties remain fully occupied the majority of the time. The manager of the Riverport Apartments reported 2 vacancies which were preleased and in the process of being cleaned for new tenants. The subject's area should continue to show good rental rate and occupancy support due to the growth of the area and lack of alternatives. Market Vacancy Based on the number of units identified as rentals by the 1990 Census, it is reasonable to assume that a significant number of single family residences are rentals as well as smaller complexes (under 8 units) not surveyed by this analyst. Increasing occupancy and rental rates during the early 1990's supports the demand for new apartments in Catoosa. The Chamber of Commerce noted that new units are planned in Catoosa. However, this analyst could not verify this statement. The owner of the Riverport Apartments owns adjacent land and has recently considered construction of additional units. Based on the success of the available units, well diversified economy, and continued growth of the business base, it is apparent that additional supply will be needed in the future. The overall market vacancy of total housing units was reported at 5.8% by the 2000 U.S. Census. A portion of this percentage is attributable to single family residences which are typically owner occupied. The population has grown, the economy has improved, but no new rental property has been developed
Page 33
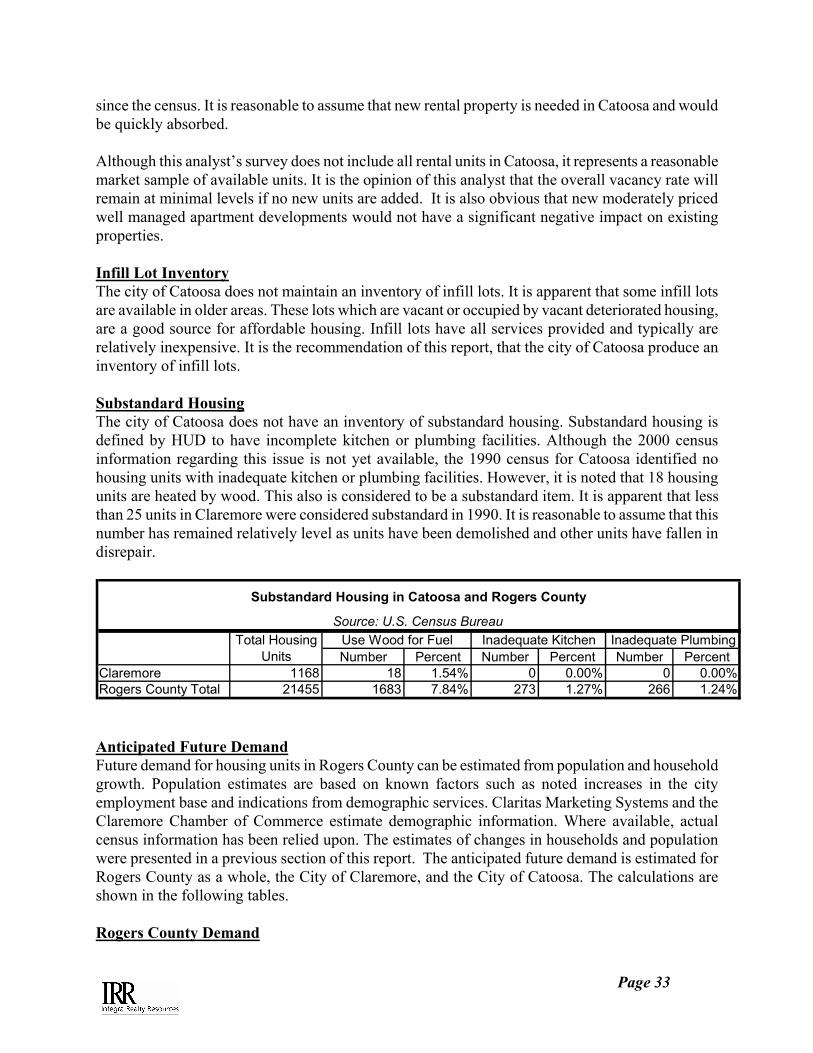
since the census. It is reasonable to assume that new rental property is needed in Catoosa and would be quickly absorbed. Although this analyst’s survey does not include all rental units in Catoosa, it represents a reasonable market sample of available units. It is the opinion of this analyst that the overall vacancy rate will remain at minimal levels if no new units are added. It is also obvious that new moderately priced well managed apartment developments would not have a significant negative impact on existing properties. Infill Lot Inventory The city of Catoosa does not maintain an inventory of infill lots. It is apparent that some infill lots are available in older areas. These lots which are vacant or occupied by vacant deteriorated housing, are a good source for affordable housing. Infill lots have all services provided and typically are relatively inexpensive. It is the recommendation of this report, that the city of Catoosa produce an inventory of infill lots. Substandard Housing The city of Catoosa does not have an inventory of substandard housing. Substandard housing is defined by HUD to have incomplete kitchen or plumbing facilities. Although the 2000 census information regarding this issue is not yet available, the 1990 census for Catoosa identified no housing units with inadequate kitchen or plumbing facilities. However, it is noted that 18 housing units are heated by wood. This also is considered to be a substandard item. It is apparent that less than 25 units in Claremore were considered substandard in 1990. It is reasonable to assume that this number has remained relatively level as units have been demolished and other units have fallen in disrepair.
Number Percent Number Percent Number PercentClaremore 1168 18 1.54% 0 0.00% 0 0.00%Rogers County Total 21455 1683 7.84% 273 1.27% 266 1.24%
Inadequate Kitchen Inadequate Plumbing
Substandard Housing in Catoosa and Rogers County
Source: U.S. Census BureauTotal Housing
UnitsUse Wood for Fuel
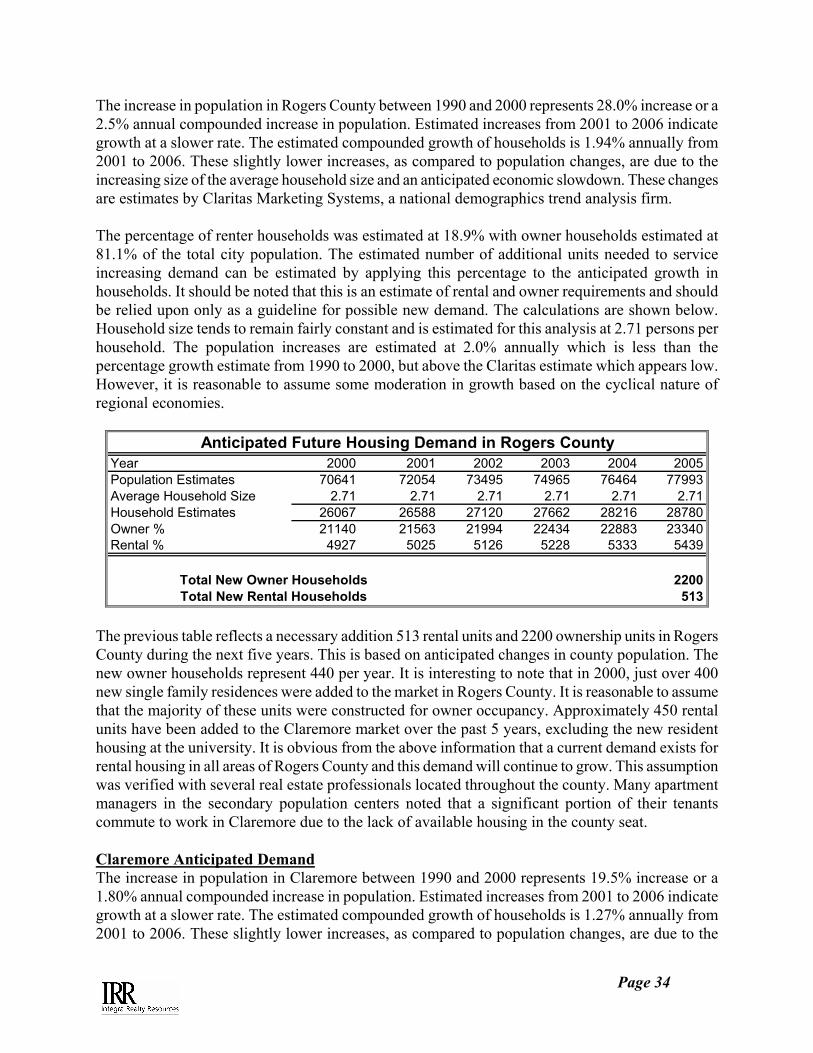
Anticipated Future Demand Future demand for housing units in Rogers County can be estimated from population and household growth. Population estimates are based on known factors such as noted increases in the city employment base and indications from demographic services. Claritas Marketing Systems and the Claremore Chamber of Commerce estimate demographic information. Where available, actual census information has been relied upon. The estimates of changes in households and population were presented in a previous section of this report. The anticipated future demand is estimated for Rogers County as a whole, the City of Claremore, and the City of Catoosa. The calculations are shown in the following tables. Rogers County Demand
Page 34
The increase in population in Rogers County between 1990 and 2000 represents 28.0% increase or a 2.5% annual compounded increase in population. Estimated increases from 2001 to 2006 indicate growth at a slower rate. The estimated compounded growth of households is 1.94% annually from 2001 to 2006. These slightly lower increases, as compared to population changes, are due to the increasing size of the average household size and an anticipated economic slowdown. These changes are estimates by Claritas Marketing Systems, a national demographics trend analysis firm. The percentage of renter households was estimated at 18.9% with owner households estimated at 81.1% of the total city population. The estimated number of additional units needed to service increasing demand can be estimated by applying this percentage to the anticipated growth in households. It should be noted that this is an estimate of rental and owner requirements and should be relied upon only as a guideline for possible new demand. The calculations are shown below. Household size tends to remain fairly constant and is estimated for this analysis at 2.71 persons per household. The population increases are estimated at 2.0% annually which is less than the percentage growth estimate from 1990 to 2000, but above the Claritas estimate which appears low. However, it is reasonable to assume some moderation in growth based on the cyclical nature of regional economies.
Year 2000 2001 2002 2003 2004 2005Population Estimates 70641 72054 73495 74965 76464 77993Average Household Size 2.71 2.71 2.71 2.71 2.71 2.71Household Estimates 26067 26588 27120 27662 28216 28780Owner % 21140 21563 21994 22434 22883 23340Rental % 4927 5025 5126 5228 5333 5439
2200513
Total New Owner HouseholdsTotal New Rental Households
Anticipated Future Housing Demand in Rogers County
The previous table reflects a necessary addition 513 rental units and 2200 ownership units in Rogers County during the next five years. This is based on anticipated changes in county population. The new owner households represent 440 per year. It is interesting to note that in 2000, just over 400 new single family residences were added to the market in Rogers County. It is reasonable to assume that the majority of these units were constructed for owner occupancy. Approximately 450 rental units have been added to the Claremore market over the past 5 years, excluding the new resident housing at the university. It is obvious from the above information that a current demand exists for rental housing in all areas of Rogers County and this demand will continue to grow. This assumption was verified with several real estate professionals located throughout the county. Many apartment managers in the secondary population centers noted that a significant portion of their tenants commute to work in Claremore due to the lack of available housing in the county seat. Claremore Anticipated Demand The increase in population in Claremore between 1990 and 2000 represents 19.5% increase or a 1.80% annual compounded increase in population. Estimated increases from 2001 to 2006 indicate growth at a slower rate. The estimated compounded growth of households is 1.27% annually from 2001 to 2006. These slightly lower increases, as compared to population changes, are due to the
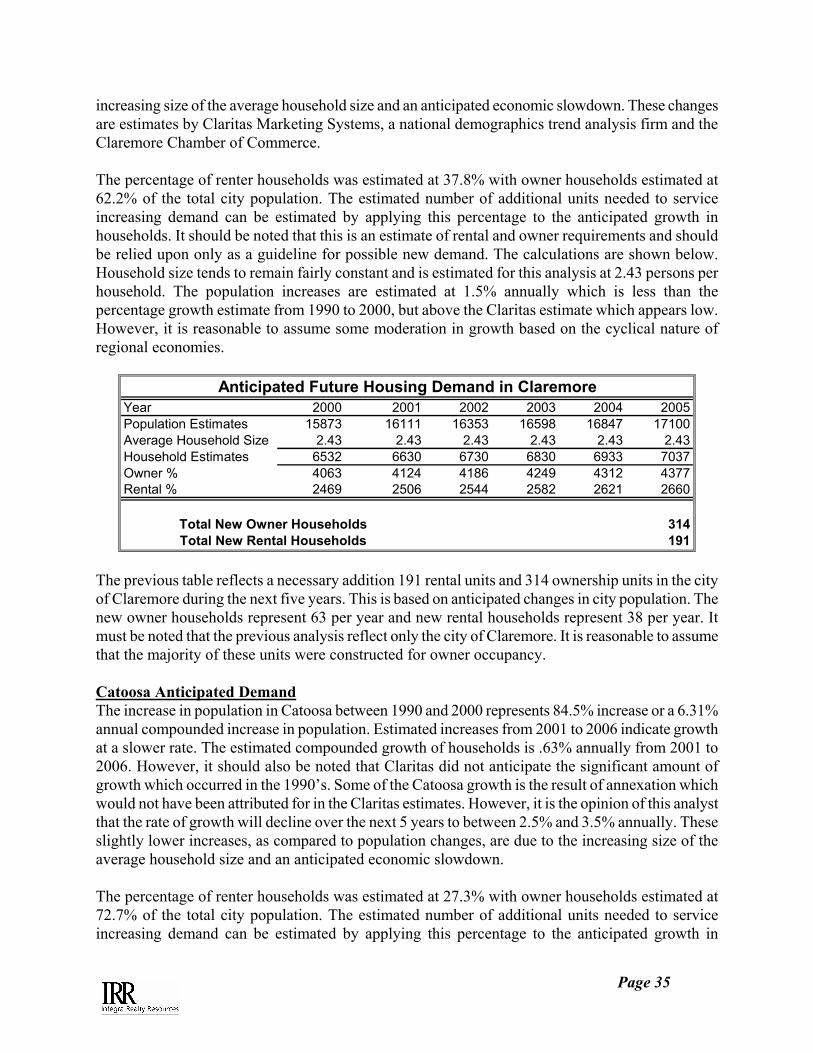
Page 35
increasing size of the average household size and an anticipated economic slowdown. These changes are estimates by Claritas Marketing Systems, a national demographics trend analysis firm and the Claremore Chamber of Commerce. The percentage of renter households was estimated at 37.8% with owner households estimated at 62.2% of the total city population. The estimated number of additional units needed to service increasing demand can be estimated by applying this percentage to the anticipated growth in households. It should be noted that this is an estimate of rental and owner requirements and should be relied upon only as a guideline for possible new demand. The calculations are shown below. Household size tends to remain fairly constant and is estimated for this analysis at 2.43 persons per household. The population increases are estimated at 1.5% annually which is less than the percentage growth estimate from 1990 to 2000, but above the Claritas estimate which appears low. However, it is reasonable to assume some moderation in growth based on the cyclical nature of regional economies.
Year 2000 2001 2002 2003 2004 2005Population Estimates 15873 16111 16353 16598 16847 17100Average Household Size 2.43 2.43 2.43 2.43 2.43 2.43Household Estimates 6532 6630 6730 6830 6933 7037Owner % 4063 4124 4186 4249 4312 4377Rental % 2469 2506 2544 2582 2621 2660
314191
Total New Owner HouseholdsTotal New Rental Households
Anticipated Future Housing Demand in Claremore
The previous table reflects a necessary addition 191 rental units and 314 ownership units in the city of Claremore during the next five years. This is based on anticipated changes in city population. The new owner households represent 63 per year and new rental households represent 38 per year. It must be noted that the previous analysis reflect only the city of Claremore. It is reasonable to assume that the majority of these units were constructed for owner occupancy. Catoosa Anticipated Demand The increase in population in Catoosa between 1990 and 2000 represents 84.5% increase or a 6.31% annual compounded increase in population. Estimated increases from 2001 to 2006 indicate growth at a slower rate. The estimated compounded growth of households is .63% annually from 2001 to 2006. However, it should also be noted that Claritas did not anticipate the significant amount of growth which occurred in the 1990’s. Some of the Catoosa growth is the result of annexation which would not have been attributed for in the Claritas estimates. However, it is the opinion of this analyst that the rate of growth will decline over the next 5 years to between 2.5% and 3.5% annually. These slightly lower increases, as compared to population changes, are due to the increasing size of the average household size and an anticipated economic slowdown. The percentage of renter households was estimated at 27.3% with owner households estimated at 72.7% of the total city population. The estimated number of additional units needed to service increasing demand can be estimated by applying this percentage to the anticipated growth in

Page 36
households. It should be noted that this is an estimate of rental and owner requirements and should be relied upon only as a guideline for possible new demand. The calculations are shown below. Household size tends to remain fairly constant and is estimated for this analysis at 2.72 persons per household. The population increases are estimated at 3.0% annually which is less than the percentage growth estimate from 1990 to 2000 but reasonable based on the location of the city, ongoing development, and anticipated economic growth. It is reasonable to assume some moderation in growth based on the cyclical nature of regional economies.
Year 2000 2001 2002 2003 2004 2005Population Estimates 5449 5612 5781 5954 6133 6317Average Household Size 2.72 2.72 2.72 2.72 2.72 2.72Household Estimates 2003 2063 2125 2189 2255 2322Owner % 1456 1500 1545 1591 1639 1688Rental % 547 563 580 598 616 634
23287
Total New Owner HouseholdsTotal New Rental Households
Anticipated Future Housing Demand in Catoosa
The previous table reflects a necessary addition 87 rental units and 232 ownership units in the city of Catoosa during the next five years. This is based on anticipated changes in city population. The new owner households represent 46 per year and new rental households represent 17 per year. It must be noted that the previous analysis reflects only the city of Catoosa. It is reasonable to assume that the majority of these units were constructed for owner occupancy. Summary and Conclusions The previous analysis has attempted to described the state of the residential housing market in Rogers County, Oklahoma. Where possible, information regarding the population centers of the county was included to assess need on a community level. Much of the information is based on demographic information from local authorities and national information services. However, personal interviews were performed with property the and owners and managers, real estate professionals, and community officials in an effort to substantiate information from the national organizations and understand current market conditions. Several important issues regarding housing have become apparent through this analysis and are identified below. Rogers County has undergone significant growth during the past several years in population and economy. The Claremore Chamber of Commerce states that Rogers County is one of the fastest growing counties in the state since 1990 and Claremore is one of the fastest growing cities with over 10,000 population in the state for the same period. Available population data support these claims. The county population has almost tripled since 1970. Since 1990, the county population has increased at an average annual rate of 2.8%. While growth has occurred throughout the county, Claremore, the county seat, has increased during the 1990’s at a rate of approximately 2.0% annually. This growth can be attributed to economic development of the industrial and commercial base, relatively low land prices for development, and easy access to employment centers or business
Page 37
opportunities in Tulsa. The Catoosa has also shown significant population increases. This is largely due to its location between telephone and Claremore Available 2,000 U.S. Census information reflected approximately twenty 27,476 housing units in the county. This is an increase of over 7,000 housing units since 1990 which indicates a percentage increase of approximately 37.4%. Based on available building permit information, the number of new single family residences has been increasing at a rate of approximately 1.5% for the past several years. The majority of these homes are “custom” built for a specific buyer. This is reflected by the average new home price of approximately $112,000 year 2000. This pricing trend is also consistent in home resale’s where average sale prices have increased significantly over the past several years. The average home value in the county in 1990 was estimated at $53,985. This increased to $87,313 in 2001, a 65% increase. This is based on Claritas estimates. Actual year 2,000 census data is not yet available for the average home value. However is apparent that values across the county have increased significantly for new and resale property. While significant new development has occurred, it is apparent that moderately priced housing marketed towards households at or below the median income level, does not reflect a large percentage of these new homes. The 2,001 median household income for Rogers County was estimated at $42,599. Typical mortgage requirements would allow a homeowner with this income a monthly payment of approximately $1,000 per month (excluding real estate tax or property insurance). This would justify a mortgage, based on current available terms, of approximately $150,000. These estimates justify much of the new county residential development. However, approximately 27.7% of the county households have a median income below $25,000 annually and 41.35% make less than $35,000 annually. These households could afford a significantly lower monthly living cost and based on the average new home cost may not have easy access to new single family home ownership. It is also important to note that although the family may be able to afford the monthly mortgage payment, a significant down payment would also be required to afford a house which costs well above $100,000. Some new ownership and rental property is being developed for the lower income groups. It is being done sporadically by indian tribes and affordable home developers throughout the county. The Delaware and Cherokee tribes have rental and ownership property in Catoosa, Claremore, and Inola. These properties are typically occupied based on income of the tenant. Although these developments provide housing for the lower income groups, tribe members are given preference for tenancy or ownership. The number of new or planned units in these programs is limited and will not noticeably increase overall supply or satisfy demand. A new affordable rental housing development is currently under construction in Claremore. This development is targeted towards moderate income families. Most other new rental housing in the county is market rate. The 2,000 U.S. census information estimated owner occupied housing vacancy at 1.9% and a rental vacancy rate of 8.2 percent. 81.1% of the housing units owner occupied and the remainder (18.9%) were renter occupied. Current surveys by this analyst revealed occupancy levels of rental and owner property at well over 95% in the population centers (Claremore, Chelsea, Catoosa, Oologah, and Inola.) Virtually all property managers and real estate professionals noted very little vacancy in rental units throughout the county.
Page 38
While some areas have rental developments under construction, it is apparent from building permit information that new multifamily housing development has been limited for several years. This is due to the cost ineffectiveness of development. New multifamily housing development costs in Tulsa recently are $60 to $70 per square foot of living area or $55,000 to $65,000 per unit. Rental rates of at least $.80/SF per month are required to financially justify new multifamily construction. This indicates $520/month for a typical one bedroom unit (650 SF) and $680/month for a typical 2 bedroom unit (850 SF). These costs assume that the tenant is responsible for partial utility payment. It is reasonable to assume that new multifamily development in Rogers County could be accomplished for significantly less cost due to cheaper land costs and by reducing property amenities. However, current market rental rates for apartments in Rogers County range around $300-$400 for one bedrooms and $400 to $600 for two bedroom units. The disparity between market rent and cost effective development rent is significant. The gap between current market rent and rents required to make development financially feasible should continue to close due to constant strong demand for rental units. However, new multifamily development is currently needed in all parts of Rogers County. Median income levels suggest that a portion of the population could afford the higher rental rates which support development. However, as with single family ownership development, a large percentage of the population would be excluded from new multifamily housing based on cost required rents. This indicates that in order for multifamily development to be economically feasible, developers must receive some financial incentive to build. In summary, it is apparent that new housing in several categories is required in Rogers County. While the upper end of the market is being satisfied, the lower end of the population which requires rental and moderate cost ownership property has a very limited product available. Demand for rental housing is currently strong in all areas of the county. As the population continues to grow, this demand will continue to increase. It is the opinion of this analyst that a significant need exists for rental housing in all price ranges. Additionally, single family ownership property is needed in the price ranges typically below $80,000.

Page 39
CERTIFICATION We, Owen S. Ard, MAI, and David Puckett, analyst, hereby certify that to the best of our knowledge and belief:
1. The statements of fact contained in this report are true and correct.
2. The reported analyses, opinions, and conclusions are limited only by the reported assumptions and limiting conditions, and are our personal, unbiased professional analyses, opinions, and conclusions.
3. We have no present or prospective interest in the property that is the
subject of this report, and have no personal interest or bias with respect to the parties involved.
4. Our compensation is not contingent upon the reporting of a predetermined
opinion or opinion that favors the cause of the client, the attainment of a stipulated result, or the occurrence of a subsequent event.
5. The analyses, opinions, and conclusions were developed, and this report
has been prepared, in conformity with the Uniform Standards of Professional Analysis Practice.
6. No one provided significant professional assistance to the person signing
this report.
7. As of the date of this report, Owen S. Ard has completed the requirements of the continuing education program of the Analysis Institute.
8. Neither the current or future employment and/or compensation of the
analysts is contingent upon a specific opinion or an opinion in a direction that favors the cause of the client, of the occurrence of a subsequent event.
9. This report may be reviewed by duly authorized committees of the
Analysis Institute.
10. INTEGRA Realty Resources – Tulsa has analyzed commercial real estate for over 13 years. The company has diligently completed assignments covering all types of property and analysis. The attached qualifications are further evidence of competency, and reflect an ability to proficiently analyze the subject property.
Housing Market Analysis Rogers County, Oklahoma
David Puckett Owen S. Ard, MAI Data Analyst Market Analyst This is certified copy # of the original report. The analyst does not warrant the validity of the certification without the original seal and his signature hereon.

PART IV: ADDENDA

ANALYST QUALIFICATIONS

QUALIFICATIONS OF ANALYST
EXPERIENCE: Principal of Integra Realty Resources - Tulsa, a full service valuation and consulting firm. Actively engaged in real estate valuation and consulting assignments since the 1984, Mr. Ard has performed appraisal services consisting of narrative and summary real estate appraisals, ad valorem tax protests, consulting, litigation support services, market and feasibility studies, reviews, market study analyses and appraisals in connection with allocation of tax credits, brokerage services for commercial and residential transactions, property management, and expert litigation testimony. All types of real property are encompassed - apartments, ranches, theaters, hotel/motel, multi-purpose and resort properties, golf courses, high-rise and garden office buildings, manufacturing facilities, warehousing and distribution centers, nursing homes, assisted living facilities, banks, shopping centers and malls, residential subdivisions, industrial parks, and sports arenas. Valuations and market studies have been prepared on proposed, partially completed, renovated and existing structures. Appraisals have been made for condemnation purposes, estates, mortgage financing, equity participation and due diligence support. Clients served include corporations, law firms, financial institutions, investment firms and public/private agencies.
PROFESSIONAL
ACTIVITIES:
Member: Appraisal Institute (MAI No. 9148) Member: Central Oklahoma Chapter, Appraisal Institute (Past Chapter President) Licensed: Oklahoma General Appraiser License No. 11245 Arkansas Certified Appraiser No. G-1301 Licensed:Oklahoma Real Estate License No. 122483 Member: National Association of Realtors Member: Urban Land Institute Member: Appraisal Institute National CommitteesDemonstration Reports Grading Subcommittee (1992- Present)
EDUCATION:
B.S.B.A. Degree, Marketing, University of Tulsa, Tulsa, Oklahoma (1984) Successfully completed numerous real estate related courses and seminars sponsored by the Appraisal Institute, accredited universities and others. Currently certified by the Appraisal Institute’s voluntary program of continuing education for its designated members.
QUALIFIED BEFORE
COURTS AND ADMINISTRATIVE BODIES:
District Court of Tulsa County, Oklahoma Tulsa County Board of Equalization Kansas Board of Tax Appeals United States Federal Bankruptcy Court, Tulsa, Oklahoma