the universe: size, origins, contents -...
TRANSCRIPT

Chapter 8
The universe: size, origins,contents
8.1 Introduction
The general and special theories of relativity discussed in the previous chap-ters are the tools currently used in the investigation and description of theuniverse. Most of the objects in the universe are somewhat mundane: stars,planets, rocks and gas clouds. Yet in many respects the universe is far frombeing a placid and peaceful place. There are stars which explode with theenergy of a billion suns, black holes with millions of times the mass of oursun which devour whole planetary systems, generating in one day as muchenergy as our galaxy puts out in two years. There are enormous dust cludswhere shock waves trigger the birth of new stars. There are intense burstsof gamma rays whose origin is still uncertain.
These phenomena are not infrequent, but appear to be so due to theimmense distances which separate stars and galaxies; for one of the mostimpressive properties of the universe is its size. The universe is so large thatjust measuring it is very difficult, and finding out the distance to variousobjects we observe can be a very complicated proposition.
In order to extract information about the universe a toolbox of methodshas been devised through the years. I will first discuss the most important ofthese methods, and with these I will describe how measure the universe anddiscuss its evolution. We need to determine sizes and distances because, aswe will see, they provide basic information about the history of the universe.
Most of the data we get from the universe comes in the form of light(by which I mean all sorts of electromagnetic radiation: from radio waves
1

2
to gamma rays). It is quite remarkable that using only the light we candetermine many properties of the objects we observe, such as, for example,their chemical composition and their velocity (with respect to us). In thefirst two sections below we consider the manner in which we can extractinformation from the light we receive.
But detecting light is not the only way to obtain information from theuniverse, we also detect high-energy protons and neutrons (forming the ma-jority of cosmic rays). The information carried by these particles concernseither our local neighborhood, or else is less directly connected with thesources: isolated neutrons are not stable (they live about 10 minutes), sothose arriving on Earth come from a relatively close neighborhood (this de-spite time dilation - Sect. ??). Protons, on the other hand are very stable(the limit on their lifetime is more than 1032 years!), but they are charged;this means that they are affected by the magnetic fields of the planets andthe galaxy, and so we cannot tell where they came from. Nonetheless themore energetic of these particles provide some information about the mostviolent processes in the universe.
In the future we will use yet other sources of information. Both gravi-tational wave detectors and neutrino telescopes will be operational withinthe next few years. Neutrinos are subatomic particles which are copiouslyproduced in many nuclear reactions, hence most stars (including our Sun)are sources of neutrinos. These particles interact very very weakly, and be-cause of this they are very hard to detect. On the other hand, the veryfact that they interact so weakly means that they can travel through veryhostile regions undisturbed. Neutrinos generated in the vicinity of a blackhole horizon can leave their native land unaffected and carry back to Earthinformation about the environment in which they were born.
8.2 Light revisited
In this section I will describe two properties of the light we receive and themanner in which it can be used to extract information about its sources.
8.2.1 The inverse-square law
A source of light will look dimmer the farther it is. Similarly the fartheraway a star is the fainter it will look; using geometry we can determine justhow a star dims with distance
Imagine constructing two spheres around a given star, one ten timesfarther from the star than the other (if the radius of the inner sphere is R,

3
the radius of the outer sphere is 10R). Now let us subdivide each sphere intolittle squares, 1 square foot in area, and assume than on the inner sphereI could fit one million such squares. Since the area of a sphere increasesas the square of the radius, the second sphere will accommodate 100 timesthe number of squares on the first sphere, that is, 100 million squares (all1 square foot in area). Now, since all the light from the star goes throughboth spheres, the amount of light going through one little square in the innersphere must be spread out among 100 similar squares on the outer sphere.This implies that the brightness of the star drops by a factor of 100, whenwe go from the distance R to the distance 10R (see Fig. 8.1).
Figure 8.1: Illustration of the inverse-square law: all the light trough the 1square-foot first area goes through the second one, which is 100 times larger,hence the light intensity per square foot is 100 times smaller in the secondarea. The intensity drops as 1/R2.
If we go to a distance of 20R the brightness would drop by a factor of400, which is the square of 20, for 30R there would be a decrease by a factorof 900 = (30)2, etc. Thus we conclude that
The brightness drops as 1/ (distance)2 . Light intensity drops as
1/ (distance)2 .
This fact will be used repeatedly below.

4
8.2.2 The Doppler effect
We have seen that light always travels at the same speed of about 300, 000km/s;in particular light emitted by a sources in relative motion to an observertravels at this speed. Yet there is one effect on light which shows that itssource is moving with respect to the observer: its color changes.
Imagine standing by the train tracks and listening to the train’s horn.As the train approaches the pitch of the blast is higher and it becomes loweras the train recedes from you. This implies that the frequency of the soundwaves changes depending on the velocity of the source with respect to you,as the train approaches the pitch is higher indicating a higher frequency andsmaller wavelength, as the train recedes from you the pitch is lower corre-sponding to a smaller frequency and a correspondingly larger wavelength.
This fact, called the Doppler effect, is common to all waves, includinglight waves. Imagine a light bulb giving off pure yellow light; when it movestowards you the light that reaches you eye will be bluer, when the bulbmoves away form you the light reaching your eye will be redder. If you havea source of light of a known (and pure) color, you can determine its velocitywith respect to you by measuring the color you observe. Qualitatively, ifone observes a redder color (longer wavelength than the one you know isbeing emitted) then the source is moving away from you, if bluer (shorterwavelength that the one you know is being emitted) the source is movingtoward you (see Fig. 8.2).If one observes a redder
color (longer wavelength
than the one you know is
being emitted) then the
source is moving away from
you, if bluer (shorter
wavelength that the one you
know is being emitted) the
source is moving toward you
The important point here is that knowing the frequency at the sourceand measuring the observed frequency one can deduce the velocity of thesource 1 If the source is moving sufficiently fast towards you the yellow lightwill be received as, for example, X-rays; in this case, however, the sourcemust move at 99.99995% of the speed of light. For most sources the shift infrequency is small.
8.2.3 Emission and absorption lines
When heated every element gives off light. When this light is decomposedusing a prism it is found to be made up of a series of “lines”, that is, theoutput from the prism is not a smooth spectrum of colors, but only a few ofthem show up. This set of colors is unique to each element and provides aunique fingerprint: if you know the color lines which make up a beam of light(and you find this out using a prism), you can determine which elementswere heated up in order to produce this light.
1More precisely this is the velocity along the line of sight,

5
Figure 8.2: Diagram illustrating the Doppler effect. The source is movingto the left hence a receiver on the right will see a red-shifted light while areceiver on the left will see a blue-shifted one. .
Similarly, when you shine white light through a cold gas of a given el-ement, the gas blocks some colors; when the “filtered” light is decomposedusing a prism the spectrum is not full but shows a series of black lines (corre-sponding to the colors blocked by the gas); see Fig. 8.3. For a given elementthe colors blocked when cold are exactly the same as the ones emitted whenhot.
The picture in Fig. 8.3 corresponds to a single element. For a realis-tic situation the decomposed light can be very complex indeed, containingemission and absorption lines of very many elements. An example is givenin Fig. 8.4.
After the discovery of emission and absorption lines scientist came to relyheavily on the fact that each element presents a unique set of lines: it is its Each element presents a
unique set of linesinimitable signature. In fact, when observing the lines from the solar light,it was found that some, which are very noticeable, did not correspond toany known element. Using this observation it was then predicted that a newelement existed whose absorption lines corresponded to the ones observedin sunlight. This element was later isolated on Earth, it is called Helium(from helios: sun).

6
Figure 8.3: Diagram illustrating emission and absorption lines: when lightgiven off by hot gas is decomposed using a prism it is shown to be made up ofcolored lines (emission lines). When white light shines trough a cold gas theresulting light , when decomposed is shown to have dark lines (absorptionlines). The emission and absorption lines for the same element match.
In following this line of argument one has to be very careful that the linesare not produced by any other element. This is complicated by the fact thatsome lines are observable only under extreme circumstances and one has totake them into consideration as well. For example, after the success of thediscovery of Helium, another set of lines (not so prominent) was isolated andassociated with yet another element, “coronium”. It was later shown thatthe coronium lines were in fact iron lines, which are clearly observable onlyin the extreme conditions present in the sun (one can also see them in thelaboratory, it’s just hard to do so).
8.2.4 A happy marriage
When observing stellar light from various distant stars (decomposed using aprism) it was found that, just as for the sun, they presented lines. But, cu-riously, these lines corresponded to no known element! This may imply thateach star carries a new set of elements, but the simplest hypothesis (whichshould be investigated first, see Sect. ??) is that the mismatch between the

7
Figure 8.4: Solar light decomposed by a prism exhibiting the emission andabsorption lines. At the top is one of the first of such measurements (1817);the curve above the lines denotes the intensity of the various colors, as ex-pected it is largest in the yellow. The second figure is a modern photographof the solar absorption lines.
laboratory and stellar lines is due to the Doppler effect which will shift thelines towards the red or blue according to the motion of the star (which isthe source in this case) with respect to Earth. One can then use the shiftin the observed stellar lines to determine the velocity at which the star ismoving (with respect to us) and also the elements in it. In one fell swoop Using spectral lines we can
determine both the speed of
the star and the elements in
it
we determine the constitution and the speed of the stars using only the lightwe get from it.
8.3 Cosmic distance ladder
Another important piece of information regarding objects in the universe istheir distance to us. This is not an easy thing to measure since these objectsare usually very far apart. I will measure distances in light years: one lightyear is the distance covered by light during one year, which is about 9.5trillion kilometers, or about 6 trillion miles.
8
In order to understand why several steps are needed in measuring dis-tances it is useful to consider a simple example. A student is in her roomsitting at her desk and would like to find the distance to the window; shegets a ruler and laboriously measures this distance to be 3 feet. This I willcall “the first rung in the student’s distance ladder”
Her next task is to find the distance to a building which she can seethrough the window. This building is too far away for her to use her 12 inchruler. What she does is to use sound: she notices that when she claps herhands outside her window there is an echo produced by the sound bouncingoff the building in front of her. She has a good watch and so she candetermine the time it takes for the sound to get from her window to thebuilding and back. Now, if she can determine the speed of sound, she coulduse the formula distance = speed × time to get the distance. In order tomeasure the speed of sound she closes her window and times the echo fromher desk to the window. Since we already knows the distance to the window(which she measured using her ruler) and she now knows the time it takessound to go from her desk to the window and back she can determine thespeed of sound. So, using the first measurement she determines the speedof sound and this allows her to measure things that are much farther away.In this way she has “constructed” the second rung in her distance ladder.
The same idea is used when measuring far away things in space: one findsa reliable method to determine the distances to near-by stars (the equivalentof using the ruler). Then one devises another method which requires a sortof calibration (the equivalent of determining the speed of sound); once thiscalibration is achieved the second method can be used to find distances toobjects that are outside the range of the first method. Similarly a third,fourth, etc. methods are constructed, each based on the previous ones.
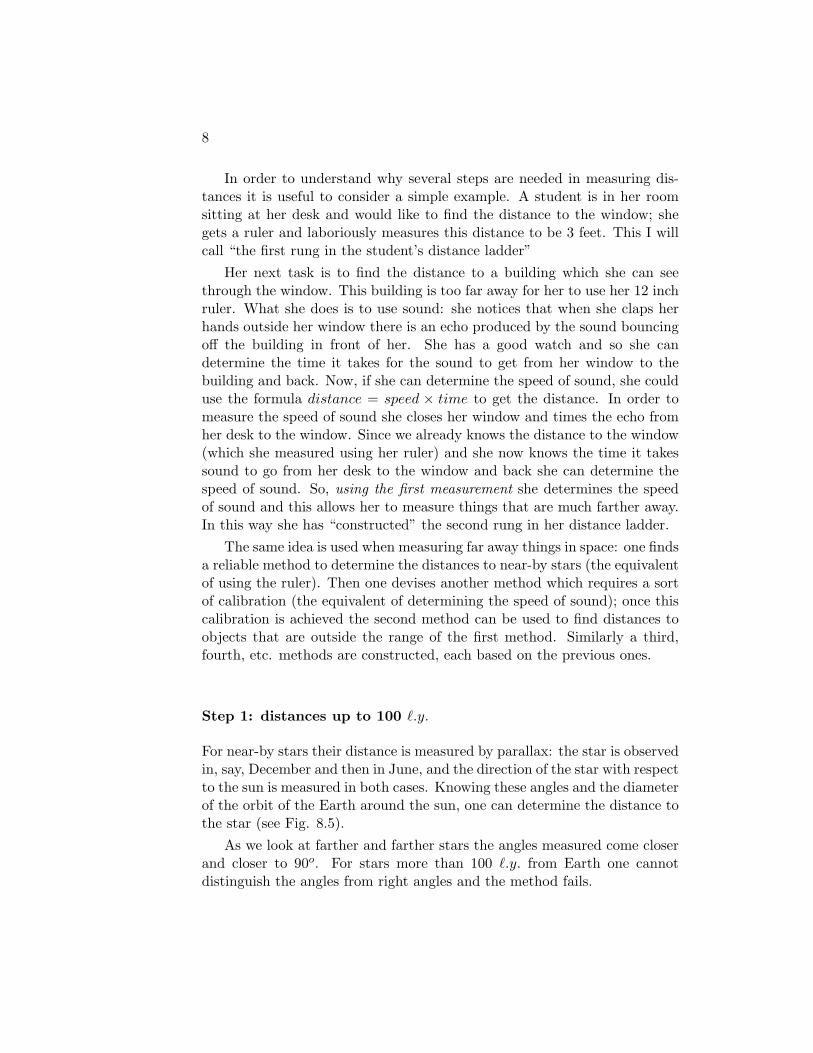
Step 1: distances up to 100 `.y.
For near-by stars their distance is measured by parallax: the star is observedin, say, December and then in June, and the direction of the star with respectto the sun is measured in both cases. Knowing these angles and the diameterof the orbit of the Earth around the sun, one can determine the distance tothe star (see Fig. 8.5).
As we look at farther and farther stars the angles measured come closerand closer to 90o. For stars more than 100 `.y. from Earth one cannotdistinguish the angles from right angles and the method fails.

9
Figure 8.5: Knowing the size of Earth’s orbit and measuring the angles ofthe light from the star at two points in the orbit, the distance to the starcan be derived. The farther the star is, the smaller the angles.
Step 2: distances up to 300,000 `.y.
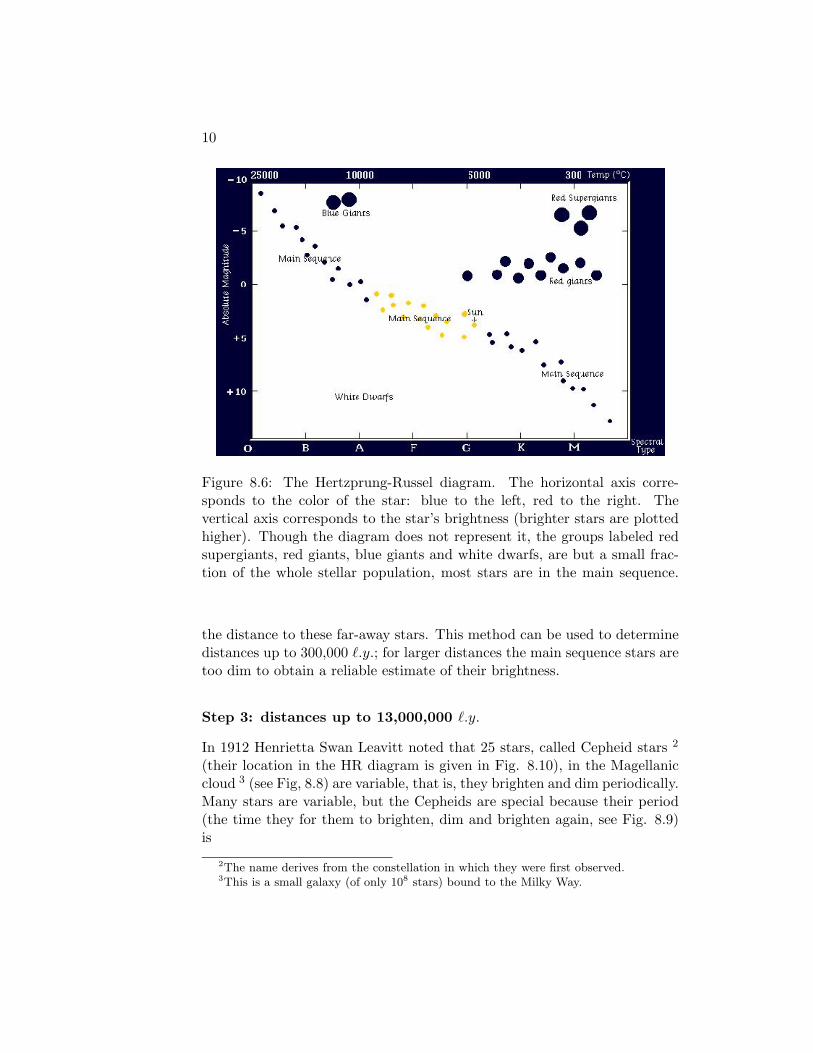
In the decade 1905-1915 Hertzprung and Russel observed a group of near-by stars whose distances they knew (using parallax). For each star theyrecorded its color and calculated its brightness as it would be measured ata distance of 1 `.y. (using the 1/(distance)2 law, see Sect. 8.2.1). Then theyplotted this brightness versus the color; what they found is that most stars(90% of them) lie on a narrow band in this type of plot which they calledthe main sequence (see Fig. 8.6).
Suppose we now obtain the HR plot for stars which are far away, say onthe other side of the galaxy, about 105 light years (1018 km). If we choosethese stars such that they are not too far apart (there are good astronomicalindicators for this) the distance from Earth to any such star will be moreor less the same. It is found that, as for the near-by stars, 90% of these farstars will again fall on a main-sequence strip in the color vs. brightness plot.
On the other hand all these stars are dimmer than the near-by starsoriginally used by H&R; the decrease in brightness is due to the fact thatbrightness drops as the square of the distance (Sect 8.2.1). Comparing thetwo main sequences (for near and far stars) as in Fig. 8.7, we can extract
10
Figure 8.6: The Hertzprung-Russel diagram. The horizontal axis corre-sponds to the color of the star: blue to the left, red to the right. Thevertical axis corresponds to the star’s brightness (brighter stars are plottedhigher). Though the diagram does not represent it, the groups labeled redsupergiants, red giants, blue giants and white dwarfs, are but a small frac-tion of the whole stellar population, most stars are in the main sequence.
the distance to these far-away stars. This method can be used to determinedistances up to 300,000 `.y.; for larger distances the main sequence stars aretoo dim to obtain a reliable estimate of their brightness.
Step 3: distances up to 13,000,000 `.y.
In 1912 Henrietta Swan Leavitt noted that 25 stars, called Cepheid stars 2
(their location in the HR diagram is given in Fig. 8.10), in the Magellaniccloud 3 (see Fig, 8.8) are variable, that is, they brighten and dim periodically.Many stars are variable, but the Cepheids are special because their period(the time they for them to brighten, dim and brighten again, see Fig. 8.9)is
2The name derives from the constellation in which they were first observed.3This is a small galaxy (of only 108 stars) bound to the Milky Way.

11
Figure 8.7: The Hertzprung-Russel diagram for the main sequence of nearand far stars. The comparison is used to determine the distance to the farstars.
i) regular (that is, does not change with time), and
ii) a uniform function of their brightness (at a 1 light-year distance). Thatis, there is relation between the period and brightness such that oncethe period is known, the brightness can be inferred.
Leavitt was able to measure the period by just looking at the stars andtiming the ups and downs in brightness,
But in order to obtain the brightness at the distance of one light year sheneeded to fist measure the maximum brightness on Earth and then, usingthe HR method, determine the distance from Earth to these stars (as itturns out, the Magellanic cloud is about 105 light years away from us).
What she obtained is that the brighter the Cepheid the longer its period,and that the relation between brightens and period was very simple: astraight line (Fig. 8.11). This means that the period and brightness areproportional to each other

12
Figure 8.8: The Magellanic Cloud
Figure 8.9: Illustration of the brightening and dimming of a variable star.
Measuring properties of the Cepheid variables. The color isno problem, you just observe the starlight through differentcolor filters and observe the intensity; ‘the’ color of thestar corresponds to the filter which lets pass the highestintensity light. The intensity at the distance of one lightyear is obtained by measuring the intensity on Earth andcalculating the distance to the star, then one uses the factthat the intensity drops as the square of the distance. Forexample, suppose we observe a star which has intensityof 1 (in some units), and which we know is at a 10 `.y.from Earth, then at a distance of 1 `.y. (which is 10 timessmaller) the intensity will be 100 times larger (the squareof 10 is 100) and so the intensity at the distance of 1 `.y.will be 100 (in the same units as before).

13
Figure 8.10: The location of the Cepheid variable stars in the Hertzprung-Russel plot.
These stars are quite distinct, reasonably abundant and very bright. Onecan identify them not only in our galaxy, but in many other galaxies as well.
If one requires the distance to a given galaxy one first locates the Cepheidvariables in this galaxy. From these observations one determines the periodof each of these stars. Leavitt’s data states that a given period has a uniquebrightness associated to it. So form the period and Leavitt’s plot we getthe brightness at the distance of one light year. We can also measure thebrightness on Earth. The brightness at the distance of one light year willbe larger than the observed brightness due to the fact that this quantitydrops like the square of the distance (Sect. 8.2.1). From these numbers onecan extract the distance to the stars. This method works up to 13 million`.y. when Earth-bound telescopes are used; for larger distances these starsbecome too dim to be observed.
Much more recently the Hubble telescope has used this same type of in-dicators to much farther distances (the Hubble is outside the Earth’s atmo-sphere and can detect much fainter stars). Looking at a galaxy in the Virgocluster (the galaxy is “called” M100), Wendy L. Freedman found (1994-5)that the Cepheid variables in this galaxy could be used to determine itsdistance; the result is 56 million `.y..

14
Figure 8.11: Relationship between the brightness and period of the Cepheidvariable stars.
Young Cepheids. Recent observations of Cepheid variablesin the galaxy M100 from the Hubble telescope have gen-erated some puzzling questions. Using these observations(and the General Theory of Relativity) it is possible to de-termine the age of the universe: we measure both the dis-tance and the velocity of these objects (with respect to us)and we can calculate the rate of expansion of the universe,from this we get the time it took to get to its present size.Curiously enough the age is in conflict with some other agedeterminations: some stars are older than the number ob-tained!How can this be resolved? There are several possibilities.one of the most likely ones is that, since the Cepheid is ob-served by the Hubble telescope are very far away, the lightwe get was sent out when the stars were quite young. But ithas not been shown that Leavitt’s data is also valid for suchteenage stars. It is quite possible that these stars have adifferent behavior and only settle into regular predictabilityonly as they become middle-aged.
15
Step 4: distances up to 1,000,000,000 `.y.
For larger distances run of the mill stars are of no use: they are too dim.There are, however, some stars which at the end of their life blow themselvesapart and, in doing so, become anomalously bright (out-shining a galaxyin many cases) for a brief period of time (less than a month); such anobject is called a supernova (for more details see Sect. ??). The uniquecharacteristics and enormous brightness of a certain type of supernova canbe used to determine distances beyond the reach of the previous methods.
There have been many measurements of the manner in which a super-nova, whose distance to Earth is known (using one of the previous methods),increases its brightness and then dims into oblivion. There is one type (calledtype Ia) for which this brightening and dimming is very regular: when themaximum brightness at a distance of 1 `.y. is calculated (using the knowndistance and the 1/distance2 rule), it is found to be the same for all cases 4.
If the distance to a far away galaxy is required, one must first locate atype Ia supernova in it (which do occur regularly) and then measure its ob-served brightness. Comparing this result with the known maximum bright-ness (at a 1`.y. distance) achieved by all such supernovae one can determinethe distance to the galaxy in question (again using the 1/distance2 rule).Since supernovae are extremely bright this method is useful to very largedistances, up to 109 `.y..
Step 5: distances beyond 1,000,000,000 `.y.
For very far objects none of the above methods work. The reason is inter-esting: since we are looking at very distant objects their light has taken avery long time to reach us, so the light we get must have left the object along time ago. Because of this the farther we look the earlier the imageswe get: looking far away is equivalent to looking back in time. When welook at the farthest obects we can see, what we get are images of their earlystages of their development.
In addition, since the brightness drops as the square of the distance,these far objects must also be very bright. From this it follows that themost distant objects we see are necessarily very bright and very young.
In order to determine the distances with any degree of accuracy we needto know the brightness at a distance of 1 `.y., but here we hit a stone wall:the only objects we see are much older than the ones we are interested in,
4In doing so astronomers must select type Ia supernovae that exhibit no abnormalities,else the measurements might be corrupted.

16
and we do not have a reliable theory of the way in which these things evolve,we have no way of calibrating our observations using any near-by objects.
It is here, in the observation of the universe at large, that the GeneralTheory of Relativity must be used to measure distances. How this is doneis described in the next section.
8.4 The relativistic universe
In everyday life there are many forces that strongly affect the world aroundus: friction, electric, magnetic, etc. But in the universe at large there is onlyone predominant force: gravity. It is gravity that determines the structureof the universe at large.
Figure 8.12: NASA Hubble Space Telescope image of the central portion ofa remote cluster of galaxies (CL 0939+4713).
The (visible) universe is filled with galaxies (see Fig.8.12) each containinga billion suns (more or less) tightly bound by their mutual gravitationalatraction. Because of this we can think of a galaxy as a solid object of agiven mass (in the same way that when you look at the gravitational pullof the Earth on the Moon you don’t have to worry about the fact that theyare made of atoms; the stars are the “atoms” which make up galaxies).

17
Magnitudes. The typical galaxy like the Milky Way hasmost of its stars in a central bulge of 104 `.y. diameteror less, where about 1011 sun-sized stars are concentrated.The pull of these stars on out Sun is 104 times stronger thanthat of the nearest sizable galaxy (Andromeda) which is atabout 2× 10⁶ `.y. away and also has about 1011 sun-sizedstars.
In this simplified picture the visible matter in the universe (that whichshines) is concentrated in a dusting of galaxies. In addition the universecan contain matter which does not shine, such as planet-sized objects, colddust and, perhaps, other more exotic objects (see Sect. 8.5.1). The universealso contains electromagnetic radiation: for example, stars continuously giveoff light and heat (infrared radiation) which then disperses throughout theuniverse (this is why we can see them!). Finally the universe contains asignificant amount of microwaves (see Sect. 8.4.2) and neutrinos, (see Sect.8.5.1), both relics from a very early time.
The first person to look at the cosmos through the eyes of the GeneralTheory of Relativity was Einstein himself. He took the above picture of auniverse filled with matter and radiation he added two assumptions
• Homogeneity: on average the universe looks the same from every van-tage point.
• Isotropy: on average the universe looks the same in every direction
These assumptions, though reasonable, still require justification; I will comeback to them. With these preliminaries one can solve the equations of theGeneral Theory of Relativity and find a description of the universe and themanner in which it evolves.
To Einstein’s initial surprise there were no steady solutions: the universeaccording to the General Theory of Relativity must expand or contract. Hecompared this result with the best observational data of the time and found,to his dismay, that the observations strongly favored a steady universe. Hethen made what he called “the greatest scientific blunder of my life”: hemodified the equations of the General Theory of Relativity by adding aterm that countered the expansion or contraction present in his initial so-lutions 5. With this ad hoc modification he did find a steady universe andwas (temporarily) satisfied.
5The modification amounts to the inclusion of a uniform cosmic pressure which balancesthe tendency to the universe to expand.

18
Not long afterwards Hubble published his now famous observations thatdemonstrated that our universe is, in fact, expanding; and the manner inwhich it expands agrees with the predictions of the solutions first obtainedby Einstein. It was then that Einstein, to his satisfaction, dropped hismodification of the equations. But this was not the end of this saga: theadded term, like the genie from the bottle, refused to disappear, showingup in many models (recent observations suggest that it must be includedin order to account for the observations). I will come back to this in Sect.8.5.2.
What Hubble did was to measure the red-shift of a group of galaxieswhose distances he knew (there were no blue-shifted galaxies, which meansthat these galaxies were receding from the Milky Way). Using the measuredred-shift and the formulas for the Doppler effect, he found the speed atwhich they receded. Then he made a plot ( called now a “Hubble plot”)of velocity vs. distance and found that, as predicted by the General Theoryof Relativity all points fall in a straight line (see Fig. 8.13); the slope ofthis line is called Hubble’s constant. General Relativity then predicts thatthe distance d to an object is related to its velocity v (both measured withrespect to the Earth) by
v = Ho d
which is called Hubble’s law and Ho is Hubble’s constant, its value is ap-General Relativity then
predicts that the distance dto an object is related to its
velocity v both measured
with respect to the Earth
by v = Ho d which is
called Hubble’s law and
Ho is Hubble’s constant
proximately
Ho =1
1.5× 10¹⁰years.
It is the above relation between distance and velocity that is used tomeasure distances beyond 109 `.y.: the final step in the cosmic distanceladder. Needless to say astronomers have verified Hubble’s law for distancesbelow 109 `.y. using supernovae (Sect. 8.3). In order to find the distanceto the farthest objects in the universe one first obtains their redshift and,using Doppler’s formulas, derives the velocity v of the object. The distanceis then v/Ho.
8.4.1 The expanding universe
All of Hubble’s (and subsequent) measurements indicate hat all galaxies arereceding from the Milky way and its neighbors. One might think that weare being ostracized by the universe as a whole, that the Milky Way hasbecome a cosmic pariah; but a little thought shows that this is not the case.According to General Relativity the universe is expanding, but this does

19
Figure 8.13: Illustration of Hubble’s law.
not mean that the galaxies and such are flying out into space, it means thatspace itself is growing, and in so doing, it increases the separation betweenthe galaxies. The classical example is to imagine a balloon with dots drawnon it; the balloon’s latex represents space, the dots represent the galaxies.As the balloon is inflated (space grows) the distance between the dots (thegalaxies) increases. An observer in any one dot would see the other dotsreceding from him/her (just as we see distant galaxies receding from us).
This universal expansion represents only the average motion of the galax-ies, the motion of a given galaxy can present deviations from this average.For example, galaxies which are close together are bound by their mutualgravitational pull and this distorts the Hubble flow.
The General Theory of Relativity predicts that the universe is not static,and observations confirm this indicating that it is expanding. Thus theuniverse must have been smaller in the past, and, following this idea to itslimit, must have been a point in its inception. Thus the universe began ata point, in the distant past and has been expanding ever since. The eventmarking this beginning is known (with a characteristic scientific flair forwords) as the Big Bang.
Just after the Big Bang the universe contained an extremely hot anddense soup of matter and energy (which are equivalent in the sense of the

20
Special Theory of Relativity) under which conditions any kind of objectwould melt almost instantaeously into its components. Yet the universeexpanded and cooled accordingly, and this cooling allowed for the formationof more and more complicated structures, ranging from atoms (300, 000years after the Big Bang) to Galaxies (109 years after the Big Bang) (seeFig. 8.16).
It must be remembered that the Big Bang represent the creation of theuniverse, including space and time. The Big Bang is not to be pictured as abig explosion somewhere out in space with galaxies being spewed out fromthe explosion region. Instead the picture provided by General Relativity isof the whole universe, including space, appearing at the Big Bang and ex-panding after that (like the balloon model described above). In this picturethe Big Bang occurred everywhere.The Big Bang occurred
everywhere.
And now what?
The universe expanding, but what will become of it? There are three pos-sible solutions to the equations of the General Theory of Relativity whichrepresent homogeneous and isotropic universes: either it will continue its ex-pansion forever, or it will eventually stop and re-contract or it will expandslowing down to a stop at infinite time. The contents of the universe (matterThe universe will continue
its expansion forever, or it
will eventually stop and
re-contract or it will expand
slowing down to a stop at
infinite time.
and radiation) determine which of these is realized in our universe. In allthree cases the shape of space remains the same as the universe expands (orin the second case, as it expands and contracts).
That the shape of space is determined by the amounts of matter andenergy in the universe is not surprising as it is matter and energy whichdetermine the curvature of space (see Sect. ??).
• Space in an eternally expanding or open universe is shaped like a 3-dimensional horse saddle. In this case the angles in a triangle add upSpace in an eternally
expanding or open universe
is shaped like a
3-dimensional horse saddle
to less than 180o.
• Space in a closed universe which will eventually re-contract is shapedlike a 3-dimensional sphere. In this case the angles in a triangle addSpace in a closed universe
which will eventually
re-contract is shaped like a
3-dimensional sphere
up to more than 180o.
• Space in a flat universe which expands slowing down to a stop atinfinite time is shaped like a 3-dimensional plane. In this case theSpace in a flat universe
which expands slowing
down to a stop at infinite
time is shaped like a
3-dimensional plane
angles in a triangle add up to 180o.
These possibilities are illustrated in Fig. 8.14.

21
Figure 8.14: The three possible shapes of a homogeneous and isotropic uni-verse: a closed universe (left), a flat universe (center) and open universe(right). See the text for an explanation.
These three possibilities give the average shape of space. Individualmasses produce local bumps and troughs. This is similar to the way we talkabout the Earth: we say it is a sphere, though we know it is full of bumps(for example, Himalayas) and troughs (the Dead Sea, for example).
Of these possibilities the one corresponding to our universe is determinedby the amount of matter in the cosmos. If there is very little the initialthrust from the Big Bang will never be stopped, if however there is a largeamount of matter, the mutual gravitational pull will be sufficient to breakthe expansion and eventually cause a re-contraction. Hence there is a criticalamount of matter such that if our universe has more it will re-contract, ifless it will expand forever (if it has precisely the critical amount it willexpand forever slowing down to a stop at infinite time). These possibilitiesare illustrated in Fig. 8.15.
The obvious question is then: how much stuff is in the universe? And tothat we can say: we don’t know. If we count all the matter that shines (starsand such) we get a number very low compared to the critical value. But, ismost of the matter shining? Could it not be that there is a lot of dust outthere? The latest results suggest that the universe will expand forever, butat present its ultimate fate is unknown.
8.4.2 The Microwave Background Radiation
General Relativity not only provides a nice history of the universe, but italso points out viable measurements which can support its validity. Themost important is the so-called Microwave Background Radiation.
When the universe began the density and temperature of the initial fire-ball was so high that all matter dissociated into its primary components.Note also that in this initial setting the force of gravity was enormous. Asthe expansion progressed the universe cooled and the initial fundamental

22
Figure 8.15: The universe might expand forever or will re-contract
constituents formed increasingly more complicated objects. This is so be-cause when the temperature is very high everything is jiggling very fast andanything that can be dissociated will; as the temperature drops so does thejiggling and, eventually, composite structures can form and survive. Thus, ifwe had been able to film the contents of the universe as it cooled, and thenrun the film backwards we would first see atoms which are then broken apartinto nuclei and electrons by the intense heat, then we would see the nucleithemselves decomposing into protons and neutrons, then the protons andneutrons decomposing into quarks 6. The microwave background radiationis a messenger from this primordial soup.
To understand how why is this microwave radiation present and how itwas generated I need to talk a bit about the way charged bodies interactwith light. Remember now that light is described by the same equations thatdescribe the physics of electric charges (Maxwell’s equations), this suggests(and it is true) that light will interact with charged objects. In fact thisis how your skin gets hot when exposed to the sun: your skin is composedof molecules which are made of atoms. Atoms in their turn are composedof a small heavy nucleus (with positive charge) surrounded by a cloud of
6There are many hypotheses about the way the universe looked at times before that ofquark formation, but none has been accepted yet this is an area of active research.

23
Figure 8.16: Abbreviated history of the universe according to the Big Bangmodel.
negatively charged light particles, the electrons. When light shines on yourskin it is absorbed by the electrons which get agitated, and it is this agitationwhich you perceive as heat. This is not as efficient as it might be because theelectrons are not free, they are inside atoms, so that on average the atomsare neutral. Much more light would be absorbed by a set of free electrons.This also works in the reverse: if you jiggle electrons sufficiently rapidly theywill give off light, this is how a light-bulb works.
Suppose now that you have a box with perfectly reflecting walls andwhich are kept very hot. Into that box we introduce a bunch of electronsand nuclei and also light. Assume that the system is so hot that the electronsare not bound to the nuclei: as soon as they come close they are wrenchedapart by the intense heat of the environment. So, on average, what you seeis a bunch of charged particles and light running amok. In this case light isconstantly being absorbed and emitted by the electrons and nuclei.
Now imagine that you cool the box by making it larger. Eventuallythings will get cold enough for the electrons to stay attached to the nuclei,the heat is not sufficiently high for them to be wrenched apart. At this pointthe rate at which light is absorbed and emitted drops rather suddenly fornow the particles in the box are neutral (on average). From this point onlight will just stream forth unimpeded (until it is reflected by a wall).
This is precisely what happens in the universe. After the big bang therecame a point where electrons and nuclei were formed. They were immersedin intense electromagnetic radiation (light, X-rays, gamma rays, etc.). Astime progressed and the expansion of the universe continued, the systembecame cooler (much as for the box when we increased its size). Eventually apoint was reached where the universe was cool enough for atoms to form andfrom this moment on most of the radiation just streamed forth unimpeded.

24
This happened when the universe was a mere 300,000 years old.So, can we see this relic of the ancient universe? The answer is yes!
But before we look for it one thing must be kept in mind. The universehas been getting bigger and bigger and less and less dense. This impliesthat the average gravitational force is getting smaller with time. So theradiation, from the moment it no longer interacted with the newly formedatoms has been shifting from an environment where gravity’s force is large tothat where gravity is small and, using (again!) General Relativity, it must bered-shifted. In fact the prediction of General Relativity is that this radiationshould be seen mostly as microwaves...and it has been seen. This predictionis not only of the existence of this relic radiation, but also how this radiationdepends frequency . These predictions have been confirmed to great accuray(see Fig. 8.17). This ubiquitous sea of radiation that permeates the cosmosis called the microwave background radiation.
The microwave background radiation was created in approximately thesame environment everywhere (remember that it came from an epoch inwhich everything was a very homogeneous hot mixture of nuclei and elec-trons) and because of this we expect it to look the same in every direction.This is precisely what happens, but, as it turns out, it is too much of agood thing: the microwave background radiation is the same everywhereto a precision of 0.1%, and understanding this presents problems, see Sect.8.5.3.
But one can go even farther. Even though the microwave backgroundradiation is very homogeneous, there are small deviations. These representinhomogeneities in the universe at the time radiation and atoms stoppedinteracting strongly. These inhomogeneities provide a picture of the universein its most tender infancy, see Fig. 8.18. As the universe expands and coolsatoms will conglomerate into stars and stars into galaxies; the initial seedsfor this process to start are these inhomogeneities. They correspond toregions where the matter was slightly mode dense than the average, andwill, in the eons that follow, attract other matter to form the structures wesee today.
It is very hard to explain the microwave background radiation by anytheory other than the Big Bang. It represent one of its biggest successes.
8.4.3 Nucleosynthesis
The most abundant element in the universe is Hydrogen, the second mostabundant element is Helium. A great success of the Big Bang theory is tobe able to predict the relative amounts of these elements: after the universe

25
Figure 8.17: Radiation relics from the epoch shortly after the Big Bang. Thehorizontal axis corresponds to the frequency of the radiation, the verticalaxis to the intensity. The measurements fall precisely on the curve.
cooled down sufficiently protons and neutrons were able, after a collision,to remain in the form of heavier atomic nuclei, in this manner Helium andLithium were created, and also Deuterium (whose nucleus has one protonand one neutron). The universe was 1s old, its temperature was 1010oK.
It was initially thought that all elements would be generated by the BigBang, but this is not the case: even at the extreme temperatures availablewhen Helium and Lithium nuclei were crated, this was not enough to smashtwo Helium nuclei to create something heavier, the creation of the remainingelements of the periodic table had to await the appearance of the first stars(see Sect. ??). Deuterium and Lithium, while used up in stars throughthe nuclear reactions that make them shine (see Sect. ??), are very rarelycreated by them . Whatever Deuterium and Lithium we see in nature wascreated about 15 billion years ago. Most of the Helium we observe (eventhough it is manufactured in stars) also came from that epoch.
The Big Bang theory predicts is the relative amounts of Helium andLithium and Deuterium and Hydrogen. And the observations match the The Big Bang theory
predicts is the relative
amounts of Helium and
Lithium and Deuterium and
Hydrogen
predictions; for example there are about 4 atoms of Hydrogen for each oneof Helium. These same calcualations predict that there are 3 light neutrinos,
The Big Bang theory
predicts that there are 3
light neutrinos

26
Figure 8.18: Inhomogeneities in the microwave background radiation. Thesegive an idea of the way the universe looked shortly after the Big Bang.
again confirmed by observation.Coupled with our understanding of stellar processes and evolution (Sects.
?? and ??) we now understand the manner in which all elements in theperiodic table were created. This is one of the most important predictionsWe understand the manner
in which all elements in the
periodic table were createdof modern cosmology.
8.5 At the cutting edge
Up to now all the results presented are well accepted and verified. Thereis little doubt that the General Theory of Relativity provides an excellentdescription of the universe at large, nor that the universe is currently ex-panding. Yet there are several puzzling results...
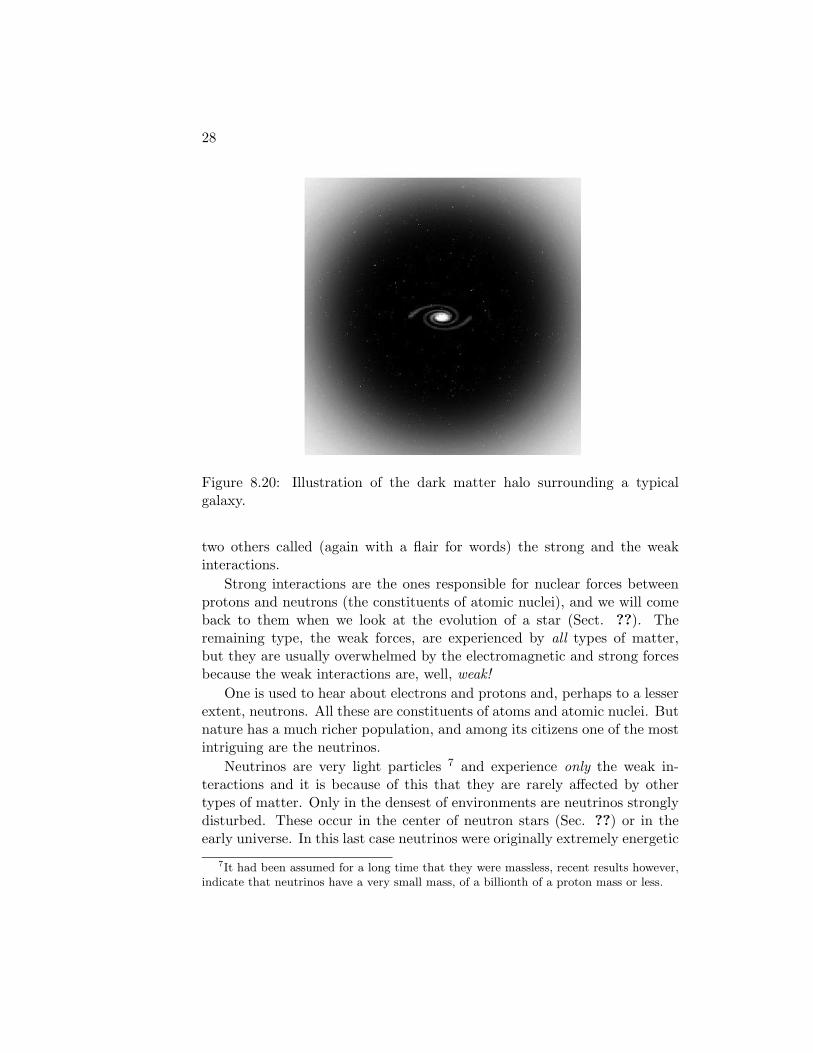
8.5.1 Dark matter
When considering the universe we observe only what we can see. Nonethe-less there are strong indications that there is something more. Supposeyou look at how stars in the outskirts of a galaxy move. Since gravity de-creases with distance one would expect that the stars would slow down asthe distance to the galaxy center increases, but this is not what is seen: thespeed of these outlying stars appears to be constant (see Fig. 8.19). Thisis explained by assuming that the galaxy is in fact surrounded by a mass of

27
matter which emits no or very little light, the so-called dark matter. In fact,calculations show that if this hypothesis is correct, this kind of matter is themain ingredient of galaxies, and perhaps the whole universe; an illustrationof the “dark matter halo” surrounding a typical galaxy is given in Fig. 8.20
Figure 8.19: Rotation curve for stars in the Andromeda galaxy. The velocitybecomes constant far away from the center suggesting the presence of darkmatter.
What is this dark matter? No one knows! Is it perhaps a very largenumber of rocks, or planets? Is it something else? Or, maybe, is there acompletely new effect which we interpret as dark matter while in reality thereare new forces in action? The only recent answer is that there are strongindication that there are large numbers of planet-like objects in the vicinityof our galaxy. But these are not nearly enough to account for the wholeeffect. Many experiments are under way aiming at detecting the nature ofdark matter (and it very existence).
Neutrinos
The early universe produced electromagnetic radiation which reaches us inthe form of microwaves. This radiation was the result of the electromagneticinteractions among charged particles. There are, however, other types ofinteractions. We already met the gravitational interaction, and there are
28
Figure 8.20: Illustration of the dark matter halo surrounding a typicalgalaxy.
two others called (again with a flair for words) the strong and the weakinteractions.
Strong interactions are the ones responsible for nuclear forces betweenprotons and neutrons (the constituents of atomic nuclei), and we will comeback to them when we look at the evolution of a star (Sect. ??). Theremaining type, the weak forces, are experienced by all types of matter,but they are usually overwhelmed by the electromagnetic and strong forcesbecause the weak interactions are, well, weak!
One is used to hear about electrons and protons and, perhaps to a lesserextent, neutrons. All these are constituents of atoms and atomic nuclei. Butnature has a much richer population, and among its citizens one of the mostintriguing are the neutrinos.
Neutrinos are very light particles 7 and experience only the weak in-teractions and it is because of this that they are rarely affected by othertypes of matter. Only in the densest of environments are neutrinos stronglydisturbed. These occur in the center of neutron stars (Sec. ??) or in theearly universe. In this last case neutrinos were originally extremely energetic
7It had been assumed for a long time that they were massless, recent results however,indicate that neutrinos have a very small mass, of a billionth of a proton mass or less.

29
but, just as in the case of radiation, there came a time when the universeexpanded to the point that the environment wasn’t dense enough for theneutrinos to be affected by it. From that point on the neutrinos have beenjust cruising along, interacting only very rarely.
Initially these neutrinos lived in a very hot environment, which impliesthat each of them had a lot of energy and they were in a situation wherevery large gravitational forces were present. Nowadays they are in an envi-ronment where the gravitational forces are very weak. To understand whatthis implies consider the following analogy.
Imagine that you throw a ball up from the earth: initially the ball hasa lot of kinetic energy, that is, energy due to its motion, but as it rises itslows down losing kinetic energy. Of course, this energy does not disappear,it is stored in potential energy (see Fig. 8.21). As the ball falls it will pickup speed so that when you catch it will be moving at the initial velocity (orclose to it). In the same way the neutrinos in the present universe will havelost most of their kinetic energy.
Figure 8.21: Neutrinos from the early universe have smaller kinetic energynow than in earlier epochs just as a baseball has lower kinetic energy thefarther it is from Earth.
So another prediction of the Big Bang theory is that the universe isfilled with neutrinos of very small kinetic energy. Unfortunately, out current

30
technology is not sufficiently sophisticated to be able to detect them directly,but this might improve in the future.
8.5.2 The cosmological constant
When Einstein first studied the universe at large using the General Theory ofRelativity he discovered that his equations predicted a universe which waseither expanding or contracting, and this was contradicted with the bestastronomical observations at the time. He then modified his equations tosatisfy the observations. This modification corresponds to the assumptionthat the whole universe is permeated with a constant pressure (which inhis case balanced the expansion yielding a steady universe). this universalpressure is called the cosmological constant
Though subsequently the data showed that the universe is in fact ex-panding and Einstein rejected the modification, on a philosophical basis thequestion still remains whether the measured cosmological constant is indeedzero (remember that on philosophical grounds Aristotle rejected heliocen-trism: one must eventually back assumptions with observations). For manyyears the best value for the cosmological was assumed to be zero since nomeasurement gave positive indication to the contrary. Yet even a very smallpressure can be important if it permeates the whole universe.
For many years the best value for the cosmological was assumed to bezero since no measurement gave positive indication to the contrary. Yet evena very small pressure can be important if it permeates the whole universe.
Recent measurements of the expansion rate of the universe (see Sect.8.4.1) using type Ia supernovae (Sect. 8.4.1) favor an open universe witha small but non-zero cosmological constant. If these results are confirmed,Einstein’s “blunder” will prove to be one more piece in the jigsaw of nature.:
8.5.3 Homogeneity and isotropy
One of the central simplifying assumptions of Einstein’s cosmology is that,on average, the universe is the same in every direction (isotropy) and in everylocation (homogeneity). this does not mean, however, that the universe isa boring tapioca-like thing. The distribution of galaxies is far from smoothwith most of them concentrated in relatively narrow sheets separated bylarge voids, see Fig. 8.22. The situation is reminiscent of a series of soapbubbles where the soapy water corresponds to the galaxies, the air insidethe bubbles to the voids.

31
There are a few hipotheses which explain the origin of this type of struc-ture. These must account not only for the voids, but also for the inhomo-geneities in the comsic background radiation; and they must also predict areasonable time-line for the development of galaxies. All these constraintsare difficult to satisfy, making this an area of very active current research.
Figure 8.22: Large scale bubble-like structures in the universe. The imagecontains about 4000 galaxies each representing one luminous point.
Inflation
When we look at the microwave background radiation it looks the same inevery direction, even from opposite sides of the sky, to a precision of 0.1%.Since they are so nicely correlated one would naturally assume that at sometime all points in the observable universe were in close contact with eachother, for otherwise it would be an unbelievable coincidence for all of themto look so much the same (at least through a microwave detector).
Now, a perfectly reasonable question is whether the Big Bang model hasthis property: will the Big Bang model predict not only the existence ofthe microwave background radiation, but also its exquisite uniformity? Theanswer is “yes” but only with additional assumptions.
This seems confusing: is the Big Bang theory to be modified and tunedevery time a new piece of data comes along which does not agree with its

32
predictions? Isn’t this cheating? Doesn’t this sound like Ptolemy addingepicycles every time things weren’t quite accurate?
Fortunately this is not the case. The Big Bang theory determines theevolution of the universe provided the matter and energy content is known,and their behavior at very extreme conditions is well understood. The factis, however, that we are not certain of all the matter and energy in the uni-verse, nor do we know, for example, how they behave at temperatures above1015 oK. Hence these “modifications” of the Big Bang theory correspond todifferent hypothesis of the behavior of matter at very high temperatures anddensities, not of the general description provided by the General Theory ofRelativity.
The simplest version of the Big Bang model which predicts a very uni-forms microwave backgound goes by the way of Inflation. The idea is thefollowing: the simplest way of getting uniform background radiation is if allthe observable universe was in very close contact at an early time. Grantedthat, inflation provides a mechanism for increasing the size of this initiallytiny region to the very large universe we see. Though mathematically in-volved what is assumed is that at a very time (about 10−35s after the BigBang) a new force comes into play which forces an exponential increase inthe size of the universe (hence the name ‘inflation’). After a fraction of asecond this force is balanced by other interactions and the universe resumesa more dignified, if ponderous, expansion (see Fig. 8.23).
Figure 8.23: Time evolution of the size of the inflationary universe
One tantalizing conclusion derived from the inflationary hypothesis is

33
that there are regions in the universe which we have not yet seen and whichmight look very different. Since no light has reached us from those regionswe are currently unaware of their existence, only our inheritors will see thelight coming from these distant reaches of the universe.
It is a challenge for current researchers to produce models that generatethe intergalactic voids, yet with the same amount of dark matter requiredto understand the rotation of stars (Sect. 8.5.1) and using the inflationhypothesis such models actually exist. The corresponding computer simu-lations produce results such as the one shown in Fig. 8.24 which should becompared to the observations (Fig. 8.22).
Figure 8.24: Simulation of the generation of structures in the universe as-suming the presence of dark matter and an early epoch of inflation.
8.5.4 Summary
Though the General Theory of Relativity has produced a generous amount ofverified predictions, its application to the universe at large has also generateda set of puzzles which, coupled to recent observations, are the topics ofintense research. Whether there is a cosmological constant, whether theuniverse is filled with dark matter and the nature of this stuff and whetherour current models of the universe are accurate enough to understand physicsto the very earliest of times are issues currently addressed by researchers.The near future will provide more puzzles and some answers leading us, wehope, to a better understanding of the universe, our home.