the unctad trade policy simulation model a...
TRANSCRIPT

UNITED NATIONS CONFERENCE ON TRADE AND DEVELOPMENT
THE UNCTAD TRADE POLICY SIMULATION MODEL
A note on the methodology, data and uses
Sam Laird and Alexander Yeats
No. 19

The opinions expressed in this paper do not necessarily reflect those of the UNCTAD secretariat. Comments on this paper are invited and should be addressed to the author, c/o the Chairman, UNCTAD Editorial Advisory Board, Palais des Nations, 1211 Geneva 10, Switzerland. Additional copies of this paper may be obtained on request.

THE UNCTAD TRADE POLICY SIMULATION MODEL
A note on the methodology, data and uses
Sam Laird and Alexander Yeats Geneva October 1986 GE.86-57273

CONTENTS Section Page PREFACE INTRODUCTION 1 I. THE BASIC DATA AND PARAMETERS 4 A. Tariffs 4 B. Non-tariff barriers 5 C. Imports 9 D. Market penetration data 10 E. Elasticities 11 F. Concordances 13 II. USES OF THE MODEL 14 III. FUTURE WORK ON THE MODEL 16 IV. CO-OPERATION WITH OTHER ORGANIZATIONS 18 ANNEX I: TECHNICAL DESCRIPTION OF THE UNCTAD TRADE
POLICY SIMULATION MODEL 20 ANNEX II: PRIMARY SOURCES FOR ESTIMATES OF THE TARIFF EQUIVALENTS OF NON-TARIFF BARRIERS 26 ANNEX III: ILUSTRATIONS OF SIMULATIONS MADE WITH THE UNCTAD MODEL 27 Table A1: Grains to developing countries of trade liberalization through
reduction to zero of tariffs in 20 DMECs, and (b) reduction to zero of tariffs and certain non-tariff barriers (NTBs) in EEC, Japan and the United States; 29
Table A2: Increases in imports by EEC from preference-receiving countries through MFN liberalization of tariffs and non-tariffs barriers; 30 Table A3: Actual values and projected changes in exports and trade balances for selected developing countries due to the adoption of a GSTP; 31 Table A4: Projected changes in the structure of developing countries’ intra-trade in primary and processed commodities under preferential tariffs; 32 Table A5: Analysis of the influence of a debt-related trade liberalization on the export of all and selected developing countries. 33

THE UNCTAD TRADE POLICY SIMULATION MODEL
A note on the methodology, data and uses
Sam Laird and Alexander Yeats1
PREFACE This note has been prepared in response to numerous requests from individual member
States of UNCTAD, from other international organizations and from academic institutions for detailed information on the methodology and the data used in the UNCTAD Trade Policy Simulation Model (TPSM).
The model has been used principally in connection with UNCTAD's work on protectionism and structural adjustment as well as in evaluating various proposals for a Global System of Trade Preferences (GSTP) among developing countries. The results have been published mainly in the Trade and Development Report, various documents for UNCTAD's Trade and Development Board and technical working notes on the GSTP. For technical reasons, it was not possible to give a full description of the model and data sources in such documents which are of a policy nature and restricted in size.
The model has also been used to provide information on the direct trade effects of various possible trade liberalization scenarios to member States of UNCTAD and other international or-ganizations, notably UNIDO and the World Bank. In this connection, it is felt that the model will be of major practical importance in helping developing countries to assess quantitatively the implications of proposals for trade liberalization in any future multilateral trade negotiations (MTN), or to assist in evaluating the likely effects of changes in developed countries' generalized system of preference (GSP) schemes. In addition, the UNCTAD secretariat has employed the model in quantifying the potential for alleviating developing country debt burdens through trade liberalization initiatives.
The work on the model is ongoing, both with respect to the updating of the data and to the model itself. The present note, therefore, is representative only of the current situation (April 1986). Future readers are invited to consult the authors concerning revisions.
Comments on data and methodology are welcomed, particularly suggestions for improvement. The authors would also appreciate hearing from researchers who are conducting studies into the restrictiveness of non-tariff barriers.
1 The authors are Economic Affairs Officers, in UNCTAD, Geneva. The views expressed in this paper are those of the authors and do not necessarily reflect the views of the United Nations, or its staff.
1
INTRODUCTION
1. The model used by UNCTAD to estimate various effects of commercial policy changes, in-
cluding changes in tariff rates and the incidence of non-tariff distortion of international trade, may be
described technically as an ex ante partial equilibrium model, measuring the first-round effects of the
simulated policy changes. (See Annex I for a full technical description). The UNCTAD model is in
the same class as that used by Cline et al. at The Brookings Institution to analyze the effects of the
Tokyo Round, by the International Monetary Fund to quantify the effects of trade liberalization
initiatives on developing country export earnings, and by Sapir and Baldwin to analyze the effects of
the Tokyo Round on India.2
2. The most important calculations in the simulations relate to the direct trade effects. Two distinct
effects are calculated:
(1) The trade creation (or loss) effect resulting from the changed level of domestic demand for
imports from a particular trading partner caused by the changed price of the imported good
after the tariff change or relative to the price of the domestically produced substitute (it is
assumed that the price change would fully reflect the tariff change, i.e. that the benefits of the
tariff change would be passed on to consumers); and
(2) The trade diversion effect - the substitution of goods coming from one set of foreign suppliers for
goods from another set of foreign suppliers. This results from the changes in the relative import
prices (after payment of duties) of goods from the different sets of foreign suppliers as a
consequence of changes in the differential in the rates which they face. This can occur through
changes in the MFN rate, the preference rate, if any, or both. If a preference rate for one set of
countries is introduced or reduced while the other set of countries continues to face
2 Gine, W.R., Trade Negotiations in the Tokyo Round - A Quantitative Assessment (The Brookings Institution, Washington, D.C., 1978); International Monetary Fund, Effects of Increased Market Access on Selected Developing Country Export Earnings: An Illustrative Exercise. (DM/84/54), Washington. D.C., 24 August, 1984). Sapir, A. and Baldwin, R.E., "India and the Tokyo Round', World Development, Vol.II, No.7, 1983. For a non-technical discussion of the use of such models for evaluating the effects of various trade liberalization proposals, see Robert Stern, 'Evaluating Alternative Formulae for Reducing Industrial Tariffs', Journal of World Trade Law,, 10 (Jan: Feb. 1976), pp.50-64.

2
the MFN rate, then there is positive trade diversion in favour of the preference-receiving
countries and negative trade diversion for the other set of countries.
3. The trade creation and trade diversion effects are summed to provide the net effect in each market
for each partner country, whether or not preference-receiving. An important assumption needs to be
mentioned: that any other limitations on the growth of imports (e.g. non-tariff barriers or limits on
GSP treatment) would be lifted to the extent necessary to permit the projected tariff-induced trade
expansion to take place. If these limitations were maintained, then the trade volume would not rise to
the extent predicted, and quota rents, for example, would increase.
4. The model can also be used directly to compute the price, revenue and welfare effects from trade
liberalization. Together with data from UNIDO's Data Base on Industrial Statistics, it has also been
used to estimate the direct trade effects of liberalization on output and employment. There is scope for
further development in this respect.
5. Partial equilibrium models are vulnerable to the criticism that they do not take account of the
economy-wide effects of changes, although they can be extended to approximate the results of inter-
industry effects and the maintenance of equilibrium in the balance of trade. Theoretically, general
equilibrium models are more satisfactory, since they also take account of second-round effects, such
as inter-industry effects and exchange rate effects. 3 They, therefore, provide valuable insights into the
inter-action of a large number of economic variables. However, they are also vulnerable to criticisms
regarding the extensive underlying assumptions, and the results obtained using such models are very
sensitive to changes in these assumptions. There are a number of problems associated with working
versions of this modelling approach, not the least of which is the loss of detail which arises because it
is necessary to work in large aggregates to make such models computable at reasonable cost.
6. Although the partial equilibrium approach has a number of drawbacks, as a modelling approach it
has the advantage of working at a very fine level of detail. For example, in most studies
3 One of the more comprehensive models of this type is the Michigan Model of World Production and Trade, a de-scription of which can be found in Deardorff, A.V., and Stern, R.M. The Michigan Model of World Production and Trade: Theory and Applications, M.I.T. Press, Cambridge, Mass., 1986. For an example of the use of this model to examine the impact of complete elimination of the post-Tokyo Round tariffs, see Deardorff, A.V. and Stern, R.M.. "The economic effects of the complete elimination of post-Tokyo Round tariffs', in Trade Policy in the 1980s Cline, W.R.(ed.), Institute for International Economics. Washington D.C. 1983.

3
carried out at UNCTAD, tariff line information is used. This is extremely detailed, depending on the
detail of the tariff classification and the number of trading partners. As an illustration, the United States
data for one year contain in the order of 150,000 observations. Working at this level of detail permits
considerable precision in identifying key products and trading partners affected by particular trade
policy scenarios. Methodologically, it has the advantage of avoiding the aggregation bias that is
common to general equilibrium models.
7. Since the UNCTAD model uses prior information on elasticities from other studies (i.e. it is a
simulation model not an estimating model), it is relatively easy to examine new policy options on an ex
ante basis.

4
II. THE BASIC DATA AND PARAMETERS
A. Tariffs
8. The basic tariff data used in the model comes from one of two sources. In the case of the majority
of the developed market-economy countries (DMECs), tariff information is drawn from GATT
computer tapes which are not available to all users. In the case of developing countries, tariff
information is coded in UNCTAD's Trade Information System (TIS - a UNDP-supported project). DM
EC tariff information has been used principally in studies on the effects of trade liberalization, mainly
for the Trade and Development Board but also in the analysis of GSP schemes. Tariff information on
developing countries has been used in the context of simulations of the effects of the Generalized
System of Trade Preferences among developing countries.
9. The GATT tapes contain a highly complex and extensive set of information on tariff rates. The main
(but not the whole) set of information covers: the detailed national tariff number (the number of digits
varies from country to country, but in any case matches the detail of the corresponding GATT trade
data); the pre-MTN base rate tariffs (i.e. those in force in 1978); other tariff rates (such as applied rates,
temporary rates and various preferential rates) when they exist (i.e. GSP, EEC ACP preferences, etc.);
the post-Tokyo Round MFN rate; and various codes covering the nature of the legal binding of the
tariff, if any.
10. In the UNCTAD model, the MFN tariff rates used as the base or initial rates for the simulations of
liberalization in the DMECs are the post-Tokyo Round statutory bound rates or, in the absence of a
binding, the applied rates, but simulations have also been carried out using the applied rates for the
most recent year for which data are available (mainly 1983). In cases where preferences exist (e.g.
under the GSP or through other preferential arrangements such as EFTA or the Lome Convention) the
appropriate preferential rate is used as the base rate. This base rate is that which is relevant to the year
for which the trade data arc drawn. In the model, the base tariff

5
rate is applied at the tariff-line level against individual partner countries (sometimes against groups
facing common rates, e.g. preference-receiving countries under the GSP).
11. In addition to the basic tariff information, UNCTAD also takes account of ceilings or quotas in
the operation of the GSP. It would be desirable to include in the modelling exercises information
about the extent to which imports from each trading partner enter at preferential rates or MFN rates
under each tariff item. Unfortunately, this information is not available at UNCTAD for more than a
few GSP donor countries, mainly because importers regard this information as confidential. Such
detailed information has been made available on computer tape by the United States, and was
loaded by UNCTAD from printed material from Australia. There have been problems in
introducing such information for other countries for which it is not confidential, and the data will be
introduced progressively. At present, for preference-granting countries other than the United States
and Australia, the average utilization factor is used (taken from country reports provided under the
GSP).
12. In the case of developing country tariff rates, the TIS has concentrated mainly on recording the
MFN rate, and it has sometimes been necessary to convert specific rates to ad valorem terms. For
some groups of developing countries, such as ASEAN, preferences that are allocated to other
countries in the particular group are also recorded. Further information on developing country
preference rates is being progressively added. Since tariff line trade data are not compiled for these
countries, it is necessary to compute the arithmetic mean of the tariff up to the level of the 4-digit
SITC item.4 At that level it is then possible to use the United Nations Commodity Trade Statistics,
Series D, to trade weight to a higher level of aggregation.
4 Arithmetic means of tariffs for sectors are typically higher than averages using current trade weights. This is because of the depressing effect of tariff restrictions on imports. For a discussion of aggregation biases in the computation of tariff averages see Laird, S. and Yeats, A., 'Aggregation biases in the computation of tariff averages", Mimeo. UNCTAD, Geneva, 1986.

6
B. Non-tariff barriers (NTBs)
13. In order to use the model to estimate the trade liberalization effects of NTB elimination, a key
requirement is comprehensive information on government-imposed trade restrictions in the major
industrialized country markets. Since no central records exist from which ad valorem equivalents of
the NTBs could be drawn, this data deficiency has been resolved by conducting a major search of the
professional literature in order to compile as many estimates as possible for the nominal
equivalents of non-tariff barriers.5 However, in order to hold this aspect of the exercise to man-
ageable dimensions, the search was specifically focused on a list of "core" products that had pre-
viously been identified by UNCTAD as being of special export interest to the developing countries.6
14. In the effort to compile information on nominal equivalents for NTBs, considerable use was
made of a recent International Monetary Fund study which partially tabulated such statistics, as
well as a related survey conducted under the auspices of the Institute for International Economic
Studies, in Stockholm.7 Table 1, which is drawn from the IMF study, indicates the types of studies
from which we have compiled data on the NTB ad valorem equivalent for use in our simulations.
15. Although these investigations generally concentrated on manufactures, they also contained
some data on commodity protection. For most of the agricultural products in the core group, a
fairly extensive body of empirical information had been developed concerning the ad valorem
incidence of existing non-tariff barriers. Here, the starting point for the data collection effort was two
general analyses by the United Nations Food and Agricultural Organization, and the International
Food Policy Research Institute (Washington), which examined the level and effects of agricultural
protection in industrial countries.8 Supplemental data was drawn from product-specific or country-
specific studies which are fully listed in Annex II.
5 The studies which have attempted to quantify the effects of these measures relate primarily to the European Economic Community, Japan and the United States. For this reason, the simulations of the trade effects of liberalizing these measures had to be confined to these three major markets. 6 See UNCTAD, Problems of protectionism and structural adjustment (Part I), (TD B/IOJ9 (Part I)), Geneva, 28 January 1985. 7 See, International Monetary Fund, Effects of Increased Market Access on Selected Developing Countries Export Earnings: an Illustrative Exercise, (DM/84/54), Washington, D.C., 24 August 1984. The results of the Stockholm study have been published in Alexander Yeats, Trade Barriers Facing Development Countries: Commercial Policy Measures and Shipping London, McMillan, 1979. A further general source employed in the collection of data was Vernon Roningen and Alexander Yeats, "Non-tariff Distortion of International Trade: Some Preliminary Empirical Evidence", Weltitirtscnaftliches Arctuv, January 1977, pp. 613-624. 8 See UN Food and Agricultural Organization, FAO Commodity Review and Outlook I979-1980. Rome, FAO, 1979,

7
Table I Information collated by IMF on tariff equivalents of tariff and non-
tariff barriers for seven commodities in four OECD markets
(percentages)
Sector
United States
European Communities
Japan
Canada
Meat
49(a),16(b) 6(c)
118(a),50(b) 104(d),37(c)
328(a),297(b) 219(c)
52(a)
Cereals
20(e),55(c) 0(b)
81(h),35(e) 73(b),51(d) 34(c)
175(b),70(e) 139(c)
Sugar
27(0, 18(c)
31(d),46(b) 33(c)
44(b),53(c)
Textiles
59(e), 9(g)
50(e)
18(c) 39(j)
Iron and steel
6(g), 5(i)
6(o
3(i)
Clothing
70(e), 9(g)
50(e)
23(e) 39(j)
Footwear 2(g), 9(i) 12(i) 16(i) ...
All sectors 33(e) 39(e) 62(e) ...
Source: IMF, (op.cit.), Table 1. Notes: See following page..
16. With regard to the NTB equivalents compiled from these sources, several specific points should
be noted. First, many of these estimates were derived in a manner that they reflect the "general" or
average level of protection against all exporters and do not reflect any special differential adverse
incidence which may exist on developing countries' exports.9 Thus, in sectors like textiles and
clothing, where goods originating in developing countries are subject to clear discrimination under the
Multifibre Arrangement, the estimated ad valorem equivalents of existing restrictions are
downward biased. It is recognized that this problem produces a similar downward
pp.112-114, for basic data, and Alberto Valdes with the assistance of J. Hayssen, Trade Liberalization in Agricultural Commodities and the Potential Foreign Exchange Benefits to Developing Countries, Washington, D.C., International Food Policy Research Institute, 1979. 9 The sources employed in tabulating the ad valorem equivalents of NTBs utilized various methods for arriving at these estimates. It should be recognized that there is no one generally accepted procedure for quantifying non-tariff measures and that all procedures which have been employed may be subject to various sources of bias. For a comprehensive analysis relating to this point, see Robert Stern and Alan Deardorf, Methods of Measurement of Non-tariff barriers, UNCTAD/ST/MD/28, Geneva. 1985.

8
I M F SOURCES OF INFORMATION ON NON-TARIFF BARRIERS
Reference notes for table 1
(a) FAO, "Protectionism in the Livestock Sector", Rome, 1980. Estimates refer to beef for 1977-79.
(b) SJ.Anjaria, et al., "Developments in International Trade Policy", IMF Occasional Paper No.16, Washington, D.C., 1982. Meat estimates refer to beef for 1977-79. Cereal estimates refer to a simple average for rice, maize and wheat for the United States; maize and wheat for the European Communities, and rice, wheat, barley and soybeans for Japan, in 1979-80.
(c) Japan Economic Institute, "Agricultural Protectionism", Tokyo, 1983. Estimates for meat refer to beef; for cereals, to grains for the United States and the European Communities, and to a simple average for rice, wheat and barley for Japan in 1978-80. Estimates for sugar also refer to 1978-80.
(d) Commonwealth Secretariat, Protectionism: Threat to International Order, London, 1982. Estimates for meat refer to beef; and for cereals to a simple average for rice, maize and wheat in 1979-80. Estimates for sugar refer to the same time period.
(e) A.J.Yeats, Trade Barriers Facing Developing Countries, New York, 1979. All estimates are for 1973. For cereals, estimates refer to grains and grain products; for textiles, clothing and manufactures, estimates are the sum of post-Kennedy Round tariffs and tariff equivalents for non-tariff barriers. Tariff equivalents for non-tariff barriers refer to apparel for both textiles and clothing.
(f) Derived from U.S. Department of Agriculture, "Sugar and Sweetener: Outlook and Situation", Washington, D.C., 1981. Estimates refer to 1979-80. Transport costs were assumed at 6 per cent of the c.i.f. price.
(g) P. Morici and L. L. Megna, U.S. Economic Policies Affecting Industrial Trade, Washington, D.C., 1983. The tariff equivalent for textiles reflects the impact of the Multifibre Arrangement; for iron and steel, it reflects the effects of several orderly market agreements with Japan, and quotas against other producers; for footwear, it reflects orderly market agreements with Taiwan and Korea between 1977-79.
(h) U. Koester, "Policy Options for the Grain Economy of the European Community: Implications for Developing Countries", IFPRI Research Report No.35, Washington, D.C., 1982. Estimates refer to a simple average for wheat, barley and maize for 1979-80.
(i) Pre-Tokyo Round tariffs calculated in A.V. Deardorff and R.M.Stern, "The Effects of the Tokyo Round on the Structure of Protection". Paper presented at the Conference on the Structure and Evolution of Recent U.S.Trade Policy, National Bureau of Economic Research, Cambridge, Mass., December 1982.
(j) M. Wolf, "Managed Trade in Practice: Implications of the Textile Arrangements", in W.R.Cline (ed.), Trade Policies in the 1980s, Washington, D.C., 1983. The simple average of total protective rates for 16 products in 1979 was employed.
bias in estimating the magnitude of the developing countries' trade expansion associated with a
removal of these restraints.10 Another (downward) bias occurs in respect of NTBs for which no
10 In principle, this bias could occur in respect of any measure applying to a sub-group of trading partners, e.g. restrictions on steel imports from other major developed market economies.

9
estimates of ad valorem equivalents could be found, e.g. "voluntary" export restraints. In such
cases, it is not possible, when using the model, to simulate the magnitude of trade expansion as-
sociated with the barriers' removal. Finally, it should be noted that some ad valorem equivalents for
non-tariff barriers applied in the agricultural sector are quite volatile due to a wide year-to-year
variation in these products' prices on international markets.11 In these cases, it has often been
necessary to make a judgemental decision as to what constituted an average or "normal" level of
protection, based on information relating to several years.
C. Imports
17. For the DMECs, the trade data used in the model are taken from the GATT trade tapes for the
relevant year. This information is receded at the tariff-line level, thus permitting the matching of
tariff and trade information on most DMECs. Import data in this series are recorded at the point of
clearing customs, even though they may have been imported considerably earlier and held in bond. In
the case of the United States, Canada, Australia and New Zealand, imports arc valued on a free-on-
board (f.o.b) basis, while for all other developed countries a cost-insurance-freight (c.i.f) valuation
is employed. As a result, trade projections made with the model vary between countries in terms of
f.o.b. and c.i.f. value.
18. For developing countries the trade data are taken from the United Nations Commodity Trade
Statistics, Series D, which uses the United Nations Standard International Trade Classification
(SITC), both in Revision 1 and Revision 2, although predominantly in Revision 1 for developing
countries. Imports data in this series are recorded at the time of arrival in the importing country,
even though some time may pass before they clear customs. For the most part, these data are
recorded at the four-digit level of the SITC. An additional point is that the developing country trade
data are normally several years out of date (on average they now apply to the 1980-82 period)
while more recent data (1984-85) are available for developed countries. This means that in
11 As an example, ad valorem equivalents have been estimated by the UNCTAD secretariat for the European Economic Community's variable import levies by taking the ratio of these import charges to the international prices of the products to which they were applied. Due to variations in both prices and levies, this procedure generated estimated ad valorem equivalents for NTBs facing some major agricultural imports that differed by as much as 100 percentage points from year to year. See UNCTAD, Protectionism and structural adjustment in agriculture (TD/B/939), Geneva, 17 March 1983, p.72, for time series on nominal equivalents for the EEC variable levies over the period 1975 to 1981.

10
studies of the liberalization of trade among developing countries it was necessary to use data for
earlier years for one or two countries. In order to obtain consistent data sets, it would have been
necessary to use earlier data for all countries or to estimate trade data for later years for those
countries for which the reported data were less recent.
D. Market penetration data
19. If the elasticity of substitution between alternative suppliers is not known, it is still possible to
compute the trade diversion effect using a formulation developed by Baldwin and Murray.12
However, for this approach it is necessary to be able to calculate the level of import penetration by
non-preference-receiving countries, i.e. the share of imports from non-preference-receiving
countries in apparent domestic consumption (defined as domestic output plus imports less exports).
20. The principal source of information lies in the data which were first produced in the World
Bank Market Penetration Project. This work is now carried out at OECD under the title of "The
OECD Compatible Trade and Production Data Base13. Information is available on output, imports
and exports for some 11 major DMEC markets under the International Standard Industrial
Classification (ISIC).
12 Baldwin, R.E. and Murray, T. 'MFN Tariff reductions and developing country trade benefits under the GSP", The Economic Journal. 87, March 1977. See the description of the UNCTAD model in Annex I for the explanation of this point. 13 For information, see Brodin, A., and Blades. D., "The OECD Compatible Trade and Production Data Base, 1970-1983', Department of Economics and Statistics Working Papers, No.31, OECD, Paris, March, 1986.

11 E. Elasticities
( i ) Elasticity of import demand
21. Information on elasticities of import demand came from a literature search. Primary use was
made of a compendium prepared by Robert Stern with this information supplemented by additional
data taken from studies by the Brookings Institution and the Kiel Institute for World Economics.14 14.
(ii) Elasticity of export supply
22. Information on elasticities of export supply has not yet been explicitly used in the model, since
comprehensive information regarding the parameters is not readily available. The main simulations
normally use an assumed value of infinity, and it is routine to carry out "sensitivity" tests based on
simulations for different values, including assumptions of inelastic supply. Simulations with
alternative values have shown that when supplies arc assumed to be relatively inelastic, the volume
changes are considerably less but there is also a positive effect on the prices received by exporters
which tends to compensate for this. The result is that with certain combinations of supply and
demand elasticities the revenue effect associated with reductions of tariffs or the elimination of
NTBs is often close to that under infinite supply elasticities.
23. One important effect is not as yet taken into account for the cases where elasticities of supply are
non-infinite. This is the simultaneous impact of liberalization of trade in a number of markets, as
might happen following multilateral negotiations. Such liberalization together with non-infinite
supply elasticities is likely to cause a much smaller expansion of trade volumes than are predicted by
the present version of the model. However, the resulting price increases are also likely to be
higher, thus operating as a counter to the smaller trade volumes in the computation of the revenue
14 See Robert Stern et al.. Price Elasticities in International Trade. London, Macmillan, for the Trade Policy Research Centre, 1975; William Cline, et al. Trade Negotiations in the Tokyo Round: A Quantitative Assessment, Washington, D.C.. The Brookings Institution, 1978; and Rolf Langhammer, "Problems and Effects of a Developing Country's Tariff Concession Round on South-South Trade", Kiel Working Paper, No.167, Institute for World Economics, Kiel, February 1983.

12
effect. This problem does not arise under the assumption of perfectly elastic supply since there is no
effect on world prices.
(iii) Elasticity of substitution
24. If explicit values are available for the elasticity of substitution between goods from different sources
then it is not necessary to use an approach based on market penetration data (as mentioned above).
However, it is in any case an option to assume values for the elasticity of substitution (and conduct
simulations across a range of reasonable estimates). These elasticity values are used in the computation
of the trade diversion effect, i.e. the extent to which trade is diverted from one foreign supplier to
another in consequence of shifts in relative prices resulting from differential movement in tariff rates or
the ad valorem incidence of NTBs. 15
25. It is implicit in computations of trade diversion, as in this type of exercise, following Armington16,
that the products coming from different foreign sources (e.g. from developing countries or from other
industrialized countries) are imperfect substitutes.17 It is then possible to express the percentage change
in the relative shares of the alternative suppliers in terms of the elasticity of substitution, the percentage
change in relative prices and the original relative shares of imports from the alternative sources.
Constant market shares of individual countries within each group of foreign suppliers equally affected
by the trade policy change are assumed.
F. Concordances
26. The various data series used in the model are classified under different systems (e.g. SITC,
ISIC or national tariff classifications - of which most but not all are based on the Customs Co-
operation Council Nomenclature (CCCN) at the 4-digit level). Since these systems do not concord .
15 For a discussion of empirical estimates of the elasticity of substitution, see Cline, (op.cit.). In The Brookings Institution Model a value of 2.5 was used. It is probable that the elasticity is lower for highly differentiated products, and vice versa. The higher the value of this elasticity, the higher the trade diversion effects i.e. the benefits from the present arrangements would be higher than estimated, as would be the losses arising from the implementation of the new arrangements. 16 Armington, P., "A theory of demand for products distinguished by place of production', IMF Staff Papers,
Vol.16.1969, pp. 159-178. 17 See also Learner, E. and Stern R.M., Quantitative International Economic, Boston, Alien and Bacon Inc., 1972, Chapter I I , on the concept of the elasticity of substitution in international trade.

13
on a one-to-one basis there are sometimes errors in cross-classifying data, particularly at the de-
tailed level. The concordances of the national tariff classifications of the United States
(TSUSA) and of Canada - which are not CCCN-based - pose particular problems, not the least
because of reclassification of items from one year to the next. Because of imperfections in the
concordances, especially for certain specific products, it can happen that, if one wishes to
examine a particular industry as defined at, say, the 4-digit SITC level, the relevant tariff
numbers would include more or less products than those that are strictly within the SITC item
product description. At higher levels of aggregation these problems are much less important.

14
II. USES OF THE MODEL
27. Two of the main uses of the model have been in connection with UNCTAD's work on
protectionism and structural adjustment and also in providing technical backstopping to work on the
GSTP. Examples of the output of the model for these two different types of exercise are given in
Annex I I I , Tables Al to A5. Tables Al and A2 are taken from previously published UNCTAD
documents and indicate the projected increase in developing country exports to the DMECs that
would accompany a liberalization of selected tariffs and NTBs. Similar results could be easily
generated for different product groups or for different liberalization proposals such as the general
tariff cutting formulae employed in the Tokyo Round multilateral trade negotiations. Table A3
shows the results of one particular policy option for the GSTP (i.e. implementation of 20 percent
linear tariff preferences for intra-trade), while Annex Table A4 examines the likely impact of pref-
erences on the level and structure of South-South commodity trade. Similar projections could be made
for any other procedure for creating preferences for intra-developing country trade (even those
involving differential exchange rates or transport cost preferences). The remaining Table A5 relates
to a study that was conducted by UNCTAD on trade-debt issues and shows how a trade liberalization
in DMECs would influence the most heavily indebted countries and their major export products.
28. Another example of the use of the model is to identify in fine detail how specific products will be
affected by different trade policy approaches. This is something for which the model is particularly
suited, since the larger general equilibrium models do not work at this level of detail. An example
of this use of the model is the identification of key products in particular markets where the
developing countries would benefit from trade liberalization. Obviously, this type of application
could greatly assist developing countries in formulating trade liberalization proposals for any future
multilateral negotiations.
29. Another example of the use of the model is to evaluate the direct trade effects of existing
preferences under the Generalised System of Preferences (GSP) for developing countries. The
model can also be used to evaluate the effects of changes in the schemes and can even be used to

15
simulate the likely effects of alternative options which might be considered. Related applications
could greatly assist developing countries in the design and implementation of the GSTP.
30. The model has also been used to provide information to developed and developing countries in
evaluating trade policies, on request. Among the intended uses of this material has been the
planning of new export ventures or the preparation for balance-of-payment consultations within
GATT. The model has also been employed to assist developing countries in evaluating the potential
contribution that trade liberalization initiatives could make towards alleviating these nations'
international debt burdens.

16
III. FUTURE WORK ON THE MODEL
31. The following points cover the main areas for future refinement of the model as well as the data and
parameters used.
It is intended to conduct further research to extend the files on elasticities of import
demand, export supply and substitution between different sources of supply for
different products and for different countries. As a long-term goal it may be desirable
to make original estimates from econometric analysis.
New work is needed to update and extend the files on the ad valorem equivalents of
non-tariff barriers for different products in different countries, including countries
other than the EEC, Japan and the United States. This would primarily be on the
basis of research into the economic literature for estimates made by other
organizations and academic researchers. However, alternative approaches are being
examined, including the possibility of estimates derived from the UNCTAD Data Base
on Trade Measures.18
Employment: It is intended to extend the analysis of the economic impact of trade liberalization to
other products and countries, including exporting countries. The analysis of indirect
employment effects can be expanded through the use of input-output tables for the
importing, liberalizing countries and/or the exporting countries, so that the effects on
related industries can be calculated. At present, the analysis of the employment effects is
limited to the direct effects resulting from an expansion of imports as a consequence of
the importer's own liberalization, whereas the expansion in exports results only from the
liberalization by other countries.
18 For information on the Data Base on Trade Measures, see "Introductory note on methodology employed and the problem of definitions', prepared by the UNCTAD secretariat (TD/B/AC.42,2), 4 September 1985.
Elasticities:
NTBs:

17
Other effects: It is possible to extend the model by equilibrating changes in imports and exports to
simulate exchange rate adjustments to restore balance of trade equilibrium, as has been
done by Cline (op.cit.) However, this would still not simulate the restoration of global
equilibrium, which is particularly important when a number of countries are
undertaking simultaneous liberalization efforts as, for example, in the context of
multilateral negotiations under the GATT or in the context of GSTP. To meet these
objectives it is intended to expand the usefulness of the modeling work in co-operation
with other efforts in UNCTAD, in other international organizations and in academic
institutions. This would permit the finely detailed information on tariffs and NTBs
stored by UNCTAD to be used in compiling first-round effects of trade liberalization
(reducing aggregation bias common to larger models), while using the general
equilibrium models to analyse second-round effects on a global basis.

18
VI. Co-operation with other organizations and governments
32. UNCTAD has received a number of requests for simulations of specific policy changes along the
lines of the present paper as well as simulations for changes in specific countries. For example, first-
round results from the model for an MFN liberalization of tariffs and NTBs in the EEC, Japan and
the United States have been used by the World Bank in a general equilibrium model to study a variety
of second-round effects for the purposes of the World Development Report 1986.
33. The model is also used to assist UNIDO consultants in the preparation of sectoral studies on the
effects of trade distortions which are used in UNIDO's system of consultations. For example, earlier
versions of the model were used to assist UNIDO with respect to sectoral studies in the following
sectors: building materials; wood and wood products; oilseeds, vegetable oils and related products; and
petrochemicals. The current version of the model has been used to provide information for a UNIDO
sectoral study on pharmaceuticals (not yet published). The UNIDO studies are as follows:
• "Tariff and non-tariff measures in the world trade of wood and wood products", Sectoral
Studies Branch, Division for Industrial Studies, UNIDO (UNIDO/IS.396).
• "Tariff and non-tariff measures in the world trade of oilseeds wood, vegetable oils and related
products", Sectoral Studies Branch, Division for Industrial Studies, UNIDO (UNIDO/IS.396).
• "Tariff and non-tariff measures in the world trade of building materials", Sectoral Studies
Branch, Division for Industrial Studies, UNIDO (UNIDO/IS.524).
• "Tariff and non-tariff measures in the world trade of petrochemicals", Sectoral Studies Branch,
Division for Industrial Studies, UNIDO (UNIDO/IS.573) - currently being revised for publi-
cation.

19
34. Preliminary discussions have also been held with the representatives of the International De-
velopment Research Centre (Canada) concerning the use of the model for assessing the likely impact
of new customs unions among developing countries. Representatives of national governments have
been assisted by the secretariat on their request concerning use of the model in connection with
balance-of-payment consultations in GATT and the IMF.

20
ANNEX
Technical Description of the UNCTAD Trade Policy Simulation Model
The basic model can be described in a series of equations and identities from which the formulation for the simulations is derived. First the notation is given:
NOTATION
M - imports Mn - imports from non-preference-receiving countries X - exports V - output in the importing country P - price R - revenue W - welfare t - tariff rate or non-tariff distortion in Y - national income ad valorem terms Em - elasticity of import demand with respect to domestic price Ex - elasticity of export supply with respect to export price Es - elasticity of substitution with respect to relative prices of the - same product from different sources of supply TC - trade creation TD - trade diversion i - subscript denoting commodity j - subscript denoting domestic/importing country data k - subscript denoting foreign/exporting country data - (In certain expressions the subscript K is used to denote data for an - alternative foreign/exporting country) d - prefix denoting change Examples: Pijk - Price of commodity i in country j from country k (i.e. domestic price in j) Pikj - Price of commodity i from country k to country j (i.e. export/world price j) Mijk - Imports of i by j from k Xikj - Exports of i by k to j
The basic model The importing country j’s import demand function for commodity i produced in country k may be expressed as: (1) M ijk = F(Y j , P ij , P ik )
The producer/exporting country k’s export supply function for commodity i may be expressed as:

21
(2) X ijk = F(P ikj )
Expressions (1) and (2) are related by the following identity: (3) M ijk = X ikj
Assuming that in a free trade situation the domestic price of the commodity i in the importing market j will be equal to exporting country k’s export price plus transport and insurance charges, it follows that this price will rise by an amount equivalent to the ad valorem incidence of any tariff or non-tariff distortion applied to the good. Thus: (4) P ijk = P ikj (l + t ijk ) It is also clear that the export revenues earned by k are :
(5) R ikj = X ikj .P ikj Trade creation The trade creation effect is the increased demand in country j for commodity i from exporting country k resulting from the price decrease associated with the assumed full transmission of price changes when tariff or non-tariff distortions are reduced or eliminated. Given the basic model consisting of expressions (1) to (5), it is possible to write the basic formula for trade creations. First, from expression (4) it is possible to derive the total differential of domestic price with respect to tariffs and foreign price:
(6) dP ijk = P ikj .dt ijk + (l + t ijk ).dP ikj Now, the standard expression for the elasticity of import demand with respect to the domestic price can be rearranged as follows: (7) dM ijk /M ijk = Em.(dP ijk /P ijk ) Substituting from expression (4) and (6) into expression (7) gives: (8) dM ijk /M ijk = Em.(dt ijk /(l + t ijk ) + dP ijk /P ikj ) The standard expression for the elasticity of export supply with respect to the world price can be rearranged as follows: (9) dP ikj /P ikj = (dX ikj /X ikj )/Ex

22
From expression (3) it follows that: (10) dM ijk /M ijk = dX ikj /X ikj Substituting expression (10) into (9) and the result into (8) produces the expression that can be employed to compute the trade creation effect. From expression (3) this is equivalent to exporting country k’s growth of exports of commodity i to country j. The expression for trade creation can be written: (11) TC ijk = M ijk . Em.dt ijk /((l + t ijk ).(1.(Em/Ex)) It may be noted that if the elasticity of export supply with respect to the world price is infinite then the denominator on the right hand side of expression (11) becomes unity and can be ignored. Trade diversion Following standard practice, the term trade diversion is used to account for the tendency of importers to substitute goods from one source to another in response to a change in the import price of supplies from one source but not from the alternative source. Thus, if prices fall in one overseas country there will be a tendency to purchase more goods from that country and less from countries whose exports are unchanged in price. Trade diversion can also occur not because of the change in the export price as such but because of introduction or elimination of preferential treatment for goods from one (or more sources) while treatment for goods from other sources remains unchanged. Again there could be simply a relative change in the treatment of the goods from different sources in the importing country by differential alterations in the treatment of different foreign suppliers. (i) Without explicit values for the elasticity of substitution
If the elasticity of substitution between alternative suppliers is not known then it is still possible to compute the trade diversion effect using a formulation developed by Baldwin and Murray.19 However, for this approach it is necessary to be able to calculate the level of import penetration by non-preference-receiving countries, i.e. the level of imports from non-preference-receiving countries in apparent domestic consumption (defined as domestic output of commodity i plus imports of commodity i less exports of commodity i). The formulation for trade diversion can then be written:
(13) TD ijk = TC ijk .(Mn ij /V ij )
This formulation assumes “the substitutability between a developing country product and a similar product produced in non-beneficiary i.e. non-preference-receiving countries should be similar to the substitutability between a developing country product and a similar product produced in the donor importing country” (Id.).
19 Baldwin, R.E. and Murray, T. “MFN tariff reductions and developing country trade benefits under the GSP”. The Economic Journal 87, March 1977.
23
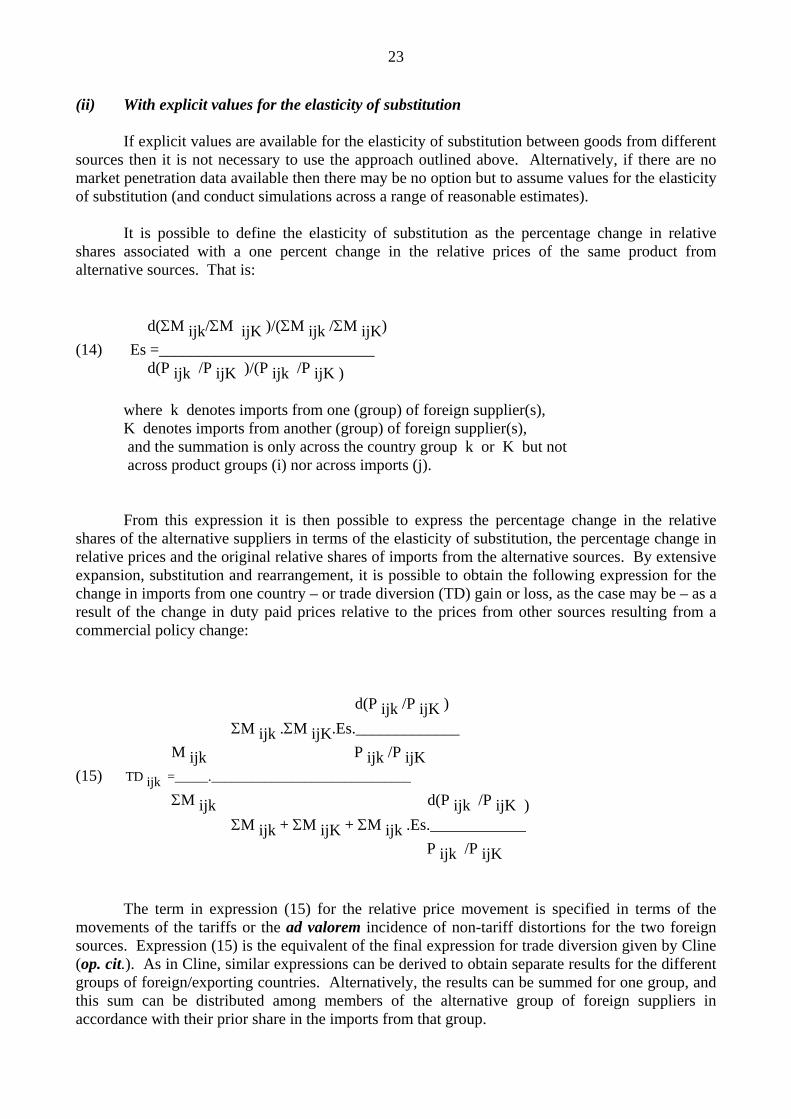
(ii) With explicit values for the elasticity of substitution If explicit values are available for the elasticity of substitution between goods from different sources then it is not necessary to use the approach outlined above. Alternatively, if there are no market penetration data available then there may be no option but to assume values for the elasticity of substitution (and conduct simulations across a range of reasonable estimates). It is possible to define the elasticity of substitution as the percentage change in relative shares associated with a one percent change in the relative prices of the same product from alternative sources. That is: d(ΣM ijk/ΣM ijK )/(ΣM ijk /ΣM ijK) (14) Es =___________________________ d(P ijk /P ijK )/(P ijk /P ijK ) where k denotes imports from one (group) of foreign supplier(s), K denotes imports from another (group) of foreign supplier(s), and the summation is only across the country group k or K but not across product groups (i) nor across imports (j). From this expression it is then possible to express the percentage change in the relative shares of the alternative suppliers in terms of the elasticity of substitution, the percentage change in relative prices and the original relative shares of imports from the alternative sources. By extensive expansion, substitution and rearrangement, it is possible to obtain the following expression for the change in imports from one country – or trade diversion (TD) gain or loss, as the case may be – as a result of the change in duty paid prices relative to the prices from other sources resulting from a commercial policy change: d(P ijk /P ijK ) ΣM ijk .ΣM ijK.Es._____________ M ijk P ijk /P ijK (15) TD ijk =_____.______________________________
ΣM ijk d(P ijk /P ijK ) ΣM ijk + ΣM ijK + ΣM ijk .Es.____________ P ijk /P ijK The term in expression (15) for the relative price movement is specified in terms of the movements of the tariffs or the ad valorem incidence of non-tariff distortions for the two foreign sources. Expression (15) is the equivalent of the final expression for trade diversion given by Cline (op. cit.). As in Cline, similar expressions can be derived to obtain separate results for the different groups of foreign/exporting countries. Alternatively, the results can be summed for one group, and this sum can be distributed among members of the alternative group of foreign suppliers in accordance with their prior share in the imports from that group.

24
The total trade effect The total trade effect is obtained simply by summing together the trade creation and trade diversion effects. Results can be summed for the imported across product groups and/or across sources of supply. Results can be summed across groups of importers for single products or groups of products as well as for single sources of supply or for groups of suppliers. Results can also be summed for suppliers across product groups. Finally, results can be summed for groups of suppliers either for individual products or across product groups. The price effect If the export supply elasticity is infinite then there is no price effect on exports. Otherwise the price effect can be obtained by substituting expression (10) into (9), giving: (16) dP ikj /P ikj = (dt ijk /(l + t ijk )).(Em/(Em-Ex)) The revenue effect Expression (16) has direct application in estimating the revenue effect for the exporting country. If the export supply elasticity is infinite, there is no price effect – as noted above – and consequently revenue increases in proportion to the increase in exports. Otherwise the percentage increase in revenue is equal to the percentage increase in exports plus the percentage increase in prices. This can be shown by taking from expression (5) above the total differential of revenue with respect to export price and the volume of exports: (17) dR ikj = P ikj .dX ikj + X ikj .dP ikj Dividing the left-hand side (LHS) of (17) with the LHS of expression (5) and the right-hand side (RHS) of (17) with the RHS of (5) gives: (18) dR ikj /R ikj = (P ikj.dX ikj + X ikj .dP ikj )/(P ikj .X ikj) Reducing and substituting from expression (10) gives: (19) dR ikj /R ikj = (dM ikj /M ijk ) + (dP ikj /P ikj) Alternatively, this can be written: (20) dR ikj /R ikj = (dt ijk /(l + t ijk )).Em.((1 + Ex)/(Ex-Em))
The welfare effect The welfare effect arises from the benefits consumers in the importing country derive from the lower domestic prices after the removal or reduction of tariffs or the ad valorem incidence of non-tariff distortions. As noted by Cline (op.cit.), “for the pre-existing level of imports, any price reduction to the consumer merely represents a transfer away from the government of tariff revenue formerly collected on the import and therefore no net gain to the country as a whole. But for the increase in imports, there is a net welfare gain equal to the domestic consumers’ valuation of the extra imports minus the cost of extra imports at supply price (excluding tariffs)”. Thus, the net welfare gain is normally estimated as the increase in import value times the average between the ad

25
valorem incidence of the trade barriers before and after their elimination. This welfare gain can also be thought of as the increase in consumer surplus. It can be written: (21) W ijk = 0.5(dt ijk. dM ijk )
In the case where the elasticity of export supply is less than infinity the supply price is higher than previously. The new domestic price of imports does not decline to the full extent of the tariff change and import expansion is less than in the case of infinitely elastic export supply. Welfare can still be computed using expression (21) but needs to be interpreted as a combination of consumer surplus and producer surplus.
26
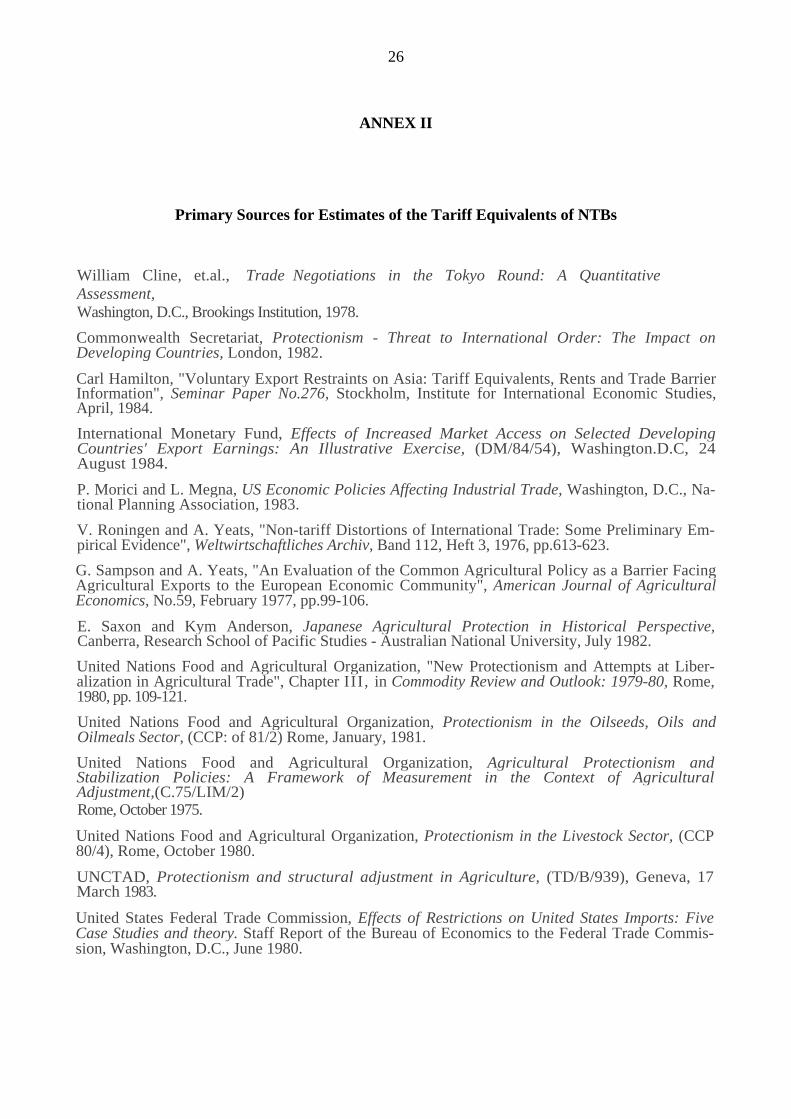
ANNEX II
Primary Sources for Estimates of the Tariff Equivalents of NTBs
William Cline, et.al., Trade Negotiations in the Tokyo Round: A Quantitative Assessment, Washington, D.C., Brookings Institution, 1978. Commonwealth Secretariat, Protectionism - Threat to International Order: The Impact on Developing Countries, London, 1982. Carl Hamilton, "Voluntary Export Restraints on Asia: Tariff Equivalents, Rents and Trade Barrier Information", Seminar Paper No.276, Stockholm, Institute for International Economic Studies, April, 1984. International Monetary Fund, Effects of Increased Market Access on Selected Developing Countries' Export Earnings: An Illustrative Exercise, (DM/84/54), Washington.D.C, 24 August 1984. P. Morici and L. Megna, US Economic Policies Affecting Industrial Trade, Washington, D.C., Na-tional Planning Association, 1983. V. Roningen and A. Yeats, "Non-tariff Distortions of International Trade: Some Preliminary Em-pirical Evidence", Weltwirtschaftliches Archiv, Band 112, Heft 3, 1976, pp.613-623. G. Sampson and A. Yeats, "An Evaluation of the Common Agricultural Policy as a Barrier Facing Agricultural Exports to the European Economic Community", American Journal of Agricultural Economics, No.59, February 1977, pp.99-106. E. Saxon and Kym Anderson, Japanese Agricultural Protection in Historical Perspective, Canberra, Research School of Pacific Studies - Australian National University, July 1982. United Nations Food and Agricultural Organization, "New Protectionism and Attempts at Liber-alization in Agricultural Trade", Chapter III , in Commodity Review and Outlook: 1979-80, Rome, 1980, pp. 109-121. United Nations Food and Agricultural Organization, Protectionism in the Oilseeds, Oils and Oilmeals Sector, (CCP: of 81/2) Rome, January, 1981. United Nations Food and Agricultural Organization, Agricultural Protectionism and Stabilization Policies: A Framework of Measurement in the Context of Agricultural Adjustment,(C.75/LIM/2) Rome, October 1975. United Nations Food and Agricultural Organization, Protectionism in the Livestock Sector, (CCP 80/4), Rome, October 1980. UNCTAD, Protectionism and structural adjustment in Agriculture, (TD/B/939), Geneva, 17 March 1983.
United States Federal Trade Commission, Effects of Restrictions on United States Imports: Five Case Studies and theory. Staff Report of the Bureau of Economics to the Federal Trade Commis-sion, Washington, D.C., June 1980.

27
ANNEX III
ILLUSTRATIONS OF SIMULATIONS MADE WITH THE UNCTAD MODEL
Explanatory note
Table Al illustrates the results of a simulation covering the effects on developing countries of the elimination of both tariff and non-tariff barriers. Tariff elimination was simulated for 20 DMECs for which tariff information is held, while tariff and NTB elimination is simulated for the EEC, Japan and the United States. The separate effects of preferential and MFN liberalization were simulated. The results are shown for all 3-digit ISIC industries. The simulations were based on 1983 import data from the GATT trade tapes and assume infinite supply capabilities. These simulations used the version of the model with an explicit elasticity of substitution among foreign suppliers, which was assumed to equal 2 in all industries. These results were reported in "Problems of protectionism and structural adjustment -Introduction and Part I: Restrictions on trade and structural adjustment", report by the UNCTAD secretariat (TD/B/10Sl(Part I), Chapter III).
Table A2 presents more detailed results from the same simulations that were carried out for Table Al . The information for the effects on developing countries of MFN liberalization of tariffs and NTBs by the EEC at the 4-digit CCCN level was ranked in order of magnitude of the value of the gains in S US. The table lists the top fifty items in order of the size of projected trade gains. Accordingly, this table represents the list of items on which developing countries would gain most from liberalization by the EEC and which would therefore be expected to rank highest in any "request list" for negotiations. Similar lists were computed for Japan and the United States, and are shown in "Problems of protectionism and structural adjustment - Introduction and Part I : restrictions on trade and structural adjustment", report by the UNCTAD secretariat (TD/B/I081(Part I), Annex II).
Annex Table A3 shows the results from a simulation of the influence of preferences for intra-trade on the exports, imports and trade balances of selected major developing countries or country groups. The simulation assumed that preferences were generated through 10, 20 and 50 per cent linear tariff cuts and that supply in developing countries was infinitely elastic. For more details, including the projected effects of different preferential tariff margins, see UNCTAD, Considerations relating to the negotiating elements and likely economic effects of a global system of trade preferences (GSTP) among developing countries, (UNCTAD/ECDC/179) (Geneva: 9 July 1985).
Annex Table A4 summarizes the results of simulations of the effects of full tariff preferences (TOO per cent preferential margins) on the commodity intra-trade of developing countries. The table shows the projected change in the value of this exchange under three different assumptions concerning supply conditions (perfectly elastic supply, unitary' elastic supply and a case when export prices rise by one-third of the corresponding change in volumes) and also indicates the resulting changes in developing countries' trade shares. See Samuel Laird and Alexander Yeats, 'Empirical Evidence Concerning the Magnitude and Effects of Developing Country Tariff Escalation", mimeo. UNCTAD Geneva, 1-4 April 1986.
Annex A5 is drawn from a simulation study that examined the use of trade liberalization initiatives for alleviating the debt burdens of the most heavily indebted developing
28
countries. The table shows the projected expansion of these nations' exports resulting from a full preferential liberalization of tariffs and NTBs applied to their "core" products in the EEC, Japan and the United States. In these projections supply is assumed to be perfectly elastic, but sensitivity tests arc run on this parameter in the full study. For details, see Samuel Laird and Alexander Yeats, "On the Potential Contribution of Trade Policy Initiatives for Alleviating the International Debt Crisis", mimeo. UNCTAD, Geneva, 2 November 1985.

29 TABLE I: Gains to developing countries of trade liberalization through (a) reduction to zero of tariffs in 20 developed market economy countries, and (b) reduction to zero of tariffs and
certain non-tariff barriers (NTBs) in the EEC, Japan and United States ($ million) 20 DMECs EEC, Japan and United States only
Tariff lib. gains Incl. imports under liberalization (a) MFN (b) Pref.
ISIC
Industry
Imports 1983
(a) MFN
(b) Pref.
Imports
1983
Tariffs
Tariffs + NTBs
Tariffs
Tariffs + NTBs
111 Agric. + livestock 12609 251 480 11291 230 329 432 592 113 Hunting, trapping, etc. 12 0 0 2 0 0 0 0 121 Forestry 1940 0 0 1833 0 0 0 0 122 Logging 2109 0 0 2099 0 0 0 0 130 Fishing 3107 165 228 2982 164 1013 226 1465 210 Coal mining 49 1 2 14 1 1 2 2 220 Crude petroleum 100817 1157 1675 94894 1542 1542 1639 1639 230 Mining 6195 0 0 5356 0 0 0 0 290 Stone quarrying, etc. 3468 33 44 2956 32 32 42 42 311 Food products 20236 900 1272 18538 835 4087 1177 5122 312 Food products nes 399 16 26 266 16 40 24 58 313 Beverages 544 47 304 478 44 48 286 298 314 Tobacco 293 32 38 285 30 30 35 35 321 Textiles 7921 1190 2007 6502 826 3194 1191 5162 322 Wearing apparel 9779 4728 5076 9146 4506 11785 4688 12461 323 Leather & products 1322 228 304 1123 167 261 208 303 324 Footwear 219 30 35 206 25 123 29 137 331 Wood products 2521 116 201 2296 102 102 166 166 341 Paper & products 701 10 42 589 7 12 34 43 342 Printing, publishing 319 2 12 261 2 3 10 13 351 Industrial chemicals 3401 82 274 2928 67 79 235 251 352 Other chemical prods. 1350 11 51 1102 13 33 47 161 353 Petroleum refineries 21440 648 1078 17741 645 645 1071 1071 354 Petroleum, coal prods. 30770 157 158 31069 156 156 157 157 355 Rubber products 2267 1359 1495 1977 1209 2207 1234 2234 356 Plastic products, nec 542 148 229 440 85 85 143 183 361 Pottery, china, etc. 169 74 105 149 70 70 92 92 362 Glass + products 218 10 36 191 9 16 29 51 369 Non-metal prods. nec 327 11 36 333 9 9 28 30 371 Iron + steel 2905 181 247 2440 168 702 212 1043 372 Non-ferrous metals 7361 45 190 7850 46 229 187 436 380 Fab. metal products 946 0 0 157 0 8 0 8 381 Metal products 1486 154 355 1264 79 296 199 529 382 Machinery nec 2939 205 434 2978 196 200 394 407 383 Electrical machinery 8462 871 1514 8017 781 1337 1305 2076 384 Transport equipment 2727 177 382 2003 146 274 283 450 385 Professional goods 3086 194 425 2492 100 100 272 272 390 Other industries 2946 398 545 2566 364 438 468 563 410 Energy 4 0 0 2 0 0 0 0 610 Wholesale trade 6 0 0 6 0 0 0 0 620 Retail trade 176 0 0 156 0 0 0 0 832 Var. business services 21 0 2 19 0 0 1 1 941 Movies, etc. 10 0 1 9 0 0 0 0 959 Photographic studios 89 0 2 84 0 0 1 1 1-9 ALL TRADE 268204 14043 19303 247091 12671 29485 16549 37557 Source: Table 8 of UNCTAD document TD/B/1081 (Part I) of 23 January, 1985 Note: The 20 DMECs are Australia, Austria, Canada, EEC (10 countries), Finland, Japan, New Zealand, Norway, Sweden, Switzerland and the United States.

30 18.4.86
Table A4
Projected Changes in the Structure of Developing Countries’ Intra-Trade in Primary and Processed Commodities Under Preferential Tariffs
1981 Value of
intra-trade ($ million) Projected change in developing country intra-trade In processed commodities under tariff preferences a/
Processing chain
Primary stage ______
Processed products _______
Share of processed products ________
Value es = ∞ ___________
($ million) Processed products’ share es = 3.0 es = 1.0 es = ∞ es = 3.0 es = 1.0 _______ ______ _____ ______ ______
All Commodities 51,644.8 13,874.9 21.2 2,529.5 1,894.4 1,365.0 2.4 1.8 1.3 All commodities (excl. petroleum) 6,871.0 6,182.7 47.4 1,491.4 1,132.1 845.7 3.9 3.0 2.1 of which: Meat 547.7 49.8 8.0 12.6 9.8 8.1 1.8 1.5 1.2 Fish 260.4 125.6 32.5 36.0 29.4 23.6 4.1 3.1 2.4 Fruit 857.9 157.3 15.5 23.9 19.2 15.2 1.1 0.8 0.5 Vegetables 555.6 73.7 11.7 9.8 9.6 9.3 0.6 0.6 0.6 Vegetables oils b/ 70.0 147.5 67.8 9.3 6.9 4.8 0.1 -0.1 -0.3 Coffee, cocoa and sugar 1,798.9 121.5 6.3 38.2 30.9 24.5 1.4 1.1 0.9 Leather 54.8 123.7 69.2 43.8 30.2 22.1 8.1 4.3 3.3 Rubber 1,295.3 262.3 16.9 151.8 91.0 63.4 7.1 4.3 3.0 Wood and paper 69.6 2,107.0 96.8 258.7 217.3 157.9 -0.5 -0.5 -0.5 Wool 25.5 26.7 51.1 25.9 21.1 17.1 12.7 10.6 8.7 Cotton 486.7 348.2 41.7 258.9 186.8 132.4 13.0 9.9 7.3 Iron 314.4 1,235.2 79.7 300.1 233.9 186.2 3.1 2.4 2.0 Copper 183.2 697.7 79.2 157.3 115.2 79.4 2.8 2.0 1.3 Bauxite 35.4 306.0 89.6 87.9 71.6 57.6 2.1 1.8 1.5 Lead 11.0 51.2 82.3 6.8 5.2 3.9 1.5 1.1 0.8 Zinc 26.4 85.7 76.4 15.2 12.2 9.8 2.4 1.9 1.6 Tin 56.9 128.5 69.3 28.7 20.5 13.6 4.0 2.9 1.9 Phosphates 221.3 135.1 37.9 26.5 21.3 16.8 2.7 1.9 1.4 Petroleum 44,773.8 7.692.2 14.7 1,038.1 762.3 519.3 1.3 0.9 0.6
Note: The projected trade changes shown in this table are based on the assumption that any non-tariff barriers applied to these products are also liberalized to an extent that the full effects of the tariff preferences can be realized. Trade diversion estimates, which are incorporated in the total figures, are based on an assumed elasticity of substitution of 1.5 between preference receiving and other products. See Cline (1978) for a discussion covering this latter point. Table 1 shows the SITC product groups that are included in the “All Commodities” projections as well as in the individual commodity processing chains. a/ Processed commodities are defined as all items other than the stage one goods listed in Table 1 of this study. b/ Including groundnuts, copra, palm kernel oil and oilseeds.

31 18.4.86
Table A5
Analysis of the influence of a Debt-Related Trade Liberalization on the Export of All and Selected Developing Countries
Annual Export Increase from a Preferential Trade Liberalization
1980 Value of Imports ($mill)
EEC Japan United States
Present Value of Increased Exports due to Preferential Liberalization ($ mill)
1983 Estim. Debt ($mill)
EEC JAPAN USA
Tariffs Tariffs & NTBs
Tariffs Tariffs & NTBs
Tariffs Tariffs & NTBs
Tariffs Tariffs & NTBs
Developing Countries All Developing Countries 812,900 167,652.1 76,777.1 67,203.4 7,150.8 19,013.2 2,880.0 3,881.2 4,492.6 11,869.1 290,468 695.270 Selected Latin American Countries Argentina 30.000 1,906.4 240.7 719.4 96.8 419.0 12.0 36.0 10.8 108.8 2,394 11,276 Brazil 81,918 5,693.8 1,426.8 3,401.7 284.0 1,377.9 39.6 70.8 293.8 626.3 12,350 41,500 Colombia 12,288 1,528.8 167.6 1,476.8 124.7 203.6 6.4 8.4 27.1 97.5 3,164 6,190 Chile 12,394 1,435.0 411.1 514.4 20.6 87.2 9.4 20.8 3.7 20.9 674 2,578 Ecuador 6,923 256.3 255.0 927.1 24.1 28.8 38.0 41.1 2.4 6.2 1,290 1,522 Mexico 75,697 1,613.0 505.8 10,992.0 74.9 198.7 14.5 40.1 421.0 955.0 10,208 23,876 Peru 10,950 1,427.9 475.2 707.1 12.6 18.7 11.2 15.2 8.0 10.6 636 890 Venezuela 24,522 2,904.2 684.4 5,171.3 119.9 304.2 31.8 32.7 65.6 84.0 4,346 8,418 Other Selected Developing Countries Algeria 19,824 5,376.9 448.3 6,548.6 80.3 102.8 11.6 11.6 29.6 29.6 2,430 2,880 Egypt 26,494 2,577.0 122.3 441.0 70.9 209.2 1.2 1.3 4.7 16.9 1.536 4.520 Republic of Korea 35,414 1,906.7 1,967.9 3,509.1 390.4 916.1 208.7 359.4 787.5 2,148.0 27,732 68,470 Moroco 11,850 1,253.4 37.7 20.8 118.4 332.2 2.6 13.5 1.7 4.8 2,454 7.010 Pakistan 12,639 1,237.7 197.8 99.3 99.6 320.0 5.7 28.5 10.5 68.9 2,316 8,348 Philippines 18,374 1,830.9 771.3 1,648.5 90.4 806.3 79.7 136.5 188.6 462.9 7,174 28,114 Turkey 18,836 1,619.6 36.2 189.3 138.9 508.5 4.2 4.2 6.1 15.4 2,984 10,562 Yugoslavia 12,090 7,823.9 27.9 423.9 701.3 1,484.0 7.6 7.6 33.4 86.4 14,846 31,560

32 Other papers in this series
No. 1 M.M. Sakbani The Enduring Financial and Monetary Consequences of the US Freeze: An SDR Recycling Proposal 2 M.M. Sakbani Towards Arab Monetary Integration: A Dynamic Application of the Theory of Optimal Currency Areas 3 I.G. Karmiloff External Assistance to Least Developed Countries: An Anonymous Country’s Case 4 G.A. Cornia Development Strategies for the 1980s: Old Myths and New Ideas 5 S. Kojima Neoclassical Theory of a New International Economic Order: An Asymmetric Two-Country, Three-Commodity Approach 6 Andrzej Olechowski The Influence of Non-Tariff Barriers on and Exports from Socialist Countries Alexander J. Yeats of Eastern Europe 7 - - 8 Dani Rodrik Comparative Advantage and Structural Change: A Quantitative Analysis 9 Edward Dommen Invisible Exports from Islands 10 Brian Ames Empirical Review of the Financial Crisis in Mexico 11 Peter Faust The United Nations Convention on a Code of Conduct for Liner Conferences 12 Samuel Laird Intra-Industry Trade of Developing Refik Erzan Countries and Some Policy Issues 13 Edward Dommen Footloose and Fancy-Free? People who move as a source of income for least developed countries 14 Mehdi Shafaeddin Some conceptual issues on diversification, bargaining power and self-reliance in the context of an oil exporting country 15 Jürgen Richtering Modelling fertility and mortality rates in the framework of a demographic-economic model 16 Refik Erzan, On the potential for expanding South-South trade Samuel Laird and through the extension of mutual preferences among

33 Alexander Yeats developing countries 17 Reinaldo Goncalves Intercountry Comparison of Export and Performance and Output Growth Jürgen Richtering 18 Guy Karsenty and The Generalized System of Sam Laird Preferences - A quantitative assessment of the direct trade effects and of policy options