the ultimate guide to kpis for entrepreneurs
TRANSCRIPT
www.grow.com / 801.560.2300 The Ultimate Guide to KPIs for Entrepreneurs / 1
The Ultimate Guide to KPIs for Entrepreneurs

www.grow.com / 801.560.2300 The Ultimate Guide to KPIs for Entrepreneurs / 2
The key to accelerating the growth of your business is to make good decisions
quickly. And the faster you make good decisions, the faster your business
will grow. Having good data feeds good decisions, but data isn’t meaningful
unless you can compare it to key performance metrics or indicators of success.
Although each situation is unique, there is a shared set of Key Performance
Indicators (KPIs) that can help you increase the likelihood of reaching your goals.
This eBook defines core principles—along with 35 KPIs—for accelerating
the growth of your business. Tracking and reporting key metrics in a
visual way allows you and your team to make better decisions fast. By
selecting a subset of these KPIs that are most relevant to your business,
you can reinforce the things that are going well and get back on track
in areas that are misaligned. This is the essence of effective leadership:
knowing where you want to go and what needs to happen to get there.
1) Principle Number One:
Clarify Your Business Objectives and Business Strategy
Clarifying your business objectives and business strategy are the first
two steps in defining meaningful KPIs. Business objectives state what
you want to accomplish and by when. They must be time bound to set
the gear ratios for every other metric and how they mesh together.
As A.G. Lafley, Chairman of the Board, President, and Chief Executive Officer
of Procter & Gamble, and Roger Martin, former Dean of the Rotman School
of Management at the University of Toronto, explain in their book “Playing
to Win”, a business strategy can be distilled down to five seemingly simple
questions. As Lafley and Martin explain, making choices is at the heart of
making strategy. You have to be willing to make choices if you want to win.
Here are Lafley and Martin’s five questions as published
in a Business Insider article by Max Nisen:
1. What is winning?
If you aren’t trying to win, if you’re just trying to participate, you are wasting the
time of your people and the money of your investors. A company has to define its
purpose strategically, decide what specific victories would lead to its ideal future.
2. Where am I going to play to win?
You can’t win the whole world or please everybody. Trying to be all things
to all people is a recipe for failure. You have to strategically narrow
the field to the geographies, demographics, and channels where your
company is most competitive, and can get the best possible results.
3. How am I going to win where I play?
This choice is intimately connected with the former. It’s deciding
The Need for Speed

www.grow.com / 801.560.2300 The Ultimate Guide to KPIs for Entrepreneurs / 3
how to create unique value, and how the company can deliver
it over a long period to create a superior return.
4. What are my core competencies that are going to enable me to win?
In order to make the above decisions work, they have to be based
on and supported by the things that a company’s best at. For P&G,
it was innovating quickly and understanding consumers.
5. What management systems and measures are going to help me execute?
Strategies have to be measured and executed by people.
Companies have to decide who they need, how to enable them,
and how they can tell whether the strategy’s succeeding. i
2) Principle Number Two:
Eliminate Vanity Metrics
David Lee Roth was the lead singer for Van Halen, the rock and roll band, in the
1970s. Van Halen was one of the first groups to tour smaller cities in outlying
areas in the U.S. The basketball arenas and other venues in these locations
weren’t designed to support the band’s heavy staging equipment. David Lee
Roth stipulated in the group’s contract rider that there should be a bowl of M&Ms
backstage with one key exception: all of the brown M&Ms had to be removed.
Roth would sometimes throw a fit—going so far as to trash the room—if he
found any brown M&Ms snuck through. The media interpreted these tirades as
an act of vanity. In reality, these antics simply created an intimidating persona,
putting venues on notice that Van Halen expected them to read and honor
their contract rider. The M&M metric gauged whether facilities managers had
read the contract and taken its quality structural specifications seriously.
As Eric Ries, the founder of The Lean Startup movement and book,
stated in an Author@Google talk, if you’re not scientific about learning
and validating what really drives your business, it’s easy to fall prey to
vanity metrics that may sound threatening to competitors in a press
release, but really have little to no effect on the growth of your business.
“The metrics have got to tell you about the quality of your business.”
3) Principle Number Three:
Use Both Leading Indicators and Lagging Indicators
One of the tendencies in defining Key Performance Indicators is to focus
exclusively on desired results. While this is an important aspect of the
goal setting process, it’s only half of the equation. In addition to clarifying
outcomes (also known as “lagging indicators”), it’s critical to identify
inputs or “leading indicators” as well. You need to measure and track
The Need for Speed

www.grow.com / 801.560.2300 The Ultimate Guide to KPIs for Entrepreneurs / 4
both kinds of indicators if you want to improve your odds of success.
Leading indicators are upstream business inputs that directly affect downstream
business outcomes. For example, if a software company wants to close 50 sales
in the month of October (the outcome), its leaders need to figure out how many
software demos and sales conversations (the inputs) it takes to close a deal, so
they can translate those upstream numbers into incentives for their salespeople.
Extending this example further, the marketing team needs to figure
out how many qualified leads they need to deliver to the sales team to
generate the necessary number of demo appointments and conversations
with decision makers to hit the sales target. In turn, the number of leads
informs the investment needed for customer acquisition campaigns
and content marketing programs. Once you’ve identified the leading
Key Performance Indicators, you can design learning experiments
to optimize the activities that have the most impact on them.
There’s nothing worse than waiting to review results until after they’re
already in the rear view mirror and it’s too late to do anything about them. By
identifying the most impactful leading indicators or inputs early, and holding
teams accountable for delivering results all along the way, you can significantly
increase the probability of achieving your desired business outcomes.
4) Principle Number Four:
Create Interlocking KPIs
Well-designed interlocking KPIs can be a catalyst that forges healthy
interdependencies across departments in your company and creates
alignment behind your business strategy. For instance, instead of
running away from criticisms of its labor and manufacturing practices in
developing countries, Nike has embraced the need to become a more
sustainable business across its entire value chain as strategic advantage.
This strategic imperative has generated a whole new suite of Corporate
Responsibility (CR) KPIs for Nike, like its Product Sustainability Indexes,
which rate “the sustainability of footwear and apparel designs” and hold
the company and its teams accountable to industry-leading standards.
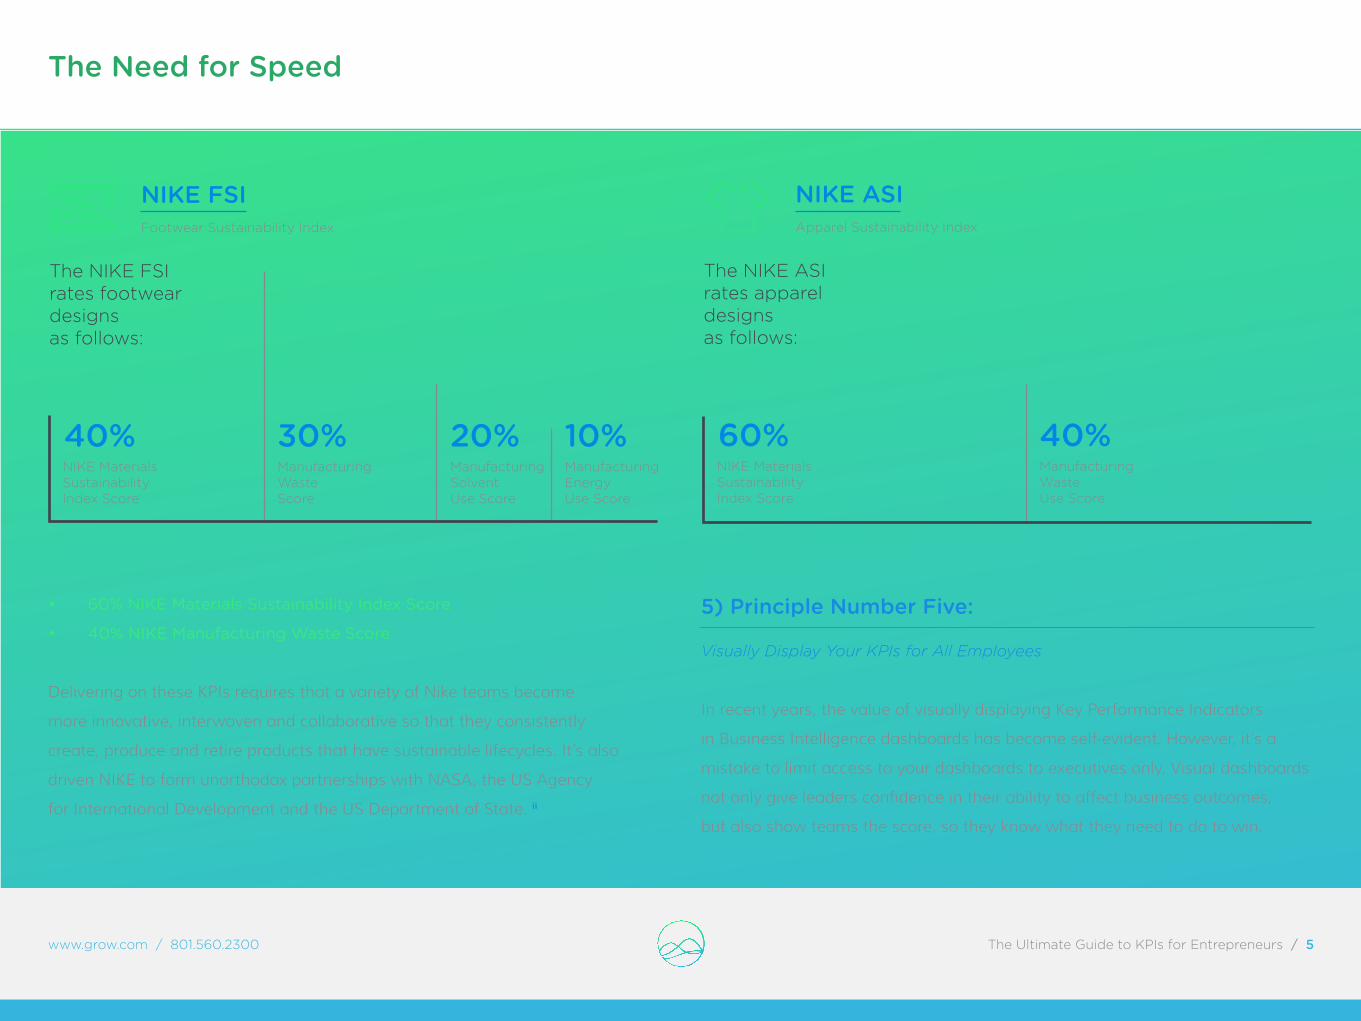
The Nike Footwear Sustainability Index (FSI) rates footwear designs as follows:
• 40% NIKE Materials Sustainability Index Score
• 30% Manufacturing Waste Score
• 20% Manufacturing Solvent Use Score
• 10% Manufacturing Energy Use Score
The Nike Apparel Sustainability Index (ASI) rates apparel designs as follows:
The Need for Speed
www.grow.com / 801.560.2300 The Ultimate Guide to KPIs for Entrepreneurs / 5
• 60% NIKE Materials Sustainability Index Score
• 40% NIKE Manufacturing Waste Score
Delivering on these KPIs requires that a variety of Nike teams become
more innovative, interwoven and collaborative so that they consistently
create, produce and retire products that have sustainable lifecycles. It’s also
driven NIKE to form unorthodox partnerships with NASA, the US Agency
for International Development and the US Department of State. ii
5) Principle Number Five:
Visually Display Your KPIs for All Employees
In recent years, the value of visually displaying Key Performance Indicators
in Business Intelligence dashboards has become self-evident. However, it’s a
mistake to limit access to your dashboards to executives only. Visual dashboards
not only give leaders confidence in their ability to affect business outcomes,
but also show teams the score, so they know what they need to do to win.
The Need for Speed
40% 30% 20% 10%NIKE MaterialsSustainabilityIndex Score
The NIKE FSIrates footwear designsas follows:
ManufacturingWasteScore
ManufacturingSolventUse Score
ManufacturingEnergyUse Score
Footwear Sustainability Index
NIKE FSI
60% 40%NIKE MaterialsSustainabilityIndex Score
The NIKE ASIrates appareldesignsas follows:
ManufacturingWasteUse Score
Apparel Sustainability Index
NIKE ASI
www.grow.com / 801.560.2300 The Ultimate Guide to KPIs for Entrepreneurs / 6
The impact of performance-based metrics is multiplied significantly when
companies display their KPIs for all employees to see. Granted, some company
goals and KPIs are too proprietary or sensitive to share openly and you should
choose modern business intelligence (BI) software that allows you to control
permissions so that each team of employees can view the metrics that are
appropriate for their role. With that being said, however, there’s no reason why
dashboards shouldn’t continually be on display on at least a departmental level.
6) Principle Number Six:
Refresh Your KPI Data in Real Time
Until recently, Excel spreadsheets were the only viable option for creating
and maintaining rudimentary business intelligence dashboards for small and
medium businesses. While being a convenient and relatively inexpensive tool,
Excel lacks the ability to automate the collection and display of data from
multiple sources in real time. This may be adequate for certain businesses with
KPIs that don’t change more than once a month or even less frequently, but
for the majority of businesses, a monthly refresh rate is not nearly frequent
enough to respond to today’s dynamic business environment. You need to be
able to make adjustments and make opportunistic moves on the fly. Painting
an accurate and actionable picture of how your business is performing at
any moment in time requires that your BI system have the ability to collect
and refresh the data behind your Key Performance Indicators in real time.
7) Principle Number Seven:
Combine Internal Data with Data From Third-Party Sources
Another specification to look for in selecting a qualified Business Intelligence
dashboard solution is its ability to collect and combine your internal data from
Excel spreadsheets with data from third-party applications like QuickBooks,
Salesforce, Dropbox, and Twitter. It should be simple to set up without
needing a lot of help from your over-committed IT department, and it should
integrate all of your data into one visual dashboard. Ideally, it should come
with a library of pre-built KPI templates so you can simply drag and drop the
data you want into your dashboard. It should be simple to see analytics for
a range of factors from interpreting social media data to financial metrics.
The Need for Speed

www.grow.com / 801.560.2300 The Ultimate Guide to KPIs for Entrepreneurs / 7
Having reviewed these seven principles, you’ll appreciate the importance of the following 35 Key Performance Indicators for entrepreneurs. All 35 metrics may not be relevant to your business (an inventory metric won’t be relevant to services company), but you’ll want to review all of these KPIs to determine the ones that can help you and your teams achieve your desired business outcomes. Please note that the Key Performance Indicators are grouped alphabetically
by function, not by order of importance or priority.
35 KPIs for Entrepreneurs
www.grow.com / 801.560.2300 The Ultimate Guide to KPIs for Entrepreneurs / 8
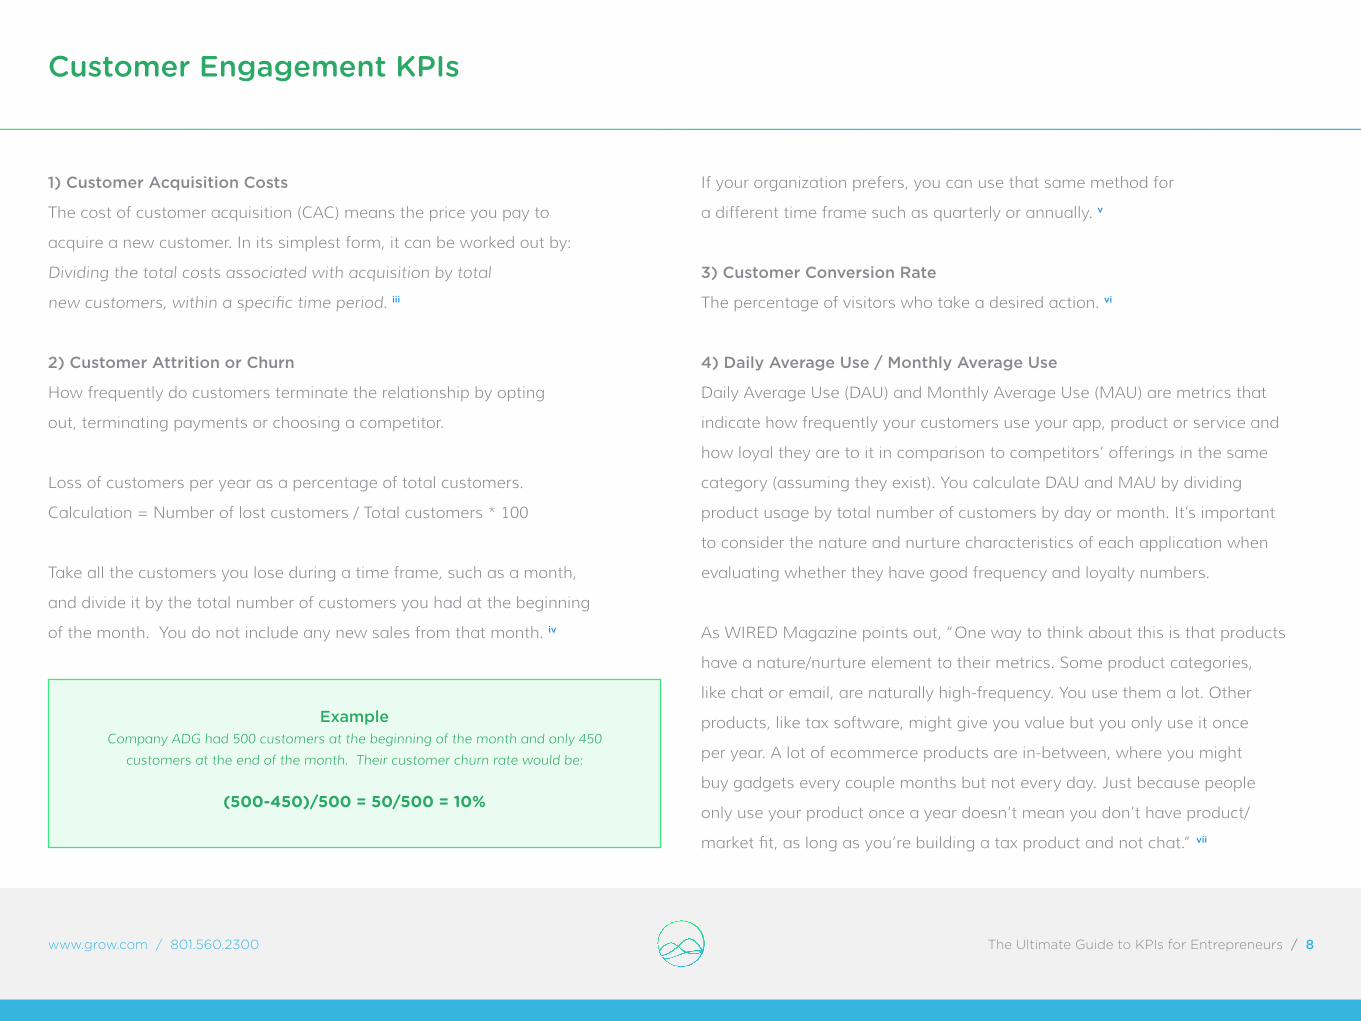
1) Customer Acquisition Costs
The cost of customer acquisition (CAC) means the price you pay to
acquire a new customer. In its simplest form, it can be worked out by:
Dividing the total costs associated with acquisition by total
new customers, within a specific time period. iii
2) Customer Attrition or Churn
How frequently do customers terminate the relationship by opting
out, terminating payments or choosing a competitor.
Loss of customers per year as a percentage of total customers.
Calculation = Number of lost customers / Total customers * 100
Take all the customers you lose during a time frame, such as a month,
and divide it by the total number of customers you had at the beginning
of the month. You do not include any new sales from that month. iv
Example Company ADG had 500 customers at the beginning of the month and only 450
customers at the end of the month. Their customer churn rate would be:
(500-450)/500 = 50/500 = 10%
If your organization prefers, you can use that same method for
a different time frame such as quarterly or annually. v
3) Customer Conversion Rate
The percentage of visitors who take a desired action. vi
4) Daily Average Use / Monthly Average Use
Daily Average Use (DAU) and Monthly Average Use (MAU) are metrics that
indicate how frequently your customers use your app, product or service and
how loyal they are to it in comparison to competitors’ offerings in the same
category (assuming they exist). You calculate DAU and MAU by dividing
product usage by total number of customers by day or month. It’s important
to consider the nature and nurture characteristics of each application when
evaluating whether they have good frequency and loyalty numbers.
As WIRED Magazine points out, “One way to think about this is that products
have a nature/nurture element to their metrics. Some product categories,
like chat or email, are naturally high-frequency. You use them a lot. Other
products, like tax software, might give you value but you only use it once
per year. A lot of ecommerce products are in-between, where you might
buy gadgets every couple months but not every day. Just because people
only use your product once a year doesn’t mean you don’t have product/
market fit, as long as you’re building a tax product and not chat.” vii
Customer Engagement KPIs

www.grow.com / 801.560.2300 The Ultimate Guide to KPIs for Entrepreneurs / 9
5) Life Time Value of the Customer Relationship
Lifetime Value (LTV) of the Customer Relationship is a formula that
helps a marketing manager arrive at the dollar value associated with
the long-term relationship with any given customer, revealing just how
much a customer relationship is worth over a period of time. viii
6) Net Promoter Score
The Net Promoter Score (NPS) is an index ranging from -100 to
100 that measures the willingness of customers to recommend
a company’s products or services to others. It is used as a proxy
for gauging the customer’s overall satisfaction with a company’s
product or service and the customer’s loyalty to the brand.
NPS programs ask just one quantitative question: “How likely are
you to recommend this business to a friend or colleague?”
Customers are surveyed on one single question. They are asked
to rate on an 11-point scale the likelihood of recommending
the company or brand to a friend or colleague.
“On a scale of 0 to 10, how likely are you to recommend this
company’s product or service to a friend or a colleague?”
Customer Engagement KPIs
Detractors‘Detractors’ gave a score lower or equal to 6. The product or the service does not particularly thrill them. They, with all likelihood, won’t purchase again from the company and could potentially damage the company’s
reputation through negative word of mouth.
Passives‘Passives’ gave a score of 7 or 8. They are somewhat satisfied but could easily
switch to a competitor’s o�ering if given the opportunity. They probably wouldn’t spread any negative word-of-mouth, but are not enthusiastic enough
about your products or services to actually promote them.
Promoters‘Promoters’ answered 9 or 10. They love the company’s products and services. They are the repeat buyers and the enthusiastic evangelists who recommends
the company products and services to other potential buyers.

www.grow.com / 801.560.2300 The Ultimate Guide to KPIs for Entrepreneurs / 10
Based on their rating, customers are then classified in 3
categories: detractors, passives and promoters.
The NPS is determined by subtracting the percentage of customers who are
detractors from the percentage who are promoters. What is generated is a
score between -100 and 100. At one end of the spectrum, if when surveyed,
all of the customers gave a score lower or equal to 6, this would lead to a
NPS of -100. On the other end of the spectrum, if all of the customers were
answering the question with a 9 or 10, then the total NPS would be 100. ix
7) Referral Rate
Your referral rate is the best test for your top-line growth and customer
loyalty. Companies spend lots of time and money on complex tools to
assess customer satisfaction. But they’re measuring the wrong thing. The
best predictor of top-line growth can usually be captured in a single survey
question: Would you recommend this company to a friend? This finding
is based on two years of research in which a variety of survey questions
were tested by linking the responses with actual customer behavior
(purchasing patterns and referrals) and ultimately with company growth.
Surprisingly, the most effective question wasn’t about customer satisfaction
or even loyalty per se. In most of the industries studied, the percentage of
customers enthusiastic enough about a company to refer it to a friend or
colleague directly correlated with growth rates among competitors. x
8) Social Engagement
It’s more important to measure how many of your followers are
engaging with your social media posts and content than how many
followers or likes you have. You can do this by measuring your daily and
monthly engagement rates, using the following types of behaviors:
• RSS feed subscriptions
• Bookmarks, tags, ratings
• Viewing of high-value or medium-value content (as valued from the
organization’s point-of-view). ‘Depth’ of visit can be combined with this
variable
• Inquiries
• Providing personal information
• Downloads
• Content resyndication
• Customer reviews
• Comments: the quality of comments is another indicator of the degree
of engagement
• Ratio between posts and comments plus trackbacks xi
9) Top 10% of Customers to % Total Revenue
How much of your revenue do the top 10 percent of your customers contribute to your
business? In other words, do a few accounts make up the majority of your revenue?
Customer Engagement KPIs

www.grow.com / 801.560.2300 The Ultimate Guide to KPIs for Entrepreneurs / 11
Customer Engagement KPIs
10) Website Referral Sources (how are potential clients finding you)
With Web traffic, a “referral” is like a recommendation from one website to
another. Google Analytics helps you view these referrals, which then add to your
understanding of how customers find your website and what they do once they
get there. Referral traffic can be a strong indicator of which external sources
are most valuable in helping your business achieve its goals, proving once and
for all, for example, whether your Facebook page really does add value. xii
11) Website Visitors
Unique website visitors refers to the number of distinct individuals
requesting pages from the website during a given period, regardless
of how often they visit. (“Visits” refers to the number of times a site is
visited, no matter how many unique visitors make up those sessions.)
The purpose of tracking unique visitors is to help marketers understand
website user behavior. Because a visitor can make multiple visits in a
specified period, the number of visits will be greater than the number of
visitors. A visitor is sometimes referred to as a unique visitor or a unique
user to clearly convey the idea that each visitor is only counted once. xiii
www.grow.com / 801.560.2300 The Ultimate Guide to KPIs for Entrepreneurs / 12
12) Cash Balance
The ideal amount of cash that a company wishes to hold in reserve at
any given point in time is a company’s Cash Balance. This figure hopes to
strike a balance between the investment opportunity costs of holding too
much cash and the balance sheet costs of holding too little. Companies
with excess cash on hand may be missing out on investment opportunities,
while companies that are cash poor can often be forced to make otherwise
undesirable transactions to free up more operating capital. xiv
13) EBITDA
A company’s earnings before interest, taxes, depreciation,
and amortization (EBITDA) is an accounting measure calculated
using a company’s net earnings, before interest expenses, taxes,
depreciation and amortization are subtracted, as a proxy for a
company’s current operating profitability, i.e., how much profit it
makes with its present assets and its operations on the products it
produces and sells, as well as providing a proxy for cash flow. xv
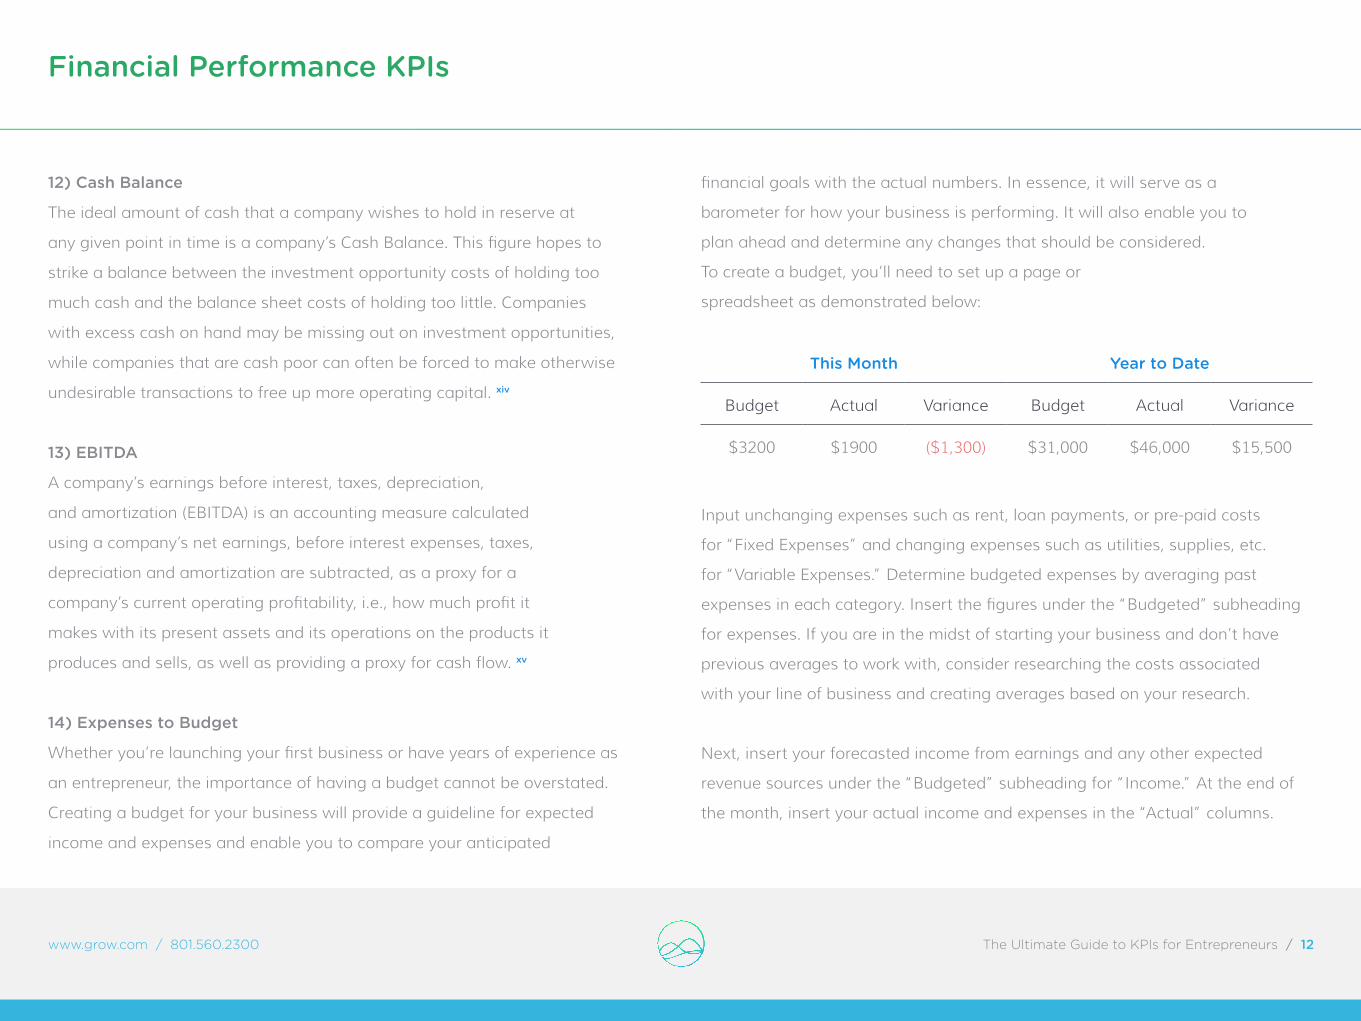
14) Expenses to Budget
Whether you’re launching your first business or have years of experience as
an entrepreneur, the importance of having a budget cannot be overstated.
Creating a budget for your business will provide a guideline for expected
income and expenses and enable you to compare your anticipated
financial goals with the actual numbers. In essence, it will serve as a
barometer for how your business is performing. It will also enable you to
plan ahead and determine any changes that should be considered.
To create a budget, you’ll need to set up a page or
spreadsheet as demonstrated below:
This Month Year to Date
Budget Actual Variance Budget Actual Variance
$3200 $1900 ($1,300) $31,000 $46,000 $15,500
Input unchanging expenses such as rent, loan payments, or pre-paid costs
for “Fixed Expenses” and changing expenses such as utilities, supplies, etc.
for “Variable Expenses.” Determine budgeted expenses by averaging past
expenses in each category. Insert the figures under the “Budgeted” subheading
for expenses. If you are in the midst of starting your business and don’t have
previous averages to work with, consider researching the costs associated
with your line of business and creating averages based on your research.
Next, insert your forecasted income from earnings and any other expected
revenue sources under the “Budgeted” subheading for “Income.” At the end of
the month, insert your actual income and expenses in the “Actual” columns.
Financial Performance KPIs

www.grow.com / 801.560.2300 The Ultimate Guide to KPIs for Entrepreneurs / 13
Financial Performance KPIs
Finally, calculate the difference between the budgeted figures and the actual
numbers. Place the figures in the “Difference” column and determine if
your budget was in line with your actual numbers. If not, it is important to
identify why the actual numbers varied from the budgeted figures, regardless
of whether you incurred more expenses or income than anticipated.
By determining the reason for the difference, you can either identify a potential
problem and fix it or capitalize on a potential opportunity you had not initially
recognized. After determining the reasons for any differences, revise the next
month’s budget with your new-found information in mind. Remember, it’s
important to remain agile and make changes to your budget as needed. xvi
15) Gross Profit Margin (Net Revenue)
Gross Profit Margin is a financial metric used to assess a firm’s financial
health by revealing the proportion of money left over from revenues
after accounting for the cost of goods sold. Gross profit margin serves
as the source for paying additional expenses and future savings.
Gross Profit Margin = (Revenue - COGS) / (Revenue)
Where: COGS = Cost of Goods Sold
Also known as “Gross Margin” xvii
16) Net Income to Budget
A company’s total earnings (or profit) is a company’s the Net Income
to Budget. Net income is calculated by taking revenues and adjusting
for the cost of doing business, depreciation, interest, taxes and other
expenses. This number is found on a company’s income statement and
is an important measure of how profitable the company is over a period
of time. The measure is also used to calculate earnings per share.
Net Income is often referred to as “the bottom line” since it is
listed at the bottom of the income statement. In the U.K., net
income is known as “profit attributable to shareholders.” xviii
17) Operating Profit Margin
A measurement of what proportion of a company’s revenue is left
over after paying for variable costs of production such as wages, raw
materials, etc. A healthy operating margin is required for a company
to be able to pay for its fixed costs, such as interest on debt. xix
18) Return on Assets (ROA)
This ratio indicates how profitable a company is relative to its total assets. The
return on assets (ROA) ratio illustrates how well management is employing
the company’s total assets to make a profit. The higher the return, the more
efficient management is in utilizing its asset base. The ROA ratio is calculated by
comparing net income to average total assets, and is expressed as a percentage.

www.grow.com / 801.560.2300 The Ultimate Guide to KPIs for Entrepreneurs / 14
Formula:
Return on Assets = (Net Income) / (Average Total Assets)
Components:
Return on Assets = ($732.50 / ($5,695.50 + $5,721.90) / 2) = 12.8%
As of December 31, 2005, with amounts expressed in millions,
Zimmer Holdings had net income of $732.50 (income statement),
and average total assets of $5,708.70 (balance sheet). By dividing,
the equation gives us an ROA of 12.8% for FY 2005.
Variations:
Some investment analysts use the operating-income figure instead
of the net-income figure when calculating the ROA ratio. xx
19) Return on Capital Employed
Return on Capital Employed (ROCE) is a financial ratio that measures a
company’s ability to earn a return on all of the capital it employs.
ROCE is calculated as:
Earnings Before Interest and Tax (EBIT) / Capital Employed
EBIT is a company’s revenue minus its cost of goods sold and operating
expenses. Capital employed is total assets minus current liabilities.
Typically, the higher the ROCE, the better, because a higher number
means the company is using capital more efficiently, which helps create
value for stockholders. Examining the ROCE of different companies is
one way investors can compare companies and decide what to invest in.
Examining the same company’s ROCE from year to year is also useful for
spotting performance trends; ideally, ROCE will be stable or growing. xxi
20) Revenue Growth Rate
Revenue growth gives a good picture of the rate at which
companies have been able to expand their businesses. This figure
represents the percentage growth in a company’s revenue over
either the trailing 12 months or the trailing year-to-date. xxii
21) Revenue Forecasts
Many entrepreneurs complain that building forecasts with any degree
of accuracy takes a lot of time—time that could be spent selling rather
than planning. But few investors will put money in your business if
you’re unable to provide a set of thoughtful forecasts. More important,
proper financial forecasts will help you develop operational and
staffing plans that will help make your business a success.
Financial Performance KPIs
www.grow.com / 801.560.2300 The Ultimate Guide to KPIs for Entrepreneurs / 15
Here’s some detail on how to go about building financial forecasts when you’re
just getting your business off the ground and don’t have the luxury of experience.
a. Start with expenses, not revenues. When you’re in the startup stage, it’s
much easier to forecast expenses than revenues. So start with estimates
for the most common categories of expenses as follows:
Fixed Costs / Overhead
1. Rent
2. Utility bills
3. Phone bills/communication costs
4. Accounting/bookkeeping
5. Legal/insurance/licensing fees
6. Postage
7. Technology
8. Advertising & marketing
9. Salaries
Variable Costs
1. Cost of Goods Sold
2. Materials and supplies
3. Packaging
4. Direct Labor Costs
5. Customer service
6. Direct sales
7. Direct marketing
8. Here are some rules of thumb you should follow when forecasting
expenses:
• Double your estimates for advertising and marketing costs since
they always escalate beyond expectations.
• Triple your estimates for legal, insurance and licensing fees since
they’re very hard to predict without experience and almost always
exceed expectations.
• Keep track of direct sales and customer service time as a direct
labor expense even if you’re doing these activities yourself during
the startup stage because you’ll want to forecast this expense
when you have more clients.
b. Forecast revenues using both a conservative case and an aggressive
case. If you’re like most entrepreneurs, you’ll constantly fluctuate
between conservative reality and an aggressive dream state, which
keeps you motivated and helps you inspire others.
Rather than ignoring the audacious optimism and creating forecasts
Financial Performance KPIs
www.grow.com / 801.560.2300 The Ultimate Guide to KPIs for Entrepreneurs / 16
based purely on conservative thinking, ... build two sets of revenue
projections (one aggressive, one conservative).
For example, your conservative revenue projections might have the
following assumptions:
1. low price point
2. two marketing channels
3. no sales staff
4. one new product or service introduced each year for the first three years
Your aggressive case might have the following assumptions:
1. low price point for base product, higher price for premium product
2. three to four marketing channels managed by you and a marketing
manager (Read my column on paying employees during the
startup stage to learn how you can afford a marketing manager.)
3. two salespeople paid on commission
4. one new product or service introduced in the first year, five more
products or services introduced for each segment of the market in
years two and three
c. Check the key ratios to make sure your projections are sound. After
making aggressive revenue forecasts, it’s easy to forget about expenses.
Many entrepreneurs will optimistically focus on reaching revenue goals
and assume the expenses can be adjusted to accommodate reality if
revenue doesn’t materialize. The power of positive thinking might help
you grow sales, but it’s not enough to pay your bills!
The best way to reconcile revenue and expense projections is by a
series of reality checks for key ratios. Here are a few ratios that should
help guide your thinking:
Gross Margin. What’s the ratio of total direct costs to total revenue
during a given quarter or given year? This is one of the areas in which
aggressive assumptions typically become too unrealistic. Beware of
assumptions that make your gross margin increase from 10 to 50
percent. If customer service and direct sales expenses are high now,
they’ll likely be high in the future.
Operating Profit Margin. What’s the ratio of total operating costs—
direct costs and overheard, excluding financing costs—to total revenue
during a given quarter or given year? You should expect positive
movement with this ratio. As revenues grow, overhead costs should
represent a small proportion of total costs and your operating profit
margin should improve. The mistake that many entrepreneurs make is
they forecast this break-even point too early and assume they won’t
need much financing to reach this point.
Financial Performance KPIs

www.grow.com / 801.560.2300 The Ultimate Guide to KPIs for Entrepreneurs / 17
Total Headcount Per Client. If you’re a one-woman-army entrepreneur
who plans to grow the business on your own, pay special attention
to this ratio. Divide the number of employees at your company—just
one if you’re a jack-of-all-trades—by the total number of clients you
have. Ask yourself if you’ll want to be managing that many accounts
in five years when the business has grown. If not, you’ll need to revisit
your assumptions about revenue or payroll expenses or both. xxiii
22) Capacity Utilization Rate
Capacity Utilization Rate (CUR) is a metric used to measure the rate at which
potential output levels are being met or used. Displayed as a percentage,
capacity utilization levels give insight into the overall slack that is in the
economy or a firm at a given point in time. If a company is running at a
70% CUR, it has room to increase production up to a 100% utilization rate
without incurring the expensive costs of building a new plant or facility.
Also known as “Operating Rate”. xxiv
= ((Actual Output - Potential Output) / (Potential Output)) × 100
23) Content Marketing Consumption
Measuring the effectiveness of content marketing is difficult. Curata built a four-
part framework based on an approach that Jay Baer proposed in his eBook on
this topic, and placed it into an inverted pyramid model as shown below:
If you take a look at the various types of content marketing metrics, you can
answer many of your most pressing content marketing strategy questions:
Financial Performance KPIs Internal Results KPIs
www.grow.com / 801.560.2300 The Ultimate Guide to KPIs for Entrepreneurs / 18
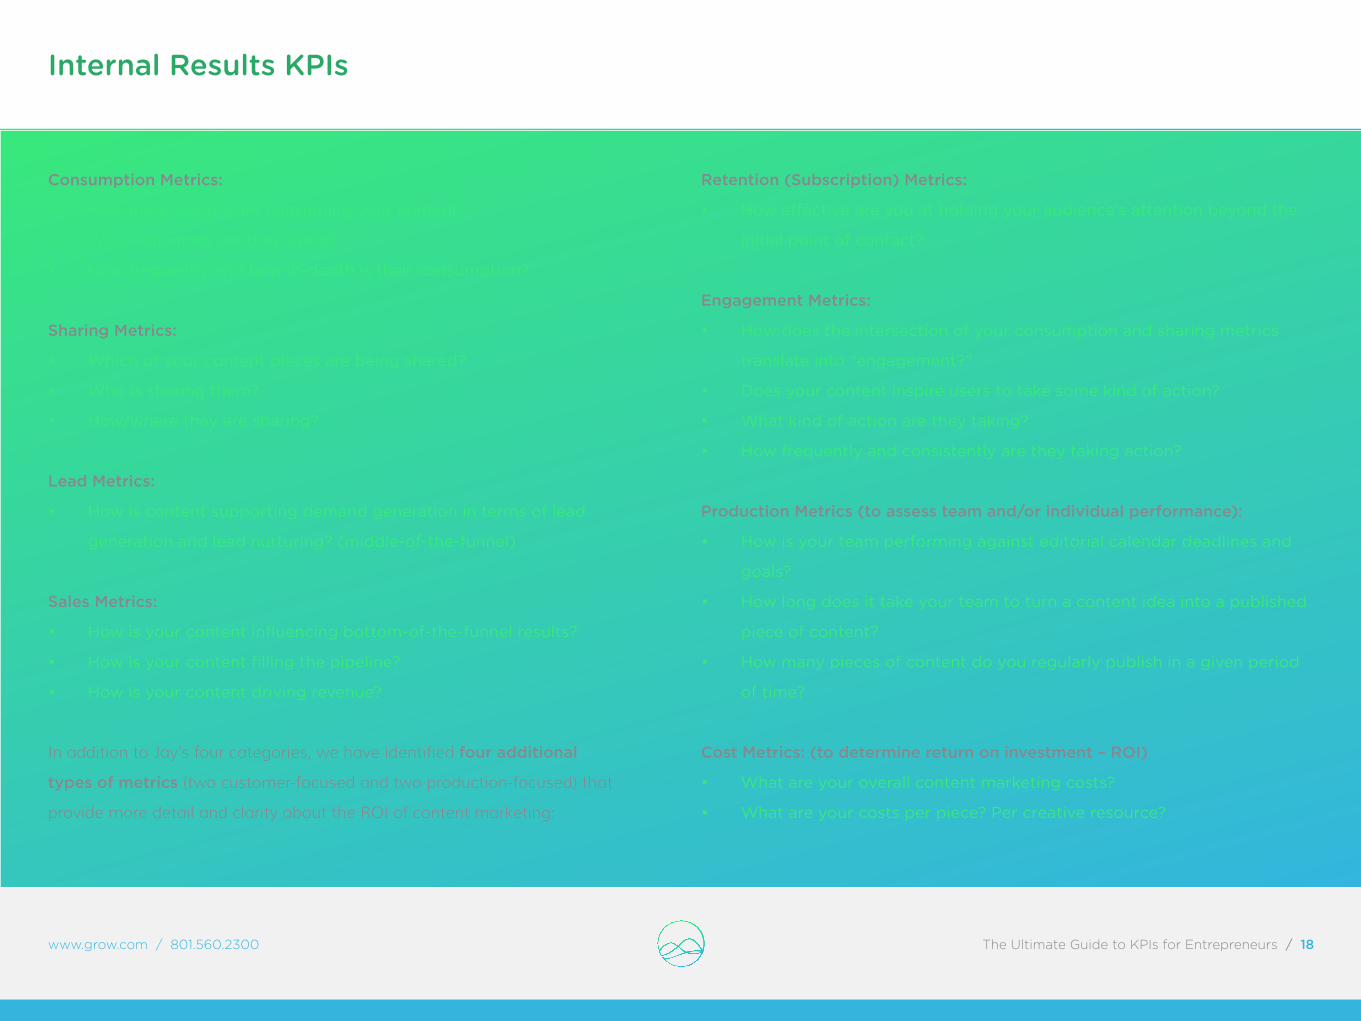
Consumption Metrics:
• How many people are consuming your content?
• Which channels are they using?
• How frequently and how in-depth is their consumption?
Sharing Metrics:
• Which of your content pieces are being shared?
• Who is sharing them?
• How/where they are sharing?
Lead Metrics:
• How is content supporting demand generation in terms of lead
generation and lead nurturing? (middle-of-the-funnel)
Sales Metrics:
• How is your content influencing bottom-of-the-funnel results?
• How is your content filling the pipeline?
• How is your content driving revenue?
In addition to Jay’s four categories, we have identified four additional
types of metrics (two customer-focused and two production-focused) that
provide more detail and clarity about the ROI of content marketing:
Retention (Subscription) Metrics:
• How effective are you at holding your audience’s attention beyond the
initial point of contact?
Engagement Metrics:
• How does the intersection of your consumption and sharing metrics
translate into “engagement?”
• Does your content inspire users to take some kind of action?
• What kind of action are they taking?
• How frequently and consistently are they taking action?
Production Metrics (to assess team and/or individual performance):
• How is your team performing against editorial calendar deadlines and
goals?
• How long does it take your team to turn a content idea into a published
piece of content?
• How many pieces of content do you regularly publish in a given period
of time?
Cost Metrics: (to determine return on investment – ROI)
• What are your overall content marketing costs?
• What are your costs per piece? Per creative resource?
Internal Results KPIs

www.grow.com / 801.560.2300 The Ultimate Guide to KPIs for Entrepreneurs / 19
Each of the above metrics can be measured across several content channels,
such as websites, blogs or social media. The following framework maps
the content marketing metrics (in the order they appear in the marketing
and sales funnel) against content channels. Using this framework, you can
get a better idea of how to measure content across all channels. xxv
24) Content Marketing Sharing
The number of people who shared one of your pieces content: an
article, a blog post, a video. (See the Curata framework above.)
25) Employee Engagement Score (how likely are they to
recommend internal jobs to friends and network)
Very few companies can achieve or sustain high customer loyalty without
a cadre of loyal, engaged employees. Engaged employees are enthusiastic
about their work and their company. Their enthusiasm is contagious. It rubs
off on other employees, and on customers. Employee promoters power strong
business performance because they provide better experiences for customers,
approach the job with energy, which enhances productivity, and come up with
creative and innovative ideas for product, process and service improvements.
Engaged employees:
• Are enthusiastic about their work
• Provide better customer experiences
• Influence other employees
• Provide feedback and ideas
Leaders, therefore, have good reason to want to earn the enthusiastic loyalty
of their employees. This means understanding employee engagement levels
and how to improve them. The traditional once-a-year employee survey
process, however, simply doesn’t meet the needs of most companies.
As a result, NPS® practitioners have developed an approach to employee
engagement based on the Net Promoter SystemSM itself. They systematically
search out those forms of employee engagement that have the biggest
potential impact on customer loyalty. They identify and strive to improve
workplace characteristics that support high customer loyalty.
To reinforce the cultural support provided by the Net Promoter SystemSM, they
align their approach to collecting and acting on employee feedback with their
approach to collecting and acting on customer feedback. They explicitly tie
together their customer system and their employee Net Promoter SystemSM. xxvi
26) Employee Net Promoter Score
The Employee Net Promoter Score (eNPS) approach, as employee NPS
practitioners call it, differs somewhat from customer NPS. It is intended
to determine how engaged employees are. Engaged employees are
enthusiastic about their work, provide better customer experiences,
influence other employees, and provide feedback and ideas.
Internal Results KPIs
www.grow.com / 801.560.2300 The Ultimate Guide to KPIs for Entrepreneurs / 20
Most adopters of employee Net Promoter scores, such as Rackspace and Apple,
have settled on one central question to determine employee engagement:
“On a scale of zero to ten, how likely is it you would recommend this company
as a place to work?” However, eNPS is an emerging science. In some cases,
Bain & Company has found that a second question can yield an even more
accurate gauge of the health of the employee relationship. The second question
is typically a variant of this: “How likely would you be to recommend this
company’s products or services to a friend or colleague?” (In some settings,
this question may need to be modified to include only appropriate friends or
colleagues—those who might be qualified to buy such a product or service.)
Because eNPS is meant to be part an ongoing operating system that can support
coaching, action and continuous improvement, companies often adjust the
frequency of the surveys to ensure a steadier stream of input than is provided by
traditional annual employee surveys. Some companies survey all their employees
every few months. Others survey employees on a staggered or rotating basis to
get a continuous stream of new input without putting a heavy survey burden on
individual employees. For example, they may send a survey to each employee
ninety days after hiring, and again on every anniversary of the hiring date.
An employee Net Promoter System makes the people side of the business far
more transparent. They support learning and experimentation. Companies
can discover which departments represent liabilities and which offer potential
best practices. They can see which team leaders are doing the best job and
which ones need more coaching. Ultimately, companies can also understand
which elements of employee sentiment and engagement most affect
customer loyalty advocacy so they can identify ways to improve both.
A note of caution: eNPS scores can be substantially lower than customer
scores. Employees often hold their company to even higher standards than
do customers. So before you initiate the employee survey process, be ready
to process some tough feedback and respond with appropriate action. xxvii
27) Employee Performance Scorecard (Objectively
measure the performance of A, B, C players)
A simple, straightforward way to rank employee performance is to
create an A, B, C scorecard that evaluates employees based on two
key measures: performance and cultural fit. Suggested definitions
for A-, B- and C-level performance are outlined below:
www.grow.com / 801.560.2300 The Ultimate Guide to KPIs for Entrepreneurs / 21
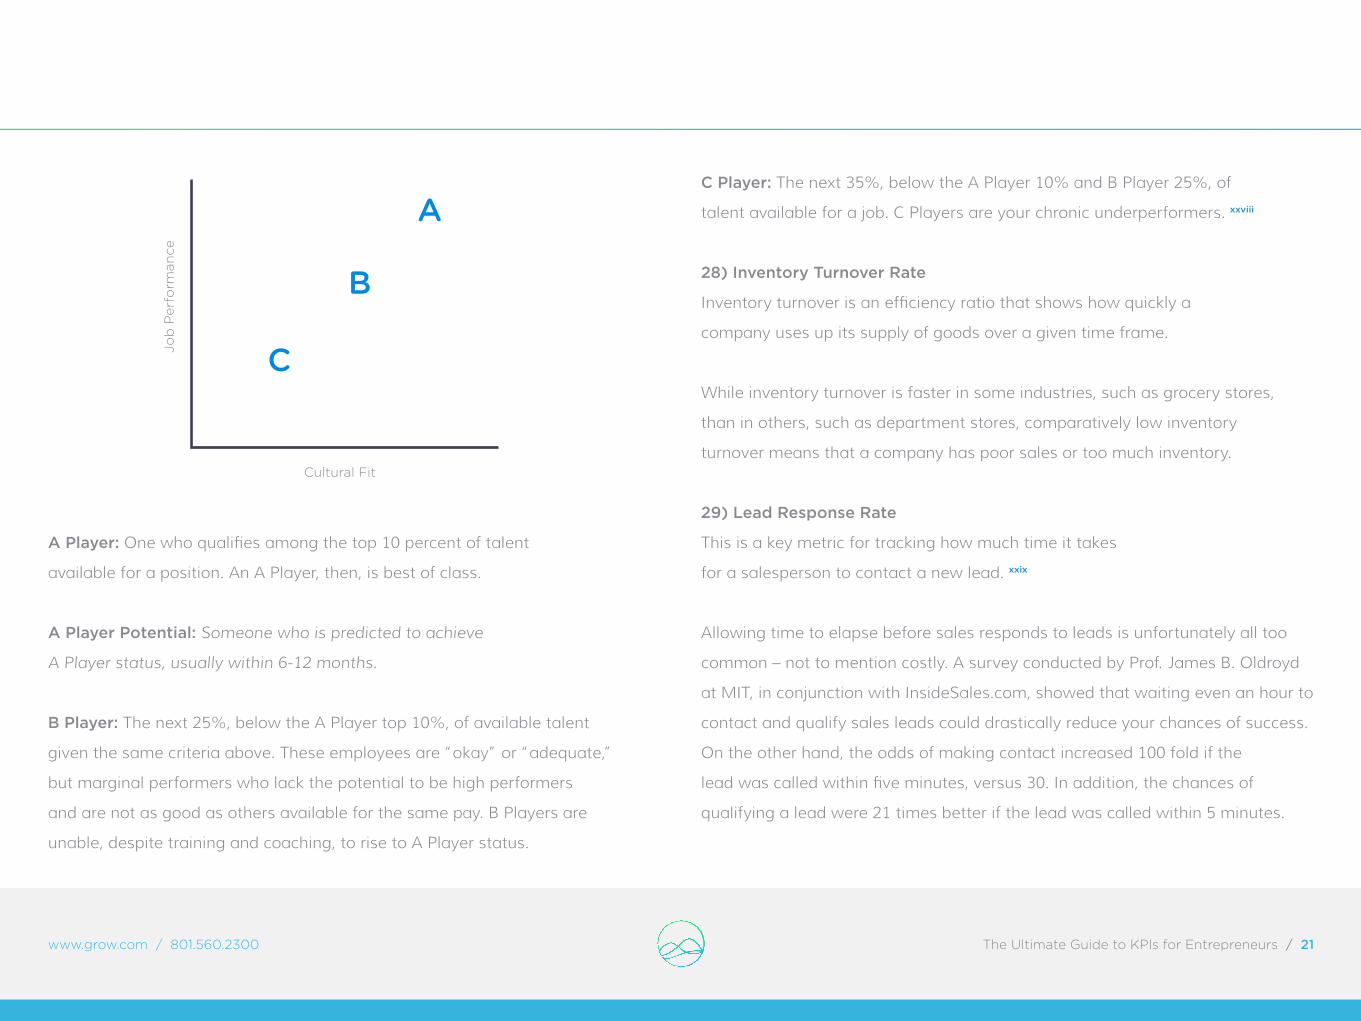
Cultural Fit
Job
Per
form
ance
C
B
A
A Player: One who qualifies among the top 10 percent of talent
available for a position. An A Player, then, is best of class.
A Player Potential: Someone who is predicted to achieve
A Player status, usually within 6-12 months.
B Player: The next 25%, below the A Player top 10%, of available talent
given the same criteria above. These employees are “okay” or “adequate,”
but marginal performers who lack the potential to be high performers
and are not as good as others available for the same pay. B Players are
unable, despite training and coaching, to rise to A Player status.
C Player: The next 35%, below the A Player 10% and B Player 25%, of
talent available for a job. C Players are your chronic underperformers. xxviii
28) Inventory Turnover Rate
Inventory turnover is an efficiency ratio that shows how quickly a
company uses up its supply of goods over a given time frame.
While inventory turnover is faster in some industries, such as grocery stores,
than in others, such as department stores, comparatively low inventory
turnover means that a company has poor sales or too much inventory.
29) Lead Response Rate
This is a key metric for tracking how much time it takes
for a salesperson to contact a new lead. xxix
Allowing time to elapse before sales responds to leads is unfortunately all too
common – not to mention costly. A survey conducted by Prof. James B. Oldroyd
at MIT, in conjunction with InsideSales.com, showed that waiting even an hour to
contact and qualify sales leads could drastically reduce your chances of success.
On the other hand, the odds of making contact increased 100 fold if the
lead was called within five minutes, versus 30. In addition, the chances of
qualifying a lead were 21 times better if the lead was called within 5 minutes.
www.grow.com / 801.560.2300 The Ultimate Guide to KPIs for Entrepreneurs / 22
It’s alarming to think about the sheer number of sales leads – and,
ultimately, sales – that are lost due to less-than-timely follow-up.
A second survey, conducted by InsideSales.com in conjunction
with Omniture, set out to examine and track the lead response and lead
nurturing strategies of 700 companies. For each company, a request
for information form was completed to begin the tracking process.
The survey’s results were truly eye-opening. Here are its key findings:
• Only 4.6 percent of the businesses used a strategy involving both phone
and email
• Less than 5 percent called within 24 hours
• 19 hours, 31 minutes was the average sales response time by email
• 36 hours, 57 minutes was the average sales response time by phone
• 45.2% of companies sales teams never responded at all
If nothing else, this survey clearly indicates that one of the most effective ways
to increase lead quality is to significantly decrease sales response time. xxx
30) Marketing Qualified Leads
Marketing Qualified Leads (MQL) shows whether a prospect has demonstrated
some level of interest or engagement that tells marketing this is a genuine lead.
Sales and marketing must work together to develop this definition. Despite
the best intentions, marketing often creates a qualified lead definition, but
sales never sees it—or agrees to it. Unless there is a clear definition and buy-
in from both sides, the MQL stage won’t do much for your organization. xxxi
31) Order Fulfillment Cycle Time
A continuous measurement defined as the amount of time from the customer
authorization of a sales order to the customer receipt of product. xxxii
32) Project Schedule Variance
The amount of time and money planned to be spent on a project
(or portion thereof) as compared to the corresponding work that
was accomplished within a specific period of time. xxxiii
33) Revenue to Social Engagement
Social commerce is a subset of electronic commerce that involves
social media and user contributions to assist in the online buying and selling
of products and services. Today, the range of social commerce has been
expanded to include social media tools and content used in the context
of e-commerce, especially in the fashion industry. Examples of social
commerce include customer ratings and reviews, user recommendations
and referrals, social shopping tools (sharing the act of shopping online),
forums and communities, social media optimization, social applications and
social advertising. Technologies such as Augmented Reality have also been
Internal Results KPIs

www.grow.com / 801.560.2300 The Ultimate Guide to KPIs for Entrepreneurs / 23
integrated with social commerce, allowing shoppers to visualize apparel
items on themselves and solicit feedback through social media tools.
Many B2C companies are using social media channels like Instagram,
Facebook and Pinterest to sell their products and services. Revenue to Social
Engagement is a ratio that divides the revenue your social commerce channels
generate by the number of active and engaged social followers you have. xxxiv
34) Sales Activity
These metrics include activities like the total number of calls your salespeople
attempted, the number of conversations they had with prospects, the number
of emails they sent, and the number of the appointments their prospects kept.
35) Sales Qualified Leads (SQL)
A Sales Qualified Lead (SQL) has the following ANUM characteristics.
The popular InsideSales.com blog, The Sales Insider, cautions
that you need to “make sure you are talking to the decision
maker before you begin qualifying with ANUM.”
A = Authority / N = Need / U = Urgency / M = Money
A = Authority. When you are talking to the decision maker, make sure to
make note of what their title and function is so you can align their needs
with your product. This will go a long way when you pitch to them! Hitting
what matters to them shows you know what their pain points are.
N = Need. Make sure to find lists of companies in the
target industry you’re seeking and their size.
U = Urgency. Keep up with companies and their latest news releases. If a sales
rep is sensitive to the urgencies of companies it can seriously help the sales
process. If a company has announced they are expanding their inside sales team
or have a new vice president of sales, this could be a cue to contact them.
M = Money. Know where the money is. If a company is growing,
recently announced a round of funding, or are older, more
established companies then they have the funds.
A lot of sales professionals might be familiar with a qualifying model
known as BANT, which is broken down to: Budget, Authority, Need and
Timing. InsideSales.com believes the principles of BANT are correct,
but the order is now a little different. ANUM is meant to provide a new
way of looking at qualifying leads, replacing the outdated BANT.
If you are able to find a decision maker and your product fits the four parts of
ANUM, then you’ve got it! ANUM is one of the great ways to qualify Leads. xxxv
Internal Results KPIs

www.grow.com / 801.560.2300 The Ultimate Guide to KPIs for Entrepreneurs / 24
You will become a more confident leader as you make timely, informed
decisions in service of growing your business. With that goal in mind, these 35
KPIs focus on actionable metrics that are within your control. (Of course, there
will always be “informational KPIs” that are important to track, but are out
of your control—like current fuel rates and the currency exchange rate.) Since
no two companies are the same, it is unlikely that you’ll use all 35 of these
metrics. By carefully considering the unique needs of your company, you can
select the metrics that will have the most impact on your growth objectives.
Conclusion
Share this ebook:

www.grow.com / 801.560.2300 The Ultimate Guide to KPIs for Entrepreneurs / 25
Ready to put what you learned into action?Start tracking your most important
KPIs in a matter of minutes.
Get a free 14 day trial of Grow.
Why entrepreneurs love Grow dashboards:
1) Super simple setup and easy-to-use interface – no IT needed
2) Deep integrations with the software you use most
3) Office monitor display options that let everyone see the score
4) Real-time analytics to help you make smarter decisions

www.grow.com / 801.560.2300 The Ultimate Guide to KPIs for Entrepreneurs / 26
i See http://read.bi/1wiHrqA read more of Max Nisen’s work
at http://www.businessinsider.com/author/max-nisen
ii See http://www.nikeresponsibility.com/ see also http://bit.ly/1skyclU
iii See “How to Win at Ecommerce,” http://bit.ly/1x4pXB3
iv See “KPI Library,” http://bit.ly/1zNgjT6
v See Evergage, http://bit.ly/1up2hBE
vi See MarketingTerms.com, http://bit.ly/1gDbLXH
vii See “What factors influence DAU/MAU? Nature
versus nurture” by Andrew Chen, http://bit.ly/1vV89So
viii See Harvard.edu, http://hbsp.harvard.edu/multimedia/flashtools/cltv/
ix See Medallia, http://bit.ly/1BHjNsk
x See http://bit.ly/1IMNnib
xi See Wikipedia, http://bit.ly/1qyCmuY
xii See The Houston Chronicle, http://bit.ly/13kfFAw
xiii See Wikipedia, http://bit.ly/1BHhgi2
xiv See Investopedia, http://bit.ly/1BA76zF
xv See Wikipedia, http://bit.ly/16jfLJV see an
EBITDA explainer video at http://bit.ly/1sqhdyt
xvi See “How to Create a Simple Budget” by Joseph Benoit, Entrepreneur
Magazine, May 15, 2009, http://www.entrepreneur.com/article/201670
xvii See Investopedia, http://bit.ly/UpUec0
xviii See Investopedia, http://bit.ly/1qyw8eD
xix See Investopedia, http://bit.ly/1wmSujY
xx See Investopedia, http://bit.ly/1mUbylu
xxi See Investopedia, http://bit.ly/1GlBopx
xxii See Morningstar, http://bit.ly/1wMDjCx
Sources
www.grow.com / 801.560.2300 The Ultimate Guide to KPIs for Entrepreneurs / 27
xxiii See “How to Forecast Revenue and Growth” by Asheesh
Advani, Entrepreneur Magazine, http://entm.ag/1n2ZMk0
xxiv See Investopedia, http://bit.ly/1zShlv1
xxv For the Curata framework see http://goo.gl/Lf5GMX
xxvi See http://bit.ly/12I1qof
xxvii See Bain & Company, http://bit.ly/1yMMTW8
xxviii See Topgrading, http://topgrading.com/topgrading-profile-of-an-a-player/
xxix See Investopedia, http://bit.ly/1e4RwBO
xxx See The Marketo Blog, http://bit.ly/1sxZhH9
xxxi See ActOn.com, http://bit.ly/1oswf8Z
xxxii See KPI Library, http://kpilibrary.com/
xxxiii See Project Management Tips, http://bit.ly/1zjaHi7
xxxiv See Wikipedia, http://bit.ly/1u6YACG
xxxv See The Sales Insider, InsideSales.com, http://bit.ly/1xefnYr
Sources