the turkish factoring industry december 2012...the members of fci. the turkish factoring industry...
TRANSCRIPT

THE TURKISH FACTORING INDUSTRY
December 2012


THE FACTORING INDUSTRY IN TURKEY
December 2012

TABLE OF CONTENTS
PREFACE .......................................................................................................................................... 1
1. EXECUTIVE SUMMARY ................................................................................................................ 3
2. AN OVERVIEW OF THE FACTORING SECTOR IN TURKEY ........................................................ 6
3. FACTORING SERVICES.............................................................................................................. 14
4. FACTORING COMPANIES .......................................................................................................... 16
5. FINANCIAL ANALYSIS OF FACTORING COMPANIES ............................................................... 32
6. INTERNATIONAL FACTORING ................................................................................................... 48
7. THE REGULATORY AND LEGISLATIVE FRAMEWORK ............................................................. 52
8. THE ECONOMIC ENVIRONMENT OF 2012 ................................................................................ 56
9. DEVELOPMENTS IN 2012........................................................................................................... 64
10. GENERAL ASSESMENT AND OUTLOOK ................................................................................. 71
ANNEX 1 - BRSA FACTORING DATA ............................................................................................ 73
ANNEX 2 – BRANCHES AND REPRESENTATIVE OFFICES.......................................................... 83
ANNEX 3 – FACTORING COMPANIES THAT HAVE TERMINATED THEIR SERVICES.................. 85
ANNEX 4 – FACTORING DATA BY COUNTRIES ............................................................................ 86
LIST OF GRAPHS
Graph 1 – Annual Turnover (Million USD) ................................................................................9
Graph 2 – The Growth Trend of Factoring Receivables Including and Excluding Energy Sector ......... 12
Graph 3 – 2011 Distribution by Sector ................................................................................... 12
Graph 4 – Distribution by Market Shares ................................................................................ 20
Graph 5 – Total Factoring Receivables / Nr. of Employee (1000 TL)............................................. 30
Graph 6 – Distribution of Assets (2011) ................................................................................. 33
Graph 7 – Distribution of Liabilities(2011)............................................................................... 33
Graph 8 – Funding Cost and Return of Assets.......................................................................... 40
Graph 9 - Net Factoring Interest Margin ................................................................................. 40
Graph 10 – Annual NPL’s and NPL Ratios ................................................................................ 41
Graph 11 – NPLs / Factoring Receivables (3 Months) ................................................................ 41
Graph 12 - Specific Provisions / NPLs..................................................................................... 41
Graph 13 – Factoring Receivables and Loans (Million TL)........................................................... 43
Graph 14 – Loans Obtained from Deposit Taking Banks by Factoring Companies ........................... 45
Graph 15 – Private Sector Bond Issues / Total Bond Stock (%) .................................................. 45
Graph 16 - Distribution of Turnover (2011) ............................................................................ 48
Graph 17 – Share of International Turnover in Total Turnover (%).............................................. 48
Graph 18 – Domestic and International Factoring..................................................................... 49
Graph 19 – Quarterly GDP Growth........................................................................................ 56
Graph 20 – Rate of Exchange (1 USD = TL) ............................................................................ 57
Graph 21 – Annual Growth Rate of Total Loans (%) ................................................................. 58
Graph 22 – Interest Rates of Corporate Loans (%)................................................................... 58
Graph 23 – 2011 Average Cost of Fixed Interest Borrowing (%) ............................................... 59
Graph 24 – Cost of Treasury Borrowings................................................................................ 59
Graph 25 – CBT O/N Interest Rates ....................................................................................... 59
Graph 26 – Banks’ cost of borrowing and average deposit yields ................................................ 59
Graph 27 - Household Liabilities/Assets (%)........................................................................... 60
Graph 28 - Households Liabilities/GDP (%) ........................................................................... 60
Graph 29 - 2007-2011 Banking Sector Loan Volume (Million TL)............................................... 62
Graph 30 – 2007-2011 Factoring Sector Loan Volume (Million TL).............................................. 62
Graph 31 – Banking Sector NPLs (Million TL) and NPL Ratios (%) ............................................... 62
Graph 32 – Annual Growth of Bank Loans and Factoring Receivables (%) .................................... 63
Graph 33 – Sector Shares in Factoring Receivables (%) (Sept. 2012 included)............................. 65
Graph 34 - Factoring Sector – Total Cash Loans (Factoring Receivables) (1000 TL)........................ 65
Graph 35 – Total Factoring NPLs (1000 TL) ............................................................................. 66
Graph 36 – NPLs / Total Factoring Receivables (%) .................................................................. 66
Graph 37 – Annual Increase of Imports of Capital Goods and Intermediate Goods ......................... 67
Graph 38 - Change of Industrial Production over to the Same Period of the Previous Year (%) ........ 67

Graph 39 - Turkish Treasury Borrowing Rates (%) ................................................................... 67
Graph 40 – The Amount of Bounced Checks (Million TL) ........................................................... 69
Graph 41 – The Ratio of the Bounced-Checks to the Total Volume of the Checks (%)..................... 69
Graph 42 - The Ratios of Bounced Checks in terms of Amount and Volume.................................. 70
Graph 43 – Protested Bills................................................................................................... 70
LIST OF TABLES
Table 1 – Comparison of Independent Factoring Companies and Bank-owned Companies (%) ..........4
Table 2 – Profitability Comparison of the Independent Factoring Companies and Bank-owned
Companies (%)..............................................................................................................5
Table 3 - Factoring Companies - Financial Indicators (Million TL) ..................................................6
Table 4 - Factoring Companies – Developments in the Structure of Balance Sheet (%)....................6
Table 5 – Distributiion of Factoring Receivables (1000 TL) ..........................................................7
Table 6 – Distribution of Domestic / International Factoring (1000 TL)...........................................7
Table 7 – Annual Turnover (1000 TL).......................................................................................7
Table 8 – Quarterly Turnover (1000 TL) and Percentage Changes ................................................8
Table 9 – Annual Domestic and International Factoring Turnover (Million USD) ...............................8
Table 10 - Sectoral Distribution of Annual Turnover (Million TL)...................................................9
Table 11 - TL and FC Distribution of Factoring Receivables (1000 TL) ......................................... 10
Table 12 - Sectoral Distribution of Factoring Receivables (1000 TL)............................................ 10
Table 13 - Total Factoring Receivables ................................................................................... 11
Table 14 – Sector Shares Excluding Three Energy Sectors (%)................................................... 11
Table 15 – Sector Shares Including Energy Sector (%) ............................................................ 12
Table 16 – Distribution of SMEs in Turkey............................................................................... 15
Table 17 - Transaction Volume of the Checks in Turkey............................................................. 15
Table 18 - Distribution of the Checks Presented to ICH according to Amount Tranches (%) ............. 15
Table 19 – Factoring Companies in Turkey as of 31.12.2011 (1000 TL)........................................ 16
Table 20 - Number of Factoring Companies According to Size (BRSA)......................................... 18
Table 21 - Concentration of Assets (%).................................................................................. 18
Table 22 - Number of Factoring Companies According to Sizes and Market Shares (Turkrating) ...... 18
Table 23 – List of Factoring Companies by Asset Size and Market Shares ..................................... 19
Table 24 – Market Shares According to Factoring Receivables .................................................... 21
Table 25 – Leading Companies Providing Guarantee Services..................................................... 23
Table 26 – Leading Companies Providing Collection Services..................................................... 23
Table 27 - Total Assets of the Bank Participation Factoring Companies (1000 TL) .......................... 24
Table 28 - Assets Sizes of the Top Independent Factoring Companies (1000 TL) .......................... 25
Table 29 - Sector Shares of the Bank Participation and Independent Factoring Companies (%)........ 25
Table 30 - Comparison of Financial Ratios of Bank Subsidiaries and Independents ........................ 26
Table 31 – Number of Employee and Personnel Expenditures ..................................................... 28

Table 32 – Number of Employees in the Factoring Sector (December 2011)............................... 28
Table 33 – Efficiency Ratios.................................................................................................. 30
Table 34 – Sector - Total Balance Sheet (Milion TL).................................................................. 32
Table 35 - Composition of Assets and Liabilities ...................................................................... 32
Table 36 – Annual Growth Rates (%)..................................................................................... 33
Table 37 – Factoring Sector- Summary Balance Sheet (1000 TL) ................................................ 34
Table 38 – Commitments and Contingencies (Million TL) .......................................................... 35
Table 39 – Income Statement (1000 TL) ................................................................................ 36
Table 40 - Factoring Companies Main Income Items (Million TL) ................................................. 36
Table 41 - Factoring Income (Million TL)................................................................................. 37
Table 42 – Profitabilty Ratios ............................................................................................... 37
Table 43 – Profitability Ratios of Factoring Companies - 2010/2011............................................ 37
Table 44 – Profitability Ratios (%)......................................................................................... 39
Table 45 – Profitability Ratios of Factoring Companies in 2011 According to Groups ....................... 39
Table 46 – Asset Quality...................................................................................................... 40
Table 47 – NPLs Ratios of Factoring Companies According to Groups (%)..................................... 41
Table 48 – Composition of Equity (Million TL) .......................................................................... 42
Table 49 - Factoring Sector Funding (Million TL) ...................................................................... 42
Table 50 – Loans (Million TL)................................................................................................ 43
Table 51 – Turkish Banking Sector Credit Distribution (Cental Bank of Turkey).............................. 44
Table 52 – Loans Obtained from Deposit Banks and Dev. and Inv. Banks By Factoring Companies
(1000 TL) ................................................................................................................... 44
Table 53 - 2008 - 2011 Total Bond Issues of the Factoring Sector (Million TL).............................. 45
Table 54 – Financial Ratios - Sector ....................................................................................... 47
Table 55 – Financial Ratios – Factoring Company Groups .......................................................... 47
Table 56 – Loans TL/FC Distribution (Million TL)....................................................................... 47
Table 57 – GDP and Factoring Penetration Rate ....................................................................... 48
Table 58 - Factoring Sector- Turnover Volume (Million TL)......................................................... 49
Table 59 – Top Countries in Turnover Volume in the World (Million USD) ..................................... 49
Table 60 - Composition of Turnover among FCI Members (Million USD) ....................................... 50
Table 61 - Distribution of Turnover in Factoring Sector............................................................. 50
Table 62 – Growth Rate of Expenditures (%)........................................................................... 56
Table 63 – Annual Consumer Price Index................................................................................ 57
Table 64 – Annual Loan Growth (%) ...................................................................................... 58
Table 65 – Household Borrowing Rates .................................................................................. 60
Table 66 – Comparison of Profitability Ratios with the Banking and Leasing Sectors ....................... 61
Table 67 – Financial Indicators of Banks................................................................................. 61
Table 68 - Quarterly Basic Indicators (Million TL) ..................................................................... 64
Table 69 – Balance Sheet Structure – Percentage Shares .......................................................... 64

Table 70 - Quarterly Turnover (1000 TL) ................................................................................ 64
Table 71 – The Volume of the Bounced-Checks (Million TL)........................................................ 68
Table 72 – Annual ratios of the Bounced- Checks ..................................................................... 69
Table 73 – Protested Bills .................................................................................................... 70
Preface
Year 2012 will be remembered as an important milestone in the history of the Turkish Factoring Industry. On 21 December 2012 the long-awaited Law Number 6361 was promulgated giving Leasing, Factoring and Consumer Finance Companies a legal basis. This law incorporates all three segments of non-bank financial institutions initiating a common association as of June 2013. Hopefully, this will mark the beginning of a new era. We expect to see the elimination of weaker companies while the stronger gain further strength under the renewed image of the industry. As a hub of international factoring, in terms of its geographical position between the developed and developing markets in export factoring, Turkey is viewed as a bridge between these markets and among the members of FCI. The Turkish Factoring Industry can play an important role in introducing factoring to a number of emerging markets by sharing its experience and transferring its know-how. This report, aims to update the detailed analytical report on the Turkish Factoring Industry written in 2011. Once again the analysis herein seeks to inform readers, in particular creditors and investors interested in factoring companies, by providing a good insight to the complex world of factoring companies. Developments in 2011 and a good part of 2012 are analyzed in the light of the economic background and changing circumstances. The trends, opportunities and challenges faced by factoring companies are presented in the light of regulatory and economic developments. The revisions of the Banking Board, the BRSA, compelled us to make considerable revisions on the tables of last year’s report. Furthermore, an important addition this year is further detailed analysis of the financial results of all factoring companies and the way they designed their business models. We questioned whether they could be grouped according to ownership, size and services they provided. As we indicated last year, details on the ownership structure of factoring companies and their quantitative data revealed the existence of a number of sub-sectors within the industry. Turkish factoring companies have different organizational structures, and they service different segments of customers and even provide different services. Our study revealed that looking at average values or ratios across the sector and evaluating any particular company in the light of such averages could lead to misleading conclusions. We are very grateful to the members of the Turkish Factoring Association for contributing valuable data and information to this report and also to all the representatives of the many companies who assisted us in understanding the problems of the sector. Gülnur Üçok General Manager of Turkrating

2
3
1. EXECUTIVE SUMMARY The growth trend of the factoring industry continued in 2011 which, overall, was a fairly profitable year. The factoring industry provides financing to the majority of small and medium sized companies and is, therefore, highly sensitive to fluctuations in economic activities. Factoring companies had to adjust to the changing economic conditions of 2011, and for some it has necessitated downsizing their business volumes. The escalation of interest rates in the second half of the year negatively impacted some companies while others used the opportunity to operate under higher profit margins. At the end of 2011 total assets of the 75 factoring companies in Turkey amounted to TL15.6 billion, representing a relatively small sector compared to the TL1.2 trillion banking sector. Total factoring receivables grew by 14.7% reaching TL14.2 billion, and shareholders’ equity increased by 14.2% to TL5.0 billion. In 2011 increase in total borrowings remained limited, liquid assets decreased. Factoring companies obtain 20% of their funding from equity and 73% from bank borrowings. Beginning in 2008, issuing bonds and commercial paper became possible; in 2011 bond issuances gained momentum, and in 2012 eight factoring companies raised funds through bond issuances. Factoring companies also provide guarantee and collection services in addition to discounting receivables. In that respect, the total financing provided to the real sector by the factoring industry amounts to TL20.0 billion when the total of these services (the TL5.7 billion volume taking place under off-balance sheet items) is added to the TL14.2 billion factoring receivables. The BRSA data shows that in Turkey 67% of factoring receivables are “with recourse” and 33% “non-recourse.” In 2010 these ratios were 57% and 33%, respectively. In 2011 with-recourse transactions increased by 30% while non-recourse transactions decreased by 15%. At the end of 2010 75 factoring companies had 28 branches and 175 rep offices in 16 provinces. In 2011, 59 additional rep offices were opened and total personnel grew by 598 people. As a result of the larger network of rep offices the number of customers increased by 39.3%, the number of transactions by 35.7%. The factoring industry remained an attractive business sector to investors and new companies joined. Between January 2011 and July 2012 the BRSA gave establishment licenses to eight companies, four of which subsequently received an operating license. Among the new entrants there were very strong groups such as Halk Bank and the Zorlu Group. A key characteristic in this industry is the existence of sub-groups which are considerably different from one another. Factoring companies form several sub-groups which differ in terms of their organization, their customer base, the services they provide and their business strategies. The strengths and weaknesses of any company can only be evaluated under the competitive conditions of its own group. The major group among these sub-groups is the group of companies that are subsidiaries of banks or indirectly related to banks through their shareholders. In many respects these companies are inarguably more privileged. Quite clearly, there is no fair competition among the bank subsidiaries and the other medium or small independent factoring companies. Their most obvious advantage is unlimited funding from the parent bank (or the bank owned by the group of companies in the shareholder structure). Although there are exceptions, bank subsidiaries not only receive the funding they require but also
4
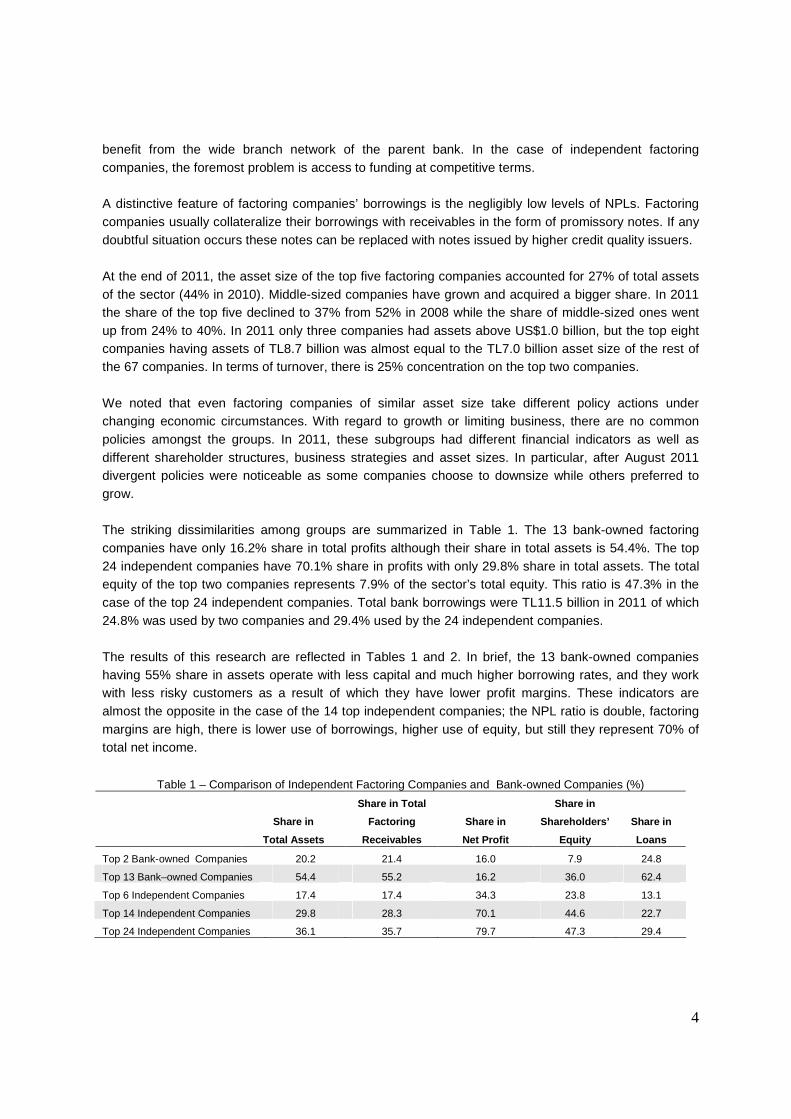
benefit from the wide branch network of the parent bank. In the case of independent factoring companies, the foremost problem is access to funding at competitive terms. A distinctive feature of factoring companies’ borrowings is the negligibly low levels of NPLs. Factoring companies usually collateralize their borrowings with receivables in the form of promissory notes. If any doubtful situation occurs these notes can be replaced with notes issued by higher credit quality issuers. At the end of 2011, the asset size of the top five factoring companies accounted for 27% of total assets of the sector (44% in 2010). Middle-sized companies have grown and acquired a bigger share. In 2011 the share of the top five declined to 37% from 52% in 2008 while the share of middle-sized ones went up from 24% to 40%. In 2011 only three companies had assets above US$1.0 billion, but the top eight companies having assets of TL8.7 billion was almost equal to the TL7.0 billion asset size of the rest of the 67 companies. In terms of turnover, there is 25% concentration on the top two companies. We noted that even factoring companies of similar asset size take different policy actions under changing economic circumstances. With regard to growth or limiting business, there are no common policies amongst the groups. In 2011, these subgroups had different financial indicators as well as different shareholder structures, business strategies and asset sizes. In particular, after August 2011 divergent policies were noticeable as some companies choose to downsize while others preferred to grow. The striking dissimilarities among groups are summarized in Table 1. The 13 bank-owned factoring companies have only 16.2% share in total profits although their share in total assets is 54.4%. The top 24 independent companies have 70.1% share in profits with only 29.8% share in total assets. The total equity of the top two companies represents 7.9% of the sector’s total equity. This ratio is 47.3% in the case of the top 24 independent companies. Total bank borrowings were TL11.5 billion in 2011 of which 24.8% was used by two companies and 29.4% used by the 24 independent companies. The results of this research are reflected in Tables 1 and 2. In brief, the 13 bank-owned companies having 55% share in assets operate with less capital and much higher borrowing rates, and they work with less risky customers as a result of which they have lower profit margins. These indicators are almost the opposite in the case of the 14 top independent companies; the NPL ratio is double, factoring margins are high, there is lower use of borrowings, higher use of equity, but still they represent 70% of total net income.
Table 1 – Comparison of Independent Factoring Companies and Bank-owned Companies (%)
Share in
Total Assets
Share in Total
Factoring
Receivables
Share in
Net Profit
Share in
Shareholders’
Equity
Share in
Loans
Top 2 Bank-owned Companies 20.2 21.4 16.0 7.9 24.8
Top 13 Bank–owned Companies 54.4 55.2 16.2 36.0 62.4
Top 6 Independent Companies 17.4 17.4 34.3 23.8 13.1
Top 14 Independent Companies 29.8 28.3 70.1 44.6 22.7
Top 24 Independent Companies 36.1 35.7 79.7 47.3 29.4

5
Table 2 – Profitability Comparison of the Independent Factoring Companies and Bank-owned Companies (%)
NPL Ratio ROAA ROAE Fact. Int. Margin
Top 2 Bank-owned Companies 1.2 2.4 52.5 1.9
Top 13 Bank–owned Companies 3.6 1.7 21.5 3.7
Top 6 Independent Companies 4.4 7.6 21.6 10.9
Top 14 Independent Companies 6.6 15.7 25.6 8.8
Top 24 Independent Companies 16.4 4.8 23.4 9.0
In 2011 domestic turnover dropped from US$46.9 billion to US$36.4 billion. International turnover rose from US$4.7 billion to US$7.3 billion. In USD terms, turnover has declined to US$43.7 billion in 2011 from US$51.6 billion in 2010. In 2011 factoring was concentrated on five major sectors: textiles, construction, retail and wholesale trade, main metal industries, and energy. Traditionally, factoring companies have been most active in textiles and the metal industries. The slowdown in economic activity which began in 2011 had its impact on small companies, and asset quality began to deteriorate, pushing up NPL ratios. The NPL ratio of 3.9% in June 2011 rose to 4.7% by June 2012 and continued to rise throughout the rest of 2012.
The balance sheet structure of factoring companies characterized by short maturities enables managements to transform the assets of a company to a much larger or smaller size. The adaptation to business cycles is a policy flexibility unique to factoring companies. As factoring companies work very closely with their customers, the volume and nature of any particular company’s checks give them a good understanding of how that company’s business is doing. They can easily unwind the volume of receivables. Year 2012 has been a year of significant slowdown in economic activity as reflected in the GDP growth deceleration to 2.6% in the first nine months (6.5% in 2011). Growth in manufacturing industries decelerated to 1.9% in the first nine months compared to 10.6% in the same period of 2011, and construction activity decelerated from 11.3% to 1.0%. As a result, factoring receivables were cut down in the third quarter of 2012. By the end of September 2012, total factoring receivables showed only 4% increase over year-end 2011, and borrowings were back to year-end levels. However, the NPL ratio moved up to 5.2%. The sharp rise in bounced checks during 2012 as a result of legislative changes could have harmed a number of factoring companies. There were a few important legislative changes in 2012, namely the promulgation of the new Commercial Code and the Code of Obligations, which impacted operations of the factoring industry. Finally, at the end of November 2012 the factoring industry gained a new legislative framework with the passing of Law 6361 regulating jointly the giving Leasing, Factoring and Consumer Finance Companies.

6
2. AN OVERVIEW OF THE FACTORING SECTOR IN TURKEY
There were 79 factoring companies serving 67,000 customers with 50 branches and 192 representative offices in the sector at the end of September 2012. Despite the large number of players in the market, the sector has less than 1% share in Turkey’s total financial system. In 2011, the financial system in Turkey recorded 17% growth (31.9% in 2010) and reached TL1.9 billion. In terms of asset size, banks have the largest share (69%) with a total of TL1.2 billion assets which account for 90% of GDP. The Central Bank’s balance sheet size is TL146.2 billion and has 7.6% share. Among the other non-bank financial institutions, insurance companies with assets totaling TL39.9 billion and mutual funds with assets of TL32.2 billion form the two largest groups. Leasing, factoring and pension funds remain relatively small among these groups. In 2011 the factoring industry asset size grew to TL15.6 billion and TL14.2 billion financing was provided to customers. Total shareholders’ equity increased by 14.2% to TL3.4 billion. Total factoring receivables were 4.2 times equity. Compared to the previous year, there was a reduction in the use of credit as a percentage of total assets (Table 6).
Table 3 - Factoring Companies - Financial Indicators (Million TL) 2008 2009 2010 2011 6/2012 9/2012
Number of Companies 81 78 76 74 79
Number of Branches 20 26 28 25 32 50
Total Assets 7,763.82 10,407.04 14,466.71 15,644.09 16,826.62 16,333.63
Factoring Receivables 5,591.17 8,350.82 12,370.17 14,223.21 15,372.44 14,817.78
Non- Performing Loans 510.13 522.34 525.00 561.13 738.22 799.39
Shareholders’ Equity 2,340.50 2,493.33 2,941.31 3,393.71 3,472.12 3,658.56
Loans 4,943.78 7,499.22 11,095.97 11,463.64 12,278.56 11,434.53
Net Profit /Loss 427.00 330.20 407.47 504.35 318.23 486.03 Source: BRSA
Table 4 - Factoring Companies – Developments in the Structure of Balance Sheet (%)
2008 2009 2010 2011 6/2012 9/2012
Equity/Total Assets 30.45 24.96 20.33 21.70 20.63 22.40
Loans/Total Assets 63.68 72.06 76.70 73.24 72.97 70.01
Factoring Receivables /Total Assets 72.02 80.24 85.50 90.87 91.35 90.72
Composition of Factoring Receivables
BRSA data shows that 67% of total factoring receivables are “with recourse” and 33% are “non-recourse.” In 2010 these ratios were 57% and 43%, respectively. With-recourse factoring increased by 30% while non-recourse factoring decreased by 15%.

7
Table 5 – Distributiion of Factoring Receivables (1000 TL)
In terms of domestic/international composition, export and import factoring increased by 67% in 2011, raising its share to 17% from 11%.
Table 6 – Distribution of Domestic / International Factoring (1000 TL)
2008 2009 2010 2011 9/2012
Domestic 6,061,912 10,442,048 13,806,423 14,107,574 13,315,227
International 1,302,873 854,312 1,754,991 2,935,488 2,695,737
Total 7,364,785 11,296,360 15,399,234 17,043,062 16 ,010,964
Maturity in Factoring
The most common maturity in the industry is 90 to 120 days. Discounting receivables is typically for a period of less than three months. These short maturities provide an important advantage to factoring companies. They have the flexibility to downsize or enlarge their receivables very rapidly in reaction to changing economic circumstances. Other non-bank financial institutions do not have such flexibility. We noted that in the first half of 2012 factoring companies have pursued very different growth strategies. Some downsized their assets by 50% in six months, others increased their assets by as much. There is no apparent common course of action. It is possible that some managements have deliberately limited their business due to the rise in NPLs. In a market where players take such different strategies, asset size ranking is bound to change frequently.
Turnover
International factoring statistical reports take into consideration turnover instead of asset size or factoring receivables. Therefore, the Factoring Association collects quarterly turnover data from its members. The BRSA also publishes turnover data. As a financial indicator, “turnover” is not used in the financial analysis of a company as it does not reflect financial strength or profitability. It is merely reflecting the volume of transactions. In the Turkish factoring industry, a number of companies still used the turnover measure as an indicator of prestige. However, unless it has a clear contribution to higher profits growing turnover volume cannot be considered an important achievement. In 2011 total turnover showed a small decrease to TL 70.billion from TL75.7 billion in the previous year.
Table 7 – Annual Turnover (1000 TL)
2010 2011 9/2012
Total Turnover 75,735,561 70,713,528 54,024,726
- International 6,777,000 11,789,000 10,531,451
Source: BRSA
2008 2009 2010 2011 9/2012
With-Recourse 5,852,370 9,621,717 8,739,120 11,353,024 10,590,564
Non-Recourse 1,512,415 1,674,643 6,660,114 5,690,038 5,420,400
Total 7,364,785 11,296,360 15,399,234 17,043,062 16 ,010,964
8
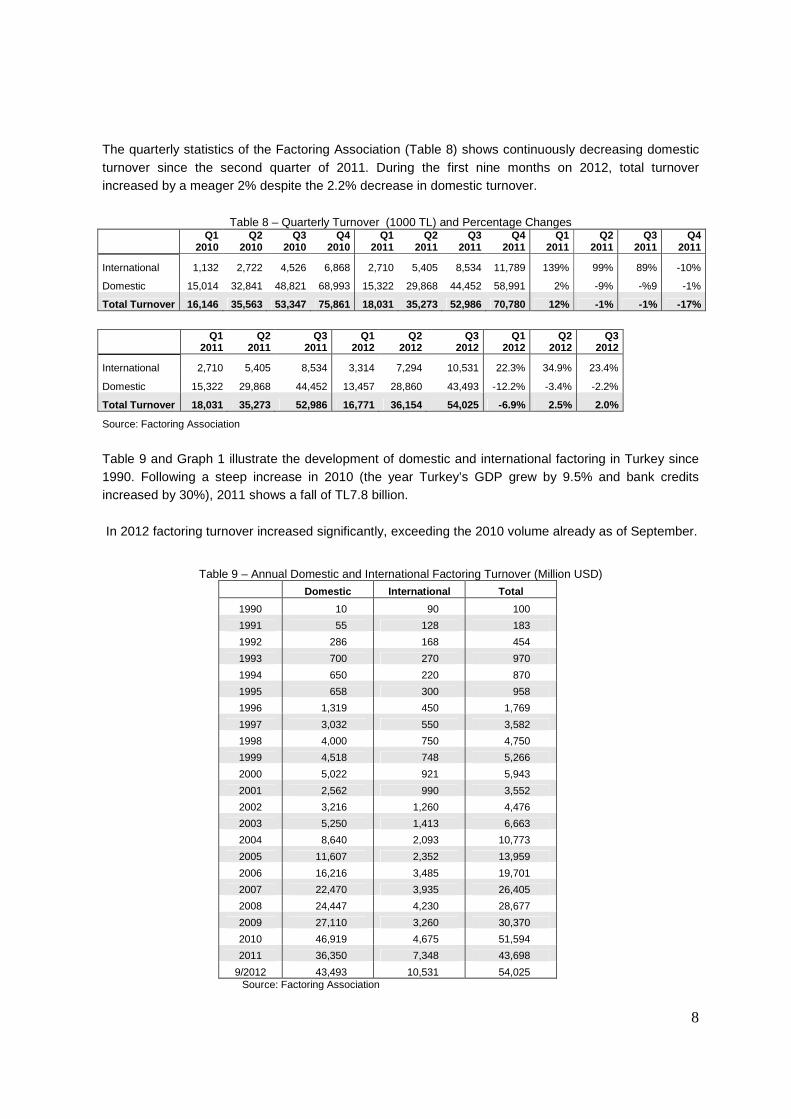
The quarterly statistics of the Factoring Association (Table 8) shows continuously decreasing domestic turnover since the second quarter of 2011. During the first nine months on 2012, total turnover increased by a meager 2% despite the 2.2% decrease in domestic turnover.
Table 8 – Quarterly Turnover (1000 TL) and Percentage Changes
Q1
2010 Q2
2010 Q3
2010 Q4
2010 Q1
2011 Q2
2011 Q3
2011 Q4
2011 Q1
2011 Q2
2011 Q3
2011 Q4
2011
International 1,132 2,722 4,526 6,868 2,710 5,405 8,534 11,789 139% 99% 89% -10%
Domestic 15,014 32,841 48,821 68,993 15,322 29,868 44,452 58,991 2% -9% -%9 -1%
Total Turnover 16,146 35,563 53,347 75,861 18,031 35,273 52,986 70,780 12% -1% -1% -17%
Q1
2011 Q2
2011 Q3
2011 Q1
2012 Q2
2012 Q3
2012 Q1
2012 Q2
2012 Q3
2012
International 2,710 5,405 8,534 3,314 7,294 10,531 22.3% 34.9% 23.4%
Domestic 15,322 29,868 44,452 13,457 28,860 43,493 -12.2% -3.4% -2.2%
Total Turnover 18,031 35,273 52,986 16,771 36,154 54,025 -6.9% 2.5% 2.0%
Source: Factoring Association
Table 9 and Graph 1 illustrate the development of domestic and international factoring in Turkey since 1990. Following a steep increase in 2010 (the year Turkey’s GDP grew by 9.5% and bank credits increased by 30%), 2011 shows a fall of TL7.8 billion. In 2012 factoring turnover increased significantly, exceeding the 2010 volume already as of September.
Table 9 – Annual Domestic and International Factoring Turnover (Million USD)
Domestic International Total
1990 10 90 100
1991 55 128 183
1992 286 168 454
1993 700 270 970
1994 650 220 870
1995 658 300 958
1996 1,319 450 1,769
1997 3,032 550 3,582
1998 4,000 750 4,750
1999 4,518 748 5,266
2000 5,022 921 5,943
2001 2,562 990 3,552
2002 3,216 1,260 4,476
2003 5,250 1,413 6,663
2004 8,640 2,093 10,773
2005 11,607 2,352 13,959
2006 16,216 3,485 19,701
2007 22,470 3,935 26,405
2008 24,447 4,230 28,677
2009 27,110 3,260 30,370
2010 46,919 4,675 51,594
2011 36,350 7,348 43,698
9/2012 43,493 10,531 54,025 Source: Factoring Association
9
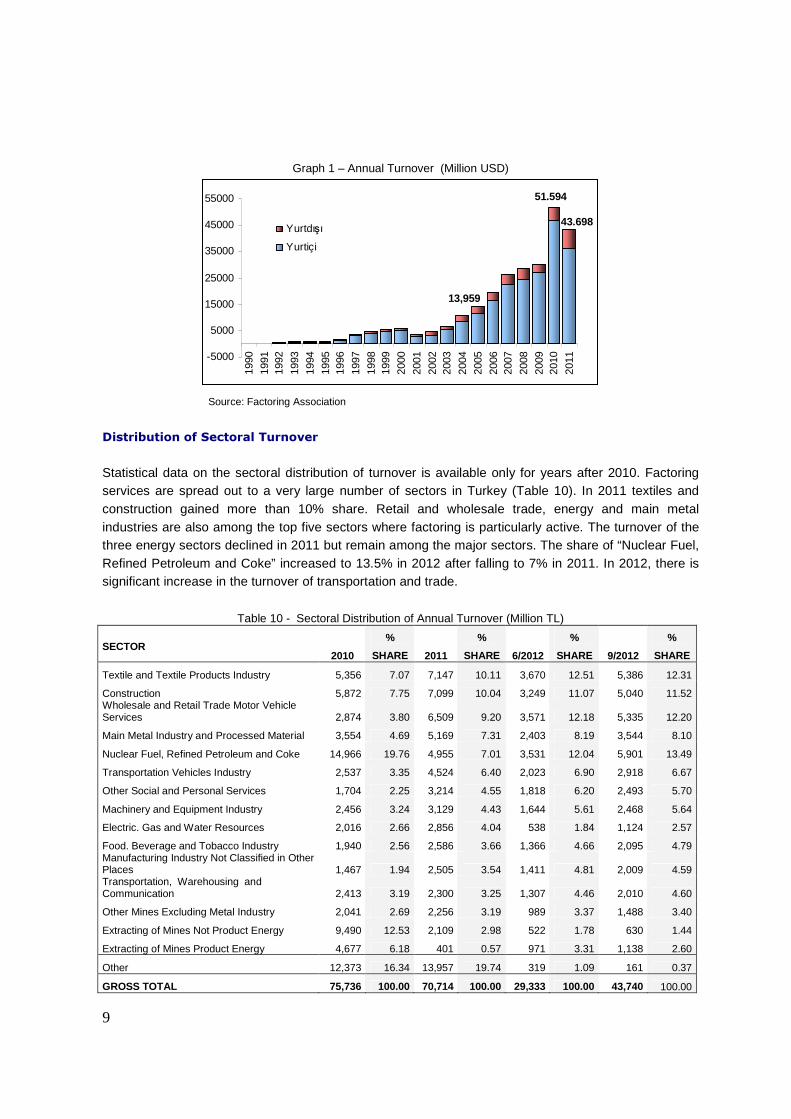
Graph 1 – Annual Turnover (Million USD)
13,959
43.698
51.594
-5000
5000
15000
25000
35000
45000
55000
1990
1991
1992
1993
1994
1995
1996
1997
1998
1999
2000
2001
2002
2003
2004
2005
2006
2007
2008
2009
2010
2011
Yurtdışı
Yurtiçi
Source: Factoring Association
Distribution of Sectoral Turnover
Statistical data on the sectoral distribution of turnover is available only for years after 2010. Factoring services are spread out to a very large number of sectors in Turkey (Table 10). In 2011 textiles and construction gained more than 10% share. Retail and wholesale trade, energy and main metal industries are also among the top five sectors where factoring is particularly active. The turnover of the three energy sectors declined in 2011 but remain among the major sectors. The share of “Nuclear Fuel, Refined Petroleum and Coke” increased to 13.5% in 2012 after falling to 7% in 2011. In 2012, there is significant increase in the turnover of transportation and trade.
Table 10 - Sectoral Distribution of Annual Turnover (Million TL)
SECTOR 2010
%
SHARE 2011
%
SHARE 6/2012
%
SHARE 9/2012
%
SHARE
Textile and Textile Products Industry 5,356 7.07 7,147 10.11 3,670 12.51 5,386 12.31
Construction 5,872 7.75 7,099 10.04 3,249 11.07 5,040 11.52 Wholesale and Retail Trade Motor Vehicle Services 2,874 3.80 6,509 9.20 3,571 12.18 5,335 12.20
Main Metal Industry and Processed Material 3,554 4.69 5,169 7.31 2,403 8.19 3,544 8.10
Nuclear Fuel, Refined Petroleum and Coke 14,966 19.76 4,955 7.01 3,531 12.04 5,901 13.49
Transportation Vehicles Industry 2,537 3.35 4,524 6.40 2,023 6.90 2,918 6.67
Other Social and Personal Services 1,704 2.25 3,214 4.55 1,818 6.20 2,493 5.70
Machinery and Equipment Industry 2,456 3.24 3,129 4.43 1,644 5.61 2,468 5.64
Electric. Gas and Water Resources 2,016 2.66 2,856 4.04 538 1.84 1,124 2.57
Food. Beverage and Tobacco Industry 1,940 2.56 2,586 3.66 1,366 4.66 2,095 4.79 Manufacturing Industry Not Classified in Other Places 1,467 1.94 2,505 3.54 1,411 4.81 2,009 4.59 Transportation, Warehousing and Communication 2,413 3.19 2,300 3.25 1,307 4.46 2,010 4.60
Other Mines Excluding Metal Industry 2,041 2.69 2,256 3.19 989 3.37 1,488 3.40
Extracting of Mines Not Product Energy 9,490 12.53 2,109 2.98 522 1.78 630 1.44
Extracting of Mines Product Energy 4,677 6.18 401 0.57 971 3.31 1,138 2.60
Other 12,373 16.34 13,957 19.74 319 1.09 161 0.37
GROSS TOTAL 75,736 100.00 70,714 100.00 29,333 100.00 43,740 100.00

10
FC - TL Receivables
Transactions and funding are mainly in local currency. Among the bank-owned top factoring companies, a few companies fund themselves from foreign banks in foreign currency. Those companies that have no export factoring prefer not to take any currency risk. In 2011 only 10% of factoring receivables were in foreign currency.
Table 11 - TL and FC Distribution of Factoring Receivables (1000 TL)
2008 2009 2010 2011 6/2012 9/2012
TL 5,050 7,838 11,219 12,719 13,871 13,415
FC 541 513 1,151 1,510 1,530 1,430
Total 5,591 8,351 12,370 14,223 15,372 14,818
Risk Concentration by Industry
The Turkish factoring industry has traditionally served predominantly the textiles, construction and main metal industries.
Table 12 - Sectoral Distribution of Factoring Receivables (1000 TL)
2008 2009 2010 2011 %
Chg. June 2012
Total Agriculture 95,805 195,82 221,199 344,915 55.93 379,961
Total Manufacturing Industry 5,397,604 7,694,552 11,414,858 11,114,506 -2.63 11,770,188
Extracting of Energy Producing Mines 85,296 169,527 1,451,132 85,327 -94.12 404,631
Extracting of None-Energy Producing Mines 23,885 796,184 274,738 227,397 -17.23 709,744
Food, Beverage and Tobacco Ind. 304,366 340,307 508,976 665,278 30.71 728,907
Textile and Textile Products Industry 1,050,976 1,259,521 1,419,056 1,581,795 11.47 1,669,362
Main Metal Industry and Processed Material 699,905 736,775 947,031 1,237,190 30.64 1,129,791
Machinery and Equipment Industry 282,447 608,554 978,392 1,108,525 13.30 1,084,244
Transportation Vehicles Industry 597,754 1,425,553 895,277 1,302,630 45.50 1,037,767 Manufacturing Industry Not Classified in Other Places 205,748 171,951 359,845 1,398,475 288.63 712,608 Nuclear Fuel and Refined Petroleum and Coke Coal Ind. 238,226 171,374 1,762,662 975,584 -44.65 1,802,976
Electric, Gas and Water Resources 26,472 300,514 612,944 462,729 -24.51 454,490
Chemical Products Industry 396,651 265,633 338,499 453,882 34.09 418,575
Other 1,485,878 1,448,659 1,866,306 1,615,694 -13.43 1,617,093
Total Services 1,802,147 3,148,127 3,873,545 5,397,558 39.34 5,552,640
Construction 713,873 988,360 1,366,581 1,350,052 -1.21 1,446,523 Wholesale and Retail Trade, Motor Vehicles Services 477,373 337,592 984,913 1,778,088 80.53 1,885,814
Other Social and Personal Services 167,752 507,566 367,774 644,018 75.11 672,886
Transportation, Warehousing and Communication 190,471 367,204 432,454 521,326 20.55 589,475
Real Estate Brokerage 33,056 89,566 108,695 349,948 221.95 267,398
Other 3068,403 6887074 3760,142 3130,986 -34.23 690,544
OTHER 69,229 228,835 51,812 186,083 259.15 115,311
TOTAL 7,364,785 11,267,334 15,561,414 17,043,062 9.52 17,818,100
Source: BRSA
11
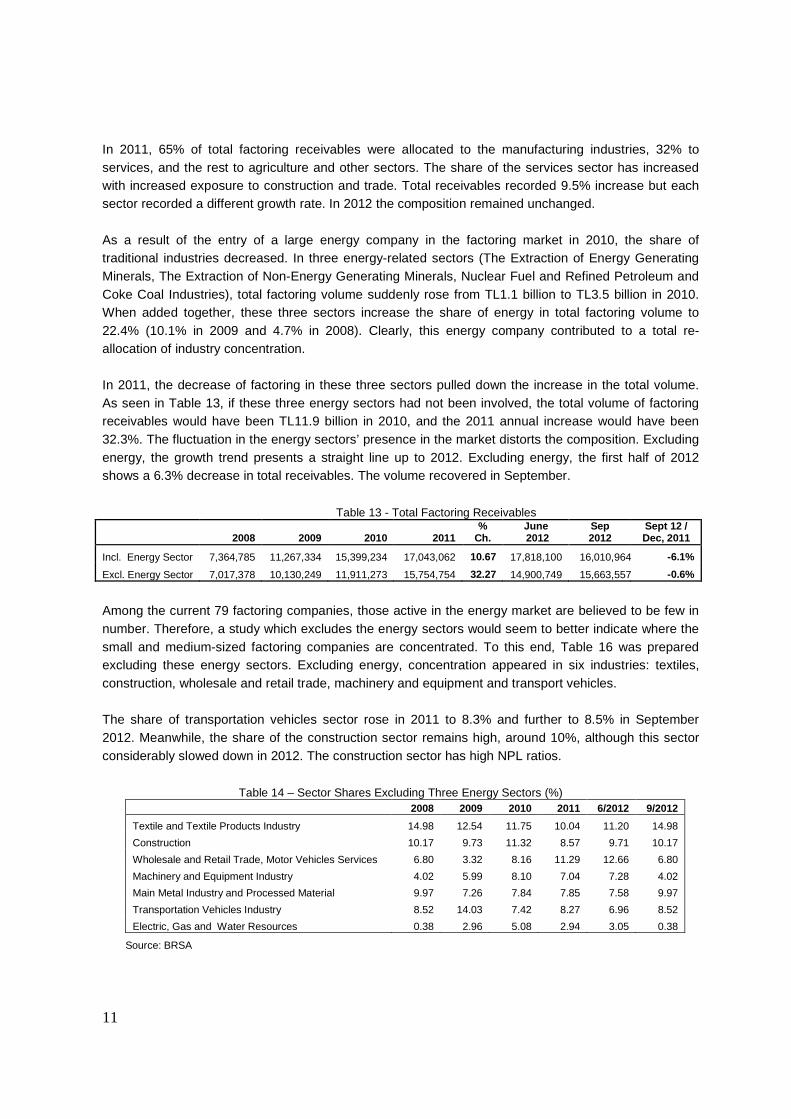
In 2011, 65% of total factoring receivables were allocated to the manufacturing industries, 32% to services, and the rest to agriculture and other sectors. The share of the services sector has increased with increased exposure to construction and trade. Total receivables recorded 9.5% increase but each sector recorded a different growth rate. In 2012 the composition remained unchanged. As a result of the entry of a large energy company in the factoring market in 2010, the share of traditional industries decreased. In three energy-related sectors (The Extraction of Energy Generating Minerals, The Extraction of Non-Energy Generating Minerals, Nuclear Fuel and Refined Petroleum and Coke Coal Industries), total factoring volume suddenly rose from TL1.1 billion to TL3.5 billion in 2010. When added together, these three sectors increase the share of energy in total factoring volume to 22.4% (10.1% in 2009 and 4.7% in 2008). Clearly, this energy company contributed to a total re-allocation of industry concentration. In 2011, the decrease of factoring in these three sectors pulled down the increase in the total volume. As seen in Table 13, if these three energy sectors had not been involved, the total volume of factoring receivables would have been TL11.9 billion in 2010, and the 2011 annual increase would have been 32.3%. The fluctuation in the energy sectors’ presence in the market distorts the composition. Excluding energy, the growth trend presents a straight line up to 2012. Excluding energy, the first half of 2012 shows a 6.3% decrease in total receivables. The volume recovered in September.
Table 13 - Total Factoring Receivables
2008 2009 2010 2011 %
Ch. June 2012
Sep 2012
Sept 12 / Dec, 2011
Incl. Energy Sector 7,364,785 11,267,334 15,399,234 17,043,062 10.67 17,818,100 16,010,964 -6.1%
Excl. Energy Sector 7,017,378 10,130,249 11,911,273 15,754,754 32.27 14,900,749 15,663,557 -0.6%
Among the current 79 factoring companies, those active in the energy market are believed to be few in number. Therefore, a study which excludes the energy sectors would seem to better indicate where the small and medium-sized factoring companies are concentrated. To this end, Table 16 was prepared excluding these energy sectors. Excluding energy, concentration appeared in six industries: textiles, construction, wholesale and retail trade, machinery and equipment and transport vehicles. The share of transportation vehicles sector rose in 2011 to 8.3% and further to 8.5% in September 2012. Meanwhile, the share of the construction sector remains high, around 10%, although this sector considerably slowed down in 2012. The construction sector has high NPL ratios.
Table 14 – Sector Shares Excluding Three Energy Sectors (%) 2008 2009 2010 2011 6/2012 9/2012
Textile and Textile Products Industry 14.98 12.54 11.75 10.04 11.20 14.98
Construction 10.17 9.73 11.32 8.57 9.71 10.17
Wholesale and Retail Trade, Motor Vehicles Services 6.80 3.32 8.16 11.29 12.66 6.80
Machinery and Equipment Industry 4.02 5.99 8.10 7.04 7.28 4.02
Main Metal Industry and Processed Material 9.97 7.26 7.84 7.85 7.58 9.97
Transportation Vehicles Industry 8.52 14.03 7.42 8.27 6.96 8.52
Electric, Gas and Water Resources 0.38 2.96 5.08 2.94 3.05 0.38
Source: BRSA

12
Table 15 – Sector Shares Including Energy Sector (%) 2008 2009 2010 2011 6/2012 9/2012 Energy 4.71 10.07 22.43 7.55 16.37 15.75 Nuclear Fuel, Refined Petroleum and Coke 3.23 1.52 11.33 5.72 10.12 14.4 Extracting of Mines Product Energy 1.16 1.50 9.33 0.50 2.27 1.05 Extracting of Mines Not Product Energy 0.32 7.05 1.77 1.33 3.98 0.30 Textile and Textile Products Industry 14.27 11.28 9.12 9.28 9.37 9.92 Construction 9.69 8.75 8.78 7.92 8.12 9.77 Main Metal Industry Processed Material 9.50 6.53 6.09 7.26 6.34 6.79 Machinery and Equipment Industry 3.84 5.39 6.29 6.50 6.09 5.76 Wholesale and Retail Trade, Motor Vehicles Services 6.48 2.99 6.33 10.43 10.58 10.55 Transportation Vehicles Industry 8.12 12.62 5.75 7.64 5.82 5.10 Total 56.61 57.63 64.79 56.58 62.69 63.64
Source: BRSA
Graph 2 – The Growth Trend of Factoring Receivables Including and Excluding Energy Sector
17.015.4
15.7
11.9
5.0
7.0
9.0
11.0
13.0
15.0
17.0
19.0
2008 2009 2010 2011
Enerji Sektörü Dahil Enerji Sektörü Hariç
Graph 3 – 2011 Distribution by Sector
Others 43.5%
Energy7.6%
Textiles and Textile Products
9.3%
Construction7.9%
Main Metal Industry
7.3%Machine and Equipment Industry
6.5%
Transport Vehicles Industry
7.4% Wholesale and Retail Trade
10.5%
Source: BRSA
13
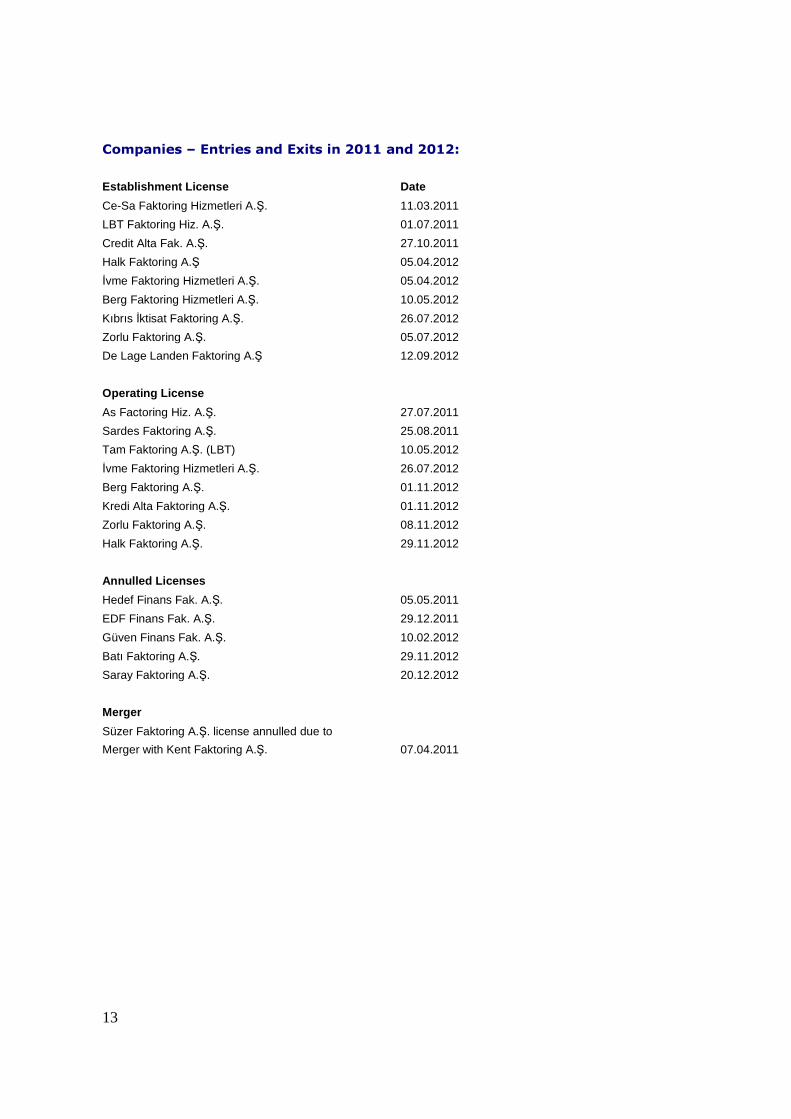
Companies – Entries and Exits in 2011 and 2012:
Establishment License Date
Ce-Sa Faktoring Hizmetleri A.Ş. 11.03.2011
LBT Faktoring Hiz. A.Ş. 01.07.2011
Credit Alta Fak. A.Ş. 27.10.2011
Halk Faktoring A.Ş 05.04.2012
İvme Faktoring Hizmetleri A.Ş. 05.04.2012
Berg Faktoring Hizmetleri A.Ş. 10.05.2012
Kıbrıs İktisat Faktoring A.Ş. 26.07.2012
Zorlu Faktoring A.Ş. 05.07.2012
De Lage Landen Faktoring A.Ş 12.09.2012
Operating License
As Factoring Hiz. A.Ş. 27.07.2011
Sardes Faktoring A.Ş. 25.08.2011
Tam Faktoring A.Ş. (LBT) 10.05.2012
İvme Faktoring Hizmetleri A.Ş. 26.07.2012
Berg Faktoring A.Ş. 01.11.2012
Kredi Alta Faktoring A.Ş. 01.11.2012
Zorlu Faktoring A.Ş. 08.11.2012
Halk Faktoring A.Ş. 29.11.2012
Annulled Licenses
Hedef Finans Fak. A.Ş. 05.05.2011
EDF Finans Fak. A.Ş. 29.12.2011
Güven Finans Fak. A.Ş. 10.02.2012
Batı Faktoring A.Ş. 29.11.2012
Saray Faktoring A.Ş. 20.12.2012
Merger
Süzer Faktoring A.Ş. license annulled due to
Merger with Kent Faktoring A.Ş.
07.04.2011

14
3. FACTORING SERVICES
Factoring Services in Brief
Turkish factoring companies provide three major services to their customers: discounting, collection, and guaranteeing of domestic and international future receivables through the assignment of receivables to the factoring company. Receivables arising from the sale of goods and services include receivables that will arise from future sale of goods and/or the rendering of services. “Financing” the customer means discounting post-dated receivables against their assignment to the factoring company, thereby providing the customer with cash. “Collection” is purely undertaking the responsibility of the payment of all receivables on the due dates, regardless of a guarantee, and reporting to the customer. Presently, collection of receivables has a relatively small share in these services but is rapidly growing. “Guaranteeing receivables” refers to a payment guarantee of receivables in case a debtor falls into payment difficulty or goes bankrupt. In many respects factoring constitutes an alternative financing model to banking. It is often referred to as supplier financing or agency financing in Turkey. This is because the suppliers of financially strong and well respected companies can easily generate cash by factoring their receivables from such customers. This system facilitates the cash flow of SMEs by providing them with working capital and liquidity. From the point of SME customers who use factoring services, the foremost advantage of factoring services is the relative simplicity of documentation and the speed of services. The time period between an application to factor a receivable and getting the payment is significantly shorter than the period necessary to obtain a bank loan. Another advantage for all companies, large and small, is balance sheet enhancement whereby receivables are replaced by cash items subsequent to a guaranteed factoring of receivables. One of the useful functions of factoring is the provision of working capital and liquidity. By employing factoring services, companies may improve their liquidity positions and, thereby, the appearance of their balance sheets. As factoring companies work closely with their customers, they acquire and accumulate information on their customers. In that respect they gain insight into the financial strength and credit standing of these companies. In the case of export factoring, factoring companies enlarge the export market potential of their customers and are able to provide information on the overseas buyers. The dominance of small and medium sized companies in Turkey constitutes the main trigger of strong demand for factoring services. The more factoring services they will use, the higher will be the proportion of recorded transactions. Factoring plays a positive role in preventing unrecorded sales. While factoring is primarily associated with SMEs, the leading companies also have a fair amount of large corporations among their customers. These corporations view this channel as a financing opportunity that is in addition to their bank limits.

15
The Existence of a Large Number of SMEs in Turkey
The majority of factoring companies’ customers are small and medium-size companies. According to statistics from the Social Security Administration, there are 1.5 million companies in Turkey. As clearly visible in Table 18, as of March 2012, 63% of these companies were employed fewer than three people while 85% employed fewer than ten people. The backdrop of such an SME concentration in Turkey provides strong demand for factoring services.
Table 16 – Distribution of SMEs in Turkey
Source: March 2012 Bulletin of Statistics of the Social Security Administration
Check (Cheque)Transactions in Turkey
Another important factor that reinforces the demand for factoring services in Turkey is the fact that post-dated checks are permitted, and the use is widespread across the country. Data published by the Interbank Settlement Center reveals that payments with checks have exceeded TL275 billion. We noted that 32.6% of the checks were for amounts of between TL2,000 and TL5,000, and that 15.8% were under TL2,000. These numbers are important in explaining why factoring companies dealing with a large number of customers financing small ticket checks have built their strategies in response to market behavior.
Table 17 - Transaction Volume of the Checks in Turkey
2006 2007 2008 2009 2010 2011
Transaction Volume (Billion TL) 188.3 220.5 234.3 200.8 228.0 275.4
Source: CBT
Table 18 - Distribution of the Checks Presented to ICH according to Amount Tranches (%)
≤ 2,000 TL 2,000-5,000 TL 5,000-10,000 TL 10,000 – 5 0,000 TL 50,000 ≥TL
2007 35.71 31.51 16.63 14.30 1.85
2008 30.33 32.62 18.24 16.42 2.38
2009 27.70 34.07 19.10 16.73 2.40
2010 22.81 34.47 20.70 18.94 3.08
2011 15.83 32.62 22.89 24.24 4.43
Source: CBT and ICH
Size of Company
Number of
Companies % Share
1-3 persons 922,701 62.92
4-9 328,778 22.42
10-49 186,868 12.74
50-99 15,705 1.07
100-249 9,168 0.63
250-499 2,370 0.16
500-999 744 0.05
1000+ 237 0.02
Total 1,466,571 100.00

16
4. FACTORING COMPANIES
Companies and Market Shares
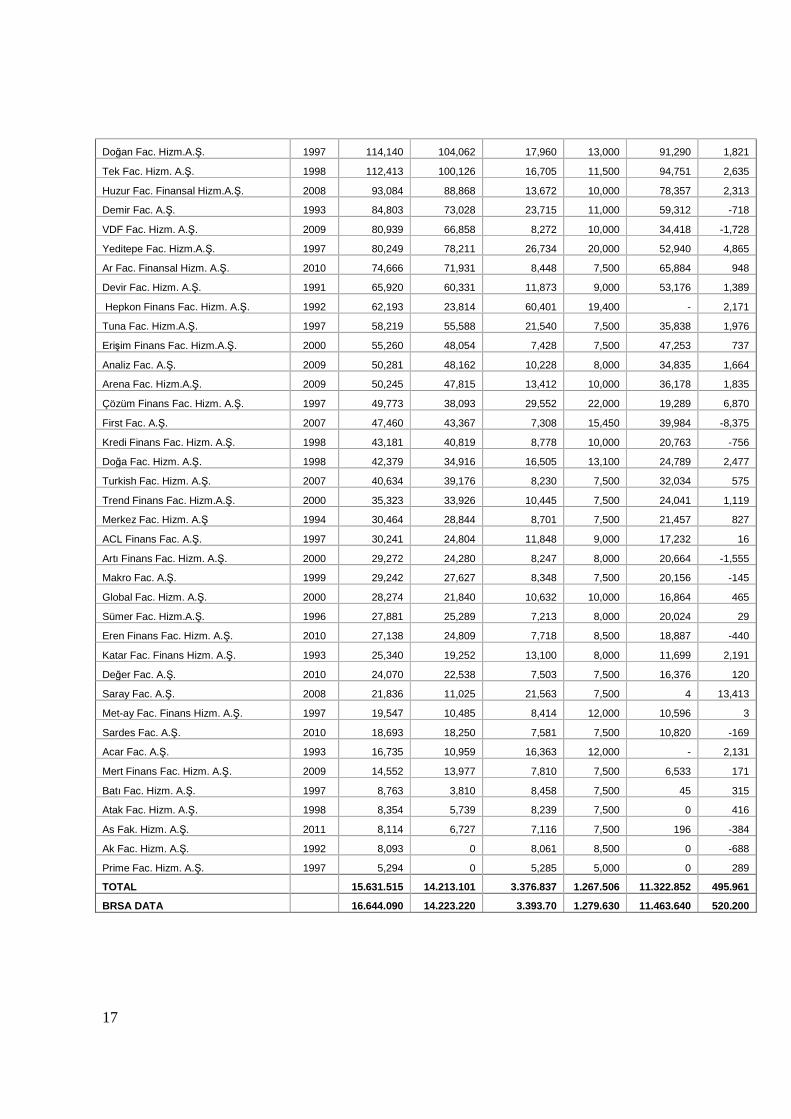
Table 21 lists the 74 factoring companies that were operating as of 31st December 2011.
Table 19 – Factoring Companies in Turkey as of 31.12.2011 (1000 TL)
Year of Establ. Assets
Factoring Receivables
Shareholders’ Equity
Paid-in Capital Loans Net Profit
Yapı Kredi Fac. A.Ş. 1992 1,881,264 1,794,353 183,263 16,802 1,661,224 46,044
Garanti Fac. Hizm. A.Ş. 1990 1,275,030 1,247,324 84,522 21,000 1,180,105 34,534
Deniz Fac. A.Ş. 1998 1,013,675 979,837 180,532 25,600 824,161 35,418
TEB Fac. A.Ş. 1997 868,679 817,847 38,462 19,000 811,851 10,247
Fiba Fac. Hizm. A.Ş. 1992 752,044 623,670 216,260 14,000 512,639 -24,772
Kapital Fac. Hizm. A.Ş. 1992 714,479 703,473 316,347 10,000 281,459 51,033
Vakıf Finans Fac. Hizm. A.Ş. 1998 624,130 617,804 84,763 22,400 537,052 13,243
Girişim Fac. A.Ş. 1997 564,331 461,007 117,805 40,000 245,363 25,445
Lider Fac. Hizm. A.Ş.. 1992 520,237 288,265 229,473 17,500 270,624 -55,796
Creditwest Fac. Hizm. A.Ş. 1994 500,821 466,061 69,035 30,000 379,162 25,652
Iş Fac. Finansman Hizm. A.Ş.. 1993 432,413 404,653 52,973 16,000 377,751 8,236
Destek Finans Fac. Hizm. A.Ş. 1996 370,425 336,954 112,294 40,000 235,546 21,513
ING Fac. A.Ş. 2010 312,760 285,342 41,597 40,000 267,950 1,022
Yaşar Fac. Hizm.A.Ş.. 1993 298,628 280,801 94,243 13,000 196,081 17,221
Finans Fac. Hizm. A.Ş.. 2009 279,570 251,719 23,380 20,000 253,475 3,340
Şirinoğlu Fac. Fins.Hizm.T.A.Ş. 1992 268,001 189,639 97,709 50,000 162,935 32,320
Eko Fac. A.Ş. 1994 263,293 242,441 71,688 21,026 187,957 30,590
Fortis Fac. A.Ş. 1992 260,456 241,944 70,843 21,026 187,960 26,624
Ekspo Fac. A.Ş. 2002 248,083 245,172 22,299 14,500 223,241 -9,410
C Fac. A.Ş. 2000 242,850 119,253 161,986 50,000 73,452 67,383
MNG Fac. Hizm. A.Ş. 1999 235,960 88,072 150,116 67,800 85,354 6,110
Pamuk Fac. A.Ş. 1992 226,149 211,885 44,222 36,000 180,438 431
Ulusal Fac. A.Ş. 1999 189,824 174,242 46,693 18,616 57,863 5,301
Şeker Fac. Hizm. A.Ş. 2000 185,659 179,599 19,833 16,000 163,902 2,305
Tekstil Fac. Hizm. A.Ş. 1997 182,191 180,705 33,482 8,100 145,848 3,974
Kent Fac. A.Ş. 1994 181,938 176,664 35,774 26,502 144,650 12,294
Bayramoğlu Finans Fac. Hizm. A.Ş. 1997 159,697 150,349 91,305 60,000 37,444 27,491
Akın Fac. Hizm. A.Ş. 2000 132,843 131,763 33,699 10,000 97,857 6,799
Strateji Fac. Hizm. A.Ş. 1996 130,167 123,855 13,994 11,000 114,444 1,650
Çağdaş Finans Fac. Hizm. A.Ş. 1994 129,277 123,467 45,343 20,000 39,658 22,385
Optima Fac. Hizm. A.Ş. 1997 128,480 112,913 24,988 16,000 73,508 6,318
Anadolu Fac. Hizm. A.Ş. 2007 120,946 119,129 45,843 27,210 74,488 17,065
Akdeniz Fac. Hizm. A.Ş.. 1993 120,745 119,111 11,774 10,000 108,306 1,247
Atılım Fac. A.Ş. 1999 118,811 110,214 28,637 12,000 77,699 5,621
Başer Fac. A.Ş. 1993 116,377 110,064 27,278 15,000 84,928 3,423
Para Finans Fac. Hizm.A.Ş. 1995 115,636 104,062 19,943 16,000 71,872 3,059
17
Doğan Fac. Hizm.A.Ş. 1997 114,140 104,062 17,960 13,000 91,290 1,821
Tek Fac. Hizm. A.Ş. 1998 112,413 100,126 16,705 11,500 94,751 2,635
Huzur Fac. Finansal Hizm.A.Ş. 2008 93,084 88,868 13,672 10,000 78,357 2,313
Demir Fac. A.Ş. 1993 84,803 73,028 23,715 11,000 59,312 -718
VDF Fac. Hizm. A.Ş. 2009 80,939 66,858 8,272 10,000 34,418 -1,728
Yeditepe Fac. Hizm.A.Ş. 1997 80,249 78,211 26,734 20,000 52,940 4,865
Ar Fac. Finansal Hizm. A.Ş. 2010 74,666 71,931 8,448 7,500 65,884 948
Devir Fac. Hizm. A.Ş. 1991 65,920 60,331 11,873 9,000 53,176 1,389
Hepkon Finans Fac. Hizm. A.Ş. 1992 62,193 23,814 60,401 19,400 - 2,171
Tuna Fac. Hizm.A.Ş. 1997 58,219 55,588 21,540 7,500 35,838 1,976
Erişim Finans Fac. Hizm.A.Ş. 2000 55,260 48,054 7,428 7,500 47,253 737
Analiz Fac. A.Ş. 2009 50,281 48,162 10,228 8,000 34,835 1,664
Arena Fac. Hizm.A.Ş. 2009 50,245 47,815 13,412 10,000 36,178 1,835
Çözüm Finans Fac. Hizm. A.Ş. 1997 49,773 38,093 29,552 22,000 19,289 6,870
First Fac. A.Ş. 2007 47,460 43,367 7,308 15,450 39,984 -8,375
Kredi Finans Fac. Hizm. A.Ş. 1998 43,181 40,819 8,778 10,000 20,763 -756
Doğa Fac. Hizm. A.Ş. 1998 42,379 34,916 16,505 13,100 24,789 2,477
Turkish Fac. Hizm. A.Ş. 2007 40,634 39,176 8,230 7,500 32,034 575
Trend Finans Fac. Hizm.A.Ş. 2000 35,323 33,926 10,445 7,500 24,041 1,119
Merkez Fac. Hizm. A.Ş 1994 30,464 28,844 8,701 7,500 21,457 827
ACL Finans Fac. A.Ş. 1997 30,241 24,804 11,848 9,000 17,232 16
Artı Finans Fac. Hizm. A.Ş. 2000 29,272 24,280 8,247 8,000 20,664 -1,555
Makro Fac. A.Ş. 1999 29,242 27,627 8,348 7,500 20,156 -145
Global Fac. Hizm. A.Ş. 2000 28,274 21,840 10,632 10,000 16,864 465
Sümer Fac. Hizm.A.Ş. 1996 27,881 25,289 7,213 8,000 20,024 29
Eren Finans Fac. Hizm. A.Ş. 2010 27,138 24,809 7,718 8,500 18,887 -440
Katar Fac. Finans Hizm. A.Ş. 1993 25,340 19,252 13,100 8,000 11,699 2,191
Değer Fac. A.Ş. 2010 24,070 22,538 7,503 7,500 16,376 120
Saray Fac. A.Ş. 2008 21,836 11,025 21,563 7,500 4 13,413
Met-ay Fac. Finans Hizm. A.Ş. 1997 19,547 10,485 8,414 12,000 10,596 3
Sardes Fac. A.Ş. 2010 18,693 18,250 7,581 7,500 10,820 -169
Acar Fac. A.Ş. 1993 16,735 10,959 16,363 12,000 - 2,131
Mert Finans Fac. Hizm. A.Ş. 2009 14,552 13,977 7,810 7,500 6,533 171
Batı Fac. Hizm. A.Ş. 1997 8,763 3,810 8,458 7,500 45 315
Atak Fac. Hizm. A.Ş. 1998 8,354 5,739 8,239 7,500 0 416
As Fak. Hizm. A.Ş. 2011 8,114 6,727 7,116 7,500 196 -384
Ak Fac. Hizm. A.Ş. 1992 8,093 0 8,061 8,500 0 -688
Prime Fac. Hizm. A.Ş. 1997 5,294 0 5,285 5,000 0 289
TOTAL 15.631.515 14.213.101 3.376.837 1.267.506 11.322.852 495.961
BRSA DATA 16.644.090 14.223.220 3.393.70 1.279.630 11.463.640 520.200
18
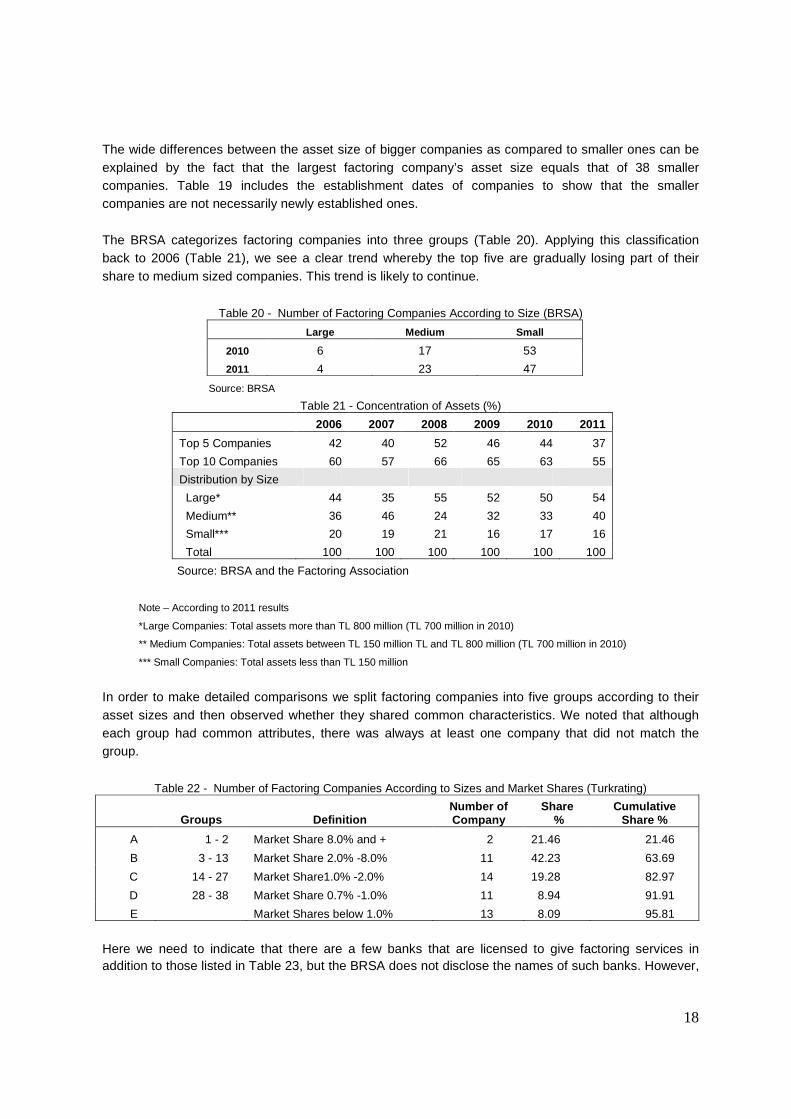
The wide differences between the asset size of bigger companies as compared to smaller ones can be explained by the fact that the largest factoring company’s asset size equals that of 38 smaller companies. Table 19 includes the establishment dates of companies to show that the smaller companies are not necessarily newly established ones. The BRSA categorizes factoring companies into three groups (Table 20). Applying this classification back to 2006 (Table 21), we see a clear trend whereby the top five are gradually losing part of their share to medium sized companies. This trend is likely to continue.
Table 20 - Number of Factoring Companies According to Size (BRSA)
Large Medium Small
2010 6 17 53
2011 4 23 47
Source: BRSA
Table 21 - Concentration of Assets (%) 2006 2007 2008 2009 2010 2011
Top 5 Companies 42 40 52 46 44 37
Top 10 Companies 60 57 66 65 63 55
Distribution by Size
Large* 44 35 55 52 50 54
Medium** 36 46 24 32 33 40
Small*** 20 19 21 16 17 16
Total 100 100 100 100 100 100
Source: BRSA and the Factoring Association
Note – According to 2011 results
*Large Companies: Total assets more than TL 800 million (TL 700 million in 2010)
** Medium Companies: Total assets between TL 150 million TL and TL 800 million (TL 700 million in 2010)
*** Small Companies: Total assets less than TL 150 million
In order to make detailed comparisons we split factoring companies into five groups according to their asset sizes and then observed whether they shared common characteristics. We noted that although each group had common attributes, there was always at least one company that did not match the group.
Table 22 - Number of Factoring Companies According to Sizes and Market Shares (Turkrating)
Groups Definition Number of Company
Share %
Cumulative Share %
A 1 - 2 Market Share 8.0% and + 2 21.46 21.46
B 3 - 13 Market Share 2.0% -8.0% 11 42.23 63.69
C 14 - 27 Market Share1.0% -2.0% 14 19.28 82.97
D 28 - 38 Market Share 0.7% -1.0% 11 8.94 91.91
E Market Shares below 1.0% 13 8.09 95.81
Here we need to indicate that there are a few banks that are licensed to give factoring services in addition to those listed in Table 23, but the BRSA does not disclose the names of such banks. However,

19
HSBC and Euro Tekfen Bank are members of the Factoring Association and their data is included in the association’s statistics.
Table 23 – List of Factoring Companies by Asset Size and Market Shares Total Total Market shares
Assets Assets 2010 2011 2010 2011 % Chg, Share (%) Share (%)
1 Yapı Kredi Fak. A.Ş. 2,023,857 1,881,264 -7.05 13.99 12.03 2 Garanti Fak. Hizm. A.Ş. 1,565,565 1,275,030 -18.56 10.82 8.15 3 Deniz Fac. A.Ş. 924,484 1,013,675 9.65 6.39 6.48 4 TEB Fac. A.Ş. 781,569 868,679 11.15 5.40 5.55 5 Fiba Fac. Hizm. A.Ş. 808,610 752,044 -7.00 5.59 4.81 6 Kapital Fak. Hizm. A.Ş. 532,434 714,479 34.19 3.68 4.57 7 Vakıf Fin. Fac. Hizm. A.Ş. 819,925 624,130 -23.88 5.67 3.99 8 Girişim Fak. A.Ş. 392,782 564,331 43.68 2.72 3.61 9 Lider Fak. Hizm. A.Ş. 627,922 520,237 -17.15 4.34 3.33
10 Creditwest Fak. Hizm. A.Ş. 368,403 500,821 35.94 2.55 3.20 11 Iş Fac. Finansman Hizm.A.Ş. 477,505 432,413 -9.44 3.30 2.76 12 Destek Fin. Fac. Hizm. A.Ş. 251,450 370,425 47.32 1.74 2.37 13 ING Fak. A.Ş. 150,216 312,760 108.21 1.04 2.00 14 Yaşar Fac. Hizm. A.Ş. 167,355 298,628 78.44 1.16 1.91 15 Finans Fak. Hizm. A.Ş. 264,652 279,570 5.64 1.83 1.79 16 Şirinoğlu Fac. Fins. Hizm.T.A.Ş. 252,535 268,001 6.12 1.75 1.71 17 Eko Fac. Hizm. A.Ş. 223,966 263,293 17.56 1.55 1.68 18 Fortis Fak. A.Ş. 201,247 260,456 29.42 1.39 1.66 19 Ekspo Fak. A.Ş. 119,103 248,083 108.29 0.82 1.59 20 C Fak. A.Ş. 247,383 242,850 -1.83 1.71 1.55 21 MNG Fac. Hizm. A.Ş. 219,302 235,960 7.60 1.52 1.51 22 Pamuk Fac. A.Ş 158,375 226,149 42.79 1.09 1.45 23 Ulusal Fak. A.Ş. 125,164 189,824 51.66 0.87 1.21 24 Şeker Fak. Hizm. A.Ş. 167,059 185,659 11.13 1.15 1.19 25 Tekstil Fac. Hizm. A.Ş. 124,677 182,191 46.13 0.86 1.16 26 Kent Fac. A.Ş. 79,397 181,938 129.15 0.55 1.16 27 Bayramoğlu Fin. Fak. Hizm. A.Ş. 127,339 159,697 25.41 0.88 1.02 28 Akın Fak. Hizm. A.Ş. 100,960 132,843 31.58 0.70 0.85 29 Strateji Fac. Hizm. A.Ş. 127,947 130,167 1.74 0.88 0.83 30 Çağdaş Fin. Fac. Hizm. A.Ş. 92,421 129,277 39.88 0.64 0.83 31 Optima Fak. Hizm. A.Ş. 121,507 128,480 5.74 0.84 0.82 32 Anadolu Fak. Hizm. A.Ş. 149881 120,946 - 1.04 0.77 33 Akdeniz Fac. Hizm. A.Ş. 99,963 120,745 20.79 0.69 0.77 34 Atılım Fak. A.Ş. 103,355 118,811 14.95 0.71 0.76 35 Başer Fak. A.Ş. 93,307 116,377 24.72 0.64 0.74 36 Para Fin. Fac. Hizm. A.Ş. 86,946 115,636 33.00 0.60 0.74 37 Doğan Fac. Hizm. A.Ş. 19,585 114,140 482.79 0.14 0.73 38 Tek Fak. Hizm. A.Ş. 105,202 112,413 6.85 0.73 0.72 39 Huzur Fak. Fin. Hizm. A.Ş. 67,137 93,084 38.65 0.46 0.60 40 Demir Fac. A.Ş. 66,690 84,803 27.16 0.46 0.54 41 VDF Fak. Hizm. A.Ş. 12,643 80,939 540.18 0.09 0.52 42 Yeditepe Fak. Hizm. A.Ş. 63,440 80,249 26.50 0.44 0.51 43 Ar Fak. Fin. Hizm. A.Ş. 56,655 74,666 31.79 0.39 0.48 44 Devir Fac. Hizm. A.Ş. 49,522 65,920 33.11 0.34 0.42 45 Hepkon Fin. Fak. Hizm. A.Ş. 70,589 62,193 -11.89 0.49 0.40 46 Tuna Fak. Hizm. A.Ş. 40,326 58,219 44.37 0.28 0.37 47 Erişim Fin. Fak. Hizm. A.Ş. 55,969 55,260 -1.27 0.39 0.35
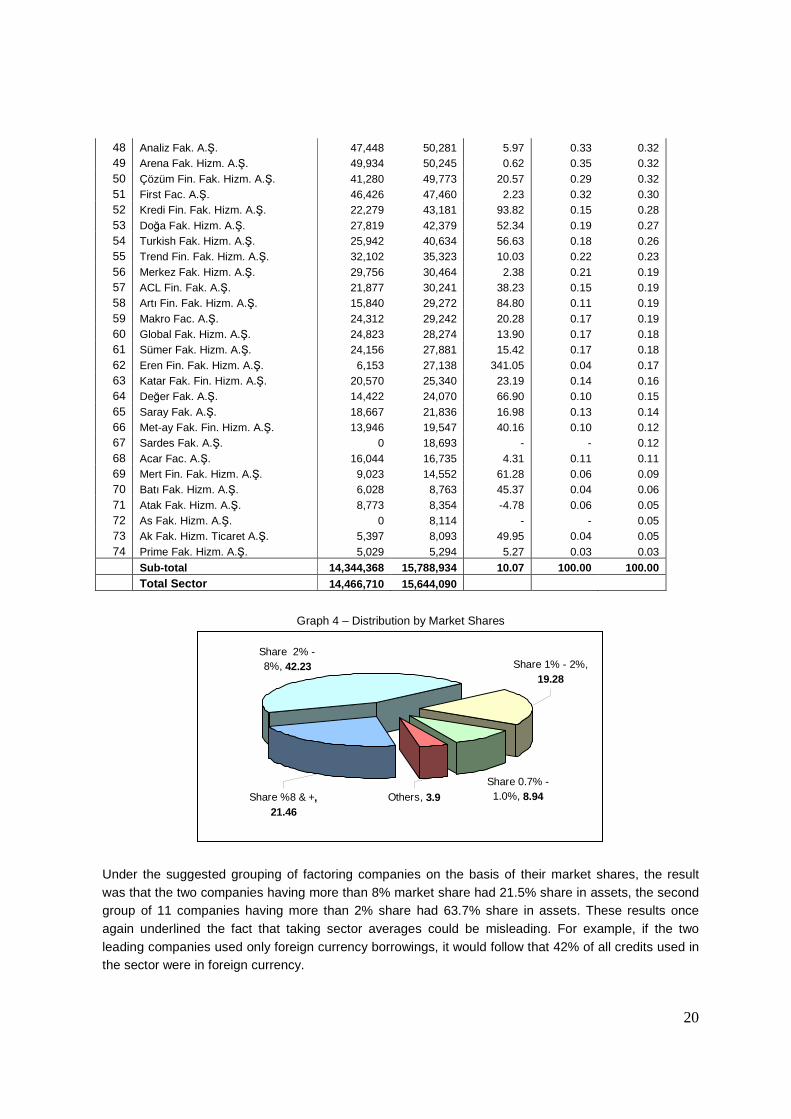
20
48 Analiz Fak. A.Ş. 47,448 50,281 5.97 0.33 0.32 49 Arena Fak. Hizm. A.Ş. 49,934 50,245 0.62 0.35 0.32 50 Çözüm Fin. Fak. Hizm. A.Ş. 41,280 49,773 20.57 0.29 0.32 51 First Fac. A.Ş. 46,426 47,460 2.23 0.32 0.30 52 Kredi Fin. Fak. Hizm. A.Ş. 22,279 43,181 93.82 0.15 0.28 53 Doğa Fak. Hizm. A.Ş. 27,819 42,379 52.34 0.19 0.27 54 Turkish Fak. Hizm. A.Ş. 25,942 40,634 56.63 0.18 0.26 55 Trend Fin. Fak. Hizm. A.Ş. 32,102 35,323 10.03 0.22 0.23 56 Merkez Fak. Hizm. A.Ş. 29,756 30,464 2.38 0.21 0.19 57 ACL Fin. Fak. A.Ş. 21,877 30,241 38.23 0.15 0.19 58 Artı Fin. Fak. Hizm. A.Ş. 15,840 29,272 84.80 0.11 0.19 59 Makro Fac. A.Ş. 24,312 29,242 20.28 0.17 0.19 60 Global Fak. Hizm. A.Ş. 24,823 28,274 13.90 0.17 0.18 61 Sümer Fak. Hizm. A.Ş. 24,156 27,881 15.42 0.17 0.18 62 Eren Fin. Fak. Hizm. A.Ş. 6,153 27,138 341.05 0.04 0.17 63 Katar Fak. Fin. Hizm. A.Ş. 20,570 25,340 23.19 0.14 0.16 64 Değer Fak. A.Ş. 14,422 24,070 66.90 0.10 0.15 65 Saray Fak. A.Ş. 18,667 21,836 16.98 0.13 0.14 66 Met-ay Fak. Fin. Hizm. A.Ş. 13,946 19,547 40.16 0.10 0.12 67 Sardes Fak. A.Ş. 0 18,693 - - 0.12 68 Acar Fac. A.Ş. 16,044 16,735 4.31 0.11 0.11 69 Mert Fin. Fak. Hizm. A.Ş. 9,023 14,552 61.28 0.06 0.09 70 Batı Fak. Hizm. A.Ş. 6,028 8,763 45.37 0.04 0.06 71 Atak Fak. Hizm. A.Ş. 8,773 8,354 -4.78 0.06 0.05 72 As Fak. Hizm. A.Ş. 0 8,114 - - 0.05 73 Ak Fak. Hizm. Ticaret A.Ş. 5,397 8,093 49.95 0.04 0.05 74 Prime Fak. Hizm. A.Ş. 5,029 5,294 5.27 0.03 0.03
Sub-total 14,344,368 15,788,934 10.07 100.00 100.00 Total Sector 14,466,710 15,644,090
Graph 4 – Distribution by Market Shares
Others, 3.9Share 0.7% - 1.0%, 8.94Share %8 & +,
21.46
Share 2% - 8%, 42.23 Share 1% - 2%,
19.28
Under the suggested grouping of factoring companies on the basis of their market shares, the result was that the two companies having more than 8% market share had 21.5% share in assets, the second group of 11 companies having more than 2% share had 63.7% share in assets. These results once again underlined the fact that taking sector averages could be misleading. For example, if the two leading companies used only foreign currency borrowings, it would follow that 42% of all credits used in the sector were in foreign currency.

21
Market Shares Based on Factoring Receivables
Rankings differed slightly when these factoring companies were listed according to their factoring receivables. We note that the third column of Table 24 is quite interesting in terms of revealing the stark differences in the companies’ growth strategies. As a result of its growth policy the ranking of any particular factoring company can go up or down several steps in one year. In that respect, a company’s ranking and market share should not be over emphasized. The market share factor appeared to be less meaningful in terms of financial strength. A company with a small market share can very well have a much higher credit standing than other companies that rank higher in size.
Table 24 – Market Shares According to Factoring Receivables 2010 2011 2010 2011
1000 TL 1000 TL %
Change Share% %
Share
1. Yapı Kredi Fak. A.Ş. 1,829,737 1,794,353 -1.93 14.79 12.62
2. Garanti Fak. Hizm. A.Ş. 1,425,654 1,247,324 -12.61 11.54 8.77 3. Deniz Fac. A.Ş. 876,479 979,837 11.83 7.08 6.89 4. TEB Fac. A.Ş. 601,074 817,847 36.06 4.86 5.75 5. Kapital Fak. Hizm. A.Ş. 522,206 703,472 34.71 4.22 4.95 6. Fiba Fac. Hizm. A.Ş. 766,313 623,670 -18.62 6.19 4.38 7. Vakıf Fin. Fac. Hizm. A.Ş. 465,373 617,805 32.75 3.76 4.34 8. Lider Fak. Hizm. A.Ş. 357,192 466,061 31.21 2.87 3.28 9. Creditwest Fak. Hizm. A.Ş. 319,136 461,007 44.45 2.58 3.24 10. Iş Fac. Finansman Hizm.A.Ş. 331,320 404,653 22.13 2.68 2.85 11. Destek Fin. Fac. Hizm. A.Ş. 236,662 336,954 42.38 1.91 2.37 12. Girişim Fak. A.Ş. 403,573 288,265 -28.57 3.26 2.03 13. ING Fak. A.Ş. 136,178 285,342 109.54 1.10 2.01
14. Yaşar Fac. Hizm. A.Ş. 161,596 280,801 73.77 1.31 1.97 15. Fin. Fak. Hizm. A.Ş. 221,524 251,719 13.63 1.79 1.77 16. Fortis Fak. A.Ş. 117,583 245,172 108.51 0.95 1.72 17. Eko Fac. Hizm. A.Ş. 220,994 242,441 6.70 1.79 1.70 18. Ekspo Fak. A.Ş. 181,055 241,944 33.63 1.46 1.70 19. MNG Fac. Hizm. A.Ş. 146,970 211,885 44.17 1.19 1.49 20. Şirinoğlu Fac. Fins.
Hizm.T.A.Ş. 192,370 189,639 -1.42 1.56 1.33 21. Tekstil Fac. Hizm. A.Ş 124,422 180,705 45.24 1.01 1.27 22. Şeker Fak. Hizm. A.Ş. 163,221 179,599 10.03 1.32 1.26 23. Kent Fac. A.Ş. 78,332 176,664 125.53 0.63 1.24 24. Ulusal Fak. A.Ş. 118,090 174,242 47.66 0.95 1.23 25. Bayramoğlu Fin. Fak. Hizm.
A.Ş. 114,487 150,349 31.32 0.93 1.06 26. Akın Fak. Hizm. A.Ş. 100,306 131,763 31.36 0.81 0.93
27. Strateji Fac. Hizm. A.Ş. 119,885 123,855 3.31 0.97 0.87 28. Çağdaş Fin. Fac. Hizm. A.Ş. 86,272 123,467 43.11 0.70 0.87 29. Pamuk Fac. A.Ş. 107,237 119,253 11.21 0.87 0.84 30. Anadolu Fak. Hizm. A.Ş. 148,004 119,129 -19.51 1.20 0.84 31. Akdeniz Fac. Hizm. A.Ş. 98,858 119,111 20.49 0.80 0.84 32. Optima Fak. Hizm. A.Ş. 110,906 112,972 1.86 0.90 0.79 33. Atılım Fak. A.Ş. 98,305 112,216 14.15 0.79 0.79 34. Doğan Fac. Hizm. A.Ş. 16,867 110,214 581.77 0.14 0.81 35. Başer Fak. A.Ş. 88,698 110,064 24.09 0.72 0.77 36. Para Fin. Fac. Hizm. A.Ş. 74,625 104,062 39.45 0.60 0.73 37. Tek Fak. Hizm. A.Ş. 95,899 100,126 4.41 0.78 0.70
38. Huzur Fak. Fin. Hizm. A.Ş. 64,082 88,868 38.68 0.52 0.62 39. C Fak. A.Ş. 71,438 88,072 23.28 0.58 0.62 40. Yeditepe Fak. Hizm. A.Ş. 61,485 78,211 27.20 0.50 0.55

22
41. Demir Fac. A.Ş. 53,004 73,028 37.78 0.43 0.51 42. Ar Fak. Fin. Hizm. A.Ş. 55,317 71,931 30.03 0.45 0.51 43. VDF Fak. Hizm. A.Ş. 663 66,858 ---- 0.01 0.47 44. Devir Fac. Hizm. A.Ş. 45,342 60,331 33.06 0.37 0.42 45. Tuna Fak. Hizm. A.Ş. 38,449 55,588 44.58 0.31 0.39 46. Analiz Fak. A.Ş. 46,211 48,162 4.22 0.37 0.34 47. Erişim Fin. Fak. Hizm. A.Ş. 49,430 48,054 -2.78 0.40 0.34 48. Arena Fak. Hizm. A.Ş. 49,057 47,815 -2.53 0.40 0.34 49. First Fac. A.Ş. 41,536 43,367 4.41 0.34 0.30 50. Kredi Fin. Fak. Hizm. A.Ş. 19,191 40,819 112.70 0.16 0.29 51. Turkish Fak. Hizm. A.Ş. 25,528 39,176 53.46 0.21 0.28 52. Çözüm Fin. Fak. Hizm. A.Ş. 35,910 38,093 6.08 0.29 0.27 53. Doğa Fak. Hizm. A.Ş. 21,434 34,916 62.90 0.17 0.25 54. Trend Fin. Fak. Hizm. A.Ş. 28,536 33,926 18.89 0.23 0.24 55. Merkez Fak. Hizm. A.Ş. 28,729 28,844 0.40 0.23 0.20 56. Makro Fac. A.Ş. 23,783 27,627 16.56 0.18 0.18 57. Sümer Fak. Hizm. A.Ş. 21,696 25,289 16.57 0.18 0.18 58. Eren Fin. Fak. Hizm. A.Ş. 203 24,809 -- 0.00 0.17 59. ACL Fin. Fak. A.Ş. 16,980 24,804 46.08 0.14 0.17 60. Artı Fin. Fak. Hizm. A.Ş. 10,702 24,280 126.87 0.09 0.17 61. Hepkon Fin. Fak. Hizm. A.Ş. 16,103 23,814 47.89 0.13 0.17 62. Değer Fak. A.Ş. 13,951 22,538 61.55 0.11 0.16 63. Global Fak. Hizm. A.Ş. 21,083 21,840 3.59 0.17 0.15 64. Katar Fak. Fin. Hizm. A.Ş. 15,900 19,252 21.08 0.13 0.14 65. Sardes Fak. A.Ş. 0 18,250 -- 0.00 0.13 66. Mert Fin. Fak. Hizm. A.Ş. 8,603 13,977 62.47 0.07 0.10 67. Saray Fak. A.Ş. 17,344 11,025 -36.43 0.14 0.08 68. Acar Fac. A.Ş. 7,684 10,959 42.62 0.06 0.08 69. Met-ay Fak. Fin. Hizm. A.Ş. 7,543 10,485 39.00 0.06 0.07 70. As Fak. Hizm. A.Ş. 0 6,727 -- 0.00 0.05 71. Atak Fak. Hizm. A.Ş. 8,559 5,739 -32.95 0.07 0.04 72. Batı Fak. Hizm. A.Ş. 1,721 3,810 121.38 0.01 0.03 73. Ak Fak. Hizm. Ticaret A.Ş. 135 0 -100.00 0.00 0.00 74. Prime Fak. Hizm. A.Ş. 0 0 0 0 0
Total 12,184,057 14,219,207 16.70 98.50 99 .97
Total Sector (BRSA) 12,370,170 14,223,220 14.98 100 .00 100.00
Not: The data in the above table has been taken from the companies audit reports on the BRSA’s web pages. The market shares
are calculated taking the BRSA’s total factoring receivables of 2010 and 2011. As the total of data taken from audit reports add up
to a lower sum, the annual increase of factoring receivables comes out as 16.7%.
Despite the importance of the volume of discounted receivables, companies providing collection services and guarantees should not be ignored as these are also fundamental factoring operations. Tables 25 and 26 give the list of the leading companies giving these services. The data on these services can be obtained on their off-balance sheets under “irrevocable factoring operations” and “revocable factoring operations”. As a result of the different business strategies of factoring companies, they can have competitive strengths in different areas. For example, a company having a small market share in overall ranking is able to take place among the top ten companies in export factoring. In fact, a company having built its business model prioritizing collection services ranks third with 10% market share in collection, although it has less than 1% market share in total factoring receivables.

23
In Table 25 we note that the leading 14 companies providing collection guarantee services have 98% share in the system. In collection services which do not involve any risk there are 11 leading companies having 77% market share.
Table 25 – Leading Companies Providing Guarantee Services
Recourse
Factoring Operations Recourse
Factoring Operations
1000 TL % Share
Yapı Kredi Faktoring 523,158 40.14
Garanti Faktoring 196,765 15.10
TEB Factoring 138,854 10.65
ING Faktoring 91,043 6.99
Deniz Factoring 47,039 3.61
Strateji Factoring 46,893 3.60
Iş Factoring Finansman 43,840 3.36
Yaşar Factoring 43,840 3.36
Fiba Factoring 35,583 2.73
Vakıf Finans Factoring 35,001 2.69
Fortis Faktoring 32,080 2.46
Creditwest Faktoring 16,610 1.27
Ekspo Faktoring 14,969 1.15
Girişim Faktoring 13,480 1.03
Total 1,279,155 98.14
Sector Total 1,303,381 100.00 Source: The Factoring Association
Table 26 – Leading Companies Providing Collection Services
Non-Recourse
Factoring Operations Non-Recourse
Factoring Operations
1000 TL % Share
Garanti Faktoring 975,235 23.59
Yapı Kredi Faktoring 528,623 12.78
Doğan Factoring 390,580 9.45
Fiba Factoring 286,576 6.93
Creditwest Faktoring 277,972 6.72
Vakıf Finans Factoring 197,687 4.78
Finans Faktoring 141,433 3.42
Optima Faktoring 118,577 2.87
Girişim Faktoring 99,952 2.42
Ekspo Faktoring A,Ş, 88,050 2.13
MNG Factoring 85,194 2.06
Total 3,189,879 77.15
Total Sector 4,134,870 100.00 Source: The Factoring Association

24
Ownership Structure
In 2011 there were 14 factoring companies that were bank subsidiaries and their total assets amounted to TL8.6 billion. Due to Yapi Kredi Factoring’s downsizing by 7% that year, the total asset size of this group decreased by TL351 million. Among these 14 factoring companies only one is the subsidiary of a state-owned bank. However, considering that Halk Factoring A.S. obtained an establishment license on 5 April 2012 (ie., before the end of the year) there could be two state-owned bank subsidiaries. It is also worth noting that another state-owned bank, Turk Eximbank, has 9.8% share in Garanti Factoring. Out of these 14 companies only the parent banks of Fiba Factoring, Is Factoring and Anadolu Factoring do not have foreign partners. In 2012 for the first time a foreign factoring company from Northern Cyprus received establishment license from the BRSA. Additionally, Tam Factoring in which EBRD has indirect ownership also received license to operate in this sector.
Table 27 - Total Assets of the Bank Participation Factoring Companies (1000 TL)
2009 2010 2011
1. Yapi Kredi 1,537,409 2,023,857 1,881,264
2. Garanti 1,138,515 1,565,565 1,275,030
3. Deniz 602,487 924,484 1,013,675
4. Teb 437,565 781,569 868,679
5. Fiba 849,649 808,610 752,044
6. Vakıf 572,781 819,925 624,130
7. Girişim 673,646 627,922 520,237
8. İş 276,099 477,505 432,413
9. ING -- 150,216 312,760
10. Finans 116,214 264,652 279,570
11. Fortis 43,272 119,103 248,083
12. Şeker 115,936 167,059 185,659
13. Anadolu 144,906 149,881 120,946
14. Turkish Bank 32,475 25,942 40,634
Total 6,540,954 8,906,290 8,555,124
The 14 factoring companies that are bank subsidiaries have more than 50% share in the sector both in terms of asset size and factoring receivables. The independent factoring companies constituting the second largest group, have barely 45% market share. Current developments point to a trend where the share of bank subsidiaries is diminishing leaving a larger market share to the independents. Table 30 lists the top 14 independent companies. Among these companies there are some which are legally not bank subsidiaries but belong to a group of companies which, among others, also own a bank. In that category we can list Tekstil Factoring, Creditwest Factoring, C Factoring and Suzer Factoring. The majority shareholder of Tekstil Factoring, GSD Holding, owns one deposit-taking bank and another investment bank. Similarly, the majority shareholder of Creditwest is Altinbas Holding, who has two banks – one in North Cyprus, the other in Ukraine. Suzer Holding recently acquired Bank Brod in Croatia. Yet another bank relation is in the case of C Factoring where the factoring company itself has stake in Bank Pozitif. These factors need to be taken into consideration while comparing the comparative advantages of these companies. In the case of four companies, Lider Faktoring, Eko Faktoring, C Faktoring and Ulusal Faktoring, foreign investors have acquired minority shares. Private equity funds have been keeping a close watch over a

25
number of Turkish factoring companies in recent years. There were a few unsuccessful bids during 2012, but their interest continues. Past acquisitions are listed below:
- In 2007 Bancroft Group invested in Eko Faktoring. Currently, the Coöperative BVS Financial Services U.A. which has 28% stake in the company, is a private equity company established in 1989 and operating in Central and Eastern Europe. No other disclosure is made other than it is part of Bancroft Group.
- In 2008 Credit Suisse Investments (Netherlands) B,V, acquired 10% share in Lider Faktoring. - In 2011, C Faktoring acquired 9.73% of HCBG Holding B.V. in which Demirhalk Bank has 70%
stake. C Faktoring is also the only factoring company to have a bank participation. It has 30.17% stake in BankPozitif Credit and Development Bank.
- Finally, also in 2011, PineBridge Eurasia Financial Investments S.a.r.l. acquired a 47% stake Ulusal Faktoring.
Needless to say, a strong parent company provides easier access to financing and perhaps presents a stronger bidding power to obtain lower funding cost. Both rating agencies and banks’ credit committees consider the financial strength of the parent company as one of the key credit standing criteria.
Table 28 - Assets Sizes of the Top Independent Factoring Companies (1000 TL)
2009 2010 2011
1. Kapital Fak. Hizm.A.Ş 394,007 532,434 714,479
2. Creditwest Fak. Hizm.A.Ş. 180,099 392,782 564,331
3. Lider Fak. Hizm.A.Ş. 306,987 368,403 500,821
4. Destek Fin. Fac. Hizm.A.Ş 176,658 251,450 370,425
5. Yaşar Fac. Hiz.A.Ş. 141,335 167,355 298,628
6. Şirinoğlu Fac. Hiz.T.A.Ş. 165,731 252,535 268,001
7. Ekspo Fak. A.Ş. 152,606 223,966 263,293
8. Eko Fac. Hizm.A.Ş. 118,525 201,247 260,456
9. Pamuk Fac. A.Ş 194,566 247,383 242,850
10. C Fak. A.Ş. 220,051 219,302 235,960
11. MNG Fac. Hizm. A.Ş. 70,489 158,375 226,149
12. Ulusal Fak. A.Ş. 85,631 125,164 189,824
13. Kent Fac. A.Ş 37,164 79,397 181,938
14. Bayramoğlu Fin. Fak. A.Ş. 129,880 127,339 159,697
Total 2,373,729 3,140,396 4,135,217
Table 31 shows the major differences in balance sheet structures between the 14 bank affiliates and the rest of the 60 independent factoring companies. The independent companies share in total assets accounts for 45% but their share in total shareholders’ equity is 79%.
Table 29 - Sector Shares of the Bank Participation and Independent Factoring Companies (%)
Bank Participations Independents
2009 2010 2011 2009 2010 2011
Total Assets 64.30 61.56 54.69 35.70 38.44 45.31
Total Factoring Receivables 60.85 59.58 54.64 39.15 40.42 45.36
NPLs 29.12 32.38 32.86 70.88 67.62 67.14
Shareholders’ Equity 22.23 19.23 21.34 77.77 80.77 78.66
Net Profit 40.44 33.58 32.53 59.56 66.42 67.47

26
Independent factoring companies are the risk takers. They have 67% share in total NPLs. As a result of their risk-taking culture their share in total earnings is also 67.5%. Table 32 further underlines the differences in their financial ratios. The NPL ratio of bank participations is lower (2.3%) than the independent companies (5.6%). The NPL ratio has been improving over the last three years in the case of the independent companies. That of bank participations has remained between 2% and 3%. As one would expect, the bank participations are leveraged more than the others. While the factoring receivables/equity ratio is 4.4 times as a sector average, it is only 2.5 times among the independents and 11.2 times among bank participations. Consequently bank subsidiaries have higher ROAs while the independents have higher ROAs.
Table 30 - Comparison of Financial Ratios of Bank Subsidiaries and Independents
Average of Total Bank Subsidiaries Independents
2009 2010 2011 2009 2010 2011 2009 2010 2011
NPL Ratio (%) 5.89 4.07 3.80 2.82 2.21 2.28 10.66 6.81 5.62
Borrowing Ratio * (x) 3.6 4.4 4.4 9.7 13.6 11.2 1.8 2.2 2.5
Shareholders’ Equity / Total Assets (%) 23.96 20.33 21.69 8.28 6.35 8.47 52.19 42.72 37.66
ROAA (%) 6.30 3.28 3.35 3.99 1.75 1.88 10.59 5.84 5.38
ROAE (%) 26.49 15.00 15.92 48.18 24.44 25.44 20.29 12.54 13.49 Borrowing Ratio = Factoring Receivables / Shareholders’ Equity (x)
The above data once more evidences that sector averages can be highly misleading. Each factoring company has to be evaluated within the framework of its own group and with companies having similar qualifications. We will elaborate on that perspective in the following sections. The Business Models and Operational Strategies of F actoring Companies As indicated earlier the Turkish Factoring industry covers a number of sub-sectors having different business models. Factors differentiating their business models can be listed as:
a) The number of customers (between a minimum of 100 and a maximum of 8,700) b) The balance sheet size of the customers c) The minimum and maximum size of transactions d) The location of the headquarters (There are companies based in Ankara and Antalya) e) The number of branches and representative offices f) The existence of export and import factoring services g) Foreign currency funding h) Whether the company is family owned (ie., whether the owner actively takes part in management) i) Length of time in the sector
It is possible to enlarge this list of factors by adding the level of corporate governance, risk management practices and marketing policies. The combination of these factors usually directs the company to a particular range of customers and at the same time determines the terms and conditions and sources of funding.

27
Business strategies also differ among companies that are bank participations. TEB Factoring, for instance, with its nine branches and 105 personnel, is similar in structure to Deniz Factoring with 11 representation offices and 104 personnel. On the other hand, there is ING Factoring with no branches, 46 personnel and only 142 customers. With a smaller organization ING has TL313 billion factoring receivables. Similarly, Finans Factoring, withTL280 billion in factoring receivables, operates with only three representation offices and 657 customers. Most bank affiliations benefit from a branch network of the parent bank, sharing customers and accessing central risk management systems. The business model is a more important factor among the independent companies. Two companies having equal market shares may have marked differences in organizations. For example, there is one company with 10,000 customers, 39 branches and 338 personnel while another has only 900 customers and 80 personnel. Therefore, the market share factor is relatively less meaningful as an indicator of strength. In terms of growth strategies, 2011 and 2012 policies showed considerable divergence among these companies. In the first half of 2012 some companies grew by 50% while others contracted by 50%. In brief, each company has its own story and has adopted a different approach in light of its own conditions and evaluations of market outlook. 2011 results have evidenced that even with 1% market share, a factoring company can be more profitable and have a higher credit standing than the others given its stable customer base. Business models range from operating with “fewer customers and higher volume transactions” to “a large number of micro companies and small ticket transactions.” Those companies working with micro companies are dealing with higher risk customers from which higher returns can be earned. They usually fund themselves at relatively higher rates but manage to be more profitable than their competitors due to higher earnings. There are companies that have borrowed at high rates (16+%) and have managed to place these funds in high yield (28+%) transactions. At the same time there were also factoring companies which funded themselves in foreign currency at 5% and managed to post excellent results. Among that segment of companies we noted that some reached good results with low profit margins while others had very limited profit returns because of their foreign exchange losses. Risk management is obviously one of the key issues in factoring. In 2011 there were quite a large number of companies that had not managed their risks well and ended up with marked increase in their NPLs. There is no ideal business model in factoring; each company has to adopt what is best for itself. The critical factor is that the business model should be carefully designed, well planned, and managed according to management’s targets.
Branches and Representative Offices
Factoring companies have gained presence in various cities of Turkey through branches and representation offices. As of September 2012 factoring companies had 50 branches and a total of 192 representative offices in 16 provinces (See Annex 2). All representative offices will need to be converted into branches or closed under the new factoring regulations. In 2011, six companies had 25 branches. Most companies are based in Istanbul; few have headquarters outside Istanbul (e.g. Ankara, Adana, Izmir, Antalya). Some companies are concentrated in Istanbul. There are altogether 30 branches in Istanbul. A number of head offices are located in the Maslak-Levent-Sisli districts, others are spread around areas where manufacturing SMEs are concentrated.

28
Employment
The factoring industry in Turkey employed 4,082 people in 2012 (3,819 in 2011). Table 31 shows total employment in years 2008 to 2012. Following the recruitment of 250 additional people in 2011, employment increased by an additional 263 people in 2012.
Table 31 – Number of Employee and Personnel Expenditures
2008 2009 2010 2011 9/2012
Number of Employees 3,009 2,959 3,557 3,819 4,082
Personnel Expenditures ( 1000 TL) 192,280 182,670 233,700 279,070 243,760 Source: BRSA and Factoring Association
Table 32 illustrates the number of employees of each company that provides a good idea of the different business models of these companies. Additionally, the data below includes factoring receivables volume to give a comparative picture. Some companies have been operating with numerous branches and a large number of staff while others have obtained the same volume of business with fewer people.
Table 32 – Number of Employees in the Factoring Sector (December 2011)
Company*
Factoring Receivables
(1000 TL)
Nr.of
Employee
1. Yapı Kredi Fak. A.Ş. 1,794,353 67
2. Garanti Fak. Hizm.A.Ş. 1,247,324 179
3. Deniz Fac. A.Ş. 979,837 101
4. TEB Fac. A.Ş. 817,847 97
6. Kapital Fak. Hizm.A.Ş. 703,473 97
5. Fiba Fac. Hizm.A.Ş. 623,670 129
7. Vakıf Fin. Fac. Hizm.A.Ş. 617,804 34
10. Lider Fak. Hizm.A.Ş. 466,061 179
8. Creditwest Fak. Hizm.A.Ş. 460,922 74
11. Iş Fac. Fin.man Hizm.A.Ş. 404,653 36
12. Destek Fin. Fac. Hizm.A.Ş. 336,954 36
9. Girişim Fak. A.Ş. 288,265 40
13. ING Fak. A.Ş. 285,342 40
14. Yaşar Fac. Hizm.A.Ş. 280,860 36
15. Fin. Fak. Hizm.A.Ş. 251,719 50
19. Fortis Fak. A.Ş. 245,172 20
18. Eko Fac. Hizm.A.Ş. 241,944 80
17. Ekspo Fak. A.Ş. 236,425 35
22. MNG Fac. Hizm.A.Ş. 211,885 90
16. Şirinoğlu Fac. Fins.Hizm.T.A.Ş. 189,639 328
25. Tekstil Fac. Hizm.A.Ş. 180,705 37
24. Şeker Fak. Hizm.A.Ş. 179,599 48
26. Kent Fac. A.Ş. 176,664 42
23. Ulusal Fak. A.Ş. 174,242 41
27. Bayramoğlu Fin. Fak. Hizm.A.Ş. 150,349 42
28. Akın Fak. Hizm.A.Ş. 131,763 24

29
29. Strateji Fac. Hizm.A.Ş. 123,855 60
30. Çağdaş Fin. Fac. Hizm.A.Ş. 123,467 75
20. Pamuk Fac. A.Ş. 119,253 21
32. Anadolu Fak. Hizm. A.Ş. 119,129 34
33. Akdeniz Fac. Hizm.A.Ş. 119,111 19
31. Optima Fak. Hizm.A.Ş. 112,913 77
34. Atılım Fak. A.Ş. 112,216 65
37. Doğan Fac. Hizm.A.Ş. 110,214 40
35. Başer Fak. A.Ş. 110,064 81
36. Para Fin. Fac. Hizm.A.Ş. 104,062 90
38. Tek Fak. Hizm.A.Ş. 99,998 69
39. Huzur Fak. Fin.al Hizm.A.Ş. 88,868 63
21. C Fak. A.Ş. 88,072 39
42. Yeditepe Fak. Hizm.A.Ş. 78,211 33
40. Demir Fac. A.Ş. 73,028 34
43. Ar Fak. Fin.al Hizm.A.Ş. 71,995 24
41. VDF Fak. Hizm.A.Ş. 66,858 8
44. Devir Fac. Hizm.A.Ş. 60,331 31
46. Tuna Fak. Hizm.A.Ş. 55,588 40
48. Analiz Fak. A.Ş. 48,162 37
47. Erişim Fin. Fak. Hizm.A.Ş. 48,054 58
49. Arena Fak. Hizm.A.Ş. 47,815 35
51. First Fac. A.Ş. 43,367 23
52. Kredi Fin. Fak. Hizm.A.Ş. 40,819 20
54. Turkish Fak. Hizm.A.Ş. 39,176 29
50. Çözüm Fin. Fak. Hizm.A.Ş. 38,093 32
53. Doğa Fak. Hizm.A.Ş. 34,916 42
55. Trend Fin. Fak. Hizm.A.Ş. 33,926 21
56. Merkez Fak. Hizm.A.Ş. 28,844 26
59. Makro Fac. A.Ş. 27,627 18
61. Sümer Fak. Hizm.A.Ş. 25,289 21
62. Eren Fin. Fak. Hizm.A.Ş. 24,809 35
57. ACL Fin. Fak. A.Ş. 24,804 30
58. Artı Fin. Fak. Hizm.A.Ş. 24,280 32
45. Hepkon Fak. Hizm. A.Ş. 23,814 51
64. Değer Fak. A.Ş. 22,538 17
60. Global Fak. Hizm.A.Ş. 21,840 35
63. Katar Fak. Fin. Hizm.A.Ş. 19,252 51
67. Sardes Fak. A.Ş. 18,250 10
69. Mert Fin. Fak. Hizm.A.Ş. 13,977 42
65. Saray Fak. A.Ş. 11,025 10
68. Acar Fac. A.Ş. 10,959 22
66. Met-ay Fak. Fin. Hizm.A.Ş. 10,485 31
72. As Fak. Hizm.A.Ş. 6,727 31
71. Atak Fak. Hizm.A.Ş. 5,739 5
70. Batı Fak. Hizm.A.Ş. 3,810 8

30
73. Ak Fak. Hizm.Ticaret A.Ş. 0 7
74. Prime Fak. Hizm.A.Ş. 0 12
TOTAL 11,177,530 3,824 * Sorted according to size,
Productivity and Efficiency
Throughout recent years factoring receivables per employee has increased and is expected to continue to increase. Table 33 reflects the productivity and efficiency ratios of the sector. One should remember that these ratios are very different for each group.
Table 33 – Efficiency Ratios
2008 2009 2010 2011 Cost / Income Ratio
(Operating expenses / Operating Income (%) 65.3 73.0 79.5 74.3
Operating Expenses / Average Assets (%) 4.5 3.4 3.1 3.0
Commission Income / Total factoring Turnover (%) 0.5 0.3 0.2 0.4
Operating Income / Nr. of Employee (1,000 TL) 167 143 138 161
Operating Expenses / Nr. of Employee (1,000 TL) 109 105 110 119
Total Assets / Nr. of Employee(1,000 TL) 2,580 3,517 4,067 4,096
Gross Factoring Receivables / Nr. of Employee (1,000 TL) 2,030 32,999 3,625 3,871
Gross Fact. Receivables / Nr. of Branch & Rep Offices (1,000 TL) 41,229 62,487 63,523 60,841
Graph 5 – Total Factoring Receivables / Nr. of Employee (1000 TL)
2226 2030
2999
36253871
0
1000
2000
3000
4000
2007 2008 2009 2010 2011
1000 TL
31
The Turkish Factoring Association
The Turkish Factoring Association is a professional association established in 1995. Currently, among the 71 members of the Association, 16 are also members of Factors Chain International and four are members of International Factors Group (IFG). The Turkish Factoring Association, of which 71 companies out of the 79 factoring companies licensed by the BRSA are members, represents the industry. The functions of the Association are primarily:
� The development of the factoring industry in Turkey. � Participation in the preparations and modifications of the industry’s regulatory framework � Standardization of factoring services � Development and introduction of new ideas and opinions that will contribute to the improvement of
the sector, and the conveying to the public and related authorities these suggestions. � Conducting training for factoring employees. � Promoting solidarity among its members.
The Association selects the five members of the Executive Board and the Chairman of the Association every two years. In addition to the Executive Board, there is a Supervisory Committee and a Disciplinary Committee. The Association also organize committees responsible for regulations, legal matters, financial matters and MASAK. The Turkish Factoring Association’s activities have been particularly concentrated on trainings, legislative improvements and the enhancement of the industry’s public image. Courses have been designed to train new recruits to the industry and to upgrade the skills of existing staff. These activities are conducted by the General Secretary of the Association, Ms. Filiz Ünal, and the Association’s small staff under the guidance of the Chairman of the Association Mr. Zafer Ataman. The Board convenes very regularly to discuss matters related to the industry and to resolve current problems. Conferences – The Association organized a series of national and international conferences in 2011
and 2012. A National Factoring Symposium was held in March 2011 with the participation of Minister Ali Babacan. This was followed with another conference in October 2011 on “The Development of Factoring and Its Contribution to Economic Development.” A workshop was organized with the EBRD in December 2011 on e-factoring, and on 14 September 2012 an international conference was organized jointly with Factors Chain International and the EBRD in Istanbul. Trainings – There are regular professional trainings for factoring companies’ staff members. Since October 2010 the Association has been conducting proficiency courses designed for all factoring company employees, and Certificates of Fundamental Factoring are issued to trainees upon completion. The training is given by university lecturers and experienced members of the industry. The Turkish Factoring Association is due to cease operations before the end of June 2013 because of the establishment of a new association that will encompass not only factoring companies but also leasing and financing companies.

32
5. FINANCIAL ANALYSIS OF FACTORING COMPANIES
Balance Sheet Structure and Growth Rates
Factoring companies have short and simple balance sheets. Factoring receivables constituted the larger part of their assets. They rarely carry securities on their balance sheets. One or two have financial or non-financial participations. Although under the uniform accounting system they must prepare long and detailed financial statements, their balance sheets can be summarized under six main items as illustrated in Table 34.
Table 34 – Sector - Total Balance Sheet (Milion TL)
Source: BRSA
In 2011 the growth of factoring receivables was funded with equity. The increase in borrowings from banks was limited to an annual increase of 3.3%. As a result, the share of borrowings in total assets fell from 76.7% to 73.2%. Bank deposits and cash assets reduced by 60%.
Table 35 - Composition of Assets and Liabilities
2008 2009 2010 2011 9/2012 2009 2010 2011
Million TL % Growth
Banks and Cash Assets 1,144 1,074 1,080 461 416 -6.1 8.6 -60.5
Factoring Receivables (Gross) 6,102 8,873 12,895 14,784 15,617 49.8 45.3 14.7
Other 518 998 492 399 300 92.3 -4.4 -58.2
Total Assets 7,764 10,407 14,467 15,644 16,333 34.5 39.0 8.1
Borrowings 4,944 7,499 11,096 11,464 11,435 53.6 48.0 3.3
Shareholders’ Equity 2,340 2,493 2,941 3,394 3,659 6.5 18.0 15.4
Other 480 360 450 786 1,239 -25.0 25.0 74.7
Total Liabilities 7,764 10,407 14,466 15,644 16,333 34.5 39.0 8.1
Asset growth of 39% in 2010 decelerated to 8.1% in 2011 and to 7.1% in the first nine months of 2012. This deceleration was mainly a result of the government’s policies to cool down the economy. The deceleration of economic activity began in the summer of 2011 and continued through the end of the
2008 2009 2010 2011 9/2012
Total Assets 7,763.82 10,407.04 14,466.71 15,644.09 16,333.63
Factoring Receivables (Loans) 5,591.17 8,350.82 12,370.17 14,223.21 14,817.78
Non-Performing Loans 510.13 522.34 525.00 561.13 799.39
Provisions 400.41 437.93 448.46 444.01 660.71
Total Liabilities 7,763.82 10,407.04 14,466.71 15,644.09 16,333.63
Borrowings 4,943.78 7,499.22 11,095.97 11,463.64 11,434.55
Shareholders’ Equity 2,340.50 2,493.33 2,941.31 3,393.71 3,658.56
Funding / Total Assets (%) 63.68 72.06 76.70 73.24 70.00
Shareholders’ Equity / Total Assets (%) 30.15 24.96 20.33 21.70 22.40

33
Others3%
Factoring Receivab.
94%
Liquid Assets
3%
Others5%
Equity20%
Credits73%
year. In 2012 once again we witnessed factoring companies’ ability to transform their balance sheets in a short period; numerous companies downsized by 50% in three months. As indicated earlier, factoring companies’ balance sheets are dominated by factoring receivables. In 2011 factoring receivables represented 94% of total assets. The remainder was bank deposits and other liquid assets. For most companies, the share of factoring receivables is above 90%. There are, of course, exceptions, such as companies having participations in financial or non-financial companies. Rarely do they hold securities. The liabilities composition is also simple. Equities represented 20% of the total in 2011 while credits represented 73%. The remainder were provisions (5%) and various small items. In the last three years the share of equity declined to 20% from 30%. As companies gain better access to funds, this trend should continue.
Graph 6 – Distribution of Assets (2011) Graph 7 – Distribution of Liabilities(2011)
Despite the decline in asset size growth from 39% to 8% in 2011, factoring operating income increased by 33% and net factoring interest income rose by 20.9%, leading to a 24.8% increase in pre-tax profits.
Table 36 – Annual Growth Rates (%)
2009 2010 2011
Factoring Operating Income -23.9 13.9 33.3
Net Factoring Interest Income -12.3 -2.4 20.9
Factoring Operating Margin 21.6 -3.3 36.6
Operating Expenses -5.8 26.2 16.8
Operating Income -15.7 15.9 24.9
Income Before Tax -15.5 16.0 24.8
Specific Provisions for Non-Performing Loans -28.8 24.5 -36.0
Net Profit -22.7 23.4 23.8
Source: BRSA

34
Table 37 – Factoring Sector- Summary Balance Sheet (1000 TL)
2008 2009 2010 2011
Cash 10,960 4,610 10,570 9,460
Banks 1,132,580 1,069,550 1,155,790 451,070
Securities1) 103,110 260,290 299,590 283,310
Derivative Assets 27,270 20 0 10
Gross Factoring Receivables 6,101,900 8,873,160 12,895,170 14,784,340
Special Reserves (-) 400,410 437,930 448,460 444,010
Non-Performing Factoring Receivables 510,130 522,340 525,000 561,130
Net Factoring Receivables 5,591,770 8,350,820 12,370,170 14,223,210
Financial Assets held for Sale 531,570 410,770 295,390 258,110
Tangible Assets 107,330 116,080 122,860 136,870
Intangible Assets 7,880 6,860 7,320 10,930
Deferred Tax 16,010 35,890 56,920 62,380
Other Assets (2) 125,620 67,740 71,560 91,620
Total Assets 7,763,820 10,407,040 14,466,710 15,644,090
Derivative Financial Liabilities (3) 8,150 2,870 9,530 48,620
Loans and Borrowings (4) 4,945,990 7,501,910 11,098,770 11,465,800
Factoring Payables 154,610 111,270 74,970 196,120
Marketable securities Issued 92,850 113,950 211,170 346,490
Other Liabilities 124,780 53,770 36,090 69,700
Income Tax payable (5) 40,550 52,360 40,940 42,890
Reserves 56,390 77,570 53,940 80,760
Subordinated loans 0 0 0 0
Total Liabilities 5,423,320 7,913,700 11,525,410 12,250,380
Paid-in Capital 1,030,030 1,026,350 1,090,500 1,279,630
Share Premium Account 99,140 285,060 262,540 300,670
Profit Reserves (6) 784,330 851,730 1,180,430 1,309,060
Net Period Profit / Loss 427,000 330,200 407,830 504,350
Total Equity 2,340,500 2,493,330 2,941,300 3,393,710
Total Liabilities and Equity 7,763,820 10,407,040 14,466,710 15,644,090
Source: BRSA
(1) Trading Financial Assets + Financial Assets Where fair value Change is reflected to Income Statement + receivables
from Reverse Repurchase Agreements + Financial Assets Held for Sale(Net)
(2) Other Assets = Other Assets + Assets Held for Sale Purpose and Held from Terminated Operations (Net)
(3) Trading Derivative Financial Liabilities (DFL) + DFL held for Hedging
(4) Loans Borrowed + Factoring payables + Lease Payables
(5) Income Tax Payable + Deferred Tax
(6) Profit Reserves + Prior Year Income or Loss

35
Off-balance Sheet Accounts
Total off-balance sheet volume didnot change in 2011, but there were some changes in its composition. “Recourse Factoring Operations” decreased by 44.6%, and “Non-recourse Factoring Operations” rose by 12.1%. The largest items of commitments and contingencies are “Collaterals Taken” (TL18.7 billion) and “Items held in Custody” (TL12.2 billion) consisting of checks and notes taken for collection.
Table 38 – Commitments and Contingencies (Million TL)
2008 2009 2010 2011
Recourse Factoring Operations 815.27 588.09 2,449.59 1,355.82
Non-Recourse Factoring Operations 3,870.03 2,501.66 3,878.74 4,348.40
Collaterals Taken 15,561.39 10,548.09 18,899.15 18,719.36
Collaterals Given 758.72 465.79 504.67 465.89
Commitments 252.85 360.13 464.41 464.30
A) Irrevocable Commitments 53.69 196.70 271.82 276.00
B) Revocable Commitments 199.16 163.43 192.60 188.30
a) Lease Commitments 0.00 0.00 0.00 0.00
b) Other Irrevocable Commitments 199.16 163.43 192.60 188.30
Derivative Financial Instruments 1,370.67 1,334.62 2,153.97 2,274.23
A) Derivative Financial Instruments Held for Hedging 1,010.35 639.93 15.95 198.97
a) Fair Value Hedges 600.31 331.37 15.18 198.97
b) Cash flow Hedges 410.04 308.56 0.77 0.00
c) Foreign Investment Hedges 0.00 0.00 0.00 0.00
B) Trading Transactions 360.32 694.68 2,138.02 2,075.26
a) Forward Foreign Currency Buy- Sell Transactions 79.11 1.00 470.76 467.82
b) Currency and Interest rate Swaps 234.20 365.97 1,495.57 1,061.79
c) Currency, Interest Rate and Security Options 47.01 277.30 2.05 2.46
d) Currency, Interest Rate Futures 0.00 0.00 0.00 0.00
e) Other 0.00 50.42 169.65 543.19
Items held in Custody 7,906.75 11,503.53 11,328.43 12,211.72
Total Off balance Sheet Commitments 30,535.67 27,30 1.91 39,678.95 39,839.71
Source: BRSA
Profitability In brief, earnings increased while expenditures decreased (Table 39). Among all factoring companies, only eight reported a loss (nine in 2010). The sector average in increase in return on average assets was 3.4% but 15 companies had ROA lower than 2%, and nine companies had ROA above 6%. It is almost impossible to make a general statement on how profitable the factoring industry is, but these nine companies have proven that it is possible to be very profitable in this sector. Factoring interest and commission income increased by 33%. We believe that commission rates did not increase. The increase in commission income came from the higher volume of collections as well as from guarantee services. We also noted that the share of foreign currency interest and commission income rose from 3.6% to 5.2%.
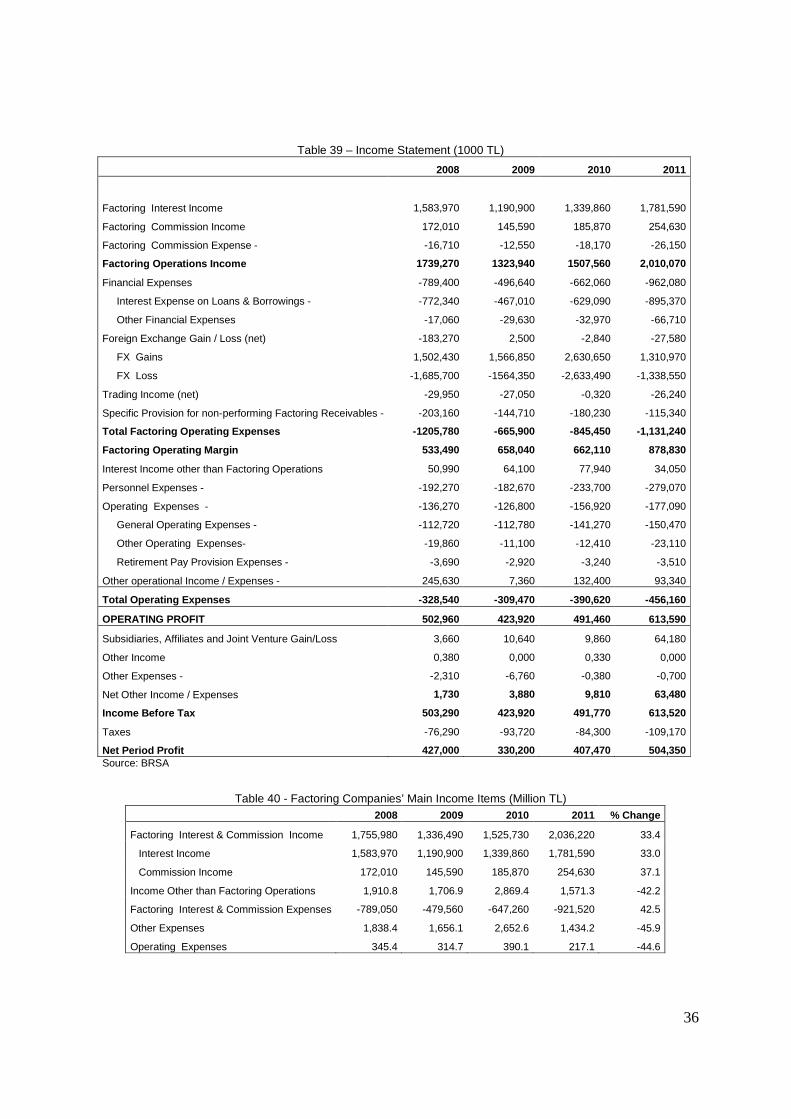
36
Table 39 – Income Statement (1000 TL)
2008 2009 2010 2011
Factoring Interest Income 1,583,970 1,190,900 1,339,860 1,781,590
Factoring Commission Income 172,010 145,590 185,870 254,630
Factoring Commission Expense - -16,710 -12,550 -18,170 -26,150
Factoring Operations Income 1739,270 1323,940 1507,560 2,010,070
Financial Expenses -789,400 -496,640 -662,060 -962,080
Interest Expense on Loans & Borrowings - -772,340 -467,010 -629,090 -895,370
Other Financial Expenses -17,060 -29,630 -32,970 -66,710
Foreign Exchange Gain / Loss (net) -183,270 2,500 -2,840 -27,580
FX Gains 1,502,430 1,566,850 2,630,650 1,310,970
FX Loss -1,685,700 -1564,350 -2,633,490 -1,338,550
Trading Income (net) -29,950 -27,050 -0,320 -26,240
Specific Provision for non-performing Factoring Receivables - -203,160 -144,710 -180,230 -115,340
Total Factoring Operating Expenses -1205,780 -665,900 -845,450 -1,131,240
Factoring Operating Margin 533,490 658,040 662,110 878,830
Interest Income other than Factoring Operations 50,990 64,100 77,940 34,050
Personnel Expenses - -192,270 -182,670 -233,700 -279,070
Operating Expenses - -136,270 -126,800 -156,920 -177,090
General Operating Expenses - -112,720 -112,780 -141,270 -150,470
Other Operating Expenses- -19,860 -11,100 -12,410 -23,110
Retirement Pay Provision Expenses - -3,690 -2,920 -3,240 -3,510
Other operational Income / Expenses - 245,630 7,360 132,400 93,340
Total Operating Expenses -328,540 -309,470 -390,620 -456,160
OPERATING PROFIT 502,960 423,920 491,460 613,590
Subsidiaries, Affiliates and Joint Venture Gain/Loss 3,660 10,640 9,860 64,180
Other Income 0,380 0,000 0,330 0,000
Other Expenses - -2,310 -6,760 -0,380 -0,700
Net Other Income / Expenses 1,730 3,880 9,810 63,480
Income Before Tax 503,290 423,920 491,770 613,520
Taxes -76,290 -93,720 -84,300 -109,170
Net Period Profit 427,000 330,200 407,470 504,350 Source: BRSA
Table 40 - Factoring Companies’ Main Income Items (Million TL) 2008 2009 2010 2011 % Change
Factoring Interest & Commission Income 1,755,980 1,336,490 1,525,730 2,036,220 33.4
Interest Income 1,583,970 1,190,900 1,339,860 1,781,590 33.0
Commission Income 172,010 145,590 185,870 254,630 37.1
Income Other than Factoring Operations 1,910.8 1,706.9 2,869.4 1,571.3 -42.2
Factoring Interest & Commission Expenses -789,050 -479,560 -647,260 -921,520 42.5
Other Expenses 1,838.4 1,656.1 2,652.6 1,434.2 -45.9
Operating Expenses 345.4 314.7 390.1 217.1 -44.6
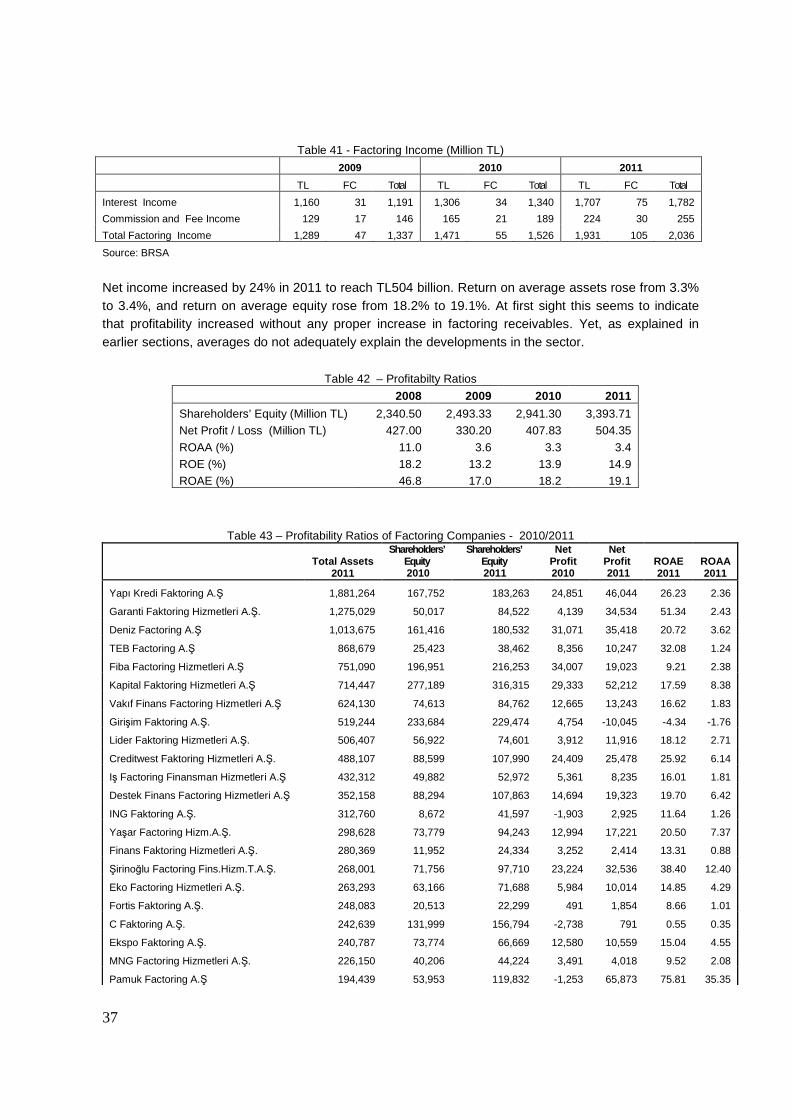
37
Table 41 - Factoring Income (Million TL)
2009 2010 2011
TL FC Total TL FC Total TL FC Total
Interest Income 1,160 31 1,191 1,306 34 1,340 1,707 75 1,782
Commission and Fee Income 129 17 146 165 21 189 224 30 255
Total Factoring Income 1,289 47 1,337 1,471 55 1,526 1,931 105 2,036
Source: BRSA Net income increased by 24% in 2011 to reach TL504 billion. Return on average assets rose from 3.3% to 3.4%, and return on average equity rose from 18.2% to 19.1%. At first sight this seems to indicate that profitability increased without any proper increase in factoring receivables. Yet, as explained in earlier sections, averages do not adequately explain the developments in the sector.
Table 42 – Profitabilty Ratios
2008 2009 2010 2011
Shareholders’ Equity (Million TL) 2,340.50 2,493.33 2,941.30 3,393.71 Net Profit / Loss (Million TL) 427.00 330.20 407.83 504.35
ROAA (%) 11.0 3.6 3.3 3.4 ROE (%) 18.2 13.2 13.9 14.9 ROAE (%) 46.8 17.0 18.2 19.1
Table 43 – Profitability Ratios of Factoring Companies - 2010/2011
Total Assets
2011
Shareholders’ Equity 2010
Shareholders’ Equity 2011
Net Profit 2010
Net Profit 2011
ROAE 2011
ROAA 2011
Yapı Kredi Faktoring A.Ş 1,881,264 167,752 183,263 24,851 46,044 26.23 2.36 Garanti Faktoring Hizmetleri A.Ş. 1,275,029 50,017 84,522 4,139 34,534 51.34 2.43 Deniz Factoring A.Ş 1,013,675 161,416 180,532 31,071 35,418 20.72 3.62 TEB Factoring A.Ş 868,679 25,423 38,462 8,356 10,247 32.08 1.24 Fiba Factoring Hizmetleri A.Ş 751,090 196,951 216,253 34,007 19,023 9.21 2.38 Kapital Faktoring Hizmetleri A.Ş 714,447 277,189 316,315 29,333 52,212 17.59 8.38 Vakıf Finans Factoring Hizmetleri A.Ş 624,130 74,613 84,762 12,665 13,243 16.62 1.83 Girişim Faktoring A.Ş. 519,244 233,684 229,474 4,754 -10,045 -4.34 -1.76 Lider Faktoring Hizmetleri A.Ş. 506,407 56,922 74,601 3,912 11,916 18.12 2.71 Creditwest Faktoring Hizmetleri A.Ş. 488,107 88,599 107,990 24,409 25,478 25.92 6.14 Iş Factoring Finansman Hizmetleri A.Ş 432,312 49,882 52,972 5,361 8,235 16.01 1.81 Destek Finans Factoring Hizmetleri A.Ş 352,158 88,294 107,863 14,694 19,323 19.70 6.42 ING Faktoring A.Ş. 312,760 8,672 41,597 -1,903 2,925 11.64 1.26 Yaşar Factoring Hizm.A.Ş. 298,628 73,779 94,243 12,994 17,221 20.50 7.37 Finans Faktoring Hizmetleri A.Ş. 280,369 11,952 24,334 3,252 2,414 13.31 0.88 Şirinoğlu Factoring Fins.Hizm.T.A.Ş. 268,001 71,756 97,710 23,224 32,536 38.40 12.40 Eko Factoring Hizmetleri A.Ş. 263,293 63,166 71,688 5,984 10,014 14.85 4.29 Fortis Faktoring A.Ş. 248,083 20,513 22,299 491 1,854 8.66 1.01 C Faktoring A.Ş. 242,639 131,999 156,794 -2,738 791 0.55 0.35 Ekspo Faktoring A.Ş. 240,787 73,774 66,669 12,580 10,559 15.04 4.55 MNG Factoring Hizmetleri A.Ş. 226,150 40,206 44,224 3,491 4,018 9.52 2.08 Pamuk Factoring A.Ş 194,439 53,953 119,832 -1,253 65,873 75.81 35.35

38
Ulusal Faktoring A.Ş. 190,508 19,754 47,082 4,702 3,788 11.34 2.39 Şeker Faktoring Hizmetleri A.Ş. 185,659 17,515 19,833 749 2,305 12.34 1.31 Kent Factoring A.Ş 185,011 11,950 38,846 3,482 10,724 42.22 8.09 Tekstil Factoring Hizmetleri A.Ş 182,191 29,508 33,482 4,429 3,974 12.62 2.58 Bayramoğlu Finans Faktoring Hiz. A.Ş. 159,697 83,818 91,305 12,080 7,209 8.23 5.02 Akın Faktoring Hizmetleri A.Ş 134,011 27,526 33,574 6,129 6,673 21.84 5.65 Optima Faktoring Hizmetleri A.Ş 132,079 22,672 24,983 3,143 5,450 22.87 4.26 Çağdaş Finans Factoring Hizmetleri A.Ş. 131,804 48,694 47,422 -772 7,774 16.18 6.93 Strateji Factoring Hizmetleri A.Ş. 130,167 13,145 13,967 1,251 1,623 11.97 1.26 Akdeniz Factoring Hizmetleri A.Ş. 120,745 10,527 11,774 689 1,247 11.18 1.13 Doğan Factoring Hizm.A.Ş. 119,054 16,145 17,920 946 1,781 10.46 2.57 Atılım Faktoring A.Ş. 118,800 23,017 28,636 6,814 5,619 21.76 5.06 Başer Faktoring A.Ş 117,127 23,713 27,278 2,805 3,511 13.77 3.32 Para Finans Factoring Hizm.A.Ş. 115,633 21,066 19,386 5,347 2,281 11.28 2.22 Tek Faktoring Hizmetleri A.Ş. 112,413 15,810 16,705 2,769 2,126 13.08 1.95 Huzur Faktoring Finansal Hizm.A.Ş. 93,110 9,929 13,669 1,977 2,280 19.32 2.84 Demir Factoring A.Ş 84,804 25,346 23,715 64 -822 -3.35 -1.08 Yeditepe Faktoring Hizm.A.Ş. 79,728 22,302 26,373 6,112 4,504 18.51 6.24 Ar Faktoring Finansal Hizmetleri A.Ş. 74,666 3,936 8,448 -1,064 1,605 25.92 2.45 Devir Factoring Hizmetleri A.Ş 65,864 9,738 11,818 698 1,185 10.99 2.05 Tuna Faktoring Hizm.A.Ş. 58,226 20,552 21,541 3,531 1,976 9.39 4.01 Erişim Finans Faktoring Hizm.A.Ş. 55,384 5,817 7,519 711 770 11.55 1.38 Arena Faktoring Hizm.A.Ş. 50,781 11,254 13,419 1,615 1,842 14.93 3.66 Analiz Faktoring A.Ş. 50,281 8,161 10,228 1,941 1,664 18.10 3.41 Çözüm Finans Faktoring Hizmetleri A.Ş. 49,781 26,590 29,492 3,897 3,016 10.76 6.62 First Factoring A.Ş. 46,111 7,223 5,959 1,812 -9,624 -146.02 -20.80 Kredi Finans Faktoring Hizmetleri A.Ş. 43,181 6,534 8,778 724 -756 -9.87 -2.31 Doğa Faktoring Hizmetleri A.Ş. 42,379 16,448 16,505 2,126 2,477 15.03 7.06 Trend Finans Faktoring Hizm.A.Ş. 35,556 11,126 10,446 1,690 1,119 10.37 3.31 ACL Finans Faktoring A.Ş. 30,238 11,561 11,848 1,181 466 3.98 1.79 Merkez Faktoring Hizmetleri A.Ş 30,231 6,853 8,350 1,360 579 7.62 1.93 Makro Factoring A.Ş. 29,242 5,022 8,466 -39 -31 -0.46 -0.12 Sümer Faktoring Hizm.A.Ş. 27,877 7,070 7,208 789 24 0.34 0.09 Eren Finans Faktoring Hizmetleri A.Ş. 27,138 4,578 7,718 -422 -440 -7.16 -2.64 Değer Faktoring A.Ş. 24,070 4,900 7,503 -100 120 1.94 0.62 Met-ay Faktoring Finans Hizmetleri A.Ş. 19,547 6,139 8,414 -1,795 3 0.04 0.02 Acar Factoring A.Ş 16,806 15,996 16,496 2,930 1,012 6.23 6.16
Table 44 illustrates the average sector profitability ratios of years 2008 to 2011, and Table 45 illustrates the profitability ratios of each group. There are striking differences between the ratios of different groups. Group A (the leading two companies) operates with a net factoring margin of 1.9%, Group C (13 middle-sized companies) work with 8% NIM, and the smaller companies under group D with 9% NIM. One can see that Group A and B can fund themselves at lower rates and apply lower discount rates to their customers. ,

39
Table 44 – Profitability Ratios (%)
2008 2009 2010 2011
Average Yield on Earning Assets 44.6 14.3 11.5 12.2
Cost of Interest Bearing Liabilities 30.3 7.7 6.9 8.2
Interest from Factoring Receivables / Interest Income 96.9 94.9 94.5 98.1
Net Factoring Interest Margin 26.0 9.3 6.2 5.9
Net Interest Margin 21.7 7.9 5.5 5.5
Factoring Operations Margin/Avg. Net
Factoring Receivables 20.2 9.8 6.4 6.8
Faktoring Operations Margin / Avg. Assets 14.5 7.5 5.3 6.0
Recurring Earning Power (Operating Profit / Avg, Assets) 13.0 4.7 4.0 4.1
Return on Average Assets ROAA 11.0 3.6 3.3 3.4
Return on Equity (period end) ROE 18.2 13.2 13.9 14.9
Net factoring interest income coverage of loan loss provision 3.91 4.80 3.76 7.11
Total Operating Expenses /Operating Income 65.3 73.0 79.5 74.3
Loan loss provisions / Operating, income 40.4 34.1% 36.7 18.8
Factoring Operations margin coverage of loan loss provision 1.41 1.56 1.48 2.04
Factoring operations income coverage of loan loss provision 4.68 5.72 4.69 9.09
Net Loan Loss Provision/Operating profit 79.6 103.3 91.3 72.4
- Average Yield on Earning Assets: (Factoring Interest Income + Other Interest Income) / Avg.
Earning Assets - Cost of Interest Bearing liabilities : Financial Expenses / Interest Bearing Liabilities - Net Factoring Interest Margin: (Factoring Interest Income + Other Interest Income) / Avg. Gross
Factoring Receivables - Avg. Asset Profitability: Net Profit / Avg. Assets - Return on Equity (Period end) : Net Profit / Equity
- Return on Average Equity (Period end) : Net Profit / Avg. Equity
Table 45 – Profitability Ratios of Factoring Companies in 2011 According to Groups
Sector Group
A Group
B Group
C Group
D Group
E
Average Yield on Earning Assets (%) 12.2 6.9 11.04 15.89 18.20 21.49
Cost of Interest Bearing Liabilities (%) 8.2 5.0 8.14 11.16 12.64 69.41
Net Factoring Interest Margin (%) 5.9 1.9 4.90 8.07 8.95 17.55 Factoring Operations Margin / Avg,Net Factoring Receivables (%) 6.8 3.0 5.82 11.25 10.83 16.54
Factoring Operations Margin / Average Assets (%) 6.0 2.8 5.18 8.90 10.14 13.67
Return on Average Assets ROAA (%) 3.4 2.4 3.30 4.31 3.42 4.46
Return on Equity (period end) ROE (%) 14.9 33.0 15.14 12.55 14.44 9.67
Average Equity Profitability (Period end) (%) 19.1 52.5 21.59 20.23 20.64 15.88
Operating Expenses / Operating Income (%) 74.3 44.22 51.71 93.97 179.32 79.96
Loan Loss Provision /Operating Income (%) 18.8 10.23 15.34 31.40 33.47 81.62

40
Graph 8 – Funding Cost and Return of Assets
12.211.5
14.3
8.2
6.9
7.7
5
7
9
11
13
15
2009 2010 2011
%
Avg. Yield on Earning Assets
Avg. Cost of Interest Bearing Liabilities
Graph 9 - Net Factoring Interest Margin
9.3
6.25.9
4
5
6
7
8
9
10
2009 2010 2011
%
Asset Quality
The increase in total non-performing loans was low, but explained by a more rapid increase in factoring receivables. The NPL ratio fell to 3.8% from 4.1%. In 2012, the NPL ratio once again rose to 4.7% in June and to 5.1% in September.
Table 46 – Asset Quality
2008 2009 2010 2011
Factoring Receivables (Million TL) 6,101,900 8,873,160 12,895,170 14,784,340
Non-Performing Loans (Million TL) 510,130 522,340 525,000 561,130
NPLs / Factoring Receivables (%) 8.4 5.9 4.1 3.8
NPLs / (Equity+ Allowances NPLs) (%) 18.6 17.8 15.5 14.6
Specific Reserves (Million TL) 400,410 437,930 448,460 444,010
Reserve Ratio (%) 78.5 83.8 85.4 79.1
Source: BRSA
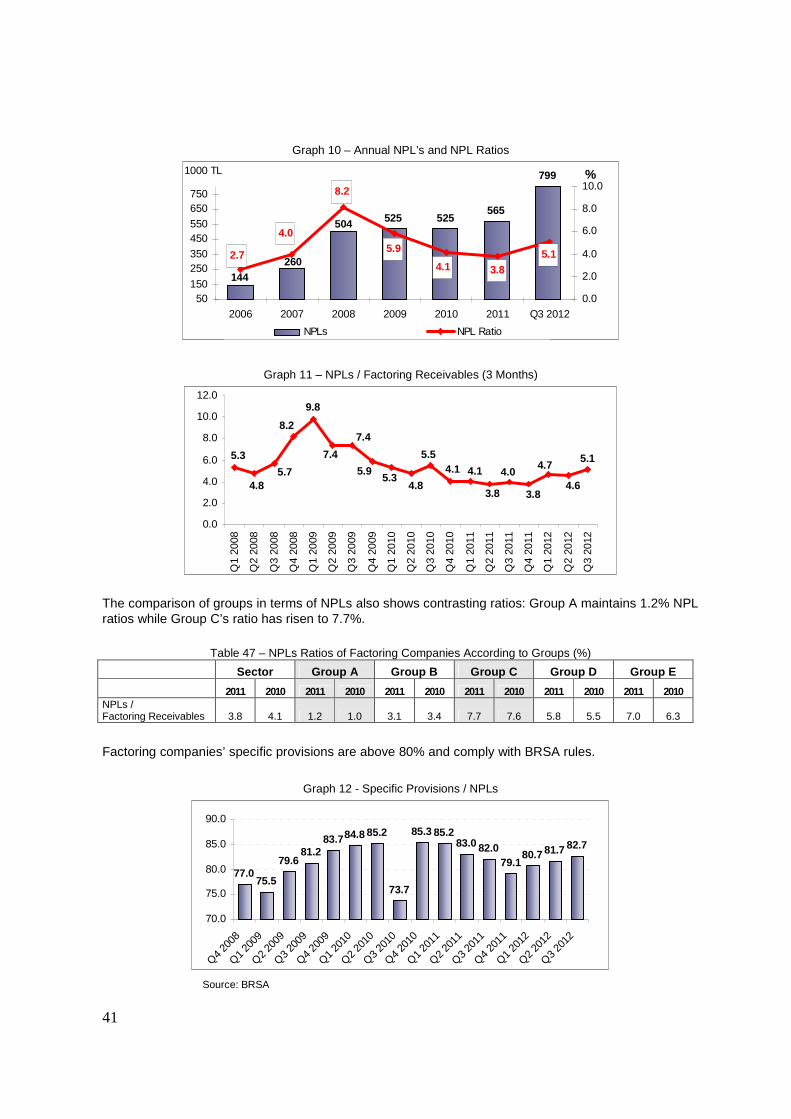
41
Graph 10 – Annual NPL’s and NPL Ratios
565
799
144
525525504
2605.1
3.84.1
5.9
8.2
4.0
2.7
50150
250350
450550
650750
2006 2007 2008 2009 2010 2011 Q3 2012
1000 TL %
0.0
2.0
4.0
6.0
8.0
10.0
NPLs NPL Ratio
Graph 11 – NPLs / Factoring Receivables (3 Months)
5.1
4.6
4.7
3.8
4.0
3.8
4.14.15.5
4.85.3
7.4
7.4
9.8
8.2
5.74.8
5.35.9
0.0
2.0
4.0
6.0
8.0
10.0
12.0
Q1
2008
Q2
2008
Q3
2008
Q4
2008
Q1
2009
Q2
2009
Q3
2009
Q4
2009
Q1
2010
Q2
2010
Q3
2010
Q4
2010
Q1
2011
Q2
2011
Q3
2011
Q4
2011
Q1
2012
Q2
2012
Q3
2012
The comparison of groups in terms of NPLs also shows contrasting ratios: Group A maintains 1.2% NPL ratios while Group C’s ratio has risen to 7.7%.
Table 47 – NPLs Ratios of Factoring Companies According to Groups (%)
Sector Group A Group B Group C Group D Group E
2011 2010 2011 2010 2011 2010 2011 2010 2011 2010 2011 2010 NPLs / Factoring Receivables 3.8 4.1 1.2 1.0 3.1 3.4 7.7 7.6 5.8 5.5 7.0 6.3
Factoring companies’ specific provisions are above 80% and comply with BRSA rules.
Graph 12 - Specific Provisions / NPLs
77.075.5
79.681.2
83.784.8 85.2
73.7
85.3 85.283.0 82.0
79.180.7 81.7 82.7
70.0
75.0
80.0
85.0
90.0
Q4 20
08
Q1 20
09
Q2 20
09
Q3 20
09
Q4 20
09
Q1 20
10
Q2 20
10
Q3 20
10
Q4 20
10
Q1 20
11
Q2 20
11
Q3 20
11
Q4 20
11
Q1 20
12
Q2 20
12
Q3 20
12
Source: BRSA
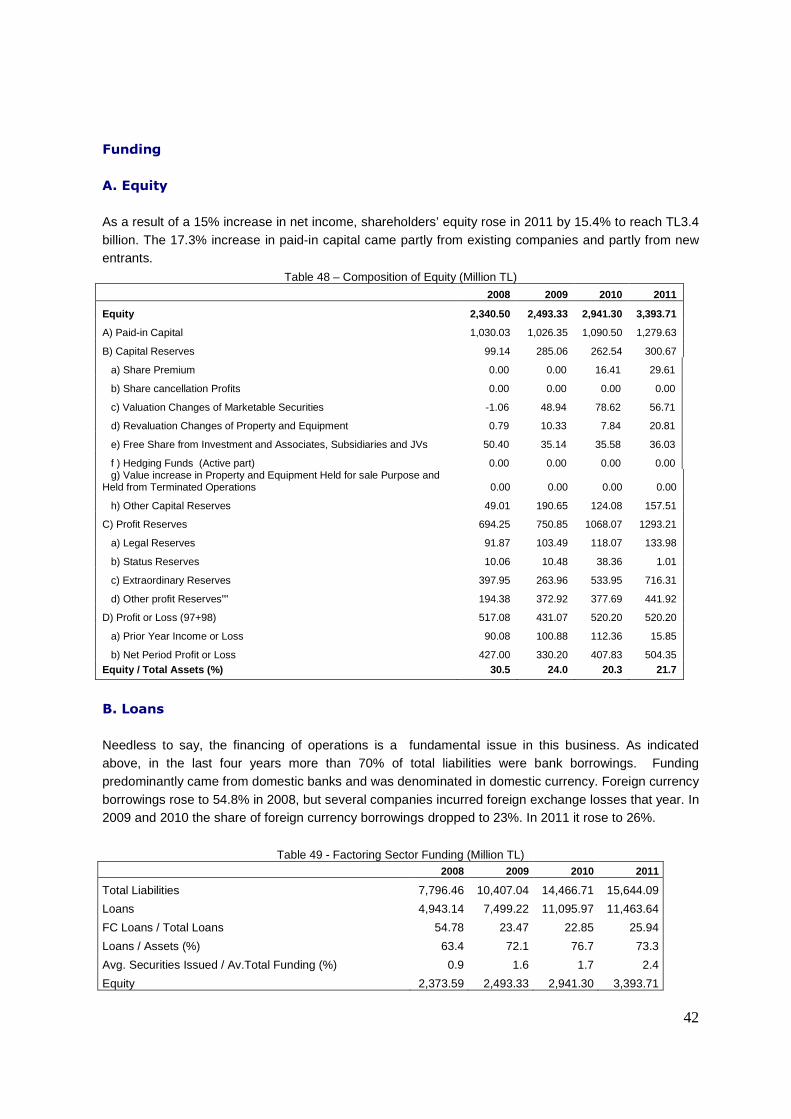
42
Funding
A. Equity
As a result of a 15% increase in net income, shareholders’ equity rose in 2011 by 15.4% to reach TL3.4 billion. The 17.3% increase in paid-in capital came partly from existing companies and partly from new entrants.
Table 48 – Composition of Equity (Million TL) 2008 2009 2010 2011
Equity 2,340.50 2,493.33 2,941.30 3,393.71
A) Paid-in Capital 1,030.03 1,026.35 1,090.50 1,279.63
B) Capital Reserves 99.14 285.06 262.54 300.67
a) Share Premium 0.00 0.00 16.41 29.61
b) Share cancellation Profits 0.00 0.00 0.00 0.00
c) Valuation Changes of Marketable Securities -1.06 48.94 78.62 56.71
d) Revaluation Changes of Property and Equipment 0.79 10.33 7.84 20.81
e) Free Share from Investment and Associates, Subsidiaries and JVs 50.40 35.14 35.58 36.03
f ) Hedging Funds (Active part) 0.00 0.00 0.00 0.00 g) Value increase in Property and Equipment Held for sale Purpose and Held from Terminated Operations 0.00 0.00 0.00 0.00
h) Other Capital Reserves 49.01 190.65 124.08 157.51
C) Profit Reserves 694.25 750.85 1068.07 1293.21
a) Legal Reserves 91.87 103.49 118.07 133.98
b) Status Reserves 10.06 10.48 38.36 1.01
c) Extraordinary Reserves 397.95 263.96 533.95 716.31
d) Other profit Reserves”” 194.38 372.92 377.69 441.92
D) Profit or Loss (97+98) 517.08 431.07 520.20 520.20
a) Prior Year Income or Loss 90.08 100.88 112.36 15.85
b) Net Period Profit or Loss 427.00 330.20 407.83 504.35 Equity / Total Assets (%) 30.5 24.0 20.3 21.7
B. Loans
Needless to say, the financing of operations is a fundamental issue in this business. As indicated above, in the last four years more than 70% of total liabilities were bank borrowings. Funding predominantly came from domestic banks and was denominated in domestic currency. Foreign currency borrowings rose to 54.8% in 2008, but several companies incurred foreign exchange losses that year. In 2009 and 2010 the share of foreign currency borrowings dropped to 23%. In 2011 it rose to 26%.
Table 49 - Factoring Sector Funding (Million TL) 2008 2009 2010 2011
Total Liabilities 7,796.46 10,407.04 14,466.71 15,644.09
Loans 4,943.14 7,499.22 11,095.97 11,463.64
FC Loans / Total Loans 54.78 23.47 22.85 25.94
Loans / Assets (%) 63.4 72.1 76.7 73.3
Avg. Securities Issued / Av.Total Funding (%) 0.9 1.6 1.7 2.4
Equity 2,373.59 2,493.33 2,941.30 3,393.71

43
Table 50 – Loans (Million TL)
2008 2009 2010 2011
Loans 4,943.14 7,499.22 11,095.97 11,463.64
Factoring Payables 152.52 111.27 74.97 196.12
Lease Payables 2.21 2.69 2.80 2.16
A) Financial Lease Payables 2.60 3.27 3.23 2.43
B) Operational Lease Payables 0.00 0.00 0.00 0.00
C) Other 0.00 0.00 0.00 0.00
D) Deferred Financial Lease Expenses ( - ) 0.40 0.58 0.43 0.27
Securities Issued (Net) 92.85 113.95 211.17 346.49
A) Bills 0.00 0.00 0.00 0.00
B) Asset-backed Securities 0.00 0.00 0.00 0.00
C) Bonds 92.85 113.95 211.17 236.49
Miscellaneous Payables 125.09 43.84 31.47 55.78
Other Foreign Liabilities 4.82 9.94 4.59 13.83
Graph 13 – Factoring Receivables and Loans (Million TL)
10,000.00
11,000.00
12,000.00
13,000.00
14,000.00
15,000.00
16,000.00
17,000.00
Q32010
Q42010
Q12011
Q22011
Q32011
Q42011
Q12012
Q22012
Q32012
Borrow ings
Factoring Receivables
Credit Disbursements from Local Banks
According to the data of the Central Bank of Turkey, a total of TL24.5 billion out of a total of TL724.7 billion in credits was extended to the Group “Leasing, Factoring, Financing Companies and Others” at the end of 2011 (Table 51). The sector composition of this table illustrates that credits extended to this group represented 3.4% of the total but the sector’s NPL ratio is 6 per mille. We observed that in 2012 this group’s NPL ratio further dropped to 4 per mille while the banking sector ratio rose to 3.4%.
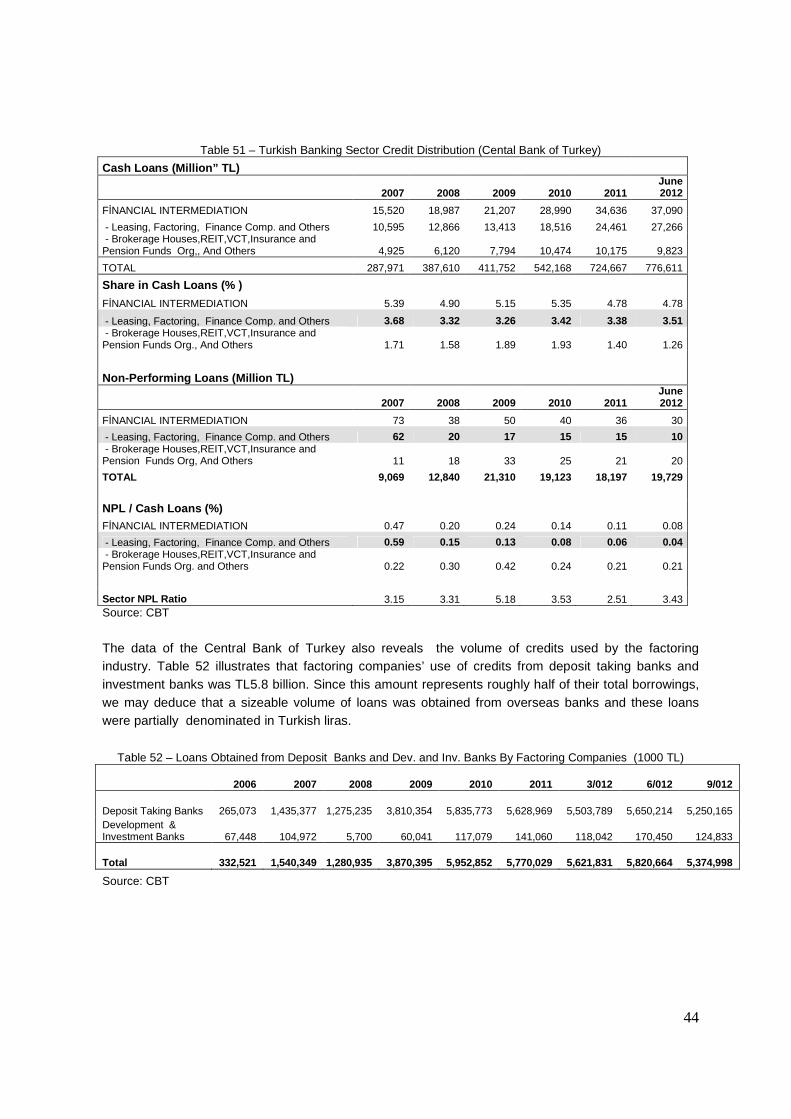
44
Table 51 – Turkish Banking Sector Credit Distribution (Cental Bank of Turkey)
Cash Loans (Million” TL)
2007 2008 2009 2010 2011 June 2012
FİNANCIAL INTERMEDIATION 15,520 18,987 21,207 28,990 34,636 37,090
- Leasing, Factoring, Finance Comp. and Others 10,595 12,866 13,413 18,516 24,461 27,266 - Brokerage Houses,REIT,VCT,Insurance and Pension Funds Org,, And Others 4,925 6,120 7,794 10,474 10,175 9,823
TOTAL 287,971 387,610 411,752 542,168 724,667 776,611
Share in Cash Loans (% )
FİNANCIAL INTERMEDIATION 5.39 4.90 5.15 5.35 4.78 4.78
- Leasing, Factoring, Finance Comp. and Others 3.68 3.32 3.26 3.42 3.38 3.51 - Brokerage Houses,REIT,VCT,Insurance and Pension Funds Org., And Others 1.71 1.58 1.89 1.93 1.40 1.26
Non-Performing Loans (Million TL)
2007 2008 2009 2010 2011 June 2012
FİNANCIAL INTERMEDIATION 73 38 50 40 36 30
- Leasing, Factoring, Finance Comp. and Others 62 20 17 15 15 10 - Brokerage Houses,REIT,VCT,Insurance and Pension Funds Org, And Others 11 18 33 25 21 20
TOTAL 9,069 12,840 21,310 19,123 18,197 19,729
NPL / Cash Loans (%)
FİNANCIAL INTERMEDIATION 0.47 0.20 0.24 0.14 0.11 0.08
- Leasing, Factoring, Finance Comp. and Others 0.59 0.15 0.13 0.08 0.06 0.04 - Brokerage Houses,REIT,VCT,Insurance and Pension Funds Org. and Others 0.22 0.30 0.42 0.24 0.21 0.21
Sector NPL Ratio 3.15 3.31 5.18 3.53 2.51 3.43 Source: CBT
The data of the Central Bank of Turkey also reveals the volume of credits used by the factoring industry. Table 52 illustrates that factoring companies’ use of credits from deposit taking banks and investment banks was TL5.8 billion. Since this amount represents roughly half of their total borrowings, we may deduce that a sizeable volume of loans was obtained from overseas banks and these loans were partially denominated in Turkish liras.
Table 52 – Loans Obtained from Deposit Banks and Dev. and Inv. Banks By Factoring Companies (1000 TL)
2006 2007 2008 2009 2010 2011 3/012 6/012 9/012
Deposit Taking Banks 265,073 1,435,377 1,275,235 3,810,354 5,835,773 5,628,969 5,503,789 5,650,214 5,250,165 Development & Investment Banks 67,448 104,972 5,700 60,041 117,079 141,060 118,042 170,450 124,833
Total 332,521 1,540,349 1,280,935 3,870,395 5,952,8 52 5,770,029 5,621,831 5,820,664 5,374,998
Source: CBT
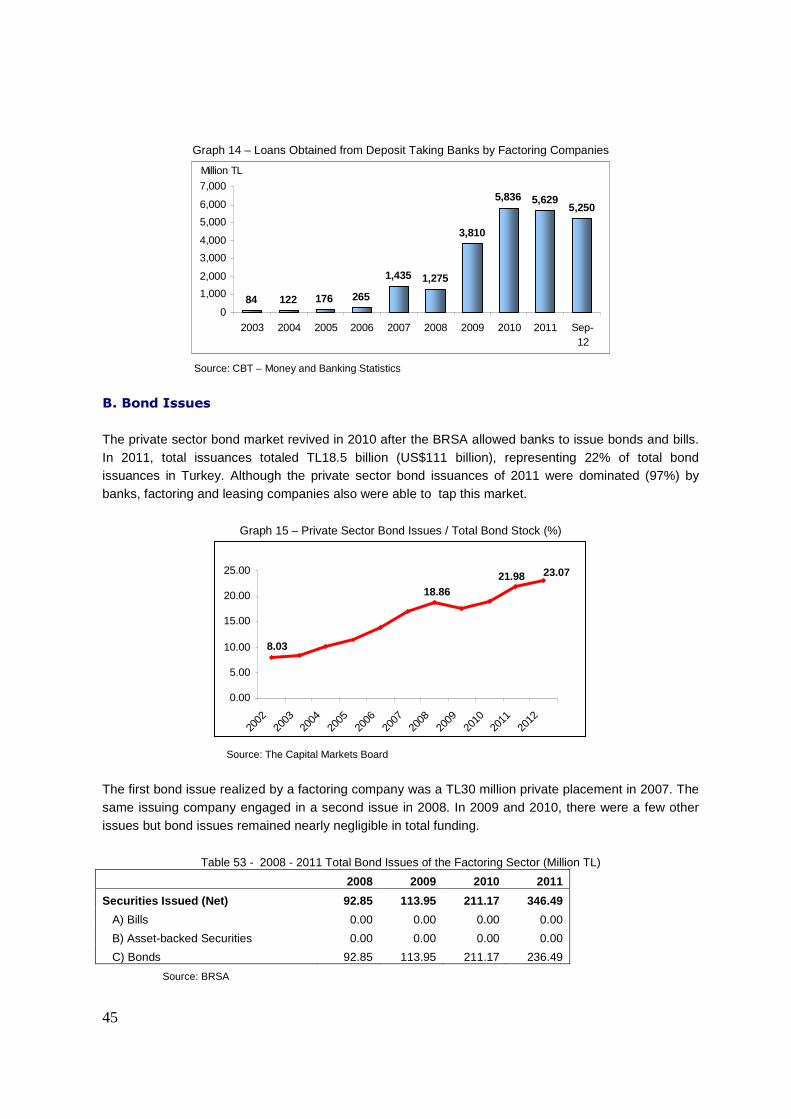
45
Graph 14 – Loans Obtained from Deposit Taking Banks by Factoring Companies
84 122 176 265
1,435 1,275
3,810
5,836 5,6295,250
0
1,000
2,000
3,000
4,000
5,000
6,000
7,000
2003 2004 2005 2006 2007 2008 2009 2010 2011 Sep-12
Million TL
Source: CBT – Money and Banking Statistics
B. Bond Issues
The private sector bond market revived in 2010 after the BRSA allowed banks to issue bonds and bills. In 2011, total issuances totaled TL18.5 billion (US$111 billion), representing 22% of total bond issuances in Turkey. Although the private sector bond issuances of 2011 were dominated (97%) by banks, factoring and leasing companies also were able to tap this market.
Graph 15 – Private Sector Bond Issues / Total Bond Stock (%)
21.98
8.03
18.86
23.07
0.00
5.00
10.00
15.00
20.00
25.00
2002
2003
2004
2005
2006
2007
2008
2009
2010
2011
2012
Source: The Capital Markets Board
The first bond issue realized by a factoring company was a TL30 million private placement in 2007. The same issuing company engaged in a second issue in 2008. In 2009 and 2010, there were a few other issues but bond issues remained nearly negligible in total funding.
Table 53 - 2008 - 2011 Total Bond Issues of the Factoring Sector (Million TL)
2008 2009 2010 2011
Securities Issued (Net) 92.85 113.95 211.17 346.49
A) Bills 0.00 0.00 0.00 0.00
B) Asset-backed Securities 0.00 0.00 0.00 0.00
C) Bonds 92.85 113.95 211.17 236.49
Source: BRSA
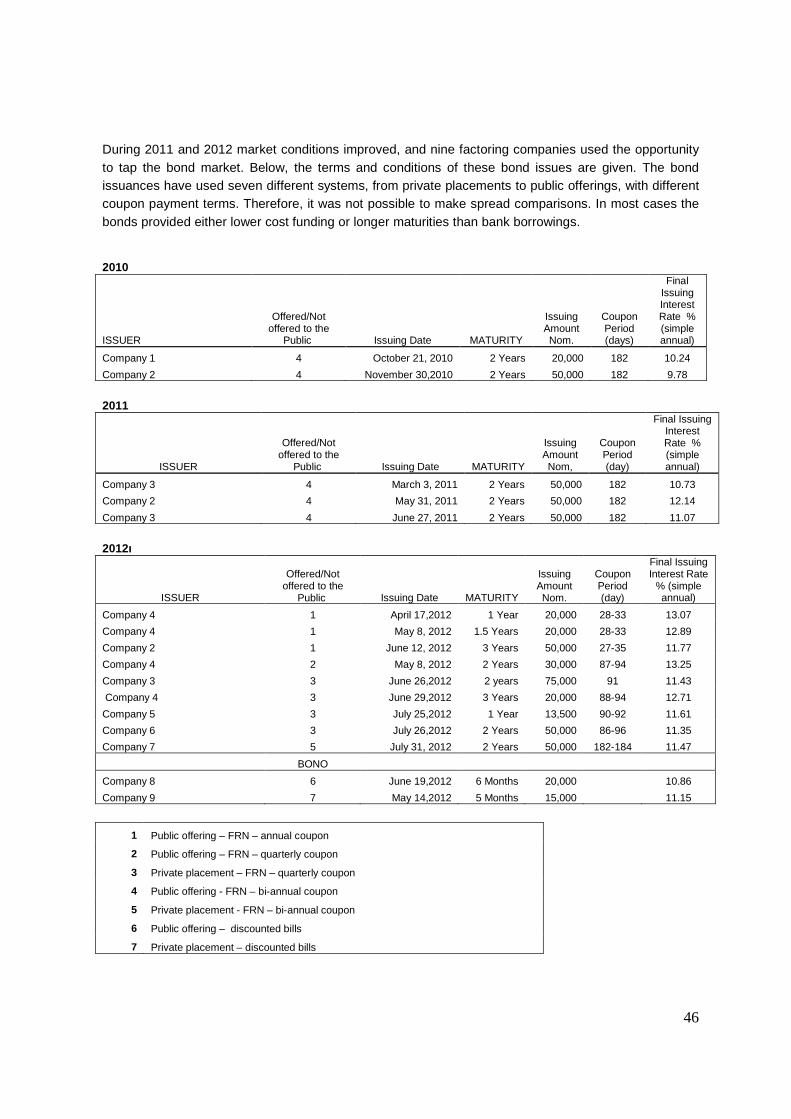
46
During 2011 and 2012 market conditions improved, and nine factoring companies used the opportunity to tap the bond market. Below, the terms and conditions of these bond issues are given. The bond issuances have used seven different systems, from private placements to public offerings, with different coupon payment terms. Therefore, it was not possible to make spread comparisons. In most cases the bonds provided either lower cost funding or longer maturities than bank borrowings. 2010
ISSUER
Offered/Not offered to the
Public Issuing Date MATURITY
Issuing Amount Nom.
Coupon Period (days)
Final Issuing Interest Rate % (simple annual)
Company 1 4 October 21, 2010 2 Years 20,000 182 10.24
Company 2 4 November 30,2010 2 Years 50,000 182 9.78
2011
ISSUER
Offered/Not offered to the
Public Issuing Date MATURITY
Issuing Amount Nom,
Coupon Period (day)
Final Issuing Interest Rate % (simple annual)
Company 3 4 March 3, 2011 2 Years 50,000 182 10.73
Company 2 4 May 31, 2011 2 Years 50,000 182 12.14
Company 3 4 June 27, 2011 2 Years 50,000 182 11.07
2012ı
ISSUER
Offered/Not offered to the
Public Issuing Date MATURITY
Issuing Amount Nom.
Coupon Period (day)
Final Issuing Interest Rate
% (simple annual)
Company 4 1 April 17,2012 1 Year 20,000 28-33 13.07
Company 4 1 May 8, 2012 1.5 Years 20,000 28-33 12.89
Company 2 1 June 12, 2012 3 Years 50,000 27-35 11.77
Company 4 2 May 8, 2012 2 Years 30,000 87-94 13.25
Company 3 3 June 26,2012 2 years 75,000 91 11.43
Company 4 3 June 29,2012 3 Years 20,000 88-94 12.71
Company 5 3 July 25,2012 1 Year 13,500 90-92 11.61
Company 6 3 July 26,2012 2 Years 50,000 86-96 11.35
Company 7 5 July 31, 2012 2 Years 50,000 182-184 11.47
BONO
Company 8 6 June 19,2012 6 Months 20,000 10.86
Company 9 7 May 14,2012 5 Months 15,000 11.15
1 Public offering – FRN – annual coupon
2 Public offering – FRN – quarterly coupon
3 Private placement – FRN – quarterly coupon
4 Public offering - FRN – bi-annual coupon
5 Private placement - FRN – bi-annual coupon
6 Public offering – discounted bills
7 Private placement – discounted bills

47
Leverage Ratios
The leading factoring companies have high leverage ratios. Their borrowings equate to 12.4 times their equity, and their total borrowings have 90% share in total assets. Still, these companies have relatively low NPLs.
Table 54 – Financial Ratios - Sector 2008 2009 2010 2011
Gross Factoring Receivables / Assets (%) 78.6 85.3 89.1 94.5
Gross Factoring Receivables / Equity (X) 2.6 3.6 4.4 4.4
Securities / Assets (%) 1.3 2.4 2.0 1.8
Loans and Borrowings / Assets (%) 63.7 72.1 76.7 73.3
Equity / Loans and Borrowings (%) 47.3 33.2 26.5 29.6
Equity / Total Funding (%) 45.0 32.3 25.8 28.3
Equity / Assets (%) 30.1 24.0 20.3 21.7
Commitments / Equity (%) 10.8 14.4 15.8 13.7
Derivative Financial Instruments / Equity (%) 58.6 53.5 73.2 67.0
Table 55 – Financial Ratios – Factoring Company Groups
Group A Group B Group C Group D Group E
Asset Quality and Risk Management 2010 2011 2010 2011 2010 2011 2010 2011 2010 2011
Gross Fact. Receivables /Assets (%) 91.7 97.8 86.2 91.3 84.2 85.4 99.0 100.4 89.2 89.8
Gross factoring Receivables / Equity 19.9 12.4 7.3 6.4 4.6 4.1 4.9 5.6 3.2 3.6
Securities/ Assets (%) 0.3 0.2 0.0 0.0 0.0 0.0 0.0 0.0 0.0 0.0
Loans and Borrowings / Assets (%) 93.6 90.4 74.1 70.6 56.4 57.8 58.2 69.6 47.3 53.1
Equity / Loans and Borrowings %) 6.2 9.1 35.4 38.7 76.1 71.3 - 36.5 - -
Equity / Total Funding (%) 6.2 9.1 32.8 33.9 82.7 60.7 102.5 29.1 - -
Equity / Assets (%) 5.7 8.2 21.1 22.1 29.7 29.4 28.6 21.2 44.1 42.0
Commitments / Equity (%) 4.0 9.0 9.0 9.4 0.0 16.6 25.3 23.6 217.2 35.3
Derivative Fin. Instruments / Equity (%) 190.7 943.0 66.4 47.3 31.4 - 0.4 0.5 2.7 4.1
FOREIGN CURRENCY RISK
The majority of factoring companies carry no foreign currency (FC) risk since they do not have foreign currency operations and do not use foreign currency credits. In 2011, total foreign currency borrowings as a percentage of total borrowings was 25.9% due to a few companies’ high exposures. The borrowings of one company that recently joined the industry were 77% FC while those of the largest factoring company represented 66%. Only seven out of the 74 companies have used FC-denominated credits.
Table 56 – Loans TL/FC Distribution (Million TL)
Use of Loans Factoring Receivables
TL FC Total FC
Ratio TL FC Total FC
Ratio
2008 2,236 2,708 4,944 54.0% 5,051 541 5,592 9.6%
2009 5,739 1,760 7,593 23.2% 7,838 513 8,351 6.1%
2010 8,561 2,535 11,096 22.8% 11,220 1,151 12,370 9.3%
2011 8,490 2,974 11,464 25.9% 12,713 1,510 14,233 10.6%
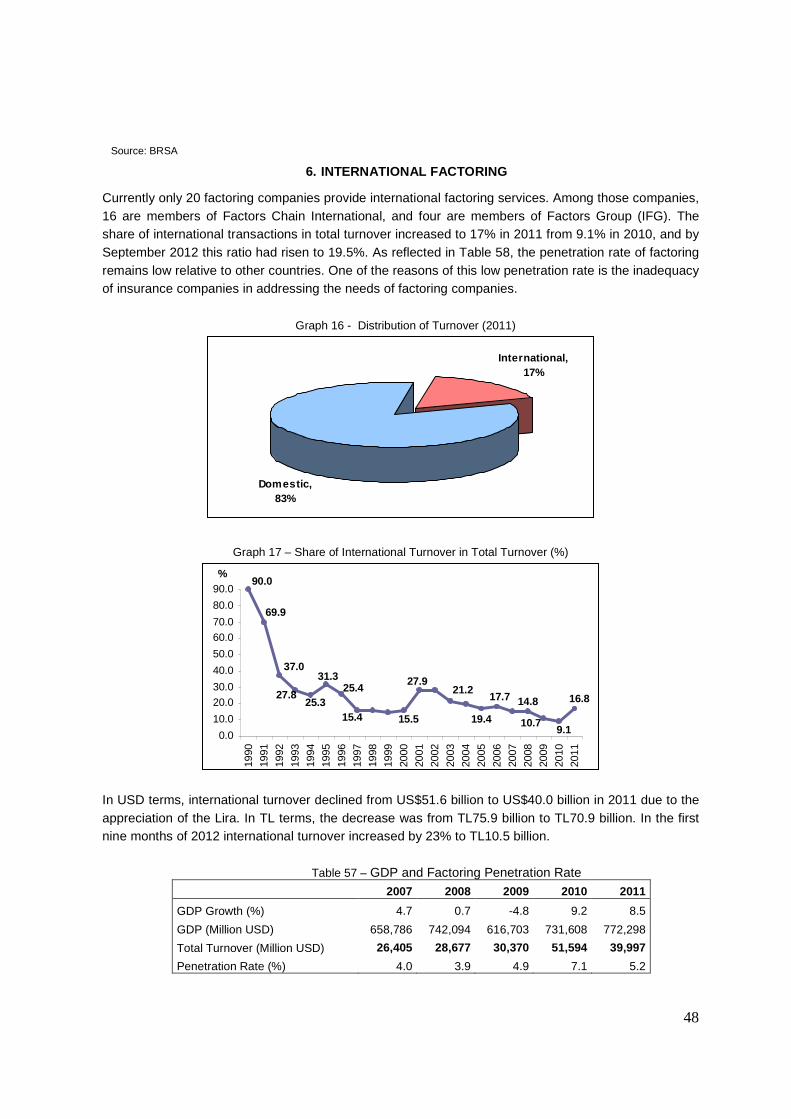
48
Source: BRSA
6. INTERNATIONAL FACTORING
Currently only 20 factoring companies provide international factoring services. Among those companies, 16 are members of Factors Chain International, and four are members of Factors Group (IFG). The share of international transactions in total turnover increased to 17% in 2011 from 9.1% in 2010, and by September 2012 this ratio had risen to 19.5%. As reflected in Table 58, the penetration rate of factoring remains low relative to other countries. One of the reasons of this low penetration rate is the inadequacy of insurance companies in addressing the needs of factoring companies.
Graph 16 - Distribution of Turnover (2011)
Domestic, 83%
International, 17%
Graph 17 – Share of International Turnover in Total Turnover (%)
14.8
10.7
17.7
15.515.4 19.4
21.227.9
37.0
69.9
90.0
16.8
9.1
27.825.3
31.325.4
0.0
10.0
20.0
30.0
40.0
50.0
60.0
70.0
80.0
90.0
1990
1991
1992
1993
1994
1995
1996
1997
1998
1999
2000
2001
2002
2003
2004
2005
2006
2007
2008
2009
2010
2011
%
In USD terms, international turnover declined from US$51.6 billion to US$40.0 billion in 2011 due to the appreciation of the Lira. In TL terms, the decrease was from TL75.9 billion to TL70.9 billion. In the first nine months of 2012 international turnover increased by 23% to TL10.5 billion.
Table 57 – GDP and Factoring Penetration Rate 2007 2008 2009 2010 2011
GDP Growth (%) 4.7 0.7 -4.8 9.2 8.5
GDP (Million USD) 658,786 742,094 616,703 731,608 772,298
Total Turnover (Million USD) 26,405 28,677 30,370 51,594 39,997
Penetration Rate (%) 4.0 3.9 4.9 7.1 5.2
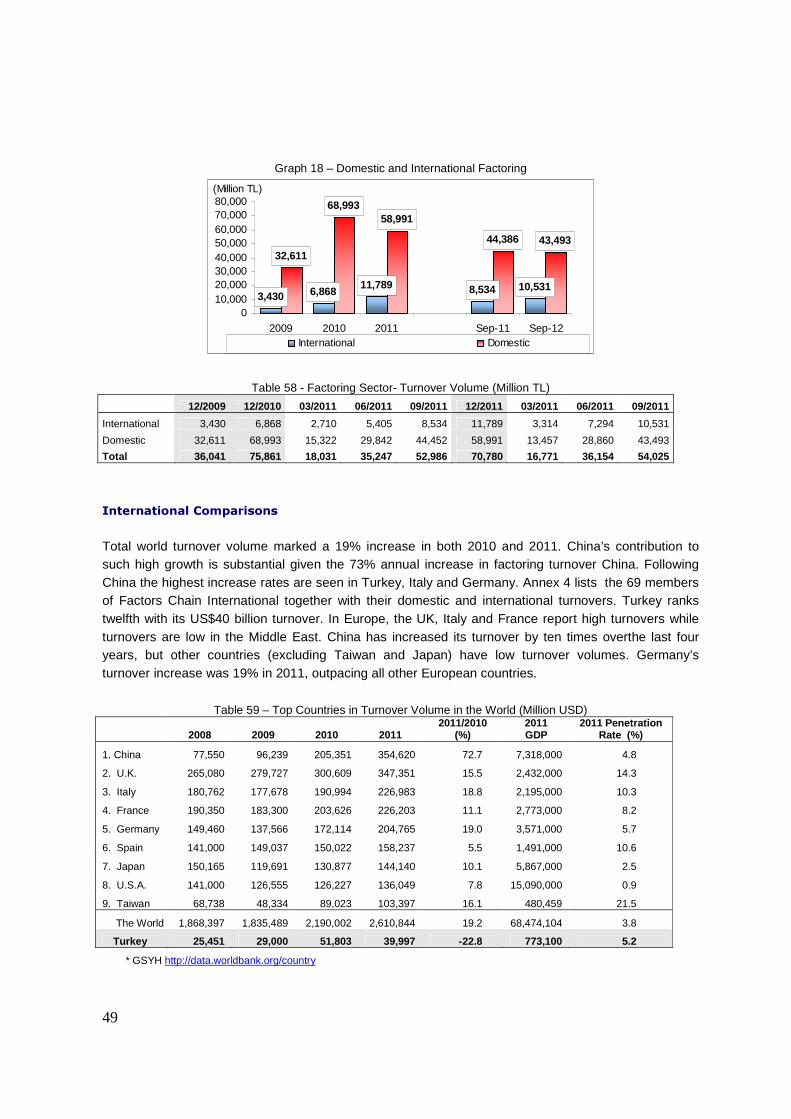
49
Graph 18 – Domestic and International Factoring
3,430 6,86811,789 8,534 10,531
32,611
68,99358,991
44,386 43,493
010,00020,00030,00040,00050,00060,00070,00080,000
2009 2010 2011 Sep-11 Sep-12
(Million TL)
International Domestic
Table 58 - Factoring Sector- Turnover Volume (Million TL)
12/2009 12/2010 03/2011 06/2011 09/2011 12/2011 03/2011 06/2011 09/2011
International 3,430 6,868 2,710 5,405 8,534 11,789 3,314 7,294 10,531
Domestic 32,611 68,993 15,322 29,842 44,452 58,991 13,457 28,860 43,493
Total 36,041 75,861 18,031 35,247 52,986 70,780 16,771 36,154 54,025
International Comparisons
Total world turnover volume marked a 19% increase in both 2010 and 2011. China’s contribution to such high growth is substantial given the 73% annual increase in factoring turnover China. Following China the highest increase rates are seen in Turkey, Italy and Germany. Annex 4 lists the 69 members of Factors Chain International together with their domestic and international turnovers. Turkey ranks twelfth with its US$40 billion turnover. In Europe, the UK, Italy and France report high turnovers while turnovers are low in the Middle East. China has increased its turnover by ten times overthe last four years, but other countries (excluding Taiwan and Japan) have low turnover volumes. Germany’s turnover increase was 19% in 2011, outpacing all other European countries.
Table 59 – Top Countries in Turnover Volume in the World (Million USD)
2008 2009 2010 2011 2011/2010
(%) 2011 GDP
2011 Penetration Rate (%)
1. China 77,550 96,239 205,351 354,620 72.7 7,318,000 4.8
2. U.K. 265,080 279,727 300,609 347,351 15.5 2,432,000 14.3
3. Italy 180,762 177,678 190,994 226,983 18.8 2,195,000 10.3
4. France 190,350 183,300 203,626 226,203 11.1 2,773,000 8.2
5. Germany 149,460 137,566 172,114 204,765 19.0 3,571,000 5.7
6. Spain 141,000 149,037 150,022 158,237 5.5 1,491,000 10.6
7. Japan 150,165 119,691 130,877 144,140 10.1 5,867,000 2.5
8. U.S.A. 141,000 126,555 126,227 136,049 7.8 15,090,000 0.9
9. Taiwan 68,738 48,334 89,023 103,397 16.1 480,459 21.5
The World 1,868,397 1,835,489 2,190,002 2,610,844 19.2 68,474,104 3.8
Turkey 25,451 29,000 51,803 39,997 -22.8 773,100 5.2
* GSYH http://data.worldbank.org/country
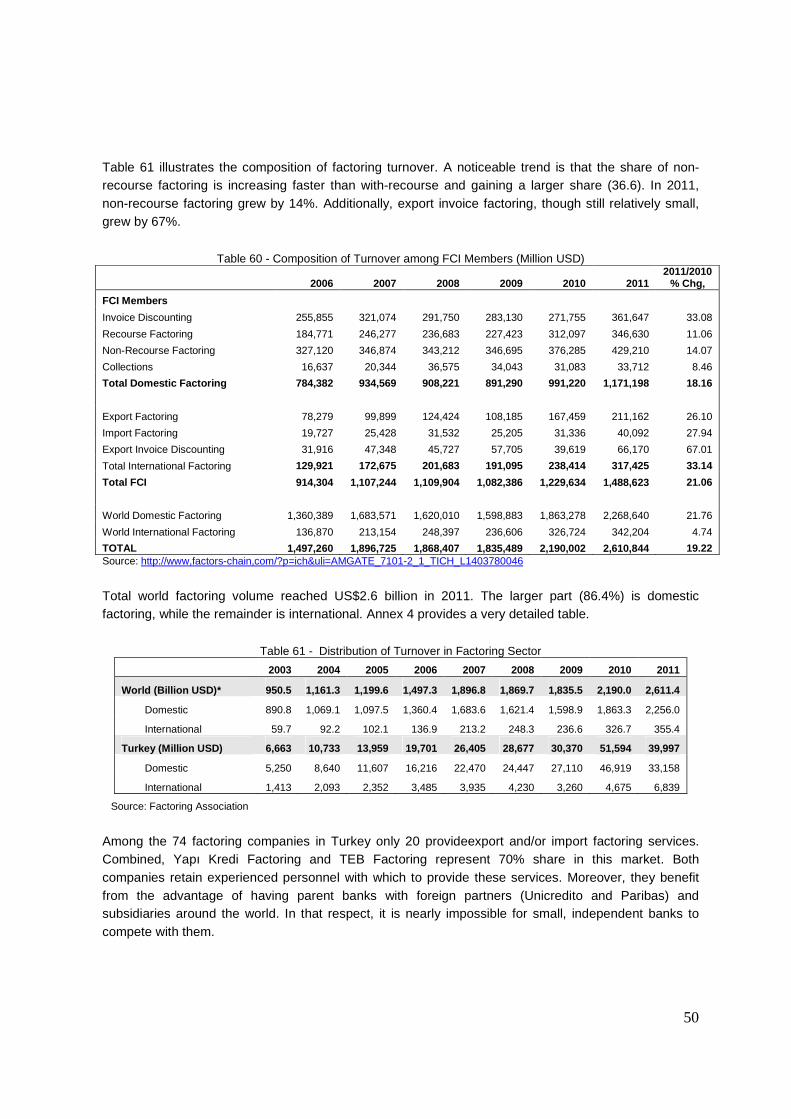
50
Table 61 illustrates the composition of factoring turnover. A noticeable trend is that the share of non-recourse factoring is increasing faster than with-recourse and gaining a larger share (36.6). In 2011, non-recourse factoring grew by 14%. Additionally, export invoice factoring, though still relatively small, grew by 67%.
Table 60 - Composition of Turnover among FCI Members (Million USD)
2006 2007 2008 2009 2010 2011 2011/2010
% Chg,
FCI Members
Invoice Discounting 255,855 321,074 291,750 283,130 271,755 361,647 33.08
Recourse Factoring 184,771 246,277 236,683 227,423 312,097 346,630 11.06
Non-Recourse Factoring 327,120 346,874 343,212 346,695 376,285 429,210 14.07
Collections 16,637 20,344 36,575 34,043 31,083 33,712 8.46
Total Domestic Factoring 784,382 934,569 908,221 89 1,290 991,220 1,171,198 18.16
Export Factoring 78,279 99,899 124,424 108,185 167,459 211,162 26.10
Import Factoring 19,727 25,428 31,532 25,205 31,336 40,092 27.94
Export Invoice Discounting 31,916 47,348 45,727 57,705 39,619 66,170 67.01
Total International Factoring 129,921 172,675 201,683 191,095 238,414 317,425 33.14
Total FCI 914,304 1,107,244 1,109,904 1,082,386 1,229,634 1,488,623 21.06
World Domestic Factoring 1,360,389 1,683,571 1,620,010 1,598,883 1,863,278 2,268,640 21.76
World International Factoring 136,870 213,154 248,397 236,606 326,724 342,204 4.74
TOTAL 1,497,260 1,896,725 1,868,407 1,835,489 2,190,002 2,610,844 19.22 Source: http://www,factors-chain,com/?p=ich&uli=AMGATE_7101-2_1_TICH_L1403780046
Total world factoring volume reached US$2.6 billion in 2011. The larger part (86.4%) is domestic factoring, while the remainder is international. Annex 4 provides a very detailed table.
Table 61 - Distribution of Turnover in Factoring Sector
2003 2004 2005 2006 2007 2008 2009 2010 2011
World (Billion USD)* 950.5 1,161.3 1,199.6 1,497.3 1,896.8 1,869.7 1,835.5 2,190.0 2,611.4
Domestic 890.8 1,069.1 1,097.5 1,360.4 1,683.6 1,621.4 1,598.9 1,863.3 2,256.0
International 59.7 92.2 102.1 136.9 213.2 248.3 236.6 326.7 355.4
Turkey (Million USD) 6,663 10,733 13,959 19,701 26,405 28,677 30,370 51,594 39,997
Domestic 5,250 8,640 11,607 16,216 22,470 24,447 27,110 46,919 33,158
International 1,413 2,093 2,352 3,485 3,935 4,230 3,260 4,675 6,839
Source: Factoring Association
Among the 74 factoring companies in Turkey only 20 provideexport and/or import factoring services. Combined, Yapı Kredi Factoring and TEB Factoring represent 70% share in this market. Both companies retain experienced personnel with which to provide these services. Moreover, they benefit from the advantage of having parent banks with foreign partners (Unicredito and Paribas) and subsidiaries around the world. In that respect, it is nearly impossible for small, independent banks to compete with them.
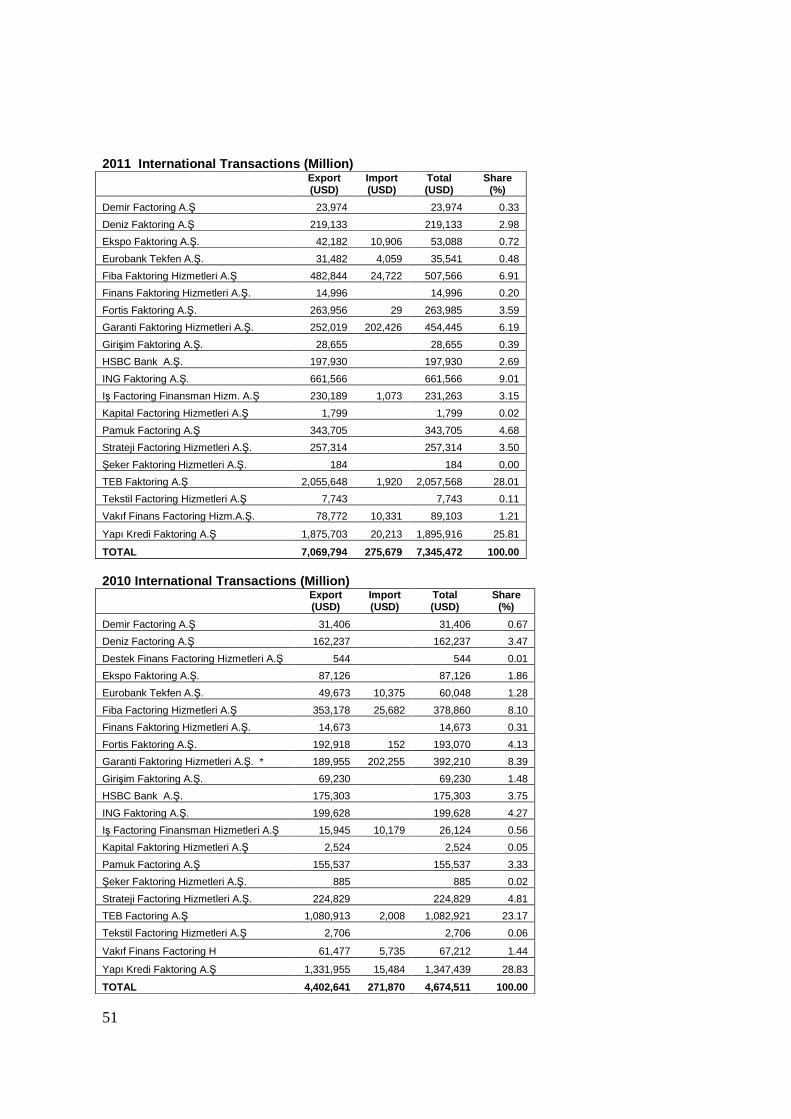
51
2011 International Transactions (Million)
Export (USD)
Import (USD)
Total (USD)
Share (%)
Demir Factoring A.Ş 23,974 23,974 0.33
Deniz Faktoring A.Ş 219,133 219,133 2.98
Ekspo Faktoring A.Ş. 42,182 10,906 53,088 0.72
Eurobank Tekfen A.Ş. 31,482 4,059 35,541 0.48
Fiba Faktoring Hizmetleri A.Ş 482,844 24,722 507,566 6.91
Finans Faktoring Hizmetleri A.Ş. 14,996 14,996 0.20
Fortis Faktoring A.Ş. 263,956 29 263,985 3.59
Garanti Faktoring Hizmetleri A.Ş. 252,019 202,426 454,445 6.19
Girişim Faktoring A.Ş. 28,655 28,655 0.39
HSBC Bank A.Ş. 197,930 197,930 2.69
ING Faktoring A.Ş. 661,566 661,566 9.01
Iş Factoring Finansman Hizm. A.Ş 230,189 1,073 231,263 3.15
Kapital Factoring Hizmetleri A.Ş 1,799 1,799 0.02
Pamuk Factoring A.Ş 343,705 343,705 4.68
Strateji Factoring Hizmetleri A.Ş. 257,314 257,314 3.50
Şeker Faktoring Hizmetleri A.Ş. 184 184 0.00
TEB Faktoring A.Ş 2,055,648 1,920 2,057,568 28.01
Tekstil Factoring Hizmetleri A.Ş 7,743 7,743 0.11
Vakıf Finans Factoring Hizm.A.Ş. 78,772 10,331 89,103 1.21
Yapı Kredi Faktoring A.Ş 1,875,703 20,213 1,895,916 25.81
TOTAL 7,069,794 275,679 7,345,472 100.00 2010 International Transactions (Million)
Export (USD)
Import (USD)
Total (USD)
Share (%)
Demir Factoring A.Ş 31,406 31,406 0.67
Deniz Factoring A.Ş 162,237 162,237 3.47
Destek Finans Factoring Hizmetleri A.Ş 544 544 0.01
Ekspo Faktoring A.Ş. 87,126 87,126 1.86
Eurobank Tekfen A.Ş. 49,673 10,375 60,048 1.28
Fiba Factoring Hizmetleri A.Ş 353,178 25,682 378,860 8.10
Finans Faktoring Hizmetleri A.Ş. 14,673 14,673 0.31
Fortis Faktoring A.Ş. 192,918 152 193,070 4.13
Garanti Faktoring Hizmetleri A.Ş. * 189,955 202,255 392,210 8.39
Girişim Faktoring A.Ş. 69,230 69,230 1.48
HSBC Bank A.Ş. 175,303 175,303 3.75
ING Faktoring A.Ş. 199,628 199,628 4.27
Iş Factoring Finansman Hizmetleri A.Ş 15,945 10,179 26,124 0.56
Kapital Faktoring Hizmetleri A.Ş 2,524 2,524 0.05
Pamuk Factoring A.Ş 155,537 155,537 3.33
Şeker Faktoring Hizmetleri A.Ş. 885 885 0.02
Strateji Factoring Hizmetleri A.Ş. 224,829 224,829 4.81
TEB Factoring A.Ş 1,080,913 2,008 1,082,921 23.17
Tekstil Factoring Hizmetleri A.Ş 2,706 2,706 0.06
Vakıf Finans Factoring H 61,477 5,735 67,212 1.44
Yapı Kredi Faktoring A.Ş 1,331,955 15,484 1,347,439 28.83
TOTAL 4,402,641 271,870 4,674,511 100.00
52
7. REGULATORY AND LEGISLATIVE FRAMEWORK
In October 2006, the regulation and supervision of factoring companies was transferred from the Turkish Treasury to the BRSA. Between 2007 and 2011, the BRSA brought discipline to the factoring sector through the introduction of a series of legislative changes which applied to Factoring, Leasing, and Financing Companies. In 2012 the government again issued a single law covering these three segments of non-bank financial institutions. Enacted on 21 November 2012, Law 6361, “The Leasing, Factoring and Financing Companies Law,” gave factoring companies a stronger legal base. Previous regulations (those dated 10 October 2006, No. 26315) and related modifications remain effective until replaced with new ones. The general principles of Law 6361 are summarized below. An Important Organizational Change: The Establishme nt of the Financial Leasing, Factoring and Financing Companies Association Within six months from the date of entry into force of this Law, professional organization, The Financial Leasing, Factoring and Financing Companies Association, will be established. It will be a legal entity and have public institution status. Every factoring, leasing and financing company will have to become a member of this association within one month of having received a license to operate. License Requirements Companies are required to have issued all ownership shares as registered and payable in cash and to maintain paid up capital of not less than TL20.0 million. Companies which have been previously established shall increase their minimum capital within three years (deadline 13 December 2015). The commercial title of companies must contain the description “Factoring Company.” Articles of association shall comply with applicable laws and regulations, and partnership structures are to be transparent and open, not hindering effective audits by the Board in case their founders are legal entities. There is a two-stage establishment permission procedure. At the first stage, permission is granted for the establishment of a company. Once procedures related to establishment (including registration with the Trade Registers Office; designating persons with signing powers; establishment of appropriate service units and internal controls; establishment of accounting, data processing and reporting systems; development of adequate staff positions for such units, including defining staff duties identifying staff powers and responsibilities) are completed, a company may apply to obtain an operating license. Establishment permissions of companies failing to apply for operating licenses within one hundred eighty days from receiving establishment permission are rendered null and void. Qualifications of Founders Company founders are expected to meet the following conditions:
a. They have not been declared bankrupt, have not declared any forced restructuring and postponement of debts, have not made any applications for restructuring through reconciliation which have not yet been upheld or do not face any rulings for postponement of bankruptcy;
b. They have not directly or indirectly held a share of ten percent or more in, or the control of, banks, the operational permissions of which have been discontinued or which have
53
been transferred to the Savings Deposit Insurance Fund or the banks transferred to the Fund before entry into force of Banking Law Nr. 5411, excluding discretional bankruptcy;
c. They have not directly or indirectly held a share of ten percent or more in, or the control of, any factoring, financial leasing, financing and insurance companies or in any other organizations operating in the money and capital markets, the operating licenses of which have been abrogated, excluding voluntary liquidation and brokers forced into liquidation of their businesses;
d. They have not received a sentence of any heavy imprisonment or imprisonment of more than five years pursuant to the abolished Turkish Criminal Code Nr. 765 dated 1 March 1926 and other laws, a sentence of imprisonment of more than three years pursuant to Turkish Criminal Code Nr. 5327 dated 26 September 2004 and other laws or they have not been convicted of opposition to the imprisonment requiring provisions of the abolished Law on Banking Nr. 3182 dated 25 April 1985, abolished Law on Banking Nr. 4389 dated 18 June 1989, Banking Law Nr. 5411, Capital Market Law Nr. 2499 dated 28 July 1981, Law on Money Lending Nr. 2279 dated 8 June 1933 and Financial Leasing Law Nr. 3226 or of infamous crimes such as simple or complicated embezzlement, extortion, bribery, theft, swindling, forgery, misuse of beliefs and offenses of fraudulent bankruptcy and smuggling offences other than smuggling of labor and consumers’ goods, rigging of public tenders and purchases and sales, money laundering and tax evasion or participation in such offenses pursuant to the abolished Turkish Penal Code Nr. 765, Turkish Penal Code Nr. 237 or other laws;
e. They must enjoy such financial capability and standing which can meet the sums of capital subscribed by them.
f. If the founder is a legal person, it must have a clear ownership structure. g. Founders must have the honesty and competence the job requires.
Opening of local branches by companies operating in Turkey Opening local and overseas branches is subject to the permission of the Board. Procedures and principles regarding the qualifications for authorizations of branches are determined by the Board. A paid-up capital amount of TL1.0 million is required for each branch or representation office. The applications made to the Board should be accompanied by a feasibility report detailing the justification for opening such a branch. Establishing a network can only be by way of opening branches. The new Law has terminated the option to open representation offices, and companies therefore are given a period of six months to close representation offices or convert them into branches. Failure to start operation within 90 days of receiving permission from the BRSA renders branch opening permission null and void. This law does not cover the terms and conditions for companies established abroad. How they can open branches in Turkey will be covered by new legislation. Restrictions Related to Factoring Companies Factoring Companies: a) May not operate outside their core business.
54
b) May not, in order to provide additional financing to customers under contracts with customers and as a part of related transactions therein, extend cash loans exceeding one percent of its total paid-up capital. The Board is authorized to reduce this rate to zero or increase to five percent of paid-up capital and may otherwise differentiate on a company-specific basis. c) May not issue guarantees, sureties, and/or letters of credit to persons holding ten percent or more of its own share capital or controlling ten percent or more of its own share capital, or to entities which hold ten percent or more of share capital or control ten percent or more of share capital, with the exception of guarantees and sureties not exceeding twenty percent of the total paid-up capital. The Board is authorized to reduce this rate to five percent, or increase up to twenty-five percent and may otherwise differentiate on a company-specific basis. d) May not, in accordance with Law Number 2499, accept deposits and may not under any name collect money in return for an interest. This excludes the issuance of securities, obtaining funds from international markets, money markets and from organized markets, and funding from partners or partnerships. e) Factoring companies take over or assume the collection of receivables arising from the sale of goods or services that cannot be documented by an invoice even if those receivables are based on bills of exchange which are within the framework of principles and procedures determined by the Board. The total amount of the partial assignments to more than one factoring company based on the same invoice cannot exceed the invoice amount. Limitations to transactions and provisions 1. The total sum of receivables of factoring companies, which stem from the extension of funds, may
not exceed thirty times their own-funds. 2. Companies must set aside provisions subject to the procedures and principles to be laid down by
the Board for the purpose of covering their losses already arisen or expected to arise out of their receivables from transactions, which cannot be precisely determined.
3. A factoring company’s minimum own funds cannot be lower than the minimum paid-up capital amount. Companies for which minimum own funds fall below this amount shall increase their own funds to this amount within one year.
External Audit Requirements Since 24 February 2011 factoring companies are required to present their annual balance sheets and income statements to the General Assembly. External audits may be made only by independent audit companies authorized by the BRSA in compliance with the “Regulation on the Authorization and Activities of Institutions to Realize Independent Audits in Banks,” published in the Official Gazette dated 11 November 2006 Nr. 26333. Companies are required to send to the BRSA independent audit contracts until the end of October of the related year and to send the Annual Audit Report no later than 15 April. Provisioning Requirements In order to cover losses and within the framework of the principles and procedures set by the Board, factoring companies are obliged to make provisions for losses arising from or expected to arise from the receivables arising from transactions.

55
Central Invoice Register Factoring companies and banks consolidate information – including invoice information – about receivables they takeover, and this information is stored at the Risk Center or in a manner deemed appropriate by the Association. The principles and procedures for sharing information is to be determined by the Association. Unrealized expectations of the sector under this La w: One of the key problems of the factoring sector is that factoring companies may not deduct their provisions for impaired receivables and/or potential future impaired receivables from operating profits. The Ministry of Finance does not allow companiesto book provisions as expenditures, though banks may. All factoring companies had expected that this unfair treatment would be resolved with the new law, but the law has made no reference. List of Related Legislation The Leasing, Factoring and Financing Companies Law No.6361 enacted on November 21st, 2012 Regulation on Principles for the Establishment and Operations of Financial Leasing, Factoring and Financing Companies - Published in Official Gazette dated October 10, 2006 Nr. 26315 prepared on the basis of the Article 93 (1a) of Banking Law Nr. 5411 dated October of 19, 2005, Articles 10, 12 and 32 of Financial Leasing Law Nr. 3226 dated June 10, 1985 and Articles 12 and 13 of Decree-Law Nr. 90 on Transactions of Lending Loans dated September 30, 1983. Amendments: - Official Gazette dated 23/03/2008 No. 26825 - Official Gazette dated 26.03.2009 No. 27270 - Official Gazette dated 14.01.2011 No. 27815 - Official Gazette dated 24.02.2011 No. 27856 MASAK (The Financial Crimes Investigation Board of the Ministry of Finance) Regulations published in the Official Gazette dated January 9, 2008 No. 26751 on “The Prevention of Financing of Terrorism and the Prevention of Laundering Proceeds of Crime” Circulars: Circular announced by the BRSA Implementation II Department on 8 July 2010 Circular announced by the BRSA Implementation II Department on 4 January 2011 By-Laws: Communiqué on Uniform Chart of Accounts to be Implemented by Financial Leasing, Factoring and Financing Companies and its explanation as well as the Form and Scope of Financial Statements to be Announced to the Public - Published in the Official Gazette dated May 17, 2007Nr. 26525 Communiqué on Procedures and Principles for the Provisions to be set aside by Financial Leasing, Factoring and Financing Companies for their Receivables - Published in Official Gazette dated July 20, 2007 Nr. 26588
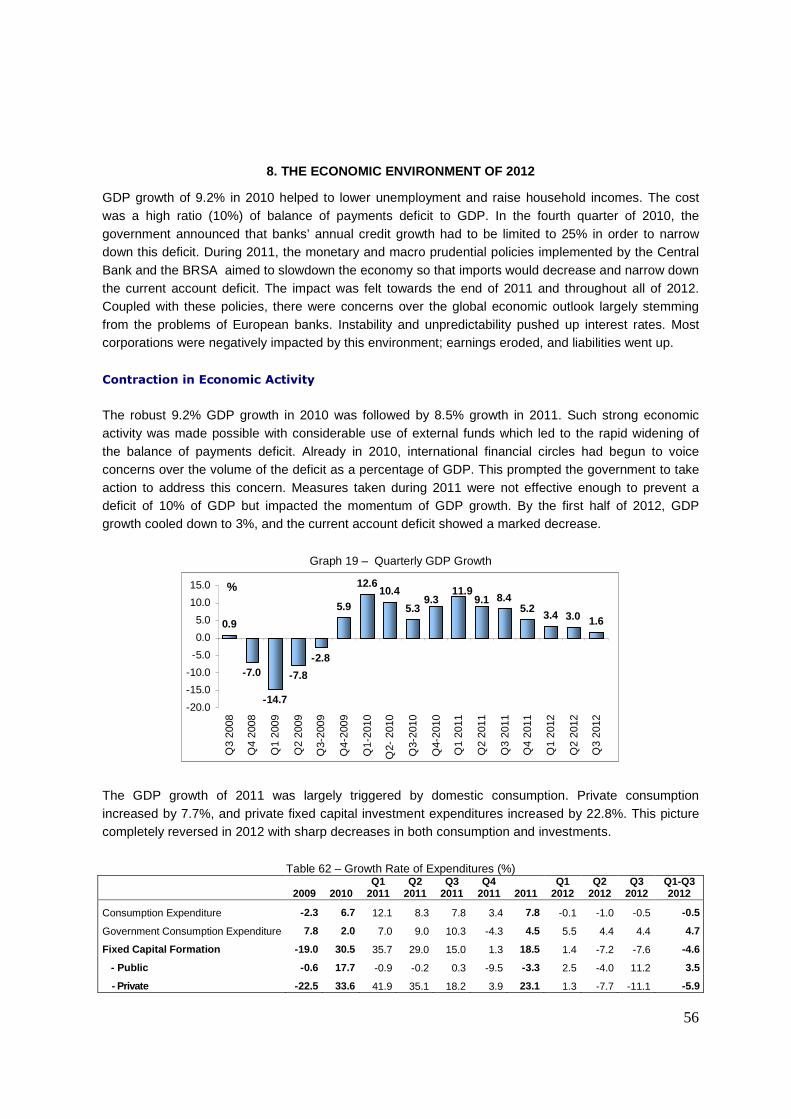
56
8. THE ECONOMIC ENVIRONMENT OF 2012
GDP growth of 9.2% in 2010 helped to lower unemployment and raise household incomes. The cost was a high ratio (10%) of balance of payments deficit to GDP. In the fourth quarter of 2010, the government announced that banks’ annual credit growth had to be limited to 25% in order to narrow down this deficit. During 2011, the monetary and macro prudential policies implemented by the Central Bank and the BRSA aimed to slowdown the economy so that imports would decrease and narrow down the current account deficit. The impact was felt towards the end of 2011 and throughout all of 2012. Coupled with these policies, there were concerns over the global economic outlook largely stemming from the problems of European banks. Instability and unpredictability pushed up interest rates. Most corporations were negatively impacted by this environment; earnings eroded, and liabilities went up.
Contraction in Economic Activity
The robust 9.2% GDP growth in 2010 was followed by 8.5% growth in 2011. Such strong economic activity was made possible with considerable use of external funds which led to the rapid widening of the balance of payments deficit. Already in 2010, international financial circles had begun to voice concerns over the volume of the deficit as a percentage of GDP. This prompted the government to take action to address this concern. Measures taken during 2011 were not effective enough to prevent a deficit of 10% of GDP but impacted the momentum of GDP growth. By the first half of 2012, GDP growth cooled down to 3%, and the current account deficit showed a marked decrease.
Graph 19 – Quarterly GDP Growth
0.9
-7.0
-14.7
-7.8
-2.8
5.9
12.610.4
5.38.4
5.23.4 3.0 1.6
9.311.9
9.1
-20.0
-15.0
-10.0
-5.0
0.0
5.0
10.0
15.0
Q3
2008
Q4
2008
Q1
2009
Q2
2009
Q3-
2009
Q4-
2009
Q1-
2010
Q2-
201
0
Q3-
2010
Q4-
2010
Q1
2011
Q2
2011
Q3
2011
Q4
2011
Q1
2012
Q2
2012
Q3
2012
%
The GDP growth of 2011 was largely triggered by domestic consumption. Private consumption increased by 7.7%, and private fixed capital investment expenditures increased by 22.8%. This picture completely reversed in 2012 with sharp decreases in both consumption and investments.
Table 62 – Growth Rate of Expenditures (%)
2009
2010 Q1
2011 Q2
2011 Q3
2011 Q4
2011
2011 Q1
2012 Q2
2012 Q3
2012 Q1-Q3 2012
Consumption Expenditure -2.3 6.7 12.1 8.3 7.8 3.4 7.8 -0.1 -1.0 -0.5 -0.5
Government Consumption Expenditure 7.8 2.0 7.0 9.0 10.3 -4.3 4.5 5.5 4.4 4.4 4.7
Fixed Capital Formation -19.0 30.5 35.7 29.0 15.0 1.3 18.5 1.4 -7.2 -7.6 -4.6
- Public -0.6 17.7 -0.9 -0.2 0.3 -9.5 -3.3 2.5 -4.0 11.2 3.5
- Private -22.5 33.6 41.9 35.1 18.2 3.9 23.1 1.3 -7.7 -11.1 -5.9
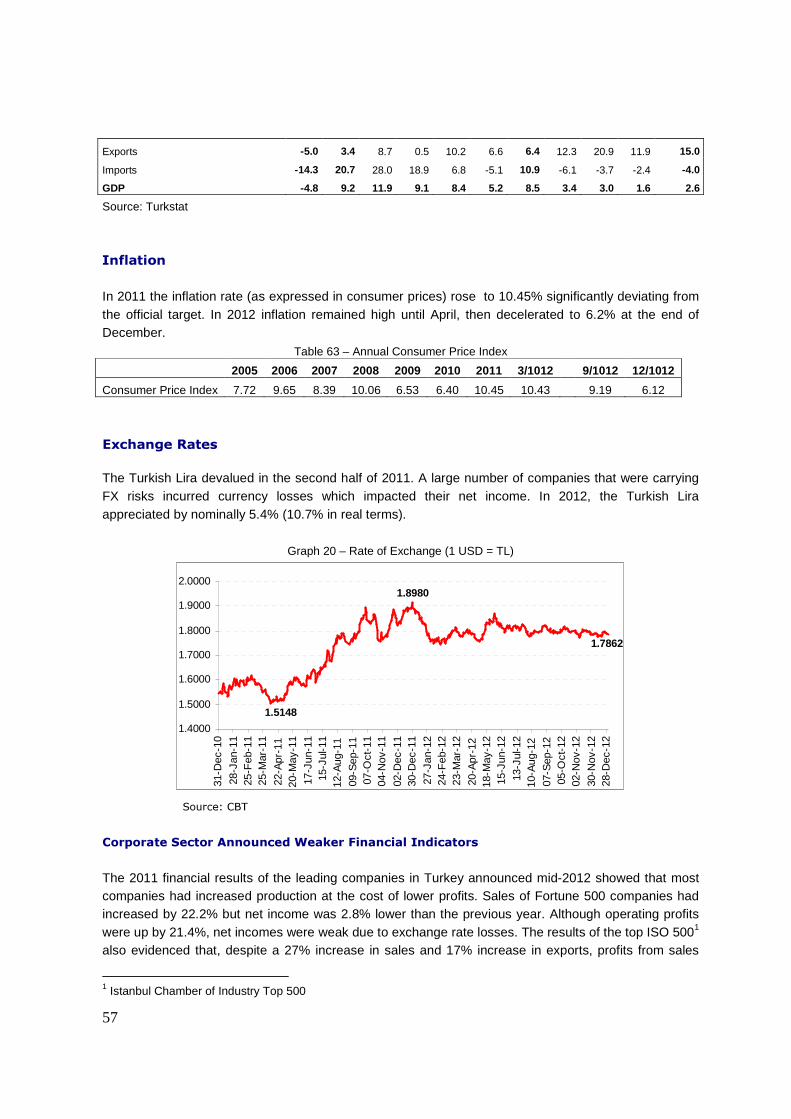
57
Exports -5.0 3.4 8.7 0.5 10.2 6.6 6.4 12.3 20.9 11.9 15.0
Imports -14.3 20.7 28.0 18.9 6.8 -5.1 10.9 -6.1 -3.7 -2.4 -4.0
GDP -4.8 9.2 11.9 9.1 8.4 5.2 8.5 3.4 3.0 1.6 2.6
Source: Turkstat
Inflation
In 2011 the inflation rate (as expressed in consumer prices) rose to 10.45% significantly deviating from the official target. In 2012 inflation remained high until April, then decelerated to 6.2% at the end of December.
Table 63 – Annual Consumer Price Index
2005 2006 2007 2008 2009 2010 2011 3/1012 9/1012 12/1012
Consumer Price Index 7.72 9.65 8.39 10.06 6.53 6.40 10.45 10.43 9.19 6.12
Exchange Rates
The Turkish Lira devalued in the second half of 2011. A large number of companies that were carrying FX risks incurred currency losses which impacted their net income. In 2012, the Turkish Lira appreciated by nominally 5.4% (10.7% in real terms).
Graph 20 – Rate of Exchange (1 USD = TL)
1.8980
1.7862
1.5148
1.4000
1.5000
1.6000
1.7000
1.8000
1.9000
2.0000
31-D
ec-1
0
28-J
an-1
125
-Feb
-11
25-M
ar-1
1
22-A
pr-1
120
-May
-11
17-J
un-1
115
-Jul
-11
12-A
ug-1
1
09-S
ep-1
107
-Oct
-11
04-N
ov-1
1
02-D
ec-1
130
-Dec
-11
27-J
an-1
224
-Feb
-12
23-M
ar-1
2
20-A
pr-1
218
-May
-12
15-J
un-1
2
13-J
ul-1
210
-Aug
-12
07-S
ep-1
205
-Oct
-12
02-N
ov-1
2
30-N
ov-1
228
-Dec
-12
Source: CBT
Corporate Sector Announced Weaker Financial Indicators
The 2011 financial results of the leading companies in Turkey announced mid-2012 showed that most companies had increased production at the cost of lower profits. Sales of Fortune 500 companies had increased by 22.2% but net income was 2.8% lower than the previous year. Although operating profits were up by 21.4%, net incomes were weak due to exchange rate losses. The results of the top ISO 5001 also evidenced that, despite a 27% increase in sales and 17% increase in exports, profits from sales
1 Istanbul Chamber of Industry Top 500
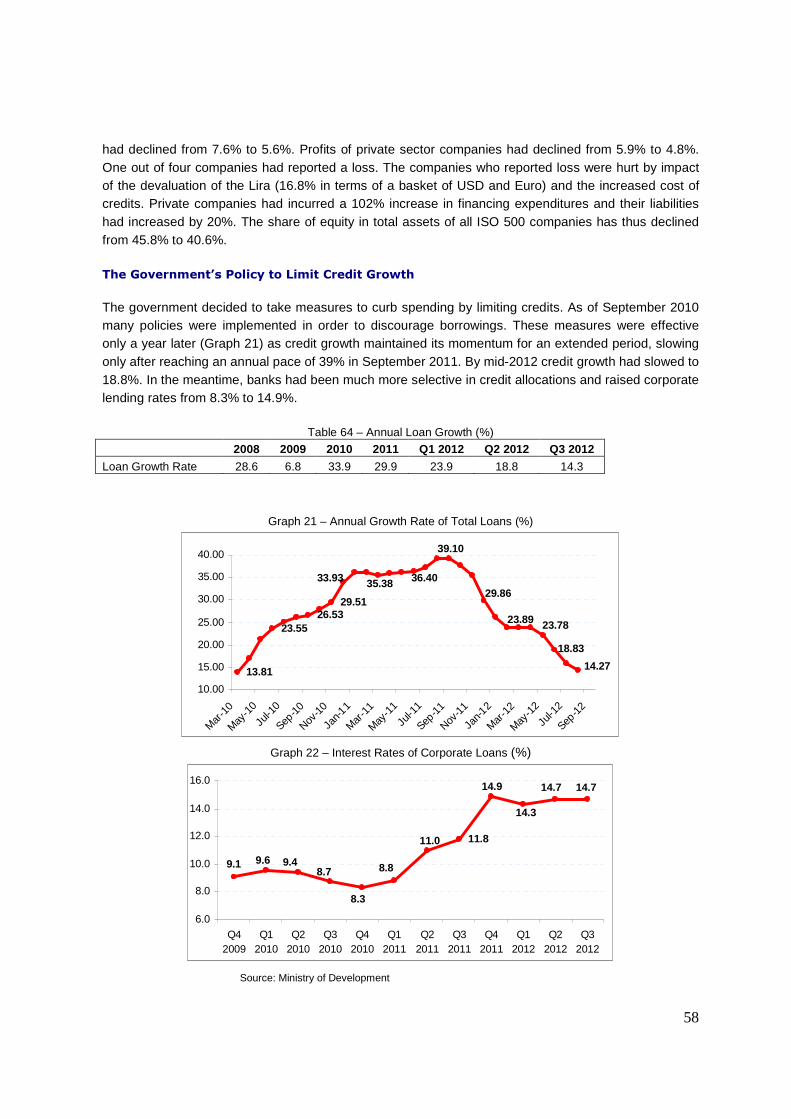
58
had declined from 7.6% to 5.6%. Profits of private sector companies had declined from 5.9% to 4.8%. One out of four companies had reported a loss. The companies who reported loss were hurt by impact of the devaluation of the Lira (16.8% in terms of a basket of USD and Euro) and the increased cost of credits. Private companies had incurred a 102% increase in financing expenditures and their liabilities had increased by 20%. The share of equity in total assets of all ISO 500 companies has thus declined from 45.8% to 40.6%. The Government’s Policy to Limit Credit Growth
The government decided to take measures to curb spending by limiting credits. As of September 2010 many policies were implemented in order to discourage borrowings. These measures were effective only a year later (Graph 21) as credit growth maintained its momentum for an extended period, slowing only after reaching an annual pace of 39% in September 2011. By mid-2012 credit growth had slowed to 18.8%. In the meantime, banks had been much more selective in credit allocations and raised corporate lending rates from 8.3% to 14.9%.
Table 64 – Annual Loan Growth (%)
2008 2009 2010 2011 Q1 2012 Q2 2012 Q3 2012
Loan Growth Rate 28.6 6.8 33.9 29.9 23.9 18.8 14.3
Graph 21 – Annual Growth Rate of Total Loans (%)
13.81
23.5526.53
29.51
14.27
33.93 35.38
23.89
29.86
39.10
36.40
18.83
23.78
10.00
15.00
20.00
25.00
30.00
35.00
40.00
Mar-1
0
May-1
0
Jul-1
0
Sep-10
Nov-10
Jan-
11
Mar-1
1
May-1
1
Jul-1
1
Sep-11
Nov-11
Jan-
12
Mar-1
2
May-1
2
Jul-1
2
Sep-12
Graph 22 – Interest Rates of Corporate Loans (%)
11.8
14.7
8.88.79.49.69.1
11.0
8.3
14.9
14.3
14.7
6.0
8.0
10.0
12.0
14.0
16.0
Q42009
Q12010
Q22010
Q32010
Q42010
Q12011
Q22011
Q32011
Q42011
Q12012
Q22012
Q32012
Source: Ministry of Development

59
Graph 23 – 2011 Average Cost of Fixed Interest Borrowing (%)
7.7
8.7 9.0 9.0
8.8
9.1 9.18.9
8.18.4
10.5 10.3
5.0
6.0
7.0
8.0
9.0
10.0
11.0
12.0
Jan Feb Mar Apr May June July Aug Sep Oct Nov Dec
Source: Turkish Treasury, Public Debt Management Report
Graph 24 – Cost of Treasury Borrowings Graph 25 – CBT O/N Interest Rates
44.5
22.0
17.0
22.7
18.4
19.2
11.6
8.5 8.7 9.0
0.05.0
10.015.020.025.0
30.035.040.0
45.050.0
2003
2004
2005
2006
2007
2008
2009
2010
2011
2012
1.75
5.756.50
9.75
13.00
1.50
5.00
0.00
2.00
4.00
6.00
8.00
10.00
12.00
14.00Ja
n-09
Jul-0
9
Jan-
10
Jul-1
0
Jan-
11
Jul-1
1
Jan-
12
Jul-1
2
Source: Turkish Treasury
Graph 26 – Banks’ cost of borrowing and average deposit yields
19.9 18.9
15.1 15.116.1 15.8
14.4
10.79.7
16.6
11.0
9.5
10.0 10.8 11.0
7.45.7 5.7
0.02.04.06.08.0
10.0
12.014.016.018.020.0
2003 2004 2005 2006 2007 2008 2009 2010 2011
%
Average Yield of Credits
Average Cost of Deposits
Source: BRSA, Financial Markets Report
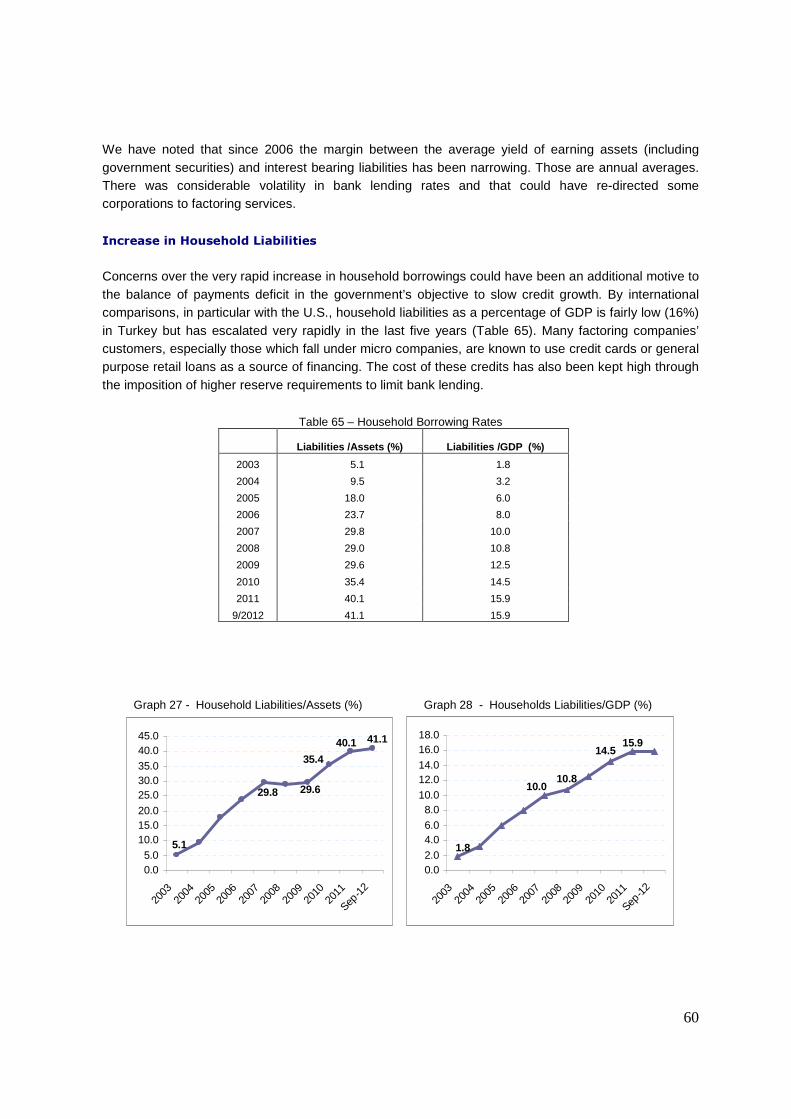
60
We have noted that since 2006 the margin between the average yield of earning assets (including government securities) and interest bearing liabilities has been narrowing. Those are annual averages. There was considerable volatility in bank lending rates and that could have re-directed some corporations to factoring services.
Increase in Household Liabilities
Concerns over the very rapid increase in household borrowings could have been an additional motive to the balance of payments deficit in the government’s objective to slow credit growth. By international comparisons, in particular with the U.S., household liabilities as a percentage of GDP is fairly low (16%) in Turkey but has escalated very rapidly in the last five years (Table 65). Many factoring companies’ customers, especially those which fall under micro companies, are known to use credit cards or general purpose retail loans as a source of financing. The cost of these credits has also been kept high through the imposition of higher reserve requirements to limit bank lending.
Table 65 – Household Borrowing Rates
Liabilities /Assets (%) Liabilities /GDP (%)
2003 5.1 1.8
2004 9.5 3.2
2005 18.0 6.0
2006 23.7 8.0
2007 29.8 10.0
2008 29.0 10.8
2009 29.6 12.5
2010 35.4 14.5
2011 40.1 15.9
9/2012 41.1 15.9
Graph 27 - Household Liabilities/Assets (%) Graph 28 - Households Liabilities/GDP (%)
41.1
29.629.8
5.1
35.4
40.1
0.05.0
10.015.020.0
25.030.035.0
40.045.0
2003
2004
2005
2006
2007
2008
2009
2010
2011
Sep-1
2
10.810.0
14.515.9
1.8
0.02.0
4.06.0
8.010.0
12.014.0
16.018.0
2003
2004
2005
2006
2007
2008
2009
2010
2011
Sep-1
2
61
Developments in the Banking Sector
In 2011, total assets of the banking sector increased by 21%, and net income dropped by 10%. Banks were unable to reflect in their lending rates any higher funding costs arising from higher reserve requirements. The interest margin between yields from credits and the interest paid to deposits narrowed. Deposit rates were unattractive and, in real terms, deposit growth remained low. Banks could easily offset deposit funds with the bonds they issued and from borrowings from money markets. Also in 2011, credits grew by 29.9% (39.9% in 2010), and non-performing loans declined – both in nominal terms and as a ratio to total loans – to 2.8%. Increase in shareholders’ equity grew by 7.5%. Capital adequacy ratios remained high (16.5%). Table 66 illustrates a comparison of the banking sector with the factoring and leasing sectors and noted that the ROA and ROE of the factoring sector remained higher.
Table 66 – Comparison of Profitability Ratios with the Banking and Leasing Sectors 2008 2009 2010 2011
Factoring Net Profit/Loss (Million TL) 427,0 330,2 407,5 504,4
ROAA (%) 5.7 3.6 3.3 3.4
ROAE (%) 30.3 13.6 15.0 15.9
Leasing Net Profit/Loss (Million TL) 590 583 466 522
ROAA (%) 2.8 2.8 2.9 2.8
ROAE (%) 15.7 13.6 12.0 12.4
Banks Net Profit/Loss (Million TL) 13,422 20,182 21,119 19,844
ROAA (%) 1.8 2.4 2.5 1.7
ROAE (%) 15.5 18.2 20.1 15.5
Table 67 – Financial Indicators of Banks
2008 2009 2010 2011
Total Assets (Million TL) 732,536 834,014 1,006,671 1,217,620
Annual Growth (%) 25.9 13.9 20.8 21.0
Loans (Million TL) 367,445 392,621 525,851 682,919
Annual Growth (%) 28.6 6.9 33.9 29.9
Non-Performing Loans (Million TL) 10,345 21,853 19,993 18,960
NPL /Total Loans 3.7 5.2 3.8 2.8
Net Profit (Million) 13,422 20,076 21,119 19,844
Annual Growth (%) -10.0 50.4 8.7 -10.3
Shareholders’ Equity (Million TL) 86,402 110,887 134,545 144,595
Annual Growth (%) 13.9 28.3 21.1 7.47 Source: BRSA
The comparison of the growth of factoring with banking sector credits shows that bank credits lost momentum in October 2011. The fall in the pace of factoring receivables’ growth began earlier in the third quarter of 2010.
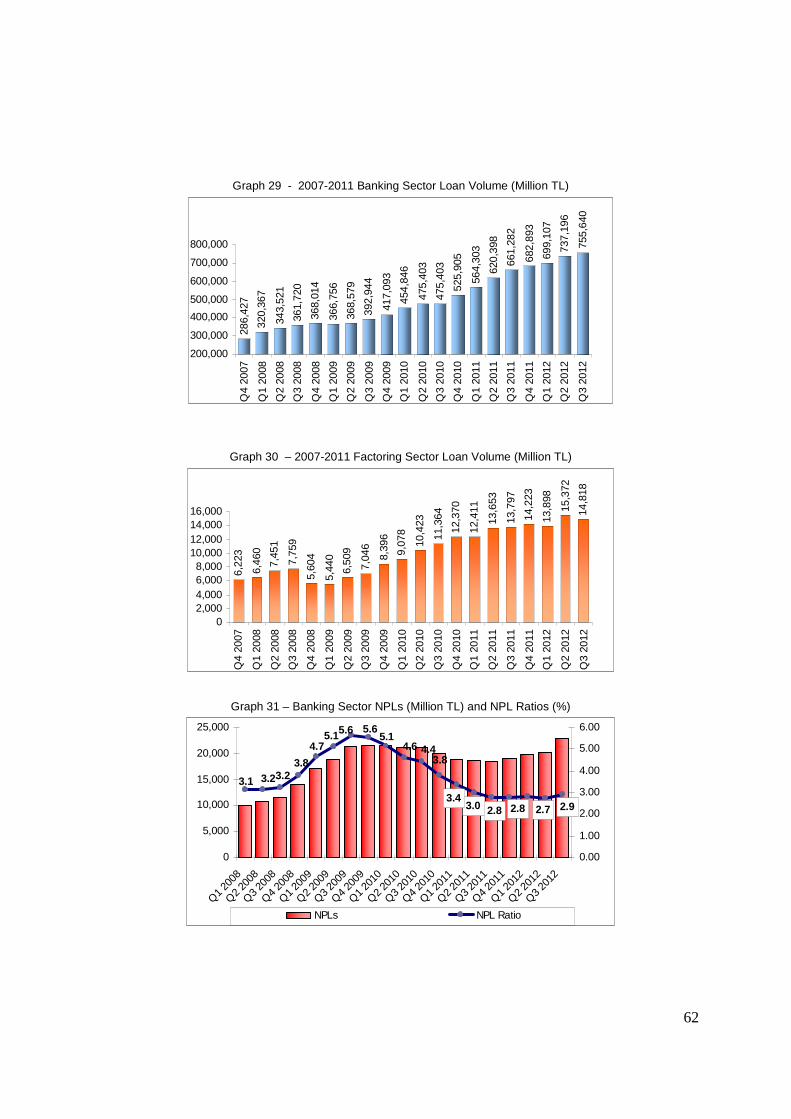
62
Graph 29 - 2007-2011 Banking Sector Loan Volume (Million TL)
286,
427
320,
367
343,
521
361,
720
368,
014
366,
756
368,
579
392,
944
417,
093
454,
846
475,
403
475,
403
525,
905
564,
303
620,
398
661,
282
682,
893
699,
107
737,
196
755,
640
200,000
300,000
400,000
500,000
600,000
700,000
800,000Q
4 20
07
Q1
2008
Q2
2008
Q3
2008
Q4
2008
Q1
2009
Q2
2009
Q3
2009
Q4
2009
Q1
2010
Q2
2010
Q3
2010
Q4
2010
Q1
2011
Q2
2011
Q3
2011
Q4
2011
Q1
2012
Q2
2012
Q3
2012
Graph 30 – 2007-2011 Factoring Sector Loan Volume (Million TL)
6,22
3
6,46
0
7,45
1
7,75
9
5,60
4
5,44
0
6,50
9
7,04
6
8,39
6
9,07
8
10,4
23
11,3
64
12,3
70
12,4
11
13,6
53
13,7
97
14,2
23
13,8
98
15,3
72
14,8
18
02,0004,0006,0008,000
10,00012,00014,00016,000
Q4
2007
Q1
2008
Q2
2008
Q3
2008
Q4
2008
Q1
2009
Q2
2009
Q3
2009
Q4
2009
Q1
2010
Q2
2010
Q3
2010
Q4
2010
Q1
2011
Q2
2011
Q3
2011
Q4
2011
Q1
2012
Q2
2012
Q3
2012
Graph 31 – Banking Sector NPLs (Million TL) and NPL Ratios (%)
3.1 3.23.23.8
4.75.15.6 5.6
5.14.6 4.4
3.8
3.0 2.83.4
2.8 2.7 2.9
0
5,000
10,000
15,000
20,000
25,000
Q1 2
008
Q2 2
008
Q3 2
008
Q4 2
008
Q1 2
009
Q2 2
009
Q3 2
009
Q4 2
009
Q1 2
010
Q2 2
010
Q3 2
010
Q4 2
010
Q1 2
011
Q2 2
011
Q3 2
011
Q4 2
011
Q1 2
012
Q2 2
012
Q3 2
012
0.00
1.00
2.00
3.00
4.00
5.00
6.00
NPLs NPL Ratio

63
Graph 32 – Annual Growth of Bank Loans and Factoring Receivables (%)
18.8314.27
30.5020.98
7.4012.59
30.99
61.28
0.00
10.00
20.00
30.00
40.00
50.00
60.00
70.00
80.00
Q42009
Q12010
Q22010
Q32010
Q42010
Q12011
Q22011
Q32011
Q42011
Q12012
Q22012
Q32012
Banking Sector Loans
Factoring Sector Receivables

64
9. DEVELOPMENTS IN 2012
In 2012, the factoring industry further matured, and there was more divergence among the various groups. The year also reflected a change in the environment, with economic growth decelerating to 3% from 9%. This contraction impacted non-performing loans, and the NPL ratio rose once again. Despite these changes, the factoring industry continued to grow (7% as of September).
Slower Growth in Q1 2012 – Pick-up in Q2 and Q3
It has become somewhat customary for factoring companies to contract in January. After year-end 2011 there was a lower volume of factoring receivables in Q1 which picked up in Q2 and Q3. Annual growth in factoring receivables was limited to 7.4%, and total asset growth was 7.2%.
Table 68 - Quarterly Basic Indicators (Million TL)
Q1 / 2011 Q2 / 2011 Q3 / 2011 Q4 / 2011 Q1 / 2012 Q2 / 2012 Q3 2012
Factoring Receivables 12,411 13,653 13,797 14,229 13,898 15,372 14,817
Total Loans 10,798 11,368 11,244 11,464 11,321 12,278 11,435
FC Loans 2,811 2,873 3,093 2,974 2,739 2,765 2,863
TL Loans 7,987 8,495 8,151 8,490 8,582 9,513 8,572
Shareholders’ Equity 3,032 3,058 3,235 3,400 3,388 3,472 3,659
Total Assets 14,352 15,119 15,253 15,652 15,516 16,827 16,334 Source: BRSA The annual increase in bank borrowings decreased to 1.8% as of September, after the 8% increase as of June 2012. Table 69 suggests that companies used their liquid assets rather than using loans.
Table 69 – Balance Sheet Structure – Percentage Shares
Q1
2010 Q2
2010 Q3
2010 Q4
2010 Q1
2011 Q2
2011 Q3
2011 Q4
2011 Q1
2012 Q2
2012 Q3
2012
Banks and Cash 10.1 8.4 7.6 8.1 6.1 3.5 3.0 2.9 3.7 2.4 2.5
Factoring Receivables 82.1 84.5 84.8 85.5 86.5 90.3 90.5 90.9 89.6 91.2 90.7
NPLs 0.7 0.6 1.3 0.5 0.5 0.6 0.7 0.8 0.8 0.8 0.8
Other Assets 7.2 6.5 6.3 5.9 6.9 5.7 5.9 5.4 5.9 5.4 5.9
100.0 100.0 100.0 100.0 100.0 100.0 100.0 100.0 100.0 100.0 100.0
Loans 74.6 75.8 76.4 77.2 75.8 76.2 74.8 74.5 74.5 74.7 71.6
Shareholders’ Equity 23.0 21.5 21.0 20.3 21.1 20.2 21.2 21.7 21.8 20.6 22.4
Other Liabilities 1.5 1.2 0.4 0.4 2.4 2.0 1.6 0.5 2.7 2.8 3.1
Profit 0.9 1.6 2.2 2.8 0.7 1.5 2.4 3.2 0.9 1.9 3.0 Source: The Factoring Association
Table 70 - Quarterly Turnover (1000 TL)
Q1
2011 Q2
2011 Q3
2011 Q1
2012 Q2
2012 Q3
2012
International 2,710 5,405 8,534 3,314 7,294 10,531
Domestic 15,322 29,868 44,386 13,457 28,860 43,493
Total Turnover 18,031 35,273 52,920 16,771 36,154 54,025
Source: The Factoring Association
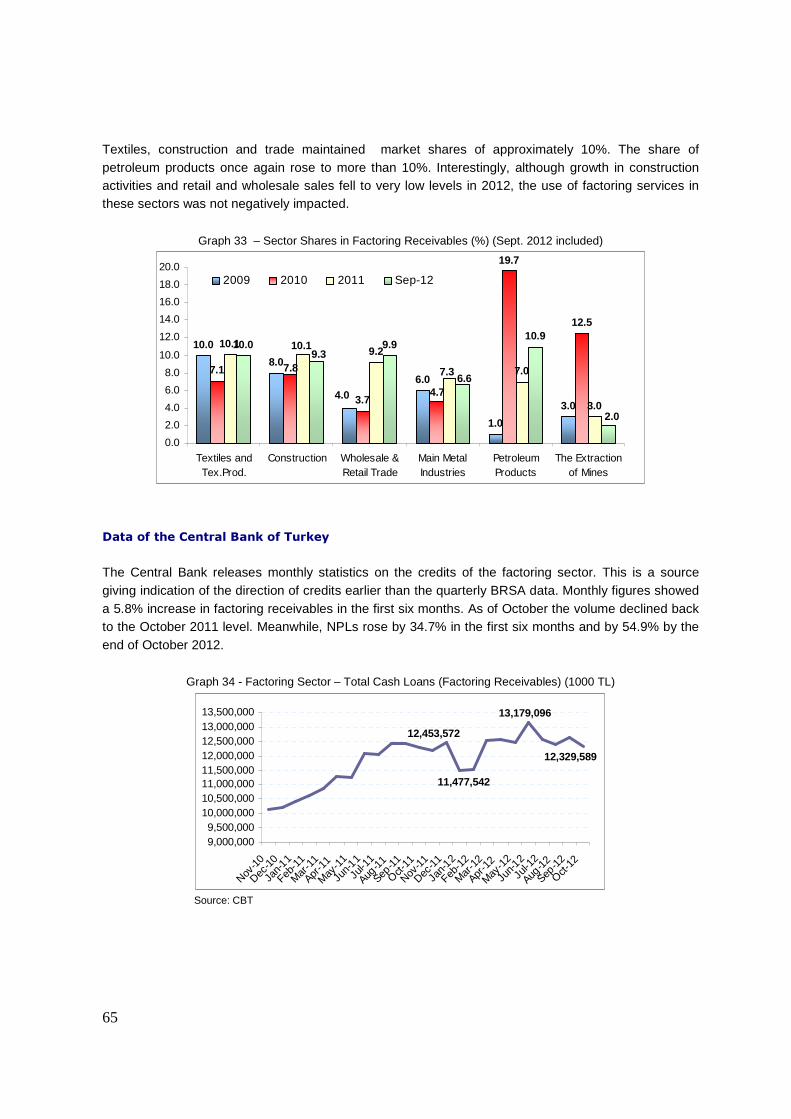
65
Textiles, construction and trade maintained market shares of approximately 10%. The share of petroleum products once again rose to more than 10%. Interestingly, although growth in construction activities and retail and wholesale sales fell to very low levels in 2012, the use of factoring services in these sectors was not negatively impacted.
Graph 33 – Sector Shares in Factoring Receivables (%) (Sept. 2012 included)
10.0
8.0
6.0
1.0
3.0
7.1
3.7
19.7
12.5
10.19.2
7.0
3.0
10.0 9.910.9
4.0 4.7
7.8 7.3
10.1
2.0
6.6
9.3
0.0
2.0
4.0
6.0
8.0
10.0
12.0
14.0
16.0
18.0
20.0
Textiles andTex.Prod.
Construction Wholesale &Retail Trade
Main MetalIndustries
PetroleumProducts
The Extractionof Mines
2009 2010 2011 Sep-12
Data of the Central Bank of Turkey
The Central Bank releases monthly statistics on the credits of the factoring sector. This is a source giving indication of the direction of credits earlier than the quarterly BRSA data. Monthly figures showed a 5.8% increase in factoring receivables in the first six months. As of October the volume declined back to the October 2011 level. Meanwhile, NPLs rose by 34.7% in the first six months and by 54.9% by the end of October 2012.
Graph 34 - Factoring Sector – Total Cash Loans (Factoring Receivables) (1000 TL)
11,477,542
12,329,589
12,453,572
13,179,096
9,000,0009,500,000
10,000,00010,500,00011,000,00011,500,00012,000,00012,500,00013,000,00013,500,000
Nov-10
Dec-10
Jan-
11
Feb-1
1
Mar-1
1
Apr-1
1
May-1
1
Jun-
11
Jul-1
1
Aug-11
Sep-11
Oct-11
Nov-11
Dec-11
Jan-
12
Feb-1
2
Mar-1
2
Apr-1
2
May-1
2
Jun-
12
Jul-1
2
Aug-12
Sep-12
Oct-12
Source: CBT
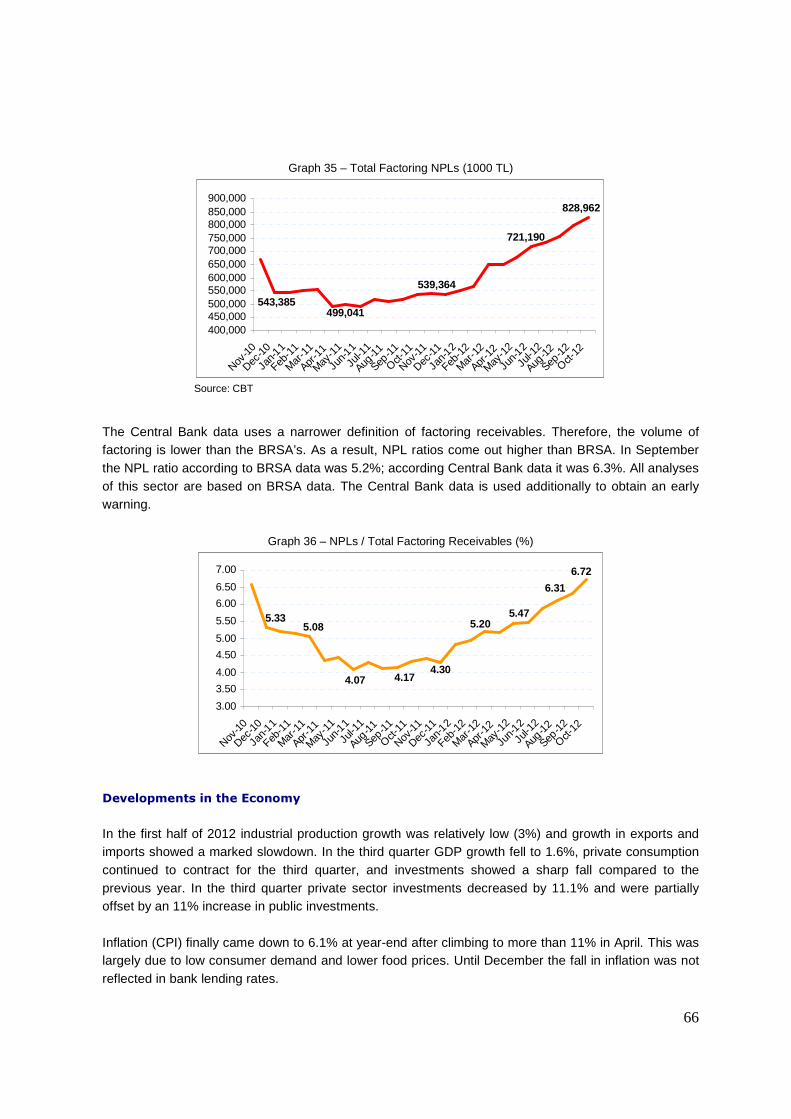
66
Graph 35 – Total Factoring NPLs (1000 TL)
828,962
543,385499,041
539,364
721,190
400,000450,000500,000550,000600,000650,000700,000750,000800,000850,000900,000
Nov-10
Dec-10
Jan-
11
Feb-1
1
Mar-1
1
Apr-1
1
May-1
1
Jun-
11
Jul-1
1
Aug-11
Sep-11
Oct-11
Nov-11
Dec-11
Jan-
12
Feb-1
2
Mar-1
2
Apr-1
2
May-1
2
Jun-
12
Jul-1
2
Aug-12
Sep-12
Oct-12
Source: CBT
The Central Bank data uses a narrower definition of factoring receivables. Therefore, the volume of factoring is lower than the BRSA’s. As a result, NPL ratios come out higher than BRSA. In September the NPL ratio according to BRSA data was 5.2%; according Central Bank data it was 6.3%. All analyses of this sector are based on BRSA data. The Central Bank data is used additionally to obtain an early warning.
Graph 36 – NPLs / Total Factoring Receivables (%)
6.31
6.72
5.335.08
4.304.174.07
5.205.47
3.00
3.50
4.00
4.50
5.00
5.50
6.00
6.50
7.00
Nov-10
Dec-10
Jan-
11
Feb-1
1
Mar-1
1
Apr-1
1
May-1
1
Jun-
11
Jul-1
1
Aug-11
Sep-11
Oct-11
Nov-11
Dec-11
Jan-
12
Feb-1
2
Mar-1
2
Apr-1
2
May-1
2
Jun-
12
Jul-1
2
Aug-12
Sep-12
Oct-12
Developments in the Economy
In the first half of 2012 industrial production growth was relatively low (3%) and growth in exports and imports showed a marked slowdown. In the third quarter GDP growth fell to 1.6%, private consumption continued to contract for the third quarter, and investments showed a sharp fall compared to the previous year. In the third quarter private sector investments decreased by 11.1% and were partially offset by an 11% increase in public investments. Inflation (CPI) finally came down to 6.1% at year-end after climbing to more than 11% in April. This was largely due to low consumer demand and lower food prices. Until December the fall in inflation was not reflected in bank lending rates.
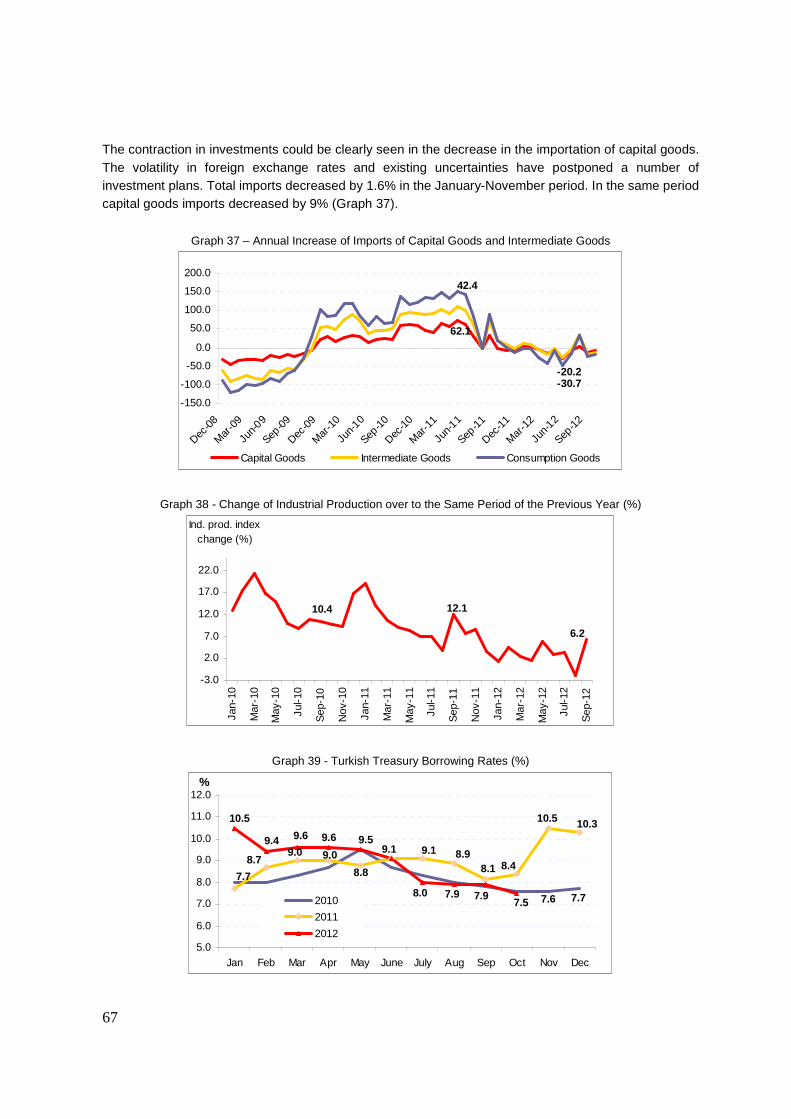
67
The contraction in investments could be clearly seen in the decrease in the importation of capital goods. The volatility in foreign exchange rates and existing uncertainties have postponed a number of investment plans. Total imports decreased by 1.6% in the January-November period. In the same period capital goods imports decreased by 9% (Graph 37).
Graph 37 – Annual Increase of Imports of Capital Goods and Intermediate Goods
62.1
-30.7
42.4
-20.2
-150.0
-100.0
-50.0
0.0
50.0
100.0
150.0
200.0
Dec-0
8
Mar
-09
Jun-
09
Sep-0
9
Dec-0
9
Mar
-10
Jun-
10
Sep-1
0
Dec-1
0
Mar
-11
Jun-
11
Sep-1
1
Dec-1
1
Mar
-12
Jun-
12
Sep-1
2
Capital Goods Intermediate Goods Consumption Goods
Graph 38 - Change of Industrial Production over to the Same Period of the Previous Year (%)
12.110.4
6.2
-3.0
2.0
7.0
12.0
17.0
22.0
Jan-
10
Mar
-10
May
-10
Jul-1
0
Sep
-10
Nov
-10
Jan-
11
Mar
-11
May
-11
Jul-1
1
Sep
-11
Nov
-11
Jan-
12
Mar
-12
May
-12
Jul-1
2
Sep
-12
Ind. prod. index change (%)
Graph 39 - Turkish Treasury Borrowing Rates (%)
7.77.6
10.310.5
8.48.18.99.19.1
8.8
9.09.08.7
7.7
9.6 9.5
7.98.07.5
9.6
10.5
9.4
7.9
5.0
6.0
7.0
8.0
9.0
10.0
11.0
12.0
Jan Feb Mar Apr May June July Aug Sep Oct Nov Dec
%
2010
2011
2012

68
A New Code of Obligations and a New Commercial Code
On 1 July 2012 the new Code of Obligations and the new Commercial Code came into effect. For a number of years Turkey waited for a new Commercial Code that would better address today’s needs. There was a lot of debate on the provisions of the new code. In response to some of the objections, some modifications were made in June. In particular one new rule, the requirement to have the spouse’s approval when underwriting an obligation, caused delays in some transactions both in the factoring and banking sectors.
The Implementation of Basel II
In line with previous announcements, the BRSA began the implementation of Basel II as of 1 July 2012. It is not clear whether this had any impact on factoring companies with respect to credits. The Increase in Bounced Checks As of March 2012, in all business circles where payments were made with checks, there was an apparent increase in the number of bounced checks. The Central Bank’s statistics confirmed the case. On 31 January 2012, the Check Legislation was modified so as to terminate the penalty of “imprisonment up to one year” and with administrative fines of between TL300 and TL3,000. Public opinion was that the increase in bounced checks was due to the termination of the prison sentence penalty, but the contraction of economic activities in some sectors may have been a contributing factor. By the end of November the number of bounced checks had increased by 92.5%, and bounced checks as a percentage of total checks had risen to more than 5%. On 9 April 2012, the Central Credit Registration Bureau initiated a new system permitting anyone (not only banks) to obtain information on the check payment record of any individual or corporation. Before accepting a check, one would have access to the “check report” and see the risks. This was obviously a good mechanism to prevent bad checks, but seemingly was not effective enough to address the problem. Graphs 40 and 41 illustrate the increase in bounced checks in 2012.
Table 71 – The Volume of the Bounced-Checks (Million TL)
2011 2012
January 563 1,213
February 511 1,040
March 534 920
April 376 1,289
May 728 1,179
June 598 865
July 464 1,764
August 718 1,470
September 1,147 1,135
October 931 2,086
November 1,005 1,623
Total 7,575 14,585 Source: CBT

69
Graph 40 – The Amount of Bounced Checks (Million TL)
0
500
1,000
1,500
2,000
2,500
Jan
Feb Mar
April
May
June Ju
ly
Augus
tSep O
ctNov Dec
2012
2011
2010
Graph 41 – The Ratio of the Bounced-Checks to the Total Volume of the Checks (%)
0.00
1.00
2.00
3.00
4.00
5.00
6.00
Jan
Feb MarApr
ilM
ayJu
ne July
Augus
tSep Oct
Nov Dec
2010 2011 2012
Source:CBT
Table 72 – Annual ratios of the Bounced- Checks
Volume Ratio of Bounced-Checks
(%)
Quantity Ratio of Bounced-Checks
(%)
2008 5.60 5.02
2009 7.66 6.83
2010 3.94 3.46
2011 2.71 2.91
Nov 2012 4.50 5.16 Source: CBT
According to Central Bank data, between 2009 and 2011 the number of bounced checks as a percentabe of total checks declined from 7.7% to 2.7%. In terms of value, the percentage declined from 6.8% to 2.9%. This trend reversed in 2012 when, in terms of value, the percentage reached 5.2%. Not all factoring companies would have been impacted by the deterioration in check payments, but certainly quite a number of companies must have encountered problems. Recent data shows a 41% annual increase in the volume of non-performing loans.
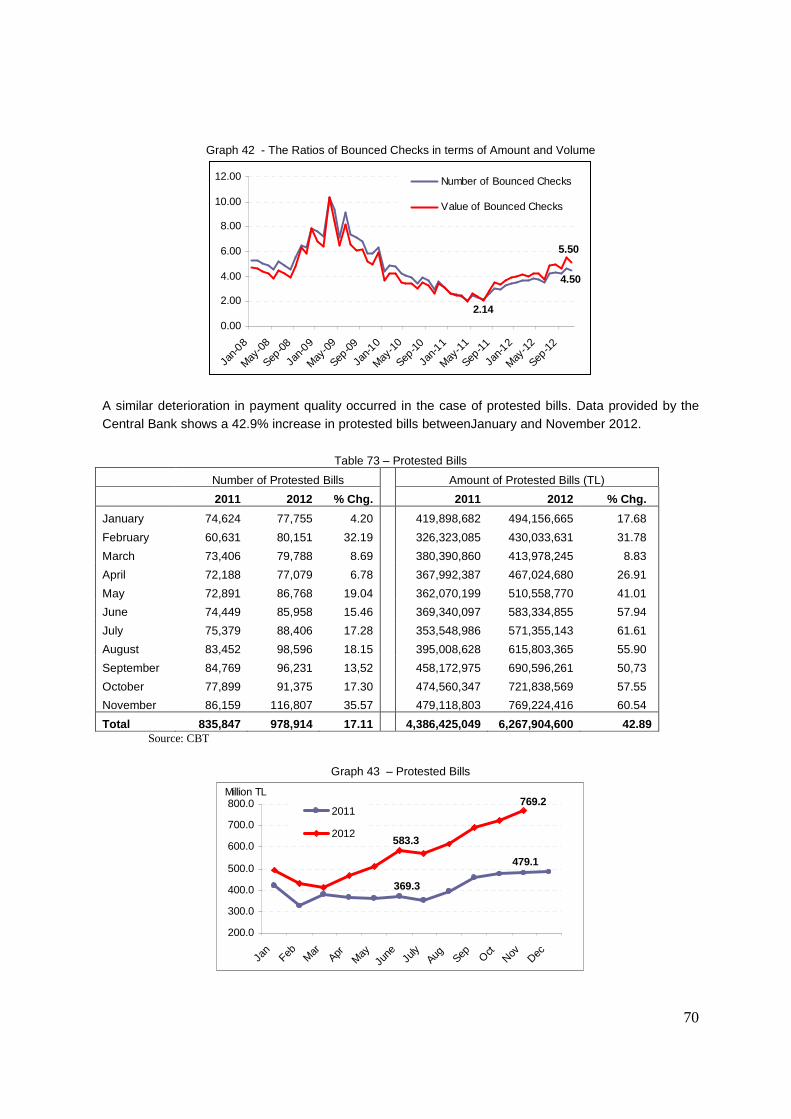
70
Graph 42 - The Ratios of Bounced Checks in terms of Amount and Volume
4.50
5.50
2.14
0.00
2.00
4.00
6.00
8.00
10.00
12.00
Jan-
08
May-0
8
Sep-08
Jan-
09
May-0
9
Sep-09
Jan-
10
May-1
0
Sep-10
Jan-
11
May-1
1
Sep-11
Jan-
12
May-1
2
Sep-12
Number of Bounced Checks
Value of Bounced Checks
A similar deterioration in payment quality occurred in the case of protested bills. Data provided by the Central Bank shows a 42.9% increase in protested bills betweenJanuary and November 2012.
Table 73 – Protested Bills
Number of Protested Bills Amount of Protested Bills (TL)
2011 2012 % Chg. 2011 2012 % Chg.
January 74,624 77,755 4.20 419,898,682 494,156,665 17.68
February 60,631 80,151 32.19 326,323,085 430,033,631 31.78
March 73,406 79,788 8.69 380,390,860 413,978,245 8.83
April 72,188 77,079 6.78 367,992,387 467,024,680 26.91
May 72,891 86,768 19.04 362,070,199 510,558,770 41.01
June 74,449 85,958 15.46 369,340,097 583,334,855 57.94
July 75,379 88,406 17.28 353,548,986 571,355,143 61.61
August 83,452 98,596 18.15 395,008,628 615,803,365 55.90
September 84,769 96,231 13,52 458,172,975 690,596,261 50,73
October 77,899 91,375 17.30 474,560,347 721,838,569 57.55
November 86,159 116,807 35.57 479,118,803 769,224,416 60.54
Total 835,847 978,914 17.11 4,386,425,049 6,267,90 4,600 42.89 Source: CBT
Graph 43 – Protested Bills
479.1
369.3
769.2
583.3
200.0
300.0
400.0
500.0
600.0
700.0
800.0
Jan
Feb Mar
AprMay
June Ju
lyAug Sep O
ctNov Dec
Million TL
2011
2012
71
10. GENERAL ASSESMENT AND OUTLOOK
This report covers the performance of the factoring industry in 2011 and presents a detailed analysis of the 74 factoring companies that were active in 2011. We have also covered year 2012 to the extent that data on economic developments impacting the industry was available. Factoring meets the financing requirements of SMEs and benefits from the wide use of check payments that is particular to Turkish companies. Moreover the factoring industry provides SMEs with the opportunity to outsource the collection of their receivables. The combination of the existence of very small companies responsible for 90% of Turkey’s production and the use of future dated checks provides the basis of demand for factoring services. Even with this strong demand, the factoring industry is a very competitive market. Competition increases by the year, reducing commissions to very thin margins. The outlook is nonetheless positive because there are two major areas with high growth potential. The first one is geographical expansion within Turkey. Factoring services are largely concentrated in and around Istanbul, leaving large untapped areas. The second growth potential is in export factoring. Thirdly, new products and services may be introduced. Demand for collection and guarantee services may increase. However, a sudden economic revival is not expected in 2013. GDP growth will remain low at around 3% to 4% and business opportunities for factoring companies can only develop in line with increasing economic activities. Briefly, the factoring industry in Turkey – with an annual growth pace of 8.0% in 2011 and 7.1% at the end of September 2012 – has lost its previous momentum. These recent growth rates are well below the growth rates of 34.5% and 39% in 2009 and 2010, respectively. Despite this trend, the industry has remained attractive to local and international investors as evidenced by the newcomers to the sector. Despite the slowdown in factoring volume, net income was up by 23.8% in 2011 (23.4% in 2009) and 33.5% at the end of September 2012. The net profit increase of the banking sector was lower (17%) in September 2012. The period 2007 through 2010, which was an adjustment period for all factoring companies to new BRSA regulations, coincided with very severe economic turbulence both in Turkey and globally. During these years, economic activity and investments exhibited tremendous volatility, and a number of factoring companies weakened financially. That adjustment period concluded in 2011, and the differences between the strengths and weakness of the companies were more discernible. It was possible to better differentiate the characteristics of the companies and sub-groups in the industry. The analysis showed that, although different from one another, each group had its own merits within given strategies. As a result of the rapid asset growth of the newly established factoring companies, it is fair to expect major changes in market shares in the next two years. The factoring industry reached a turnover volume of TL71 billion at the end of 2011. Representatives of the industry are targeting turnover of US$100.0 billion by 2015. This appears feasible in terms of raising the current 6% penetration rate to 10% as in the UK, Spain and Taiwan. There is no doubt that the new law will be instrumental in significantly upgrading the image and status of the factoring sector. Finally, legally certified as “non-bank financial institutions,” factoring companies have another period of adjustment ahead of them in which they will need to establish the Association of Leasing, Factoring and Financing Companies and set up the Central Registration Unit. They will need to convert their

72
representative offices into branches or close them. There will be additional injection of capital to quite a number of companies. Looking forward, 2013 will be a busy year for all. Sources:
- BRSA Reports and Statistics - Interviews with the members and representatives of the Factoring Association - Interviews with various sector representatives - Dünya Gazetesi - Hürriyet Daily dated December 13, 2012

73
ANNEX 1 - BRSA FACTORING DATA
The following tables were downloaded from the BRSA’s website pages on 3 March 2012.Revisions after this date have not been taken into consideration.
BALANCE SHEET (Million TL) ASSETS (Million TL)
2008 2009 2010 2011
1 CASH 10.6 4.61 10.57 9.46
2 FINANCIAL ASSETS AT FAIR VALUE CHANGE IS REFLECTED TO INCOME STATEMENT (Net) 39.89 73.42 13.22 9.41
3 A) Financial Assets Held for Trading 38.05 65.10 9.08 7.67
4 B) Financial Assets Where Fair value Change is Reflected to Income statement 0.76 0.23 0.33 0.22
5 C) Derivative Financial Assets held for Trading 1.07 8.09 3.81 1.53
6 BANKS 1,132.58 1,069.55 1,155.79 451.07
7 RECEIVABLES FROM REVERSE REEPURCHASE AGREEMENTS 7.42 0.00 0.06 0.00
8 FINANCIAL ASSETS AVAILABLE FOR SALE (Net) 55.80 186.87 286.31 273.90
9 FACTORING RECEIVABLES (10+14) 5,591.77 8,350.82 1 2,370.17 14,223.21
10 A) Discount Factoring Receivables (11+12-13) 2,845.77 3,846.15 5,507.53 6,822.09
11 a) Domestic 2,969.22 3,976.44 5,630.24 7,064.89
12 b) Foreign 0.00 0.00 26.11 4.53
13 c) Unearned Income (-) 123.44 130.29 148.83 247.34
14 B) Other Factoring receivables (15+16) 2,746.00 4,504.68 6,862.63 7,401.13
15 a) Domestic 2,294.09 4,081.98 5,885.01 6,037.64
16 b) Foreign 451.91 422.69 977.62 1,363.49
29 NON-PERFORMING RECEIVABLES 109.72 84.41 76.54 117.12
30 A) Non-Performing Factoring Receivables 510.13 522.34 525.00 561.13
33 D) Specific Provisions (-) 400.41 437.93 448.46 444.01
34 DERIVATIVE FINANCIAL ASSETS HELD FOR HEDGİNG 27.27 0.02 0.00 0.01
35 A) Fair Value Hedges 21.47 0.02 0.00 0.01
36 B) Cash Flow Hedges 5.80 0.00 0.00 0.00
37 C) Net Foreign Investment Hedging 0.00 0.00 0.00 0.00
38 INVESTMENTS HELD TO MATURITY (Net) 0.08 0.11 0.01 0.00
39 SUBSIDIARIES (Net) 97.95 81.49 93.16 99.36
40 AFFILIATES (Net) 433.62 329.28 202.23 158.75
41 JOINT VENTURES (Net) 0.00 0.00 0.00 0.00
42 TANGIBALE ASSETS (Net) 107.33 116.08 122.86 136.87
43 INTANGIBALE ASSETS (Net) (44+45) 7.88 6.86 7.32 10.93
44 A) Goodwill 0.80 0.00 0.00 0.00
45 B) Other 7.08 6.86 7.32 10.93
46 DEFERRED TAX ASSETS 16.01 35.89 56.92 62.38
47 ASSETS HELD FOR SALE PURPOSE AND HELD FROM TERMINATEDOPERATIONS (Net) 12.13 11.26 12.05 14.61
48 A) Held for Sale 12.13 11.26 12.05 14.61
49 B) Terminated Operations 0.00 0.00 0.00 0.00
50 OTHER ASSETS 113.43 56.38 59.52 77.01
51 TOTAL ASSETS 7,763.82 10,407.04 14,466.71 15,644.09

74
LIABILITIES (Million TL)
2008 2009 2010 2011
52 DERIVATIVE FINANCIAL LIABILITIES HELD FOR TRADING 2.08 2.87 9.51 48.62
53 LOANS AND BORROWINGS 4,943.78 7,499.22 11,095.97 11,463.64
54 FACTORING PAYABLES 154.61 111.27 74.97 196.12
55 LEASE PAYABLES (56+57+58-59) 2.21 2.69 2.80 2.16
56 A) Finance Lease Payables 2.60 3.27 3.23 2.43
57 B) Operational Lease Payables 0.00 0.00 0.00 0.00
58 C) Other 0.00 0.00 0.00 0.00
59 D) Deferred Financial Lease Expenses ( - ) 0.40 0.58 0.43 0.27
60 MARKETABLE SECURITIES ISSUED (Net) (61+62+63) 92.85 113.95 211.17 346.49
61 A) Bills 0.00 0.00 0.00 0.00
62 B) Asset Back Securities 0.00 0.00 0.00 0.00
63 C) Bonds 92.85 113.95 211.17 346.49
64 MISCELLANEAOUS PAYABLES 120.00 43.84 31.47 55.78
65 OTHER EXTERNAL RECOURCES 4.78 9.94 4.59 13.83
66 DERIVATIVE FINANCIAL LIABILITIES HELD FOR HEDGİNG (67+68+69) 6.07 0.00 0.02 0.00
67 A) Fair Value Hedges 1.93 0.00 0.00 0.00
68 B) Cash Flow Hedges 4.15 0.00 0.02 0.00
69 C) Net foreign Investment Hedging 0.00 0.00 0.00 0.00
70 TAXES PAYABLES AND OTHER LIABILITIES 33.40 48.11 39.66 41.92
71 PROVISIONS (72+73+74) 56.39 77.57 53.94 80.76
72 A) Provisions for Restructuring 0.00 0.03 0.19 0.14
73 B) Reserve for Employee Benefits 5.56 12.14 17.11 20.62
74 C) Other Reserves 50.83 65.40 36.64 60.00
75 DEFERRED TAX LIABILITIES 7.15 4.25 1.28 0.97
76 PAYAV-BLES RELATED TO ASSETS HELD FOR SALE PURPOSE AND HELD FROM TERMINATED OPERATIONS (Net) (77+78) 0.00 0.00 0.03 0.09
77 A) Held for Sale 0.00 0.00 0.03 0.09
78 B) Terminated Operations 0.00 0.00 0.00 0.00
79 SUBORDINATED LOANS 0.00 0.00 0.00 0.00
80 SHAREHOLDERS’ EQUITY (81+82+91+96) 2,340.50 2,493.33 2,941.30 3,393.71
81 A) Paid-in Capital 1,030.03 1,026.35 1,090.50 1,279.63
82 B) Capital Reserves (83+84+85+86+87+88+89+90) 99.14 285.06 262.54 300.67
83 a) Share Premium 0.00 0.00 16.41 29.61
84 b) Share Cancellation Profits 0.00 0.00 0.00 0.00
85 c) Valuation Changes of Marketable Securities -1.06 48.94 78.62 56.71
86 d) Revaluation Changes of Property and Equipment 0.79 10.33 7.84 20.81
87 e) Free Share from Investment and Associates, Subsidiaries and Joint Ventures 50.40 35.14 35.58 36.03
88 f) Hedging Funds (Active part) 0.00 0.00 0.00 0.00
89 g) Value increase in Property and Equipment Held for sale Purpose and Held from Terminated Operations 0.00 0.00 0.00 0.00
90 h) Other Capital Reserves 49.01 190.65 124.08 157.51
91 C) Profit Reserves (92+93+94+95) 694.25 750.85 1,068.07 1,293.21
92 a) Legal Reserves 91.87 103.49 118.07 133.98
93 b) Status Reserves 10.06 10.48 38.36 1.01
94 c) Extraordinary Reserves 397.95 263.96 533.95 716.31
95 d) Other Profit Reserves 194.38 372.92 377.69 441.92
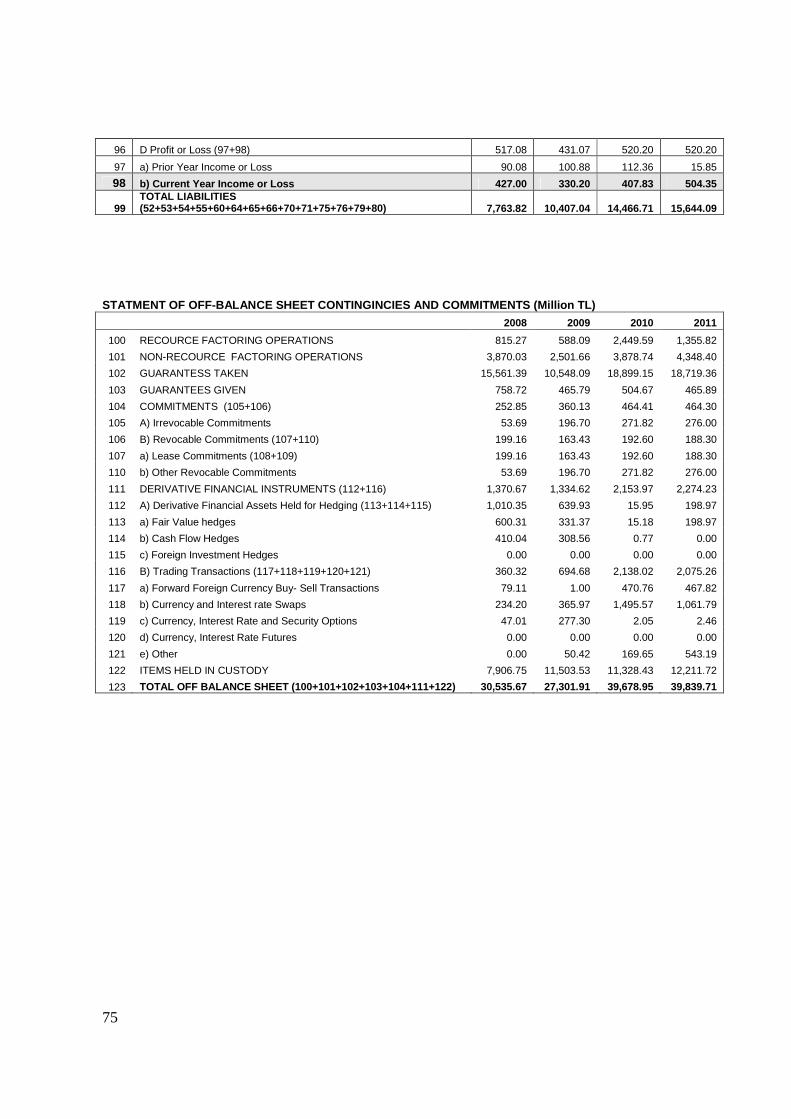
75
96 D Profit or Loss (97+98) 517.08 431.07 520.20 520.20
97 a) Prior Year Income or Loss 90.08 100.88 112.36 15.85
98 b) Current Year Income or Loss 427.00 330.20 407.83 504.35
99 TOTAL LIABILITIES (52+53+54+55+60+64+65+66+70+71+75+76+79+80) 7,763.82 10,407.04 14,466.71 15,644.09
STATMENT OF OFF-BALANCE SHEET CONTINGINCIES AND COM MITMENTS (Million TL)
2008 2009 2010 2011
100 RECOURCE FACTORING OPERATIONS 815.27 588.09 2,449.59 1,355.82
101 NON-RECOURCE FACTORING OPERATIONS 3,870.03 2,501.66 3,878.74 4,348.40
102 GUARANTESS TAKEN 15,561.39 10,548.09 18,899.15 18,719.36
103 GUARANTEES GIVEN 758.72 465.79 504.67 465.89
104 COMMITMENTS (105+106) 252.85 360.13 464.41 464.30
105 A) Irrevocable Commitments 53.69 196.70 271.82 276.00
106 B) Revocable Commitments (107+110) 199.16 163.43 192.60 188.30
107 a) Lease Commitments (108+109) 199.16 163.43 192.60 188.30
110 b) Other Revocable Commitments 53.69 196.70 271.82 276.00
111 DERIVATIVE FINANCIAL INSTRUMENTS (112+116) 1,370.67 1,334.62 2,153.97 2,274.23
112 A) Derivative Financial Assets Held for Hedging (113+114+115) 1,010.35 639.93 15.95 198.97
113 a) Fair Value hedges 600.31 331.37 15.18 198.97
114 b) Cash Flow Hedges 410.04 308.56 0.77 0.00
115 c) Foreign Investment Hedges 0.00 0.00 0.00 0.00
116 B) Trading Transactions (117+118+119+120+121) 360.32 694.68 2,138.02 2,075.26
117 a) Forward Foreign Currency Buy- Sell Transactions 79.11 1.00 470.76 467.82
118 b) Currency and Interest rate Swaps 234.20 365.97 1,495.57 1,061.79
119 c) Currency, Interest Rate and Security Options 47.01 277.30 2.05 2.46
120 d) Currency, Interest Rate Futures 0.00 0.00 0.00 0.00
121 e) Other 0.00 50.42 169.65 543.19
122 ITEMS HELD IN CUSTODY 7,906.75 11,503.53 11,328.43 12,211.72
123 TOTAL OFF BALANCE SHEET (100+101+102+103+104+111+12 2) 30,535.67 27,301.91 39,678.95 39,839.71
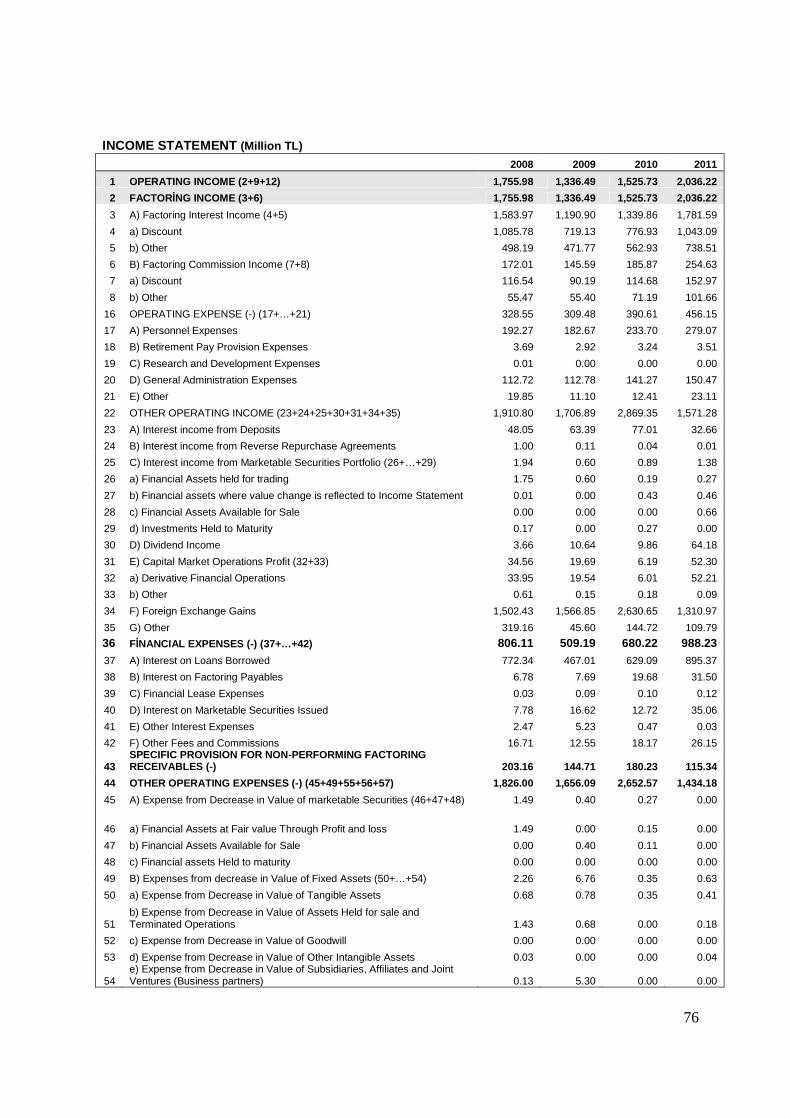
76
INCOME STATEMENT (Million TL) 2008 2009 2010 2011
1 OPERATING INCOME (2+9+12) 1,755.98 1,336.49 1,525.73 2,036.22
2 FACTORİNG INCOME (3+6) 1,755.98 1,336.49 1,525.73 2,036.22
3 A) Factoring Interest Income (4+5) 1,583.97 1,190.90 1,339.86 1,781.59
4 a) Discount 1,085.78 719.13 776.93 1,043.09
5 b) Other 498.19 471.77 562.93 738.51
6 B) Factoring Commission Income (7+8) 172.01 145.59 185.87 254.63
7 a) Discount 116.54 90.19 114.68 152.97
8 b) Other 55.47 55.40 71.19 101.66
16 OPERATING EXPENSE (-) (17+…+21) 328.55 309.48 390.61 456.15
17 A) Personnel Expenses 192.27 182.67 233.70 279.07
18 B) Retirement Pay Provision Expenses 3.69 2.92 3.24 3.51
19 C) Research and Development Expenses 0.01 0.00 0.00 0.00
20 D) General Administration Expenses 112.72 112.78 141.27 150.47
21 E) Other 19.85 11.10 12.41 23.11
22 OTHER OPERATING INCOME (23+24+25+30+31+34+35) 1,910.80 1,706.89 2,869.35 1,571.28
23 A) Interest income from Deposits 48.05 63.39 77.01 32.66
24 B) Interest income from Reverse Repurchase Agreements 1.00 0.11 0.04 0.01
25 C) Interest income from Marketable Securities Portfolio (26+…+29) 1.94 0.60 0.89 1.38
26 a) Financial Assets held for trading 1.75 0.60 0.19 0.27
27 b) Financial assets where value change is reflected to Income Statement 0.01 0.00 0.43 0.46
28 c) Financial Assets Available for Sale 0.00 0.00 0.00 0.66
29 d) Investments Held to Maturity 0.17 0.00 0.27 0.00
30 D) Dividend Income 3.66 10.64 9.86 64.18
31 E) Capital Market Operations Profit (32+33) 34.56 19.69 6.19 52.30
32 a) Derivative Financial Operations 33.95 19.54 6.01 52.21
33 b) Other 0.61 0.15 0.18 0.09
34 F) Foreign Exchange Gains 1,502.43 1,566.85 2,630.65 1,310.97
35 G) Other 319.16 45.60 144.72 109.79
36 FİNANCIAL EXPENSES (-) (37+…+42) 806.11 509.19 680.22 988.23 37 A) Interest on Loans Borrowed 772.34 467.01 629.09 895.37
38 B) Interest on Factoring Payables 6.78 7.69 19.68 31.50
39 C) Financial Lease Expenses 0.03 0.09 0.10 0.12
40 D) Interest on Marketable Securities Issued 7.78 16.62 12.72 35.06
41 E) Other Interest Expenses 2.47 5.23 0.47 0.03
42 F) Other Fees and Commissions 16.71 12.55 18.17 26.15
43 SPECIFIC PROVISION FOR NON-PERFORMING FACTORING RECEIVABLES (-) 203.16 144.71 180.23 115.34
44 OTHER OPERATING EXPENSES (-) (45+49+55+56+57) 1,826.00 1,656.09 2,652.57 1,434.18
45 A) Expense from Decrease in Value of marketable Securities (46+47+48) 1.49 0.40 0.27 0.00
46 a) Financial Assets at Fair value Through Profit and loss 1.49 0.00 0.15 0.00
47 b) Financial Assets Available for Sale 0.00 0.40 0.11 0.00
48 c) Financial assets Held to maturity 0.00 0.00 0.00 0.00
49 B) Expenses from decrease in Value of Fixed Assets (50+…+54) 2.26 6.76 0.35 0.63
50 a) Expense from Decrease in Value of Tangible Assets 0.68 0.78 0.35 0.41
51 b) Expense from Decrease in Value of Assets Held for sale and Terminated Operations 1.43 0.68 0.00 0.18
52 c) Expense from Decrease in Value of Goodwill 0.00 0.00 0.00 0.00
53 d) Expense from Decrease in Value of Other Intangible Assets 0.03 0.00 0.00 0.04
54 e) Expense from Decrease in Value of Subsidiaries, Affiliates and Joint Ventures (Business partners) 0.13 5.30 0.00 0.00
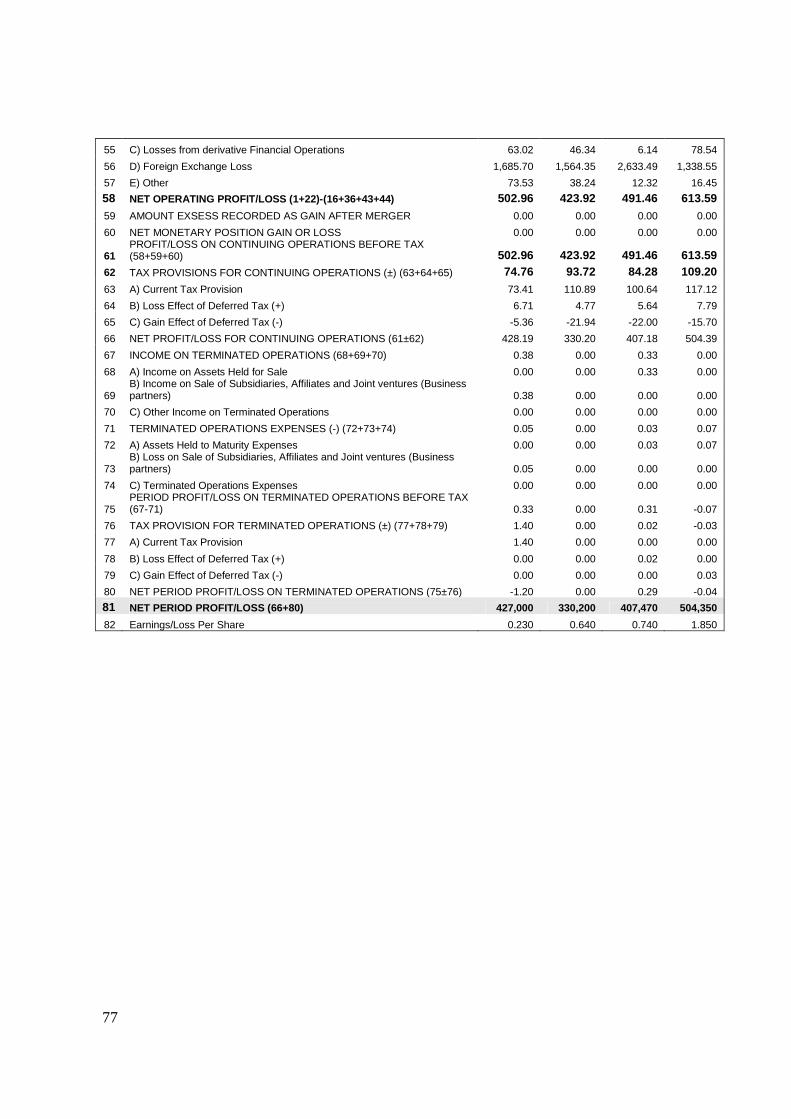
77
55 C) Losses from derivative Financial Operations 63.02 46.34 6.14 78.54
56 D) Foreign Exchange Loss 1,685.70 1,564.35 2,633.49 1,338.55
57 E) Other 73.53 38.24 12.32 16.45
58 NET OPERATING PROFIT/LOSS (1+22)-(16+36+43+44) 502.96 423.92 491.46 613.59 59 AMOUNT EXSESS RECORDED AS GAIN AFTER MERGER 0.00 0.00 0.00 0.00
60 NET MONETARY POSITION GAIN OR LOSS 0.00 0.00 0.00 0.00
61 PROFIT/LOSS ON CONTINUING OPERATIONS BEFORE TAX (58+59+60) 502.96 423.92 491.46 613.59
62 TAX PROVISIONS FOR CONTINUING OPERATIONS (±) (63+64+65) 74.76 93.72 84.28 109.20 63 A) Current Tax Provision 73.41 110.89 100.64 117.12
64 B) Loss Effect of Deferred Tax (+) 6.71 4.77 5.64 7.79
65 C) Gain Effect of Deferred Tax (-) -5.36 -21.94 -22.00 -15.70
66 NET PROFIT/LOSS FOR CONTINUING OPERATIONS (61±62) 428.19 330.20 407.18 504.39
67 INCOME ON TERMINATED OPERATIONS (68+69+70) 0.38 0.00 0.33 0.00
68 A) Income on Assets Held for Sale 0.00 0.00 0.33 0.00
69 B) Income on Sale of Subsidiaries, Affiliates and Joint ventures (Business partners) 0.38 0.00 0.00 0.00
70 C) Other Income on Terminated Operations 0.00 0.00 0.00 0.00
71 TERMINATED OPERATIONS EXPENSES (-) (72+73+74) 0.05 0.00 0.03 0.07
72 A) Assets Held to Maturity Expenses 0.00 0.00 0.03 0.07
73 B) Loss on Sale of Subsidiaries, Affiliates and Joint ventures (Business partners) 0.05 0.00 0.00 0.00
74 C) Terminated Operations Expenses 0.00 0.00 0.00 0.00
75 PERIOD PROFIT/LOSS ON TERMINATED OPERATIONS BEFORE TAX (67-71) 0.33 0.00 0.31 -0.07
76 TAX PROVISION FOR TERMINATED OPERATIONS (±) (77+78+79) 1.40 0.00 0.02 -0.03
77 A) Current Tax Provision 1.40 0.00 0.00 0.00
78 B) Loss Effect of Deferred Tax (+) 0.00 0.00 0.02 0.00
79 C) Gain Effect of Deferred Tax (-) 0.00 0.00 0.00 0.03
80 NET PERIOD PROFIT/LOSS ON TERMINATED OPERATIONS (75±76) -1.20 0.00 0.29 -0.04
81 NET PERIOD PROFIT/LOSS (66+80) 427,000 330,200 407,470 504,350
82 Earnings/Loss Per Share 0.230 0.640 0.740 1.850

78
Sector Turnover Distribution (1,000 TL)
2010 2011 % Chg.
1 Agriculture, Hunting, Forest Products 818,426 1,283,092 56.78
2 Fishing 61,741 30,667 -50.33
3 Total Agriculture (1+2) 880,167 1,313,759 49.26
4 Extracting of Mines Product Energy 4,676,700 400,688 -91.43
5 Extracting of Mines Not Product Energy 9,490,135 2,108,620 -77.78
6 Food, Beverage and Tobacco Industry 1,940,433 2,585,853 33.26
7 Textile and Textile Products Industry 5,355,675 7,147,104 33.45
8 Leather and Leather Products Industry 251,949 342,578 35.97
9 Wood and Wood Products Industry 679,797 654,665 -3.70
10 Paper Raw Materials and Paper Products Industry 2,292,278 2,014,985 -12.10
11 Nuclear Fuel and Refined Petroleum and Coke Coal Ind. 14,965,781 4,954,684 -66.89
12 Chemical Products Industry 1,481,286 1,736,112 17.20
13 Rubber and Plastic Products Industry 991,102 1,559,349 57.33
14 Other Mines Excluding Metal Industry 2,040,604 2,255,903 10.55
15 Main Metal Industry 3,553,549 5,168,642 45.45
16 Machine and Equipment Industry 2,455,777 3,129,340 27.43
17 Electrical and Optical Devices Industry 1,437,644 1,202,256 -16.37
18 Transportation Vehicles Industry 2,536,760 4,523,949 78.34
19 Manufacturing Industry Not Classified In Another Places 1,467,060 2,504,951 70.75
20 Electric, Gas and Water Resources 2,016,178 2,855,801 41.64
21 Total Manufacturing (4+…+20) 57,632,708 45,145,480 -21.67
22 Construction 5,872,077 7,098,540 20.89
23 Wholesale and Retail Trade, Motor Vehicles Services 2,874,365 6,508,514 126.43
24 Hotels and Restaurants (Tourism) 998,588 795,276 -20.36
25 Transportation, Warehousing and Communication 2,413,481 2,300,472 -4.68
26 Financial Intermediation 1,368,765 1,563,459 14.22
27 a) Financial Institutions 1,184,862 1,440,062 21.54
28 b) Other Financial Intermediation 183,903 123,397 -32.90
29 Real Estate Brokerage 475,961 1,313,718 176.01
30 Defense and Public Administration And Social Security Institutions 6,788 10,280 51.44
31 Education 70,100 64,258 -8.33
32 Health and Social Services 505,522 713,344 41.11
33 Other Social and Personal Services 1,704,451 3,214,463 88.59
34 Private Person Employing Worker 50,627 42,475 -16.10
35 International Organizations and Institutions 311 1,823 486.17
36 Total Services (22+…+35) - (27+28) 16,341,036 23,626,622 44.58
37 OTHER 881,650 627,667 -28.81
38 GENERAL TOTAL (3+21+36+37) 75,735,561 70,713,528 -6.63
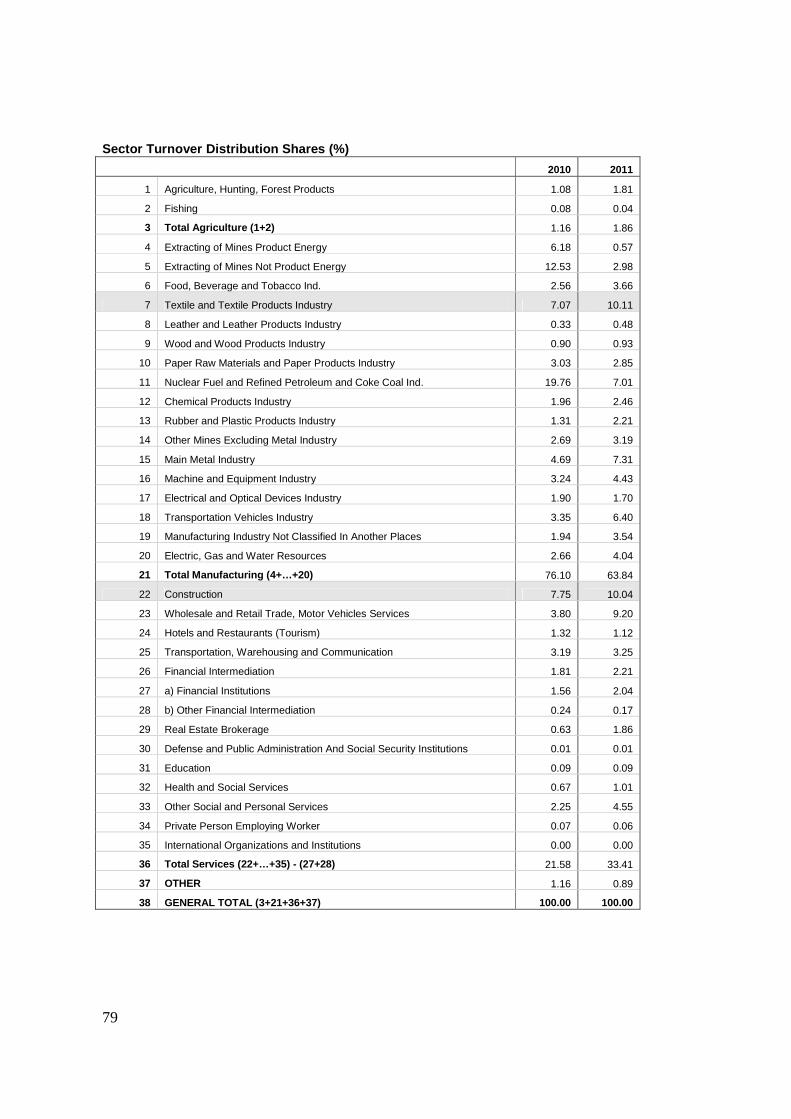
79
Sector Turnover Distribution Shares (%)
2010 2011
1 Agriculture, Hunting, Forest Products 1.08 1.81
2 Fishing 0.08 0.04
3 Total Agriculture (1+2) 1.16 1.86
4 Extracting of Mines Product Energy 6.18 0.57
5 Extracting of Mines Not Product Energy 12.53 2.98
6 Food, Beverage and Tobacco Ind. 2.56 3.66
7 Textile and Textile Products Industry 7.07 10.11
8 Leather and Leather Products Industry 0.33 0.48
9 Wood and Wood Products Industry 0.90 0.93
10 Paper Raw Materials and Paper Products Industry 3.03 2.85
11 Nuclear Fuel and Refined Petroleum and Coke Coal Ind. 19.76 7.01
12 Chemical Products Industry 1.96 2.46
13 Rubber and Plastic Products Industry 1.31 2.21
14 Other Mines Excluding Metal Industry 2.69 3.19
15 Main Metal Industry 4.69 7.31
16 Machine and Equipment Industry 3.24 4.43
17 Electrical and Optical Devices Industry 1.90 1.70
18 Transportation Vehicles Industry 3.35 6.40
19 Manufacturing Industry Not Classified In Another Places 1.94 3.54
20 Electric, Gas and Water Resources 2.66 4.04
21 Total Manufacturing (4+…+20) 76.10 63.84
22 Construction 7.75 10.04
23 Wholesale and Retail Trade, Motor Vehicles Services 3.80 9.20
24 Hotels and Restaurants (Tourism) 1.32 1.12
25 Transportation, Warehousing and Communication 3.19 3.25
26 Financial Intermediation 1.81 2.21
27 a) Financial Institutions 1.56 2.04
28 b) Other Financial Intermediation 0.24 0.17
29 Real Estate Brokerage 0.63 1.86
30 Defense and Public Administration And Social Security Institutions 0.01 0.01
31 Education 0.09 0.09
32 Health and Social Services 0.67 1.01
33 Other Social and Personal Services 2.25 4.55
34 Private Person Employing Worker 0.07 0.06
35 International Organizations and Institutions 0.00 0.00
36 Total Services (22+…+35) - (27+28) 21.58 33.41
37 OTHER 1.16 0.89
38 GENERAL TOTAL (3+21+36+37) 100.00 100.00
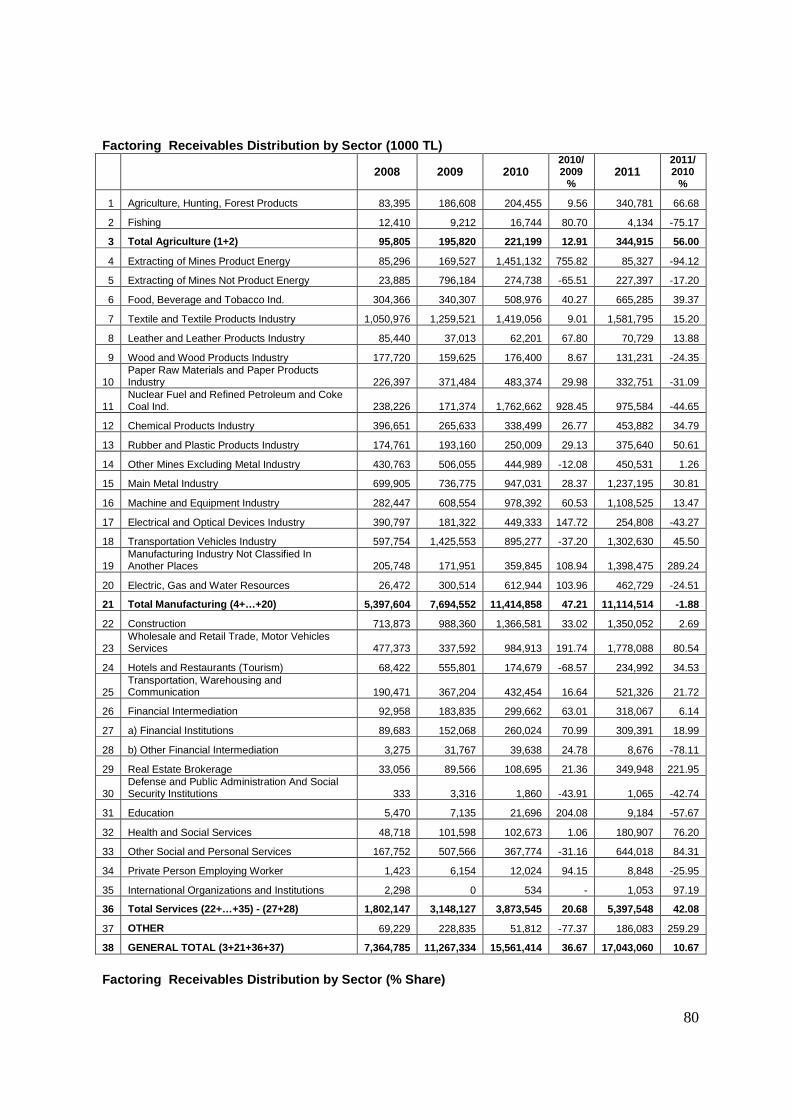
80
Factoring Receivables Distribution by Sector (1000 TL)
2008 2009 2010
2010/ 2009
% 2011
2011/ 2010
%
1 Agriculture, Hunting, Forest Products 83,395 186,608 204,455 9.56 340,781 66.68
2 Fishing 12,410 9,212 16,744 80.70 4,134 -75.17
3 Total Agriculture (1+2) 95,805 195,820 221,199 12.91 344,915 56.00
4 Extracting of Mines Product Energy 85,296 169,527 1,451,132 755.82 85,327 -94.12
5 Extracting of Mines Not Product Energy 23,885 796,184 274,738 -65.51 227,397 -17.20
6 Food, Beverage and Tobacco Ind. 304,366 340,307 508,976 40.27 665,285 39.37
7 Textile and Textile Products Industry 1,050,976 1,259,521 1,419,056 9.01 1,581,795 15.20
8 Leather and Leather Products Industry 85,440 37,013 62,201 67.80 70,729 13.88
9 Wood and Wood Products Industry 177,720 159,625 176,400 8.67 131,231 -24.35
10 Paper Raw Materials and Paper Products Industry 226,397 371,484 483,374 29.98 332,751 -31.09
11 Nuclear Fuel and Refined Petroleum and Coke Coal Ind. 238,226 171,374 1,762,662 928.45 975,584 -44.65
12 Chemical Products Industry 396,651 265,633 338,499 26.77 453,882 34.79
13 Rubber and Plastic Products Industry 174,761 193,160 250,009 29.13 375,640 50.61
14 Other Mines Excluding Metal Industry 430,763 506,055 444,989 -12.08 450,531 1.26
15 Main Metal Industry 699,905 736,775 947,031 28.37 1,237,195 30.81
16 Machine and Equipment Industry 282,447 608,554 978,392 60.53 1,108,525 13.47
17 Electrical and Optical Devices Industry 390,797 181,322 449,333 147.72 254,808 -43.27
18 Transportation Vehicles Industry 597,754 1,425,553 895,277 -37.20 1,302,630 45.50
19 Manufacturing Industry Not Classified In Another Places 205,748 171,951 359,845 108.94 1,398,475 289.24
20 Electric, Gas and Water Resources 26,472 300,514 612,944 103.96 462,729 -24.51
21 Total Manufacturing (4+…+20) 5,397,604 7,694,552 11,414,858 47.21 11,114,514 -1.88
22 Construction 713,873 988,360 1,366,581 33.02 1,350,052 2.69
23 Wholesale and Retail Trade, Motor Vehicles Services 477,373 337,592 984,913 191.74 1,778,088 80.54
24 Hotels and Restaurants (Tourism) 68,422 555,801 174,679 -68.57 234,992 34.53
25 Transportation, Warehousing and Communication 190,471 367,204 432,454 16.64 521,326 21.72
26 Financial Intermediation 92,958 183,835 299,662 63.01 318,067 6.14
27 a) Financial Institutions 89,683 152,068 260,024 70.99 309,391 18.99
28 b) Other Financial Intermediation 3,275 31,767 39,638 24.78 8,676 -78.11
29 Real Estate Brokerage 33,056 89,566 108,695 21.36 349,948 221.95
30 Defense and Public Administration And Social Security Institutions 333 3,316 1,860 -43.91 1,065 -42.74
31 Education 5,470 7,135 21,696 204.08 9,184 -57.67
32 Health and Social Services 48,718 101,598 102,673 1.06 180,907 76.20
33 Other Social and Personal Services 167,752 507,566 367,774 -31.16 644,018 84.31
34 Private Person Employing Worker 1,423 6,154 12,024 94.15 8,848 -25.95
35 International Organizations and Institutions 2,298 0 534 - 1,053 97.19
36 Total Services (22+…+35) - (27+28) 1,802,147 3,148,127 3,873,545 20.68 5,397,548 42.08
37 OTHER 69,229 228,835 51,812 -77.37 186,083 259.29
38 GENERAL TOTAL (3+21+36+37) 7,364,785 11,267,334 15,561,414 36.67 17,043,060 10.67
Factoring Receivables Distribution by Sector (% Sh are)

81
2008 2009 2010 2011
1 Agriculture, Hunting, Forest Products
2 Fishing
3 Total Agriculture (1+2) 0.01 0.02 0.01 2.02
4 Extracting of Mines Product Energy 1.16 1.50 9.33 0.50
5 Extracting of Mines Not Product Energy 0.32 7.05 1.77 1.33
6 Food, Beverage and Tobacco Ind. 4.13 3.10 3.27 3.90
7 Textile and Textile Products Industry 14.27 11.28 9.12 9.28
8 Leather and Leather Products Industry 1.16 0.33 0.40 0.42
9 Wood and Wood Products Industry 2.41 1.42 1.13 0.77
10 Paper Raw Materials and Paper Products Industry 3.07 3.29 3.11 1.95
11 Nuclear Fuel and Refined Petroleum and Coke Coal Ind. 3.23 1.52 11.33 5.72
12 Chemical Products Industry 5.39 2.36 2.18 2.66
13 Rubber and Plastic Products Industry 2.37 1.71 1.61 2.20
14 Other Mines Excluding Metal Industry 5.85 4.48 2.86 2.64
15 Main Metal Industry 9.50 6.53 6.09 7.26
16 Machine and Equipment Industry 3.84 5.39 6.29 6.50
17 Electrical and Optical Devices Industry 5.31 1.61 2.89 1.50
18 Transportation Vehicles Industry 8.12 12.62 5.75 7.64
19 Manufacturing Industry Not Classified In Another Places 2.79 1.52 2.31 8.21
20 Electric, Gas and Water Resources 0.36 2.66 3.94 2.72
21 Total Manufacturing (4+…+20) 0.73 0.68 0.73 65.21
22 Construction 9.69 8.75 8.78 7.92
23 Wholesale and Retail Trade, Motor Vehicles Services 6.48 2.99 6.33 10.43
24 Hotels and Restaurants (Tourism) 0.93 4.92 1.12 1.38
25 Transportation, Warehousing and Communication 2.59 3.26 2.78 3.06
26 Financial Intermediation 1.26 1.63 1.93 1.87
27 a) Financial Institutions 1.22 1.35 1.67 1.82
28 b) Other Financial Intermediation 0.04 0.28 0.25 0.05
29 Real Estate Brokerage 0.45 0.79 0.70 2.05
30 Defense and Public Administration And Social Security Institutions 0.00 0.03 0.01 0.01
31 Education 0.07 0.06 0.14 0.05
32 Health and Social Services 0.66 0.90 0.66 1.06
33 Other Social and Personal Services 2.28 4.49 2.36 3.78
34 Private Person Employing Worker 0.02 0.05 0.08 0.05
35 International Organizations and Institutions 0.03 0.00 0.00 0.01
36 Total Services (22+…+35) - (27+28) 24.47 27.88 24.89 31.67
37 OTHER 0.94 2.03 0.33 1.09
38 GENERAL TOTAL (3+21+36+37) 100.00 100.00 100.00 100.00
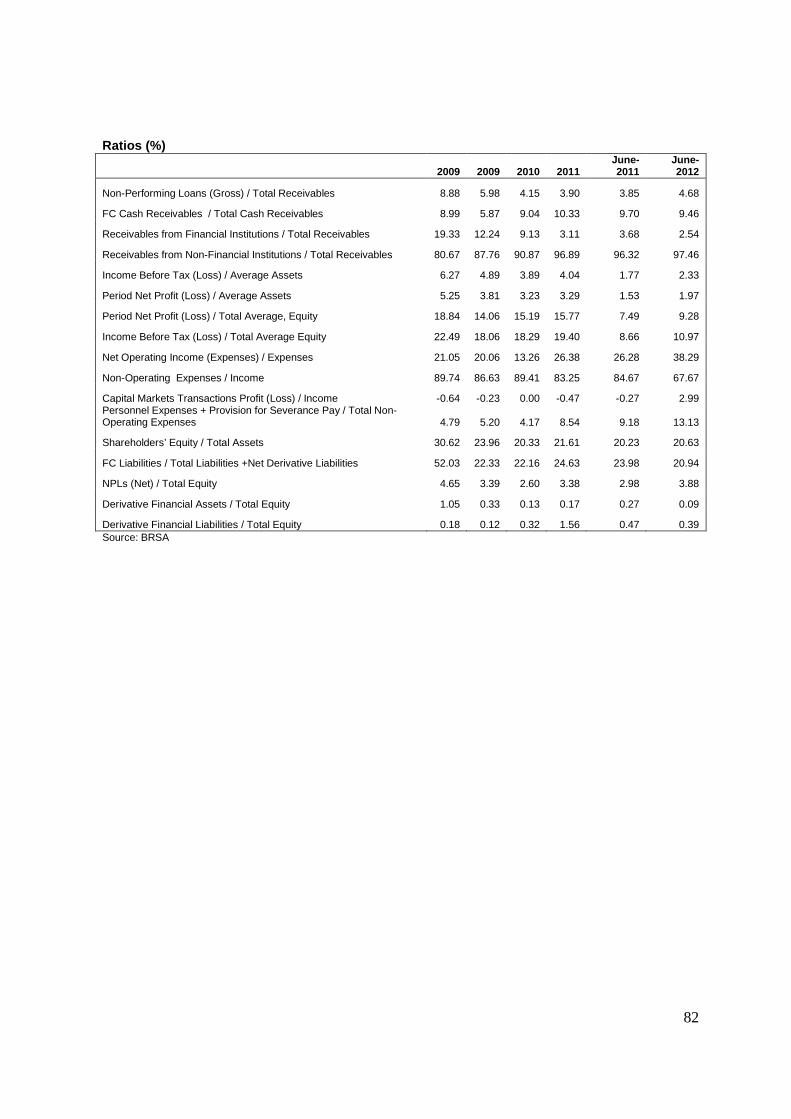
82
Ratios (%)
2009 2009 2010 2011 June-2011
June-2012
Non-Performing Loans (Gross) / Total Receivables 8.88 5.98 4.15 3.90 3.85 4.68
FC Cash Receivables / Total Cash Receivables 8.99 5.87 9.04 10.33 9.70 9.46
Receivables from Financial Institutions / Total Receivables 19.33 12.24 9.13 3.11 3.68 2.54
Receivables from Non-Financial Institutions / Total Receivables 80.67 87.76 90.87 96.89 96.32 97.46
Income Before Tax (Loss) / Average Assets 6.27 4.89 3.89 4.04 1.77 2.33
Period Net Profit (Loss) / Average Assets 5.25 3.81 3.23 3.29 1.53 1.97
Period Net Profit (Loss) / Total Average, Equity 18.84 14.06 15.19 15.77 7.49 9.28
Income Before Tax (Loss) / Total Average Equity 22.49 18.06 18.29 19.40 8.66 10.97
Net Operating Income (Expenses) / Expenses 21.05 20.06 13.26 26.38 26.28 38.29
Non-Operating Expenses / Income 89.74 86.63 89.41 83.25 84.67 67.67
Capital Markets Transactions Profit (Loss) / Income -0.64 -0.23 0.00 -0.47 -0.27 2.99 Personnel Expenses + Provision for Severance Pay / Total Non-Operating Expenses 4.79 5.20 4.17 8.54 9.18 13.13
Shareholders’ Equity / Total Assets 30.62 23.96 20.33 21.61 20.23 20.63
FC Liabilities / Total Liabilities +Net Derivative Liabilities 52.03 22.33 22.16 24.63 23.98 20.94
NPLs (Net) / Total Equity 4.65 3.39 2.60 3.38 2.98 3.88
Derivative Financial Assets / Total Equity 1.05 0.33 0.13 0.17 0.27 0.09
Derivative Financial Liabilities / Total Equity 0.18 0.12 0.32 1.56 0.47 0.39 Source: BRSA
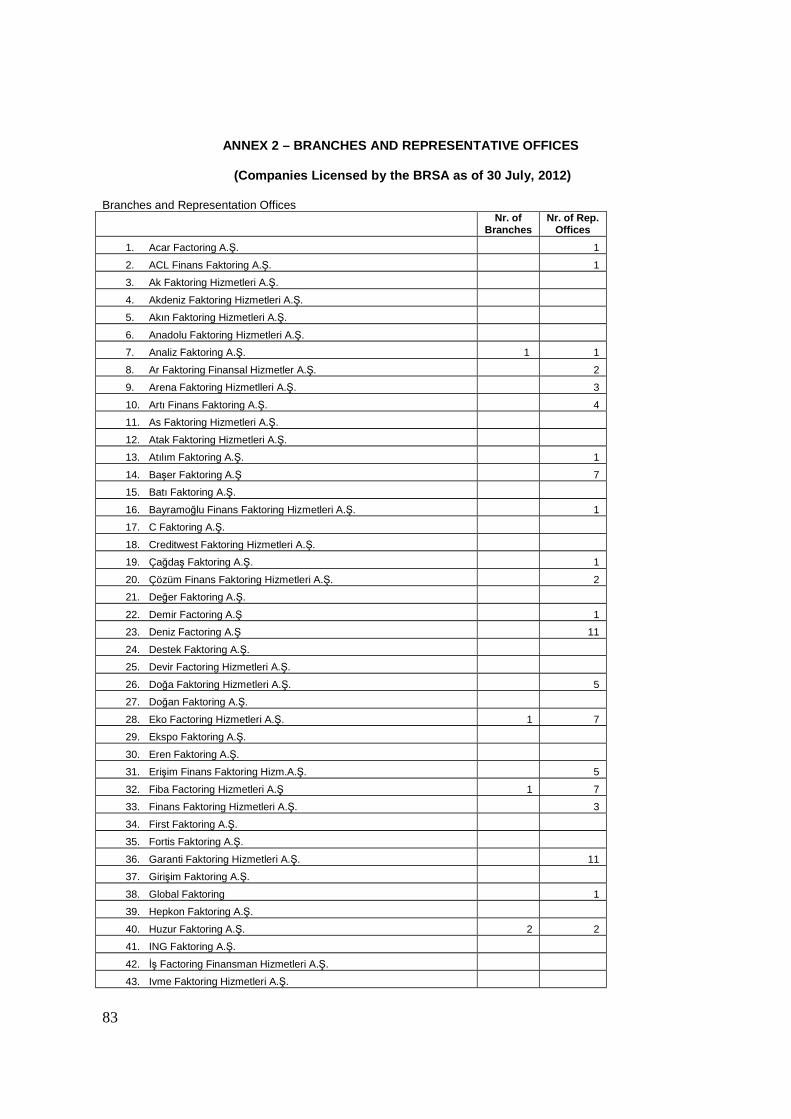
83
ANNEX 2 – BRANCHES AND REPRESENTATIVE OFFICES
(Companies Licensed by the BRSA as of 30 July, 201 2) Branches and Representation Offices
Nr. of
Branches Nr. of Rep.
Offices
1. Acar Factoring A.Ş. 1
2. ACL Finans Faktoring A.Ş. 1
3. Ak Faktoring Hizmetleri A.Ş.
4. Akdeniz Faktoring Hizmetleri A.Ş.
5. Akın Faktoring Hizmetleri A.Ş.
6. Anadolu Faktoring Hizmetleri A.Ş.
7. Analiz Faktoring A.Ş. 1 1
8. Ar Faktoring Finansal Hizmetler A.Ş. 2
9. Arena Faktoring Hizmetlleri A.Ş. 3
10. Artı Finans Faktoring A.Ş. 4
11. As Faktoring Hizmetleri A.Ş.
12. Atak Faktoring Hizmetleri A.Ş.
13. Atılım Faktoring A.Ş. 1
14. Başer Faktoring A.Ş 7
15. Batı Faktoring A.Ş.
16. Bayramoğlu Finans Faktoring Hizmetleri A.Ş. 1
17. C Faktoring A.Ş.
18. Creditwest Faktoring Hizmetleri A.Ş.
19. Çağdaş Faktoring A.Ş. 1
20. Çözüm Finans Faktoring Hizmetleri A.Ş. 2
21. Değer Faktoring A.Ş.
22. Demir Factoring A.Ş 1
23. Deniz Factoring A.Ş 11
24. Destek Faktoring A.Ş.
25. Devir Factoring Hizmetleri A.Ş.
26. Doğa Faktoring Hizmetleri A.Ş. 5
27. Doğan Faktoring A.Ş.
28. Eko Factoring Hizmetleri A.Ş. 1 7
29. Ekspo Faktoring A.Ş.
30. Eren Faktoring A.Ş.
31. Erişim Finans Faktoring Hizm.A.Ş. 5
32. Fiba Factoring Hizmetleri A.Ş 1 7
33. Finans Faktoring Hizmetleri A.Ş. 3
34. First Faktoring A.Ş.
35. Fortis Faktoring A.Ş.
36. Garanti Faktoring Hizmetleri A.Ş. 11
37. Girişim Faktoring A.Ş.
38. Global Faktoring 1
39. Hepkon Faktoring A.Ş.
40. Huzur Faktoring A.Ş. 2 2
41. ING Faktoring A.Ş.
42. İş Factoring Finansman Hizmetleri A.Ş.
43. Ivme Faktoring Hizmetleri A.Ş.

84
44. Kapital Faktoring Hizmetleri A.Ş 6
45. Katar Faktoring A.Ş. 3
46. Kent Factoring A.Ş 2
47. Kredi Finans Faktoring Hizmetleri A.Ş.
48. Lider Faktoring Hizmetleri A.Ş. 23
49. Makro Factoring A.Ş.
50. Merkez Faktoring Hizmetleri A.Ş.
51. Mert Finans Faktoring Hizmetleri A.Ş.
52. Met-ay Faktoring Finans Hizmetleri A.Ş. 6
53. MNG Factoring Hizmetleri A.Ş. 1 7
54. Optima Faktoring Hizmetleri A.Ş 8
55. Pamuk Factoring A.Ş.
56. Para Finans Factoring Hizm.A.Ş. 6
57. Prime Faktoring A.Ş.
58. Saray Faktoring A.Ş.
59. Sardes Faktoring A.Ş.
60. Strateji Factoring Hizmetleri A.Ş. 10
61. Sümer Faktoring A.Ş.
62. Şeker Faktoring Hizmetleri A.Ş. 8
63. Şirinoğlu Factoring Fins.Hizm.T.A.Ş. 39
64. Tam Faktoring A.Ş.
65. TEB Factoring A.Ş 9
66. Tek Faktoring Hizmetleri A.Ş. 6
67. Tekstil Factoring Hizmetleri A.Ş. 5
68. Trend Faktoring A.Ş. 1
69. Tuna Faktoring A.Ş.
70. Turkish Faktoring A.Ş.
71. Ulusal Faktoring A.Ş. 2 2
72. Vakıf Factoring A.Ş.
73. VDF Factoring Hizmetleri A.Ş.
74. Yapı Kredi Faktoring A.Ş. 5
75. Yaşar Factoring Hizm.A.Ş.
76. Yeditepe Faktoring Hizmetleri A.Ş.
TOTAL 30 200 Source: The Factoring Association
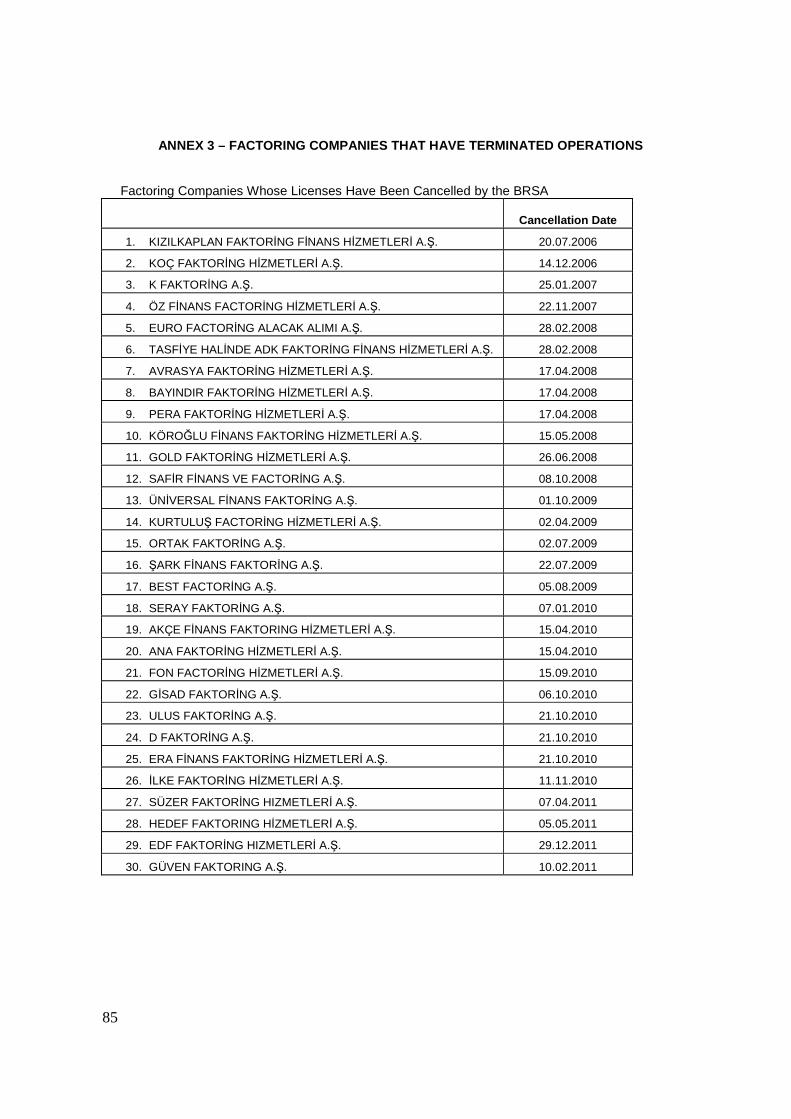
85
ANNEX 3 – FACTORING COMPANIES THAT HAVE TERMINATED OPERATIONS Factoring Companies Whose Licenses Have Been Cancelled by the BRSA
Cancellation Date
1. KIZILKAPLAN FAKTORİNG FİNANS HİZMETLERİ A.Ş. 20.07.2006
2. KOÇ FAKTORİNG HİZMETLERİ A.Ş. 14.12.2006
3. K FAKTORİNG A.Ş. 25.01.2007
4. ÖZ FİNANS FACTORİNG HİZMETLERİ A.Ş. 22.11.2007
5. EURO FACTORİNG ALACAK ALIMI A.Ş. 28.02.2008
6. TASFİYE HALİNDE ADK FAKTORİNG FİNANS HİZMETLERİ A.Ş. 28.02.2008
7. AVRASYA FAKTORİNG HİZMETLERİ A.Ş. 17.04.2008
8. BAYINDIR FAKTORİNG HİZMETLERİ A.Ş. 17.04.2008
9. PERA FAKTORİNG HİZMETLERİ A.Ş. 17.04.2008
10. KÖROĞLU FİNANS FAKTORİNG HİZMETLERİ A.Ş. 15.05.2008
11. GOLD FAKTORİNG HİZMETLERİ A.Ş. 26.06.2008
12. SAFİR FİNANS VE FACTORİNG A.Ş. 08.10.2008
13. ÜNİVERSAL FİNANS FAKTORİNG A.Ş. 01.10.2009
14. KURTULUŞ FACTORİNG HİZMETLERİ A.Ş. 02.04.2009
15. ORTAK FAKTORİNG A.Ş. 02.07.2009
16. ŞARK FİNANS FAKTORİNG A.Ş. 22.07.2009
17. BEST FACTORİNG A.Ş. 05.08.2009
18. SERAY FAKTORİNG A.Ş. 07.01.2010
19. AKÇE FİNANS FAKTORING HİZMETLERİ A.Ş. 15.04.2010
20. ANA FAKTORİNG HİZMETLERİ A.Ş. 15.04.2010
21. FON FACTORİNG HİZMETLERİ A.Ş. 15.09.2010
22. GİSAD FAKTORİNG A.Ş. 06.10.2010
23. ULUS FAKTORİNG A.Ş. 21.10.2010
24. D FAKTORİNG A.Ş. 21.10.2010
25. ERA FİNANS FAKTORİNG HİZMETLERİ A.Ş. 21.10.2010
26. İLKE FAKTORİNG HİZMETLERİ A.Ş. 11.11.2010
27. SÜZER FAKTORİNG HIZMETLERİ A.Ş. 07.04.2011
28. HEDEF FAKTORING HİZMETLERİ A.Ş. 05.05.2011
29. EDF FAKTORİNG HIZMETLERİ A.Ş. 29.12.2011
30. GÜVEN FAKTORING A.Ş. 10.02.2011

86
ANNEX 4 – FACTORING DATA BY COUNTRY
Factors Chain International Factoring Turnover by Country in 2011 (Million USD)
Nr. of Companies Country Domestic International Total EUROPE
100 Germany 119,120 38,140 157,260
4 Austria 7,009 1,977 8,986
6 Belgium 28,704 9,500 38,204
1 Bosnia & Herzegovina 30 15 45
7 Bulgaria 800 210 1,010
8 Czech Rep, 3,865 1,25 5,115
6 Denmark 5,51 3,65 9,16
4 Estonia 972 192 1,164
5 Finland 11,050 1,950 13,000
12 France 141,410 33,170 174,580
20 Croatia 2,153 116 2,269
4 Nederlands 30 16 46
42 United Kingdom 249,664 18,416 268,08
8 Ireland 17,047 1,283 18,330
24 Spain 109,083 13,042 122,125
40 Sweden 28,259 1 29,259
8 Switzerland 3,352 98 3,450
45 Italy 142,686 32,496 175,182
3 Cyprus 3,700 58 3,758
9 Latvia 200 171 371
8 Lithuania 795 1,339 2,134
1 Luxemburg 177 3 180
22 Hungary 2,455 362 2,817
2 Malta 150 50 200
7 Norway 14,334 2,061 16,395
18 Poland 14,200 3,700 17,900
15 Portugal 24,812 3,067 27,879
13 Romania 1,922 660 2,582
33 Russia 20,944 230 21,174
13 Serbia 726 200 926
7 Slovakia 810 361 1,171
4 Slovenia 410 140 550
74 Turkey 25,591 5,278 30,869
25 Ukraine 933 22 955
12 Greece 12,685 2,046 14,731
610 Total Europe 1,025,558 192,253 1,217,811
AMERICAS
300 United States 90,000 15,000 105,000
5 Argentina 455 20 475
1 Bolivia 32 3 35
1,112 Brazil 45,580 43 45,623
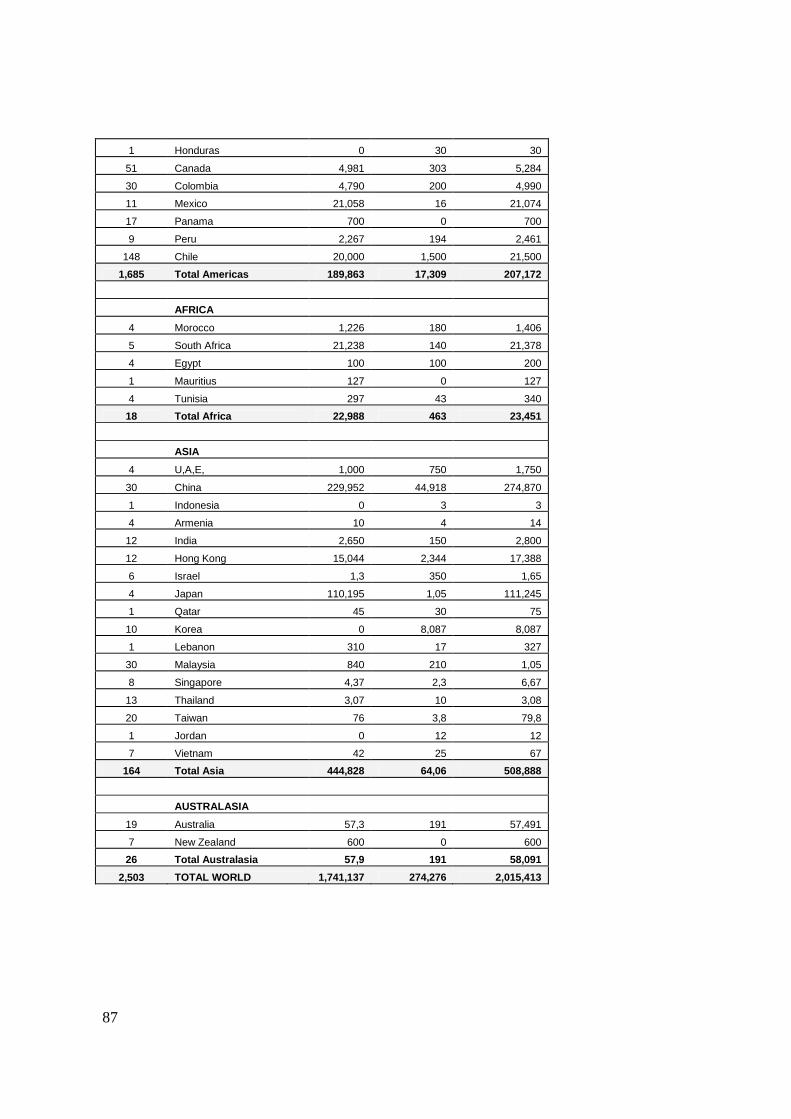
87
1 Honduras 0 30 30
51 Canada 4,981 303 5,284
30 Colombia 4,790 200 4,990
11 Mexico 21,058 16 21,074
17 Panama 700 0 700
9 Peru 2,267 194 2,461
148 Chile 20,000 1,500 21,500
1,685 Total Americas 189,863 17,309 207,172
AFRICA
4 Morocco 1,226 180 1,406
5 South Africa 21,238 140 21,378
4 Egypt 100 100 200
1 Mauritius 127 0 127
4 Tunisia 297 43 340
18 Total Africa 22,988 463 23,451
ASIA
4 U,A,E, 1,000 750 1,750
30 China 229,952 44,918 274,870
1 Indonesia 0 3 3
4 Armenia 10 4 14
12 India 2,650 150 2,800
12 Hong Kong 15,044 2,344 17,388
6 Israel 1,3 350 1,65
4 Japan 110,195 1,05 111,245
1 Qatar 45 30 75
10 Korea 0 8,087 8,087
1 Lebanon 310 17 327
30 Malaysia 840 210 1,05
8 Singapore 4,37 2,3 6,67
13 Thailand 3,07 10 3,08
20 Taiwan 76 3,8 79,8
1 Jordan 0 12 12
7 Vietnam 42 25 67
164 Total Asia 444,828 64,06 508,888
AUSTRALASIA
19 Australia 57,3 191 57,491
7 New Zealand 600 0 600
26 Total Australasia 57,9 191 58,091
2,503 TOTAL WORLD 1,741,137 274,276 2,015,413
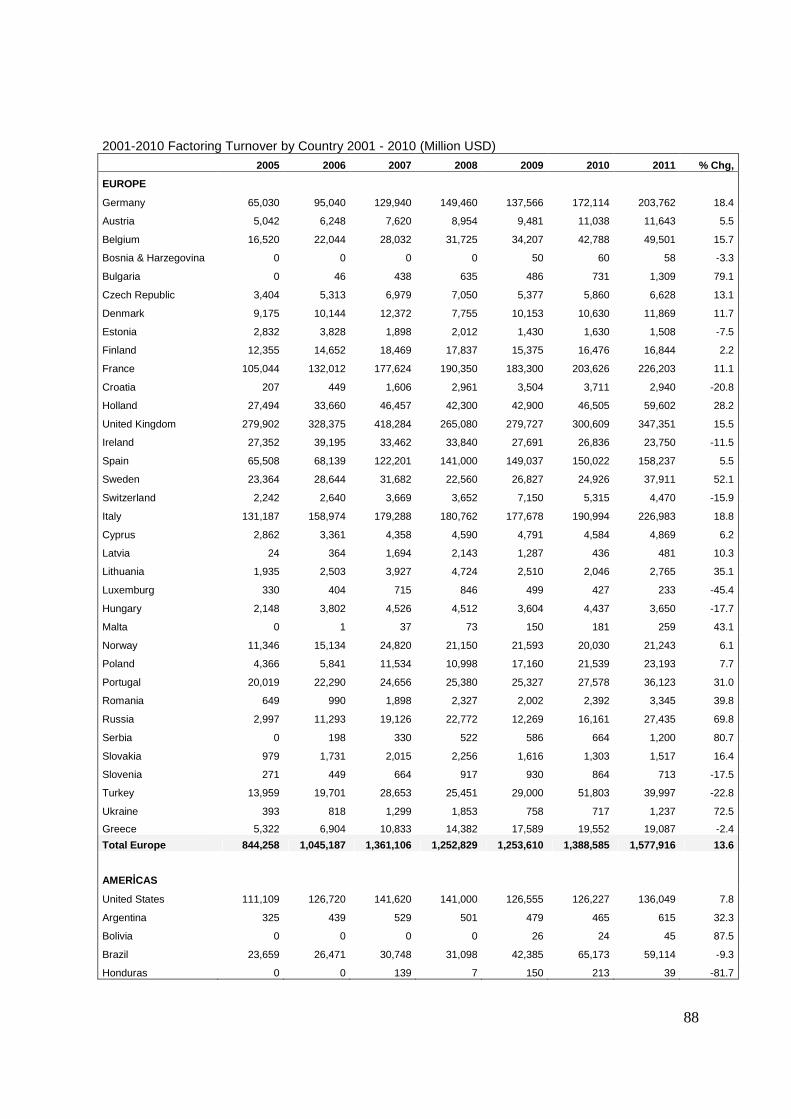
88
2001-2010 Factoring Turnover by Country 2001 - 2010 (Million USD) 2005 2006 2007 2008 2009 2010 2011 % Chg,
EUROPE
Germany 65,030 95,040 129,940 149,460 137,566 172,114 203,762 18.4
Austria 5,042 6,248 7,620 8,954 9,481 11,038 11,643 5.5
Belgium 16,520 22,044 28,032 31,725 34,207 42,788 49,501 15.7
Bosnia & Harzegovina 0 0 0 0 50 60 58 -3.3
Bulgaria 0 46 438 635 486 731 1,309 79.1
Czech Republic 3,404 5,313 6,979 7,050 5,377 5,860 6,628 13.1
Denmark 9,175 10,144 12,372 7,755 10,153 10,630 11,869 11.7
Estonia 2,832 3,828 1,898 2,012 1,430 1,630 1,508 -7.5
Finland 12,355 14,652 18,469 17,837 15,375 16,476 16,844 2.2
France 105,044 132,012 177,624 190,350 183,300 203,626 226,203 11.1
Croatia 207 449 1,606 2,961 3,504 3,711 2,940 -20.8
Holland 27,494 33,660 46,457 42,300 42,900 46,505 59,602 28.2
United Kingdom 279,902 328,375 418,284 265,080 279,727 300,609 347,351 15.5
Ireland 27,352 39,195 33,462 33,840 27,691 26,836 23,750 -11.5
Spain 65,508 68,139 122,201 141,000 149,037 150,022 158,237 5.5
Sweden 23,364 28,644 31,682 22,560 26,827 24,926 37,911 52.1
Switzerland 2,242 2,640 3,669 3,652 7,150 5,315 4,470 -15.9
Italy 131,187 158,974 179,288 180,762 177,678 190,994 226,983 18.8
Cyprus 2,862 3,361 4,358 4,590 4,791 4,584 4,869 6.2
Latvia 24 364 1,694 2,143 1,287 436 481 10.3
Lithuania 1,935 2,503 3,927 4,724 2,510 2,046 2,765 35.1
Luxemburg 330 404 715 846 499 427 233 -45.4
Hungary 2,148 3,802 4,526 4,512 3,604 4,437 3,650 -17.7
Malta 0 1 37 73 150 181 259 43.1
Norway 11,346 15,134 24,820 21,150 21,593 20,030 21,243 6.1
Poland 4,366 5,841 11,534 10,998 17,160 21,539 23,193 7.7
Portugal 20,019 22,290 24,656 25,380 25,327 27,578 36,123 31.0
Romania 649 990 1,898 2,327 2,002 2,392 3,345 39.8
Russia 2,997 11,293 19,126 22,772 12,269 16,161 27,435 69.8
Serbia 0 198 330 522 586 664 1,200 80.7
Slovakia 979 1,731 2,015 2,256 1,616 1,303 1,517 16.4
Slovenia 271 449 664 917 930 864 713 -17.5
Turkey 13,959 19,701 28,653 25,451 29,000 51,803 39,997 -22.8
Ukraine 393 818 1,299 1,853 758 717 1,237 72.5
Greece 5,322 6,904 10,833 14,382 17,589 19,552 19,087 -2.4
Total Europe 844,258 1,045,187 1,361,106 1,252,829 1,253,610 1,388,585 1,577,916 13.6
AMERİCAS
United States 111,109 126,720 141,620 141,000 126,555 126,227 136,049 7.8
Argentina 325 439 529 501 479 465 615 32.3
Bolivia 0 0 0 0 26 24 45 87.5
Brazil 23,659 26,471 30,748 31,098 42,385 65,173 59,114 -9.3
Honduras 0 0 139 7 150 213 39 -81.7

89
Canada 4,508 4,470 6,234 4,230 4,648 4,947 6,846 38.4
Colombia 0 132 2,964 2,961 3,420 3,699 6,466 74.8
Mexico 8,378 10,758 13,432 13,466 3,032 19,317 27,306 41.4
Panama 283 801 705 649 715 797 907 13.8
Peru 112 743 946 1,234 1,084 3,603 3,189 -11.5
Chile 11,210 14,916 21,345 22,278 20,735 21,820 27,858 27.7
Total Americas 159,584 185,450 218,662 217,424 203,229 246,285 268,434 9.0
AFRİCA
Morocco 507 581 964 1,199 1,301 1,423 1,822 28.0
South Africa 6,584 10,296 14,279 17,075 19,305 20,090 27,700 37.9
Egypt 1 4 29 71 157 266 259 -2.6
Tunisia 267 356 358 357 395 392 441 12.5
Total Africa 7,359 11,237 15,630 18,702 21,158 22,171 30,222 36.3
ASIA
U,A,E, 519 1,069 496 2,623 2,731 2,657 2,267 -14.7
China 6,879 18,876 48,145 77,550 96,239 205,351 356,149 73.4
Indonesia 0 0 0 0 0 0 4
Armenia 0 0 0 10 10 18 18 0.0
India 2,348 4,699 7,380 7,332 3,790 3,654 3,628 -0.7
Hong Kong 9,086 12,817 11,242 11,985 11,553 19,133 22,530 17.8
Israel 384 495 1,168 1,974 2,002 2,192 2,138 -2.5
Japan 91,120 98,380 113,473 150,165 119,691 130,877 144,140 10.1
Qatar 0 0 0 0 33 31 97 212.9
Korea 1,003 1,122 1,394 1,269 4,200 6,748 10,478 55.3
Lebanon 72 125 257 564 601 598 423 -29.3
Malaysia 628 634 683 776 1,001 1,406 1,360 -3.3
Mauritius 0 0 0 0 173 166 165 -0.6
Singapore 3,398 3,901 4,774 5,640 6,721 7,706 8,642 12.1
Thailand 1,935 2,541 3,270 3,337 3,013 2,784 3,991 43.4
Taiwan 42,480 52,800 62,050 68,738 48,334 89,023 103,397 16.1
Jordan 0 0 0 0 61 57 16 -71.9
Vietnam 2 21 63 120 135 86 87 1.2
Total Asia 159,854 197,480 254,395 332,083 300,288 472,487 659,530 39.6
AUSTURALASIA
Australia 27,293 36,396 48,297 45,890 56,356 59,679 74,491 24.8
New Zealand 295 370 1,022 987 1,001 797 777 -2.5
Total Australasia 27,588 36,766 49,319 46,877 57,357 60,476 75,268 24.5
TOTAL WORLD 1,198,643 1,476,120 1,899,112 1,867,915 1,835,642 2,190,004 2,611,370 19.2
90
Istanbul International Rating Services, Turkrating for short, is a local agency rating Turkish companies.
Turkrating’s rating coverage includes corporations, financial institutions, municipalities and public sector institutions. It was established in Turkey in 2006 by Turkish partners and a group of international
experts with unrivaled experience in ratings, investor services, banking, and other industry sectors. Turkrating aims to be the number one provider of independent and objective opinions on the
creditworthiness of Turkish obligors. The company attaches utmost importance to complying with international best practice in the rating process and the participation of experienced analysts contributes to the observance of high standards.
In addition to ratings and company financial evaluations reports, Turkrating provides comprehensive industry reports covering the overview of each industry, analyzing the dynamics of production, factors
shaping domestic demand and the outlook of the industry. A discussion of risks and opportunities are presented giving creditors and investors the ability to evaluate their exposure within the context of the industry’s characteristics.
Turkrating is licensed by the Banking Regulatory and Supervisory Board (BRSA) and the Capital Markets Board to conduct rating services in Turkey.
www.turkrating.com

91