the technology of skill formation - national bureau of ... · the technology of skill formation...
TRANSCRIPT
NBER WORKING PAPER SERIES
THE TECHNOLOGY OF SKILL FORMATION
Flavio CunhaJames Heckman
Working Paper 12840http://www.nber.org/papers/w12840
NATIONAL BUREAU OF ECONOMIC RESEARCH1050 Massachusetts Avenue
Cambridge, MA 02138January 2007
This research was supported by NIH R01-HD043411, NSF SES-24158, the Committee for EconomicDevelopment with a grant from The Pew Charitable Trusts and the Partnership for America's EconomicSuccess, and the J.B. Pritzker Consortium on Early Childhood Development at the Harris School ofPublic Policy, University of Chicago. Flavio Cunha also acknowledges support from the Claudio Haddaddissertation fund at the University of Chicago. The views expressed in this paper are those of the authorsand not necessarily those of the funders listed here. The first draft of this paper, written with PedroCarneiro, was presented at a conference at the Minneapolis Federal Reserve, October 2003. We thankGary S. Becker, Janet Currie and Greg J. Duncan for helpful comments. A website at http://jenni.uchicago.edu/tech-skill/contains supporting material. The views expressed herein are those of the author(s) and do not necessarilyreflect the views of the National Bureau of Economic Research.
© 2007 by Flavio Cunha and James Heckman. All rights reserved. Short sections of text, not to exceedtwo paragraphs, may be quoted without explicit permission provided that full credit, including © notice,is given to the source.

The Technology of Skill FormationFlavio Cunha and James HeckmanNBER Working Paper No. 12840January 2007JEL No. I38,J13,J24
ABSTRACT
This paper develops a model of skill formation that explains a variety of findings established in thechild development and child intervention literatures. At its core is a technology that is stage-specificand that features self productivity, dynamic complementarity and skill multipliers. Lessons are drawnfor the design of new policies to alleviate the consequences of the accident of birth that is a majorsource of human inequality.
Flavio CunhaDepartment of EconomicsUniversity of Chicago1126 E. 59th StreetChicago IL [email protected]
James HeckmanDepartment of EconomicsThe University of Chicago1126 E. 59th StreetChicago, IL 60637and [email protected]
The Technology of Skill Formation
by Flavio Cunha and James Heckman∗
It is well documented that people are diverse on a vast array of abilities, that these abilities
account for a substantial portion of the variation found across people in their socioeconomic
success, and that persistent ability gaps across children from various socioeconomic groups open
up at early ages before children enter school. The family plays a powerful role in shaping these
abilities through genetics, parental investments and through choice of child environments. From
a variety of intervention studies, it is known that ability gaps in children from different socioeco-
nomic groups can be reduced if remediation is attempted at early enough ages. The remediation
efforts that appear to be most effective are those that supplement family environments for dis-
advantaged children. Cunha et al. (2006a), henceforth CHLM, present a comprehensive survey
and discussion of this literature.
This paper uses a simple economic model of skill formation to organize this and other
evidence summarized below and the findings of related literatures in psychology, education
and neuroscience. The existing theoretical literature on child development in economics treats
childhood as a single period (see, e.g., Becker and Nigel Tomes, 1986; S. Rao Aiyagari et al.,
2002; Roland Benabou, 2002). The implicit assumption in this approach is that inputs into
the production of skills at different stages of childhood are perfect substitutes. We argue that
to account for a large body of evidence, it is important to build a model of skill formation
with multiple stages of childhood, where inputs at different stages are complements and where
there is self-productivity of investment. In addition, in order to rationalize the evidence, it is
important to recognize three distinct credit constraints operating on the family and its children.
(i) The inability of a child to choose its parents. This is the fundamental constraint imposed
by the accident of birth. (ii) The inability of parents to borrow against their children’s future
income to finance investments in them. (iii) The inability of parents to borrow against their
own income to finance investments in their children.
1

This paper summarizes findings from the recent literature on child development and presents
a model that explains them. A model that is faithful to the evidence must recognize that
(a) parental influences are key factors governing child development; (b) early childhood invest-
ments must be distinguished from late childhood investments; (c) an equity-efficiency trade-off
exists for late investments, but not for early investments; (d) abilities are created, not solely
inherited, and are multiple in variety; (e) the traditional ability-skills dichotomy is misleading.
Both skills and abilities are created; and (f) the “nature versus nurture” distinction is obso-
lete. These insights change the way we interpret evidence and design policy about investing in
children. Point (a) is emphasized in many papers. Point (b) is ignored in models that consider
only one period of childhood investment. Points (c), (d) and (e) have received scant attention
in the formal literature on child investment. Point (f) is ignored in the literature that partitions
the variance of child outcomes into components due to nature and components due to nurture.
I Observations About Human Diversity and Human Development
and Some Facts Our Model Explains
Any analysis of human development must reckon with three empirically well established obser-
vations about ability. The first observation is that ability matters. A large number of empirical
studies document that cognitive ability is a powerful determinant of wages, schooling, partici-
pation in crime and success in many aspects of social and economic life. The frenzy generated
by Richard J. Herrnstein and Charles A. Murray’s book, The Bell Curve, because of its claims
of genetic determinism, obscured its real message, which is that cognitive ability is an impor-
tant predictor of socioeconomic success. (See, e.g., James J. Heckman, 1995, and Richard J.
Murnane et al., 1995.)
A second observation, more recently established, is that abilities are multiple in nature.
Noncognitive abilities (perseverance, motivation, time preference, risk aversion, self-esteem, self-
control, preference for leisure) have direct effects on wages (controlling for schooling), schooling,
teenage pregnancy, smoking, crime, performance on achievement tests and many other aspects
of social and economic life. (Samuel Bowles et al., 2001; Lex Borghans et al., 2006; Heckman
2
et al., 2006).
The third observation is that the nature versus nurture distinction is obsolete. The modern
literature on epigenetic expression teaches us that the sharp distinction between acquired skills
and ability featured in the early human capital literature is not tenable (see, e.g., Leslie Pray,
2004).1 Additive “nature” and “nurture” models, while traditional and still used in many
studies of heritability and family influence, mischaracterize how ability is manifested. Abilities
are produced, and gene expression is governed by environmental conditions (Eric Turkheimer
et al., 2003). Measured abilities are susceptible to environmental influences, including in utero
experiences, and also have genetic components. These factors interact to produce behaviors and
abilities that have both a genetic and an acquired character.2,3 Genes and environment cannot
be meaningfully parsed by traditional linear models that assign variance to each component.
Taking these observations as established, we develop a simple economic model to explain the
following six facts from the recent empirical literature. First, ability gaps between individuals
and across socioeconomic groups open up at early ages, for both cognitive and noncognitive
skills. See Figure 1 for a prototypical figure which graphs a cognitive test score by age of child
by socioeconomic status of the family.4 CHLM present many graphs of child cognitive and
noncognitive skills by age showing early divergence and then parallelism during school-going
years across children with parents of different socioeconomic status.5 Levels of child skills are
highly correlated with family background factors like parental education and maternal ability,
which, when statistically controlled for, largely eliminate these gaps (see Carneiro and Heckman,
2003, CHLM and our website).6 Experimental interventions with long term followup confirm
that changing the resources available to disadvantaged children improves their adult outcomes.
See the studies surveyed in CHLM or David Blau and Currie (2006). Schooling quality and
school resources have relatively small effects on ability deficits and have little effect on test
scores by age across children from different socioeconomic groups as displayed in Figure 1 and
related graphs (see Heckman et al., 2004; Stephen W. Raudenbush, 2006).
Second, in both animal and human species, there is compelling evidence of critical and
3

sensitive periods in the development of the child. Some skills or traits are more readily acquired
at certain stages of childhood than other traits (see the evidence summarized in Eric I. Knudsen
et al., 2006). For example, on average, if a second language is learned before age 12, the child
speaks it without an accent (Elissa L. Newport, 1990). If syntax and grammar are not acquired
early on, they appear to be very difficult to learn later on in life (Steven Pinker, 1994). A child
born with a cataract on the eye will be blind if the cataract is not removed within the first year
of life.
Different types of abilities appear to be manipulable at different ages. IQ scores become
stable by age 10 or so, suggesting a sensitive period for their formation below age 10. (See
Kenneth Hopkins and Glenn Brecht, 1975.) There is evidence that adolescent interventions
can affect noncognitive skills (see CHLM). This evidence is supported in the neuroscience that
establishes the malleability of the prefrontal cortex into the early 20s (Ronald E. Dahl, 2004).
This is the region of the brain that governs emotion and self-regulation.
On average, the later remediation is given to a disadvantaged child, the less effective it is.
A study by Thomas G. O’Connor et al. (2000) of adopted Romanian infants reared in severely
deprived orphanage environments before their adoption supports this claim. The later the
Romanian orphan was rescued from the social and emotional isolation of the orphanage, the
lower was his or her cognitive performance at age 6. Classroom remediation programs designed
to combat early cognitive deficits have a poor track record.
At historically funded levels, public job training programs and adult literacy and educational
programs, like the GED, that attempt to remediate years of educational and emotional neglect
among disadvantaged individuals have a low economic return and produce meager effects for
most persons. A substantial body of evidence suggests that returns to adolescent education
for the most disadvantaged and less able are lower than the returns for the more advantaged
(Costas Meghir and Marten Palme, 2001; Carneiro and Heckman, 2003, and the evidence they
cite; Carneiro et al., 2006).
The available evidence suggests that for many skills and abilities, later remediation for
4

disadvantage may be possible but is much more costly than early remediation to achieve a
given level of adult performance (Cunha and Heckman, 2006b). The economic returns to job
training, high school graduation and college attendance are lower for less able persons. (See
Carneiro and Heckman, 2003, and the studies they cite.)
Third, despite the low returns to interventions targeted toward disadvantaged adolescents,
the empirical literature shows high economic returns for remedial investments in young disad-
vantaged children. See W. Steven Barnett (2004), the evidence in CHLM and the papers they
cite. This finding is a consequence of dynamic complementarity and self-productivity captured
by the technology developed in the next section.
Fourth, if early investment in disadvantaged children is not followed up by later investment,
its effect at later ages is lessened. Investments appear to be complementary and require follow
up to be effective. Currie and Duncan Thomas (1995) document a decline in the performance
of Head Start minority participants after they leave the program, return to disadvantaged
environments, and receive the low levels of investment experienced by many disadvantaged
children.7
Fifth, the effects of credit constraints on a child’s adult outcomes depend on the age at which
they bind for the child’s family. Recent research summarized in Carneiro and Heckman (2002,
2003) and in CHLM demonstrates the quantitative insignificance of family credit constraints
in the child’s college-going years in explaining a child’s enrollment in college. Controlling
for cognitive ability, under meritocratic policies currently in place in American society, family
income during the child’s college-going years plays only a minor role in determining child college
participation, although much public policy is predicated on precisely the opposite point of view.
Holding ability fixed, minorities are more likely to attend college than others despite their lower
family incomes (see Stephen V. Cameron and Heckman, 2001, and the references they cite).
Augmenting family income or reducing college tuition at the stage of the life cycle when a child
goes to college does not go far in compensating for low levels of previous investment.
Carneiro and Heckman present evidence for the United States that only a small fraction (at
5

most 8%) of the families of adolescents are credit constrained in making college participation
decisions. This evidence is supported in research by Cameron and Christopher Taber (2004)
and Ralph Stinebrickner and Todd R. Stinebrickner (2006). Permanent family income plays an
important role in explaining educational choices, insofar as it is a proxy for the high level of
investment in abilities and skills that wealthier families provide, but it is not synonymous with
family income in the adolescent years, nor with tuition and fees.
However, there is some evidence that credit constraints operating in the early years have
effects on adult ability and schooling outcomes (Duncan and Jeanne Brooks-Gunn, 1997; Gor-
don B. Dahl and Lance J. Lochner, 2004; Pamela Morris et al., 2005; and Duncan and Ariel
Kalil, 2006). Carneiro and Heckman (2003) show that controlling for family permanent income
reduces the estimated effect of early income on child outcomes. Permanent income has a strong
effect on child outcomes. The strongest evidence for an effect of the timing of parental income
for disadvantaged children is in their early years. The best documented market failure in the
life cycle of skill formation in contemporary American society is the inability of children to buy
their parents or the lifetime resources that parents provide and not the inability of families to
secure loans for a child’s education when the child is an adolescent.
Sixth, socioemotional (noncognitive) skills foster cognitive skills and are an important prod-
uct of successful families and successful interventions in disadvantaged families. Emotionally
nurturing environments produce more capable learners. The Perry Preschool Program, which
was evaluated by random assignment, did not boost participant adult IQ but enhanced per-
formance of participants on a number of dimensions, including scores on achievement tests,
employment and reduced participation in a variety of social pathologies. See Lawrence J.
Schweinhart et al. (2005) and the figures and tables on the Perry program posted at our web-
site.8
II A Model of Skill Formation
We now develop a model of skill formation that can explain the six facts just presented as well
as additional findings from the literature on child development. We use the terms “skill” and
6
“ability” interchangeably. Both are produced by environments, investment, and genes.
Agents possess a vector of abilities at each age. These abilities (or skills) are multiple in
nature and range from pure cognitive abilities (e.g. IQ) to noncognitive abilities (patience, self
control, temperament, risk aversion, time preference). These abilities are used with different
weights in different tasks in the labor market and in social life more generally.9 Achievement
test scores, sometimes confused with IQ scores (e.g., Herrnstein and Murray, 1994), are not
pure measures of ability and are affected by cognitive, noncognitive and environmental inputs
(See, e.g., Karsten T. Hansen et al., 2004, and Cunha and Heckman, 2006a).
The human skill formation process is governed by a multistage technology. Each stage
corresponds to a period in the life cycle of a child. While the child development literature
recognizes stages of development (see, e.g., Erik H. Erikson, 1950), the economics of child
development does not. Inputs or investments at each stage produce outputs at the next stage.
Like Yoram Ben-Porath (1967), we use a production function to determine the relationship
between inputs and the output of skill. Unlike Ben-Porath, in our model qualitatively different
inputs can be used at different stages and the technologies can be different at different stages
of child development.10
Ben-Porath focuses on adult investments where time and its opportunity cost play impor-
tant roles. For child investments, parents make decisions and child opportunity costs are less
relevant. The outputs at each stage in our technology are the levels of each skill achieved at
that stage. Some stages of the technology may be more productive in producing some skills
than other stages, and some inputs may be more productive at some stages than at other stages.
The stages that are more effective in producing certain skills are called “sensitive periods” for
the acquisition of those skills. If one stage alone is effective in producing a skill (or ability), it
is called a “critical period” for that skill.
An important feature of our technology is that the skills produced at one stage augment the
skills attained at later stages. This effect is termed self-productivity. It embodies the idea that
skills acquired in one period persist into future periods. It also embodies the idea that skills are
7

self-reinforcing and cross-fertilizing. For example, emotional security fosters child exploration
and more vigorous learning of cognitive skills. This has been found in animal species (Stephen
J. Suomi, 1999; Michael J. Meany, 2001; Judy Cameron, 2004) and in humans (Duncan et al.,
2006; C. Cybele Raver et al., 2006, interpreting the ability of a child to pay attention as a
socioemotional skill). A higher stock of cognitive skill in one period raises the stock of next
period cognitive skills. A second key feature of skill formation is dynamic complementarity.
Skills produced at one stage raise the productivity of investment at subsequent stages. In a
multistage technology, complementarity implies that levels of skill investments at different ages
bolster each other. They are synergistic. Complementarity also implies that early investment
should be followed up by later investment in order for the early investment to be productive.
Together, dynamic complementarity and self-productivity produce multiplier effects which are
the mechanisms through which skills beget skills and abilities beget abilities.
Dynamic complementarity, self-productivity of human capital, and multiplier effects imply
an equity-efficiency trade-off for late child investments but not for early investments. These
concepts, embedded in alternative market settings, explain the six facts from the recent liter-
ature summarized in the previous section. These features of the technology of skill formation
have consequences for the design and evaluation of public policies toward families. In particular,
they show why the returns to late childhood investment and remediation for young adolescents
from disadvantaged backgrounds are so low, while the returns to early investment in children
from disadvantaged environments are so high.
We now formalize these concepts in an overlapping generations model. An individual lives
for 2T years. The first T years the individual is a child of an adult parent. From age T + 1 to
2T the individual lives as an adult and is the parent of a child. The individual dies at the end
of the period in which he is 2T years-old, just before his child’s child is born. At every calendar
year there are an equal and large number of individuals of every age t ∈ {1, 2, . . . , 2T}.11 To
simplify the notation, we do not explicitly subscript generations.
A household consists of an adult parent and his child. Parents invest in their children
8

because of altruism. They have common preferences and supply labor inelastically. Let It
denote parental investments in child skill when the child is t years-old, where t = 1, 2, . . . , T .
The output of the investment process is a skill vector. The parent is assumed to fully control
the investments in the skills of the child, whereas in reality, as a child matures, he gains much
more control over the investment process.12 We ignore investments in the child’s adult years
to focus on new ideas in this paper. We also keep government inputs (e.g., schooling) implicit.
They can be modeled as a component of It.
We now describe how skills evolve over time. Assume that each agent is born with initial
conditions θ1. Let h denote parental characteristics (e.g., IQ, education, etc.). At each stage t,
let θt denote the vector of skill stocks. The technology of production of skill when the child is
t years old is
(1) θt+1 = ft (h, θt, It) ,
for t = 1, 2, . . . , T . We assume that ft is strictly increasing and strictly concave in It, and twice
continuously differentiable in all of its arguments.13
Technology (1) is written in recursive form. Substituting in (1) for θt, θt−1, . . ., repeatedly,
one can rewrite the stock of skills at stage t + 1, θt+1, as a function of all past investments:14
(2) θt+1 = mt (h, θ1, I1, . . . , It) , t = 1, . . . , T.
Dynamic complementarity arises when ∂2ft (h, θt, It) /∂θt∂I ′t > 0, i.e., when stocks of skills
acquired by period t − 1 (θt) make investment in period t (It) more productive. Such com-
plementarity explains why returns to educational investments are higher at later stages of the
child’s life cycle for more able children (those with higher θt). Students with greater early skills
(cognitive and noncognitive) are more efficient in later learning of both cognitive and noncogni-
tive skills. The evidence from the early intervention literature suggests that the enriched early
preschool environments provided by the Abecedarian, Perry and CPC interventions promote
9
greater efficiency in learning in school and reduce problem behaviors. See Currie and Blau
(2006) and CHLM.
Self-productivity arises when ∂ft (h, θt, It) /∂θt > 0, i.e., when higher stocks of skills in one
period create higher stocks of skills in the next period. For the case of skill vectors, this includes
own and cross effects. The joint effects of self-productivity and dynamic complementarity help
to explain the high productivity of investment in disadvantaged young children but the lower
return to investment in disadvantaged adolescent children for whom the stock of skills is low
and hence the complementarity effect is lower. These are facts two and three presented in
Section I.
This technology is sufficiently rich to describe learning in rodents and macaque monkeys.
More emotionally secure young animals explore their environments more actively and learn
more quickly. This technology also explains the evidence that the ability of the child to pay
attention affects subsequent academic achievement. Cross-complementarity serves to explain
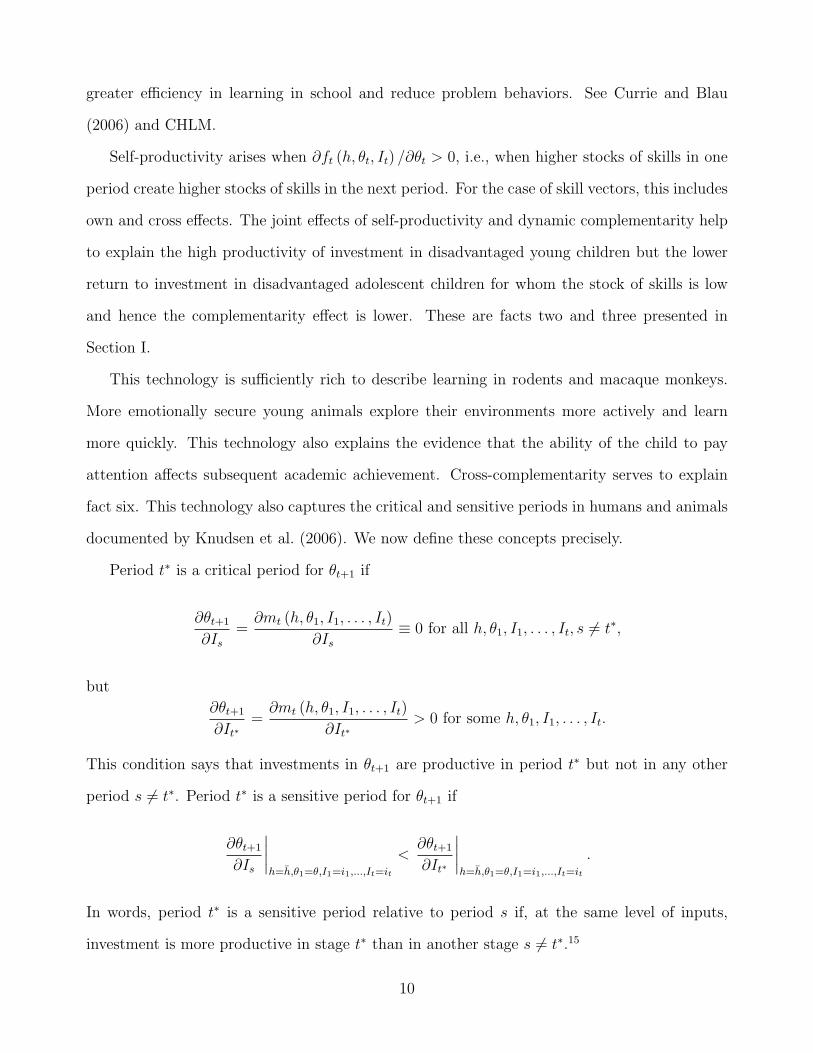
fact six. This technology also captures the critical and sensitive periods in humans and animals
documented by Knudsen et al. (2006). We now define these concepts precisely.
Period t∗ is a critical period for θt+1 if
∂θt+1
∂Is
=∂mt (h, θ1, I1, . . . , It)
∂Is
≡ 0 for all h, θ1, I1, . . . , It, s 6= t∗,
but
∂θt+1
∂It∗=
∂mt (h, θ1, I1, . . . , It)
∂It∗> 0 for some h, θ1, I1, . . . , It.
This condition says that investments in θt+1 are productive in period t∗ but not in any other
period s 6= t∗. Period t∗ is a sensitive period for θt+1 if
∂θt+1
∂Is
∣∣∣∣h=h,θ1=θ,I1=i1,...,It=it
<∂θt+1
∂It∗
∣∣∣∣h=h,θ1=θ,I1=i1,...,It=it
.
In words, period t∗ is a sensitive period relative to period s if, at the same level of inputs,
investment is more productive in stage t∗ than in another stage s 6= t∗.15
10

Suppose for simplicity that T = 2. In reality, there are many stages in childhood, including
in utero experiences.16 Assume that θ1, I1, I2 are scalars.17 The adult stock of skills, h′ (= θ3),
is a function of parental characteristics, initial conditions and investments during childhood I1
and I2:
(3) h′ = m2 (h, θ1, I1, I2) .
The literature in economics assumes only one period of childhood. It does not distinguish
between early investment and late investment. This produces the conventional specification
which is a special case of the technology (3), where
(4) h′ = m2 (h, θ1, γI1 + (1− γ) I2)
and γ = 1/2. In this case, adult stocks of skills do not depend on how investments are
distributed over different periods of childhood. For example, take two children, A and B, who
have identical parents and the same initial condition θ1, but have different investment profiles:
child A receives no investment in period one and receives I units of investment in period two,
IA1 = 0, IA
2 = I, while child B receives I units of investment in period one and zero units of
investment in period two, IB1 = I, IB
2 = 0. According to (4), when γ = 1/2, children A and
B will have the same stocks of skills as adults. The timing of investment is irrelevant. Neither
period one nor period two is critical.
The polar opposite of perfect substitution is perfect complementarity:
(5) h′ = m2 (h, θ1, min {I1, I2}) .
Technology (5) has the feature that adult stocks of skills critically depend on how investments
are distributed over time. For example, if investment in period one is zero, I1 = 0, then it does
not pay to invest in period two. If late investment is zero, I2 = 0, it does not pay to invest
11
early. For the technology of skill formation defined by (5), the best strategy is to distribute
investments evenly, so that I1 = I2. Complementarity has a dual face. It is essential to invest
early to get satisfactory adult outcomes. But it is also essential to invest late to harvest the
fruits of the early investment.18 Such dynamic complementarity helps to explain the evidence by
Currie and Thomas (1995) that for disadvantaged minority students, early investments through
Head Start have weak effects in later years if not followed up by later investments. This is fact
four on our list. Our explanation is in sharp contrast to the one offered by Becker (1991) who
explains weak Head Start effects by crowding out of parental investment by public investment.
That is a story of substitution against the invested child in a one-period model of childhood.
Ours is a story of dynamic complementarity.19
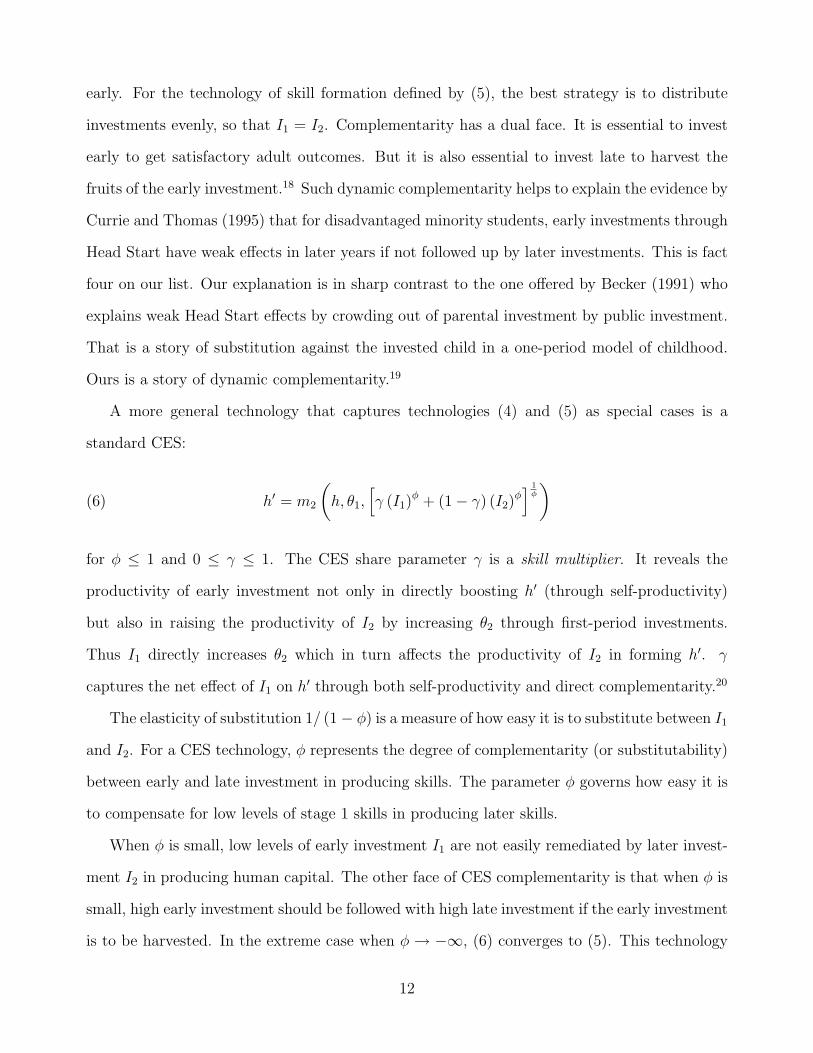
A more general technology that captures technologies (4) and (5) as special cases is a
standard CES:
(6) h′ = m2
(h, θ1,
[γ (I1)
φ + (1− γ) (I2)φ] 1
φ
)
for φ ≤ 1 and 0 ≤ γ ≤ 1. The CES share parameter γ is a skill multiplier. It reveals the
productivity of early investment not only in directly boosting h′ (through self-productivity)
but also in raising the productivity of I2 by increasing θ2 through first-period investments.
Thus I1 directly increases θ2 which in turn affects the productivity of I2 in forming h′. γ
captures the net effect of I1 on h′ through both self-productivity and direct complementarity.20
The elasticity of substitution 1/ (1− φ) is a measure of how easy it is to substitute between I1
and I2. For a CES technology, φ represents the degree of complementarity (or substitutability)
between early and late investment in producing skills. The parameter φ governs how easy it is
to compensate for low levels of stage 1 skills in producing later skills.
When φ is small, low levels of early investment I1 are not easily remediated by later invest-
ment I2 in producing human capital. The other face of CES complementarity is that when φ is
small, high early investment should be followed with high late investment if the early investment
is to be harvested. In the extreme case when φ → −∞, (6) converges to (5). This technology
12

explains facts two and three —why returns to education are low in the adolescent years for
disadvantaged (low h, low I1, low θ2) adolescents but are high in the early years. Without the
proper foundation for learning (high levels of θ2) in technology (1), adolescent interventions
have low returns.
In a one-period model of childhood, inputs at any stage of childhood are perfect substitutes.
Application of the one-period model supports the widely held but empirically unsupported
intuition that diminishing returns make investment in less advantaged adolescents more pro-
ductive. As noted in fact two of Section I, the evidence suggests that just the opposite is true.
We next embed the technology in a market environment with parental choice of inputs.
III The Optimal Lifecycle Profile of Investments
Using technology (6), we now show how the ratio of early to late investments varies as a function
of φ and γ as a consequence of parental choices in different market settings. Let w and r denote
the wage and interest rates, respectively, in a stationary environment. At the beginning of
adulthood, the parent draws the initial level of skill of the child, θ1, from the distribution J(θ1).
Upon reaching adulthood, the parent receives bequest b. The state variables for the parent are
the parental skills, h, the parental financial resources, b, and the initial skill level of the child,
θ1. Let c1 and c2 denote the consumption of the household in the first and second period of
the lifecycle of the child. The parent decides how to allocate the resources among consumption
and investments at different periods as well as bequests b′ which may be positive or negative.
Assuming that human capital (parental and child) is scalar, the budget constraint is:
(7) c1 + I1 +c2 + I2
(1 + r)+
b′
(1 + r)2 = wh +wh
(1 + r)+ b.
Let β denote the utility discount factor and δ denote the parental altruism toward the child.
Let u(·) denote the utility function. The recursive formulation of the problem of the parent is:
(8) V (h, b, θ1) = max{u (c1) + βu (c2) + β2δE [V (h′, b′, θ′1)]
}.
13

The problem of the parent is to maximize (8) subject to (7), and technology (6).21
When φ = 1, so early and late investment are perfect CES substitutes, the optimal in-
vestment strategy is straightforward. The price of early investment is $1. The price of the
late investment is $1/(1 + r). Thus the parent can purchase (1 + r) units of I2 for every unit
of I1. The amount of human capital produced from one unit of I1 is γ, while $ (1 + r) of I2
produces (1 + r) (1− γ) units of human capital. Thus, two forces act in opposite directions.
High productivity of initial investment (the skill multiplier γ) drives the parent toward making
early investments. The interest rate drives the parent to invest late. It is optimal to invest
early if γ > (1− γ) (1 + r).
As φ → −∞, the CES production function converges to the Leontief case and the optimal
investment strategy is to set I1 = I2. In this case, investment in the young is essential. At
the same time, later investment is needed to harvest early investment. On efficiency grounds,
early disadvantages should be perpetuated, and compensatory investments at later ages are
economically inefficient.
For −∞ < φ < 1, the first-order conditions are necessary and sufficient given concavity of
the technology in terms of I1 and I2. For an interior solution, we can derive the optimal ratio
of early to late investment:
(9)I1
I2
=
[γ
(1− γ) (1 + r)
] 11−φ
.
Figure 2 plots the ratio of early to late investment as a function of the skill multiplier γ under
different values of the complementarity parameter φ, assuming r = 0. When φ → −∞, the
ratio is not sensitive to variations in γ. When φ = 0, the function (6) is
h′ = m2 (h, θ1, I1, I2) = m2
(h, θ1, I
γ1 I1−γ
2
).
In this case, from equation (9), the optimal I1/I2 is close to zero for low values of γ, but explodes
to infinity as γ approaches one.22
14
When CES complementarity is high, the skill multiplier γ plays a limited role in shaping
the ratio of early to late investment. High early investment should be followed by high late
investment. As the degree of CES complementarity decreases, the role of the skill multiplier
increases, and the higher the multiplier, the more investment should be concentrated in the
early ages.
In a perfect credit market model, optimal investment levels are not affected by parental
wages or endowments, or the parameters that characterize the utility function u(·).23 Note,
however, that even in this “perfect” credit market setting, parental investments depend on
parental skills, h, because these characteristics affect the returns to investment. From the point
of view of the child, this is a market failure due to the accident of birth. Children would like to
choose the optimal amount of parental characteristics h to complement their initial endowment,
θ1.24
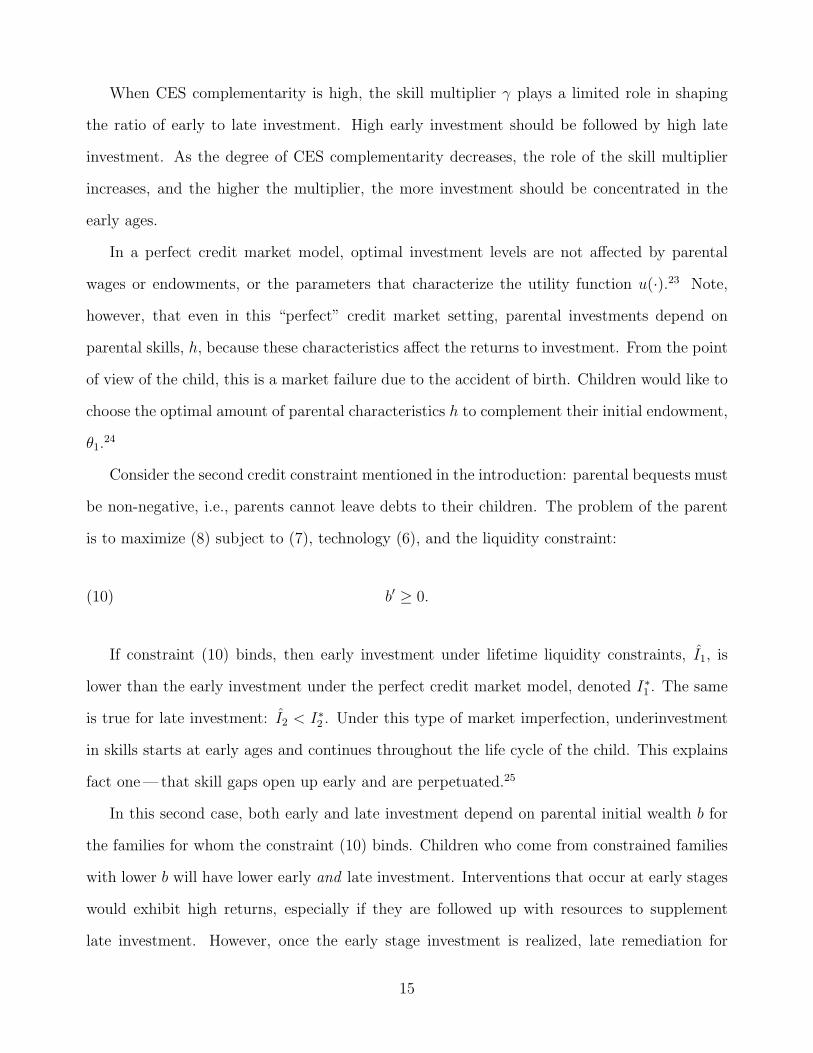
Consider the second credit constraint mentioned in the introduction: parental bequests must
be non-negative, i.e., parents cannot leave debts to their children. The problem of the parent
is to maximize (8) subject to (7), technology (6), and the liquidity constraint:
(10) b′ ≥ 0.
If constraint (10) binds, then early investment under lifetime liquidity constraints, I1, is
lower than the early investment under the perfect credit market model, denoted I∗1 . The same
is true for late investment: I2 < I∗2 . Under this type of market imperfection, underinvestment
in skills starts at early ages and continues throughout the life cycle of the child. This explains
fact one—that skill gaps open up early and are perpetuated.25
In this second case, both early and late investment depend on parental initial wealth b for
the families for whom the constraint (10) binds. Children who come from constrained families
with lower b will have lower early and late investment. Interventions that occur at early stages
would exhibit high returns, especially if they are followed up with resources to supplement
late investment. However, once the early stage investment is realized, late remediation for
15

disadvantaged children would produce lower returns if early and late investment are not perfect
substitutes and late investment is more productive the higher the level of early investment.
This helps to explain fact five in Section I.
The effects of government policies on promoting the accumulation of human capital depend
on the complementarity between early and late investment as well as on whether the policies
were anticipated by parents or not. For example, the short-run effects of an unanticipated
policy that subsidizes late investment will have weaker effects the greater the complementarity
between early and late investment. If the technology is Leontief, there is no short-run impact
of the policy on adolescent investment. At the time the policy is announced, poor parents have
already made their early investment decisions and, in the Leontief case, it is not possible to
compensate by increasing late investment as a response to the subsidy.
There is, however, a long-run effect of the policy. If the policy is a permanent change
announced before the child is born, new parents will adjust both early and late investment
in response to the subsidy to late investment. Note that the same is true for an exogenous
increase in the return to education. If there is strong complementarity between early and late
investment, in the short run we would expect weak reactions to the increase in returns to
education as gauged by adolescent investment decisions for the children from very poor family
backgrounds, but stronger reactions in the long run. This analysis provides an explanation for
why the college enrollment response to unanticipated increases in the returns to college were
initially so strong for adolescents from advantaged families and initially so weak for adolescents
from less advantaged families. Adolescents from less advantaged families are more likely to lack
the foundational skills that make college going productive, compared to adolescents from more
advantaged families. See Figure D10 on the website.
There is no trade-off between equity and efficiency in early childhood investment. Gov-
ernment policies to promote early accumulation of human capital should be targeted to the
children of poor families. However, the optimal second-period intervention for a child from a
disadvantaged environment depends critically on the nature of technology (6). If I1 and I2
16

are perfect CES complements, then a low level of I1 cannot be compensated at any level of
investment by a high I2. On the other hand, suppose that φ = 1, so the technology m2 can
be written with inputs as perfect CES substitutes. In this case, a second-period intervention
can, in principle, eliminate initial skill deficits (low values of I1). At a sufficiently high level of
second-period investment, it is technically possible to offset low first-period investment, but it
may not be cost effective to do so. If γ is sufficiently low relative to r, it is more efficient to
postpone investment.
The concepts of critical and sensitive periods are defined in terms of the technical possi-
bilities of remediation. Many noneconomists frame the question of remediation for adverse
environments in terms of what is technically possible— not what is economically efficient. Our
analysis considers both technological possibilities and costs. From an economic point of view,
critical and sensitive periods should be defined in terms of the costs and returns of remediation,
and not solely in terms of technical possibilities.
Another source of market failure arises when parents are subject to lifetime liquidity con-
straints and constraints that prevent parents from borrowing against their own future labor
income, which may affect their ability to finance investment in the child’s early years.26 This is
the third constraint considered in the introduction. To analyze this case, assume that parental
productivity grows exogenously at rate α. Let s denote parental savings. We write the con-
straints facing the parent at each stage of the life cycle of the child as:
(first stage) c1 + I1 +s
(1 + r)= wh + b
(second stage) c2 + I2 +b′
(1 + r)= w (1 + α) h + s,
where s ≥ 0 and b′ ≥ 0. The restriction s ≥ 0 says that the parent cannot borrow income
from their old age to finance consumption and investment when the child is in the first stage
of the life cycle. Some parents may be willing to do this, especially when α is high. In the case
17

when s ≥ 0 and b′ ≥ 0 bind, and investments in different periods are not perfect substitutes,
early income matters. To see this, note that if u (c) = (cσ − 1)/σ, the ratio of early to late
investment is
I1
I2
=
[γ
(1− γ) (1 + r)
] 11−φ
[(wh + b− I1)
β ((1 + α) wh− I2)
] 1−σ1−φ
.
If early income is low with respect to late income, the ratio I1/I2 will be lower than the
optimal ratio. The deviation from the optimal ratio will be larger the lower the elasticity of
intertemporal substitution of consumption (captured by the parameter σ). Early income would
not matter if σ = 1, which would be the case when consumption at stage one is a perfect
substitute for consumption in stage two. Substitutability through parental preferences can
undo lack of substitutability in the technology of skill formation.
Our analysis of credit constrained families joined with a low value of φ interprets the evidence
presented by Duncan and Brooks-Gunn, Morris et al., Duncan and Kalil, and Dahl and Lochner
that the timing of family income in the early stages of childhood has some effect on the level
of ability and achievement of the children. This is fact five of Section I. Our analysis also
interprets the evidence of Carneiro and Heckman and Cameron and Taber that conditioning
on child ability, family income in the adolescent years has only a minor effect on adolescent
schooling choices.
IV Cognitive and Noncognitive Skill Formation
A large body of research documents the socioemotional basis of reason (see Antonio R. Damasio,
1994; Joseph E. LeDoux, 1996). Our analysis goes beyond this literature to formalize a body of
evidence that emotional skills promote learning. Mechanisms relating cortisol to stress and the
effects of cortisol on brain development have been documented by Suomi (1999) and Meaney
(2001) for animals. Duncan et al. (2006) and Raver et al. (2006) show that a child’s ability to
pay attention facilitates later learning.
The framework developed in Section II readily accommodates skill vectors.27 The evidence
summarized in Section I shows the importance of both cognitive and noncognitive skills in
18

determining adult outcomes. Child development is not just about cognitive skill formation
although a lot of public policy analysis focuses solely on cognitive test scores. Let θt denote
the vector of cognitive and noncognitive skills: θt =(θC
t , θNt
). Let It denote the vector of
investment in cognitive and noncognitive skills: It =(ICt , IN
t
). We use h =
(hC , hN
)to denote
parental cognitive and noncognitive skills. At each stage t, we can define a recursive technology
for cognitive skills (k = C), and noncognitive skills, (k = N):
(11) θkt+1 = fk
t
(θC
t , θNt , Ik
t , hC , hN), k ∈ {C, N}.
Note that technology (11) allows for cross-productivity effects: cognitive skills may affect the
accumulation of noncognitive skills and vice versa. They also allow for critical and sensitive
periods to differ by skill, as required to account for fact two.
If cognitive and/or noncognitive skills determine costs of effort, time preference or risk
aversion parameters, parental investments affect child and adult behavior. Our analysis of
preference formation contrasts with the analyses of Hideo Akabayashi (1996) and Bruce A.
Weinberg (2001). Those authors build principal-agent models where the parent (the principal)
and the child (the agent) agree on contracts in which parents financial transfers are conditional
on observable measures of effort (e.g., test scores in school). These contracts are designed so
that the children are driven towards the level of effort desired by the parents. In our model,
parents directly shape child preferences.
Accounting for preference formation enables us to interpret the success of many early child-
hood programs targeted to disadvantaged children which do not permanently raise IQ, but
which permanently boost social performance.28 This is fact six of Section I. The controversy
over Head Start fadeout may have been a consequence of relying only on cognitive measures to
gauge performance. The Perry Preschool Program had an IQ fadeout but a lasting effect on a
variety of participants through age 40. They work harder, are less likely to commit crime, and
participate in many fewer social pathologies than do control group members.29
19
V Estimates of the Technology
Cunha and Heckman (2006a) and Cunha et al. (2006b) estimate recursive multistage technology
(6) with cognitive and noncognitive skills generating adult outcomes like schooling, earnings and
occupational choice.30 They develop new econometric methods that extend factor analysis to a
nonlinear setting. We refer the reader to those papers for econometric details and discussions
of the rich panel data on child development that makes such estimation possible.
They find strong evidence of self-productivity and complementarity. Their evidence is consis-
tent with the literature demonstrating malleability of the prefrontal cortex governing executive
function and socioeconomic development as well as the stability of IQ measures after age 10
cited in Section I. They find higher substitutability of early and late investment in producing
noncognitive skills and lower substitutability of early investment in producing cognitive skills.
Higher stocks of noncognitive skills promote the self-productivity of cognitive skills; cognitive
skill stocks promote the self-productivity of noncognitive skills. Higher levels of both cognitive
and noncognitive skills raise the productivity of subsequent investment. There is evidence of
sensitive periods for parental investment. The productivity of parental investment is higher
in early stages for cognitive skills with a fall off in their productivity in later years. The
productivity of parental investment is higher at later stages for noncognitive skills. This evi-
dence is consistent with greater malleability of the prefrontal cortex governing socioemotional
development into the early 20s, documented by Dahl (2004).
Cunha et al. (2006b) estimate a strong interaction between initial endowments and parental
investments that calls into question the conventional additive model of nature vs. nurture. This
evidence is consistent with the modern literature on epigenetics. Nature and nurture interact
to produce child outcomes and environmental effects that last across generations. Even θ1,
endowment at birth, is affected by environmental factors as a large literature documents (see,
e.g., Shonkoff and Phillips, 2000).
20
VI Lessons for the Design of Policies
Cunha and Heckman (2006b) simulate the nonlinear model of skill formation estimated by
Cunha et al. (2006b) to show the importance of self-productivity and complementarity for
designing policies to reduce inequality. We focus our analysis on children from disadvantaged
backgrounds because at current levels of social inequality they benefit the most from policies
that supplement early environments.31 Disadvantaged children are at risk of being permanently
poor and uneducated, and of participating in crime. In our simulation, disadvantaged children
come from a background where mothers are in the first decile in the distribution of parental
skills. If no intervention occurs, the children receive investments equivalent to the first decile
of the distribution of parental investments.
Consider three different policies. The first policy is a Perry Preschool-like policy. It provides
investment at early ages that moves children from the first decile of child cognitive skills at entry
age to the fourth decile of child skills at the age of exit from the program. This gain can be
achieved by moving parental investment from the bottom decile to around the seventh decile
of the family investment distribution. In this policy, there is no follow-up investment. We
also consider a second policy for the same target population that postpones remediation until
adolescence. It compensates early shortfalls by investing larger amounts in adolescent stages of
the life cycle to produce approximately the same high school graduation rates that are observed
in the Perry program.
College tuition programs, adolescent literacy programs and mentoring programs are exam-
ples of such a policy. To achieve Perry-like outcomes for this population through adolescent
investment, it is necessary to move adolescent investment to the top of the parental investment
distribution. The present value of the costs of the investment in this adolescent remediation
program is more than 35% larger than in the Perry Preschool program. Late remediation is
possible but it is costly. The case for early childhood intervention is based more on the im-
portance of sensitive periods in the life cycle of the child than on the importance of critical
periods. We contrast early-only and late-only investment policies with a third policy that op-
21
timally distributes the resources spent in the second policy over the full life cycle of the child.
A balanced investment strategy is the most efficient.
The first column of numbers in Table 1 reports high-school graduation, college enrollment,
conviction, probation, and use of welfare if no intervention is made. Our model predicts a 41%
high school graduation rate for this group, compared to 41.4% found in the Perry control group.
Only 4.5% of the control group ever enroll in college. Around 22% of them will be convicted
of a crime or be on probation at some point in their adult lives. About 18% will make use of
welfare programs in their adult years.
The second column of numbers in Table 1 reports the performance of our Perry-like early
intervention policy. This policy increases high school graduation and college enrollment rates to
more than 65% and 12%, respectively. It reduces participation in crime. It makes the children
more productive when they are adults. It cuts in half the probability that the child collects
welfare benefits in his/her early adult years. These effects are comparable to those reported in
the Perry preschool intervention (See, e.g., Schweinhart et al., 2005). Thus, with our technology,
we can rationalize the results found in the Perry program as an intervention that boosts parental
investments (but not parental characteristics) from the first decile of investment in children to
the fourth decile.
The third column of the numbers in Table 1 displays the performance of a 35% more costly
policy that produces comparable educational outcomes for those obtained in the Perry-like
intervention. Adolescent interventions can be effective, but they are more costly than early
interventions. The greater cost associated with later remediation arises from lost gains in self-
productivity and dynamic complementarity from early investment that are a key feature of our
model.
The empirical importance of dynamic complementarity—the fact that the marginal produc-
tivity of investment depends on the level of skills produced by previous investments— generates
an important insight for the design of policies. For a fixed expenditure, policies that are bal-
anced increase returns and are more productive than policies tailored to one segment of the
22
life cycle of the child. The returns to later investment are greater if higher early investment is
made. Perry children made less use of remedial education than peers who did not receive treat-
ment. The intervention made later schooling more effective. If early interventions are followed
up with later interventions in an optimal fashion, outcomes can be considerably improved.
The fourth column of numbers in Table 1 presents the results from a balanced policy. It
displays the outcomes that can be produced by an intervention that distributes the funds spent
on the adolescent-only intervention in an optimal way. For a balanced program, high school
graduation and college enrollment rates are, respectively, 91% and 37%. The reduction in
conviction and probation rates is better than what is obtained from an adolescent-only policy,
and welfare use is reduced to a low 2.6% rate. Complementarity implies that early investment
is more productive if it is followed up with late investment. And late investment is more
productive if it is preceded by early investment. The mechanism that makes the balanced
intervention more effective has a very simple economic interpretation. When adolescent-only
interventions are made, baseline skills are low and, consequently, so is the marginal productivity
of later investment. A balanced investment program increases the stock of skills of the child
coming into adolescence. Because the marginal productivity of later investment depends on the
level of skills acquired prior to adolescence, the investment in the last period is more productive.
Thus, the same amount of total investment distributed more evenly over the life cycle of the
child produces more adult skills than a policy that concentrates attention on only one part of
the child’s life cycle.
VII Summary and Extensions
A technology of cognitive and noncognitive skill formation that features self-productivity, dy-
namic complementarity and skill multipliers explains a variety of findings established in the
child development and child intervention literatures. Although we have focused on cognitive
and noncognitive skills, our analysis also applies to the formation of physical health capital. (See
Cunha and Heckman, 2006c.) The evidence on the importance of early childhood environments
on adult health (David J. P. Barker, 1998, and Anne Case et al., 2005) can be rationalized by
23

our technology. Stocks of cognitive and noncognitive skills facilitate the accumulation of health
capital through self-regulation and choices. Stocks of health skills also raise the productivity of
schooling (Alok Bhargava, 2008).
24

References
Aiyagari, S. Rao, Jeremy Greenwood, and Ananth Seshadri. 2002. “Efficient Investment in
Children.” Journal of Economic Theory, 102(2):290–321.
Akabayashi, Hideo. 1996. “On the Role of Incentives in the Formation of Human Capital in
the Family.” Ph.D. thesis, University of Chicago.
Barker, David J. P. 1998. Mothers, Babies and Health in Later Life. Edinburgh: Churchill
Livingstone.
Barnett, W. Steven. 2004. “Benefit-Cost Analysis of Preschool Education.” PowerPoint pre-
sentation. URL http://nieer.org/resources/files/BarnettBenefits.ppt.
Becker, Gary S. 1991. A Treatise on the Family. Cambridge, MA: Harvard University Press,
enlarged ed.
Becker, Gary S. 1993. Human Capital: A Theoretical and Empirical Analysis, with Special
Reference to Education. University of Chicago Press, 3rd ed.
Becker, Gary S. and Nigel Tomes. 1986. “Human Capital and the Rise and Fall of Families.”
Journal of Labor Economics, 4(3, Part 2):S1–S39.
Ben-Porath, Yoram. 1967. “The Production of Human Capital and the Life Cycle of Earnings.”
Journal of Political Economy, 75(4, Part 1):352–365.
Benabou, Roland. 2002. “Tax and Education Policy in a Heterogeneous Agent Economy: What
Levels of Redistribution Maximize Growth and Efficiency?” Econometrica, 70(2):481–517.
Bhargava, Alok. 2008. Food, Economics and Health. Oxford: Oxford University Press. Forth-
coming.
25
Blau, David and Janet Currie. 2006. “Preschool, Daycare, and Afterschool Care: Who’s Mind-
ing the Kids?” In Handbook of the Economics of Education, edited by Eric Hanushek and
Finis Welch, vol. 1 of Handbooks in Economics. Amsterdam: North-Holland.
Borghans, Lex, James J. Heckman, and Bas ter Weel. 2006. “The Economics of Noncognitive
Skills.” Unpublished manuscript, University of Chicago, Department of Economics. Forth-
coming, Journal of Human Resources.
Bowles, Samuel, Herbert Gintis, and Melissa Osborne. 2001. “The Determinants of Earnings:
A Behavioral Approach.” Journal of Economic Literature, 39(4):1137–1176.
Cameron, Judy. 2004. “Evidence For An Early Sensitive Period For The Development Of Brain
Systems Underlying Social Affiliative Behavior.” Unpublished manuscript, Oregon National
Primate Research Center.
Cameron, Stephen V. and James J. Heckman. 2001. “The Dynamics of Educational Attainment
for Black, Hispanic, and White Males.” Journal of Political Economy, 109(3):455–99.
Cameron, Stephen V. and Christopher Taber. 2004. “Estimation of Educational Borrowing
Constraints Using Returns to Schooling.” Journal of Political Economy, 112(1):132–182.
Carneiro, Pedro, Flavio Cunha, and James J. Heckman. 2003. “Interpreting the Evidence
of Family Influence on Child Development.” In The Economics of Early Childhood Devel-
opment: Lessons for Economic Policy. Minneapolis, Minnesota: The Federal Reserve Bank.
Presented at ”The Economics of Early Childhood Development: Lessons for Economic Policy
Conference,” Minneapolis Federal Reserve Bank, Minneapolis, MN. October 17, 2003.
Carneiro, Pedro and James J. Heckman. 2002. “The Evidence on Credit Constraints in Post-
Secondary Schooling.” Economic Journal, 112(482):705–734.
Carneiro, Pedro and James J. Heckman. 2003. “Human Capital Policy.” In Inequality in
America: What Role for Human Capital Policies?, edited by James J. Heckman, Alan B.
Krueger, and Benjamin M. Friedman. Cambridge, MA: MIT Press.
26

Carneiro, Pedro, James J. Heckman, and Edward J. Vytlacil. 2006. “Estimating Marginal and
Average Returns to Education.” Under review, American Economic Review.
Case, Anne, Angela Fertig, and Christina Paxson. 2005. “The Lasting Impact of Childhood
Health and Circumstance.” Journal of Health Economics, 24(2):365–389.
Caspi, Avshalom, Joseph McCLay, Terrie E. Moffitt, Jonathan Mill, Judy Martin, Ian W.
Craig, Alan Taylor, and Richie Poulton. 2002. “Role of Genotype in the Cycle of Violence in
Maltreated Children.” Science, 297(5582):851–854.
Caucutt, Elizabeth and Lance J. Lochner. 2004. “Early and Late Human Capital Investments,
Credit Constraints, and the Family.” Unpublished manuscript, University of Western Ontario,
Department of Economics.
Cunha, Flavio and James J. Heckman. 2006a. “Formulating, Identifying and Estimating the
Technology of Cognitive and Noncognitive Skill Formation.” Unpublished manuscript, Uni-
versity of Chicago, Department of Economics. Forthcoming, Journal of Human Resources.
Cunha, Flavio and James J. Heckman. 2006b. “Investing in our Young People.” Unpublished
manuscript, University of Chicago, Department of Economics.
Cunha, Flavio and James J. Heckman. 2006c. “The Technology and Neuroscience of Skill and
Health Formation.” Presented at Economic Causes and Consequences of Population Aging,
Robert Fogel 80th Birthday Celebration, November 18, 2006. Forthcoming in Proceedings of
the National Academy of Sciences special issue in honor of Robert Fogel.
Cunha, Flavio, James J. Heckman, Lance J. Lochner, and Dimitriy V. Masterov. 2006a. “In-
terpreting the Evidence on Life Cycle Skill Formation.” In Handbook of the Economics of
Education, edited by Eric A. Hanushek and Frank Welch. Amsterdam: North-Holland, 697–
812.
Cunha, Flavio, James J. Heckman, and Susanne M. Schennach. 2006b. “Estimating the Tech-
nology of Cognitive and Noncognitive Skill Formation.” Unpublished manuscript, University
27

of Chicago, Department of Economics. Presented at the Yale Conference on Macro and Labor
Economics, May 5–7, 2006. Under revision, Econometrica.
Currie, Janet and Duncan Thomas. 1995. “Does Head Start Make a Difference?” American
Economic Review, 85(3):341–364.
Currie, Janet and Duncan Thomas. 2000. “School Quality and the Longer-Term Effects of Head
Start.” Journal of Human Resources, 35(4):755–774.
Dahl, Gordon B. and Lance J. Lochner. 2004. “The Impact of Family Income on Child Achiev-
ment.” Unpublished manuscript, University of Western Ontario.
Dahl, Ronald E. 2004. “Adolescent Brain Development: A Period of Vulnerabilities and Op-
portunities.” In Annals of the New York Academy of Sciences, edited by Ronald E. Dahl and
Linda Patia Spear. New York: New York Academy of Sciences, 1–22.
Damasio, Antonio R. 1994. Descartes’ Error: Emotion, Reason, and the Human Brain. New
York: Putnam.
Duncan, Greg and Ariel Kalil. 2006. “The Effects of Income in the Early Years on Child
Outcomes.” Unpublished manuscript, Northwestern University.
Duncan, Greg J. and Jeanne Brooks-Gunn. 1997. “Income Effects Across the Life Span: In-
tegration and Interpretation.” In Consequences of Growing Up Poor, edited by G. Duncan
and J. Brooks-Gunn. New York: Russell Sage Foundation, 596–610.
Duncan, Greg J., Chantelle J. Dowsett, Amy Claessens, Katherine Magnuson, Aletha C. Hus-
ton, Pamela Klebanov, Linda Pagani, Leon Feinstein, Mimi Engel, Jeanne Brooks-Gunn,
Holly Sexton, Kathryn Duckworth, and Crista Japeli. 2006. “School Readiness and Later
Achievement.” Working paper. Northwestern University.
Erikson, Erik H. 1950. Childhood and Society. New York: Norton.
28

Hansen, Karsten T., James J. Heckman, and Kathleen J. Mullen. 2004. “The Effect of Schooling
and Ability on Achievement Test Scores.” Journal of Econometrics, 121(1-2):39–98.
Heckman, James J. 1995. “Lessons from The Bell Curve.” Journal of Political Economy,
103(5):1091.
Heckman, James J., Maria Isabel Larenas, and Sergio Urzua. 2004. “Accounting for the Effect
of Schooling and Abilities in the Analysis of Racial and Ethnic Disparities in Achievement
Test Scores.” Unpublished manuscript, University of Chicago, Department of Economics.
Heckman, James J., Jora Stixrud, and Sergio Urzua. 2006. “The Effects of Cognitive and
Noncognitive Abilities on Labor Market Outcomes and Social Behavior.” Journal of Labor
Economics, 24(3):411–482.
Herrnstein, Richard J. and Charles A. Murray. 1994. The Bell Curve: Intelligence and Class
Structure in American Life. New York: Free Press.
Hopkins, Kenneth D. and Glenn H. Bracht. 1975. “Ten-Year Stability of Verbal and Nonverbal
IQ Scores.” American Educational Research Journal, 12(4):469–477.
Knudsen, Eric I., James J. Heckman, Judy Cameron, and Jack P. Shonkoff. 2006. “Economic,
neurobiological, and behavioral perspectives on building America’s future workforce.” Pro-
ceedings of the National Academy of Sciences, 103(27):10155–10162.
LeDoux, Joseph E. 1996. The Emotional Brain: The Mysterious Underpinnings of Emotional
Life. New York: Simon and Schuster.
Meaney, Michael J. 2001. “Maternal Care, Gene Expression, And The Transmission of Indi-
vidual Differences in Stress Reactivity Across Generations.” Annual Review of Neuroscience,
24(1):1161–1192.
Meghir, Costas and Marten Palme. 2001. “The Effect of a Social Experiment in Education.”
Tech. Rep. W01/11, Institute for Fiscal Studies.
29

Morris, Pamela, Greg J. Duncan, and Elizabeth Clark-Kauffman. 2005. “Child Well-Being in
an Era of Welfare Reform: The Sensitivity of Transitions in Development to Policy Change.”
Developmental Psychology, 41(6):919–932.
Murnane, Richard J., John B. Willett, and Frank Levy. 1995. “The Growing Importance of
Cognitive Skills in Wage Determination.” Review of Economics and Statistics, 77(2):251–266.
Newport, Elissa L. 1990. “Maturational Constraints on Language Learning.” Cognitive Science,
14(1, Special Issue):11–28.
O’Connor, Thomas G., Michael Rutter, Celia Beckett, Lisa Keaveney, Jana M. Kreppner, and
the English and Romanian Adoptees Study Team. 2000. “The Effects of Global Severe Priva-
tion on Cognitive Competence: Extension and Longitudinal Follow-Up.” Child Development,
71(2):376–390.
Pinker, Steven. 1994. The Language Instinct: How the Mind Creates Language. New York: W.
Morrow and Co.
Pray, Leslie A. 2004. “Epigenetics: Genome, Meet your Environment.” The Scientist,
18(13):14–20.
Raudenbush, Stephen W. 2006. “Schooling, Statistics and Poverty: Measuring School Improve-
ment and Improving Schools.” Inaugural Lecture, Division of Social Sciences, University of
Chicago.
Raver, C. Cybele, P. Garner, and R. Smith-Donald. 2006. “The Roles of Emotion Regulation
and Emotion Knowledge for Children’s Academic Readiness: Are the Links Causal?” In
Kindergarten Transition and Early School Success, edited by R. C. Pianta and K. Snow.
Baltimore, MD: Brookes Publishing.
Schweinhart, Lawrence J., Jeanne Montie, Zongping Xiang, W. Steven Barnett, Clive R.
Belfield, and Milagros Nores. 2005. Lifetime Effects: The High/Scope Perry Preschool Study
Through Age 40. Ypsilanti, MI: High/Scope Press.
30
Shonkoff, Jack P. and Deborah Phillips. 2000. From Neurons to Neighborhoods: The Science of
Early Child Development. Washington, DC: National Academy Press.
Stinebrickner, Ralph and Todd R. Stinebrickner. 2006. “Credit Constraints and College Attri-
tion.” Revision requested, American Economic Review.
Suomi, Stephen J. 1999. “Developmental Trajectories, Early Experiences, and Community
Consequences: Lessons from Studies with Rhesus Monkeys.” In Developmental Health and
the Wealth of Nations: Social, Biological, and Educational Dynamics, edited by Daniel P.
Keating and Clyde Hertzman. The Guilford Press, 185–200.
Turkheimer, Eric, Andreana Haley, Mary Waldron, Brian D’Onofrio, and Irving I. Gottesman.
2003. “Socioeconomic Status Modifies Heritability of IQ in Young Children.” Psychological
Science, 14(6):623–628.
Weinberg, Bruce A. 2001. “An Incentive Model of the Effect of Parental Income on Children.”
Journal of Political Economy, 109(2):266–280.
31
Notes
∗This research was supported by NIH R01-HD043411, NSF SES-024158, the Committee
for Economic Development with a grant from The Pew Charitable Trusts and the Partner-
ship for America’s Economic Success, and the J.B. Pritzker Consortium on Early Childhood
Development at the Harris School of Public Policy, University of Chicago. Flavio Cunha also
acknowledges support from the Claudio Haddad dissertation fund at the University of Chicago.
The views expressed in this paper are those of the authors and not necessarily those of the fun-
ders listed here. The first draft of this paper, written with Pedro Carneiro, was presented at a
conference at the Minneapolis Federal Reserve, October 2003. We thank Gary S. Becker, Janet
Currie and Greg J. Duncan for helpful comments. A website at http://jenni.uchicago.edu/tech-
skill/ contains supporting material.
1For example, Becker (1993, pp. 99–100) contrasts the implications for the earnings distri-
bution of ability models of earnings and human capital models, claiming the latter are more
consistent with the empirical evidence on earnings. The implicit assumption in his analysis and
the literature it spawned is that ability is determined by “nature”, i.e., is genetic, and outside
the influence of family investment strategies.
2There is some evidence that the modified genes are heritable (see Pray, 2004).
3Some recent evidence on gene-environment interactions resulting from child maltreatment
is presented in Avshalom Caspi et al. (2002).
4Permanent income is the measure of socioeconomic status in this figure. See CHLM for the
source of this figure and the precise definition of permanent income.
5These and other figures are posted at the website for this paper. See Figures D0–D8 on
the website.
6See Figures D1–D3 on the website.
7Currie and Thomas (2000) present additional analyses of the Head Start Program.
8See the Figure D9 series.
9CHLM briefly discuss the evidence on this point and suggest a model of comparative ad-
32

vantage in occupational choice to supplement their model of skill formation.
10We discuss the comparison between our technology and that of Ben-Porath (1967) in Sec-
tion B of the website.
11We develop our formal OLG model in Section C of our website.
12A sketch of such a model is discussed in Carneiro et al., 2003.
13These conditions are sufficient. There is no need for a differentiability requirement for h,
and the differentiability requirement with respect to θt can be weakened.
14Examples are developed in Section A at our website.
15See CHLM for a definition of critical and sensitive periods in terms of technology (1). These
definitions are developed further in Section B of the website.
16Our technology applies to in utero and post-natal investments as well. See Jack P. Shonkoff
and Deborah Phillips (2000) for evidence on the importance of such investments.
17CHLM analyze the vector case. See also the supporting material on the website.
18Both periods are critical. Note that in this case the production function is not strictly
differentiable as required in our definition. Our definition can be extended to deal with this
limit case.
19We offer another explanation of the apparently weak Head Start effects below.
20Consider an example in which ft (h, θt, It) = [η1,t (θt)φt +η2,t (It)
φt +η3,t (h)φt ]ρtφt for t = 1, 2;
ρ1 = 1, ρ2 < 1; and η1,t + η2,t + η3,t = 1. Then, substituting for θ2, we obtain m2 (h, θ1, I1, I2) =
[η1,2(η1,1 (θ1)φ1 +η2,1 (I1)
φ1 +η3,1 (h)φ1)φ2φ1 +η2,2 (I2)
φ2 +η3,2 (h)φ2 ]ρ2φ2 . The parameter φ2 describes
how easy it is to compensate early neglect with second-period investment. The parameter φ1
describes the compensation possibilities for overcoming adverse initial conditions θ1 with first-
period investment. The technology in the text is obtained by setting φ1 = φ2, η3,1 = η3,2 =
η1,1 = 0, so that γ = η1,2η2,1 and η2,2 = 1−γ. See Section A.1 at the website for further analysis
of this and related cases.
21Section C of the website develops this analysis for an overlapping generations model.
22Table A1 on the website concisely summarizes this analysis.
33

23We refer to parental resources specific to a given generation.
24This thought experiment is whimsical. If parents create the child, through genes and
environment, the child is not an independent actor. Under a homunculus theory, the child
would have an identity independent of the parent.
25Of course other reasons why skill gaps open up early and are perpetuated is variation in h
and θ1, the parental environmental and initial endowment variables, respectively.
26This type of constraint is also analyzed by Elizabeth Caucutt and Lochner (2004).
27See Section B at our website.
28The Abecedarian early intervention program permanently boosted adult IQ. See CHLM.
29See the D9 series on the website. The exact mechanism by which noncognitive skills are
boosted is not yet established. It could be that noncognitive skills are created directly in the
early years and persist. It could also be that the higher early cognitive skills that fade out
foster noncognitive skills that persist. Both channels of influence could be in operation.
30Anchoring test score outcomes in behavior avoids reliance on arbitrarily scaled test scores
as a measure of output. See Cunha and Heckman (2006a) and Cunha et al. (2006b).
31This is fact three of Section I.
34

Table 1. Comparison of different investment strategies
Disadvantaged children: first decile in the distribution of cognitive and noncognitive skills at age 6
Mothers are in first decile in the distribution of cognitive and noncognitive skills at ages 14-21
Baseline Changing initial
conditions:
Moving children to the
4th decile of distribution
of skills only through
early investment
Adolescent intervention:
Moving investments at
last transition from 1st to
9th decile
Changing initial
conditions and
performing a balanced
intervention
High school graduation 0.4109 0.6579 0.6391 0.9135
Enrollment in college 0.0448 0.1264 0.1165 0.3755
Conviction 0.2276 0.1710 0.1773 0.1083
Probation 0.2152 0.1487 0.1562 0.0815
Welfare 0.1767 0.0905 0.0968 0.0259
Note: The adolescent-only and balanced intervention programs cost 35% more than the Perry program
Source: Cunha and Heckman (2006b)
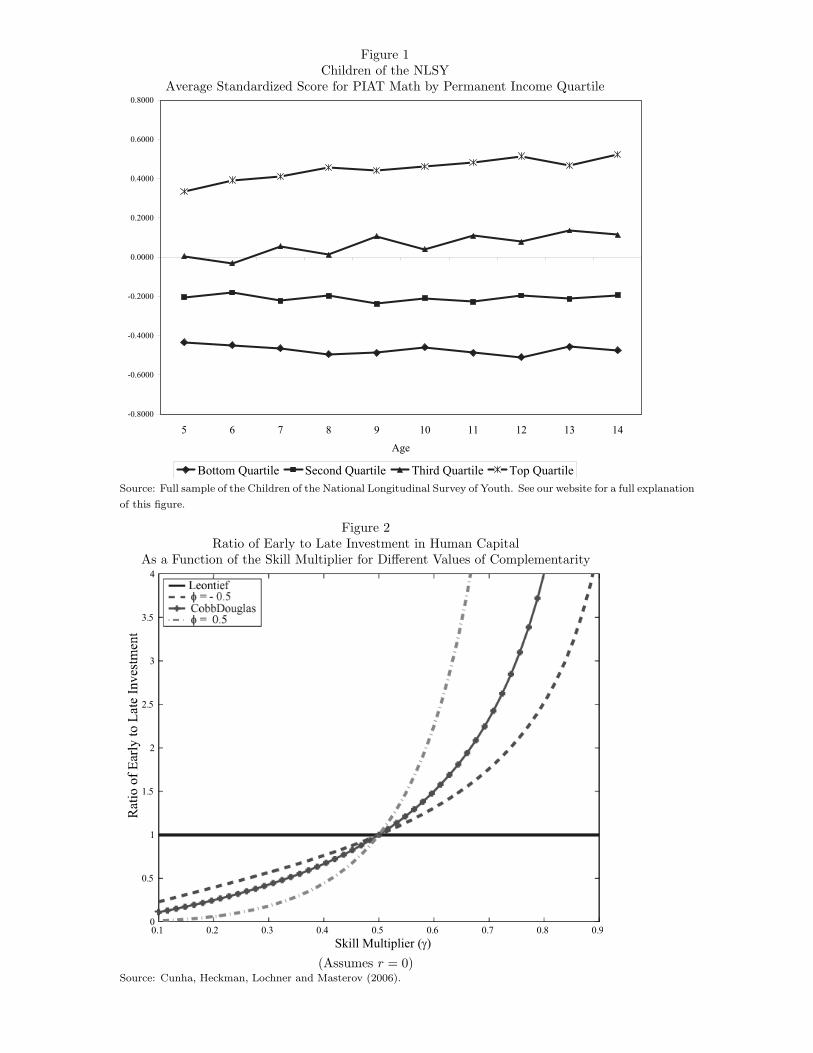
Figure 1Children of the NLSY
Average Standardized Score for PIAT Math by Permanent Income Quartile
0008.0-
0006.0-
0004.0-
0002.0-
0000.0
0002.0
0004.0
0006.0
0008.0
413121110198765
egA
elitrauQ mottoB elitrauQ dnoceS elitrauQ drihT elitrauQ poT
Source: Full sample of the Children of the National Longitudinal Survey of Youth. See our website for a full explanation
of this figure.
Figure 2Ratio of Early to Late Investment in Human Capital
As a Function of the Skill Multiplier for Different Values of Complementarity
0.1 0.2 0.3 0.4 0.5 0.6 0.7 0.8 0.90
0.5
1
1.5
2
2.5
3
3.5
4
Leontief= - 0.5
CobbDouglas= 0.5
Skill Multiplier ( )
(Assumes r = 0)Source: Cunha, Heckman, Lochner and Masterov (2006).