the technical and economic feasibility of a freight pipeline system in texas
TRANSCRIPT

Technical Report Documentation Page 1. Report No.
FHWA/TX-01/1519-1
2. Government Accession No.
3. Recipient's Catalog No.
4. Title and Subtitle
THE TECHNICAL AND ECONOMIC FEASIBILITY OF A FREIGHT PIPELINE SYSTEM IN TEXAS – YEAR 1 REPORT
5. Report Date
November 2000
6. Performing Organization Code
7. Author(s)
Stephen S. Roop, Leslie Olson, Jeffery Warner, Curtis Morgan, and Othon Rediniotis
8. Performing Organization Report No.
Report 1519-1
9. Performing Organization Name and Address
Texas Transportation Institute The Texas A&M University System College Station, Texas 77843-3135
10. Work Unit No. (TRAIS)
11. Contract or Grant No.
Project No. 9-1519 12. Sponsoring Agency Name and Address
Texas Department of Transportation Research and Technology Implementation Office P. O. Box 5080 Austin, Texas 78763-5080
13. Type of Report and Period Covered
Research: August 1999 – September 2000
14. Sponsoring Agency Code
15. Supplementary Notes
Research performed in cooperation with the Texas Department of Transportation and the U.S. Department of Transportation, Federal Highway Administration. Research Project Title: Freight Pipeline Feasibility Study 16. Abstract
The North American Free Trade Agreement (NAFTA) has accelerated the rate of growth between Canada, Mexico, and the United States. Tremendous quantities of goods now flow between these three trading partners, mostly transported by truck. Texas, because of its geographic location, serves as the principal land-side gateway to Mexico, and, as a consequence, hosts truck traffic from all over the U.S., Mexico, and Canada. This truck traffic is beginning to dominate certain Texas highways. It costs the state large sums of money to maintain the condition of the affected roadways. The current research is aimed at determining whether non-traditional systems can alleviate the congestion and wear problem by shifting truck–carried goods to an alternative mode. Freight-conveying pipelines are being evaluated in this context. 17. Key Words
Freight, Pipeline, Underground, Freight Movement
18. Distribution Statement
No restrictions. This document is available to the public through NTIS: National Technical Information Service 5285 Port Royal Road Springfield, Virginia 22161
19. Security Classif.(of this report)
Unclassified
20. Security Classif.(of this page)
Unclassified
21. No. of Pages
100
22. Price
Form DOT F 1700.7 (8-72) Reproduction of completed page authorized


THE TECHNICAL AND ECONOMIC FEASIBILITY OF A FREIGHT PIPELINE SYSTEM IN TEXAS – YEAR 1 REPORT
by
Stephen S. Roop, Ph.D. Research Scientist
Texas Transportation Institute
Leslie Olson Associate Research Scientist
Texas Transportation Institute
Jeffery Warner Engineering Research Associate Texas Transportation Institute
Curtis Morgan
Engineering Research Associate Texas Transportation Institute
and
Othon Rediniotis
Aerospace Engineering Texas A&M University System
Report 1519-1 Project Number 9-1519
Research Project Title: Freight Pipeline Feasibility Study
Sponsored by the Texas Department of Transportation
In Cooperation with the U.S. Department of Transportation Federal Highway Administration
November 2000
TEXAS TRANSPORTATION INSTITUTE The Texas A&M University System College Station, Texas 77843-3135

Texas Transportation Institute v Rail Research Center/AAR Affiliated Lab
DISCLAIMER
The contents of this report reflect the views of the authors, who are responsible for the facts and the accuracy of the data presented herein. The contents do not necessarily reflect the official view or policies of the Federal Highway Administration (FHWA) or the Texas Department of Transportation (TxDOT). This report does not constitute a standard, specification, or regulation.
Texas Transportation Institute vi Rail Research Center/AAR Affiliated Lab
ACKNOWLEDGMENTS
The authors wish to express their appreciation for their forward-thinking sponsors at TxDOT, including the project director, Greg Wood, and the project monitoring committee.

Texas Transportation Institute vii Rail Research Center/AAR Affiliated Lab
TABLE OF CONTENTS
Page
LIST OF FIGURES........................................................................................................................ xi LIST OF TABLES ........................................................................................................................xii CHAPTER 1 – INTRODUCTION ................................................................................................. 1 Sponsorship ..................................................................................................................................... 1 Research Scope and Time Frame .................................................................................................... 2 Systems Engineering Approach ................................................................................................ 2 Economics of the Prototype System.......................................................................................... 2 Political and Institutional Issues................................................................................................ 3 CHAPTER 2 – FIRST YEAR WORK............................................................................................ 5 Underground Freight Pipeline – Current Issues.............................................................................. 5 Brief History of Freight Pipelines ............................................................................................. 5 Coal Slurry Pipelines........................................................................................................... 6 Pneumatic Capsule Pipeline (PCP) ..................................................................................... 6 Hydraulic Capsule Pipeline (HCP) ..................................................................................... 7 Coal Log Pipeline (CLP)..................................................................................................... 7 Summary of Existing Literature on Freight Pipeline Concepts, Infrastructure and Propulsion Alternatives ....................................................................................................... 8 Introduction to Freight Pipelines............................................................................................... 8 Freight Pipeline Systems and Concepts .......................................................................................... 9 General Characteristics ............................................................................................................. 9 Economics ............................................................................................................................... 12 Terminal Logistics................................................................................................................... 13 Policy Issues............................................................................................................................ 13 Corridor Selection Criteria in Texas as Part of a Freight Pipeline Feasibility Study.............. 14 Intra-City ................................................................................................................................. 16 Inter-City ................................................................................................................................. 16 Trans-Texas............................................................................................................................. 16 Conclusions ............................................................................................................................. 20 Suitable Freight Types for Freight Pipeline Transportation.......................................................... 21 Characteristics of Potentially Appropriate Freight........................................................................ 22 Policy Analysis ...................................................................................................................... 23 Policy Issues............................................................................................................................ 23 CHAPTER 3 – SYSTEM ENGINEERING FOR THE FREIGHT PIPELINE SYSTEM ........... 25 Goals.............................................................................................................................................. 26 Needs Statement............................................................................................................................ 26 Needs Analysis.............................................................................................................................. 26 Function Structure ......................................................................................................................... 27 Functional and Performance Requirements .................................................................................. 29

Texas Transportation Institute viii Rail Research Center/AAR Affiliated Lab
Sub-System Conceptual Design ................................................................................................... 30 Underground System (Tunnel Infrastructure) ......................................................................... 30 Infrastructure Alternatives....................................................................................................... 30 Selection of Pipeline Material ................................................................................................. 31 Rigid Pipe.......................................................................................................................... 31 Flexible Pipe...................................................................................................................... 31 Design Requirements .............................................................................................................. 32 Requirement 1: Subterranean System ............................................................................... 32 Requirement 2: 450 Miles Long and Located between Dallas and Laredo ...................... 32 Requirement 3: Entrance/Exit Points from the Tunnel to the Four Terminals ................. 34 Requirement 4: Size to Encompass MTM Traveling in Both Directions With Capsules Carrying Pallets of 40 in. x 48 in. x 60 in........................................... 34 Requirement 5: The Base/Foundation Must Withstand the MTM and the Tunnel Structure.......................................................................................................... 34 Requirement 6: Life Expectancy of 50 Years ................................................................... 34 Requirement 7: Must Accommodate Water Systems (Rivers and Lakes) ........................ 34 Requirement 8: Designed to Handle Natural Disasters (Earthquakes, Floods, etc.)......... 34 Requirement 9: Sealed Against Water Seepage................................................................ 35 Requirement 10: Designed to Handle Emergency Freight Spills from the MTM ............ 35 Requirement 11: Adequate Ventilation............................................................................. 35 Requirement 12: Preventative Maintenance Program....................................................... 35 Requirement 13: Fire Protection ....................................................................................... 36 Cost Analysis of Underground Structure ................................................................................ 36 Power Plant for the System ..................................................................................................... 36 Design for Requirements......................................................................................................... 36 Requirement 1: Rated Power for the Entire System is Roughly Estimated at 70 MW......................................................................................................................... 36 Requirement 2: Uninterrupted and Stable Power Supply ................................................. 37 Requirement 3: Efficient Power Transmission ................................................................. 37 Power Generation Concepts and Options...................................................................................... 38 Coal-Fired Power Plants.......................................................................................................... 38 Oil-Fired Power Plants ............................................................................................................ 38 Natural Gas-Fired Plants ......................................................................................................... 39 Nuclear Power Plants .............................................................................................................. 39 Gas Turbine and Combined-Cycle Plants ............................................................................... 39 Hydroelectric and Pumped Storage Plants .............................................................................. 40 Cost of Power Generation and Transmission................................................................................ 40 Fixed Cost ..................................................................................................................................... 40 Variable Cost................................................................................................................................. 41 Main Transport Mechanism Requirements and Propulsion System Options ............................... 42 Requirements................................................................................................................................. 43 Design Requirements .............................................................................................................. 43 Requirement 1: Capacity................................................................................................... 43 Requirement 2: Performance............................................................................................. 43 Requirement 3: Ability to Vary the Speeds between 0 – 50 mph ..................................... 43 Requirement 4: Automated Command and Control.......................................................... 43

Texas Transportation Institute ix Rail Research Center/AAR Affiliated Lab
Requirement 5: System Safety and Reliability ................................................................. 44 Requirement 6: Environmentally Sound........................................................................... 44 Propulsion System Design Concepts............................................................................................. 44 Concept 1: Use of Natural Gas as Fuel Source for the Onboard Propulsion System ............. 44 Characteristics of Natural Gas........................................................................................... 45 Requirement for Environmental Soundness...................................................................... 45 Availability of Resources for Power ................................................................................. 45 Requirement for Safety ..................................................................................................... 45 Requirement for Capacity and Ability to Transport 450 Miles ........................................ 46 Compressed Natural Gas (CNG)....................................................................................... 46 Liquefied Natural Gas (LNG) ........................................................................................... 46 Feasibility of Using Natural Gas Vehicles.............................................................................. 47 Concept 2: Use of Linear Electric Motors as a Propulsion System ........................................ 47 Feasibility .......................................................................................................................... 48 Cost.................................................................................................................................... 48 Safety and Reliability ........................................................................................................ 48 Concept 3: Onboard Electric Motor as a Propulsion System.................................................. 49 Induction Motors ............................................................................................................... 49 Synchronous Motors ......................................................................................................... 49 Cost.................................................................................................................................... 49 Safety and Reliability ........................................................................................................ 49 Comparison of the Three Propulsion Concepts ...................................................................... 50 Warehousing and Material Handling Subsystem (Terminal)........................................................ 50 Pallet Identification System .......................................................................................................... 53 Identification System for the Freight Pipeline ........................................................................ 53 Radio Frequency Identification Systems (RFID).................................................................... 54 System Configuration.............................................................................................................. 54 Tags ......................................................................................................................................... 55 Antenna ................................................................................................................................... 55 Reader...................................................................................................................................... 55 RF Transponder Programmer.................................................................................................. 55 Terminal RFID System ................................................................................................................. 56 MTM RFID System ...................................................................................................................... 57 Conclusions ................................................................................................................................... 57 Laser System ........................................................................................................................... 57 Radio Frequency (Wireless) Identification System ................................................................ 58 Infrared System ....................................................................................................................... 58 Control System Design.................................................................................................................. 59 Functions Performed by the Control System .......................................................................... 59 Interface Design ...................................................................................................................... 60 Failure Modes and Effects Analysis.............................................................................................. 62 Underground Structure............................................................................................................ 62 Power System.......................................................................................................................... 63 Main Transport Mechanism .................................................................................................... 63 Warehousing and Material Handling System.......................................................................... 63 Control System........................................................................................................................ 64

Texas Transportation Institute x Rail Research Center/AAR Affiliated Lab
Conclusions ................................................................................................................................... 64 Subsystem Designs.................................................................................................................. 64 Underground Structure............................................................................................................ 64 Main Transport Mechanism .................................................................................................... 64 Power Plant System................................................................................................................. 65 Warehousing and Material Handling System.......................................................................... 65 Control Systems ...................................................................................................................... 65 Cost Analysis........................................................................................................................... 65 CHAPTER 4 – NUMERICAL STUDY OF THE AERODYNAMICS OF A CAPSULE FREIGHT PIPELINE........................................................................................................ 67 Introduction ...................................................................................................................... 67 Capsule Aerodynamics.................................................................................................................. 67 Skin Friction............................................................................................................................ 68 Pressure Drag .......................................................................................................................... 69 Shock-Loss .............................................................................................................................. 71 Rolling Resistance................................................................................................................... 71 Notes........................................................................................................................................ 72 Discussion of Preliminary Results ................................................................................................ 73 Basic Considerations in Drag Minimization ........................................................................... 73 Additional Parameters Affecting Drag.................................................................................... 75 Potential Drag Reducing Alternatives..................................................................................... 75 Application of Computational Tools............................................................................................. 75 Conclusions ................................................................................................................................... 76 CHAPTER 5 – 2001 WORK PLAN............................................................................................. 77 Task 1 – Finalize Systems Engineering Design Specification...................................................... 77 Task 2 – Perform Trade-Off Analyses .......................................................................................... 77 Task 3 – Begin Cost Analysis ....................................................................................................... 78 Task 4 – Policy Analysis............................................................................................................... 78 Task 5 – Document Year 2 Results............................................................................................... 79 REFERENCES ...................................................................................................................... 81 APPENDIX ...................................................................................................................... 83

Texas Transportation Institute xi Rail Research Center/AAR Affiliated Lab
LIST OF FIGURES
Page Figure 1. Volume of NAFTA Truck Traffic Carried on Major Highways .................................. 19 Figure 2. Suggested Corridors in Texas for the Freight Pipeline Feasibility Study..................... 21 Figure 3. Power Generation From Different Sources (1991 Data). ............................................. 39 Figure 4. Relative Costs of the Various Power Plants. ................................................................ 41 Figure 5. Schematic Representation of the Functions of the MTM............................................. 42 Figure 6. Schematic Representation of the Warehousing and Material Handling System. ......... 53 Figure 7. Functions of the Control System. ................................................................................. 59 Figure 8a. Schematic Representing the MTM in the Pipeline ..................................................... 60 Figure 8b. Pallet Control in the WHMS....................................................................................... 60 Figure 9. Preliminary Interface Diagram. .................................................................................... 61 Figure 10. Assumed Tunnel Cross Section. ................................................................................. 68 Figure 11. Pressure Drag on Capsule. .......................................................................................... 69 Figure 12. Pressure Drag Due to Boundary Layer. ...................................................................... 70 Figure 13. Effect of Blockage Ratio on Theoretical Drag Components ...................................... 72 Figure 14. Effect of Train Length on Drag Components. ............................................................ 73 Figure 15. Tested Configurations.................................................................................................. 76 Figure 16. Forces Impacting Power Requirements. ..................................................................... 86

Texas Transportation Institute xii Rail Research Center/AAR Affiliated Lab
LIST OF TABLES
Page Table 1. Number of January Truck Shipments into Mexico through Selected Texas Cities (1995-
1999) and the Overall Percentage Change in Shipments for Those Years. .......................... 17 Table 2. Number of January Truck Shipments out of Mexico into Selected Texas Cities (1995-
1999) and the Overall Percentage Change in Shipments for Those Years. .......................... 17 Table 3. Daily Truck VMT, NAFTA Truck VMT, and Average Volume of NAFTA
Trucks by Corridor for 1996. ................................................................................................ 18 Table 4. Annual Costs Imposed on Texas by NAFTA Truck Traffic for 1996. .......................... 20 Table 5. Freight Transportation System....................................................................................... 27 Table 6. RFID System Costs. ....................................................................................................... 56 Table 7. Identification System Scenarios. .................................................................................... 58 Table 8. Schedule and Period of Performance for FY 2001. ....................................................... 79 Table 9. Summary of Power Requirement Calculations. ............................................................. 87

Texas Transportation Institute 1 Rail Research Center/AAR Affiliated Lab
CHAPTER 1 – INTRODUCTION
This is the first report in a planned series of reports detailing an investigation into the feasibility of a solid freight conveying pipeline system for Texas. The impetus behind this project is found in the overwhelming growth in truck traffic on Texas highways. The passage of the North American Free Trade Agreement (NAFTA) with Mexico and Canada in 1993 initiated a surge in trade volume between the participating countries that continues unabated today. Much of this trade moves by truck, and a significant portion moves between the U.S. and Mexico through Texas. While a great deal of NAFTA traffic originates and terminates in Texas, an increasing burden to the Texas highway system has resulted from vehicles passing through the state between Mexico and other U.S. states or Canada.
The adoption of NAFTA has opened up many opportunities including a tremendous
growth in the amount of freight transferred into and out of Mexico and Canada. This has specifically impacted the truck traffic in the state of Texas. According to a survey conducted to project the effect of NAFTA on the Texas Highway System, it was observed that the truck vehicle miles traveled (VMT) on state roadways now exceeds 5.2 million per day. It was also noted that 67 percent of the northbound truck traffic from Mexico reaches its destination in Texas. The amount of money spent on the preservation, mobility, and safety of impacted highways has been estimated at $350 million annually.
The construction cost of an additional lane-mile on existing highways is estimated at $3
million through a rural area and $5 million through an urban area. When the cost of maintenance, rehabilitation, and replacement of existing roadways is factored in, the need for investigating an alternate means of transporting freight within Texas and across the border to Mexico is strongly supported. This project will give a broad overview of the design for a proposed freight transportation system focusing specifically on the region from Dallas to Laredo, Texas. This corridor is the most heavily traveled NAFTA corridor in the state, and evaluation of this route will be an excellent indicator of the feasibility of such a system elsewhere.
SPONSORSHIP
The Texas Transportation Institute (TTI) received a federal earmark in the recent
Transportation Efficiency Act for the 21st Century (TEA-21) legislation to research the feasibility of developing a freight pipeline system in Texas. This project, sponsored by FHWA and the TxDOT, is an important effort to address an emerging challenge. The concept of a freight pipeline is being investigated as a possible means of alleviating some of the problems associated with growing traffic congestion on major highways and meeting the transportation capacity needs of the 21st century. A properly engineered and implemented freight pipeline system could alleviate some of the congestion attributed to truck traffic. Additionally, a freight pipeline could potentially serve to offset some of the construction, maintenance, pollution, and congestion costs currently associated with freight transportation by truck.

Texas Transportation Institute 2 Rail Research Center/AAR Affiliated Lab
RESEARCH SCOPE AND TIME FRAME As a means to determine the economic viability of a freight pipeline system in Texas, TTI is conducting a four and a half year project (1999 - 2004), consisting of three major research areas. These are: 1. systems engineering for a freight conveying pipeline system tailored to the needs of
Texas, 2. economics associated with the resulting system configuration, and 3. political and institutional issues impacting both implementation initiatives and operations.
Systems Engineering Approach
A systems engineering approach is being employed due to the complexity of the system
and the many options available to address the need of a more efficient, less costly freight movement strategy. By establishing a clear vision of the need for a freight pipeline as an alternative and determining functional and performance criteria, the resulting configuration will better approximate an optimal solution to the problem.
Inherent in this approach is the growing recognition that transportation for freight and
transportation for people are different enough to warrant different approaches. Highway systems mixing large numbers of trucks with passenger vehicles are serving neither set of users as effectively as they could if dedicated facilities were available. Congestion, safety, and maintenance concerns are heightened as a result. A freight pipeline could help segregate goods and commodity movements from the movement of people and perhaps do so in a way that achieves an efficient use of public funds.
Economics of the Prototype System
Assuming there are no technological reasons why an underground transport system will
not work, the economics associated with a prototype freight pipeline system will determine the feasibility of the system. Two categories of costs will be evaluated. They are: 1. capital expenditures, and 2. marginal cost of operation.
Capital expenditures to put the system in place will be compared to those required for highway capacity improvements. Capital costs are those costs that are independent of actual freight movement. Major capital costs are the pipe elements themselves, the guide way and propulsion systems, and the hardware required for command and control. While these numbers are important, the vital economic consideration will be the marginal cost of operation or the cost to the user to move one ton of material a distance of one mile (a ton-mile). The marginal costs are directly impacted by the amount of freight moved since the greater the weight of freight moved, the greater the energy requirements (and hence energy costs). All of the operational costs, (i.e., energy consumption, maintenance, management, technicians, etc.) will be unitized by

Texas Transportation Institute 3 Rail Research Center/AAR Affiliated Lab
dollar per ton-mile for each evaluated freight pipeline sub-system. Current estimations are that the cost to accomplish this with trucks is approximately $0.29 per ton-mile.
The economics of system use, should they prove favorable, will be used as an inducement
to the private sector to integrate the freight pipeline into its operations. It is the current working premise that no alternative system will achieve success without the enthusiastic participation of trucking firms. The trucking companies themselves will have to benefit, as will their customers, by providing a lower-cost, higher reliability alternative to highway transportation. The model for these ideas may be found in the U.S. airport system, where publicly funded airports are made available to carriers for a fee. Political and Institutional Issues
Political issues are considered to be all the concerns outside the technological and
economic realm that could affect the ultimate viability of a freight pipeline system during planning, construction, or operation. Political issues are most commonly driven by various interest groups. These groups may consist of competing transportation modes, political entities, environmental groups, landowners, or others. A degree of support for a freight pipeline system is necessary from these factions for the project to move from concept to serious consideration. This project will evaluate one particular political issue, the right of eminent domain, relative to both the state and federal government. Eminent domain may be necessary to facilitate right of passage through private landholdings. Some have contended that without some form of eminent domain, a freight pipeline system will ultimately be infeasible.
The remainder of this interim report will summarize the work produced during the first
year of the project. This work included a review of the literature currently available concerning freight pipelines and their history up to the present day. Also included is information on the progress to date concerning analysis of the concept, systems engineering approach, propulsion system requirements and options, aerodynamic design of freight capsules to minimize power requirements, and handling of the freight pallets once they arrive at the terminal. Finally the report will outline a work plan for FY 2001, the second year of the project.


Texas Transportation Institute 5 Rail Research Center/AAR Affiliated Lab
CHAPTER 2 – FIRST YEAR WORK
UNDERGROUND FREIGHT PIPELINE – CURRENT ISSUES
The growth and development in the trucking industry over the last few decades has shifted a major part of freight transportation from railroads to our nation’s highways. This modal shift has increased the pressure on publicly subsidized highways, which were already facing enormous pressure due to the large growth in the number of passenger vehicles. This increased traffic volume is causing serious problems on many key intercity highway routes where heavy usage creates the need for more frequent maintenance and rehabilitation. There are two ways to address this problem; build more highway capacity by widening existing routes or constructing new roadways, or search for an innovative, yet practical alternative means to move some or all of that traffic.
The answer to the second approach may be found in the freight pipeline, which may extend highway life by diverting freight movement to an alternative mode of transportation. A freight pipeline can be many things. There is much nomenclature in the literature describing general freight pipeline technology as Pneumatic Capsule Pipeline (PCP), Tube Freight Transportation System, Underground Freight Transportation (UFT), and so on. To avoid any confusion the general term of Freight Pipeline seems most appropriate to describe the system under consideration in this project. It is envisioned as an underground system that may have advantages over the traditional highway transportation. These advantages, which will each be explored in turn, may include: 1. improved cost effectiveness, 2. system reliability, 3. energy efficiency, 4. system performance (improved delivery times, all-weather, around-the-clock system), 5. enhanced cargo security, 6. reduced pollution (air and noise), 7. lowered maintenance costs compared to highways, and 8. more effective land use. Brief History of Freight Pipelines
The public is generally unaware of the important role played by the pipeline industry in delivering both liquid commodities and natural gas throughout the United States. The pipeline industry is unique in a number of ways. These attributes range from ownership and the types of commodities being transported to its subterranean nature. Pipelines are often unidirectional with no backhaul capability. Pipelines played an important role in the transportation of petrochemicals in the post-World War II era. Originally, pipelines were used to feed other modes of transportation, such as railroads or water carriers. The Pennsylvania Railroad started the development of pipelines in the oil fields of Pennsylvania in the 19th century and sold out to the Standard Oil Company, setting the precedent of pipelines being owned by oil companies.

Texas Transportation Institute 6 Rail Research Center/AAR Affiliated Lab
Solid freight pipelines are a different class of transportation altogether. Their proponents view them as a means to move solid material in a fashion analogous to liquid or gas pipeline transportation. Systems designed to move both bulk commodities, such as phosphate, ore, and coal, or packaged material, such as mail or finished goods, are in operation in various places around the world. However, no system currently exists to specifically divert truck-borne freight in large quantities from highway systems. It is this last application which is of interest to Texas and is the focus of the current research. A brief description of current freight pipeline systems is presented below to familiarize the reader with existing concepts. Coal Slurry Pipelines Coal pipelines are frequently referred to as slurry pipelines because coal is moved in a pulverized form in water (one-to-one ratio by weight). Once the coal reaches its destination, water is removed and the coal is ready for use. Slurry lines are primarily used for transporting coal to utility companies for generating electricity. The longest slurry pipeline, which operates between Arizona and Nevada (Black Mesa), is 273 miles long with an 18-inch diameter (456 mm) and moves 4.8 million tons of coal per year. Coal pipelines use very large quantities of water as the transport medium. This causes concern in several western states where there is already a scarcity of water. Also, the water in the system cannot be reused due to the unidirectional nature of the slurry pipeline. Railroads oppose slurry pipelines since they present a stiff form of competition. Several projects have been stopped by the railroads by refusing to allow the pipeline to cross railroad right of way. Pneumatic Capsule Pipeline
There are two types of pneumatic pipelines. One is the suction or negative pressure type
that uses a fan or blower to pull by suction solids through the pipe. This type of system has a severe limitation over long distances. It is viable only for a couple of hundred meters. The second is a positive pressure or pressure type in which a fan or blower is used to thrust solid materials through the pipelines. Pressure systems can transfer materials through pipelines to greater distances compared to the suction type. There are some PCPs that can transport material for over 2 km. The PCP uses air or an inert gas as a transporting fluid, and because of its lightness, the fluid in a PCP can not develop significant buoyancy and lift forces to suspend capsules and hence require wheels (usually rubber) to roll in the pipe. The wheeled capsules are propelled by the thrust of the air generated by the fans or blowers.
PCP is not a new technology. Its roots date back to 1827, when Danish engineer
Medhurst wrote how letters and goods can be transported in small pipes at speeds in excess of 160 km/h (1). In 1861, a large-scale PCP was built in England by the Pneumatic Dispatch Company. At the turn of the century, five U.S. post offices (Philadelphia, New York, Boston, St. Louis, and Chicago) had PCP systems connecting their main offices to branch offices. The first industry-wide use of pneumatic pipeline after cement was invented was in the brewing industry. PCP transported both malt and grits. After World War II many industries like newspapers, bakeries, plastic manufacturers, and animal feed producers started using PCPs. Currently,

Texas Transportation Institute 7 Rail Research Center/AAR Affiliated Lab
practically all-industrial plants that produce or use powdered and/or granular solids in large quantity use pneumatic systems. One of the biggest current users of PCP is the plastics industry.
With the use of modern pipeline technology and advancement in computer technology a
new breed of PCP has emerged. It has found greater use in hospitals to transport blood samples, medicines, and supplies between buildings. These systems have been used successfully in drive-in banks to transfer cash and receipts, in factories to transport machine parts and materials, and at airports for transporting tickets and documents between buildings.
Some limited success has been made in developing large scale PCP systems in recent years. Both the former Soviet Union and Japan have built and use large and long PCP systems for transporting minerals (2). The largest of such a system is LILO-2 in the Republic of Georgia with a 17 km (10.6 miles) long and 1.22 m (48 inches) diameter pipe for transporting rock. Japan’s Sumitomo Metal Industries built a large PCP for transporting limestone from a mine in 1983. It has a 1 m (39 inches) diameter and travels a distance of 3.2 km (2.0 miles). In the U. S., a large PCP system was developed and marketed by Tubexpress System in New Jersey. The system has not yet been implemented. Hydraulic Capsule Pipeline (HCP)
HCP is a relatively new idea that was first introduced during World War II to transport war materials to China via Burma. Due to technological constraints at that time, the concept was never implemented. The concept was reborn in Canada in 1959 and has been studied in the U.S., Japan, and South Africa since then. HCP uses water as a transporting fluid. Since water is a thousand times denser than air at standard atmospheric pressure, larger buoyancy and lift forces are generated on hydraulic capsules, thus making it possible to lift the capsules in the pipe at relatively low velocities without the need for wheels. Coal Log Pipeline (CLP)
CLP is a special kind of HCP for transporting compacted coal logs. Currently, the Capsule Pipeline Research Center at the University of Missouri-Columbia is instrumental in popularizing the concept of CLP. The current focus is to develop CLP for commercial use by the year 2000. The CLP for transporting coal has several advantages over the coal slurry pipelines, namely lower cost, less water required, and larger throughput.
Based upon this historical foundation, a literature review was begun to determine the current state-of-the-art practices and research findings for freight pipeline movement. This work encompassed the study of concepts, infrastructure needs, and propulsion alternatives for the various subsystems of the freight pipeline.

Texas Transportation Institute 8 Rail Research Center/AAR Affiliated Lab
Summary of Existing Literature on Freight Pipeline Concepts, and Infrastructure and Propulsion Alternatives
The literature associated with freight pipeline systems, while not exceedingly extensive,
is informative about both the design concepts and uses to which underground freight conveyances have been put. This literature review provides:
1. a summary of the existing published material describing freight pipeline systems and
concepts, 2. indication of potential infrastructure alternatives, and 3. assessment of propulsion alternatives. Additional material will be added as it is discovered or as it becomes available.
Freight pipeline systems and concepts consist of descriptions of general system
characteristics, such as pipeline length, diameter, and type of use. Other considerations reviewed are freight pipeline economics, terminal logistics, and associated policy issues. The following introduction provides a brief historical account of freight pipeline systems. Introduction to Freight Pipelines Pipeline systems used to move commercial solids began in the 1850s with the transportation of telegrams over distances of 600 feet with a pneumatic propulsion system (2). A chronicle of the origins of freight pipelines, “Tube Freight Transportation” by Larry Vance, has an extensive outline of the history of tube freight transportation. His historical account starts with proposals of large tube freight systems as early as 1810 and includes work up until recent proposals for the application of linear induction propulsion concepts. Vance provides examples of successfully working systems that move freight via pneumatic systems. A thorough investigation of the history of slurry pipelines is provided by Zandi et al, (3). A mixture of gold, sand, and water was piped as early as 1850 in California. Soon following this application, coal was mixed with water and the resulting slurry was transported from the mine to its destination. Coal remains the most common commodity transported in slurry pipelines. Today, both pneumatic capsule and hydraulic pipelines are used for the movement of small parcels (tube diameters less than 7 inches) and solids, such as phosphates and coal (tube diameters up to 2 feet). More recently, researchers have been studying the use of linear induction motors for the propulsion of freight (4, 5, 6). The most technically evolved systems proposal is for evacuated-tube, magnetic levitation. The high speeds attainable and long-run fuel efficiency relative to highway transport of some commuter transport suggest the use of this method. This propulsion technique could be considered for freight transportation as well (7). Prior to the advent of complex highway systems, pneumatic technologies and slurry pipelines were often used due to the lack of technologically acceptable substitutes. In the late 20th century, governments, academics, and industry are studying freight and slurry pipelines for different reasons. One of the primary reasons listed by all of the studies surveyed is traffic reduction. Other commonly listed reasons for using freight pipelines include efforts to decrease

Texas Transportation Institute 9 Rail Research Center/AAR Affiliated Lab
air pollution by decreasing fossil fuel consumption, greater reliability for deliveries by protecting cargo from inclement weather, and greater overall automation resulting in improved safety for both humans and cargo. The following discussion addresses the sub-tasks mentioned previously as they pertain to several freight pipeline studies. Visser and Binsbergen study a potential underground freight system for the city of Leiden in the Netherlands (8). Zhao, Lundgren, and Sampson study a capsule pipeline system for the state of Minnesota (4). Goff, Patil, and Shih study the potential for a freight pipeline system in Texas (6). Allen and Plaut study a series of interconnecting cities in the northeastern corridor between Chicago and New York (9). Koshi studies an underground tube network for goods transport in Tokyo (10). Lastly, Stein et al. provide a preliminary study of a freight pipeline system for the market Ruhr-area in Germany (11). This German study was completed in the spring of 2000. In addition to the aforementioned computer simulations, there are existing freight transportation systems up to a meter in diameter, such as the systems by Smith and Sumitomo Metals in Florida and Japan. These studies are of prototypes or existing pipelines. Although these studies provide true, operational costs, the diameter of these systems is much smaller than that required for the movement of palletized freight. Further, these systems will not be reviewed because the systems are designed to move only one type of cargo that oversimplifies the system required by a palletized, commercial freight system. FREIGHT PIPELINE SYSTEMS AND CONCEPTS General Characteristics The oldest study by USDOT, Transport of Solid Commodities Via Freight Pipeline, includes comprehensive information regarding costs and demand for four types of freight pipelines: slurry, pneumatic, pneumo-capsule, and hydro-capsule (12). The authors consider freight in several solid forms: powdered, granulated, sintered, manufactured, and packaged. A series of two-way, intercity corridors that connect New York City with Chicago, between 100 and 700 miles in length, was examined in this study. Although technological improvements have surpassed the need for pneumatic pipeline systems, Zandi et al. elaborate on some of the specific costs and estimation of freight demands for a system which is similar in scope to that which will potentially be studied by TTI for the state of Texas (3). Preliminary analysis indicated that corridors between 400 and 800 miles in length, traversing Texas, such as corridors between Laredo and Dallas, or Houston and El Paso, were the most likely candidates for TTI analysis (13). Other comprehensively documented studies of either computer simulations or concept design of freight pipelines have been performed for two areas, the Netherlands and Minnesota. These studies analyze the possibility of moving palletized freight that would probably be more comparable to the type of freight suitable for transportation in a Texas freight pipeline study.

Texas Transportation Institute 10 Rail Research Center/AAR Affiliated Lab
The Netherlands study by Visser and Binsbergen investigates transportation systems with a linear motor with pneumatically or electrically driven self-propelled transporting units for the city of Leiden (8). Their study was not complete at the time the literature review was completed, so its authors only state aspects of the pipeline they are considering as opposed to definite pipeline characteristics. The authors stressed, however, that “high” quality goods or piece goods in production processes could be shipped with little emphasis or concern over cost of transportation. Other major considerations by the Netherlands research team are the engineering aspects of the pipeline. The team has broken the engineering aspects down into four points: receiving the goods, transporting the goods, delivering the goods, and the control system. The researchers state that pneumatically driven systems are not feasible because of the size and distance, particularly because of the loss of compressed air in the pipe and the difficult conduction of air requiring one compressor for each branch and the difficulty of steering capsules equally per compressor. The researchers investigated an alternative of a frequency controlled three-phase motor in connection with a wheel-rail-system due to its “technical perfection.” They say that such a system is robust and requires low maintenance. Another alternative investigated was the use of a linear motor, particularly with the use of a magnetically levitated tracking system. The next major component studied was the steering technique. The main research emphasis was on the development of typical steering methods for nodal points, requiring coupling and uncoupling of containers. The researchers suggested the need for “intelligent” steering mechanisms that could exhibit “man-like cognitive features.” Following the steering component, the research team investigated the aspects of pipeline construction and maintenance. Team members examined both open trench and trenchless construction (shield jacking and horizontal directional drilling methods). Suitable pipe connections were analyzed under consideration of conditions for fabrication, construction, and operation. These studies from the Netherlands introduced important concepts and frameworks for conducting a freight pipeline study. Although these studies provide information which addresses issues similar to TTI’s tasks, such as finding the appropriate pipeline diameter, terminal consideration, etc., these studies are also inherently different from TTI’s project for several reasons. The first overriding contrast is the difference in the objectives of the two studies. The government of the Netherlands wants to reduce traffic, yet improve market transportation of high quality goods, making system costs a secondary consideration. The objective of the TTI project revolves around economic viability, which is dependent upon the cost of the system. Two other differences stand out. First, the Netherlands study primarily addresses city systems. So, their “corridor selection criteria,” “types of suitable freight,” and “characterization of appropriate freight,” which are Tasks 2, 3, and 4 for TTI’s work plan, are all constrained to an urban setting. The corridor selection process in Texas, driven mainly by the reduction of traffic, is much more complicated. Not only does Texas have dense domestic or intrastate traffic, but Texas also experiences a high flow of pass-through NAFTA traffic that affects mainly its interstate highways. Second, the Netherlands studies are nationally sanctioned as part of the national transportation planning process. The freight pipeline project for the Netherlands receives

Texas Transportation Institute 11 Rail Research Center/AAR Affiliated Lab
national support and therefore, would not require the same level or type of policy analysis that would be required for a state-funded pipeline system for Texas. Viability of a freight pipeline system in Texas not only requires economic viability, but also necessitates, among other things, public support of alternatives to the current transportation system, independent interest group support such as environmental lobbies, and statutory resolution of the eminent domain question. The Minnesota study, while lacking in documentation about conceptual considerations in designing a freight pipeline, provides detail about the technical and economic aspects of their simulated pipeline (14). Zhao et al. examine capsule pipelines in which the capsules are driven by linear electric motors using a wheel on rail configuration (4). The total length of the pipeline is 20 km (12.4 miles). The interior diameter of the pipeline is 2 m (6.6 ft). The capsule length is 3 m (9.8 ft) with the payload assumed to be 8 tons. The authors also assume no change in the average grade. Immediately apparent distinctions between the Minnesota study and TTI’s study are both the assumption of no grade change and the proposed pipeline length. As mentioned before, the area of study for TTI’s study is at least 35 times greater in length than the Minnesota study. This has implications for infrastructure requirements and costs, as well as the energy requirements to operate the pipeline. Further, it will be impossible to maintain a zero, average grade change over the proposed corridor for the Texas study due to both length and the physical geography of the state. Although little detail is provided by Stein et al., the German study is similar to the Leiden case in that it is a city system where production centers are located in the region of the pipeline itself (11). In the Stein study, they are quite concerned about peak time delivery, just-in-time delivery, and reliability and pace of transportation. The Texas pipeline corridor would be serving different needs. It is envisioned as more of a conduit through the state for remotely produced goods that are just transiting through the area. Unfortunately, the German study does not provide us with any antidotes for their legality issues, but instead provides a comprehensive list of potential legal barriers. It provides an overview of considerations for conceptualizing the methodology for a feasibility study, but does not provide any results of their analysis. Potentially more illuminating than the Netherlands and Minnesota studies, Goff et al. has studied the same geographic region as that for the TTI project (6). Goff et al. studied the feasibility of a freight pipeline structure between San Antonio and Dallas, approximately 300 miles long. The diameter of the pipeline was assumed to be 2 m. Terminals for the system were to be located at Waco, Temple, Austin, and San Marcos, in addition to the end terminals. Assuming linear induction motors as the means of propulsion, capsules would travel at 25 m per second. The authors estimate the mean years to failure for the propulsion and controls at 80 years or approximately eight times greater than the average years to a truck engine failure. The tube system itself was estimated to endure 60 years until failure, which is approximately three times greater than highway. Lastly, the authors found that the track or guideway would last approximately 55 years until failure. Although the Goff et al. study will provide TTI with valuable information, there is an important difference between these two studies that could easily make results of one study more

Texas Transportation Institute 12 Rail Research Center/AAR Affiliated Lab
economically palatable (6). That difference is the corridor selection and its implications for modal shift. Choosing the appropriate terminal locations for the corridor can make a great difference in whether the design for a competitive transportation alternative is or is not successful (14). Lastly, Koshi examines a system much more extensive than that considered for Texas (10). The Tokyo system considered by Koshi studies a 300 km (186.5 mile) freight pipeline network with 150 stations. The pipeline diameter is 5.5 m (18.0 ft) and has a square cross-section. This tunnel handles two-way traffic of containers of varying widths. The largest container has a width of 1.7 m (5.6 ft), length of 2.5 m (8.2 ft), and a height of 2 m (6.6 ft). The system design also calls for automatic handling and transfer of containers. The tracking system would be steel rail and steel wheel with linear motor traction. The literature indicates that a prototype for this system was built in 1993, but we have been unable to locate the documentation of the prototype results. The general characteristics of the five aforementioned studies all contain at least one known difference and may contain more unknown differences from the system which will be studied by TTI. Since the Texas freight pipeline system has unique characteristics, much more attention will need to be given to general characteristics and design factors not considered in the existing literature. As previously stated, the first hurdle to overcome is that of economic feasibility. Economics All of the studies mentioned in the previous section found their freight pipeline systems to be economical or competitive with other current means of transportation except for the Goff et al. study (6). The authors estimate an operating cost of approximately .021 cents per ton mile compared to the marginal cost of trucking, which is estimated at .10 cents per ton mile (5). Despite this low marginal cost, the authors estimate that the volume of materials that would be shifted from truck to pipeline would not compensate investors for their capital expenses. Vandersteel takes exception to the Goff et al. report. Vandersteel states that several of Goff’s figures are incorrect, resulting in an overestimation of the capital expenditures. Given the new capital expenditures, Vandersteel reports that the minimum volume needed to compensate investors is attainable. In the Zandi et al. report, the freight pipeline became feasible (competitive with trucks) when the tonnage exceeded 25 million tons per year with a shipment size of 5 tons (14). Also, the longer the line haul distance, particularly more than 300 miles, the more competitive the freight pipeline became. Koshi determines both the demand and costs for the Tokyo freight pipeline system (10). He estimates that the construction cost for his extensive pipeline system is the same as the present value of the Tokyo expressway that carries approximately 20 percent of the total vehicles in Tokyo. He estimates that the pipeline freight system will be able to replace 40 percent of truck traffic in Tokyo. Also, he estimates that the 300 km (186.5 mile) system will be adequate to handle the estimated demand.

Texas Transportation Institute 13 Rail Research Center/AAR Affiliated Lab
The prototype and existing freight pipeline studies from Florida and Japan, as mentioned before, address the true economic costs involved in freight pipelines. Additionally, engineering concerns have been addressed. Future work by TTI’s Rail Research Center will seek to extrapolate from these studies to determine the costs of a freight pipeline system with dimensions and length suitable for Texas. This work will also need to examine the economics and handling characteristics of freight at the terminals along or at the ends of the pipeline. Terminal Logistics The economics of a freight pipeline system will be influenced in no small measure by the ease with which cargo is handled at terminal locations. Modern materials handling systems along with the selection of the appropriate standardized unit of cargo (pallet, container, etc.) will go a long way toward making the flow of freight fast and inexpensive. The initial literature review in the expanding field of materials handling and inventory control suggests that computerization, robotics, terminal layout, and conveyor systems continue to adopt innovations which improve efficiency and reduce cost. Each of these areas will be examined in the current research for their potential contribution to a terminal design that offers the efficiency needed in a prototype freight pipeline system design. The materials handling literature is rife with existing systems that may apply to freight pipeline terminal design. Many of these systems seek to minimize the delay associated with transfer loading operations within the terminal. As would be expected, computerized control systems are increasingly crucial in an environment characterized by automation at every turn (15). Control systems serve the command and control function as well as managing inventory and retrieval subsystems. The integration of these and other components, such as sorters and conveyors, appears to be of critical importance to terminal design. Developments in terminal design embrace several distinct disciplines. Robotics is playing a larger role in materials handling, performing functions formerly undertaken by hand or by manned-machines (16). The efficiency with which these systems operate, on a 24-hour a day basis, make them attractive for a wide variety of roles. Coupled with conveyor systems, automated scanning systems for routing control and billing, and efficient space-utilization, a freight pipeline terminal could be designed to operate economically with a minimum of manpower. Other innovations appearing in the literature include vertical lift devices that serve the same purpose as horizontal conveyors and may lend themselves to a 3-dimensional terminal layout. 3-D terminals appear to be very efficient and represent the state-of-the-art in space utilization and retrieval speed, allowing stored elements to reside in a space identified by an xyz-coordinate system (17). Policy Issues Little is mentioned by any of the authors on policy issues due to the fact that few pipelines actually exist. The Netherlands researchers do address certain legal issues they have confronted. From the legal perspective, the first problem the researchers encountered was the

Texas Transportation Institute 14 Rail Research Center/AAR Affiliated Lab
classification of this new transportation system. A different set of consequences is attached to the classification of the pipeline as either a supply system or transportation system. One of the major issues they face is whether they can use the existing traffic network to install the pipeline. Additionally, they said that pipeline construction would use private property, requiring more legal investigation. Other legal questions arose regarding how the pipeline may come in contact with other infrastructure systems, such as subways, railroads, and water and electricity lines. Another legal issue needing clarification is investigation into the environmental friendliness of such a system. Since policy issues are synonymous with the viability of such a system in Texas, much consideration will be expended toward the study of policy issues. Many of the same issues will be of interest to our project as well as evaluating recent large infrastructure projects in the state and public attitudes regarding them. This effort will be ongoing throughout the remaining years of the project.
Corridor Selection Criteria in Texas as Part of a Freight Pipeline Feasibility Study
This section will describe the process TTI has used to choose an appropriate corridor for analysis within the larger freight pipeline feasibility study. Three types of potential corridors are examined: intra-city, inter-city, and trans-Texas. The criteria for selecting potential corridors were chosen in an attempt to make the freight pipeline system as economically viable as possible. Economic viability, in this context, means the defraying of social costs, such as road construction and maintenance, and the ability to attract potential customers. The defraying of social costs can be measured by the reduction in the volume of trucks and number of miles traveled along different corridors. Other criteria, such as the factors that affect modal shift, are only loosely defined at this stage of the analysis. The research team believes that additional assessment of the policy issues involved is needed prior to estimating the volume of freight that can be attracted to the system from the existing traffic base.
Preliminary analysis of these issues indicates that the most suitable corridors for a freight pipeline would likely be a trans-Texas system. This type of corridor would allow the system to attract both domestic and, most importantly, the NAFTA traffic that promises to overwhelm the Texas highway system. The following material focuses on the various types of corridors found in Texas and provides examples of each. The objective of this study is not to build a prototype system, but rather to assess, within the context of an appropriate location, how a freight pipeline would compare to traditional transportation systems. Implicit in this approach is an understanding of the economies of scale necessary to make a large investment of public or private funds return both social and economic dividends. By selecting an appropriate pipeline corridor, valid comparisons can be made between a functioning pipeline system and the cost of maintaining or building new highway infrastructure.
The Texas highway system must contend with its own intrastate truck traffic in addition to more than 5.2 million vehicle miles of NAFTA truck travel per day (18). The shift of freight from trucks to an alternative system such as the freight pipeline to alleviate traffic congestion is a worthy goal, but, in the final analysis, this type of system will work only if the economics appeal to users. It is clear as the evaluation progresses that freight pipeline viability has different

Texas Transportation Institute 15 Rail Research Center/AAR Affiliated Lab
connotations depending upon the perspective of the interested party. For the purposes of this analysis, the interested parties are considered as anyone having a primary or secondary financial stake in the development of a freight pipeline system and its ultimate impact, either positive or negative, on the public funds supporting transportation. Viability from the state’s perspective could mean realizing a lessening of the cost of the infrastructure required to move a ton-mile of freight in an added highway lane versus a freight pipeline system. Viability could also take into account the lowered cost of maintenance of state roads relative to the construction of a freight pipeline. On the other hand, viability from the perspective of a private investor could mean finding that the operating cost of a freight pipeline system per ton-mile is less than that of truck transportation. TTI’s research begins by identifying potential corridors for study. It is not feasible for all truck corridors to be studied, so researchers developed criteria to guide the selection of candidate corridors. Corridor selection was based upon criteria that may aid the state in achieving its transportation goals. TxDOT’s goals address the maintenance and improvement of public transportation systems in the state, the reduction of congestion, and the enhancement of safety on Texas’ highways. Ultimately, these goals directly relate to the expenditure of tax dollars. To reduce congestion, the state is under pressure to build more highway infrastructure. To improve safety, the department invests in a wide array of programs, design innovations, and roadside safety accoutrements. The criteria that support these goals are also the criteria that determine the economic viability of an alternative freight transportation system. The primary criterion to be considered for any proposed transportation improvement is its ability to aid the overall transportation system to meet current and future traffic demand levels. The freight pipeline must be assessed in light of its ability to induce freight traffic to shift from other traditional modes of transportation, i.e., modal shift. By extension, the corridor should be one in which the ability of the alternative transportation system to favorably impact air pollution production and the potential of land use other than for road construction could be evaluated. Other considerations for corridor selection also include an assessment of the potential to access other transportation modes, potential for future extension or expansion, and the perceived need for improvement by local governmental authorities along the route. Intra-city corridors can be defined to include certain metropolitan areas subsuming one or more major cities. Dallas-Fort Worth is an example of a Texas metroplex with the potential for freight transportation via freight pipeline. Houston, San Antonio, or any other large city with production areas in nearby suburbs could also be considered as a candidate for assessment. Inter-city corridors, as contrasted to intra-city corridors, would link markets in cities separated geographically. Dallas to Houston, Dallas to San Antonio, and Houston to San Antonio would all be examples of inter-city corridors with the potential for freight traffic. Lastly, a trans-Texas corridor has terminal ends near or outside of the border of the state. Laredo to Dallas or Beaumont (or Houston) to El Paso would be examples of a trans-Texas corridor. Corridor selection, whether intra-, inter-, or trans-Texas will depend on assessing traffic and market factors deemed critical to the economic success of an alternative mode of transportation. It may be that an additional consideration, one pertaining to political or policy

Texas Transportation Institute 16 Rail Research Center/AAR Affiliated Lab
issues, will “tip the scales” toward selection of a corridor that maximizes the benefits to the citizens of Texas. These benefits, which are economic in nature, address the ability of a freight pipeline system to divert substantial volumes of truck traffic from Texas highways to something else. In the best-case scenario, the diversion would focus on “foreign” trucks (either domestic, non-Texas based trucks, or U.S. trucks dedicated to Mexican and Canadian shipments) which use Texas roadways but do not pay proportionately for the construction or maintenance of the state’s highway system. Intra-City After an initial evaluation, the intra-city corridor type was first to be eliminated from the pool of eligible corridors to be studied. Three principal factors were considered. First, tunnel boring is sometimes necessary to install pipelines in urban areas, and the cost of boring is substantially higher than the cost of trenching. Secondly, potential patrons would be less likely to use the system if the number of transfers (moving materials from one mode of transportation to another) goes beyond a practical limit. This is especially true for a relatively short movement between origin and destination. Also, intra-city freight movement would likely be more time sensitive than freight moving greater distances. Finally, the criteria focusing on access to other transportation modes, although possible, becomes more difficult in urban areas by virtue of existing structures and established systems. Inter-City The elimination of the intra-city corridor leaves the inter-city and the trans-Texas alternatives. An inter-city corridor could be appropriate considering that 86 percent of the truck traffic in Texas has a Texas destination (19). However, considerations other than freight destination must be examined. First, the distance between most major Texas cities, while greater than the national average, is still moderate and allows for efficient truck operations (same day delivery). Considering the requirement to handle freight additional times, a freight pipeline could conceivably be slower than truck transportation in an inter-city market. Given that consumer goods traveling shorter distances are typically time sensitive, this factor could greatly inhibit the potential traffic base for the system. Second, inter-city corridors within Texas are disproportionately serviced by Texas-based trucking firms. These firms could oppose the alternative system in the political arena and negatively influence public opinion. Trans-Texas A trans-Texas corridor may be the most appropriate corridor since it could capture both NAFTA traffic and some inter-city traffic. One measure of corridor appropriateness could be truck movement through particular areas. Tables 1 and 2 show how truck traffic in selected border towns has changed since the inception of NAFTA. The three cities with the most tuck traffic in 1999 are represented in these tables: Laredo, Brownsville, and Pharr. As the data shows, the highest number of trucks moving in and out of Mexico travel through Laredo. Over the past five years, 1995 through 1999, the overall percentage changes into and out of Laredo are approximately 153 percent and 61 percent, respectively. Pharr has a much greater percentage change in truck traffic going into and out of Mexico, approximately 2010 percent and 370

Texas Transportation Institute 17 Rail Research Center/AAR Affiliated Lab
percent, but the overall number of trucks is much lower than in Laredo, and the major growth occurred in 1997 with a tapering off of growth since that time. Brownsville has the third highest truck traffic. This city has had an approximate growth in truck traffic of 53 percent over the last five years but has seen roughly even levels of traffic out of Mexico. Table 1. Number of January Truck Shipments into Mexico through Selected Texas Cities
(1995-1999) and the Overall Percentage Change in Shipments for Those Years.
1995 1996 1997 1998 1999 % Change
Brownsville 14,580 16,286 17,680 23,060 22,381 53.5%
Laredo 3,664 37,962 48,194 91,388 92,872 153.3%
Pharr 715 3,411 6,810 13,317 15,092 2010%
*Source: Texas A&M International University
Table 2. Number of January Truck Shipments Out of Mexico into Selected Texas Cities
(1995-1999) and the Overall Percentage Change in Shipments for Those Years.
1995 1996 1997 1998 1999 % Change
Brownsville 9,751 8,695 9,757 8,430 9,450 -3.0%
Laredo 31,238 40,579 44,067 43,978 50,411 61.3%
Pharr ** 3,231 12,004 12,173 15,204 37.0%
*Source: Texas A&M International University **Data not available for this year.
Truck counts are necessary when measuring traffic relative to a stationary point. Other measures important to potential corridor selection are vehicle miles traveled by corridor and the amount or volume that is moved on each corridor. Table 3 provides vehicle miles traveled on each major corridor for all truck traffic and provides the average volume of NAFTA trucks.
The locations of the different highway corridors are pictured in Figure 1, which shows the volume of NAFTA truck traffic carried on major highways by depicting the level of volume with bandwidth. IH-35 is the most heavily traversed with all types of trucks, NAFTA trucks, as well as average volume of NAFTA trucks. The average daily volume of NAFTA trucks along the 589 mile IH-35 corridor was 2809 trucks in 1996 and the average daily VMT of 4.4 million (Table 3). Given the percentage increase in border truck counts in Tables 1 and 2, one may assume that the 1999 average daily VMT and average daily volume of trucks has increased significantly over the 1996 levels on IH-35 and other corridors carrying NAFTA traffic, as well. The next highest VMT by all trucks is on the IH-10 corridor with 4.1 million. IH-10 also has the

Texas Transportation Institute 18 Rail Research Center/AAR Affiliated Lab
second highest daily NAFTA truck VMT, .9 million. IH-20, IH-30, IH-45, IH-40, and US-59 all have total daily VMT of over 1,000,000.
Table 3. Daily Truck VMT, NAFTA Truck VMT, and Average Volume of NAFTA Trucks
by Corridor for 1996.*
Corridor All Trucks Daily
VMT NAFTA Trucks
Daily VMT Roadway Length
(miles) NAFTA Trucks Average Volume
IH-35 4,477,244 1,654,573 589 2,809
US-77 636,031 426,327 232 1,838
IH-37 439,753 215,511 129 1,671
US-281 339,015 247,687 164 1,510
IH-30 1,444,034 242,960 223 1,090
IH-10 4,167,542 903,511 875 1,033
US-75 576,102 78,414 86 912
IH-20 3,416,678 443,151 627 707
US-59 1,579,009 318,023 580 548
US-83 140,478 53,016 177 300
US-87/190 461,943 42,120 559 75
IH-40 1,041,379 7,072 181 39
IH-45 1,988,075 5,976 287 21
Other 10,964,419 595,462 20,156 30
Total 31,671,702 5,233,803 24,865 210
*Table reproduced from TxDOT’s Effect of NAFTA on the Texas Highway System, p. 20.
In Effects of the North American Free Trade Agreement on the Texas Highway System, the concluding remarks state that NAFTA-related truck travel represented 16.4 percent of all truck travel in 1996. Also, 13 highway corridors carried almost 90 percent of all NAFTA trucks. IH-35 carried 31.6 percent of all NAFTA-related truck traffic. Also, of the total truck traffic on US-281, 73 percent was due to NAFTA trucks.

Texas Transportation Institute 19 Rail Research Center/AAR Affiliated Lab
IH 20
US 87/US 190
IH 10
IH 3
5
US
75
IH 30IH
45
US 59
IH 37
US
28
1
US 83
US
77Note:
= Bandwidth Corresponds to Average NAFTA Truck Volume on the Corridor or Segment
Figure 1. Volume of NAFTA Truck Traffic Carried on Major Highways.
While a freight pipeline system would not focus exclusively on NAFTA commerce, NAFTA commerce has a particular role in corridor consideration. Since much of the NAFTA traffic is moving to destinations outside of Texas, the marginal savings of using a freight pipeline system may be relatively greater for these trips than for shorter, intra-state trips. These savings occur because a transition cost is incurred when switching modes. On longer trips, the transition cost may be made up by the potentially lower cost of operation. Additionally, time may actually be saved with a pipeline that doesn’t suffer service interruptions due to inclement weather or driver fatigue. Hence, the economic incentive to use a freight pipeline system would be greater for the long-haul patrons. Based on these considerations, the level of NAFTA traffic seems an important consideration. The measures of volume of trucks and truck miles are doubly important because they translate into social costs. Table 4 shows the annual costs imposed on Texans by NAFTA truck traffic. Since NAFTA truck traffic accounts for approximately 14 percent of all traffic, the potential defrayal of annual costs due to truck traffic with the use of a freight pipeline system could be closer to $950 million.
IH 40

Texas Transportation Institute 20 Rail Research Center/AAR Affiliated Lab
Table 4. Annual Costs Imposed on Texas by NAFTA Truck Traffic for 1996.
Types of Impact Annual Cost (millions)
Congestion $ 213.2
Accidents 158.7
Air Pollution 89.7
Noise 49.2
Total Annual Cost $ 510.8 *Table reproduced from TxDOT’s Effect of NAFTA on the Texas Highway System, p.20.
Conclusions
The data from the TxDOT report suggest that several corridors may be potential candidates for study due to the high volume of truck traffic. However, when taking other criteria into consideration, such as potential for modal shift, access to alternative modes of transportation and expansion of capabilities, two corridors stand out: the Laredo to Dallas corridor and the Beaumont/Houston to El Paso corridor (Figure 2).
The Beaumont/Houston to El Paso corridor has access to the Ports of Beaumont and Houston and could also pick up NAFTA commerce moving west from Austin. When examining the Laredo to Dallas corridor, strategically placed freight pipeline terminals north of Dallas and at Laredo would provide convenient access to NAFTA commerce locations, would access interstate traffic moving north and east of Dallas, and would be within close proximity to multiple rail lines and facilities north of Dallas and several intermodal facilities near Laredo. These corridors would also encompass the major intercity traffic between Houston and Austin, Austin and Dallas, San Antonio and Austin, and Houston to Dallas via Austin.
Our analysis suggests that the greatest modal shift potential exists with traffic moving across Texas to Mexico in a north-south direction because there would be relatively fewer transportation shifts, hence transaction costs, per mile traveled. Thus, the Dallas to Laredo corridor appears to provide the most significant opportunity to examine the diversion of commerce to a freight pipeline system.

Texas Transportation Institute 21 Rail Research Center/AAR Affiliated Lab
Figure 2. Suggested Corridors in Texas for the Freight Pipeline Feasibility Study.
SUITABLE FREIGHT TYPES FOR FREIGHT PIPELINE TRANSPORTATION
Developing a freight pipeline system for solid material implies that the items to be
shipped are pre-packaged in some form to facilitate transport. The typical packaging units found in commerce range in size and shape from small individually wrapped consumer items to large intermodal containers of the type used by steamship companies, railroads, and trucking firms. The variation in packaging corresponds in scope to the diversity of goods and material transported. What must be determined is the best unit of material transfer for a system designed to alleviate truck congestion, or, stated another way, what is the standard unit of material handling found in the trucking industry today?
It appears that there are three options to initially consider. The system can be designed to
transport material in its original packaging from the manufacturer, configured to transport an
#
#
#
#
#
##
DFW
Laredo
Austin
El Paso
HoustonSan Antonio
Beaum ont

Texas Transportation Institute 22 Rail Research Center/AAR Affiliated Lab
intermediate aggregation of goods and material (e.g., by pallet load), or designed to ship larger units of transfer, such as intermodal containers as 20- or 40-foot equivalent units.
An initial capacity analysis suggests that a system with sufficient dimensions to transport intermodal containers would provide start-up capacity far beyond what is necessary at today’s traffic levels. This capacity consideration, plus the sheer size of the required infrastructure, places immediate doubt on the feasibility of this option. When coupled with the fact that railroads already service the sector of the market at ports and for international trade and that the major volume of goods transported by truck do not fall into this category (< 5 percent), intermodal containers appear to be a poor design target.
Shipping individual boxes, apart from the fact that this is not a preferred method by any
shipper or carrier, requires too much handling of packages. Pallets remain the industry norm, with forklifts performing much of the truck trailer loading and unloading. Boxes of widely varying sizes containing one to several items or non-packaged items may be loaded onto pallets and moved by means of a forklift from a warehouse onto a loading dock and directly into a truck. With an approximate capacity of 30 pallets per truck, it is estimated by industry sources that a truck can be loaded or unloaded in about 30-45 minutes.
Verification that the pallet was the appropriate design target was undertaken by the
research team during a data collection exercise in the summer of 2000. The results of this effort are described in the following section.
CHARACTERISTICS OF POTENTIALLY APPROPRIATE FREIGHT
Task 4 was begun in June 2000 by TTI researchers. In cooperation with the Texas Department of Pubic Safety (DPS), research staff surveyed northbound trucks on Interstate 35 (IH-35) at a weigh station near Devine, Texas. The team worked for two days interviewing truck drivers and filling out surveys on critical shipment information. The survey was designed to reveal where the shipment originated, its route, its destination, weight, and manner of packaging. The results of the survey confirmed several assumptions about the pattern of travel on IH-35 and on the predominance of pallets as the target unit of transfer for NAFTA and domestic trade along the route.
It was observed that 76 percent of the northbound traffic during this time frame was
transported in enclosed trailers. For one third of these it could be verified from either the manifest or direct questions that the cargo was palletized. In another one third, the unit of transfer was not indicated. It was estimated that most of these shipments were also palletized. Using a 95 percent confidence level in conjunction with destination data for the surveyed trucks, it was determined that approximately 40 percent of the northbound traffic was Dallas-bound and palletized. Estimates using 1996 data on IH-35 truck volumes indicate that this conservatively represents 1,000 trucks a day potentially suitable for diversion to the freight pipeline system.
Texas Transportation Institute 23 Rail Research Center/AAR Affiliated Lab
POLICY ANALYSIS
The evaluation of policy related to the design and development of a freight pipeline system may involve a variety of considerations, both public and private. A brief overview of the issues identified as policy concerns is presented in this section in response to Task 5 of the work plan. Most of the issues will be addressed in detail as they are identified and as information is collected to support the evaluation. The policy analysis task will appear in each year’s work plan, receiving the most attention in the last half of the study.
Policy Issues
The trucking industry is privately owned and operated and is profit motivated. The industry is not likely to support a system that increases competition in what is already a very competitive business. It is the current opinion of the research team that one of the design goals of the freight pipeline should be to make the system an extension of the trucking industry. The direct use of the system by shippers is secondary to the intent to configure a system that can be accessed directly by carriers as a lower cost alternative for moving goods between Dallas and Laredo than over the road shipments. The policy issues indicated by this goal include system ownership, leasing of terminal space, system operations, oversight, management, and vehicle ownership.
The trade between the U.S. and Mexico remains constrained by transportation-related issues at the border. A freight pipeline with a terminus in Laredo may transport material faster and more cheaply to its destination, but crossing the border would still present obstacles. A bi-national system with a terminal inside of Mexico will be explored as a policy option.
In order to finance a system of this magnitude, policy issues concerning whether this is a public or private venture must be reconciled. It may be that, if the relative cost-effectiveness of the system can be demonstrated, the public sector’s investment can be shown to be a better use of public funds, thereby justifying public investment and ownership and private use and benefit. The issues associated with public-private ventures will also be explored.
The right of eminent domain, which is cited by many as a concern for projects of this type, will be evaluated in the context of the current research.

Texas Transportation Institute 25 Rail Research Center/AAR Affiliated Lab
CHAPTER 3 – SYSTEMS ENGINEERING FOR THE FREIGHT PIPELINE SYSTEM
Systems engineering refers to an engineering design discipline aimed at arriving at an
optimal system configuration given defined needs, goals, and performance criteria. The U.S. space shuttle is an example of a system developed using the approach and highlights the advantage of using a systematic approach to develop a complex system with identifiable performance requirements. While the shuttle is clearly a more complex system than a freight-conveying pipeline, the systems engineering approach can be applied in the current research to arrive at a feasible design, while minimizing costs and ensuring predictable levels of performance.
To initiate the systems engineering approach to design, the system design problem is
summarized in a needs statement. The general design is spelled out in the needs analysis based on system requirements developed or provided by users. The function structure for the freight transportation system is then outlined to encompass the basic parameters in the needs analysis.
An analysis of system requirements led to the definition of five sub-components
comprising the overall system:
1. underground infrastructure, 2. main transport mechanism (MTM), 3. power supply systems, 4. warehousing and material handling, and 5. control system.
These sub-systems are further broken down with detailed requirements for each that must be satisfied in the conceptual design.
The brief description of each of the sub-functions follows:
• The underground infrastructure focuses on the tunnel system and related conduit. The material for the conduit and its cross-sectional shape are also addressed. There is a preliminary examination of geo-technical data as well as discussion of the two main options for constructing the tunnel: cut and cover or tunnel boring.
• The MTM sub-function illustrates the vehicle options for actually transporting the freight throughout the system (through the tunnel and around the terminal).
• The power sub-function describes the power-generating options available to supply the necessary power requirements to run the MTM and the operation of the terminals.
• The warehousing and material handling system sub-function encompasses the terminal areas including an freight identification system.
• The control system sub-function integrates the overall command and control of each subsystem, i.e., power source, warehousing and material handling system as well as the MTM.
Texas Transportation Institute 26 Rail Research Center/AAR Affiliated Lab
The initial evaluation examines three conceptual designs in the Power and Main Transport Mechanism design with recommendations on each design. State-of-the-art technology is to be utilized for the warehousing and material handling at the terminals and for the control systems. Further, the specific interfaces between the five sub-functions are reviewed. The issues of safety and reliability within each sub-function are addressed by means of failure modes and effects analysis and also to satisfy the design requirements. The initial evaluation is significantly broad in scope and at this early stage, only limited cost analysis figures will be presented. It became evident that a more detailed design specification is needed for each sub-function in order to gather realistic cost estimates. Goals
The goals established for this feasibility study revolve around evaluating an underground
freight conveying system meeting certain design and functional guidelines. These guidelines may be summarized as follows: • The system will provide an alternate transportation system for moving palletized freight
(40 in. x 48 in. x 60 in.) between Dallas and Laredo. • The system should be composed of existing, proven technologies. • The proposed system must be automated (driver-less). • The marginal cost of operation must be very competitive with the costs of trucking
freight between the same markets (< $0.10 per ton-mile). • The system’s performance must provide a high speed (45 mph +), high capacity
substitute for trucking. • The overall system must be environmentally sound. • The system should be subterranean where possible so as to optimize land use and
minimize contention with other transportation modes. • The system must offer 24 hour per day service. • Material handling at terminal locations should be as automated as possible.
Needs Statement
The above goals may be translated into a simple statement of needs:
To transport palletized freight in an efficient, reliable, and environmentally friendly manner. This freight transportation system (FTS) must be automated, subterranean, and economically feasible.
Needs Analysis
As stated previously, the adoption of NAFTA has resulted in a steady increase in the amount of freight transferred between the United States, Canada, and Mexico. Most apparent is the tremendous increase in the amount of goods and material carried by the trucking industry. Since Texas serves as the principal gateway to Mexico, international trade necessarily travels through Texas. The increased traffic has resulted in severe congestion on key interstate routes,

Texas Transportation Institute 27 Rail Research Center/AAR Affiliated Lab
increases in highway maintenance costs, degradation in safety, and will eventually necessitate the construction of additional lanes to accommodate the continually growing traffic base. When considering the high cost of constructing additional interstate highway lanes relative to the capacity added, it is expedient to evaluate higher-capacity, innovative alternatives.
The guiding design requirements for the system are based on efficiency and reliability in
transporting freight. The initial conceptualization requires that the freight pipeline be integrated into the overall transportation system and, by virtue of its efficiency and reliability, induce carriers to use it as a better alternative than over-the-highway transport.
Function Structure
The various functions that the system has to perform are shown below in Table 5.
Table 5. Freight Transportation System.
1.0 Warehousing and Materials Handling (WHMH) System
1.1.1 Access cargo from the truck
1.1.2 Transport cargo
1.1.3 Deliver cargo to conveyor/truck
1.1.4 Ensure safe and correct transfer
1.1 Unloading System
1.1.5 Exchange information with control system
1.2.1 Check dimensions and weight
1.2.2 ID cargo (time, destination, shipper, id #)
1.2.3 Transfer palletized cargo 1.2 Pallet Identification
1.2.4 Exchange information with control system
1.3.1 Access pallets from unloading/loading area to and from storage
1.3.2 Transport/deliver pallets to storage location and vice versa
1.3.3 Ensure safe and correct transfer 1.3 Transfer System 1
1.3.4 Exchange information with control system
1.4.1 Locate storage area for pallets
1.4.2 Identify pallets to go to storage area or loading system
1.4.3 Exchange information with control
1.4.4 Provide for pallet storage 1.4.4.1 Physical 1.4.4.2 Safety
1.4 Temporary Storage
1.4.5 Provide accessibility for loading/unloading pallets onto storage area

Texas Transportation Institute 28 Rail Research Center/AAR Affiliated Lab
1.5.1 Access pallets for temporary storage/loading
1.5.2 Transfer pallets
1.5.3 Deliver pallets to loading system/storage area
1.5.4 ID Cargo (time, destination, shipper, id #)
1.5.5 Ensure safe and correct transfer
1.5 Transfer System 2
1.5.6 Exchange information with control system
1.6.1 Access
1.6.2 Load pallets onto MTM
1.6.3 Deliver pallets to loading system/storage 1.6 Loading System
1.6.4 Exchange information with control system
1.7 Power Supply
2.0 MAIN TRANSPORT MECHANISM 2.1 Receive Pallets from Loading System
2.2 Secure Pallet Safely
2.3.1 Send “Ready”
2.3.2 Receive “Go” Signal 2.3 Exchange Information with Control
2.3.3 Communicate to control system 2.3.3.1 Status 2.3.3.2 Location
2.4.1 Mechanism for pallet conveyance
2.4.1.1 Propulsion 2.4.1.2 Access 2.4.1.3 Speed controller for pallet
conveyance 2.4 Transport Pallet Safely
2.4.2 Provide pallet integrity
2.5 Provide for Maintenance
2.5.1 Conduct safety checks
PROVIDE STRUCTURE FOR PALLET TRANSPORTATION (UNDERGROUND STRUCTURE)
3.1 Provide Subterranean Capability
3.2 Physical Structure
3.3 Size Criterion (capacity)

Texas Transportation Institute 29 Rail Research Center/AAR Affiliated Lab
4.0 CONTROL SYSTEM 4.1 Monitor Information
4.1.1 Collect
4.2 Process Information
4.2.1 Initiate corrective measures
4.3 Send Signals Based on Processed Information
4.4.1 Control location 4.4 Monitor Pallet in MTM
4.4.2 Control for safety
4.5 Provide Control System
5.0 POWER SOURCE 5.1 Power Generation
5.2 Power Transmission
Functional and Performance Requirements
Each of these sub-systems has design requirements which are defined in functional and
performance requirements. The requirements for all the sub-systems are listed below. Some of the requirements may overlap for the five sub-systems.
1. The cargo received is palletized and shipped to the terminal by truck. 2. The average weight of a pallet is estimated at 1,000 lb, with a maximum of 4,000 lb. 3. The area near the MTM must allow at least 25 ft x 5 ft of room for loading and unloading
of the pallet onto/off of the MTM. 4. The temporary storage area must contain 400,000 cu ft for temporary storage of pallets at
50 percent capacity. 5. The rate of transfer of pallets on the MTM must not be less than 45 mi/hr. 6. The freight pipeline system must be capable of transporting 50,000 pallets per day (see
Appendix) translating to 100,000 to 200,000 lb. per day. 7. The entire freight conveyance process must be completed with 0 injuries and 0 material
spills. 8. The MTM must be capable of encompassing 450 miles both directions. (900 total) 9. The power source must be capable of supplying 27.3 kW/ pallet. (Appendix) 10. The underground infrastructure must be 5-30 feet underground. 11. The MTM must be capable of varying pallet speed from 0 mph to 50 mph within 60 sec. 12. The conduit must be able to accommodate two-way pallet conveyance and provide for
future growth. 13. The power source must supply 1770 MW (see Appendix) power for continuous operation
of the system. The power source must supply 161 MW (see Appendix) per terminal for the two originating terminals.

Texas Transportation Institute 30 Rail Research Center/AAR Affiliated Lab
14. The automated material handling at the terminal sites must require minimal manual labor. 15. The identification and inventory system must be completely automated. 16. The pallet contents must adhere to government regulations and meet industry
specifications for non-hazardous cargo. 17. The time delay for freight transfer from trucks to the MTM must not exceed 1.5 hours. 18. The freight must meet all governmental requirements prior to loading/unloading the
MTM (into/out of country--customs). 19. The MTM and the underground infrastructure must satisfy all local and federal
environmental requirements for air, noise, water, and land pollution. 20. The underground infrastructure must allow for the impact of natural causes of nature (i.e.,
earthquake, floods, etc.). 21. The operating cost must be less than $0.10 per ton-mile. 22. The freight conveying system must have a life expectancy of 50 years. 23. The MTM must be automated and driverless. 24. System reliability: Mean Up Time 363 days/year
Mean Down Time 2 days/year Service 24 hrs/day
SUB-SYSTEM CONCEPTUAL DESIGN
This section of the report addresses sub-task 1.2 of the work plan concerning identification of infrastructure alternatives. The requirements are reviewed for each subsystem to illustrate the specific design needs for that subsystem. Each area will evaluate different methods for achieving the functions of each subsystem of the overall infrastructure.
Underground System (Tunnel Infrastructure)
The tunnel infrastructure subsystem encompasses the structure that supports the main
transport mechanism and serves as the conduit for transported material. While it is discussed as an underground structure, it is understood that it does not need to be underground for the entire route. Where terrain, geography, or environmental regulations require (or allow) it, the system could be constructed above ground.
Infrastructure Alternatives Designers can choose from a number of different materials to construct the tunnel infrastructure of a freight pipeline system. These different materials include reinforced, pre-stressed concrete, vitrified clay, plastic, thermoplastic tubing, fiberglass, high -density-polyethylene (HDPE), steel, corrugated metal, and ductile iron depending upon the size and functionality of the system under consideration. Each of these materials has unique characteristics in terms of its ability to withstand load and stresses it experiences for the intended function. The system’s design process must consider the relative strength of each of these materials, construction considerations, as well as the costs, and relate these to the function of the project under consideration.
Texas Transportation Institute 31 Rail Research Center/AAR Affiliated Lab
When reviewing the costs of the infrastructure alternatives, the installation and maintenance costs must be considered in addition to the cost of the pipeline itself. The selection and ultimate use of the properly designed materials can significantly reduce the amount of time and effort in the accomplishment of the project goals, thus, potentially reducing the construction, operation, and maintenance costs of the system. More specifically, the selection of the right freight pipeline material, of optimal diameter and wall thickness, can reduce the amount of trench bedding and required compaction. Another relevant question regarding pipeline installation is whether to opt for a cut and cover method or tunnel boring to install the freight pipeline. The need for tunnel boring may arise when environmentally sensitive or urban areas cannot be disturbed. However, the cost of this method could be prohibitive. All of these factors affect the construction costs and therefore the economic feasibility of the project. There are a number of factors that go into the considerations for the proper design, construction, and achievement of a satisfactory service life of a freight pipeline system. The design process to be followed will consider all the design parameters, assess different options, and then choose the one that best fits the defined requirements given all the constraints. The final design will attempt to balance all the economic, engineering, environmental, social, and legal aspects of the project. Selection of the Pipeline Material The selection of the pipeline material at this seminal stage of the project can be viewed as more of an engineering intuition without any hardcore calculations. But that selection has a firm basis on the kind and size of the freight pipeline under consideration. The final design should identify and quantify all specific design parameters that go into the freight pipeline design. The system under consideration may span several hundred miles with a diameter of 2 to 3 m to considerably larger. In general, the typical pipeline selection parameters include soil types, soil conditions, ground water, seismic activity, faulting, type of material to be transported and/or any other special construction requirements. The different types of material and their relative advantages and disadvantages can be assessed as follows by dividing them into two main categories, rigid and flexible.
Rigid Pipe Reinforced concrete pipe is a rigid material. It is a composite material consisting of both reinforcing steel and concrete. The properties of steel are very constant but must be considered in relation to concrete, which can be designed and built with different strengths depending upon the different loading conditions. This remains as the top choice due to its structural strength and cost consideration relative to steel and vitrified clay.
Flexible Pipe In general, flexible pipe is defined as a piping material that can deflect 2 percent or more without structural distress. For example plastic, thermoplastic, fiberglass, corrugated metal, and ductile iron can be regarded as flexible material. An important consideration in the use of such flexible materials is the ability to achieve large diameter pipes without deflection under pressure. Another issue with plastic, thermoplastic,

Texas Transportation Institute 32 Rail Research Center/AAR Affiliated Lab
fiberglass, and HDPE is overcoming the potential for building electrostatic charges in the pipe that can lead to a catastrophic combustion within the pipe.
Requirements:
1. This subsystem must be subterranean. 2. The tunnel length is 450 miles, located between Dallas and Laredo, Texas. 3. Entrance/exit points from the tunnel would exist at the two origins of Dallas and Laredo
and, possibly, at two intermediate terminals located in Austin and San Antonio, Texas. 4. The tunnel must accommodate the MTM traveling in both directions and carrying 40 in.
x 48 in. x 60 in. pallets. 5. The base of the tunnel must withstand the weight of the MTM and its contents as well as
the tunnel structure itself. 6. The tunnel must be designed to have a life expectancy of at least 50 years. 7. The tunnel must accommodate water systems such as rivers and lakes by either going
over or under the water system. 8. The tunnel must be designed to handle natural disasters such as earthquakes and floods in
designated areas as appropriate. 9. The tunnel must be sealed against water from seepage. 10. The tunnel must be designed to allow personnel to effectively handle maintenance and
emergencies. 11. The tunnel must have adequate ventilation for equipment as well as for personnel during
maintenance activities. 12. The tunnel must have a preventative maintenance program. 13. The tunnel must be designed for fire protection. Design Requirements Requirement 1: Subterranean system As stated previously, the system will be located underground wherever possible. It is conceivable that conditions will require portions to be built aboveground. Requirement 2: 450 miles long and located between Dallas and Laredo
A freight pipeline between Dallas and Laredo requires a complete geotechnical
evaluation or exploration of the entire range of the proposed tunnel. One of the first decisions, before this evaluation, is to determine exactly where the tunnel will be located. The aim is to follow the general path of the IH-35. Following the right-of-way of IH-35, may eliminate some potential costs and additional land purchases. This, however, requires extensive construction when following IH-35 through the cities of Waco, Austin, and San Antonio. The option of following the right-of-way of IH-35 predominantly in the rural areas and excluding urban areas (where a route is designed around the city) may represent an acceptable compromise.

Texas Transportation Institute 33 Rail Research Center/AAR Affiliated Lab
The next step is a geotechnical evaluation of the outlined route. Some of the challenges of the geotechnical evaluation as put forth by Harvey W. Parker, in the Geotechnical Investigations Tunnel Engineering Handbook are:
• There is vast uncertainty in all underground projects. • The cost and feasibility of the study are dominated by geology. • Every feature of geologic investigation is more demanding than traditional foundation
engineering projects. • The regional geology must be known. • Engineering properties change with a wide range of conditions, such as time, season, rate
and direction of loading, etc.– sometimes drastically. • Groundwater is the most difficult condition/parameter to predict and the most
troublesome during construction. • Even comprehensive exploration programs recover a relatively minuscule drill core
volume, less than 0.0005 percent of the excavated volume of the tunnel. • It is guaranteed that the actual stratography, groundwater flow, and behavior encountered
during construction will be compared with the geotechnical teams’ predictions. • In spite of these challenges, geotechnical explorations are largely successful. Geology
has the highest impact in designing and constructing a tunnel, especially as it relates to determining the cost. This includes the geology and the hydrogeology on the site. The regional geology outside the tunnel corridor must be understood as well because it may give insight to complex groundwater systems.
A review of geological material from The American Association of Petroleum Geologists
provides a high-level overview of the types of geology likely to be encountered when constructing a tunnel from Dallas to Laredo. The potential for impact on cost projections is so high that a preliminary site investigation is recommended as early as possible. An estimate of 3.0 percent of the project cost should be dedicated to site exploration on average, according to the U.S. National Committee on Tunneling Technology.
Additional data sources regarding geological information are available from:
• U.S. Bureau of Mines, • State & U.S. Departments of Transportation, • U.S. Dept. of Energy, • State Dept. of Geology, • U.S. Geological Survey, • U.S. Dept. of Agriculture, and • U.S. Forest Service (aerial photos).

Texas Transportation Institute 34 Rail Research Center/AAR Affiliated Lab
Requirement 3: Entrance/exit points from the tunnel to the four terminals
The entrance and exit points are designed around the needs of loading and unloading at the terminals. This is one of the key interfaces of the tunnel. The terminals may be designed to have separate locations for loading and unloading.
Requirement 4: Size to encompass MTM Traveling in both directions with capsules carrying Pallets of 40 in. x48 in. x60 in.
The tunnel dimensions must accommodate transfer of the capsules in both directions.
The shape of the tunnel depends on the type of construction used to build the tunnel, as well as ventilation required. Key options include circular, arched, or flat-roofed. Requirement 5: The base/foundation must withstand the MTM and the tunnel structure
Calculations for the foundation require further information on the final design of the
MTM before they can be estimated. Beneficial information regarding the tunnel structure, from the Tunnel Engineering Handbook (19), is listed as follows:
Tunnel linings usually do not carry the direct total load of the overlying soil or rock.
What occurs in all tunnels is that the in-situ stresses are redistributed around the opening by virtue of the inherent shear strength and the continuity of the ground. The mobilization of shear strength and the attendant transfer of stress away from the underground opening are commonly referred to as “arching.” The lining theoretically has to support only those stresses not arched to the adjacent ground. The effectiveness of the ground arch depends on the inherent strength and deformation characteristics of the soil or rock, the extent to which these characteristics are modified and mobilized by the effects of tunnel (and subsequent) construction, the presence of discontinuities, and the influence of water pressure in reducing shear resistance.
Requirement 6: Life expectancy of 50 Years
According to Civil Engineering for Underground Rail Transport, tunnel structure life
expectancy is at least 100 years (20). Requirement 7: Must accommodate water systems (rivers and lakes)
Most designs accommodate water systems by either going deeper underground or using a
bridge to go over the water systems. An important consideration is the significant increase in cost each time the tunnel must be routed over or under a water system. A detailed structure and cost analysis for each water system is recommended. Requirement 8: Designed to handle natural disasters (earthquakes, floods, etc.)
The most likely accident of this type is underground flooding that may lead to a large
crack in the tunnel lining. The prevention of such an occurrence requires a means to remove the water from the tunnel. Pumps are the most economical, but need regular maintenance.

Texas Transportation Institute 35 Rail Research Center/AAR Affiliated Lab
Requirement 9: Sealed against water seepage
When determining the stability and lining of the tunnel several design considerations must be addressed. The first consideration is water. Groundwater pressure in soft ground tunnels can be dealt with; either by a one-pass lining formed of segmented rings (with watertight gasketed joints), or by a two-pass lining with an initial construction support layer backed by a waterproof membrane and an internal concrete lining. This requirement is met by selecting the appropriate lining and structure to surround the conduit.
This raises an additional design concern of constructability, which is the compatibility of
the construction process with the expected ground conditions. The control in ground quality is generally measured in what is known as “stand-up” time. Soft and wet ground conditions require immediate support. The requirement that it must be watertight generally calls for a gasketed segmental one-pass lining. When there is an appreciable stand-up time with dry ground or ground that can be dewatered, the initial lining does not need to be watertight. Traditionally, steel ribs and timber lagging are used, but more recently roughcast, un-gasketed concrete segments are utilized. Generally the quality of surface finish and joint alignment is not satisfactory, so an interior second-pass concrete lining is added. If the ground is dry or the tunnel is subject only to limited percolation of groundwater, no further treatment is needed. But if permanent groundwater level is about the tunnel, generally a watertight membrane is added between the construction support and the interior lining.
The clay ground that occurs along the majority of the distance between Dallas and Laredo
will be considered to have appreciable stand-up time and will also need to be dewatered. The decision on lining will depend on the results of the geotechnical evaluation.
Requirement 10: Designed to handle emergency freight spills from the MTM
This design is in spite of the MTM being designed for zero spills, thus providing
redundancy and reliability. Special entrance points are designed into the tunnel at appropriate intervals. The length of the intervals is determined by the ease of reaching the location of the spill. Cost is a large factor in determining the spacing of the entrance points. Requirement 11: Adequate ventilation
Adequate ventilation is related to the process of handling spills, maintenance procedures
(both routine and non-routine), and exhaust or ozone gases produced by the selected propulsion system. Ventilation requirements are determined by the human requirements in case of maintenance. In addition, capsule aerodynamic characteristics may also affect the amount and location of ventilation systems. Requirement 12: Preventative maintenance program
Generally speaking, tunnels require little maintenance. However, inspections are
recommended every four years to take note of damages or deformation of linings and structures.

Texas Transportation Institute 36 Rail Research Center/AAR Affiliated Lab
The ingress of water should also be monitored. Drainage systems for the potential flooding, depending on the type installed, must also be maintained. Requirement 13: Fire protection
The tunnel is constructed of metal, concrete, or other non-organic materials to protect
against fire. The liability for the contents of the freight being transported through the tunnel must be determined.
Cost Analysis of Underground Structure
The cost analysis of the tunnel very much depends on the type of construction that is
utilized. The two main types under consideration are cut and cover, and use of a tunnel-boring machine. The cost cannot be specifically defined without first completing a geotechnical evaluation. Once such an evaluation is done, the costs can be outlined according to the following areas:
• site preparation, • excavation, • foundation, • de-watering, • structure, • finishing/backfill, and • site un-prep.
The site preparation and cleanup vary widely between the two processes. Also backfill is not necessary in the tunnel-boring process. However, the tunnel-boring process requires a dumpsite for the excess earth. Rural areas are suitable for the cut and cover method, whereas, in urban areas, some tunnel boring may be required to avoid possible conflicts with existing aboveground structures.
Power Plant for the System
The power plant sub-system is the heart of the freight transportation system. It provides vital power for all the sub-systems. The requirements for the system are as follows:
1. Rated power for the whole system is roughly estimated at 1770 MW. 2. The power supply must be uninterrupted and stable. 3. Power transmission is efficient. Design for Requirements Requirement 1: Rated power for the entire system is roughly estimated at 1770 MW
Single or multiple power plants capable of delivering this amount of power may be needed. This means having a base load generating station capable of delivering at full load

Texas Transportation Institute 37 Rail Research Center/AAR Affiliated Lab
consistently. Such power plants have high conversion efficiency and can generate electric power at low costs. They are characterized by high capital investment and low fuel cost. However, the base load generating units have poor load change capability, i.e., they would take more time to respond to the load demand than the peak load generating systems.
Tunnel electrical load may include power requirements for:
• MTM – If electrical propulsion systems are selected, then power will be required along the entire corridor.
• Ventilation, cooling, and pumps – Power requirements depend on fan types, drives, and ventilation needed in the tunnel.
• Communications and controls – Hardware and sensors would be the major users of power.
The power requirements of the system are calculated based upon the number of pallets,
the weight of the pallets, and the power required to move the pallets. For detailed information on these factors and relevant calculations refer to the Appendix.
Note: The preliminary power requirements are determined based on factors that may
change after detailed design of the pallet conveyance mechanism. This may require corresponding changes in the estimated power requirements.
Requirement 2: Uninterrupted and Stable power supply
Alternate reliable sources of power are necessary in the event of failure. Some common
backup systems include: engine-driven generators fueled by gasoline, oil or natural gas, and uninterruptible power supply (UPS) systems. Uninterrupted power systems are often provided for systems associated with public safety and utilize computer-based equipment such as monitoring and control, fire protection, security, traffic control and surveillance, and communication systems. Standby power distribution systems would consist of automatic transfer switches, panel boards, and associated wiring. Requirement 3: Efficient power transmission
Power transmission from the power plant to the subsystems – terminals, tunnel, control system, and main transport mechanism, must be reliable and efficient. The power distribution system can be classified into the following: • Primary Distribution System – This system supplies power to the load center unit
substations located strategically to permit relatively short low-voltage circuits. • Secondary Distribution System – This system supplies the power to the load center unit
substations for the traction purpose. Operational reliability is increased by redundancy.

Texas Transportation Institute 38 Rail Research Center/AAR Affiliated Lab
Power Generation Concepts and Options
In order to satisfy system requirements, alternative power generation options will be reviewed. This exercise is important at the early stages of systems design in order to assess the potential expenditure required to supply power to what may prove to be an energy-intensive system. The various types of power generation systems reviewed are coal-fired power plants, oil-fired power plants, natural gas-fired, nuclear, gas turbine, and hydro-electric and pumped storage plants.
Coal-Fired Power Plants
Coal-fired plants make up slightly over one-half of the electric power generation of the United States and in most other countries (see Figure 3). Design of this system should be done based on the following factors:
• Location of the plant site - The site should be large enough for sufficient coal storage and
should be accessible to coal delivery. It should also be suitable for condenser cooling water either from a river or a water body, or by cooling towers.
• Steam generators - Designed to burn coal, they must be tailored for the specific application.
• Turbine systems for the power plant - Single shaft units generate power in the range of 1100 MW. Cross-compounded (two shafts) turbine units occasionally achieve greater capability and higher efficiency. Maximum capabilities range from 500 to 1300 MW.
• Amount of water required for the power plant - A power plant consisting of four 600 to 800 MW units would require 1,600,000 to 2,000,000 gpm of water.
• Waste disposal - Waste disposal is a major concern in coal-fired generating plants. Coal fly ash must be collected in electrostatic precipitators. Fly ash is ash carried by the combustion gases. Heavier ash would fall to the bottom of the boiler furnace, where it would be collected in a hopper. Facilities must be provided to remove the dry ash from the precipitator hoppers and the bottom ash from the boiler bottom hopper.
Oil-Fired Power Plants
Oil-fired power plants use fuel oil as the main source for generating power. Two grades of fuel oil could be used. No. 2 distillate oil is light oil (specific gravity 0.8654 at 50 °F) and usually contains 0.4 to 0.7 percent sulfur. No. 2 oil is used in gas turbine applications. No. 6 oil is much heavier (0.9861 at 60 °F) and contains up to 2.8 percent sulfur. No. 6 grade is generally used in large central station boilers.
According to Kam W. Li and A. Paul Priddy, presently 4 percent of power generation in
the U.S. is oil-fired (21). But it is not expected that any new large oil-fired central stations would be built in the foreseeable future due to fluctuations in oil prices making this option economically infeasible.

Texas Transportation Institute 39 Rail Research Center/AAR Affiliated Lab
coal (55%)
oil (4%)
hydro/other(10%)
natural gas (9%)
nuclear (22%)
1991 TOTAL USA = 2,825 BILLION kWhSource: Annual Energy Review by U.S. DOE 1992
Figure 3. Power Generation from Different Sources (1991 data).
Natural Gas-Fired Plants
Natural gas-fired plants currently make up 9 percent of electric generation in the U.S. Natural gas-fired plants are the simplest and cleanest of all the fossil power plants. Except for the boiler design and operation, this plant system is similar to that of a coal-fired plant. This option presents better applicability due to the supply availability of natural gas in Texas. Nuclear Power Plants
Nuclear power plants provide about 22 percent of the power generation in the U.S. More than 70 nuclear power generating units are now in operation throughout the country. These plants have operated remarkably well and have generated electric power at a lower cost than the average of other modes of generation. The construction period of these units has extended to 12 to 14 years from the date of inception. The cost per kilowatt has increased from original forecasts of around $600 to $2500 or more. The production of steam in a nuclear reactor is by means of the reactor coolant fluid, which is water in most cases. One can either utilize a boiling water reactor (BWR) or pressurized water reactor (PWR). The capacities of the nuclear plants vary in the range from 900 MW to 1100 MW. The forecasted energy requirements necessitate a single plant of large capacity or two plants of lesser capacity each. Spent fuel would be a problem in nuclear power generation. Gas Turbine and Combined-Cycle Plants
Gas turbine power plants have secured a prominent place in electric utility systems. The plants are compact, relatively inexpensive and could be constructed within two years. These plants occupy less space. Gas turbines are less polluting than other fossil or nuclear plants. Environmentally harmful discharge gases such as NOX, could be reduced. The plants could be

Texas Transportation Institute 40 Rail Research Center/AAR Affiliated Lab
made relatively free of noise when equipped with the proper level of inlet silencers. Gas turbine plants have the further advantage of being quick starting. They could be on line at the rated load within 30 minutes. The sizes of single units of gas turbines could be manufactured in many steps up to 100 MW and even higher.
Combined-cycle plants are an extension of gas turbine plants, having heat recovery
boilers to utilize the gas turbine exhaust heat and a steam turbine generator. The combined-cycle plants have most of the advantages of a simple cycle gas turbine, with the added advantage of a heat rate that is lower than all other fossil-fired or nuclear plants. A typical combined-cycle plant would consist of two or more gas turbines, each with a heat recovery boiler serving steam to a single-steam turbine generator. Plant capacities could be in steps of 150 MW to 600 MW. Hydroelectric and Pumped Storage Plants
Hydroelectric and pumped storage plants constitute 10 percent of the power generation in the United States. Hydroelectric generation utilizes the flow of natural rivers as they move from higher altitudes toward the oceans. Dams are built to channel the river flow through the hydraulic turbines with as much head as the natural gradient and terrain will feasibly permit.
Cost of Power Generation and Transmission
Many factors influence the cost of generating power. The fixed cost generally remains
constant regardless of the number of hours the facility is utilized. The variable cost is related to the production level of the facility. The various factors involved in each of the costs are shown below.
Fixed Cost
• Rate of return: It is the minimum acceptable percentage return on the invested capital.
Sometimes it is referred to as the cost of capital, the discounted rate, or the interest rate. • Depreciation rate: There must be periodic depreciation charges to the income in order to
recover the cost of equipment before its usefulness is exhausted. • Administrative and general expenses: These expenses cover administrative and general
salaries, miscellaneous materials and supplies, and any other expenses that have not been accounted for in the other components. The administrative and general expenses are usually expressed as a percentage of invested capital.
• Insurance expenses: These cover insurance against accidents to equipment and personnel as a result of fire, storm, hail, flood, or earthquake.
• Taxes other than income taxes: These expenses deal with property-related taxes, payroll taxes, and other miscellaneous taxes other than income or franchise taxes.
• Income tax: This component is determined by the rate of return. It is expressed as a uniform equivalent annual percentage of the invested capital.
The sum of these six components is frequently called the total fixed charge rate.
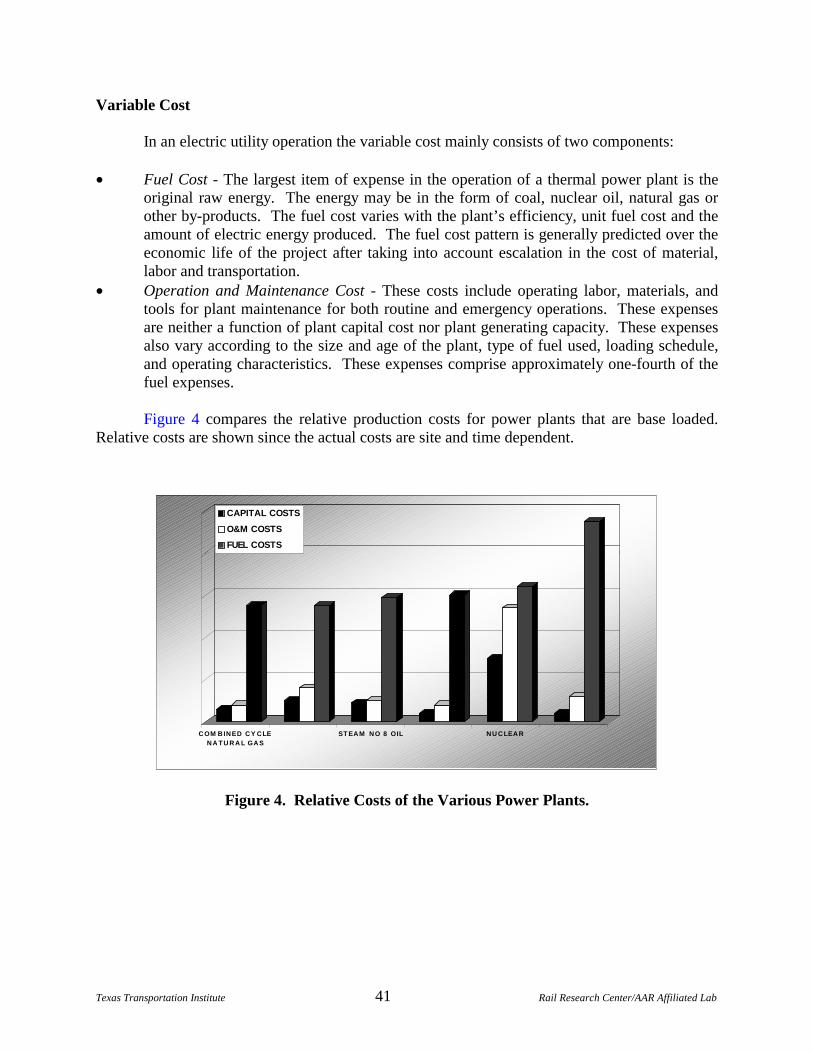
Texas Transportation Institute 41 Rail Research Center/AAR Affiliated Lab
Variable Cost
In an electric utility operation the variable cost mainly consists of two components:
• Fuel Cost - The largest item of expense in the operation of a thermal power plant is the original raw energy. The energy may be in the form of coal, nuclear oil, natural gas or other by-products. The fuel cost varies with the plant’s efficiency, unit fuel cost and the amount of electric energy produced. The fuel cost pattern is generally predicted over the economic life of the project after taking into account escalation in the cost of material, labor and transportation.
• Operation and Maintenance Cost - These costs include operating labor, materials, and tools for plant maintenance for both routine and emergency operations. These expenses are neither a function of plant capital cost nor plant generating capacity. These expenses also vary according to the size and age of the plant, type of fuel used, loading schedule, and operating characteristics. These expenses comprise approximately one-fourth of the fuel expenses.
Figure 4 compares the relative production costs for power plants that are base loaded.
Relative costs are shown since the actual costs are site and time dependent.
COM B INE D CY CL ENA T U R A L GAS
S T E AM NO 8 OIL NU CL E AR
CAPITAL COSTS
O&M COSTS
FUEL COSTS
Figure 4. Relative Costs of the Various Power Plants.

Texas Transportation Institute 42 Rail Research Center/AAR Affiliated Lab
MAIN TRANSPORT MECHANISM REQUIREMENTS AND PROPULSION SYSTEM OPTIONS
The MTM is one of the most important subsystems of the freight transportation system. As already detailed, the function of the MTM is to convey the freight pallets safely and securely between the terminals. The palletized freight is loaded onto the capsules by an automatic material handling system, which then using the MTM conveys the pallets from the terminal to its destination. One primary component of the MTM is the capsules. Each capsule is designed to carry six pallets.
The pallet dimensions are 40 in x 48 in x 60 in. Assuming that the pallet is placed along
its width of 40 in., the required length for each capsule is 25 feet assuming a foot between each pallet. It is necessary to maintain this distance to prevent the pallets from rubbing against each other and to help in securing the pallets while traveling at speeds of 45 mph and higher. See Figure 5 for the block diagram of the MTM.
Figure 5. Schematic Representation of the Functions of the MTM.
The MTM provides for four important functions:
• Secure the pallets in place and transfer them safely to the destination. • Provide structure for pallet transportation. • Exchange information with the control system. • Provide power source or conduit for the propulsion system.
Goods from
terminals
Propulsion system
Secure the pallets
Goods transported to
destination terminal
Provide structure for pallet
Power for propulsion
Exchange information with control system
MAIN TRANSPORT MECHANISM

Texas Transportation Institute 43 Rail Research Center/AAR Affiliated Lab
Requirements
The requirements of the MTM are listed below:
1. ability to handle the required capacity, 2. performance parameters allowing for the transport of pallets at least 450 miles, 3. ability to vary the speed of the capsule from 0 – 50 mph, 4. automated command and control of the MTM, 5. system safety and reliability, and 6. environmentally sound.
Design Requirements
Requirement 1: Capacity
From preliminary calculations it is estimated that the total design number of pallets to be
transported per day is 50,000. This number is the maximum number of pallets that need to be transported in each direction. Considering six pallets per capsule, the total number of capsules that are needed is set at a maximum of 8350. Also, the power required per pallet is 27.36 kW, or 200 kW for each capsule considering all conversion efficiencies.
The current total estimated length of the capsule is 25 feet allowing for sufficient distance
between pallets. The capsules are placed lengthwise and will be affixed to the floor of the MTM with a secure system of ties. The capsule height is estimated at approximately 6 feet to accommodate the maximum height of pallets.
Requirement 2: Performance
The selected propulsion system should be capable of transporting a maximum load a
distance of 450 miles without the need for refueling or any interruptions in service. This distance (Dallas to Laredo) will allow the system to move material from launch to destination arrival in approximately 10 hours. Requirement 3: Ability to vary the speeds between 0 – 50 mph
The selected system configuration should be able to accelerate from 0 to 50 mph and be
able to decelerate and stop safely when required. The system should also be able to maintain maximum speeds of approximately 50 mph without overheating or becoming dynamically unstable.
Requirement 4: Automated command and control
Speed and vehicle separation are the two main performance parameters that require automated control. Speed can be controlled by special mechanisms that control the flow of electricity or fuel to the propulsion system. Also, utilizing regenerative braking or other such mechanisms, energy use can be optimized and braking performance improved. Vehicle guidance

Texas Transportation Institute 44 Rail Research Center/AAR Affiliated Lab
should be fail-safe and integrated into tracks or some other guidance mechanism. Deceleration should be controlled and reliable and should not inordinately diminish capacity. Requirement 5: System safety and reliability
The entire system should be designed to eliminate any hazards to human operators.
Loading functions, vehicle preparation and queuing, vehicle launch, and recovery should be automated and configured in such a manner as to pose no danger to the employees involved. The system should also be maximally reliable, with as little down time for maintenance or trouble-shooting as possible. By incorporating redundant features and identifying critical parameters with a comprehensive failure modes and effects analysis, reliability of the system should be maximized. Requirement 6: Environmentally sound
This requirement is intended to ensure that the system design process considers exhaust emissions, noise, and other potential pollution-producing elements as key components to optimize. The benchmark will be the pollution-producing characteristics of trucks, and measurement metrics will be normalized by a common statistic such as ton/miles. Propulsion System Design Concepts
The review of available propulsion technology literature examines the various attributes of motive power systems for a long-range (> 450 miles), high-load freight pipeline. Although a comprehensive analysis cannot be accomplished without more in-depth research and examination, the pros and cons of each potential system are considered. Attributes such as technical compatibility within the context of the envisioned operating conditions, expected material and maintenance costs for each potential system, and operating requirements have been reviewed and three principal concepts are put forward for more detailed examination. The conceptual designs for the current system are: Concept 1: Use of natural gas as fuel source for the onboard propulsion system. Concept 2: Use of linear induction or linear synchronous motors for the propulsion system. Concept 3: Use of onboard electric motors as propulsion system.
The research team believes that the three propulsion system concepts evaluated meet, to a
large degree, the performance requirements for the MTM stated above and may perform most other functions satisfactorily. Since each concept for the propulsion system is different, the considerations by which the systems are evaluated may vary.
Concept 1: Use of natural gas as fuel source for the onboard propulsion system
This concept uses an onboard power plant and natural gas as the fuel. This approach is considered since the transportation system conduit is enclosed, and the fuel used for the propulsion system must have a low emission rate.

Texas Transportation Institute 45 Rail Research Center/AAR Affiliated Lab
A natural gas vehicle (NGV) is a vehicle that uses compressed (CNG) or liquefied natural gas (LNG) as the fuel for the engine. NGVs are more common abroad. Italy has about 300,000 natural gas-powered vehicles; the former Soviet Union has an estimated 250,000; New Zealand has more than 150,000; Australia has some 75,000; and Canada has more than 20,000. According to the American Gas Association, there are an estimated 35,000 NGVs operating in the United States.
Characteristics of Natural Gas Natural gas is a fossil fuel and can be found by itself or in association with crude oil or hydrocarbon condensates – gases that liquefy at normal atmospheric pressures and closely resemble mineral spirits. Natural gas is primarily composed of methane (CH4), with minor amounts of ethane (CH6), propane (C3H8), butane (C4H10), and pentane (C5H12). Natural gas has an ignition temperature of about 1200 degrees Fahrenheit, about 600 degrees higher than gasoline. The heating value of natural gas depends on the proportion of gases making up the mixture. Most commercial natural gas has a heating value from 960 to 1120 British Thermal Units (BTU) per cubic foot, with a rough average of 1025 Btu/cubic foot.
A very important characteristic of natural gas as a motor fuel is its very high octane number of 130. Thus, natural gas can be used in very high compression ratio gasoline engines with high combustion efficiency. When reduction of emissions is taken into account, the ideal compression ratio is approximately 14:1. The two major advantages of methane as a fuel are reduced wear of engines and reduced engine emissions. Requirement for Environmental Soundness NGVs’ exhaust emissions are 95 percent lower than conventional gasoline vehicles. Emissions of hydrocarbons are cut by 80 percent, and the nitrogen oxides are reduced by 30 percent. Emissions of carbon monoxide, a major health problem, are reduced by 95 percent. Emissions of gases that contribute to global climate change such as carbon dioxide are reduced by about 15 percent compared to gasoline use. Availability of Resources for Power There is no specific power generation source required, since the power plant is onboard. The only requirement is to have a good supply of the fuel at nominal costs. The natural gas could be stored at the terminals and the capsules could be refueled when necessary.
In 1988, the U.S. Department of Energy (DOE) concluded that the technically recoverable resource base for natural gas is 1050 trillion scf (standard cubic feet). At the current rate of consumption, this amount would be sufficient for more than 50 years. According to a U.S. DOE study more than half of the 1050 trillion scf is judged to be economically recoverable at wellhead prices less than $3.00 per thousand scf. The most abundant natural gas resources have been found in the Gulf Coast of Texas and Louisiana. Hence, the use of natural gas for freight transport in Texas seems to be a good choice given the proximate availability. Requirement for Safety The overall safety record of natural gas, including production, delivery, and end use, is superior to that of any other propulsion system used in

Texas Transportation Institute 46 Rail Research Center/AAR Affiliated Lab
automotive applications. It is especially favorable compared to gasoline. Despite the fact that natural gas is generally stored onboard vehicles at a pressure of between 3000 and 3600 psi, the safety record of natural gas cylinders far surpasses that of gasoline fuel tanks. There appears to be no reported deaths from an exploding fuel storage cylinder during the 25 billion miles natural gas vehicles have been driven worldwide.
Requirement for Capacity and Ability to Transport 450 Miles To travel 450 miles at a stretch means that there should be enough quantity of natural gas stored onboard the vehicle. From the power calculations it is evident that the total power required to convey one capsule with six pallets requires 200 kW. Studies on similar engines mounted on board the automobiles have been found to have a fuel efficiency of 15 – 20 mpg (miles per gallon). This means that the fuel capacity of the fuel tank is to be in the order of 30 gallons considering 15 mpg fuel efficiency.
Compressed Natural Gas (CNG) In CNG storage, the gas is stored in compressed form at pressures of 2400 to 4350 psi. The storage tank is typically cylindrical in shape, is permanently attached to the vehicle, and is refillable. The typical CNG storage tank has an internal volume of 13.2 gallon. Since the MTM needs about 30 gallons to travel 450 miles, two to three such tanks would be required on board the vehicle. Various configurations of tanks are available.
Liquified Natural Gas (LNG) LNG is natural gas that has been liquefied for easy storage or transport. Natural gas is turned into a liquid by extreme cooling to –256 °F. LNG is almost pure methane, and because it is a liquid, has an energy storage density much closer to gasoline than CNG. The requirements for maintaining the temperature of the liquid and its volatility make its applications limited for transportation purposes. Some demonstrations are currently being undertaken to look at LNG for heavy-duty applications such as transit buses, heavy-duty long-haul trucks or locomotives. This proven demonstration of LNG used for heavy-duty applications makes it an ideal candidate for use in the MTM.
As already mentioned, LNG storage requires a cryogenic tank. Heat transfer from the surroundings to LNG fuel can take place through three modes of heat transfer. The ideal means of limiting heat transfer is to surround the cryogenic fluid with a vacuum preventing neither conduction nor convection of heat to occur. Providing reflecting surfaces to thermal radiation can reduce the radiant heat transfer. This is the so-called Dewar vessel whose inexpensive version is well known as the “thermos bottle.”
Commercially available LNG tanks range in volume from 18 gal to 88 gal have a diameter ranging from 12 inches to 20 inches, and a respective length ranging from 50 inches to 96 inches. The empty tanks weigh between 100 lb and 350 lb and when full, weigh between 157 lb and 630 lb. All have a working pressure of 70 psi and a maximum allowed pressure of 235 psi.

Texas Transportation Institute 47 Rail Research Center/AAR Affiliated Lab
Feasibility of Using Natural Gas Vehicles
• NGVs have the required capacity to transport the capsule for 450 miles at the required speeds.
• The cost of the power plant is replaced by: ��cost of on-board engine, and ��cost of storing fuel on board and at the fuel pumps at the terminals.
• Pneumatic tires on concrete would be utilized as the means for providing traction. • Natural gas is neither corrosive nor toxic and is readily available in the state of Texas. • Natural gas vehicles have been proven to have low emission rates as compared to
gasoline engines. • Natural gas vehicles have been tested and could be available commercially. • Maintenance costs are low. • Automated control is achieved by ability to control the fuel flow. • Storage tanks are safe and reliable. Concept 2: Use of linear electric motors as a propulsion system A leading motive power system for freight pipelines is the electric linear motor with or without pneumatic assist. The linear motor is essentially a familiar round motor that is cut along the long axis and stretched out flat. The linear motor then uses the magnetic flux developed as current flows to push the movable section of the motor from one end of the flattened stationary section to the other end. There are two basic forms of this linear motor, the induced magnetic field type or the permanent magnetic field type. Both have variations in the method of application and each in turn has its advocates. One of the principals of practical application in attracting truck freight traffic to a freight pipeline is the ability to maintain the physical integrity of the freight shipment. Of primary concern for this system is the ability to provide a high-quality ride environment for the freight in the system. In considering this design principle, it becomes apparent that a relatively smooth ride will be a consideration in the modal shift equation. Given the potential for widely varying load weights and configurations, a substantial suspension system will be required for dampening vertical accelerations. The use of the induction linear motor system is considered to be outside the scope of this operational requirement since it requires a stable and unvarying coupling distance of only millimeters (3-5 at most to maintain reasonable efficiency) between the vehicle underside and the conduit. A simple suspension system operating under the load conditions expected would vary this critical distance by a far greater amount. A linear motor with a pneumatic assist system suffers from these same failings, but is examined to determine its potential use for a long freight pipeline. The positive attributes of this propulsion system revolve around the use of pneumatic forces that offset some of the power requirements otherwise needed to push air trapped between vehicles in a closed pipeline. Further, linear motors reduce vehicle weight and are relatively easy to maintain when accessible. On the negative side, the electric generation requirements, which are high, are not currently available. Also, pneumatic assist requires a special seal design on vehicles or the vacuum becomes lost between vehicles. The use of pneumatic assist requires single direction closed

Texas Transportation Institute 48 Rail Research Center/AAR Affiliated Lab
systems, which would increase the capital cost of the overall system. The trade-off between energy savings against capital and maintenance costs will require substantial investigation not contained in the existing literature. The linear motor technology for this application is limited to the synchronous type. The linear induction motor drive system without pneumatic assist and in a two-way, single tube enjoys many of the same benefits that the pneumatic assist approach can cite. These are the low expected maintenance costs, low vehicle weight, and energy efficiency. The disadvantages of the system include the fact that the linear induction motor requires a moveable platform to fixed guideway magnetic coupling distance of only millimeters. Large variations in the magnetic coupling distance will reduce motor efficiency dramatically. When a failed vehicle stops in the pipeline with an induced linear motor technology, the powered element must be turned off. If the fixed guideway is the powered element, no following vehicles will be capable of moving the failed vehicle along the pipeline to a place of removal. Finally, ozone generation is of concern and continues to be under investigation. The synchronous linear motor system also has low expected maintenance costs, low vehicle weight, and high energy efficiency. However, the synchronous linear motor system requires the permanent magnet portion of the motor to be the fixed portion of the motor, a requirement that carries a relatively high price, with as much as $2,000 – $4,000 in magnet costs per vehicle.
Feasibility The single-sided active guideway linear synchronous motor represents an acceptable solution as the technology has been widely used. The three-phase stator is located along the guideway, laterally, on both sides of the vehicle. The armature winding is energized section by section, by the rectifier-inverter system so that the system is continuously locked into synchronism. Reasonable performance levels could be expected as long as the section length does not go beyond 30 times the vehicle length.
Cost The main cost in this system is the capital cost. The capital cost would consist of:
• construction of specific guideways which would accommodate the stator in the
tunnel, • three-phase stator winding, • armature winding on the capsule, • capsule structure, and • rectifier-inverter system for armature excitation.
The operational cost would consist of the costs incurred in power consumption and maintenance of the system.
Safety and Reliability Safety and reliability are of prime importance, and the system should be operated in a synchronized mode to avoid collision of capsules. The system should also provide for the positive control of the capsule motion in case of power failure or other emergencies.

Texas Transportation Institute 49 Rail Research Center/AAR Affiliated Lab
Concept 3: Onboard Electric motor as a propulsion system
The final concept calls for a standard, electric rotary traction motor located on the vehicle in contrast to the linear motor concept where the guideway and the vehicle would form the motor. The onboard motor would draw power from the guide/side ways of the rail track. This eliminates the use of continuous secondary as is the case of linear motors. Both induction and synchronous onboard motors could be used to propel the capsules.
Induction Motors Direct current (DC) motors, which are standard rotary systems, are also being evaluated for use as the primary propulsion mechanism. The DC traction motor concept benefits from the fact that it is based on readily available technology. Using a third-rail configuration, pipeline construction and alignment tolerances are expected to have low criticality. These systems are in large supply, and an established service network already exists. With a long history of success in similar commercial applications, the DC traction motor is inherently robust, versatile, and fail-safe. Flexibility in locating the equipment on the vehicle and the potential for redundant motors make this an attractive option. In addition, the system could be easily adapted for power regeneration on down slopes in the pipeline.
Considering power requirements, it is seen that three-phase induction motors are the best
choice. Three-phase motors correspond to the number of phases in a commercial power system. The induction motors require no means of excitation other than the AC line. They are economical to build for higher speeds and lend themselves to a fair degree of speed control. Wound-rotor motors are more suitable as load requirements lead to higher starting torque due to high inertia. Moreover, they give a soft start with good speed control, which is necessary for MTM and material handling. The maximum torque is more than 200 percent of full-load value while the full load slip may be as low as 3 percent, which makes for a high full-load efficiency.
Synchronous Motors The synchronous motor is a constant speed drive. Its efficiency is higher than that of the induction motor. A drawback for the induction motors is that they require special starting conditions, but at the same time they provide excellent speed control. The separate source of excitation supplied to a synchronous motor provides it with a degree of flexibility not found in induction machines.
Cost The cost mainly consists of capital cost, power distribution system, and capsule structure. The cost of a separate source of excitation could be a factor in the case of the synchronous motor. The operational cost would mainly be for power distribution and maintenance of the system.
Safety and Reliability These are the same as discussed for the second concept.

Texas Transportation Institute 50 Rail Research Center/AAR Affiliated Lab
Comparison of the Three Propulsion Concepts
A preliminary comparison between the three concepts yields the following observations:
• Cost – Cost is an important parameter, but since the design is only at the conceptual stage, it is not possible at this stage to provide detailed comparisons for the three concepts.
• Weight – The weight is also an important parameter. For natural gas vehicles, total weight includes the gross engine weight, the weight of the transmission system, the fuel storage tank, etc. For onboard traction motors, the primary and secondary windings, casing, and flywheel constitute the total weight.
• In contrast to onboard motors, linear motors have their secondary laid down on the track. Thus, the vehicle contains only the primary, which is in the form of permanent magnet. Hence, linear motors are the best when compared by weight.
• Safety – Though gas vehicles are proven to be relatively safe, onboard fuel still presents a hazard other options do not face.
• An onboard traction motor requires power taps for both the primary and secondary. • Maintenance – Gas vehicles require maintenance of the engine, its storage tanks, etc.
Higher maintenance is required because there are a larger number of moving parts. • Linear motors require permanent magnets, which are expensive and may need periodic
replacement due to magnetic deterioration. No such replacements are required for onboard motors.
• Onboard electric motors are superior when maintenance is a key consideration. Two motors could provide the redundancy necessary to maintain high system reliability.
• Power source – Since power for the gas vehicles is carried on board, the considerable cost involved in providing for power plant capacity is eliminated.
• Since the electric system requires power to be tapped from the track, a base load power plant needs to be installed.
WAREHOUSING AND MATERIAL HANDLING SUBSYSTEM (TERMINAL)
This section of the report addresses sub-task 4.3 regarding determination of terminal logistics requirements. Among the factors considered are terminal operating capacity, power requirements, safety factors, automation, temporary storage capacity, and terminal size.
The WHMH system is one of the most important and complex sub-systems making up the freight pipeline system. In order to divert enough freight from highways to warrant the construction of an alternative transportation system it is mandatory that system throughput is sufficiently high so as to avoid a backlog of material awaiting shipment. This means, in very simple terms, that the system’s ability to handle pallets must be equal to or greater than the projected traffic loads. The performance burden falls upon the WHMH system and the pipeline itself.

Texas Transportation Institute 51 Rail Research Center/AAR Affiliated Lab
Very simple and preliminary projections give some indication of the magnitude of the materials handling task. For example, to divert 1000 trucks per day from Texas highways means that the freight pipeline system must handle between 25,000 and 30,000 pallets per day. To accomplish the daunting task, the system must be designed to:
• receive incoming trucks; • off-load pallets; • measure/weigh, identify, and dispatch pallets; • aggregate and send to appropriate MTM; or • send to warehouse for temporary storage; then • retrieve from warehouse and re-aggregate for shipment.
The preliminary functional design of the WHMH system includes nine principal
functions, as detailed below. These functions will be evaluated for completeness, and performance criteria will be attached to each element. 1. Provide for freight access to the system.
• Roadway • Rail • Air
The connecting roadway system must be adequate to accommodate a large amount of
traffic into and out of the freight pipeline complex without an unacceptable or otherwise adverse impact on surrounding areas. The location of the terminal should also allow modal access for air freight and rail. 2. Provide an efficient freight unloading system.
• Truck • MTM
The interface between arriving trucks and the freight pipeline system at the dock is a
function that must be undertaken with a high level of efficiency in order to keep system throughput at target levels. Whether manual or automated, the unloading process is an extra step in the transportation of freight that over-the-road drivers will not have to perform and, thus, must be performed very efficiently. 3. Measure and identify incoming freight.
• Dimensions • Weight • Ownership • Priority • Time/Date • Destination/Origin

Texas Transportation Institute 52 Rail Research Center/AAR Affiliated Lab
The measurement and identification of incoming freight is essential to effective routing and system reliability. 4. Provide for the transfer of pallets between various system elements within the WHMH
system. • Storage • MTM • Truck
This function speaks to the fundamental movement of pallets from receipt to loading in
the MTM. The performance specifications will determine what system options are available, but it is envisioned to be a highly automated network of conveyors and lifts.
5. Storage System.
• Retrieval • Transfer
The users of the freight pipeline may determine that temporary storage or warehousing of
material is desirable. High-priority freight may move directly from trucks to the loading zone for placement on an MTM, while lower priority shipments may be held until it is determined that the goods need to be shipped.
6. Loading/Unloading System.
• MTM
The pallet loading system will interact with the transfer mechanisms to aggregate the required number of pallets for placement into a ready MTM. Initial concepts include a multi-forklift system that will lift and move pallets in one motion into the MTM’s cargo bay. The MTM will provide for locking the pallets securely to the vehicle so that the reverse operation may take place on the receiving end of the system. 7. Information Exchange with Control System.
As with each sub-system, the WHMH components will be integrated with the overall command and control structure of the freight pipeline system.
The design issues to be considered are:
• Capacity and size • Automation • Costs - capital costs and operational costs • Safety and reliability
Figure 6 depicts a conceptual diagram of the terminal. The layout shown combines docks
for loading and unloading trucks, a warehousing location for temporary storage of pallets, a bay for storage of inactive MTMs, and the loading/unloading area for the conduit.

Texas Transportation Institute 53 Rail Research Center/AAR Affiliated Lab
Figure 6. Schematic Representation of the Warehousing and Material Handling System.
PALLET IDENTIFICATION SYSTEM
Identification System for the Freight Pipeline
An important part of the freight pipeline feasibility study is a design for the pallet and vehicle identification system and estimation of its cost. Pallet and vehicle identification systems are an integral part of the warehousing and material handling systems. This section will present the technology preliminarily chosen for application, justification of the choice, and an initial cost estimation.
A literature search was conducted in order to determine existing identification technologies and investigate their applicability for this project. Automated identification technology can be divided into six main areas:
Warehousing Management
System
Terminal
Loading/Unloading
Temporary Storage of MTMs
Loading/Unloading from MTM

Texas Transportation Institute 54 Rail Research Center/AAR Affiliated Lab
• biometric, • smart card, • electromagnetic, • magnetic, • optical, and • touch.
There are four specific considerations that should be taken into account while making a choice regarding the type of identification technology selected. The main requirements are as follows: absence of line of sight, ability to identify moving objects, ability to operate in noisy environment, and non-sensitive to dirt. Taking into consideration the specifics of the transportation system addressed in this study Radio Frequency Identification (RFID) and Bar Code Technologies have been chosen for further investigation. Radio Frequency Identification Systems
RFID is an approach to identifying items over relatively short distances (a few inches to a hundred feet) by the use of radio signals. RFID uses a reader (interrogator) and special RFID devices attached to an item (tags). Radio waves transfer data between a reader and a tag. An interrogator sends out a RF signal which “wakes up” a tag, and a tag transmits information back to an interrogator via RF. In addition to reading a tag, an interrogator uses RF technology to write new information to the tag. This makes it possible for the user to alter the information stored in a tag from a distance. Interrogators can be networked together so as to provide coverage for a large system. Data within a tag may provide identification for an item in storage, goods in transit, a location, or what time an item traveled through a certain zone. System Configuration
A typical RFID system consists of a tag, an antenna, a reader, a programmer for read-write tags, and some sort of computer processing equipment. In addition to this basic equipment, an RFID system includes application-specific software. The reader sends requests for identification information to the tag. The tag responds with the respective information that is then passed by the reader to the data processing device.
The system can be classified according to the frequency used for data transmission. Three
frequency ranges are generally distinguished, low (100-500 kHz), intermediate (10-15 MHz), and high (850-950 MHz, 2.4-5.0 GHz). Data transmission rate is of primary importance when making the decision regarding the frequency range. The higher the frequency the higher the data transfer or throughput rates that can be achieved. The system can be broken down according to tag characteristics: whether the tag is passive or active, read-only, write-once-read-many, or read-write.
Texas Transportation Institute 55 Rail Research Center/AAR Affiliated Lab
Tags
The tags may be programmed with data that identify the item to which the tag is attached. The tag responds to a transmitted request for the data it carries. Power is required for tags to work even though the levels are very small. Depending on the manner in which the device derives its power, the tags are either passive or active. Internal batteries power active tags to receive and transmit information. These tags can contain a greater number of components. The advantage of active tags is that they reduce the power requirements of the reader, the reading distance is larger, and the data transmission rates are higher. The use of battery-powered tags, on the other hand, means finite lifetime, larger size, and greater cost. Passive tags operate without an internal battery source, deriving the power to operate from the field generated by the reader. They are smaller, lighter, and less expensive than active tags, and offer unlimited operational lifetime. The disadvantages are that the read range is shorter, they have limited data storage capacities, and they require a higher powered reader.
More details regarding the comparison of advantages and disadvantages of passive and active tags are presented in Table 7. Antenna
Each RFID system includes an antenna to transmit and receive the RF signals. The quantity and type of antenna used depends on the application and the type of the tags. In some cases the antenna can be included in the reading device. Reader
The main function of the readers is to provide the means of communication with the tags and facilitating data transfer. The reader sends a signal to the tag, receives and encodes the signal from the tag, decodes the tag’s identification, and transmits the identification with any other data from the tag to the host computer. The reader/interrogator can differ considerably in complexity depending on the type of tags being supported and the functions being fulfilled. RF Transponder Programmer
The transponder programmer delivers data to the tags. This function can be carried out off-line at the beginning of the process or re-programming can be carried out on-line, if the data should be changed during the process. There is a possibility of combining reading and programming functions into one device in order to receive and program data without interruption. Programming range is generally less than read range, and in some systems positioning the units nearly in contact is required.
RFID is flexible technology that is convenient, easy to use, and well suited for automatic operations. It combines advantages not available with other identification technologies. RFID can be supplied as read-only or read/write, does not require contact or line-of-sight to operate,

Texas Transportation Institute 56 Rail Research Center/AAR Affiliated Lab
can function under variety of environmental conditions, and provides a high level of data integrity.
Taking into account the complexity of the freight pipeline system, two identification sub-systems will be considered: Terminal RFID System and MTM Truck RFID System (identification of the vehicles inside of the pipeline). The prices for the parts of different types of RFID Systems, which will be used in further calculations, are presented in Table 6.
Table 6. RFID System Costs. Type of RFID technology Tag Reader Antenna
a) RFID passive read only b) RFID passive read/write c) RFID active
$2 $12 $62
$55 $2,100 (programmer included) $3,600 (programmer included)
Included in reader Included in reader
$400 TERMINAL RFID-SYSTEM Terminal RFID Systems allow programming, reading and attaching tags with information about the owner, day and time of shipment, and other information about the pallets. Both bar code and RFID technologies could be used for such systems. Five scenarios will be considered:
1. Bar Code (no monitoring of pallets in storage) 2. RFID passive read-only tags (no monitoring of pallets in storage) 3. RFID passive read/write tags (no monitoring of pallets in storage) 4. RFID active tags (no monitoring of pallets in storage) 5. RFID active tags with monitoring of pallets in storage
A comparison of the advantages and disadvantages of the proposed scenarios is shown in Table 7. The interrogator/programmer may be installed directly on forklifts unloading/loading the trucks. The system should be able to operate in a noisy and moving environment. The tag should be able to store at least a 12-digit serial number. The challenge may be to develop a device to store and attach/detach tags to/from pallets. Out of five proposed cases, only the last three will allow reprogramming of the information on the tags directly at the terminals. Because of the potential size of the facilities and presence of storage areas at the terminals, the question arises regarding monitoring of the pallets while stored at the facilities. Active RFID technology would make monitoring possible. There are two ways to monitor pallets: 1) to create zones with the movement of tagged pallets in and out of the zone monitored (antennas can be located so direction of movement can be determined), and 2) to blanket the storage area. This would allow continuous real-time communication with the tags.
Texas Transportation Institute 57 Rail Research Center/AAR Affiliated Lab
In this case the same active tags and interrogators can be used for Terminal and MTM systems. Tags can contain different information depending on where they are used. All interrogators would be able to read the ID on all tags, but files on the tags can be password protected and accessible only by applications programmed to use the password. MTM RFID SYSTEM The MTM RFID System should be designed to read or write on tags attached to vehicles at departure or arrival.
The interrogator/programmer should be able to program information about the number of pallets, the owner, date, and time of departure. Due to the speed of the cards and large read range for interrogators inside of the conduit, active RFID technology is proposed. The system should meet the following requirements: • the speed of the tag while passing the interrogator - 60 mi/hr, • the required read range - ~ 6 ft, and • the size of the memory - at least 12 digit serial number. CONCLUSIONS Due to the high speed of the MTMs inside the conduit, active RFID technology should be used for the MTM system. Five cases have been investigated for two scenarios of MTM monitoring inside of the pipeline (midpoint monitoring and each mile monitoring). A preliminary evaluation shows that the cost of the equipment increases when we move from using the passive to active RFID technology. At the same time, the identification and monitoring capabilities of the system improve and allow more control over the process. The results of the preliminary evaluation show that the cost rises considerably if active RFID is chosen for both terminal and MTM systems, but only this combination gives us continuous real-time communication with the tags. Before making any final decision, all aspects should be taken into consideration including the system capacity and the level of control necessary for the process.
ID tags would be placed in the buffer zone of the loading docks. This tag includes information about the destination, source, manufacturer, and other information. This process would be handled by a separate ID tag system in conjunction with the control system. The main function of the ID system would be to correctly convey to the control system information about the location (and other details) of the pallet. The different types of ID system are discussed next. Laser System
This system utilizes a bar code sticker attached to the pallet, which is then scanned by a laser scanner. The bar code is placed at a strategic location on the pallet for ease of identification. The scanners would be placed within the system when the need to locate a pallet arises. The drawback to this system is that it is sensitive to dirt.

Texas Transportation Institute 58 Rail Research Center/AAR Affiliated Lab
Radio Frequency (Wireless) Identification System This system uses a transponder known as a RF-tag or global positioning (GPS)
transponder mounted on the pallet, which is then read by a transceiver or a base station. The tags can come in many shapes, from flat adhesive labels to blocks inserted into the pallets. Advantages of using RF-tags include the capability of the tags being read at extremely high speeds and the capability to perform well in varied environments. The tags also operate effectively with no line-of-sight or direct contact necessary. Infrared System
This system is similar to the RF approach except that it uses infrared technology for reading/transmitting. This has similar drawbacks to the laser technology.
Table 7 summarizes the advantages and disadvantages of each system.
Table 7. Identification System Scenarios.
TERMINAL ID SYSTEM
MTM TRUCK RFID SYSTEM
ADVANTAGES DISADVANTAGES
Bar code technology
Active read/write tags
Least expensive technology among all cases
Short read range (4 –18 inch); Sensitive to dirt; Requires line-of-sight; Unable to monitor pallets in the storage
Passive read-only tags
Active read/write tags
Not expensive technology Unable to add any information on the tags; Unable to read through the pallet (sensible to the pallet orientation); Unable to monitor pallets in the storage; Short read range (up to 3 ft)
Passive read/write tags
Active read/write tags
Longer read range (up to 10 ft); Ability to record information on the tags;
Unable to monitor pallets in the storage; Unable to read through the pallet (sensible to the pallet orientation)
Active read/write tags
Active read/write tags
Longer read range (up to 100 ft); Ability to record information on the tags; Ability to monitor pallets in the storage
Expensive technology

Texas Transportation Institute 59 Rail Research Center/AAR Affiliated Lab
CONTROL SYSTEM DESIGN Command, control, and communications (C3) is the term given to the automated systems
designed to control complex interactions among the elements composing a larger system configuration. As a descriptive term, C3 speaks to the three fundamental roles that must be well thought out and implemented if a complex system is to work as intended. The feasibility study being undertaken for a freight pipeline system in Texas represents just such a complex system. This section of the report describes the initial concepts and planning that have been directed at the control systems aspect of the freight pipeline. The goal of the research, as with other facets of the overall system, is not to design a working control system but rather to establish the requirements necessary to develop a design for a system that will control the operation of the system and thereby estimate the associated costs. Functions Performed by the Control System A preliminary assessment of control system interactions is presented in Figure 7.
Figure 7. Functions of the Control System.
The control system must be designed keeping in mind the interaction of two subsystems, the WHMH and the MTM. In addition, the control system will determine the behavior of MTMs while in transit, particularly vehicle speed and distance between vehicles.
CONTROL SYSTEM FUNCTIONS
MTM spacing
MTM
power distribution
EN ROUTE
conveying system
pallet ID & control
truck/traffic control
warehousing

Texas Transportation Institute 60 Rail Research Center/AAR Affiliated Lab
The design of the control system for the pallet transfer in the MTM and WHMH is based on the schematic depicting the five layers of control shown in Figures 8a and 8b respectively.
Figure 8a. Schematic Representing the Figure 8b. Pallet Control in the WHMH. MTM in the Pipeline.
Year 2 research will detail the architecture and design parameters of the command and
control system in a manner that allows refinement and initial cost estimates. INTERFACE DESIGN
The interface design for the Freight Transportation System is represented in Figure 9. The control system has a two-way interaction with all systems except the tunnel/underground system, with which it has no interface. The power generation and transmission system have a one-way interaction with the tunnel/underground structure.
Network Layer
Physical Layer
Raw data
Sensor data
Pallet flow data
Link Layer
Travel time Routing
Speed, Lane Exit
Maneuver Request
Co-ordination Layer
Control Input
Regulation Layer
Network Layer
Physical Layer
Raw data (actual position)
Sensor data
Pallet flow data
Link Layer
Total loading and unloading time for
a pallet
Routing-
Loading/unloading time
Loading/unloading
Co-ordination Layer
Regulation Layer
Control Input

Texas Transportation Institute 61 Rail Research Center/AAR Affiliated Lab
Figure 9. Preliminary Interface Diagram. The design of the interfaces is based on two key factors: safety and reliability. 1. Control System ↔ Power Generation and Transmission: Physical Interface: Connected by way of wiring and transformers. Functional Interface: Current, voltage measurement, and feedback. 2. Control System ↔ Warehouse and Material Handling System: Physical Interface: Connected by way of controllers, sensors, and positioning devices. Functional Interface: Pallet transfer control. 3. Control System ↔ MTM/Propulsion System: Physical Interface: Connected by way of controllers, sensors, and path-side devices. Functional Interface: Capsule transfer control. 4. Warehouse and Material Handling System ↔ Power Generation and Transmission: Physical Interface: Connected by way of wiring and transformers. Functional Interface: Power for Warehouse and Materials Handling System. 5. Warehouse and Material Handling System ↔ MTM/Propulsion System: Physical Interface: Connected by way of conveyors, sensors, and positioning devices. Functional Interface: Pallet transfer to MTM, pallet conveyance system. 6. Warehouse and Material Handling System ↔ Tunnel/Underground Structure: Physical Interface: Structures, entrances, and exits. Functional Interface: Pallet transfer from and to WHMH. 7. Power Generation and Transmission → Tunnel/Underground Structure: Physical Interface: Electrical towers, wiring, and transformers.
Transmission only
Control System
Tunnel/Underground Structure
MTM/Propulsion System WHMH Power Generation and Transmission

Texas Transportation Institute 62 Rail Research Center/AAR Affiliated Lab
Functional Interface: Power transmission to MTM/Propulsion System. 8. MTM/Propulsion System ↔ Tunnel/Underground Structure: Physical Interface: Structures, fixed guideway or rails, and exits. Functional Interface: Enclosure for MTM/Propulsion System, routing. 9. Power Generation and Transmission ↔ MTM/Propulsion System: Physical Interface: Wiring, transformers, and motors. Functional Interface: Transmission from power source to MTM/Propulsion System.
FAILURE MODES AND EFFECTS ANALYSIS
In conducting an analysis of failure modes and effects, the first three steps are:
1. defining the system performance, 2. specifying the assumptions and ground rules, and 3. developing a model of the system.
These three steps have been achieved to varying degrees for the designs investigated to
this point. The final two steps in the analysis are to identify and analyze the failure modes and to recommend corrective actions and design improvements. One of the key factors that must be weighed appropriately when considering a failure modes and effects analysis is the cost of the system. Theoretically any system could be made totally reliable if cost were no issue. Several layers of redundancy could be built into the system at every point to achieve maximum reliability. Since cost and system safety or integrity are both of concern in this project, a balance between the two must be reached.
In identifying and analyzing the failure modes for the envisioned freight pipeline
transportation system, each sub-system is analyzed and potential failure modes are assessed. Recommendations and corrective actions resulting from this analysis will be proposed for the subsequent conceptual designs of each of the sub-systems.
Underground Structure
The major modes of failure to the structure are as follows:
• Settling of the structure due to improper foundation: This is overcome by paying special attention to the design of the foundation to prevent failure. Corrective actions could include reinforcement of the foundation.
• Cracking of the structure: Actions include use of proper reinforcements allowing for excess loads.
• Flooding of the tunnel: Actions include a provision for drainage channels inside the structure.
• Fire protection: Following OSHA standards and other fire hazard regulations will be recommended.

Texas Transportation Institute 63 Rail Research Center/AAR Affiliated Lab
• Minor damage from use: Regular maintenance and monitoring for any damage will be recommended.
Power System
In the power subsystem, the major areas of failure and recommended actions are:
• Break in power supply: Standby power supply systems should be evaluated. • Improper transfer of power to MTM: State of the art transmission systems with adequate
transmission structures, transformers, and routers ensure uninterrupted power transfer. • Safety within the power plant: The power plant system should be designed to adhere to
all recommended safety regulations. Main Transport Mechanism
The modes of failure and safety issues in this system are:
• Securing of pallets: Adequate fastening devices are to be installed to ensure secure transport.
• Ensuring capsule stability: Systems are to be in place that ensure transport of the capsules at rated speeds and without spills or collisions.
• Control of capsules: Built in redundancies in the control system will ensure control at all times.
• Contingency plans: Contingency measures in case of collisions, spills, or breakdowns are integrated in response systems.
Failure modes to be evaluated are:
• Failure of the primary coil: This can be due to a faulty power supply, short circuit of the
coils due to improper insulation, and mechanical failure of coil due to wear and tear. A transmission system with proper relays ensures correct power supply. With linear motors, the conduit carrying the cables is insulated from the surroundings. Periodic checking and replacement of faulty cables prevents mechanical failure.
• Failure of secondary coil/permanent magnet: Secondary coils have similar failure features as the primary coils. In case of permanent magnets on the vehicle, periodic monitoring for demagnetization and replacement can prevent failure.
• Failure of guideways: This could result from mechanical failure due to wear and tear. Track designs with a high factor of safety and periodic inspection reduce the mode.
Warehousing and Material Handling System
The failure modes within this system are:
• Securing of pallets: Pallets are conveyed safely without tipping and spills; achieved in conjunction with control system. Redundancies in the system should ensure adequate response in case of contingencies like spillage to offset system down time.

Texas Transportation Institute 64 Rail Research Center/AAR Affiliated Lab
• Ensure zero blockages: Design should provide control mechanisms to eliminate bottlenecks in the systems; requires efficient routing, flow planning, and realtime decisions. In case of emergencies alternate routes and plans are available.
Control System
The possible failure modes and effects are: • Loss of control: Provisions for self-test design ensure that the control system operates
within parameters. Redundancies in control system components ensure automatic adjustment.
• Accident prevention: Algorithms built into the control system are conflict-avoidance driven. Conflict resolution is provided at every stage in the control process, with precedence being given to the process with higher priority.
CONCLUSIONS
Subsystem Designs
The preliminary systems engineering for the freight pipeline addressed safety and
reliability requirements as well as the statement of needs outlined at the beginning of the chapter. Designs have been presented at a conceptual level. Detailed designs have not been considered at this time. Preliminary cost analyses were performed on some components at a high level, illuminating potential areas of excess cost. Detailed costs are dependent on a greater level of detail and will be undertaken in subsequent stages of the feasibility project. Some initial design ideas and the means of fulfilling the requirements for each sub-system are outlined below.
Underground Structure
The major requirements are to provide a subterranean structure, which can support the main transport mechanism for a distance of 450 miles from Dallas to Laredo, Texas. The structure travels through a wide range of terrain and must handle variations in soil composition. The suggested method for building a structure to meet the needs is using the state of the art technology in underground structures. This would require that the design utilize concrete and steel for the materials. Cut and cover methods are suitable for construction, especially in the rural areas and limited tunnel boring could be utilized where necessary, especially in the urban areas to bypass existing aboveground structures. Main Transport Mechanism
The major function of this sub-system is to convey the pallets from one terminal to another (Dallas to Laredo), a distance of 450 miles. The constraints cited include that the system must be automated, safe, secure, and capable of traveling at speeds in excess of 45 mph. The propulsion concepts that have been generated meet these requirements and general performance criteria. The concepts are:

Texas Transportation Institute 65 Rail Research Center/AAR Affiliated Lab
• Natural gas as fuel for onboard power plant: The capsule, which carries the pallets through the tunnel structure, requires an onboard power plant.
• Linear induction or linear synchronous motors as the propulsion system: This concept employs the principle of a linear form of rotary motors. The guideways and the vehicle act as the stator and the rotor and the combination act as the propulsion system for the vehicle. There are advantages and disadvantages for both the designs. The choice of the design will be determined following additional detailed analyses.
• Electric traction motors as the onboard propulsion system: This concept utilizes the motors on board the capsule for propulsion. The drive system could be either pneumatic tires on concrete or steel wheels on rail. The motor has to access power from the guideways.
All the above concepts are feasible and each has its advantages and drawbacks. The final selection will be based on additional data and assessment. Power Plant System
The power plant generates the total power required by the system at the terminals, control system, and depending on the propulsion system selected, the main transport mechanism. Various power plants were discussed in the power plant section. This selected system should use state of the art technology and be as environmentally sound as possible. Depending on the power requirements there may be a need for more than one power plant. Two of the concepts for MTM propulsion need the transmission of electricity for linear and rotary motors. The concept of natural gas does not need any captive power plant. In that case, a fuel storage refueling station is used instead of electrical power. Warehousing and Material Handling System
This system handles the pallets within the terminals and is involved in the transfer of the pallets between the trucks, loading docks, warehouse, and the MTM. State-of-the-art technology in conveying systems, automatic storage and retrieval systems, and warehouse management systems will be used. Additional assessment will be directed as this function in the coming year. Control Systems
The control system is the overall manager for automation and control issues throughout each sub-system. State of the art technology will be used for hardware and software when implementing this design. Cost Analysis Costs have only been analyzed within each sub-system at a conceptual level. Potential areas for costs have been identified within each sub-system. Detailed analysis will follow in subsequent stages of the analysis.


Texas Transportation Institute 67 Rail Research Center/AAR Affiliated Lab
CHAPTER 4 – NUMERICAL STUDY OF THE AERODYNAMICS OF A CAPSULE FREIGHT PIPELINE
INTRODUCTION
This section contains the results from an initial study into the aerodynamics of a freight pipeline system. The analysis has been undertaken in order to understand the parameters driving energy consumption, a major contributor to the marginal cost of operations. In order to minimize operating costs it is necessary to decrease the energy expenditure of the capsules as they navigate the pipeline. General expressions relating the dependence of the capsule drag on basic design parameters (e.g., blockage, capsule length, etc.) are presented. These expressions allow the reader to gain a feel for the relative importance of the design parameters. These expressions explicitly suggest the manner in which the drag should be optimized.
Traditionally, the design of new aerodynamic systems has been achieved through the use
of experimental testing. However, economic considerations have generally seen a decline in the use of experimental methods, especially with the maturation of Computational Fluid Dynamics (CFD). CFD allow greater flexibility in configuration optimization at greatly reduced cost and as such is an excellent tool. For exact determination of a configuration’s properties it is imperative to complete any CFD analysis with experimental verification.
Computational tools are also evaluated in this study. A Navier Stokes solver is employed to: • verify its viability as a design/optimization tool, and • initiate optimization of a capsule design.
CAPSULE AERODYNAMICS
The drag on a capsule is caused by both viscous shear loads and normal pressure loads. These may be itemized as: • skin friction, • pressure drag, • shock-losses, and • rolling resistance.
In this initial analysis, the capsule is assumed to have a rectangular cross section, as
shown in Figure 10. The capsule is also assumed to be symmetrically located in the tunnel (also of rectangular dimensions). The front profile of the train is that of a 2:1 ellipse when viewed from the side.

Texas Transportation Institute 68 Rail Research Center/AAR Affiliated Lab
Skin Friction
Figure 10. Assumed Tunnel Cross Section. Viscosity causes a deceleration of the airflow close to the capsule wall. The resultant
shear stresses acting over the capsule surface cause skin friction drag. The following analysis does not account for the tunnel wall boundary layer development that is induced by flow through the annulus around the train. This component (relative to the tunnel) is typically small especially for practical annulus dimensions. The vertical coordinate of the nose section is given by:
4
22 x
Hy −= (1)
The arc length of the leading edge surface is given by:
∫
+=
x
dxdx
dyl
0
2
1 (2)
For a capsule traveling at 60 mph (V1), the Reynolds number is 1.8x10⁶/meter. It may
thus be assumed that the boundary layer flow is turbulent. The boundary layer thickness (δ) may be approximated as:
7/1Re
16.0 l=δ (3)
with the Reynolds number given by:
x 2H
H
l
y
Front ViewTunnel
Capsule
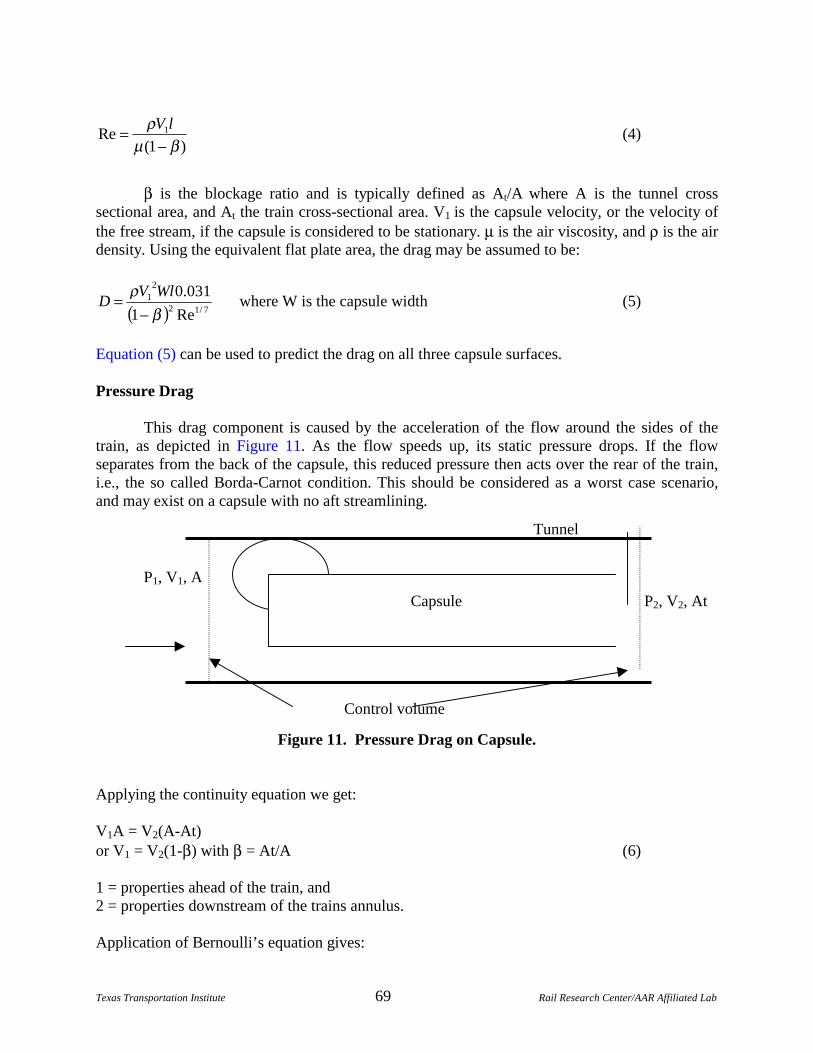
Texas Transportation Institute 69 Rail Research Center/AAR Affiliated Lab
)1(Re 1
βµρ
−=
lV (4)
β is the blockage ratio and is typically defined as At/A where A is the tunnel cross sectional area, and At the train cross-sectional area. V1 is the capsule velocity, or the velocity of the free stream, if the capsule is considered to be stationary. µ is the air viscosity, and ρ is the air density. Using the equivalent flat plate area, the drag may be assumed to be:
( ) 7/12
21
Re1
031.0
βρ
−= WlV
D where W is the capsule width (5)
Equation (5) can be used to predict the drag on all three capsule surfaces. Pressure Drag
This drag component is caused by the acceleration of the flow around the sides of the train, as depicted in Figure 11. As the flow speeds up, its static pressure drops. If the flow separates from the back of the capsule, this reduced pressure then acts over the rear of the train, i.e., the so called Borda-Carnot condition. This should be considered as a worst case scenario, and may exist on a capsule with no aft streamlining.
Figure 11. Pressure Drag on Capsule. Applying the continuity equation we get: V1A = V2(A-At) or V1 = V2(1-β) with β = At/A (6) 1 = properties ahead of the train, and 2 = properties downstream of the trains annulus. Application of Bernoulli’s equation gives:
P1, V1, A
P2, V2, At Capsule
Tunnel
Control volume

Texas Transportation Institute 70 Rail Research Center/AAR Affiliated Lab
2
222
11 2
1
2
1VPVP ρρ +=+
yielding
( )[ ]1)12
1 22212 −−=− βρVPP (7)
Application of the x-momentum equation gives:
21
2212 )( AVVAtAAPAPD ρρ −−+−=
Substitution of Bernoulli’s equation and manipulating gives:
2
221
)1( ββρ
−= AV
D where V1 is the capsule velocity. (8)
As mentioned previously, this expression represents the maximum pressure drag. If the
rear of the capsule is streamlined, then D in Eq. 8 reduces. A pressure recovery factor may be defined as:
Krec = 1 for total separation
and Krec = 0 for no separation or generally,
2
221
)1(
ˆ
ββρ
−
=∫ ∫
V
sdnp
Krec s
�
(9)
An additional component of pressure drag, shown in Figure 12, occurs due to the
development of the boundary layer along the capsule, i.e., pressure drag due to boundary layer induced jetting. The reduced velocity of the fluid in the boundary layer causes an increase in the airspeed outside the boundary layer so as to satisfy the continuity equation. Once again, the boundary layer development on the tunnel wall is neglected, as the velocities relative to the wall are small.
Figure 12. Pressure Drag Due to Boundary Layer.
y = L
2
y 3
δ

Texas Transportation Institute 71 Rail Research Center/AAR Affiliated Lab
Applying the continuity equation between points 2 and 3 gives (per unit depth), where L is the annulus height
∫∫ ∫ +=LL
ydVydyVydVδ
δ
3
0 0
32 )(
with V2=V1/(1-β) and V3=V3(��δ)1/7 assuming a turbulent boundary layer. Solving for V3 gives
∫
−
+−−
=−
−−−
=δ
δδ
δβδδβ 0
1313 )(8
71/
))(1()(
)(
)()1( LL
LVyd
L
yV
L
LVV (10)
Applying Bernoulli’s equation between points 1 and 3 yields
233
2121 2
1
)1(2
1VPVP ρρ
β+=
−+
gives
−+−−
−−
=∆
2
2
21
))(8
71(
1
))(1()1(
1
2
1
δδδββ
ρ
LL
LVP (11)
The additional drag due to this pressure reduction is then: D�3 = ∆P.At (12) Shock-Loss
This loss is incurred due to the abrupt expansions and contractions encountered between capsules. This type of loss may be expressed in the form:
−= ∑
−
=−
1
12
21
)1(2
N
iLiLS KAt
VD
βρ
(13)
where KLi gives the loss of pressure, and N is the number of capsules. This component can be significantly reduced by eliminating the gaps between capsules or by having smoothly blended capsules. Rolling Resistance
The rolling resistance is dependent on the friction encountered in the wheel bearings, resistance between the rails and the flanges, and rolling resistance between the steel wheels and the rails due to deformation. This drag may be estimated using the following empirical expression:

Texas Transportation Institute 72 Rail Research Center/AAR Affiliated Lab
13
4.424
_039.0
4.424
_1082.3 V
masscapsulemasscapsulexDroll += (14)
where the capsule mass is measured in metric tons. Droll is in Newtons. The rolling resistance is composed of two components, one static and the other dynamic. Notes
If the boundary layer that forms on the capsule impinges and/or merges with that of the wall, an additional drag results due to a loss of stagnation pressure (viscous dissipation converts mechanical pressure to non-recoverable internal energy and also causes heat transfer). This loss manifests as a reduction in static pressure at the rear of the capsule. Flow in the annulus between the train and the wall also leads to the development of a boundary layer from the tunnel wall out. The shear associated with this boundary layer, however, is small as the annulus velocities relative to the stationary wall are generally low, unless the annulus is of very small extent. Flow separation is also responsible for a loss of pressure at the nose of the train, thus increasing drag. However, if the train is streamlined, this effect is generally negligible.
Figure 13 shows the effect of blockage, β, on the theoretical maximum pressure drag and the skin friction drag. As seen for high blockage, i.e., a small annulus, the pressure drag is significant. For larger annuli, skin friction drag predominates. As clearly seen in the figure, from a drag perspective, a large annulus is preferable. Figure 14 shows the effect of the length of the capsule on the relative magnitude of the drag components for β = 0.5.
Figure 13. Effect of Blockage Ratio on Theoretical Drag Components.
0.00.20.40.60.81.0β
0
1000
2000
3000
Dra
g, N
3UHVVXUH GUDJ� %RUGD�&DUQRW
ERXQGDU\ FRQGLWLRQ
6NLQ IULFWLRQ GUDJ
6LPXODWHG VTXDUH ERG\� ��� HOOLSWLFDO QRVH
/HQJWK ��P� :LGWK ���P� +HLJKW ���P
7UDLQ VSHHG ��P�V ���PSK�� 6LQJOH FDUULDJH
$VVXPHG IXOO\ WXUEXOHQW ERXQGDU\ OD\HU�
3UHVVXUH GUDJ � ERXQGDU\
OD\HU GXH WR �MHW�

Texas Transportation Institute 73 Rail Research Center/AAR Affiliated Lab
Figure 14. Effect of Train Length on Drag Components.
DISCUSSION OF PRELIMINARY RESULTS
From an aerodynamic perspective, shock losses can be easily reduced by blending the
capsules together so that they present a smooth exterior (as is commonly done on high-speed trains). Rolling resistance is not an aerodynamic consideration, but is dependent on the mechanics of the capsule. Thus, from an aerodynamic perspective, the components of significance are skin friction and pressure drag. Basic Considerations in Drag Minimization
Equation 5 shows that skin friction drag is most sensitive to the train speed (∝ train speed2). However, the speed of the capsules is also dictated by other factors, and the suggested transit speed of 60 mph is not high. Thus, speed does not present itself as an independent design variable. The drag is also linearly proportional to the width and length of the capsules. Obviously, reducing the size of the capsules would reduce this drag component, but the capsule size is dictated by the payload. Reducing the length, or having extremely short “trains” is not viable as for a given length of train, a continuous vehicle will have lower frictional drag than a train constituted of separate capsules. As the air flows over the capsules, it is retarded by viscous effects, and as a result, the viscous shear on each subsequent section is reduced. The skin
0.0 10.0 20.0 30.0 40.0 50.0Train length, m
0
400
800
1200
1600
2000
Dra
g, N
3UHVVXUH GUDJ� %RUGD�&DUQRWERXQGDU\ FRQGLWLRQ
6NLQ IULFWLRQ GUDJ
6LPXODWHG VTXDUH ERG\� ��� HOOLSWLFDO QRVH
%HWD ���� :LGWK ���P� +HLJKW ���P
7UDLQ VSHHG ��P�V ���PSK�� 6LQJOH FDUULDJH
$VVXPHG IXOO\ WXUEXOHQW ERXQGDU\ OD\HU�
3UHVVXUH GUDJ � ERXQGDU\OD\HU GXH WR �MHW�

Texas Transportation Institute 74 Rail Research Center/AAR Affiliated Lab
friction drag is also seen to be proportional to 1/(1-β)2. As shown in Figure 13, the skin friction drag reduces rapidly as the size of the tunnel relative to the train increases. The dependence of skin friction on β follows from the effect of the tunnel constraint on the air that flows through the annulus around the train. Decreasing this annulus increases the velocity and so increases the shear forces that the train experiences. Figure 13 suggests that a β less than about 0.3 is desirable.
Pressure drag is highly dependent on the blockage ratio β as suggested by Eq. (8) and may also be surmised from Figure 13. This expression for the pressure drag must be interpreted carefully, however. It assumes that the air separates (i.e., no longer conforms to the surface) at the back of the train, the so-called “Borda-Carnot” boundary condition. In this case the static pressures towards the back of the train are low and cause an additional drag, i.e., “pressure drag.” This drag can be reduced in two ways:
1. by having a large β, and 2. by controlling flow separation from the back of the train (independent of β).
Figure 13 shows that as β reduces below about 0.3 the pressure drag becomes comparatively small. If the flow was controlled such that it did not separate from the back of the train then this drag component would be zero, as the annulus flow’s dynamic pressure would be reconverted into static pressure, i.e., so-called pressure recovery. Thus the static pressures acting on the front and the back of the train would be equal and no drag would result. An additional component of drag also exists in a confined tunnel due to the growth of the boundary layer from the train (and potentially the walls – depending on the nature of the annulus flow). As seen in Figure 13, this component may also be reduced by maintaining β below 0.3. Notice that pressure drag (Borda-Carnot criterion) is independent of the length of the train (see Figure 14). Please also note that pressure drag does exist for a train in the open if the flow separates from the back of the vehicle, it is just not as large in magnitude as that in a confined system.
The proceeding analysis shows that: 1. To minimize both skin friction and pressure drag, a fairly large tunnel is desirable with β
< 0.3. 2. The capsules should be smoothly blended together to form trains, so by reducing shock-
losses.
Another important benefit of large β is a reduction of the so-called “piston” effect. When a train moves through a tunnel with a small surrounding annulus, depending upon the train’s profile, a certain amount of air is pushed ahead of the train, while a certain amount moves past the train in the opposite direction. The train profile and β dictate the relative quantities. This effect causes additional drag. If, however, β is low, the air is no longer pushed ahead of the train but is displaced laterally (for a dual track configuration) with concomitant drag benefits.
The proceeding discussion does not give any insight into specific details of the train profile; the simple analytic expressions employed are not amenable to yielding this information. It does however lay the guidelines of what is required for an efficient system. The following
Texas Transportation Institute 75 Rail Research Center/AAR Affiliated Lab
sections of this report will describe the use of CFD methodology to start yielding information as to optimal designs. Additional Parameters Affecting Drag
In addition to the size of the tunnel, the drag of the capsules will also depend upon:
1. The shape of the tunnel: probably dictated by structural considerations and thus not a variable. This would benefit from CFD analysis.
2. Train eccentricity: the lateral location of the train relative to the walls will influence the drag. As the tunnel will probably be a dual-track system, choices of eccentricity will be constrained by structural requirements such that the tunnel dimensions are minimized. This would also benefit from CFD analysis.
3. Train shaping: the cross-sectional and for/aft shape of the train will influence drag. CFD analysis will be used to reduce this drag.
Potential Drag Reducing Alternatives
A potential drag reduction mechanism may be partial evacuation of the tunnel. The effect on drag would be to reduce the air density. Consequently, drag reductions would be proportional to the reduction in air density. The system could be evacuated in two ways:
1. by partially evacuating the whole tunnel, and 2. by evacuating sections of the tunnel enclosing the train(s).
Both of the systems have drawbacks. One would require the extraction of a tremendous quantity of air, and the other would require continual monitoring of the capsule trains in the tunnel (moving in both directions) so that sections of the tunnel could be sealed/isolated and evacuated. Neither approach is optimal nor likely to be efficient considering the size of the proposed tunnel. Partial evacuation would, however, be beneficial in helping to eliminate heat transfer from the moving components into the environment following from the reduction in air density.
APPLICATION OF COMPUTATIONAL TOOLS
A Navier Stokes solver, STARCD, was used for computations. As a first step in the
optimization, various capsule configurations were investigated. For a particular configuration drag would be minimized by suppressing flow separation. The following configurations were analyzed (see Figure 15): • a circular front and flat tail, • an elliptical front and flat tail, • a sharp front and flat tail, • a circular front and circular tail, and • an elliptical front and elliptical tail.

Texas Transportation Institute 76 Rail Research Center/AAR Affiliated Lab
Figure 15. Tested Configurations.
All the investigated cases were two-dimensional. The length of the cylindrical section in all cases was 20 feet. The blockage factor β was = 0.49. The radius of the circular section was 7 feet. For the elliptical sections a 2:1 ellipse was used. The length of the nose section for the various configurations was 7 feet. Each computation used 17,000 cells. The measured drag was both the pressure and skin friction component. Results show that the circular and elliptical profiles applied at the front and rear of the capsule show the lowest drag, clearly indicating the significance of suppressing flow separation. CONCLUSION
An analysis has been undertaken to yield insight into the aerodynamic considerations of
designing an enclosed capsule freight transport system. Such a system is proposed as a solution to the present trucking problem, with an application of a line running from Laredo to Dallas. Expressions have been derived that relate the drag of the train/capsules to various geometric parameters. Computational tools (a Navier-Stokes solver) have also been employed. This preliminary analysis has shown that in order to minimize drag, it is necessary to have a tunnel cross-section which is at least 3.3x larger than the train’s cross section. The capsules need to be smoothly blended to form a smooth continuous surface. The computational study has shown the importance of flow management near the back of the train to reduce pressure drag. For future study, it is recommended that the computational study be expanded to yield optimal 3D vehicles. The CFD analysis should also be extended to establish the nature of additional design variables that simple analytic methods are not capable of simulating, e.g., train eccentricity. For verification, the computational approach requires validation from experimental studies.

Texas Transportation Institute 77 Rail Research Center/AAR Affiliated Lab
CHAPTER 5 – 2001 WORK PLAN
The work plan for FY 2001 will continue the strategy of design according to systems engineering principles. This year’s efforts will focus on finalizing the baseline design specifications for sub-functions identified in FY 2000. The approach will enable the research team to develop a system design suited to both the task and the environment within which it will operate. This design will offer the most economical option within the design parameters established for the freight pipeline. In this manner, the research team will be able to evaluate freight pipeline options relative to truck operations and determine the potential for significant freight diversion from IH-35 in Texas. Task 1 – Finalize Systems Engineering Design Specification Sub-task 1.1 – Finalize Functional Analysis for Sub-systems
This sub-task will focus on the finalization of the functional analysis for sub-systems.
The functional analysis specifies what the system component must accomplish in concert with other system elements to achieve the mission of the freight pipeline system. Sub-task 1.2 – Establish Final Functional Requirements for Sub-systems
Sub-task 1.2 will elaborate on the functional analysis by defining the constraints and
assumptions associated with system operations. This will include system dimensions and operating characteristics. Sub-task 1.3 – Establish Final Performance Requirements for Sub-systems
Performance requirements will be finalized as an understanding is developed regarding
the parameters defining a superior freight transportation option in the selected corridor. The factors addressed in the first year’s report, such as speed, capacity, and security, will be revisited and evaluated for consistency and reasonableness. Sub-task 1.4 – Establish Conceptual Design Options for Sub-systems
Options for each sub-system will be developed. The options will meet the functional and
performance requirements established in preceding tasks and allow the design team to begin a selection process based on the overall efficacy of the component using trade-off analyses.
Task 2 – Perform Trade-Off Analyses
Trade-off analyses will be performed for each freight pipeline sub-system option: Tunnel
System, Main Transport Mechanism, Power Generation Sub-function, Terminal and Material Handling Sub-function, Command and Control Sub-function. The trade-off analysis will help determine the preferable option for each sub-function and set the stage for initial cost analyses.

Texas Transportation Institute 78 Rail Research Center/AAR Affiliated Lab
Task 3 – Begin Cost Analysis
The determination of system feasibility will ultimately be based on the costs of system design, construction, and operation. The trade-off analysis performed in Task 2 will initiate the process of cost determination, but additional data collection and projection will be performed in the task to augment these data. Costs will be assessed for capital expenditures and compared to the public costs incurred for highway capacity additions and maintenance. The marginal cost of operation will be targeted for a subsequent work plan, as these costs will be heavily dependent on final design parameters, which are not expected this year.
Task 4 – Policy Analysis
Sub-task 4.1 – Meet with Trucking Firms to Determine Level of Interest in Freight Pipeline System and Operational Needs
Interviews will be undertaken in Task 4 with representatives of major trucking firms
represented on the IH-35 corridor to determine the parameters within which they would likely be interested participants. The interviews will identify the trucking community’s concerns, needs, and constraints relative to enhancing their profitability through integration of freight pipeline operations with their current operational strategies. Data may be collected in personal interviews, by phone, or if more advantageous, by written survey.
Sub-task 4.2 – Begin Evaluation of Financing Options; Public, Private, or Public and Private
The process of financing a major capital project is complex at best. The potential
magnitude of investment required for this effort in conjunction with the innovative nature of the system may introduce additional considerations that must be fully understood as operational parameters are established. A review of comparable projects will be undertaken to gain an understanding of the broad requirements and approaches attempted in the past. The information gained will help establish the recommended approach to system implementation.
Sub-task 4.3 – Initiate Dialog with the Mexican Transportation Institute Regarding Bi-National Cooperation and Cross-Border Operations
Border transportation issues continue to receive attention due to the practical, physical,
and institutional impediments presented by international trade with Mexico. It may be that some of these obstacles could be minimized by physically and operationally extending the freight pipeline into a market center within Mexico. TTI’s research alliance with the Mexican Transportation Institute (IMT) will be used to begin an investigation into the issues associated with such a goal, the benefits to be gained, and the potential costs associated with such a strategy. Sub-task 4.4 – Begin Investigation of Use of Public Property for System Right of Way
The use of existing publicly owned right of way to construct a freight pipeline system
could greatly improve the feasibility of the project by reducing cost and contention with private

Texas Transportation Institute 79 Rail Research Center/AAR Affiliated Lab
concerns. This sub-task will initiate an investigation into the possibility of this approach and delineate the pros and cons identified. A preliminary examination of the IH-35 corridor will be performed to assess if access to the public property along this route is feasible. In addition, alternative Dallas to Laredo corridor(s) will be investigated.
Sub-task 4.5 – Develop an Assessment of Issues Associated with Right of Eminent Domain
The ability to condemn property for demonstrable public benefit is called the right of
eminent domain. This power allows the authorized entity to identify needed property and take possession at fair market value without the consent of the private property landowners. The courts arbitrate the settlement and enforce the decisions made for the public good. Many transportation projects rely on this power and, while it is a time-consuming and difficult process, it may be critical to the success of the freight pipeline concept. This task will initiate an investigation into the issues associated with eminent domain within the context of the current research. Sub-task 4.6 – Identify Other Regulatory and/or Environmental Issues to be Addressed • DEA • Customs
Task 5 – Document Year 2 Results
The results of the 2nd year’s work plan will be documented in an interim report. The
report will summarize the work accomplished, detail any adjustments to the schedule, and provide a work plan for the subsequent period of performance. The schedule and period of performance are depicted in Table 8.
Table 8. Schedule and Period of Performance for FY 2001.
FY 2001 TASKS
S O N D J F M A M J J A Task 1 Sub-task 1.1
Sub-task 1.2 Sub-task 1.3 Sub-task 1.4
Task 2 Task 3 Task 4 Sub-task 4.1
Sub-task 4.2 Sub-task 4.3 Sub-task 4.4 Sub-task 4.5 Sub-task 4.6
Task 5 ρ ρ Interim Report


Texas Transportation Institute 81 Rail Research Center/AAR Affiliated Lab
REFERENCES 1. Medhurst, George A., “A new system of inland conveyance for goods and passengers.”
London, 1827. 2. Vance, L. and Mills. “Tube Freight Transportation”. Public Roads On-Line (Autumn 1994). 3. Zandi, I., W. B. Allen, E. K. Morlok, K. Grimm, T. Plaut and J. Warner. “Transport of Solid
Commodities Via Freight Pipeline-Cost and Level of Service Comparison - Volume I.” U.S. Department of Transportation (July 1976).
4. Zhao, Y. J., T. S. Lundgren and J. Sampson. “Electrical Capsule Pipeline System for Freight.”
5. Vandersteel, William, “Pneumatic Pipeline Transport System.” United States Patent 4,458,602. 1984; and Personal Communication, April 2000.
6. Goff, Zane A., Shekhar Patil, and C. S. Shih, “Feasibility of Freight Pipelines to Relieve Highway Congestion,” (October 1998).
7. Stronach, C. and D. Noakes. “Evacuated-Tube Maglev: The Way To Go.” Speedlines (Fall 1996), pp 16-17.
8. Visser, Johan and A. Binsbergen. “Underground goods distribution in the city of Leiden: The result of a feasibility study.” International Symposium on Underground Transportation by Capsule Pipelines and Other Tube/Tunnel Systems (September 1999).
9. Allen, W. B. and T. Plaut. “Transport of Solid Commodities Via Freight Pipeline - Demand Analysis Methodology - Volume IV.” U.S. Department of Transportation (July 1976).
10. Koshi, Masaki. “An Automated Underground Tube Network for Urban Goods Transport.” Journal of International Association for Traffic and Safety Science, Volume 16, No.2, 1992.
11. Stein, D., R. Stein, W. Weller, and B. Schoesser. “Transportation of Goods Through Pipelines - A Comprehensive Study.” International Symposium on Underground Transportation by Capsule Pipelines and Other Tube/Tunnel Systems (September 1999).
12. Zandi, I. and K. K. Gimm. “Transport of Solid Commodities Via Freight Pipeline - Freight Pipeline Technology - Volume II.” U.S. Department of Transportation (July 1976).
13. Roop, S., Jerko, C. “Texas Corridor Selection for the Freight Pipeline Feasibility Study.” International Symposium on Underground Transportation by Capsule Pipelines and Other Tube/Tunnel Systems (September 1998).
14. Zandi, I. and K. K. Gimm. “Transport of Solid Commodities Via Freight Pipeline – Impact Assessment - Volume V.” U.S. Department of Transportation (July 1976).
15. Andel, Tom. “Controls are Everybody’s Business,” Materials Handling Engineering, May, 1999.
16. Witt, C. “Palletizing Unit Loads: Many Options,” Materials Handling Engineering, January, 1999.
17. Trunk, Christopher. “The Sky’s the Limit for Vertical Lifts,” Materials Handling Engineering, August, 1998.
18. HNTB Corporation, Wilbur Smith Associates, HDR Engineering, Hicks & Company, Sylva Engineering, WHM Transportation, McGray Research, CJ Petersen & Associates. “Recommended Corridor Investment Strategies.” (September 1999).
19. John A. Bickel (ed.), Thomas R. Kuesel, Elwyn H. King, Tunnel Engineering Handbook, 1996, p.1-3, 46-51, 99.
20. J.T. Edwards (ed.), Civil Engineering for Underground Rail Transport, 1990, p. 27-28 21. Li W. Kam and A Paul Priddy, Power Plant System Design, John Wiley & Sons, 1985.


Texas Transportation Institute 83 Rail Research Center/AAR Affiliated Lab
APPENDIX


Texas Transportation Institute 85 Rail Research Center/AAR Affiliated Lab
CALCULATION FOR THE POWER REQUIRED TO TRANSPORT A PALLET
It is assumed that the pallets are loaded on the capsules. The power required to transport the capsule is determined by knowing the weight of the capsule. The weight of each capsule is determined by the number of pallets carried, which can vary from one to six.
The main criteria in determining the power required are the drag force (Fd) and rolling friction (f).
Weight of the capsule = 2000 to 4000 lb (assume 2000 lb in this case for one pallet). The
capsule should attain a velocity of 50 mph in 60 seconds.
The drag force Fd = 0.1 � (velocity)2 , where the drag coefficient = 0.1.
The rolling resistance f = µ R � weight, µ R = 0.02 to 0.04 for pneumatic tires on smooth road, µ R = 0.001 to 0.005 for hardened steel on steel. Assume µ R = 0.05 (with an extra factor) Therefore, V = 50 mph = 22.35 m/s. t = 60 s N = M � g = 2000 lb = 2000 � 4.45 = 8.9 kN M = 907 kg Figure 16 shows the relationship of the forces impacting the power requirements.
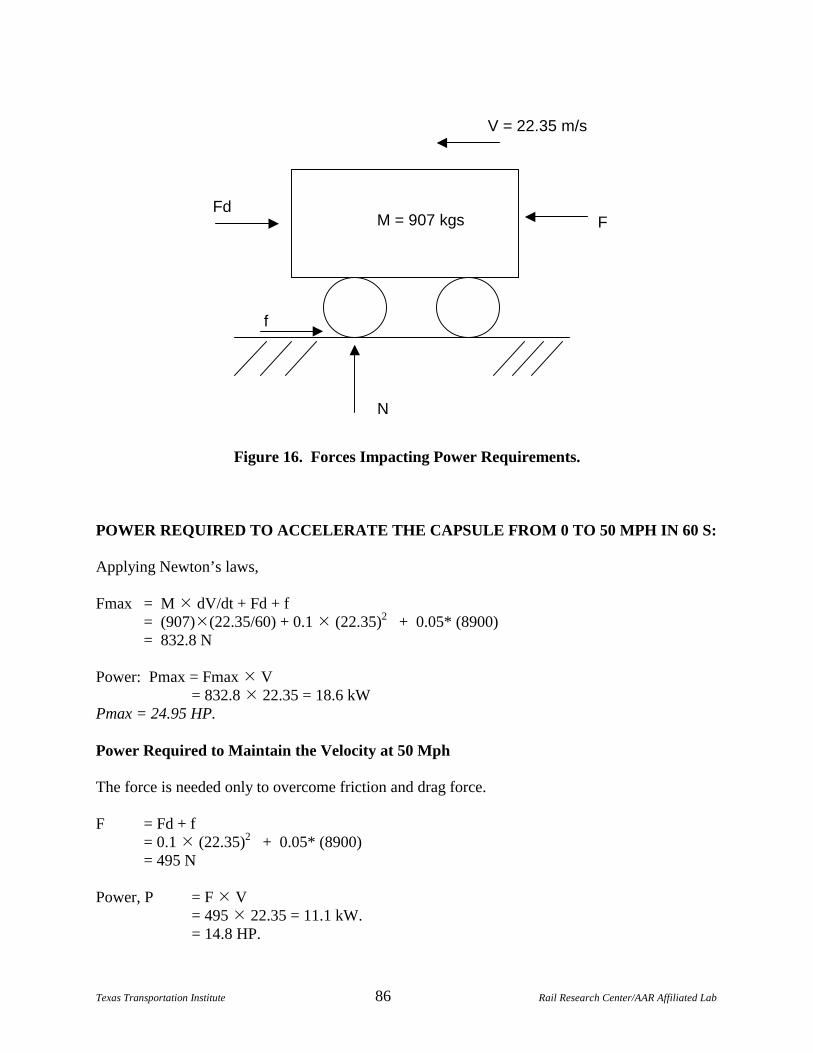
Texas Transportation Institute 86 Rail Research Center/AAR Affiliated Lab
Figure 16. Forces Impacting Power Requirements.
POWER REQUIRED TO ACCELERATE THE CAPSULE FROM 0 TO 50 MPH IN 60 S: Applying Newton’s laws, Fmax = M � dV/dt + Fd + f = (907)�(22.35/60) + 0.1 � (22.35)2 + 0.05* (8900) = 832.8 N Power: Pmax = Fmax � V = 832.8 � 22.35 = 18.6 kW Pmax = 24.95 HP. Power Required to Maintain the Velocity at 50 Mph The force is needed only to overcome friction and drag force. F = Fd + f = 0.1 � (22.35)2 + 0.05* (8900) = 495 N Power, P = F � V = 495 � 22.35 = 11.1 kW. = 14.8 HP.
Fd
N
F
f
V = 22.35 m/s
M = 907 kgs

Texas Transportation Institute 87 Rail Research Center/AAR Affiliated Lab
Hence, to calculate the power required for the pallet movement, only the Pmax needs to be considered. Additional calculations are given in Table 9. The values for drag coefficient and the rolling resistance can be suitably changed. In this example, the worst case is considered. To Calculate the Power for Six Pallets
We multiply the power for one pallet by 6 to calculate the power required for the capsule to transport six pallets.
Table 9. Summary of Power Requirement Calculations.
1. Power Calculations per Pallet
Weight of the pallet 2000 3000 4000 lbsN = x 4.45 kN 8900 13350 17800 N
Mass of the pallet 907.2 1360.9 1814.5 kgs
Velocity 50 mphV x 0.447 m/s 22.35 m/s
t Time 60 secs
Fd Drag Force = 0.1 * (velocity)^2 50.0 N
Rolling friction = .05 * (weight of the pallet)f 445 667.5 890 N
1 The Max. driving force F needed to accelerate the pallet from 0- 50mphF = M* dV/dt + Fd + f
dV /dt = 0.3725 m/s^2
Fmax. F = 832.9 1224.4 1615.8 N
Power required: F x velocityP = 18.6 27.4 36.1 kW
Pmax 25.0 36.7 48.4 HP
2 The force required to keep the pallet moving at a constant velocityF = Fd + f
F2 F = 495.0 717.5 940.0 N
Power required:P = 11.1 16.0 21.0 kW
P2 14.8 21.5 28.2 HP
Since Pmax > P2, the required power considered is only Pmax.