vtrans2035 freight finalvtrans.org/resources/freight_final.pdf · fci freight congestion index gsp...
TRANSCRIPT
Virginia’s Long-Range Multimodal Transportation Plan
2007-2035
Freight
Prepared for:
Office of Intermodal Planning and Investment
Prepared by:
Cambridge Systematics, Inc.

i
ABBREVIATIONS AND ACRONYMS
AADDT Average Annual Daily Truck Traffic CS Cambridge Systematics, Inc. FCI Freight Congestion Index GSP Gross State Product PCE Passenger Car Equivalent PPTA Public-Private Partnership Agreement TEU Twenty-Foot Equivalent Unit, or one 20-Foot Long Container VMT Vehicle Miles of Travel VPA Virginia Port Authority VSM Virginia State Model

ii
TABLE OF CONTENTS
ABBREVIATIONS AND ACRONYMS .................................................................................... i
ABOUT THIS PAPER ..................................................................................................................1
Purpose and Organization ........................................................................................................1 Key Issues and Opportunities ...................................................................................................1 Other Resources ........................................................................................................................2
FREIGHT MOVEMENT AND THE VIRGINIA ECONOMY ...............................................2
Economic Contribution .............................................................................................................2 Recent Demand .........................................................................................................................3 Projected Demand .....................................................................................................................5
VIRGINIA’S MULTIMODAL FREIGHT TRANSPORTATION SYSTEM ........................7
Highways ..................................................................................................................................7 Railroads .................................................................................................................................13 Ports ........................................................................................................................................17 Airports ...................................................................................................................................20
VIRGINIA FREIGHT NEEDS, IMPROVEMENTS, AND STRATEGIES .........................21
Bottlenecks ..............................................................................................................................21 Planned Improvements ............................................................................................................22 Suggested Virginia Multimodal Freight Program ...................................................................25
ATTACHMENT A: PROGRAMMED NEAR-TERM PROJECTS ....................................28
ATTACHMENT B: POTENTIAL LONGER-TERM PROJECTS .....................................37
ATTACHMENT C: POTENTIAL FREIGHT STRATEGIES .............................................48
ATTACHMENT D: FREIGHT PROGRAM EVALUATION .............................................51

1
ABOUT THIS PAPER
Purpose and Organization
As input to the VTrans2035 process, this Issue Paper addresses, in concise form, three main topic areas: freight movement and the Virginia economy; Virginia’s multimodal freight transportation system; and Virginia freight needs, improvements, and strategies.
Key Issues and Opportunities
Virginia was founded as a trading colony, and freight movement remains a critical part of the Commonwealth’s economy. The movement of freight – raw materials, intermediate products, and finished goods – currently supports over 350 billion dollars of Virginia’s Gross State Product annually. The movement of freight through Virginia is also critical to the economy of other states, and to the nation as a whole. Almost 80% of Virginia’s freight tonnage has an origin or a destination in another state – including 40% which is simply passing through Virginia on its way to and from other states.
To accommodate the movement of freight, Virginia hosts one of the nation’s leading seaports, two national freight railroads and numerous local and regional railroads, four major cargo airports, and some of the nation’s most heavily used truck corridors. Over the next two decades, the forecast is for significant growth in the demand for freight movement into, out of, within, and through Virginia. Some of the Commonwealth’s freight infrastructure is well-positioned to accommodate this growth. But much of its infrastructure will be challenged – from normal wear and tear, from growth in the amount, type, and location of freight movement, from increased passenger traffic over shared highways and rail corridors, and from environmental pressures associated with higher freight volumes and/or denser settlement patterns in and around major freight facilities and corridors.
Over the past decade, Virginia has emerged as a national leader in addressing freight
issues. There are many studies, plans and programs underway to improve Virginia’s interstate and state highways, its ports and marine terminals, its freight rail corridors and terminals, and its airports. Freight is regularly addressed by the Commonwealth, not only through its modal transportation agencies but also through multimodal planning activities and the efforts of Virginia’s Metropolitan Planning Organizations. Virginia has also been a national leader in establishing partnerships with the public sector, and with other states through multi-state corridor coalitions.
The opportunity before the Commonwealth is to make freight investments that generate significant public benefits and offer a positive return on public investment for the Commonwealth’s economy, transportation system, and environment. More efficient freight movement means lower transportation costs for industries and businesses that depend on freight transportation, helping them (and Virginia’s economy) grow and prosper, and making Virginia a more attractive place to do business. In turn, lower costs of transporting goods to market also benefits Virginia’s consumers, in the form of lower prices. Freight mobility improvements also benefit passengers, and vice versa, because much of Virginia’s transportation system is shared between them.

2
Additional Resources
Readers seeking additional detail may be interested in reviewing the Virginia Multimodal
Freight Study Phases I and II; the Feasibility Plan for Truck to Rail Diversion in Virginia’s I-81
Corridor; the Virginia Port Authority 2040 Master Plan; and the Virginia State Rail Plan 2008
Update.
FREIGHT MOVEMENT AND THE VIRGINIA ECONOMY
Economic Contribution
As of 2006, Virginia was home to 7.6 million residents, making it the 12th most populous State in the country. Virginia’s economy employed 3.7 million people in 2006, accounting for 2.8 percent of all US jobs. In 2005, the total output of Virginia’s economy was approximately $658 billion. (Output is a measure of the total value of goods and services). For the same period, Virginia’s gross state product (or GSP) was $352 billion. (GSP is a measure of the total value added to goods and services because of Virginia activity.) Virginia accounts for almost three percent of the entire US economy. If Virginia was a country, its economy would be equivalent in size to Sweden or Turkey, ranking as the 21st largest in the world.
Around 50% of Virginia’s output, 28% of its gross state product, and 34% of its employment, is associated with industries that depend heavily on the movement of raw materials, intermediate goods, and/or finished products. These can be thought of as “freight dependent” industries. Producing industries like agriculture depend on freight movement to move farm products from fields to processing plants to wholesalers to retail outlets, in Virginia and throughout the US and the world. Other producing industries, like transportation equipment manufacturers, also depend on freight movement to bring them the intermediate products – rolled or fabricated steel, tires, engine parts, etc. – they need to assemble their finished products. Wholesale and warehouse/distribution industries serve as the bridge between producers and consumers. Finally, consumers of all kinds – from shoppers at grocery stores to power plants – rely on freight movement to deliver the goods and materials to the final point of sale or point of use. Freight-dependent industries generally fall into three main groupings, or clusters:
• The goods movement cluster includes industries and businesses that provide freight transportation services – such as truckers, railroads, marine shipping and air cargo shipping companies, wholesalers, warehouse/distribution facility operators, logistics professionals, legal and insurance service providers, etc. – engaged in domestic and international transportation. Benefiting from its location on the center of the East Coast, Virginia is a key US gateway for international trade, exporting and importing goods destined for or originating from markets throughout the United States and the world. Exports from Virginia to other countries (based on the “origin of movement” export data series) have been on a steady growth trend, topping $12 billion worth of goods in 2005 and surging to above $14 billion in 2006. Overall, the goods movement cluster represents around 7% of Virginia’s GSP.

3
• The freight intensive industries cluster includes industries where the transportation of raw materials, intermediate products, and finished goods accounts for a major share of their cost of doing business – such as agriculture, tobacco, food products, construction, wood and paper, machinery, transportation equipment, energy, chemical products and mineral extraction. The freight intensive industries cluster represents around 15% of Virginia’s GSP.
• The retail cluster includes consumer outlets – supermarkets, merchandise retailers, auto dealers, etc. – that require freight transportation services to stock their inventory. The retail cluster represents around 6% of Virginia’s GSP.
Table 1. Virginia’s Freight-Dependent Industries Cluster Examples Share of GSP
Goods Movement Truckers, railroads, marine shipping and air cargo shipping companies, wholesalers, distribution facility operators logistics professionals, legal and insurance service providers, etc.
7%
Freight Intensive Industries Agriculture, tobacco, food products, construction, wood and paper, machinery, transportation equipment, energy, chemical products, mineral extraction, etc.
15%
Retail Supermarkets, merchandise retailers, auto dealers, etc. 6%
Recent Demand
Understanding the volume and the value of freight demand is critical to addressing freight movement challenges and identifying opportunities. There are many different freight data sources and measures; each provides valuable information and comes with its own unique set of limitations.
One of the most comprehensive data sources available is a commercial data product known as TRANSEARCH, which incorporates a mix of public sector data (for rail, air, and water movements) and proprietary data (from trucking companies and logistics services). TRANSEARCH provides estimates of freight tonnage and units moving between different geographic areas (counties, business economic areas, and states), by different transportation modes (truck, rail, water, and air), distinguished by commodity type. Virginia owns several years of TRANSEARCH data, the most recent being year 2004. The year 2004 data suggests the following:
• Virginia’s multimodal transportation system handled around 915 million tons of freight worth more than $2.1 trillion dollars. This includes freight associated with trucking, rail, air, domestic water, and international water; also it includes freight moving inbound to, outbound from, within, and through the Commonwealth.
• Around 41% of tonnage was passing through Virginia, some by rail but mostly by truck. Virginia’s geography places it at the center of the Mid-Atlantic corridor, and positions it at a major “crossroads” for goods moving between the west/southeast/south and the northeastern US.
4
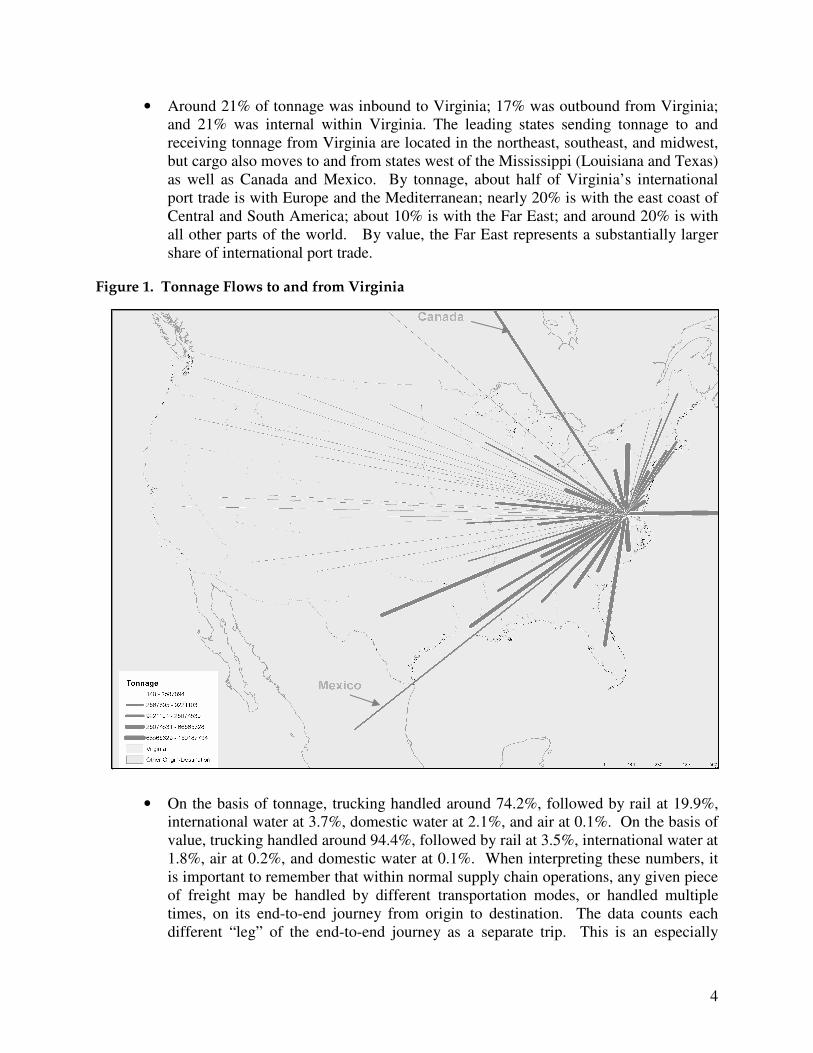
• Around 21% of tonnage was inbound to Virginia; 17% was outbound from Virginia; and 21% was internal within Virginia. The leading states sending tonnage to and receiving tonnage from Virginia are located in the northeast, southeast, and midwest, but cargo also moves to and from states west of the Mississippi (Louisiana and Texas) as well as Canada and Mexico. By tonnage, about half of Virginia’s international port trade is with Europe and the Mediterranean; nearly 20% is with the east coast of Central and South America; about 10% is with the Far East; and around 20% is with all other parts of the world. By value, the Far East represents a substantially larger share of international port trade.
Figure 1. Tonnage Flows to and from Virginia
•
• On the basis of tonnage, trucking handled around 74.2%, followed by rail at 19.9%, international water at 3.7%, domestic water at 2.1%, and air at 0.1%. On the basis of value, trucking handled around 94.4%, followed by rail at 3.5%, international water at 1.8%, air at 0.2%, and domestic water at 0.1%. When interpreting these numbers, it is important to remember that within normal supply chain operations, any given piece of freight may be handled by different transportation modes, or handled multiple times, on its end-to-end journey from origin to destination. The data counts each different “leg” of the end-to-end journey as a separate trip. This is an especially
5
important consideration for air and water, because most waterborne freight and virtually all air freight generates corresponding truck moves. Also, tonnage and value measures do not reflect the fact that air, water, and rail tend to specialize in longer-distance freight movement, while trucks accommodate both long-distance and short-haul movements.
Table 2. Virginia Freight Movement, Year 2004 Mode Share of Tonnage Share of Value
Truck 74.2% 94.4%
Rail 19.9% 3.5%
International Water 3.7% 1.8%
Domestic Water 2.1% 0.1%
Air 0.1% 0.2%
Projected Demand
Economic forecasts prepared by Global Insight Inc. in 2007 for the Virginia Multimodal
Freight Study Phase I suggested that through the year 2035, freight industry output would increase 100%, freight industry GSP would increase 70%, and freight-related employment would increase 20%. It turns out that 2007 was a peak year for freight movement, and since that time, the recession has led to declining freight movement volumes. Nationally, port volumes are down between 15% and 30% from their peaks, rail traffic is down by about the same amount, and even truck counts on interstate highways are down by about the same amount. Most analysts see 2009 as the bottom of the “freight recession,” and expect that by 2012, volumes will recover to previous levels. Therefore, it is appropriate to extend prior forecasts by approximately five years, allowing for this recovery period.
Even with the recession, the incredibly rapid industrialization of China, and much attention to the supposed demise of US manufacturing, it is important to remember that the US remains the world’s leading manufacturing economy on a dollar value basis. The US, and Virginia, will continue to move raw materials, intermediate products, and finished goods.
To support Virginia’s expanding economy and population, Virginia’s freight movement capacity will need to keep pace with growing demand. Virginia’s transportation network and services must accommodate the mobility, logistics, and consumer needs of an increasing number of residents, workers, visitors, retirees, and businesses, and do so reliably, safely, and efficiently. Growth in population and economic drivers will lead to a greater demand for goods and more congested highways and airports. State, national, and global economic growth will put additional pressures on Virginia’s railroads and ports to accommodate the increases in freight volumes that will accompany the mounting needs of businesses and consumer markets as well as increasing world trade.
The Virginia TRANSEARCH database provided growth projections for freight tonnage by mode, commodity, and direction, through the year 2035. These projections are still considered useful, provided that the timeframe for achieving the volumes is extended to the year 2040.
6
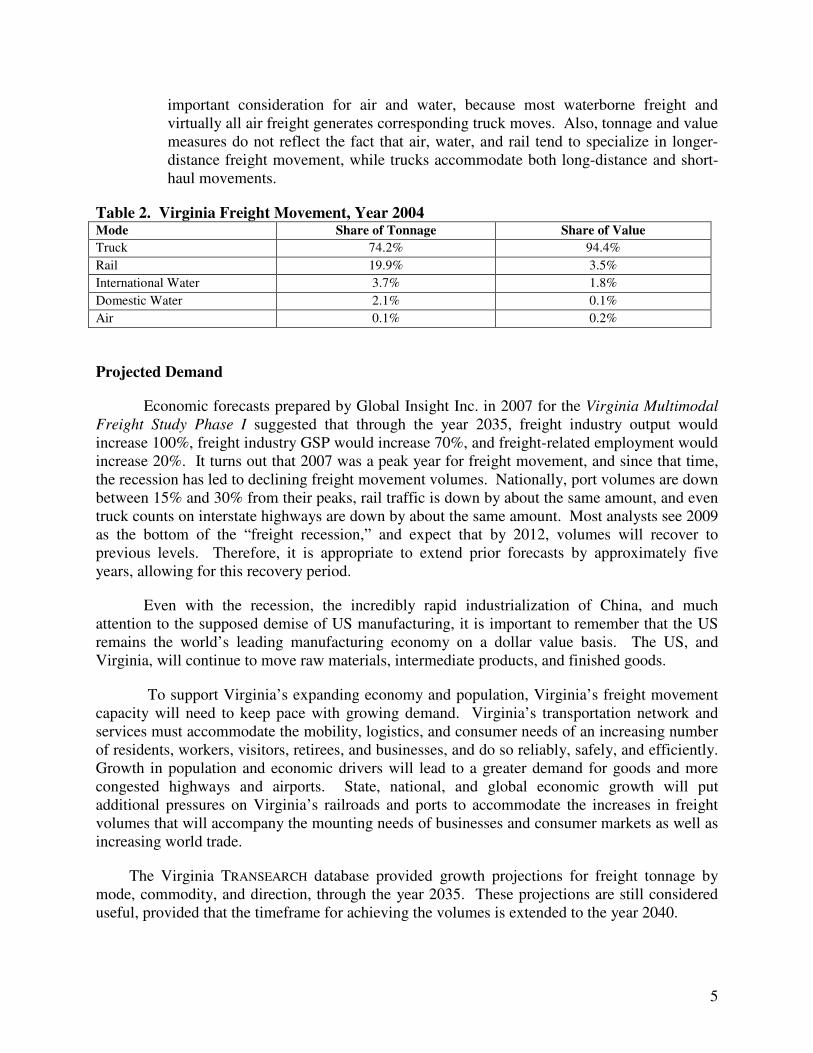
With this adjustment, total tonnage is projected to grow from 915 million tons to more than 1,950 million tons – an increase of 113%. The fastest growth is for international container and air cargo trades, each anticipated to increase more than 200%. Trucking, rail, domestic water, and non-containerized international water, which handle the great majority of total tonnage, are anticipated to increase at rates between 100% and 115%.
Figure 2. Projected Growth in Virginia Freight Tonnage (2004-2040)
115%
102% 102%
226%
100%
210%
113%
0%
50%
100%
150%
200%
250%
Truck Rail Domestic
Water
Int'l Container Int'l Non-
Container
Air Total
In 2004, the leading domestic commodities moved to, from, and within Virginia included: non-metallic minerals (industrial minerals other than metals or fuels); coal; “secondary traffic” (a mix of commodities that typically move in containers or in dry van trucks); clay/concrete/glass/stone; petroleum; food products; and lumber and wood. By 2040, secondary traffic is expected to become the Commonwealth’s leading commodity by tonnage, overtaking non-metallic minerals. In 2004, secondary traffic was the Commonwealth’s leading commodity by value, and it should retain this position through 2040. The next leading commodities on the basis of value include electrical equipment, and transportation equipment. These tonnages do not include municipal solid waste, which is not a commodity, but do include commodity scrap and recyclable materials.

7
Figure 3. Leading Domestic Commodities Moving to, from, and within Virginia, 2004 and 2040
Figure X7. Virginia’s Top Commodities by Weight, 2004 and 2035
VIRGINIA’S MULTIMODAL FREIGHT TRANSPORTATION SYSTEM
Highways
In 2004, Virginia’s highway system accommodated 680 million tons of freight – the
equivalent of 55 million loaded units, or a line of trucks going around the world nearly thirty times – moving more than 200 billion ton-miles. (A ton-mile is one ton of freight moving a distance of one mile.) Virginia’s state-maintained highway system is divided into the following categories:
• Interstate – More than 1,000 miles of four to ten-lane highways that connect states and major cities.
• Primary – More than 8,000 miles of two to eight lane roads that connect cities and towns with each other and with interstates.
• Secondary – More than 48,000 miles of local connector or county roads. (Arlington and Henrico counties maintain their own county roads.)
0 50 100 150 200 250
A ll O thers
Tra nsporta tion Equip m ent - 37
W a ste or Scrap Materia ls - 40
Chem icals or Allied Produ cts - 28
Lu m ber or Wood Produ cts - 24
Food or Kindred Produ cts - 20
Petroleum or C oa l Produ cts - 29
Clay, Concrete, Glass, Stone - 32
C oal - 11
Secondary Tra ffic - 50
Nonm etallic Minerals - 14
Tons (in Millions)
8
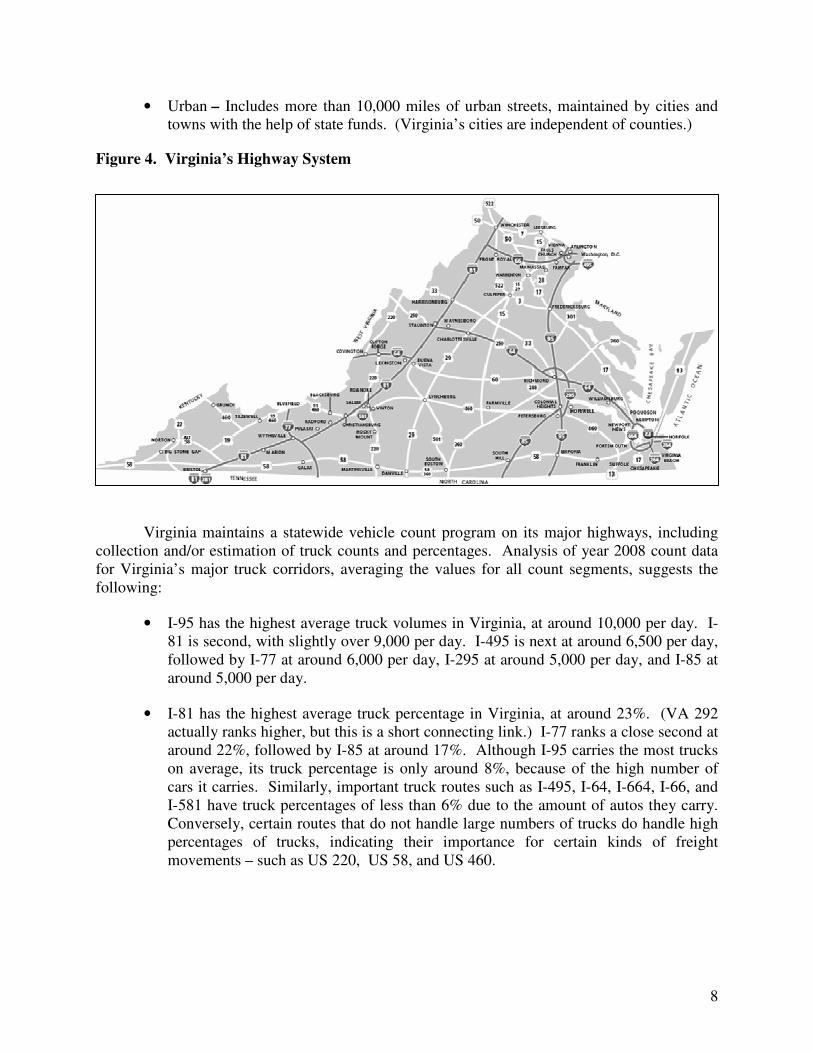
• Urban – Includes more than 10,000 miles of urban streets, maintained by cities and towns with the help of state funds. (Virginia’s cities are independent of counties.)
Figure 4. Virginia’s Highway System
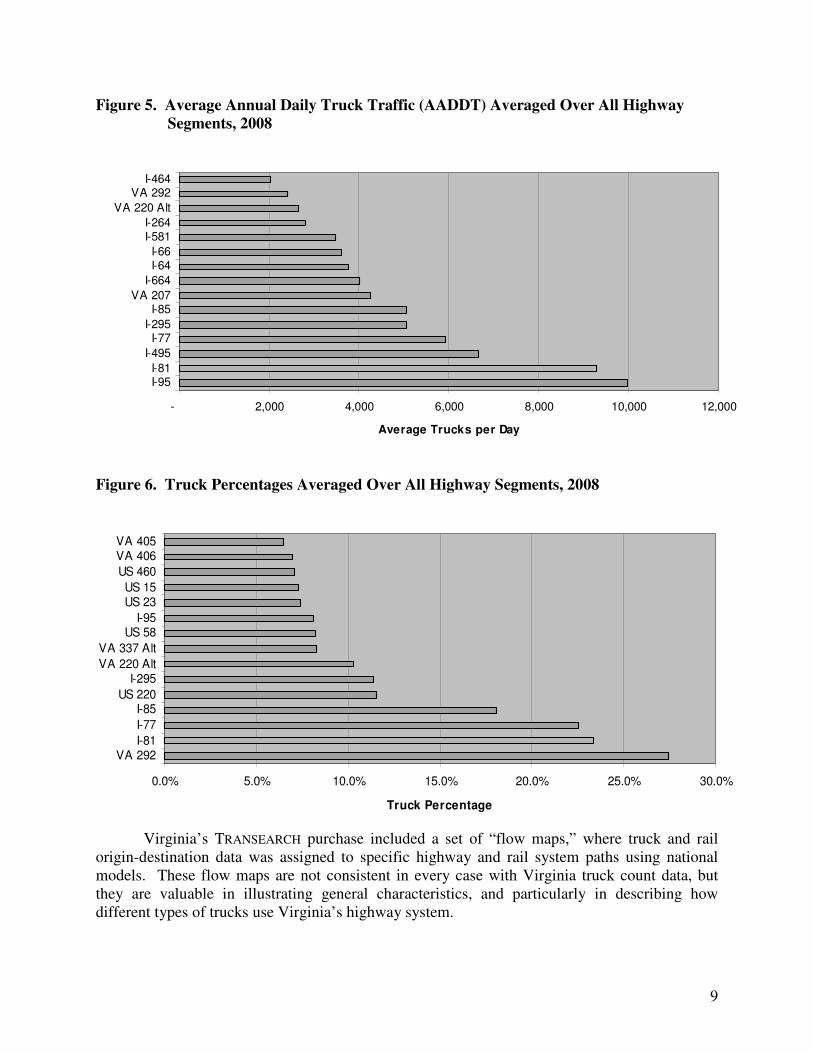
Virginia maintains a statewide vehicle count program on its major highways, including collection and/or estimation of truck counts and percentages. Analysis of year 2008 count data for Virginia’s major truck corridors, averaging the values for all count segments, suggests the following:
• I-95 has the highest average truck volumes in Virginia, at around 10,000 per day. I-81 is second, with slightly over 9,000 per day. I-495 is next at around 6,500 per day, followed by I-77 at around 6,000 per day, I-295 at around 5,000 per day, and I-85 at around 5,000 per day.
• I-81 has the highest average truck percentage in Virginia, at around 23%. (VA 292 actually ranks higher, but this is a short connecting link.) I-77 ranks a close second at around 22%, followed by I-85 at around 17%. Although I-95 carries the most trucks on average, its truck percentage is only around 8%, because of the high number of cars it carries. Similarly, important truck routes such as I-495, I-64, I-664, I-66, and I-581 have truck percentages of less than 6% due to the amount of autos they carry. Conversely, certain routes that do not handle large numbers of trucks do handle high percentages of trucks, indicating their importance for certain kinds of freight movements – such as US 220, US 58, and US 460.
9
Figure 5. Average Annual Daily Truck Traffic (AADDT) Averaged Over All Highway
Segments, 2008
- 2,000 4,000 6,000 8,000 10,000 12,000
I-95I-81
I-495
I-77I-295
I-85VA 207
I-664
I-64I-66
I-581I-264
VA 220 Alt
VA 292I-464
Average Trucks per Day
Figure 6. Truck Percentages Averaged Over All Highway Segments, 2008
0.0% 5.0% 10.0% 15.0% 20.0% 25.0% 30.0%
VA 292I-81
I-77
I-85US 220
I-295VA 220 Alt
VA 337 Alt
US 58I-95
US 23US 15
US 460
VA 406VA 405
Truck Percentage
Virginia’s TRANSEARCH purchase included a set of “flow maps,” where truck and rail origin-destination data was assigned to specific highway and rail system paths using national models. These flow maps are not consistent in every case with Virginia truck count data, but they are valuable in illustrating general characteristics, and particularly in describing how different types of trucks use Virginia’s highway system.

10
Figure 7. Virginia Inbound/Outbound/Internal Truck Tons (2004)
Figure 8. Virginia Through Truck Tons (2004)
11
Virginia-oriented truck trips – that is, trucks that are moving into, out of, and within Virginia, as opposed to passing through – represent around 57% of Virginia truck tonnage. According to TRANSEARCH, leading truck routes for this tonnage include: I-95, I-81, I-64, I-264, I-66, I-77, I-85, I-295, US 29, US 360, US 460, US 58, and US 13.
Through truck movements represent around 41% of Virginia truck tonnage. According to TRANSEARCH, the routing patterns for this tonnage tend to concentrate on a few key routes: I-81, I-95, and I-77, and to a lesser extent I-85 and US 29. Truck surveys performed by the Commonwealth at I-81 weigh stations determined that around 60% of trucks on I-81 were passing through the state. I-95 also handles a significant amount of through truck traffic – around 40% at its northern end, and around 60% at its southern end. I-85 also handles nearly 60% through trucks. I-77 handles the highest percentage of through trucks, around 85%.
Critical highway issues impacting freight mobility include:
• Roadway and bridge/tunnel condition. Maintaining Virginia’s truck network in a state of good repair and providing adequate dimensional capacities on its bridges and tunnels is essential.
• Safety and emergency response. Ensuring that truck routes are designed and maintained to provide for safe and secure operation, and that trucks operate in conformance with applicable regulations, is equally essential. One emerging safety issue is the growing use of roadway shoulders for overnight truck parking.
• System performance. Trucking operations depend on highway capacity being available when needed. To the extent it is not available, their operations suffer, in the form of slower travel times, less reliable schedules, and higher costs. Within Virginia’s urbanized regions – especially Northern Virginia, Hampton Roads, and Richmond – and on critical corridors, peak period highway system performance is declining. Most of the decline is due to automobile traffic, which makes up the great majority of peak period travel. Trucks contribute to the congestion, but also suffer from it. Virginia must find ways to preserve and improve the performance of its highways, through the appropriate combination of additional capacity and better utilization of existing capacity to accommodate both passenger and freight movement.
• Intermodal connectivity. Trucking is the only transportation mode that connects to every other mode. While some shippers and receivers have direct service by rail, water, or air, the majority depend on trucks to move their goods – picking up and delivering to rail terminals, seaports, or airports, moving to and from warehouse and distribution centers, or delivering door-to-door. Any deficiencies in Virginia’s highway system will have a direct ripple effect on other transportation modes, and throughout its economy as a whole.
• Environment. With increased trucking and increased population, the potential negative effects of freight activities are magnified. Factors such as truck emissions,
12
fuel consumption, noise, and land use conflicts must be considered in freight system planning and regulation.
• Industry support and partnership. The trucking industry faces issues of driver recruitment and retention, and the Commonwealth could be a partner in providing education and training. Similarly, there may be opportunities for the Commonwealth to expand the types of system information it provides to truckers – and for truckers, in turn, to provide more information on travel patterns and other issues back to the Commonwealth.
• Time shifting. In the off-peak periods, much of Virginia’s highway system has excess capacity, apart from work zone related delays. Many long-haul truckers whose schedules allow them to travel through Virginia’s congested urban areas at night will do so. Perhaps more truck travel could occur at night, and perhaps some shorter-haul activity could also occur at night. However, much of the short-haul activity will continue to occur in daylight hours for several reasons: that is when most businesses are open, businesses are located in neighborhoods where off-peak/overnight deliveries would be disruptive, people do not want to receive deliveries at their homes at 3 AM, and truck driver availability. Strategies to encourage greater use of off-peak highway capacity are an important opportunity, but must address not only the truckers, but also consider businesses and neighborhoods.
• Mode shifting. The Commonwealth has been active in exploring the potential to shift long-haul truck traffic to rail, to the extent this may prove feasible. Several background studies addressing I-81 have been performed, and another addressing truck-rail diversion is currently underway. These opportunities hold promise, and determining the real benefits and associated costs is important to develop a basis for public investment decisions. Mode-shifting also applies to passengers – more transit use means fewer cars, which means more highway capacity is available for trucks.
• Funding. Given that Virginia’s funding for needed transportation improvements is highly constrained, and given that the private sector is a direct financial beneficiary of freight improvements, it stands to reason that partnership opportunities – where a portion of the private sector benefit is captured to support needed improvements – should be carefully considered. There is also a need to demonstrate a public sector benefit associated with investments in private sector infrastructure. Ensuring that pass-through traffic, which impacts the Commonwealth in terms of wear and tear on roads, etc., contributes its fair share to Virginia is a concern.
By 2035, the critical issue is: given the significant issues we face today, and the
projected growth in population and non-freight travel, and anticipated transportation
revenues and available funding, how will Virginia deal with a projected near-doubling
of truck tonnage?
13
Railroads
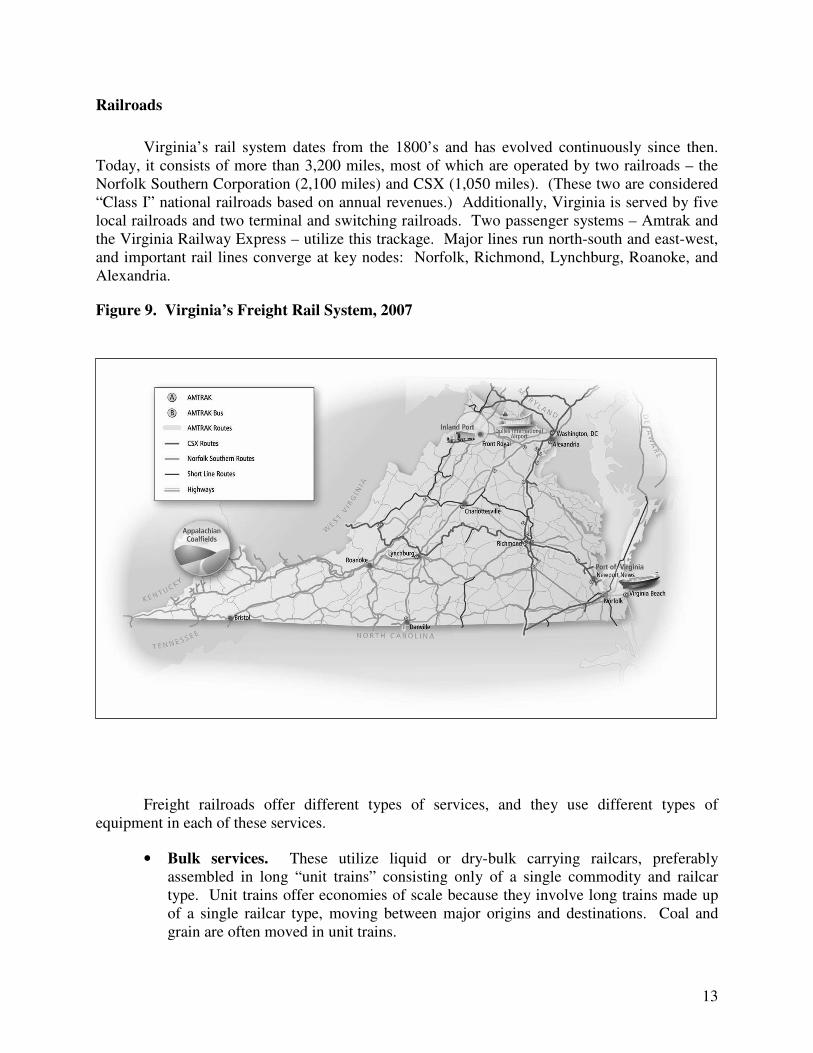
Virginia’s rail system dates from the 1800’s and has evolved continuously since then. Today, it consists of more than 3,200 miles, most of which are operated by two railroads – the Norfolk Southern Corporation (2,100 miles) and CSX (1,050 miles). (These two are considered “Class I” national railroads based on annual revenues.) Additionally, Virginia is served by five local railroads and two terminal and switching railroads. Two passenger systems – Amtrak and the Virginia Railway Express – utilize this trackage. Major lines run north-south and east-west, and important rail lines converge at key nodes: Norfolk, Richmond, Lynchburg, Roanoke, and Alexandria.
Figure 9. Virginia’s Freight Rail System, 2007
Freight railroads offer different types of services, and they use different types of equipment in each of these services.
• Bulk services. These utilize liquid or dry-bulk carrying railcars, preferably assembled in long “unit trains” consisting only of a single commodity and railcar type. Unit trains offer economies of scale because they involve long trains made up of a single railcar type, moving between major origins and destinations. Coal and grain are often moved in unit trains.

14
• Carload or “loose car” services. Carload trains are made up of a mix of different types of railcars and commodities, coming from different origins and moving to different destinations. Smaller shippers and receivers who might use a few railcars per day or per week, or larger shippers and receivers who handle multiple types of commodities, are typical carload customers.
• Intermodal services. As defined by the railroads, intermodal means carrying containers (single stacked on flat cars, or double-stacked in specially designed “well cars”), truck trailers (on flat cars), and even entire trucks (known as “piggyback” service). Some definitions also include “autoracks” (specialized two-level or three-level railcars carrying automobiles) as intermodal. Intermodal aims to provide a level of service comparable to trucking, with scheduled high-speed service.
Figure 10. Examples of Bulk, Carload, and Intermodal Services
TRANSEARCH data indicate that Virginia’s freight railroads handled more than 180 million tons of freight in 2004. This includes inbound, outbound, internal, and pass-through shipments. According to the most recent data available (year 2007), Virginia’s railroads handled 176,486,139 tons of freight. Virginia shipped 617,645 carloads outbound and received 924,615 carloads inbound. Around 43% of the carloads were coal, and around 23% were intermodal.
Virginia’s TRANSEARCH flow maps show that the majority of inbound, outbound, and internal rail tonnage is moving in an east-west direction, between Appalachian coalfields and the port in Hampton Roads, roughly paralleling US 460. Conversely, through tonnage tends to move in a north-south direction, on the CSX route paralleling I-95 and on the NS routes (the Shenandoah and the Piedmont) paralleling I-81. (There are some known anomalies in the TRANSEARCH routings of rail traffic, but the maps are useful for descriptive purposes.)

15
Figure 11. Virginia Inbound/Outbound/Internal Rail Tons (2004)
Figure 12. Virginia Through Rail Tons (2004)
16
Critical issues for Virginia’s freight rail system include:
• Safety and security, particularly for at-grade road-rail crossings.
• Retention and expansion of public benefits. Without railroads, Virginia’s truck tonnage would increase dramatically. Around 180 million tons of annual rail freight would become approximately 10 million annual truck trips – most of them long-haul – over Virginia’s highways. Businesses that depend on affordable, reliable rail transportation would close their doors. So even though the Commonwealth’s rail system is almost entirely in private hands, it actually represents one of the Commonwealth’s major transportation and economic resources Preserving the system that currently provides public benefits, and improving it to provide increased public benefits, are established Commonwealth goals.
• System modernization and capacity improvements. Over the past two decades, the nation’s rail system has transformed much of its 19th century infrastructure to serve 21st century markets, with tracks and bridges that accommodate heavier railcars, and with improved double-stack intermodal corridors and railyards. Most of these investments have come from the rail companies themselves.
• Public-private partnership opportunities. There are some types of railroad improvement projects where public partnership may be appropriate. Generally, these are cases where the cost exceeds the investment ability of the railroad, and where the project generates a positive return to the public in the form of transportation, economic, and/or environmental benefits. Virginia is currently partnering with Norfolk Southern to develop the Heartland Corridor, which will upgrade an historic coal line between Hampton Roads and Columbus, Ohio to enable double stack intermodal service.
• Shortline assistance. As the nation’s rail system has evolved, many of its “last mile” connections to end users have moved from the Class I railroads to the shortlines, and in some cases these shortlines require public support for needed improvements. Virginia is meeting some of these needs through its Rail Enhancement Fund.
• Port accessibility and service. With strong anticipated growth in the movement of international shipping containers and other commodities through Virginia’s ports, maintaining and improving rail service for marine terminals is critical. There are several projects advancing in this area.
• Passenger operations. In Virginia, passenger and freight rail service operate over the same tracks, potentially restricting the capacity of both. Virginia’s freight rail system must accommodate growing levels of utilization by passenger rail service, safely and reliably.
• Multistate coordination. Most rail freight travels long distances (e.g., greater than 500 miles), usually traversing multiple state lines. The success or failure of rail investments in Virginia may depend on corresponding investments in other states.

17
Ports
Virginia boasts one of the world’s greatest natural harbors and “marine highways” – the Chesapeake Bay and its tributaries. The Chesapeake Bay provides the deepest navigation channels for waterborne transportation of any US Atlantic Coast port. Hampton Roads hosts the Virginia Port Authority’s terminals (at Norfolk, Portsmouth, and Newport News), the new privately-developed APM (Maersk) container terminal, the future Craney Island container terminal, and privately-owned terminals handling coal and other commodities. The James River hosts the ports of Richmond and Hopewell, and the York and Appomattox Rivers also accommodate waterborne freight transportation facilities. Hampton Roads regularly ranks second or third (depending on the year) for container volumes among Atlantic Coast ports, and is also among the top 20 in the country for total tonnage.
Figure 13. Virginia Port Authority Marine Terminals and Channels
By 2035, the critical issue is: how can Virginia’s rail system be preserved and upgraded
to handle double the freight tonnage, while also potentially relieving pressure on the
highway system by diverting truck traffic to rail and also increasing passenger rail
service?
18
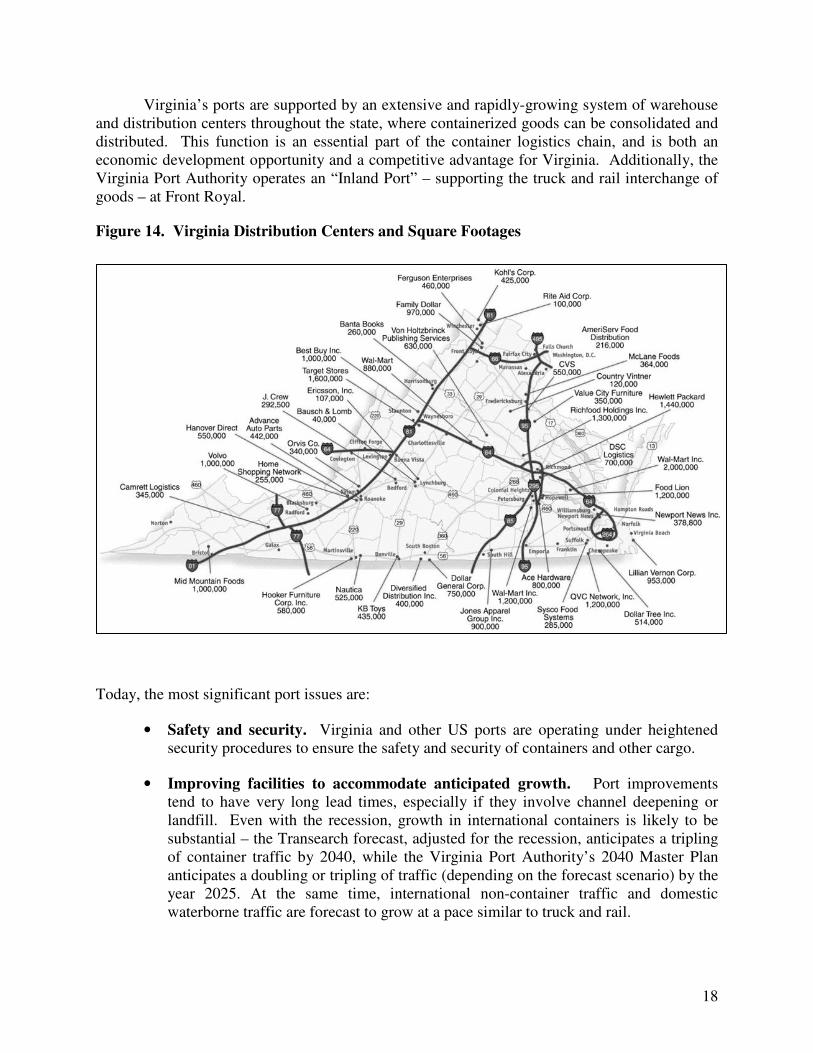
Virginia’s ports are supported by an extensive and rapidly-growing system of warehouse and distribution centers throughout the state, where containerized goods can be consolidated and distributed. This function is an essential part of the container logistics chain, and is both an economic development opportunity and a competitive advantage for Virginia. Additionally, the Virginia Port Authority operates an “Inland Port” – supporting the truck and rail interchange of goods – at Front Royal.
Figure 14. Virginia Distribution Centers and Square Footages
Today, the most significant port issues are:
• Safety and security. Virginia and other US ports are operating under heightened security procedures to ensure the safety and security of containers and other cargo.
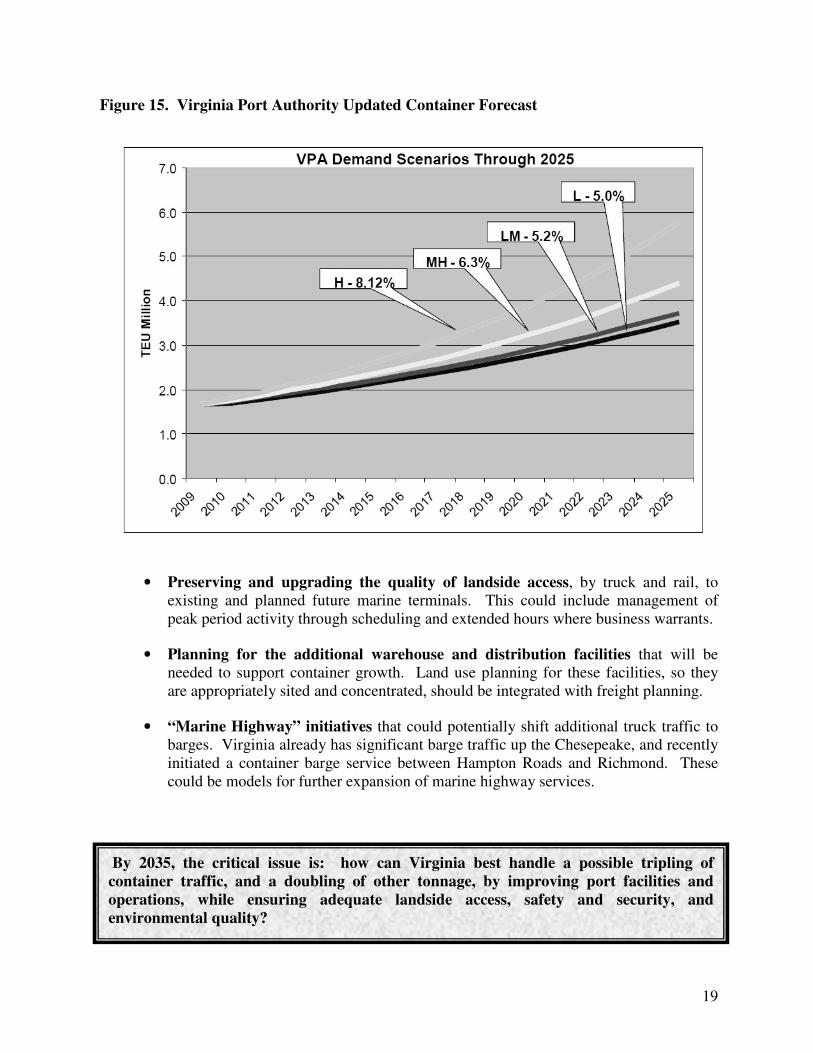
• Improving facilities to accommodate anticipated growth. Port improvements tend to have very long lead times, especially if they involve channel deepening or landfill. Even with the recession, growth in international containers is likely to be substantial – the Transearch forecast, adjusted for the recession, anticipates a tripling of container traffic by 2040, while the Virginia Port Authority’s 2040 Master Plan anticipates a doubling or tripling of traffic (depending on the forecast scenario) by the year 2025. At the same time, international non-container traffic and domestic waterborne traffic are forecast to grow at a pace similar to truck and rail.
19
Figure 15. Virginia Port Authority Updated Container Forecast
• Preserving and upgrading the quality of landside access, by truck and rail, to existing and planned future marine terminals. This could include management of peak period activity through scheduling and extended hours where business warrants.
• Planning for the additional warehouse and distribution facilities that will be needed to support container growth. Land use planning for these facilities, so they are appropriately sited and concentrated, should be integrated with freight planning.
• “Marine Highway” initiatives that could potentially shift additional truck traffic to barges. Virginia already has significant barge traffic up the Chesepeake, and recently initiated a container barge service between Hampton Roads and Richmond. These could be models for further expansion of marine highway services.
By 2035, the critical issue is: how can Virginia best handle a possible tripling of
container traffic, and a doubling of other tonnage, by improving port facilities and
operations, while ensuring adequate landside access, safety and security, and
environmental quality?

20
Airports
Virginia is served by four main cargo airports – Washington Dulles, Richmond, Norfolk, and Roanoke. In 2005, Washington Dulles (IAD) handled 303,012 metric tons of cargo which ranked it 23rd among all US airports. Richmond, Norfolk, and Roanoke accommodated 49,614 metric tons, 31,791 metric tons, and 14,333 metric tons, respectively.
Figure 16. Virginia Cargo Airports
Currently, Virginia’s airports do not suffer from significant freight movement bottlenecks. Airport capacity and on-time arrival statistics indicate no undue stress on the air cargo network. Given that air cargo tonnage is projected to triple, opportunities to improve the quality of international and domestic services through Virginia’s air cargo gateways will need to be explored. One possible opportunity is to capture more of the current “truck-air” market, which is Virginia traffic that is trucked to and from out-of-state airports (like JFK) that offer more frequent wide-body international passenger flights to more destinations. The challenge is that to attract international freight, one must provide more international passenger flights, so the freight opportunity is limited to some extent by passenger demand. For domestic freight, all-freight flights are more common and there are possibilities to attract them, provided there is a strong local market and/or “hubbing” potential.
By 2035, the critical issue is: how can Virginia best handle a tripling of air cargo traffic,
within the context of growing passenger demand through Virginia’s airports?

21
VIRGINIA FREIGHT NEEDS, IMPROVEMENTS, AND STRATEGIES
Bottlenecks
Virginia’s freight transportation system is performing, overall, at a level sufficiently high
to support the Commonwealth’s vibrant economy, and to accommodate high levels of global trade as well as pass-through traffic. The critical challenge will be to address current deficiencies, and to maintain and improve levels of performance in the face of projected growth in freight volumes, and to ensure that Virginia’s producers and consumers continue to benefit from safe, secure, and efficient freight movement.
However, Virginia’s freight transportation system contains segments that are stressed or over subscribed to the point that they are defined as bottlenecks. Bottlenecks – whether existing or emerging – prohibit the efficient flow of freight through the system and across the Commonwealth. Bottlenecks are created by a combination of demand to utilize a transportation asset (both freight and passenger), the capacity of the asset, and fluctuations in the demand at different points in time. A bottleneck slows down the system regardless of its mix of passenger and commercial vehicle traffic. Currently, Virginia’s primary freight bottlenecks generally correspond to:
• Major urbanized regions with high levels of congestion (Northern Virginia, Hampton Roads, Richmond);
• Major national through-travel corridors (I-95, I-81);
• Intersections of major highway arteries (I-495/I-95, I-77/I-81, I-64/I-295/I-95);
• Routes with few or no alternatives (Hampton Roads Bridge Tunnel, Midtown Tunnel);
• Rail system points where infrastructure provides inadequate freight capacity or dimension, especially where growing freight and passenger needs must be accommodated over shared infrastructure; and
• Access into and out of heavily used marine terminal facilities, and links between marine terminals and related inland facilities and warehouse/distribution centers.

22
Figure 17. Selected Virginia Freight Bottlenecks
Planned Improvements
The Commonwealth has a wide range of initiatives underway that will address freight
bottlenecks. Some are freight oriented, while others benefit both freight and passengers. Some focus on a single mode, while others are based on the concept of multimodal and cross-modal benefit.
• Much of Virginia’s transportation planning and funding is focused on highway issues and solutions. Key projects and initiatives include: the I-81 Near-Term Safety Improvements and Corridor Improvement Study; Truck to Rail Diversion in Virginia’s I-81 Corridor; various I-95/I-395/Capitol Beltway improvement projects including HOT (high occupancy toll) lanes and toll lanes; I-66 Improvements; Route 460 Location Study; I-64 Improvements; potential Hampton Roads Third Crossing; the I-564 Intermodal Connector; and the Route 29 Corridor Study Phases II and III
• Today, at the system level, there are numerous rail chokepoints throughout the Commonwealth. Typical chokepoints include limited height and weight capability, insufficient mainline capacity, at-grade highway crossings, conflicts with passenger trains, and insufficient yard capacity. In 2004, the Virginia State Rail Plan identified a series of high-priority initiatives, including: the Norfolk Southern Heartland
23
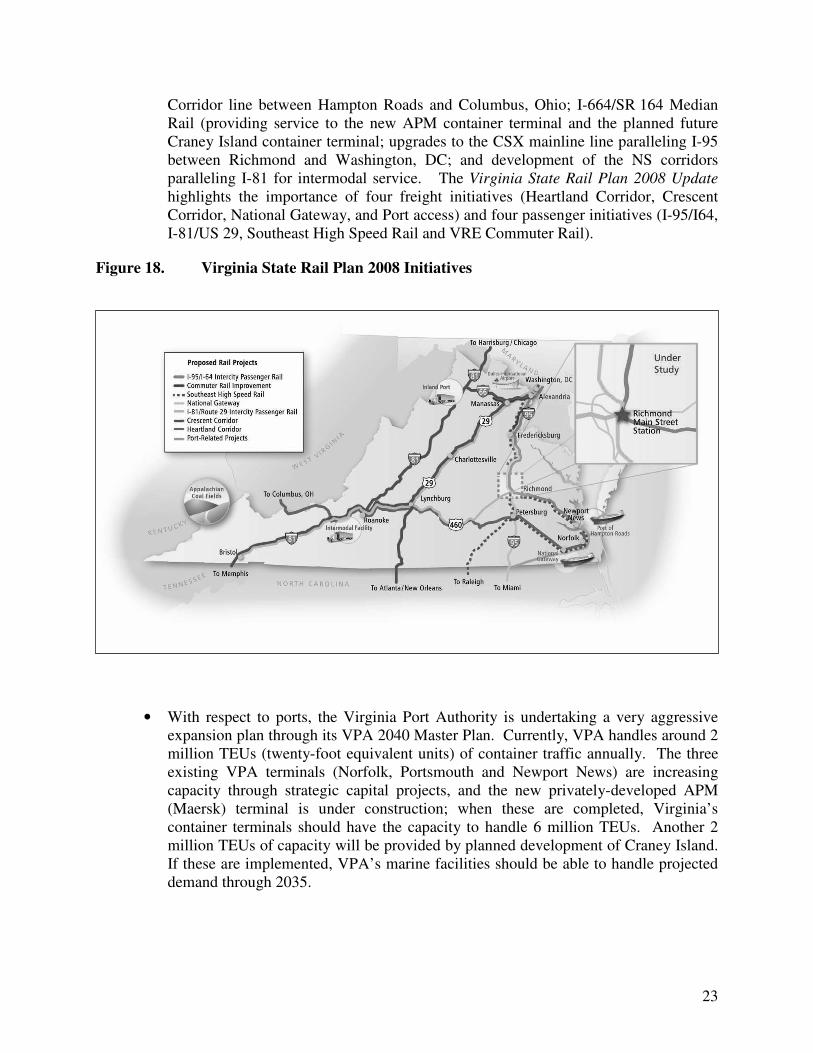
Corridor line between Hampton Roads and Columbus, Ohio; I-664/SR 164 Median Rail (providing service to the new APM container terminal and the planned future Craney Island container terminal; upgrades to the CSX mainline line paralleling I-95 between Richmond and Washington, DC; and development of the NS corridors paralleling I-81 for intermodal service. The Virginia State Rail Plan 2008 Update highlights the importance of four freight initiatives (Heartland Corridor, Crescent Corridor, National Gateway, and Port access) and four passenger initiatives (I-95/I64, I-81/US 29, Southeast High Speed Rail and VRE Commuter Rail).
Figure 18. Virginia State Rail Plan 2008 Initiatives
• With respect to ports, the Virginia Port Authority is undertaking a very aggressive expansion plan through its VPA 2040 Master Plan. Currently, VPA handles around 2 million TEUs (twenty-foot equivalent units) of container traffic annually. The three existing VPA terminals (Norfolk, Portsmouth and Newport News) are increasing capacity through strategic capital projects, and the new privately-developed APM (Maersk) terminal is under construction; when these are completed, Virginia’s container terminals should have the capacity to handle 6 million TEUs. Another 2 million TEUs of capacity will be provided by planned development of Craney Island. If these are implemented, VPA’s marine facilities should be able to handle projected demand through 2035.

24
Figure 19. VPA Container Cargo Demand and Planned New Capacity
• Finally, with respect to airports, each of Virginia’s cargo airports makes significant investments according to its own capital improvements plan. Airside improvements such as runways, as well as landside access improvements, benefit freight as well as passengers. At Dulles, extension of Metro to Dulles Airport will free up capacity on the existing four lanes (two in each direction) toll road for use by autos and trucks. This study did not identify significant air cargo bottlenecks. However, positive opportunities for Virginia airports to be more competitive with out-of-state airports for international services, as well as the potential for increased domestic cargo service from existing and additional airports, should continue to be explored.
Virginia’s public transportation agencies, communities, and private stakeholders already have done extensive work in identifying and advancing freight-supporting infrastructure projects. Freight advocates would like to see all freight-benefiting projects advanced as soon as practical, but it must be recognized that progress on many – if not most – will depend on the identification of new revenues, and the timetable for accomplishing this is far from certain. In the meantime, due to funding limitations, project opportunities will need to be carefully prioritized and trade-offs evaluated, to obtain the greatest public benefit for the least public cost. This requires a multimodal approach to transportation planning that considers all modes in the context of critical corridors and planning subregions, addresses the interrelated effects of improvements to one mode on the other modes, integrates freight and passenger mobility, and aims to maximize public benefit and return on public investment regardless of mode or location..

25
Suggested Virginia Multimodal Freight Program
Virginia’s transportation improvement plans and programs typically address modal systems – highway, rail, port, and aviation – but do not usually distinguish between passenger transportation needs and freight transportation needs. Given the importance of freight to Virginia, it is useful to define a set of programmed near-term projects, potential longer-term projects, and potential freight strategies that are targeted specifically at the improvement of freight movement. Collectively, these three components constitute a suggested Virginia Multimodal Freight Program.
The Virginia Multimodal Freight Program aims to identify the projects that are most important to freight movement – seaports, cargo airports, freight railroads, and major truck routes. In many cases, both freight and passengers benefit from the improvements. For example, new general-purpose highway lanes benefit both trucks and cars, and even car-only high-occupancy lanes will benefit trucks by moving cars out of their way. Freight railroad improvements benefit auto users by allowing more freight to move by rail instead of truck. Improvements to seaports and airports reduce Virginia’s reliance on out-of-state facilities, reducing the need for long-haul truck trips.
Detailed descriptions of the projects and strategies that comprise the suggested Virginia Multimodal Freight Program are presented in Attachments A, B, C, and D. The reader is invited to review this summary material first, then proceed to the more detailed information. The program recommendations were developed as part of the Virginia Statewide Multimodal Freight Plan, Phase II, and are currently under review by the Commonwealth. At this point, they represent consultant recommendations only, and have not been approved or endorsed by the Commonwealth.
The costs for the Virginia Multimodal Freight Program are estimated as follows:
• Programmed Near-Term Projects: $5.6 billion. These represent projects identified in near-term modal system plans that are underway, or for which funding is secured or assumed to be secured. The Commonwealth’s share of these costs is $1.5 billion, and funding comes from a variety of sources including general fund, fuel taxes, transportation taxes, and facility revenues.
• Potential Longer-Term Projects: $14.6 billion. These represent additional freight benefiting projects that could be implemented between now and 2035. Of this amount, $7.2 billion is associated with projects that are listed on approved long-range modal system plans. The remaining $7.4 billion is associated with projects that are not included in long-range modal system plans; some of these projects are under discussion, while others are being proposed for the first time in this Program. Funding for these projects is not secured, but could come from public monies, public/private partnerships, and/or user fees. These projects have not yet been endorsed or approved by the Commonwealth or other responsible agencies, and funding is not secured, but these projects are recommended for further consideration. The Commonwealth’s estimated share of these costs is $6.0 billion, and funding

26
would presumably come from a variety of sources including general fund, fuel taxes, transportation taxes, and facility revenues.
• Potential Strategies: cost not estimated. These represent policies, actions, and initiatives that supplement capital projects. Many can be implemented in the near-term, and are recommended for further consideration.
The potential effectiveness of the Freight Program was tested in four ways:
• Qualitative Bottleneck Analysis. Freight Program improvements were compared to a list of known freight bottlenecks, and it was determined that nearly all will be addressed in a positive way by the Program.
• Highway Network Model Analysis. CS developed an upgraded version of the Virginia State Model (VSM). Each of the major projects and strategies in the Program was coded into the model, to the extent permitted by the model’s level of geographic detail (it is designed for large-scale corridors, not local projects) and our ability to anticipate the likely effects of multimodal improvements and potential strategies. For year 2035, compared to a No Action alternative, the Freight Program would result in an overall improvement to statewide truck mobility of 30%, due to the combination of improved highway capacity and increased reliance on rail, water, and air as alternatives to trucking. The Freight Program would also result in a reduction of 5.1 million truck vehicle miles of travel (VMT) each day in year 2035, a 20% improvement compared to the No Action alternative.
• Monetized Transportation Benefit Analysis. Between 2009 and 2035, the anticipated VMT reduction produces a discounted cumulative savings of $1.3 billion in avoided pavement maintenance costs, $1.7 billion in avoided crash-related costs, and $1.7 billion in avoided emissions costs (after adjusting for increased emissions in modes that substitute for truck). Benefits of individual projects will vary, but the overall message is that freight investments can help pay for themselves out of other transportation-related savings to the Commonwealth.
• Monetized Economic Benefit Analysis. Today, the movement of freight – including raw materials, intermediate products, and finished goods – supports around $350 billion dollars of Virginia’s annual gross state product. The Freight Program improvements would substantially enhance Virginia’s ability to move freight in an efficient, sustainable manner, and allow freight to support a growing amount of Virginia’s gross state product. Between 2009 and 2035, the anticipated VMT reduction produces a discounted cumulative savings of $6.4 billion in direct shipper cost savings from using lower-cost transportation modes; $5.4 billion in indirect and induced benefits from industries applying the savings to other productive uses; and $6.6 billion in value of time saved by automobiles and trucks on Virginia’s highways due to reduced congestion. The shipper cost savings and multiplier benefits accrue wherever the shippers are located, which may not be in Virginia; the time savings benefits are associated entirely with travel in Virginia.

27
The key findings are as follows:
1. The suggested Virginia Multimodal Freight Program, in total, would make a significant contribution to freight mobility in the Commonwealth, and would generate significant transportation and economic benefits.
2. The Programmed Near-Term Projects are largely funded and in place through modal system plans -- rail, port, airport, and highway. Every effort should be made to ensure these projects advance as planned.
3. The Programmed Long-Range Projects extend the benefits of the Programmed Near-Term Projects, but at significant cost. Some of the cost will be addressed through facility revenues, or under PPTAs, or by private freight carriers; but much of the cost burden may fall to the Commonwealth. A careful, project-by-project, benefit-cost analysis of each Potential Long-Term Project should therefore be undertaken. Also, it should go without saying that each of the Potential Long-Term Projects will require appropriate environmental review before proceeding. The Programmed Long-Range Projects are additive, not duplicative – but if some projects drop off the list as planning advances, there may be opportunities to expand other projects to “pick up the slack.” It is essential to advance the required planning, engineering, and environmental studies for these projects, so these determinations can be made.
4. Many of the Potential Strategies can be implemented in the near-term, and at relatively low cost compared to infrastructure improvements. The Commonwealth should establish a review panel of representatives from each modal administration to determine which of these strategies to advance, and how. As part of this process, input from the Commonwealth’s Freight Advisory Committee and from significant freight-handling regions will be critical.
5. Finally, the Commonwealth should, as appropriate, begin integrating the suggested Virginia Multimodal Freight Program into other ongoing local, regional, and statewide planning and programming efforts.
28
ATTACHMENT A: PROGRAMMED NEAR-TERM PROJECTS
The Programmed Near-Term Projects component of the Virginia Multimodal Freight
Program consists of projects listed in Virginia modal system planning documents. These documents do not differentiate between “freight” and “non-freight” projects, so we have made qualitative judgments about which projects should be considered freight-oriented.
• Rail projects were identified based on the Virginia State Rail Plan 2008 Update. Projects were included if they met three criteria: (a) they affect facilities owned by freight railroads; (b) their primary purpose is to enhance freight mobility; and (c) they are funded.
• Port projects were identified based on the Virginia Port Authority’s Strategic Plan and 2040 Master Plan. All projects in these plans are directly related to freight movement. Projects were included if they are planned for completion by 2015; for projects that will be initiated but not completed by 2015, costs through 2015 were pro-rated based on average annual expenditures.
• For aviation, the team reviewed the Virginia Air Transportation System Plan Update
and current Department of Aviation six-year funding plans. While aviation expenditures benefit both freight and passenger movement – since freight uses the same access roads, runways, traffic control systems, and in most cases aircraft as passengers, there are no purely freight-serving projects in these plans.
• Highway projects were identified based on the Virginia Department of Transportation’s Six-Year Plan. There is no road in the Commonwealth that is truck-only, and no road where trucks constitute a majority percentage of the traffic handled. We therefore developed a methodology to identify which highway improvements make a particularly significant contribution to freight movement, and counted these as freight projects. See Attachment D for details on the designation of freight projects.
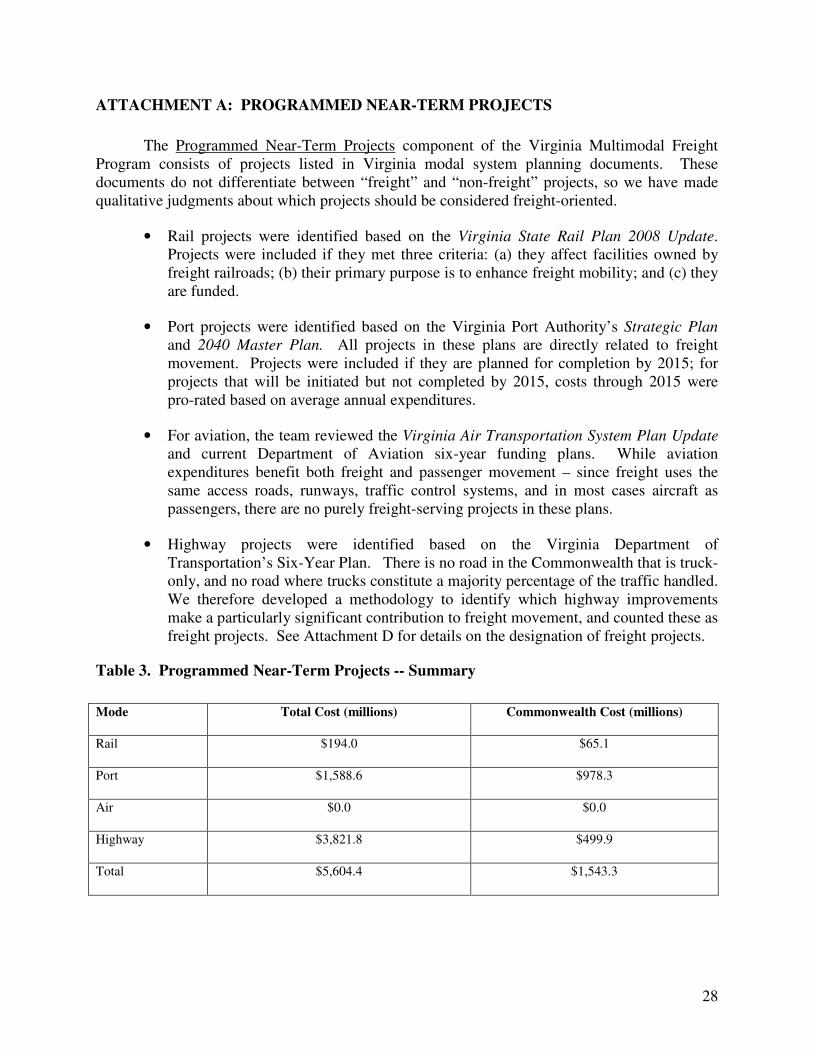
Table 3. Programmed Near-Term Projects -- Summary
Mode Total Cost (millions) Commonwealth Cost (millions)
Rail $194.0 $65.1
Port $1,588.6 $978.3
Air $0.0 $0.0
Highway $3,821.8 $499.9
Total $5,604.4 $1,543.3

29
Table 4. Programmed Near-Term Projects -- Detail
Mode Map
Location
Name Description Total Cost
(millions)
Common-
wealth
Cost
(millions)
Rail R1 National Gateway Phase I
The National Gateway is a coordinated program of multistate improvements to CSX rail lines, aimed at improving double-stack rail connections between Mid-Atlantic ports and Midwestern markets. The total project is expected to cost $842 million across multiple states, and addresses three corridors, including the I-95 Corridor between North Carolina and Baltimore. Within Virginia, Phase I consists of clearance projects and various engineering and design studies.
$135.7 $25.0
Rail R2 Crescent Corridor Phase I
Norfolk Southern’s Crescent Corridor is a 2,500 mile rail between Northern New Jersey, Memphis, and New Orleans. $2.1 billion in planned improvements in multiple states will allow for the diversion of domestic truck traffic to rail from numerous interstates, including Virginia’s I-81, I-95, I-77, and I-85. Improvements in Virginia include straightening curves, adding sidings, and double tracking portions of the Shenandoah and Piedmont lines. Phase I consists of capacity improvements between Manassas and Front Royal, and at four other locations.
$38.0 $26.6
Rail R3 Heartland Corridor Phase I
The Heartland Corridor will improve NS rail lines between Hampton Roads and Ohio, allowing double-stack container train service from VPA terminals. Phase I funding addresses intermodal facility costs.
$18.1 $12.7
Rail Port-Related Rail Improvement Project Phase I
The Port-Related Rail Improvement Project will provide improved rail access to existing VPA terminals and build rail to the future Craney Island terminal. Phase I addresses engineering studies for the Norfolk International Terminals on-dock rail yard and the Norfolk and Portsmouth Belt Line rail yard.
$2.2 $0.8

30
Port Dredging Projects
The current 50-foot channels are authorized for deepening to 55 feet. This project will implement the deepening, under a federal cost-sharing agreement.
$140.5 $87.5
Port P1 NIT Projects Projects at Norfolk International Terminals include relocating the north gate, upgrading the central rail yard, improving the south container yard and gates, and acquiring property.
$132.2 $132.2
Port P2 PMT Projects Projects at the Portsmouth Marine Terminal include rehabilitation and upgrading of the former APM area.
$9.3 $2.0
Port P3 NNMT Projects Road and rail access to the Newport News Marine Terminal will be improved.
$2.0 $2.0
Port P4 CIMT Craney Island is an historic dredged materials disposal site. A variety of projects are planned to will extend its useful life beyond 2025, provide a site adjacent to VPA’s main shipping channel for a future new container terminal, and provide logistics load-out space for military equipment. Work through 2015 addresses engineering and design, environmental mitigation, dike construction (assumed to be cost shared with the US Army Corps of Engineers), landfilling, and road and rail access projects.
$1,211.9 $661.9
Port Equipment VPA plans to acquire straddle carriers, top picks, and wharf cranes for its container terminals.
$92.7 $92.7
Highway H2 I-81 SB Climbing Lanes
From milepost 119 to milepost 128. (UPC 84117) Note: $67.9 already spent.
$83.0 $16.0
Highway H3 I-81 NB Climbing Lanes
From 0.43 miles north of Route 641 (MP 135.9) to 0.20 miles north of Route 635 (MP 138.6). (UPC 84363) Note: $44.4 already spent.
$82.9 $16.5
Highway H3 I-81 Widening From 4 to 8 Lanes
From 0.05 miles north of Route 641 (MP 135.9) to 0.88 miles north of Route 635 (MP 138.65). Costs are for PE only. (UPC 16591) Note: these funds are already spent.
$2.6
$0.3

31
Highway H4 I-81 Widening From 4 to 8 Lanes
From 0.20 miles north of Route 635 (MP 138.6) to 0.75 miles north of Route 311 (MP 140.9). Costs are for PE only. (UPC 53094) Note: these funds are already spent.
$1.4
$0.3
Highway H5 I-81 Widening From 4 to 8 Lanes
From 0.75 miles north of Route 311 (MP 140.9) to 0.79 miles south of I-581 (MP 143.1). Costs are for PE only. (UPC 53095) Note: these funds are already spent.
$2.1
$1.8
Highway H6 I-81 Widening From 4 to 8 Lanes
From 0.79 miles south of I-581 (MP 143.1) to 0.88 miles north of I-581 (MP 144.5). Costs are for PE only. (UPC 53096) Note: these funds are already spent.
$2.5
$0.5
Highway H7 I-81 Widening From 4 to 8 Lanes
From 0.88 miles north of I-581 (MP 144.5) to 0.28 miles south of Route 648 (MP 147.5). Costs are for PE & ROW only. (UPC 16593) Note: these funds are already spent.
$1.6
$0.4
Highway H8 I-81 Widening From 4 to 8 Lanes
From 0.28 miles south of Route 648 (MP 147.5) to 0.79 miles north of route 779E 220 (MP 152.4). Costs are for PE & ROW only. (UPC 53097) Note: these funds are already spent.
$9.4
$2.7
Highway H11 I-64 Widening From 4 to 6 Lanes
From 0.99 miles west of Route 623 to 0.38 miles west of I-295. (UPC 70542) Note: $2.7 already spent.
$35.3 $7.1
Highway
H13 I-64 Pavement Rehabilitation and Widening
From 1.0 miles west of Airport Drive to 1.0 miles east of I-295. Costs are for PE only. (UPC 12799) Note: these funds are already spent.
$4.7
$3.9
Highway H15 I-64 Pavement Rehabilitation and Widening
From 1.0 miles east of Route 249 to 1.0 miles east of Route 33. Costs are for PE only. (UPC 11800) Note: these funds are already spent.
$0.4
$0.1
Highway H18 Route 164 Design/Build
Road improvements for APM terminal. (UPC 70552) Note: these funds are already spent.
$26.7 $24.0
Highway H19 I-564 Intermodal Connector
This 2.6 mile project will extend I-564 and freight rail lines to NIT and Naval Station Norfolk. (UPC 18968) Note: $67.3 already spent.
$170.3 $41.3
Highway H36 I-95 Widening From 6 to 8 Lanes
From 0.02 miles south of Route 123 (Gordon Blvd.) to 0.15 miles north of Route 7100 (Fairfax County Parkway) (UPC 57017) Note: $63.9 spent.
$122.9 $27.8

32
Highway H40 I-95 Widening From 2.10 miles west of Telegraph Road to 0.45 miles east of Telegraph Road. (UPC 18136) Note: $101.0 already spent.
$256.4 $90.2
Highway H41 I-95 Widening From 0.88 miles west of Route 1 to Woodrow Wilson Memorial Bridge. (UPC 18138) Note: $269.4 already spent.
$297.2 $26.1
Highway H42 I-95/395 BRT and Hot Lanes
Project to construct a multi-modal transportation facility between the beginning of the 14th Street Bridge in Arlington County and Massaponax in Spotsylvania County. The proposed BRT/HOT Lanes would be located in the center of the existing I-95/395 Corridor, as an expansion of the existing HOV lanes north of the town of Dumfries and as a new two-lane roadway from Dumfries to Massaponax.
$913.41 $0.0
2
Highway H43 I-495 HOT Lanes Project includes: two new HOT lanes in each direction from the Springfield Interchange to just north of the Dulles Toll Road (14 miles); first-time introduction of HOV and reliable transit options to the Beltway and Tysons Corner; replacement of more than $260 million of aging infrastructure, including more than 50 bridges and overpasses; replacement of existing soundwalls and construction of new soundwalls to double existing noise reduction tools for surrounding neighborhoods; construction of carpool ramps connecting I-95 with the Beltway to create a seamless HOV network.
$1,809.03 $240.9
1 Fluor-Transurban proposal accessed from the Virginia Megaprojects web site http://www.vamegaprojects.com/tasks/sites/default/assets/File/pdf/Tab_3.pdf. Note: the scope of this project is currently under review by VDOT. It is very likely that the total cost of this project will change as a result of the review.
2 Under the Fluor-Transurban proposal the Commonwealth would be responsible for covering the following risks through the establishment of a contingency fund: (1) overruns in the Department’s oversight budget, (2) overruns in the right-of-way (ROW) allowance, (3) Department caused delays. (4) force majeure events not covered by insurance, and (5) safety directed changes as a result of new standards.
3 From page 3 of the “VDOT Commissioner Recommended Business Terms Memorandum” September 2007 accessed from Virginia Megaprojects web site http://www.vamegaprojects.com/faqsdocuments/i495-hot-lanes-documents/
33
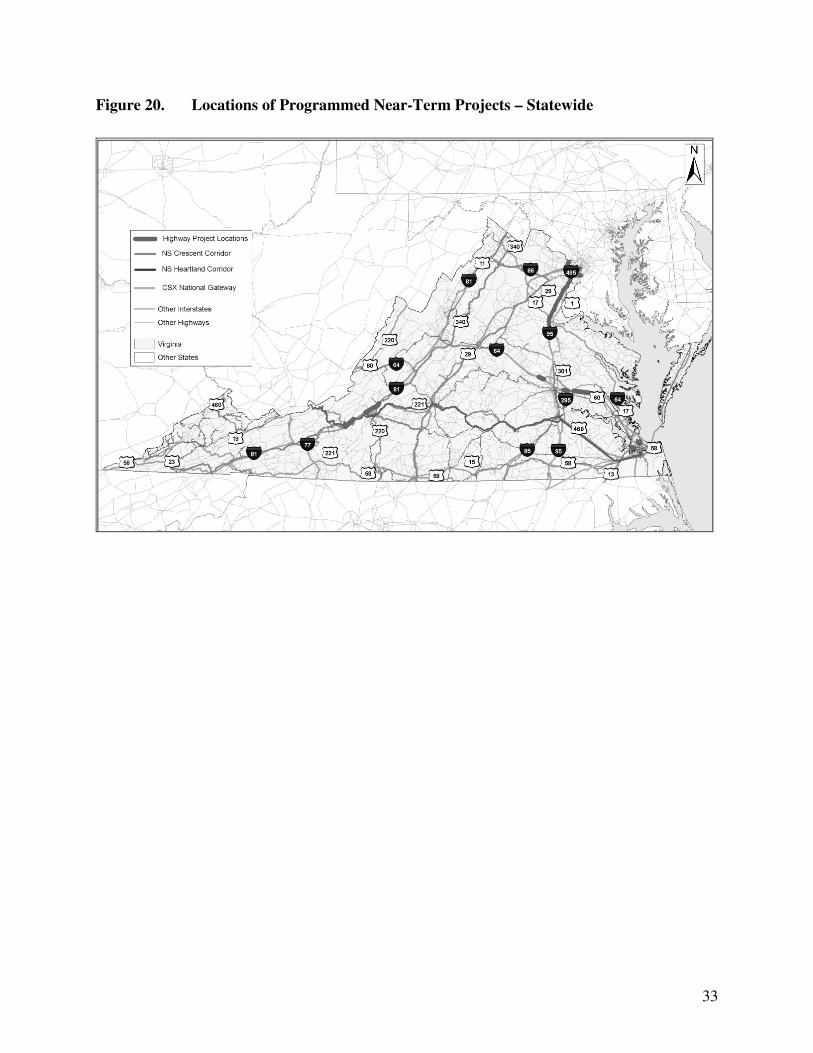
Figure 20. Locations of Programmed Near-Term Projects – Statewide
34
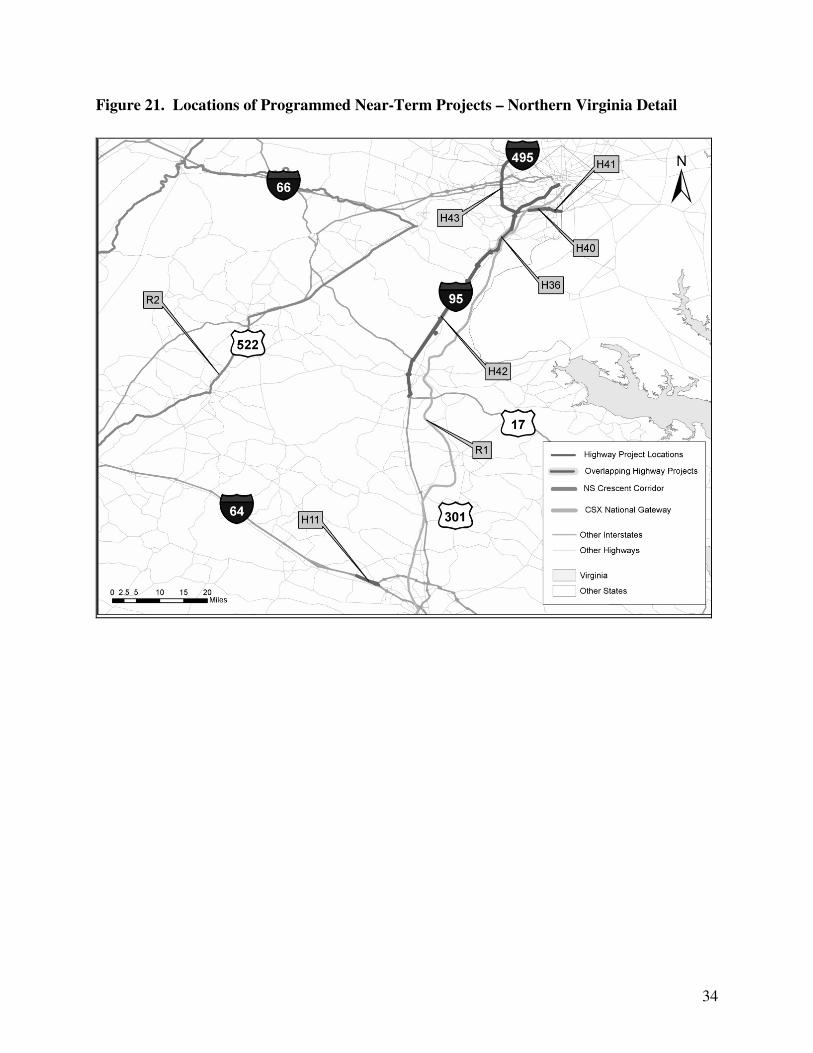
Figure 21. Locations of Programmed Near-Term Projects – Northern Virginia Detail
35
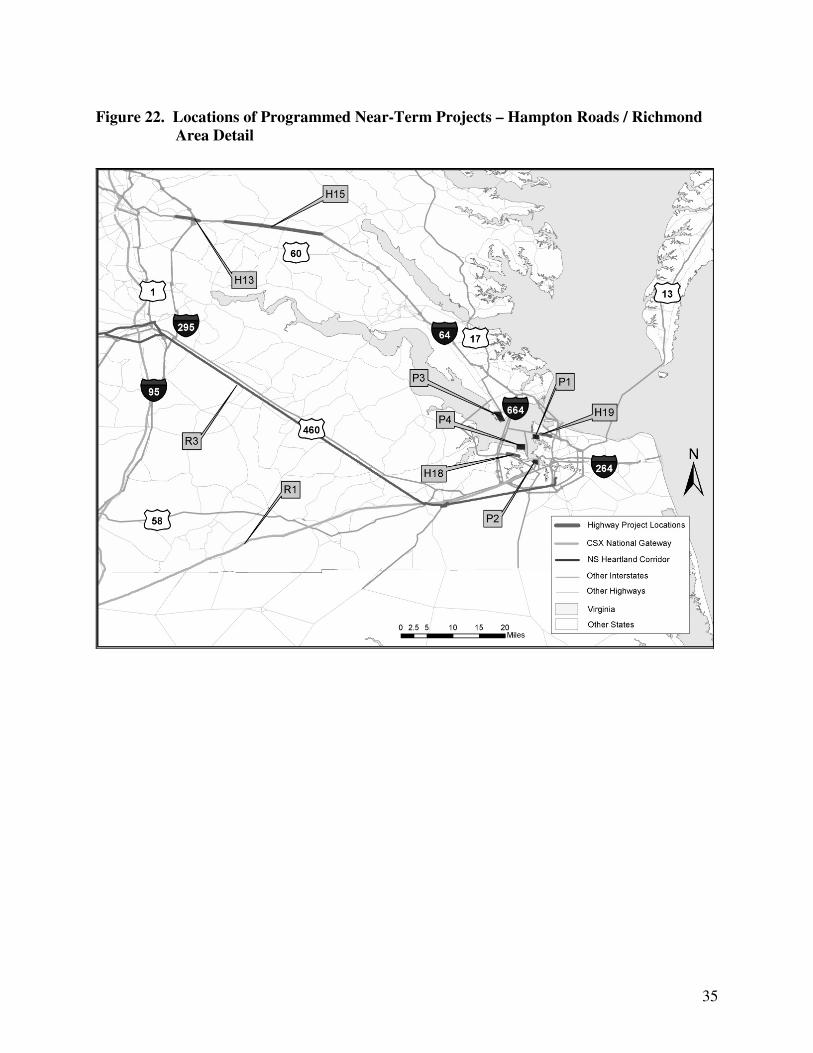
Figure 22. Locations of Programmed Near-Term Projects – Hampton Roads / Richmond
Area Detail
36
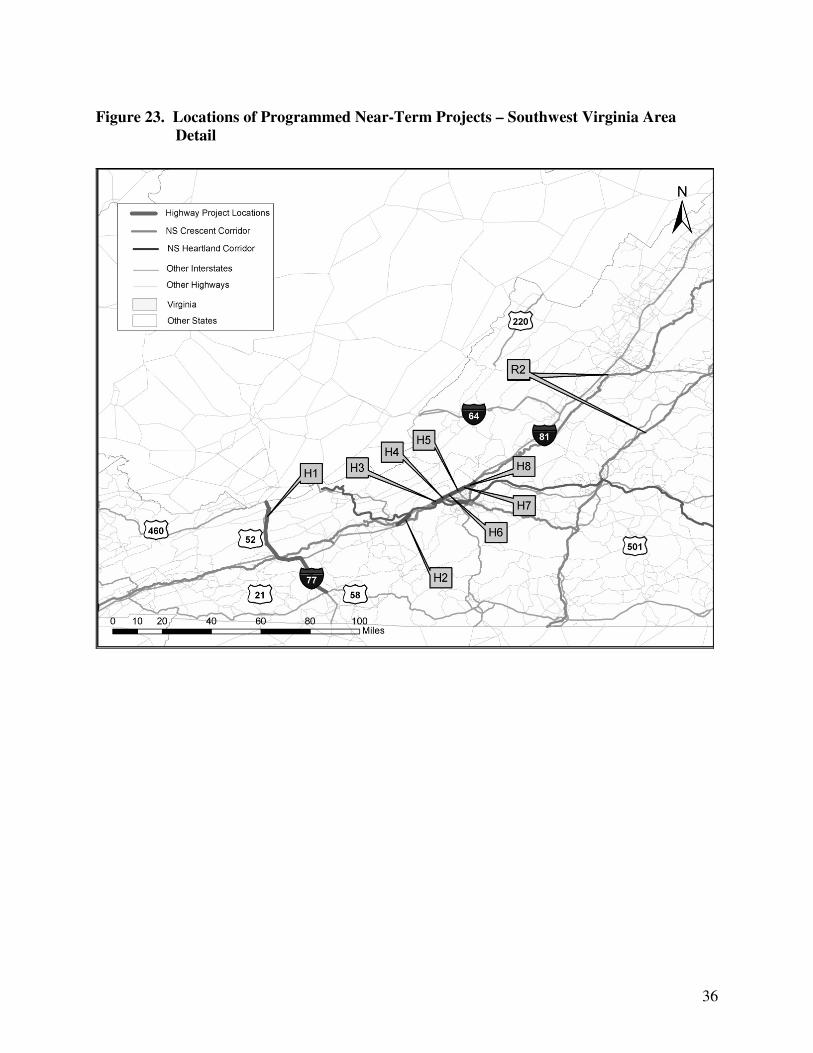
Figure 23. Locations of Programmed Near-Term Projects – Southwest Virginia Area
Detail

37
ATTACHMENT B: POTENTIAL LONGER-TERM PROJECTS
The Potential Longer-Term Projects component of the Virginia Multimodal Freight
Program consists of additional projects that may be implemented by the year 2035. Some of these projects are identified in long-range modal system plans; others have emerged through the PPTA process; others are being discussed but have not advanced to modal system plans or PPTA applications; and still others are new concepts being introduced for further consideration, based on findings from VSM analysis and awareness of emerging strategies elsewhere.
Funding for these projects has not been allocated or secured, although funding streams are in place to address some of them. Estimates of Commonwealth and non-Commonwealth funding contributions have been made based on available information. Non-Commonwealth funding reflects expected federal contributions, PPTA contributions, and private railroad contributions. For rail projects, we have assumed an 80% Commonwealth/20% private railroad cost share, consistent with typical Rail Enhancement Fund allocations, but actual cost shares would be negotiated and the private shares might well be higher. Additionally, it should be noted that some of the Commonwealth costs will be supported by dedicated revenue streams, such as seaport lease revenues.
As with the Programmed Near-Term Projects, we have included highway projects that substantially benefit freight movement, as described in Attachment D.
Table 5. Potential Longer-Term Projects -- Summary
Mode
Total Cost (millions) Commonwealth Cost (millions)
Rail
$1,219.7 $975.8
Port
$2,193.0 $2,193.0
Air
$0.0 $0.0
Highway
$11,219.3 $2,800.6
Total
$14,632.1 $5,969.4
38
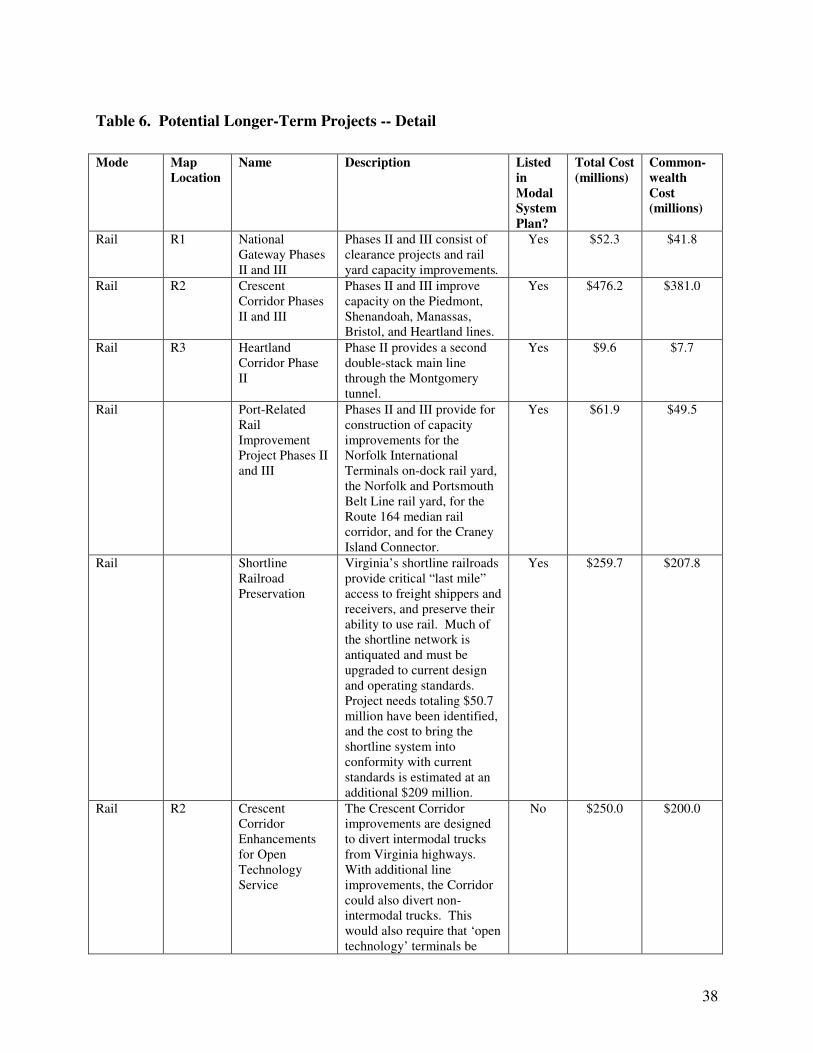
Table 6. Potential Longer-Term Projects -- Detail
Mode Map
Location
Name Description Listed
in
Modal
System
Plan?
Total Cost
(millions)
Common-
wealth
Cost
(millions)
Rail R1 National Gateway Phases II and III
Phases II and III consist of clearance projects and rail yard capacity improvements.
Yes $52.3 $41.8
Rail R2 Crescent Corridor Phases II and III
Phases II and III improve capacity on the Piedmont, Shenandoah, Manassas, Bristol, and Heartland lines.
Yes $476.2 $381.0
Rail R3 Heartland Corridor Phase II
Phase II provides a second double-stack main line through the Montgomery tunnel.
Yes $9.6 $7.7
Rail Port-Related Rail Improvement Project Phases II and III
Phases II and III provide for construction of capacity improvements for the Norfolk International Terminals on-dock rail yard, the Norfolk and Portsmouth Belt Line rail yard, for the Route 164 median rail corridor, and for the Craney Island Connector.
Yes $61.9 $49.5
Rail Shortline Railroad Preservation
Virginia’s shortline railroads provide critical “last mile” access to freight shippers and receivers, and preserve their ability to use rail. Much of the shortline network is antiquated and must be upgraded to current design and operating standards. Project needs totaling $50.7 million have been identified, and the cost to bring the shortline system into conformity with current standards is estimated at an additional $209 million.
Yes $259.7 $207.8
Rail R2 Crescent Corridor Enhancements for Open Technology Service
The Crescent Corridor improvements are designed to divert intermodal trucks from Virginia highways. With additional line improvements, the Corridor could also divert non-intermodal trucks. This would also require that ‘open technology’ terminals be
No $250.0 $200.0

39
developed at hubs in other states; the out-of-state costs are not shown.
Rail R2-A R2-B
Crescent Corridor Enhancements for Virginia Terminals
The Crescent Corridor improvements are designed to accommodate traffic moving through Virginia. This project would improve the existing Front Royal facility and the planned Elliston facility and integrate them into the Crescent Corridor service network.
No $100.0 $80.0
Rail Short Haul “Sprint Trains”
Typically, intermodal rail is competitive with trucking at distances of 400 miles or more. There is considerable interest in developing services that could be competitive at much shorter distances, to link VPA with freight centers in Suffolk, Richmond, and Front Royal. Such a service is speculative but planning and engineering studies could be undertaken. Costs shown are for PE only.
No $10.0 $8.0
Port P1 NIT Projects Projects at Norfolk International Terminals include wharf strengthening and upgrading the gate interchange at NIT North and building container freight station and cold storage structures.
Yes $110.1 $110.1
Port P2 PMT Projects Projects at the Portsmouth Marine Terminal include container yard and wharf rehabilitation, paving, and expansion.
Yes $205.6 $205.6
Port R2-A VIP Projects Projects at the Virginia Inland Port include rail facility expansion.
Yes $7.0 $7.0
Port P4 CIMT Projects at Craney Island Marine Terminal include Phases I, II, III, and IV of container terminal development.
Yes $1,343.9 $1,343.9
Port Equipment VPA plans to acquire straddle carriers, top picks, and wharf cranes for its container terminals.
Yes $516.4 $516.4
Port Marine Highway Service expansion
The “Marine Highway” is a service concept where barges are used to substitute for
No $10.0 $10.0
40
intermodal truck trips. VPA already has barge services to Baltimore and Richmond. The concept is to expand these services to divert more trucks from I-64. Costs shown are for PE only.
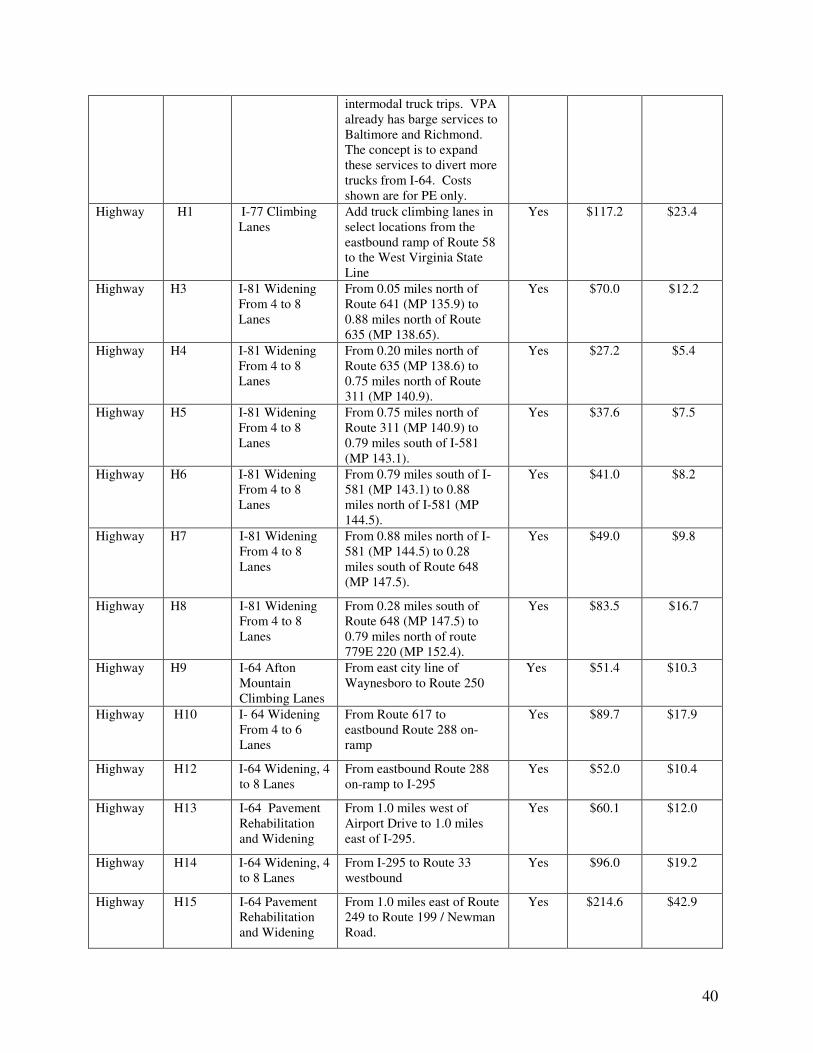
Highway H1 I-77 Climbing Lanes
Add truck climbing lanes in select locations from the eastbound ramp of Route 58 to the West Virginia State Line
Yes $117.2 $23.4
Highway H3 I-81 Widening From 4 to 8 Lanes
From 0.05 miles north of Route 641 (MP 135.9) to 0.88 miles north of Route 635 (MP 138.65).
Yes $70.0 $12.2
Highway H4 I-81 Widening From 4 to 8 Lanes
From 0.20 miles north of Route 635 (MP 138.6) to 0.75 miles north of Route 311 (MP 140.9).
Yes $27.2 $5.4
Highway H5 I-81 Widening From 4 to 8 Lanes
From 0.75 miles north of Route 311 (MP 140.9) to 0.79 miles south of I-581 (MP 143.1).
Yes $37.6 $7.5
Highway H6 I-81 Widening From 4 to 8 Lanes
From 0.79 miles south of I-581 (MP 143.1) to 0.88 miles north of I-581 (MP 144.5).
Yes $41.0 $8.2
Highway H7 I-81 Widening From 4 to 8 Lanes
From 0.88 miles north of I-581 (MP 144.5) to 0.28 miles south of Route 648 (MP 147.5).
Yes $49.0 $9.8
Highway H8 I-81 Widening From 4 to 8 Lanes
From 0.28 miles south of Route 648 (MP 147.5) to 0.79 miles north of route 779E 220 (MP 152.4).
Yes $83.5 $16.7
Highway H9 I-64 Afton Mountain Climbing Lanes
From east city line of Waynesboro to Route 250
Yes $51.4 $10.3
Highway H10 I- 64 Widening From 4 to 6 Lanes
From Route 617 to eastbound Route 288 on-ramp
Yes $89.7 $17.9
Highway H12 I-64 Widening, 4 to 8 Lanes
From eastbound Route 288 on-ramp to I-295
Yes $52.0 $10.4
Highway H13 I-64 Pavement Rehabilitation and Widening
From 1.0 miles west of Airport Drive to 1.0 miles east of I-295.
Yes $60.1 $12.0
Highway H14 I-64 Widening, 4 to 8 Lanes
From I-295 to Route 33 westbound
Yes $96.0 $19.2
Highway H15 I-64 Pavement Rehabilitation and Widening
From 1.0 miles east of Route 249 to Route 199 / Newman Road.
Yes $214.6 $42.9

41
Highway H16 I-64 Widening From 4 to 6 Lanes Plus 2 HOV Lanes
From Route 199 to Fort Eustis Blvd.
Yes $219.3 $21.9
Highway H17 I-64 Widening From 4 to 6 Lanes Plus 2 HOV Lanes
From I-464 to I-264 / I-664 Yes $134.8 $27.0
Highway H20 Hampton Roads Third Crossing
The project was initiated to relieve congestion at the I-64 Hampton Roads Bridge Tunnel and other transportation facilities in the Hampton Roads region. The project is envisioned to carry vehicles, light and heavy passenger rail, and would significantly upgrade access to VPA. Cost estimates
range from $3.2 to $4.54
billion. If the project proceeds, it is expected to do so as a PPTA.
No $4,505 $1,8005
Highway H21 U.S. 460 – Add 1 Lane To Each Direction
From Suffolk Bypass to I-264
No $29.0 $5.86
Highway H22 U.S. 460 Widening From 4 to 6 Lanes
From Kings Fork Road to Suffolk Bypass
Yes $16.4 $3.3
Highway H23 U.S. 58 Widening From 4 to 6 Lanes
From Manning Bridge Road to Suffolk Bypass
Yes $24.8 $5.0
Highway H24 U.S. 460 Expressway
The project entails the new construction of approximately 55 miles of four-lane divided limited access highway between Petersburg and Suffolk Virginia. Cost estimates
range from $1.0 to $2.47
billion. If the project proceeds, it is expected to do
No $2,432.08 $174.5
9
4 Various totals from Fluor’s $3.18 billion proposal to a $4.505 billion estimate on the HRPDC website.
5 The Fluor Virginia proposal cites up to $693 million in public costs. The Skanska/Washington/BAM (SWB) proposal estimates up to $1.8 billion in public costs.
6 Cambridge Systematics estimate using 2006 VDOT cost estimation guidelines.
7 Costs from the Cintra, Itinere, and VCP proposals from the Virginia PPTA web site http://route460ppta.org/.
8 From VCP proposal.
9 From Cintra proposal.

42
so as a PPTA.
Highway H25 I-95 Widening From 4 to 6 Lanes
From North Carolina State Line to Bus Route 58
Yes $128.4 $25.7
Highway H26 I-95 Widening From 4 to 6 Lanes
From Route 35 to I-295 Yes $76.2 $15.2
Highway H27 I-95 Widening From 6 to 8 Lanes
From Route 656 to Route 54 Yes $51.1 $10.2
Highway H28 I-95 Widening From 6 to 8 Lanes
From Route 54 to Route 30 Yes $30.2 $6.0
Highway H29 I-95 Widening From 6 to 8 Lanes
From Route 30 to Route 207 Yes $66.5 $13.3
Highway H30 I-95 Widening From 6 to 8 Lanes
From Route 207 to Route 608
Yes $210.8 $42.2
Highway H31 I-95 – Add 2 Lane CD Road to Each Direction
From Route 608 to Route 3 Yes $357.9 $71.6
Highway H32 I-95 – Add 3 Lane CD Road to Each Direction
From Route 3 to Route 17 Yes $172.4 $34.5
Highway H33 I-95 – Add 2 Lane CD Road to Each Direction
From Route 17 to Route 610 Yes $684.5 $136.9
Highway H34 I-95 – Add 2 Lane CD Road to Each Direction
From Route 610 to Route 234
Yes $46.7 $9.3
Highway H35 I-95 Add 1 Lane to Each Direction
Route 234 to Route 123 Yes $38.4 $7.7
Highway H35 I-95 – Add 3 Lane Reversible HOT Lanes
From 0.6 miles south of Route 234 to Route 123
Yes $38.5 $3.8
Highway H36 I-95 – Add 3 Lane Reversible HOT Lanes
From Route 123 to I-495 Yes $45.0 $4.5
Highway H37 I-95 Add 1 Lane Each Direction
From Route 123 to Route 644
Yes $162.0 $32.4
Highway H38 I-95 – Add 2 I-495 to Route 613 Yes $17.0 $3.4

43
Lane CD Road to Each Direction
Highway H39 I-95 – Add 2 Lane CD Road to Each Direction Plus HOV Lanes
From Route 613 to Maryland State Line
Yes $235.5 $47.1
Highway H44 U.S. 17 Widening From 4/6 to 8 Lanes
From I-95 to Route 749 Yes $33.0 $6.6
Highway H45 U.S. 17 Widening From 4 to 6 Lanes
From Route 749 to Route 705 South
Yes $22.8 $4.6
Highway H46 U.S. 29 – Add one lane each direction
From Route 17 to Prince William County Line
No $71.6 $14.310
Highway H47 I-66 Widening From 4/6 to 6 Lanes Plus 2 HOV Lanes
From Route 29 to Route 234 Yes $79.7 $15.9
Highway H48 I-66 Widening to 8 Lanes Plus 2 HOV Lanes
From Route 234 to Route 50 East
Yes $144.8 $29.0
Highway H49 I-66 Widening to 8 Lanes Plus 2 HOV Lanes
From Route 50 East to I-495 Yes $155.6 $31.1
10
Cambridge Systematics estimate using 2006 VDOT cost estimation guidelines.

44
Figure 24. Locations of Potential Longer-Term Projects – Statewide
45
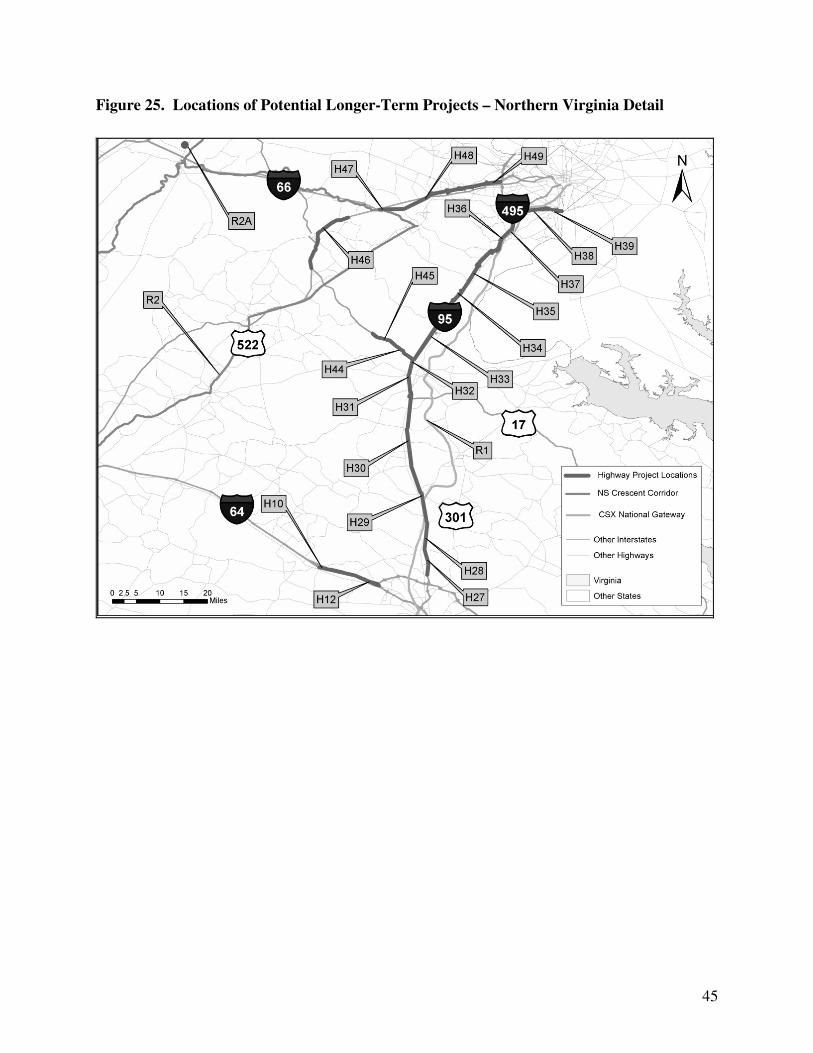
Figure 25. Locations of Potential Longer-Term Projects – Northern Virginia Detail

46
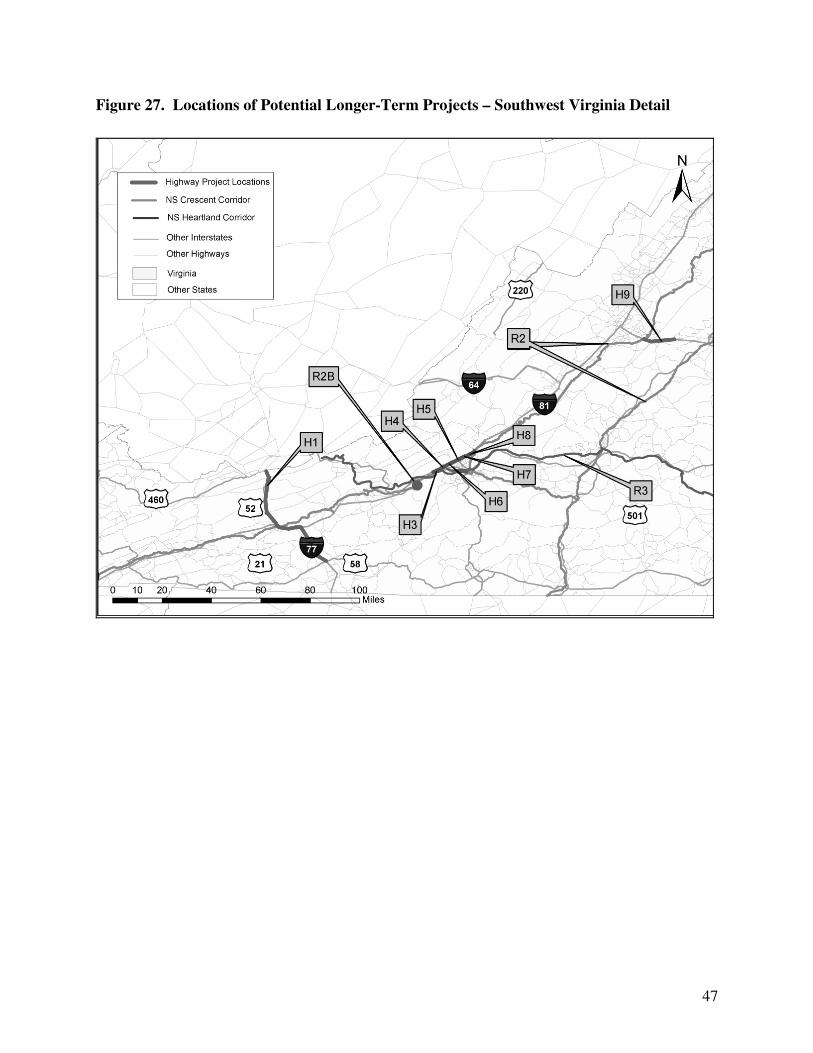
Figure 26. Locations of Potential Longer-Term Projects – Hampton Roads / Richmond
Detail
47
Figure 27. Locations of Potential Longer-Term Projects – Southwest Virginia Detail

48
ATTACHMENT C: POTENTIAL FREIGHT STRATEGIES
The table below lists potential policy options that are not based on expensive
infrastructure investments. They are ideas that may have merit, but each would require further study to determine if they should be pursued by the Commonwealth. The strategies fall roughly into the following areas:
• Business Information and Outreach
• Intelligent Transportation Systems
• Transportation System/Demand Management
• Freight Planning
• Funding
Table 7. Potential Freight Strategies
Strategy Area Strategy Comments
Business Information and Outreach
1. Software Portals to Facilitate Matching Available Loads and Drivers
Advanced dispatch technologies and “backhaul cooperatives” can help reduce the amount of empty (non-loaded) mileage traveled by trucks on Virginia highways.
Business Information and Outreach
2. Software Portals to Enable Exchange of Information on Truck Routes and Other Regulatory Issues
This can improve coordination with the trucking industry, allow the Commonwealth to identify and respond to issues on established truck routes, help identify alternative or new truck routes, obtain feedback on other regulatory issues, and increase overall trucking efficiency.
Business Information and Outreach
3. Carrier Education and Outreach Program to Improve Regulatory Compliance
Increased compliance reduces bottlenecks at inspection stations, enforcement costs for the Commonwealth, wear on roadways and bridges, and incident costs for freight and non-freight users.
Intelligent Transportation Systems
4. Real-Time “5-1-1” Information System for Trucks and Freight Shippers
Real-time information could address incidents and delays, work zone activities, routing recommendations, enforcement and permit requirements, availability of space at rest areas, etc.
Intelligent Transportation Systems
5. Automatic Height Monitoring for Trucks
This technology can increase enforcement efficiency, improve safety, and reduce damage to transportation infrastructure.
Intelligent Transportation Systems
6. Ramp Metering for Limited Access Highways
This strategy can improve the performance of limited access highways in congested areas, by ensuring minimum highway flows are maintained.
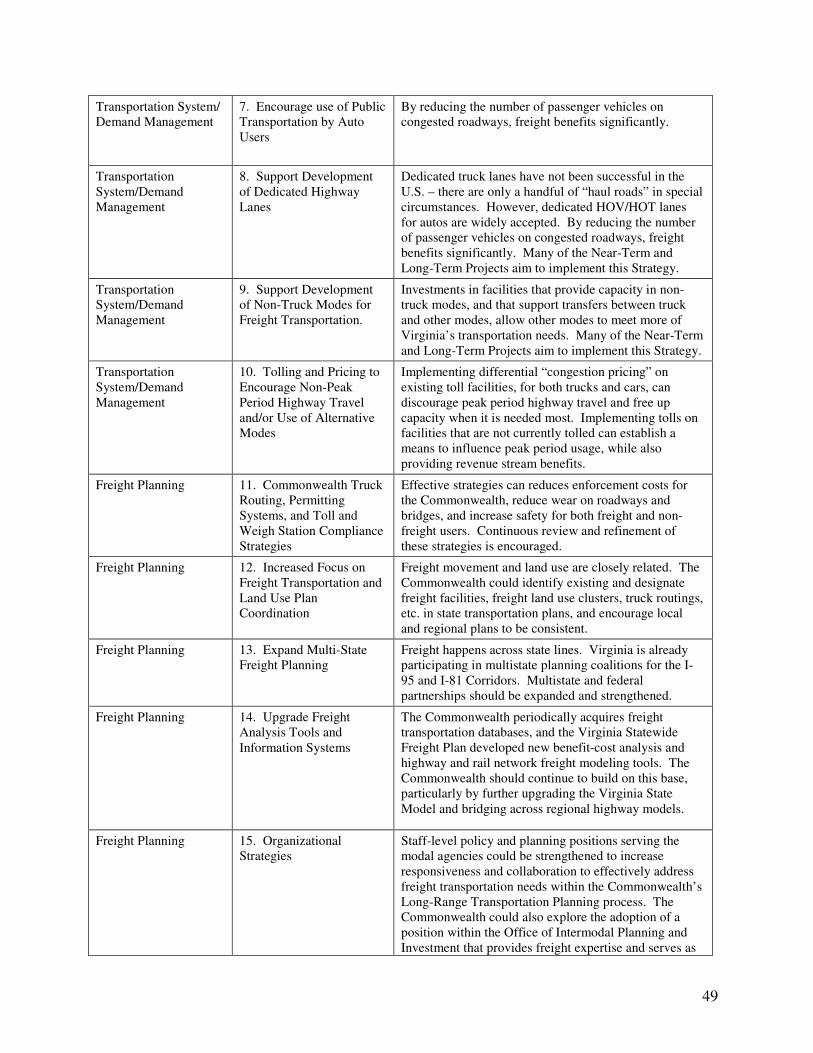
49
Transportation System/ Demand Management
7. Encourage use of Public Transportation by Auto Users
By reducing the number of passenger vehicles on congested roadways, freight benefits significantly.
Transportation System/Demand Management
8. Support Development of Dedicated Highway Lanes
Dedicated truck lanes have not been successful in the U.S. – there are only a handful of “haul roads” in special circumstances. However, dedicated HOV/HOT lanes for autos are widely accepted. By reducing the number of passenger vehicles on congested roadways, freight benefits significantly. Many of the Near-Term and Long-Term Projects aim to implement this Strategy.
Transportation System/Demand Management
9. Support Development of Non-Truck Modes for Freight Transportation.
Investments in facilities that provide capacity in non-truck modes, and that support transfers between truck and other modes, allow other modes to meet more of Virginia’s transportation needs. Many of the Near-Term and Long-Term Projects aim to implement this Strategy.
Transportation System/Demand Management
10. Tolling and Pricing to Encourage Non-Peak Period Highway Travel and/or Use of Alternative Modes
Implementing differential “congestion pricing” on existing toll facilities, for both trucks and cars, can discourage peak period highway travel and free up capacity when it is needed most. Implementing tolls on facilities that are not currently tolled can establish a means to influence peak period usage, while also providing revenue stream benefits.
Freight Planning 11. Commonwealth Truck Routing, Permitting Systems, and Toll and Weigh Station Compliance Strategies
Effective strategies can reduces enforcement costs for the Commonwealth, reduce wear on roadways and bridges, and increase safety for both freight and non-freight users. Continuous review and refinement of these strategies is encouraged.
Freight Planning 12. Increased Focus on Freight Transportation and Land Use Plan Coordination
Freight movement and land use are closely related. The Commonwealth could identify existing and designate freight facilities, freight land use clusters, truck routings, etc. in state transportation plans, and encourage local and regional plans to be consistent.
Freight Planning 13. Expand Multi-State Freight Planning
Freight happens across state lines. Virginia is already participating in multistate planning coalitions for the I-95 and I-81 Corridors. Multistate and federal partnerships should be expanded and strengthened.
Freight Planning 14. Upgrade Freight Analysis Tools and Information Systems
The Commonwealth periodically acquires freight transportation databases, and the Virginia Statewide Freight Plan developed new benefit-cost analysis and highway and rail network freight modeling tools. The Commonwealth should continue to build on this base, particularly by further upgrading the Virginia State Model and bridging across regional highway models.
Freight Planning 15. Organizational Strategies
Staff-level policy and planning positions serving the modal agencies could be strengthened to increase responsiveness and collaboration to effectively address freight transportation needs within the Commonwealth’s Long-Range Transportation Planning process. The Commonwealth could also explore the adoption of a position within the Office of Intermodal Planning and Investment that provides freight expertise and serves as

50
a freight champion to ensure the consideration of freight needs in the Commonwealth Transportation Program and to administrate the collaborative effort shared by the Commonwealth‘s Transportation Agencies on freight transportation policy, planning and programming, as well as a spokesperson with freight industry partners.
Funding 16. Identify New Funding Sources and Strategies
Clearly, new funding sources will be needed to ensure completion of the Virginia Multimodal Freight Program. Options include: expanded user fees (highway tolling and pricing, tenant revenues, gate fees and facility charges, etc.); expanded PPTA opportunities; increasing the motor fuel tax; alternatives to the motor fuel tax such as a VMT-based tax; multistate funding compacts; improved federal grant and loan utilization; and other options. Each source has pros and cons, and consideration of these options will need to be a continuing long-term effort.
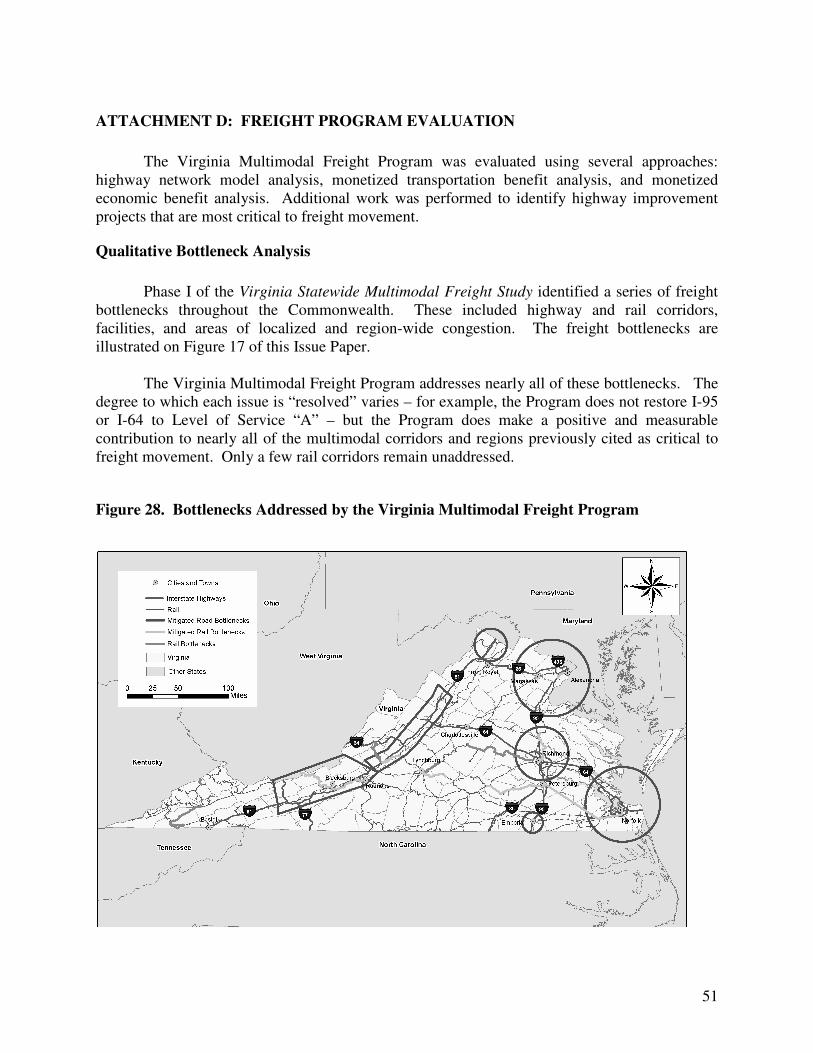
51
ATTACHMENT D: FREIGHT PROGRAM EVALUATION
The Virginia Multimodal Freight Program was evaluated using several approaches:
highway network model analysis, monetized transportation benefit analysis, and monetized economic benefit analysis. Additional work was performed to identify highway improvement projects that are most critical to freight movement.
Qualitative Bottleneck Analysis
Phase I of the Virginia Statewide Multimodal Freight Study identified a series of freight
bottlenecks throughout the Commonwealth. These included highway and rail corridors, facilities, and areas of localized and region-wide congestion. The freight bottlenecks are illustrated on Figure 17 of this Issue Paper.
The Virginia Multimodal Freight Program addresses nearly all of these bottlenecks. The degree to which each issue is “resolved” varies – for example, the Program does not restore I-95 or I-64 to Level of Service “A” – but the Program does make a positive and measurable contribution to nearly all of the multimodal corridors and regions previously cited as critical to freight movement. Only a few rail corridors remain unaddressed.
Figure 28. Bottlenecks Addressed by the Virginia Multimodal Freight Program

52
Figure 29. Remaining Bottlenecks Not Addressed
Highway Network Model Analysis
CS developed an upgraded version of the Virginia State Model (VSM). Each of the
major projects and strategies in the Program was coded into the model, to the extent permitted by the model’s level of geographic detail (it is designed for large-scale corridors, not local projects) and our ability to anticipate the likely effects of multimodal improvements and potential strategies. The Freight Program alternative was then tested against a No Action alternative (representing the current system) using year 2035 traffic levels.
The VSM did not allow for accurate estimation of truck travel times or link level of service (total vehicle volumes divided by total link capacity) due to the erratic behavior of automobile traffic and external truck trips within the model; these issues will need to be addressed in future VSM upgrades. However, it was possible to derive two important metrics: a “Freight Congestion Index,” and total truck VMT. These were estimated for eleven designated Virginia multimodal corridors, individually and cumulatively.
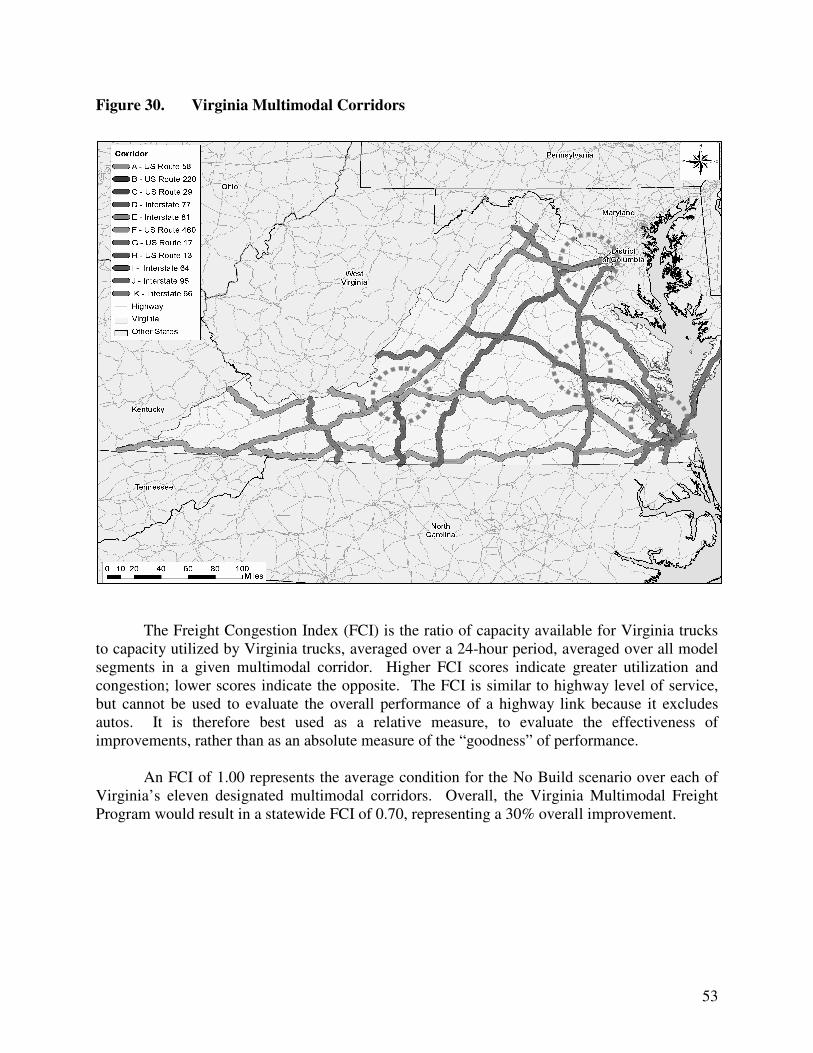
53
Figure 30. Virginia Multimodal Corridors
The Freight Congestion Index (FCI) is the ratio of capacity available for Virginia trucks to capacity utilized by Virginia trucks, averaged over a 24-hour period, averaged over all model segments in a given multimodal corridor. Higher FCI scores indicate greater utilization and congestion; lower scores indicate the opposite. The FCI is similar to highway level of service, but cannot be used to evaluate the overall performance of a highway link because it excludes autos. It is therefore best used as a relative measure, to evaluate the effectiveness of improvements, rather than as an absolute measure of the “goodness” of performance.
An FCI of 1.00 represents the average condition for the No Build scenario over each of
Virginia’s eleven designated multimodal corridors. Overall, the Virginia Multimodal Freight Program would result in a statewide FCI of 0.70, representing a 30% overall improvement.

54
Figure 31. Freight Congestion Index, Freight Program versus No Action, Averaged
Over All Virginia Multimodal Corridors
0.0 0.2 0.4 0.6 0.8 1.0 1.2
No Build
Freight Program
Freight Congestion Index
Looking at the FCI results by individual corridor reveals two pieces of information: first, the magnitude of anticipated freight congestion averaged over an entire corridor; and second, the anticipated effectiveness of Freight Program improvements.
From the following table, we see that the highest FCI score is associated with I-81,
followed by I-95 and I-77. This would be expected, given that these routes have the highest truck volumes and percentages in the state, and that truck volumes are relatively consistent over the entire length of these routes.
The FCI score for I-64 is lower than for I-77, because the high truck volumes experienced
in the Hampton Roads area are offset by the lower truck volumes west of Richmond; remember that the FCI is an average over the entire corridor. The FCI scores for US 460 and US 58 also reflect the balance between high-volume and low-volume truck segments over these corridors.
The effectiveness of Freight Program improvements in improving FCI scores varies by
corridor, but is significant, especially on major truck routes – 33% on I-81, 33% on I-95, 30% on I-77, and 25% on I-64.

55
Figure 32. Freight Congestion Index, Freight Program versus No Action, By Individual
Multimodal Corridor
0 0.5 1 1.5 2 2.5 3 3.5 4
I-81
I-95
I-77
US 13
I-64
US 29
US 220
I-66
US 460
US 17
US 58
Freight Congestion Index
No-Build Freight Program
The analysis of truck VMT is equally interesting. The VSM has a base year of 2005; the base year VMT, recalibrated to actual counts for year 2005, is 12.2 million truck VMT per day over all eleven multimodal corridors. This is projected to double to 25.3 million truck VMT per day in 2035 under the No Action alternative. Under the Freight Program alternative, truck VMT grows to 20.1 million truck VMT per day in 2035 – which still represents significant growth, but also saves around 5.1 million truck VMT per day compared to No Action, an improvement of 20%. This is due to the combined effects of:
• Truck to rail diversion from the Crescent Corridor, National Gateway, Short Haul Rail, and other rail projects. These projects reduce truck VMT on I-95, I-95, I-77, I-85, I-66, I-64, US 460/US 58 and other routes.
• Truck to barge diversion from expansion of Marine Highway services, which reduces truck VMT on I-64 and I-95.
• Redistribution of east coast pass-through truck trips that currently use I-81 (to avoid metropolitan congestion) to I-95 (which is a shorter path through Virginia).

56
Improvement of seaport and aviation facilities leads to increased travel demand to and from these facilities, which is partially but not completely offset by truck to rail and truck to barge diversion. This is reflected in the results. However, improvements to these facilities also mean less reliance on out-of-state facilities, preventing significant additional truck VMT from appearing on the network.
Monetized Transportation Benefit Analysis
CS utilized a preliminary version of the Multimodal Freight Benefit-Cost tool currently
under development for the Commonwealth to quantify the dollar value of reduced VMT. Between 2009 and 2035, the anticipated VMT reduction produces a discounted
cumulative savings of $1.3 billion in avoided pavement maintenance costs, $1.7 billion in avoided crash-related costs, and $1.7 billion in avoided emissions costs (after adjusting for increased emissions in modes that substitute for truck). The calculations themselves are simple, although the work involved in developing and validating the per-unit factors was extremely time-consuming.
Table 8. Selected Monetized Transportation Benefits, Year 2035
Pavement
Maintenance
Costs Avoided
Crash-Related Costs
Avoided
Social Costs of Engine
Emissions (Carbon, NOx, and
Particulate Matter) Avoided
VMT avoided/day 5.1 million
$ value per avoided VMT $0.0870 Source: Virginia Transportation Research Council
$0.1117 Source: CS benefit-cost analysis of NS Crescent Corridor proposal
$0.1124 Source: CS benefit-cost analysis of NS Crescent Corridor proposal
Value per day $443,700 $569,670 $573,240
Value for year 2035 $161,950,500 $207,929,550 $209,232,600
Cumulative value from 2009 through 2035, not discounted
$2,186,331,750 $2,807,048,925 $2,824,640,100
Cumulative value from 2009 through 2035, discounted at 3%/year
$1,300,516,704 $1,669,743,860 $1,680,207,788
This is by no means a comprehensive or rigorous analysis, and it omits many potential benefit factors of interest to analysts. But it does clearly illustrate that reductions in truck VMT produce meaningful transportation system benefits, and that the cost of making transportation system investments that reduce truck VMT will, to a large extent, pay for themselves out of other savings to the Commonwealth. Each individual project, of course, must be evaluated individually to ensure that investments are targeted to derive the highest return on investment for the Commonwealth.
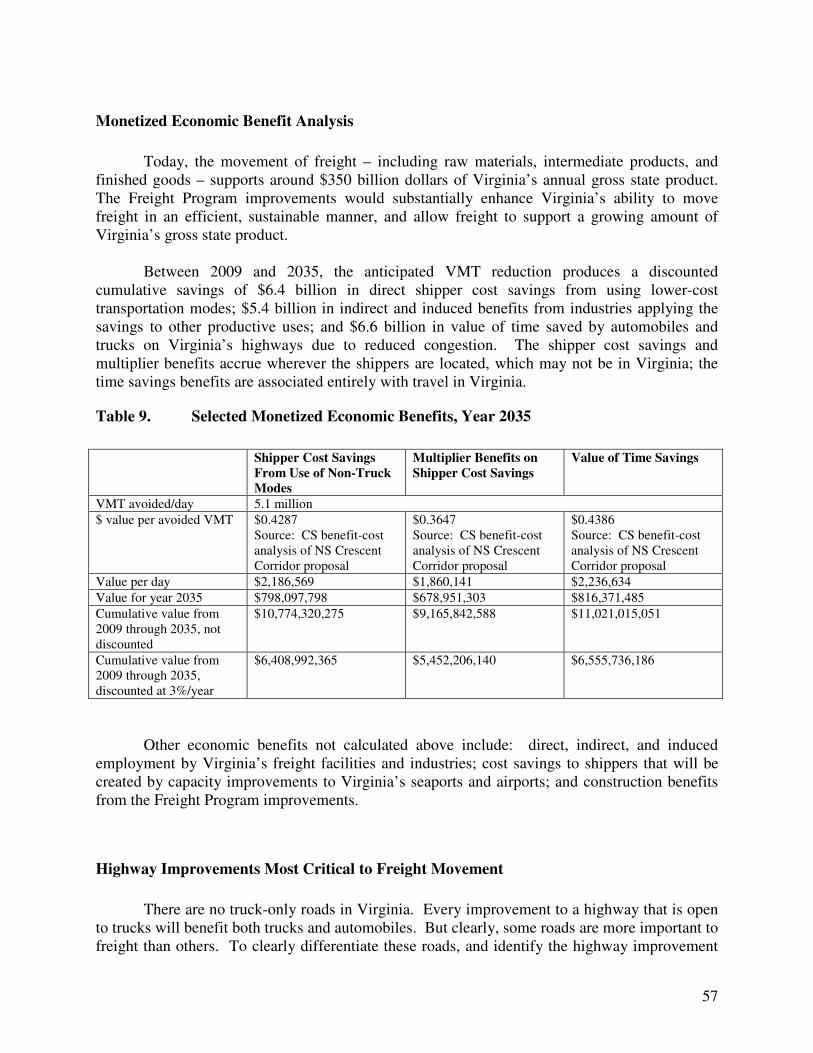
57
Monetized Economic Benefit Analysis
Today, the movement of freight – including raw materials, intermediate products, and
finished goods – supports around $350 billion dollars of Virginia’s annual gross state product. The Freight Program improvements would substantially enhance Virginia’s ability to move freight in an efficient, sustainable manner, and allow freight to support a growing amount of Virginia’s gross state product.
Between 2009 and 2035, the anticipated VMT reduction produces a discounted cumulative savings of $6.4 billion in direct shipper cost savings from using lower-cost transportation modes; $5.4 billion in indirect and induced benefits from industries applying the savings to other productive uses; and $6.6 billion in value of time saved by automobiles and trucks on Virginia’s highways due to reduced congestion. The shipper cost savings and multiplier benefits accrue wherever the shippers are located, which may not be in Virginia; the time savings benefits are associated entirely with travel in Virginia.
Table 9. Selected Monetized Economic Benefits, Year 2035
Shipper Cost Savings
From Use of Non-Truck
Modes
Multiplier Benefits on
Shipper Cost Savings
Value of Time Savings
VMT avoided/day 5.1 million
$ value per avoided VMT $0.4287 Source: CS benefit-cost analysis of NS Crescent Corridor proposal
$0.3647 Source: CS benefit-cost analysis of NS Crescent Corridor proposal
$0.4386 Source: CS benefit-cost analysis of NS Crescent Corridor proposal
Value per day $2,186,569 $1,860,141 $2,236,634
Value for year 2035 $798,097,798 $678,951,303 $816,371,485
Cumulative value from 2009 through 2035, not discounted
$10,774,320,275 $9,165,842,588 $11,021,015,051
Cumulative value from 2009 through 2035, discounted at 3%/year
$6,408,992,365 $5,452,206,140 $6,555,736,186
Other economic benefits not calculated above include: direct, indirect, and induced employment by Virginia’s freight facilities and industries; cost savings to shippers that will be created by capacity improvements to Virginia’s seaports and airports; and construction benefits from the Freight Program improvements.
Highway Improvements Most Critical to Freight Movement
There are no truck-only roads in Virginia. Every improvement to a highway that is open
to trucks will benefit both trucks and automobiles. But clearly, some roads are more important to freight than others. To clearly differentiate these roads, and identify the highway improvement

58
projects that should be considered critical elements of the Multimodal Freight Program, additional analysis steps were undertaken.
• First, the initial highway project list was compiled from the Virginia six-year improvement program, the Virginia 2025 State Highway Plan, and a list of potential additional projects developed by CS and informed by long-range transportation plans for the Hampton Roads, Tri-Cities, Roanoke, and Northern Virginia regions.
• Second, each of these highway projects was classified as having high, medium, or low freight benefit based on the percentage of truck traffic and total number of trucks on a given section of roadway and the total number.
The percentage of truck traffic, or “freight share,” was estimated using for the projects classified as having high freight benefit. Since trucks are larger and less maneuverable than passenger cars, each truck consumes proportionally more of the overall benefit of the project. The Highway Capacity Manual (HCM) describes trucks as having Passenger Car Equivalents (PCE) based on the terrain of the roadway. On level terrain a truck is equal to 1.5 PCEs. On rolling terrain a truck is equal to 2.4 PCEs, and in mountainous terrain it is equal to 4.5 PCEs. Using VDOT-provided truck percent data and sample data from the Highway Performance Monitoring System (HPMS), truck percentage figures were converted to a corresponding “freight share” figure for the physical extent of an improvement project. The tables below summarize the “freight share” rankings for the Programmed Near-Term Projects and Potential Long-Term Projects ranked as “high.”
Table 10. Freight Share of High Ranking Near-Term Highway Projects
Map
Location
Name Description Freight Share
(PCE method)
Average Truck
Volumes
H2 I-81 Southbound Climbing Lanes
From milepost 119 to milepost 128. (UPC 84117)
66.20% 11,630
H3 I-81 Northbound Climbing Lanes
From 0.43 miles north of Route 641 (MP 135.9) to 0.20 miles north of Route 635 (MP 138.6). (UPC 84363)
60.11% 12,938
H3 I-81 Widening From 4 to 8 Lanes
From 0.05 miles north of Route 641 (MP 135.9) to 0.88 miles north of Route 635 (MP 138.65). (UPC 16591)
30.62% 11,860
H4 I-81 Widening From 4 to 8 Lanes
From 0.20 miles north of Route 635 (MP 138.6) to 0.75 miles north of Route 311 (MP 140.9 (UPC 53094)
28.51% 11,468
H5 I-81 Widening From 4 to 8 Lanes
From 0.75 miles north of Route 311 (MP 140.9) to 0.79 miles south of I-581 (MP 143.1). (UPC 53095)
26.42% 11,838
H6 I-81 Widening From 4 to 8 Lanes
From 0.79 miles south of I-581 (MP 143.1) to 0.88 miles north of I-581 (MP 144.5). (UPC 53096)
28.30% 11,734
H7 I-81 Widening From 4 to 8 Lanes
From 0.88 miles north of I-581 (MP 144.5) to 0.28 miles south of Route 648 (MP 147.5 (UPC 16593)
28.30% 11,249
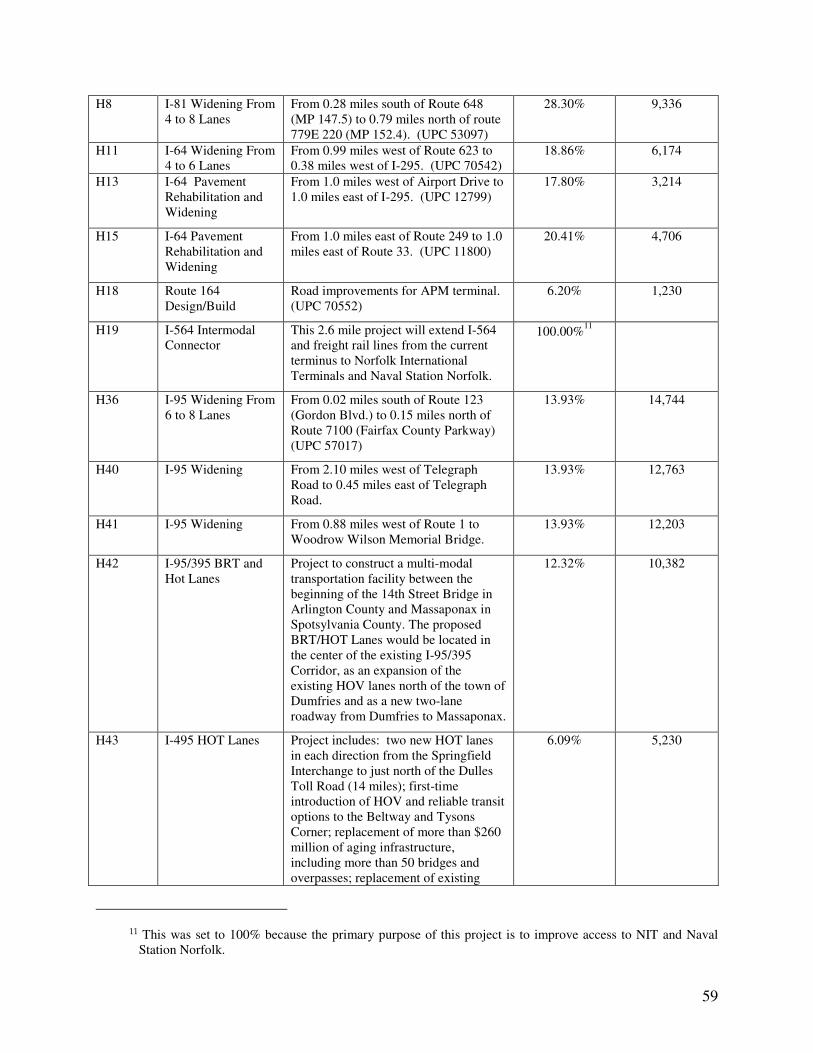
59
H8 I-81 Widening From 4 to 8 Lanes
From 0.28 miles south of Route 648 (MP 147.5) to 0.79 miles north of route 779E 220 (MP 152.4). (UPC 53097)
28.30% 9,336
H11 I-64 Widening From 4 to 6 Lanes
From 0.99 miles west of Route 623 to 0.38 miles west of I-295. (UPC 70542)
18.86% 6,174
H13 I-64 Pavement Rehabilitation and Widening
From 1.0 miles west of Airport Drive to 1.0 miles east of I-295. (UPC 12799)
17.80% 3,214
H15 I-64 Pavement Rehabilitation and Widening
From 1.0 miles east of Route 249 to 1.0 miles east of Route 33. (UPC 11800)
20.41% 4,706
H18 Route 164 Design/Build
Road improvements for APM terminal. (UPC 70552)
6.20% 1,230
H19 I-564 Intermodal Connector
This 2.6 mile project will extend I-564 and freight rail lines from the current terminus to Norfolk International Terminals and Naval Station Norfolk.
100.00%11
H36 I-95 Widening From 6 to 8 Lanes
From 0.02 miles south of Route 123 (Gordon Blvd.) to 0.15 miles north of Route 7100 (Fairfax County Parkway) (UPC 57017)
13.93% 14,744
H40 I-95 Widening From 2.10 miles west of Telegraph Road to 0.45 miles east of Telegraph Road.
13.93% 12,763
H41 I-95 Widening From 0.88 miles west of Route 1 to Woodrow Wilson Memorial Bridge.
13.93% 12,203
H42 I-95/395 BRT and Hot Lanes
Project to construct a multi-modal transportation facility between the beginning of the 14th Street Bridge in Arlington County and Massaponax in Spotsylvania County. The proposed BRT/HOT Lanes would be located in the center of the existing I-95/395 Corridor, as an expansion of the existing HOV lanes north of the town of Dumfries and as a new two-lane roadway from Dumfries to Massaponax.
12.32% 10,382
H43 I-495 HOT Lanes Project includes: two new HOT lanes in each direction from the Springfield Interchange to just north of the Dulles Toll Road (14 miles); first-time introduction of HOV and reliable transit options to the Beltway and Tysons Corner; replacement of more than $260 million of aging infrastructure, including more than 50 bridges and overpasses; replacement of existing
6.09% 5,230
11 This was set to 100% because the primary purpose of this project is to improve access to NIT and Naval Station Norfolk.

60
soundwalls and construction of new soundwalls to double existing noise reduction tools for surrounding neighborhoods; construction of carpool ramps connecting I-95 with the Beltway to create a seamless HOV network. Upgrades to 12 key interchanges and new access points at Merrifield and Tysons Corner.
Table 11. Freight Share of High Ranking Potential Longer-Term Highway Projects
Map
Location
Name Description Freight Share
(PCE method)
Average Truck
Volumes
77 Climbing Lanes Add truck climbing lanes in select locations from the eastbound ramp of Route 58 to the West Virginia State Line
58.07% 7,669
H3 I-81 Widening From 4 to 8 Lanes
From 0.05 miles north of Route 641 (MP 135.9) to 0.88 miles north of Route 635 (MP 138.65).
30.62% 11,860
H4 I-81 Widening From 4 to 8 Lanes
From 0.20 miles north of Route 635 (MP 138.6) to 0.75 miles north of Route 311 (MP 140.9).
28.51% 11,468
H5 I-81 Widening From 4 to 8 Lanes
From 0.75 miles north of Route 311 (MP 140.9) to 0.79 miles south of I-581 (MP 143.1).
26.42% 11,838
H6 I-81 Widening From 4 to 8 Lanes
From 0.79 miles south of I-581 (MP 143.1) to 0.88 miles north of I-581 (MP 144.5).
28.30% 11,734
H7 I-81 Widening From 4 to 8 Lanes
From 0.88 miles north of I-581 (MP 144.5) to 0.28 miles south of Route 648 (MP 147.5).
28.30% 11,249
H8 I-81 Widening From 4 to 8 Lanes
From 0.28 miles south of Route 648 (MP 147.5) to 0.79 miles north of route 779E 220 (MP 152.4).
28.30% 9,336
H9 I-64 Afton Mountain Climbing Lanes
From east city line of Waynesboro to Route 250
31.28% 3,241
H10 I-64 Widening From 4 to 6 Lanes
From Route 617 to eastbound Route 288 on-ramp
24.66% 4,590
H12 I-64 Widening from 4 to 8 Lanes
From eastbound Route 288 on-ramp to I-295
17.10% 6,707

61
H13 I-64 Pavement Rehabilitation and Widening
From 1.0 miles west of Airport Drive to 1.0 miles east of I-295.
17.80% 3,214
H14 I-64 Widening From 4 to 8 Lanes
From I-295 to Route 33 westbound
15.36% 5,529
H15 I-64 Pavement Rehabilitation and Widening
From 1.0 miles east of Route 249 to Route 199 / Newman Road.
17.84% 4,632
H16 I-64 Widening From 4 to 6 Lanes Plus 2 HOV Lanes
From Route 199 to Fort Eustis Blvd.
11.74% 4,136
H17 I-64 Widening From 4 to 6 Lanes Plus 2 HOV Lanes
From I-464 to I-264 / I-664 12.52% 4,268
H20 Hampton Roads Third Crossing
The project was initiated to relieve congestion at the I-64 Hampton Roads Bridge Tunnel and other transportation facilities in the Hampton Roads region. The project is envisioned to carry vehicles, light and heavy passenger rail, and would significantly upgrade access to VPA.
10.95%12
3,406
H21 U.S. 460 – Add 1 Lane To Each Direction
From Suffolk Bypass to I-264
11.86% 4,575
H22 U.S. 460 Widening From 4 to 6 Lanes
From Kings Fork Road to Suffolk Bypass
26.17% 3,821
H23 U.S. 58 Widening From 4 to 6 Lanes
From Manning Bridge Road to Suffolk Bypass
21.14% 4,498
H24 U.S. 460 Expressway The project entails the new construction of approximately 55 miles of four-lane divided limited access highway between Petersburg and Suffolk Virginia. Cost estimates range from $1.0 to $2.5 billion. If the project proceeds, it is expected to do so as a PPTA.
26.17% 2,223
H25 I-95 Widening From 4 to 6 Lanes
From North Carolina State Line to Bus Route 58
35.91% 6,668
H26 I-95 Widening From 4 to 6 Lanes
From Route 35 to I-295 22.75% 5,982
H27 I-95 Widening From 6 to 8 Lanes
From Route 656 to Route 54
21.92% 15,086
12 Used HRBT AADT data for truck percentage data as proxy.
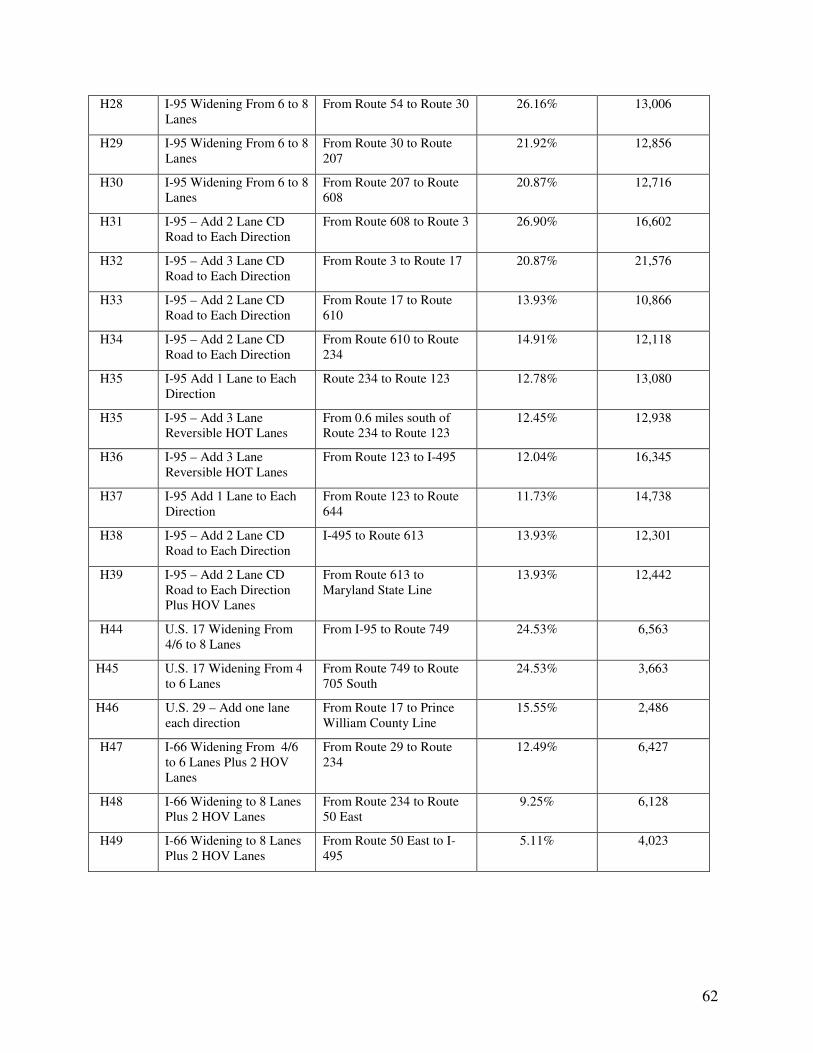
62
H28 I-95 Widening From 6 to 8 Lanes
From Route 54 to Route 30 26.16% 13,006
H29 I-95 Widening From 6 to 8 Lanes
From Route 30 to Route 207
21.92% 12,856
H30 I-95 Widening From 6 to 8 Lanes
From Route 207 to Route 608
20.87% 12,716
H31 I-95 – Add 2 Lane CD Road to Each Direction
From Route 608 to Route 3 26.90% 16,602
H32 I-95 – Add 3 Lane CD Road to Each Direction
From Route 3 to Route 17 20.87% 21,576
H33 I-95 – Add 2 Lane CD Road to Each Direction
From Route 17 to Route 610
13.93% 10,866
H34 I-95 – Add 2 Lane CD Road to Each Direction
From Route 610 to Route 234
14.91% 12,118
H35 I-95 Add 1 Lane to Each Direction
Route 234 to Route 123 12.78% 13,080
H35 I-95 – Add 3 Lane Reversible HOT Lanes
From 0.6 miles south of Route 234 to Route 123
12.45% 12,938
H36 I-95 – Add 3 Lane Reversible HOT Lanes
From Route 123 to I-495 12.04% 16,345
H37 I-95 Add 1 Lane to Each Direction
From Route 123 to Route 644
11.73% 14,738
H38 I-95 – Add 2 Lane CD Road to Each Direction
I-495 to Route 613 13.93% 12,301
H39 I-95 – Add 2 Lane CD Road to Each Direction Plus HOV Lanes
From Route 613 to Maryland State Line
13.93% 12,442
H44 U.S. 17 Widening From 4/6 to 8 Lanes
From I-95 to Route 749 24.53% 6,563
H45 U.S. 17 Widening From 4 to 6 Lanes
From Route 749 to Route 705 South
24.53% 3,663
H46 U.S. 29 – Add one lane each direction
From Route 17 to Prince William County Line
15.55% 2,486
H47 I-66 Widening From 4/6 to 6 Lanes Plus 2 HOV Lanes
From Route 29 to Route 234
12.49% 6,427
H48 I-66 Widening to 8 Lanes Plus 2 HOV Lanes
From Route 234 to Route 50 East
9.25% 6,128
H49 I-66 Widening to 8 Lanes Plus 2 HOV Lanes
From Route 50 East to I-495
5.11% 4,023