the teaching of the concepts of statistical tests the teaching of the concepts of statistical tests...
TRANSCRIPT
•
.'
THE TEACHING OF THE CONCEPTS OF STATISTICAL TESTSOF HYPOTHESES TO NON-STATISTICIANS
by
Shrikant I. Bangdiwala
Department of BiostatisticsUniversity of North Carolina at Chapel Hill
Institute of Statistics Mimeo Series No. 1427
•
"
1
The Teaching of the Concepts of Statistical Testsof Hypotheses to Non-statisticians
byShrikant I. Bangdiwala
University of North CarolinaChapel Hill, NC 27514
Abstract
The logic underlying the formulation of statistical tests of
hypotheses is counterintuitive for the non-statistician, e.g., to test
whether two treatments are significantly different, why assume they
are equal? When introducing the topic of hypothesis testing, it is
easy to present the formal framework for the testing procedure without
explaining the logic behind it. In courses for statisticians, one
relies on the understanding of probability concepts as a foundation
for understanding statistical inference, but in courses taught to
non-statisticians where there is minimal discussion of probability,
explanations must be based on concepts the students can readily
understand. The method proposed here for teaching the concept of
hypothesis testing makes an analogy to the American judicial system,
whereby a person is assumed innocent until proven guilty. Analogies
for the different elements of statistical tests are presented and
discussed, together with a classroom framework for discussion of
statistical tests.
Key words
Statistical tests of hypothesisAmerican Judicial system
2
The Teaching of the Concepts of Statistical Testsof Hypotheses to Non-statisticians
1. Introduction
The widespread utilization of statistics in various disciplines
as well as in everyday life has prompted a growing number of
university departments to require their graduate and even
undergraduate students to take at least an introductory course
in basic statistical methods. When the required expertise in
statistics is unavailable within the department, the responsibility
for such instruction falls on the institution's statistics and
biostatistics departments and their so-called "service courses."
These courses are not intended to breed new statisticians, and often
will be the only classroom exposure these students will have to the
concepts of statistics.
Teaching such introductory courses to non-statisticians poses a
challenge to instructors over and above the usual problems inherent in
teaching. Besides being conducted in typically large classroom
settings, students in these courses are often deficient in their
mathematical background, and in some extreme cases, they may even
experience some form of "math anxiety." Thus the statistician
teaching the course is not only unable to use the elegant probability
proofs of statistical theory that excite mathematically-oriented
students, but must also cope with students having a psychological
aversion to mathematics. Often the students are required to accept
the statistical results on faith, leaving them with both a feeling of
inferiority and of missing the relevance of the concept. The
course needs to be taught at a level that reflects the students'
•
•

,
3
mathematical capabilities, but at the same time keeping in mind that
the students are high achievers in their respective fields. The
students' needs vary; some will require an understanding of the
concepts behind the problem-solving, while' others will be concerned
with correctly solving the problem without necessarily understanding
what they are doing. The goal of an introductory course in such a
situation should be to impart to the students a general knowledge of
what statistics are and what their purpose is, and an understanding of
commonly used statistical terminology. The students must realize that
they are obtaining a limited exposure to a vast field and that just
like other specialized professionals, statisticians are to be
consulted in all stages of research projects. Students should not
emerge from this course thinking that they are statisticians, but
instead be able to critically read reports and articles that contain
statistical problems in their own fields, as well as be able to
intelligently interact with a statistician. The students are viewed
as "consumers" of statistics and therefore, we the teachers, become the
"sellers" of statistics. It is essential that a good impression of the
"product" be made and a sense of professionalism demonstrated.
A common pitfall of situations mentioned above is to teach the
course using the principle of "you need to do it to understand it."
Students are subjected to tedious calculations from which they are
supposed to derive a conceptual understanding of the principles behind
the problem. At the other extreme, the teaching of concepts without
problem solving might lead to boring lectures that need to be made
appealing with examples from the literature as well as applications
from everyday life. A happy medium is desirable. Students who are
4
unable to think quantitatively have had unsuccessful experiences with
manipulative aspects of mathematical thinking. which are often overly
emphasized in courses. If concepts are carefully and logically
developed. these same students might comprehend quantitative concepts
and hopefully even be able to perform simple quantitative
manipulations [Phillips (1982)].
This paper ,will focus on the practical issues relating to how to
teach the statistical concept of hypothesis testing in a service
course setting with the considerations mentioned above in mind.
2. Statistical tests of hypotheses
Due to the exposure students receive to statistical inference in
the form of t-tests. chi-squared tests. p-values. and the like, it is
important in an introductory course to have the students fully
understand the concepts of statistical testing. The first concept to
get across is that there is a uniform framework that encompasses all
statistical tests no matter what the partiollar field of research
(Figure 1). To achieve familiarity with performing statistical tests.
memorization of such a framework is meaningless, but an understanding
of each phase is essential. However, statistical tests are difficult
to explain because their logic is contrary to normal everyday logic;
it is based on indirect proof rather than direct proof with which
students are familiar. In a direct proof. a hypothesis is formulated
and following the scientific method, an investigation or an experiment
is conducted to confirm or reject the hypothesis. When probability
and chance processes come into play. the scientific roethod is still
followed but because of sampling variability, the hypothesis
formulation and proof follow an unfamiliar logic --the indirect proof.
,
•
5
In addition, the single hypothesis of interest is converted to a set
of null and alternative hypotheses. The logic of the proof is to
assume that the null hypothesis is true and see if the information
obtained in the sample is probable given that assumption. It is hoped
that under the null hypothesis the probability of observing the sample
is small, and therefore the null hypothesis is rejected in favor of
the alternative hypothesis. In fact, one of the hardest aspects of
statistical tests for students to comprehend is the reason for
formulating the set of two hypotheses when one really wants to test
only one. More puzzling to the students is that one assumes the null
hypothesis is true but really hopes to prove that it is not true. The
choice of null and alternative hypotheses is not immediately clear to
the non-statistician, and a typical explanation such as the null
hypothesis is the "status-quo" or "the no difference case" often
leaves the students perplexed.
A conceptual approach originally preseated by Feinberg (1971)
draws an analogy between statistical testing and the American judicial
process. Feinberg restricted his presentation to the Type I and II
errors and examined the probability distributions of what he called an
"ability to defend innocence" variable. I wish to depart from the
probability-based approach for the introductory level course and to
extend the analogy to cover the entire framework of a statistical test
(Figure 1). The familiarity of students with the judicial process
enables them to comprehend the concepts of statistical hypothesis
testing.
3. Judicial Process Analog
The concept of hypothesis testing can be related to the lawyer's

6
courtroom setting. If a person is accused of committing a crime, the
suspect is brought to trial where that person's guilt is investigated
(tested). Non-suspects are not brought to trial. The accused is
either guilty or not guilty, a clear-cut decision. However, the guilt
of the accused cannot be known for sure and examination of the
evidence is required. Now, the courts and the judicial system assume
that the accused is innocent until proven guilty, that is, until
sufficient evidence is found to reject his innocence. The values and
merit of the evidence is judged by a jury or the judge. A perfect
parallel can be drawn between statistical testing and the courtroom
setting. Figure 2 presents a schematic analogy of each component of
the framework of a statistical test with the corresponding concept in
the judicial process.
The definition and choice of null (HQ) and alternative (HA)
hypotheses is better explained to the students by way of the judicial
process analog. The HA is simply the claim or accusation being made
and HO is the plea of innocence. Take, for example, the test of the
hypothesis that the average height of men (~) in the United States is
greater than the average height of men in Europe. The claim that has
been made is that ~(U.S. men) > ~(European men). This becomes our
alternative hypothesis. Clearly there is no predetermined reason for
the average heights to differ, so the null hypothesis is that they are
the same, the innocence case. The evidence that will be judged or
examined to test the claim is the sample and appropriate random
variables computed from the sample. The level of significance (a) of
a statistical test is usually described as the risk one is willing to
assume of falsely rejecting HO. Here lies one of the strong
•

•
7
advantages of the judicial process analog. The concept of wanting a
to be held small is better understood, since now it is the chance of
stating that the accused is guilty when in fact he/she is innocent •
Firm in the public's mind is the mandate that the judicial system
should not punish innocent people. If, for example, a = .05 is
chosen, then five out of 100 innocent people given the same evidence
can be expected to be found guilty by the system. If this is thought
unfair, a = .01 can be chosen, so that only lout of 100 innocent
people on the average is unjustly convicted. It is understood that
the system is not perfect and some innocents will be punished, but we
want the probability of this happening to be small. On the other
hand, if no one is declared guilty by the system, individuals will go
free who are actually guilty. The statistical concept of power is
easily introduced as the ability of the sytem to find guilty the real
criminals.
The next step in conducting the test of the hypothesis is to look
at how the sample is to be utilized. The quantity and type of evidence
available in a courtroom setting determines how a decision is to be
arrived at, in a similar manner as a statistician determines what
appropriate test is to be used to examine the hypothesis given the
type of data collected and the sampling techniques utiliz~d. The
beauty of statistics is that there is a probabiity framework that
enables the decision to be arrived at in an objective manner, parallel
to the subjective process undergone by a judge or a jury in evaluating
the evidence. At this point one can delve into the probabilities of
Type I and II errors such as in Feinberg (1971). However, for an
introductory course when probability theory is de-emphasized, this

8
discussion is often confusing. It should be kept in mind that we are
not talking of the probability of the crime occurring just as we don't
talk about the probability that HO is true or HA is true; instead we
talk about the probability of the crime being committed by the accused
given the evidence examined, i.e., the probability of rejecting HO
given the observed test statistic calculated from our sample. The
aCDlsed is either innocent or not in the same way that HO is true or
not.
An unexpected by-product of the judicial process analog is the
ability to present the concept that the error probabilities of a
statistical test are not related to a single test but are due to the
testing system. A particular test is either decided correctly or
incorrectly and there is no probability of HO or HA being true;
similarly, a particular individual is either judged correctly or
incorrectly and there is no probability of being innocent or guilty.
The probability statements refer to the testing process or the
judicial system of judging the evidence.
The evidence is utilized to define a critical region, or what is
to be called incriminating or conclusive evidence. The critical
region is the set of values of the test statistic that are unlikely
under HO at a given a, or, in other words, given innocence. In other
words, the critical region is the collection of evidence that would
seem most unlikely, where unlikely is defined by the choice of a. An
example would be to compare evidence on a murder scene: fingerprints
on the doorknob are less incriminating than having the murder weapon
at the scene of the crime. Analogously for a statistical test, a
difference of 0.5 cm in average heights between U.S. and European men
•
•
•
•
9
is less incriminating than a difference of 10 cm in average heights
(given equal variances).
The next step is to perform the test, where the evidence is
collected, judged, and a verdict is established. If the evidence so
warrants, HO is rejected at the established level of risk in favor of
RA' and the accused is found guilty. The flo is never accepted, just as
innocence is never fully established; instead the no can be
not-rejected given the test statistic, just as the accused is found
not-guilty given the examined evidence. Inappropriate test statistics
or analyses are equivalent to not having the complete evidence or
misinterpreting the evidence.
The concept of p-value is one that the students often demand to
know since it is stresed in the literature. It is usually explained
as the probability under RO of observing a more "extreme" value of the
test statistic, where "extreme" is departure from the null case
depending on the alternative hypothesis. Within the given analogy,
the p-value is the likelihood of observing more incriminating evidence
given that the accused is innocent, where incriminating depends on the
accusation. If a person is innocent, how much more incriminating
evidence could be brought up than is already present? If potentially
"worse" evidence could not be -found, then there is already substantial
incriminating evidence and the p-value is small. On the other hand,
if a considerable amount of "worse" evidence could possibly be found,
then there is not sufficient incriminating evidence at hand and the
p-value is large. Returning to the murder scene example, assume that
the following items of evidence comprise the entire distribution of
possible evidence for a murder crime: motive, murder weapon, presence

10
at the scene of the crime, and admission of guilt. Let us assume also
. that they are ranked in order of importance. If under the assumption
of innocence we have only a motive, the p-value would be large, as
possibly three more incriminating pieces of evidence could be found.
If on the other hand we had all possible evidence except admission of
guilt, the p-value would be small.
A problem often stated by students is their inability to decide
whether a small or a large p-value is preferred and how the p-value
relates to the level of significance a. When presented with the
judicial process analog it becomes clearer that a p-value smaller than
a means that the accused would be found guity at that a level of
significance and a p-value larger than a means that the accused would
be found not guilty at that a level of significance. The concept of
relating p-value to the severity of evidence found in the proceedings
has the added benefit that the students realize that a p-value is a
statistic computed from the sample but relates to the assumption made
in the null hypothesis (innocence). It then becomes clear that the
p-value is a descriptive tool for the sample, a speculation
peripherally related to the testing being performed.
4. Teaching practice
When utilizing the judicial process analog as a tool for
explaining the concepts of statistical hypothesis testing, it is best
not to present the analogy directly but introduce it by means of
examples. A particular testing situation can be presented and the
terminology of the test framework (Figure 1) presented using the
example concurrently with the judicial process analog. The students
are then exposed gradually to hypothesis testing and will remember and
•
•
••
·e
•
11
understand the terminology as they relate it to the analogy. Examples
from the literature greatly enhance the use of the judicial process
analogy. A recent letter in The New England Journal of Medicine
concerning the research on Laetrile [ReIman (1982)] shows the
widespread applicability of the analogy when it stated: "Laetrile, I
believe, has now had its day in court. The evidence, beyond
reasonable doubt, is that it doesn't benefit patients .....
Once the concept of statistical tests is understood, it is
reinforced when discussing particular tests for different situations
by referring back to the general framework and gradually substituting
the statistical jargon for their judicial process counterparts in
accordance with the capabilities of the class.
5. Discussion
The above parallel development of the concepts of statistical
tests of hypotheses utilizing the judicial process were successfully
utilized in a large introductory service course in the Department of
Biostatistics at the University of North Carolina in the fall of 1981.
Very encouraging feedback from the students demonstrated the
usefulness of the judicial process analog as an effective teaching
tool of the concepts of statistical hypothesis testing •
12
ACKNOWLEDGEMENTS
Research was performed while supported by the National Heart,
Lung and Blood Institute Contract No. 1-HV-1-2243-L. The author •wishes to thank the students and teaching assistants for their help in
letting him expose them to the ideas presented.
REFERENCES
Phillips, John Lo, Jr. (1982). Statistical Thinking, W.H. Freemanand Company, San Francisco, California, 2nd edition.
Feinberg, William E. (1971). "Teaching the Type I and Type II Errors:The Judicial Process," The American Statisticia~ 25, ppo 30-320
ReIman, Arnold S. (1982). "Closing the Books on Laetrile," The NewEngland Journal of Hedicine, January 28, 1982, p. 236.
•
•
13
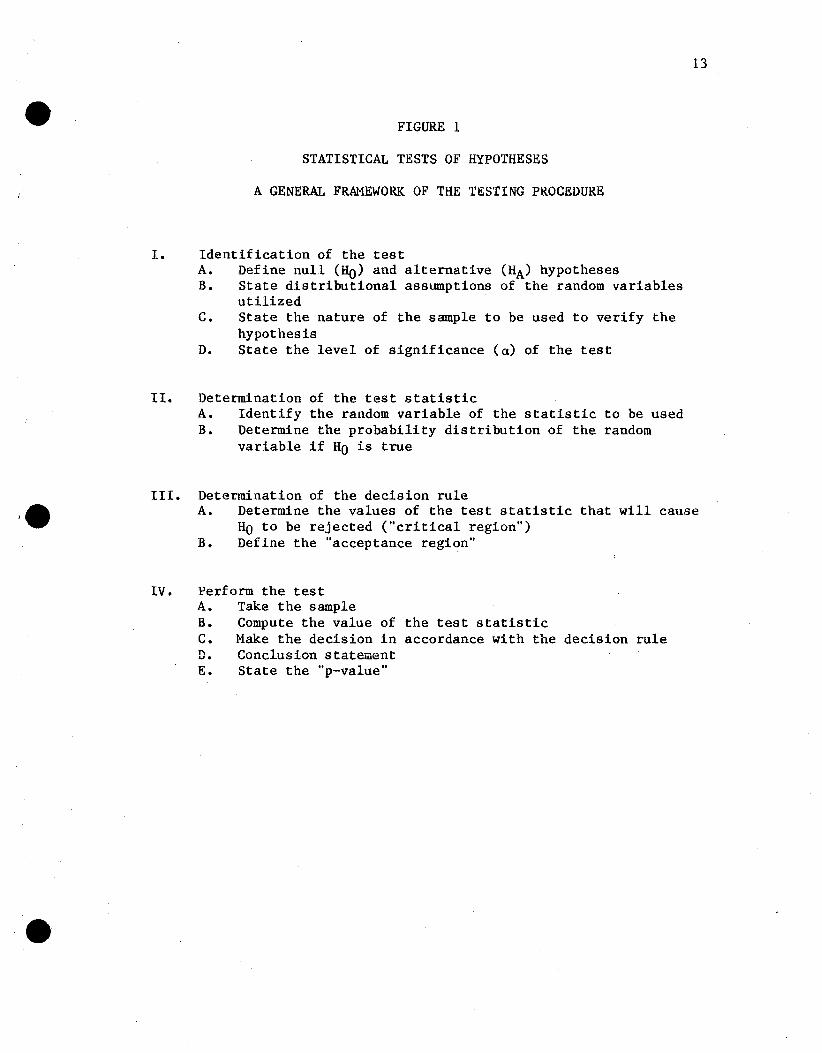
FIGURE 1
STATISTICAL TESTS OF HYPOTHESES
A GENERAL FRAMEWORK OF THE TESTING PROCEDURE
I. Identification of the testA. Define null (Ho) and alternative (HA) hypothesesB. State distributional assumptions of the random variables
utilizedC. State the nature of the sample to be used to verify the
hypothesisD. State the level of significance (a) of the test
II. Determination of the test statisticA. Identify the random variable of the statistic to be usedB. Determine the probability distribution of the random
variable if HO is true
III. Determination of the decision ruleA. Determine the values of the test statistic that will cause
HO to be rejected ("critical region")B. Define the "acceptance region"
IV. Perform the testA. Take the sampleB. Compute the value of the test statisticC. Make the decision in accordance with the decision ruleD. Conclusion statementE. State the "p-value"

14
FIGURE 2
COMPARISON OF STANDARD AND JUDICIAL PROCESS TERMINOLOGY
FOR STATISTICAL TESTS OF HYPOTHESES
Components andGeneral Frameworkof the Procedure Judicial Process Analog
I.
II.
III.
Identify the testA. Null hypothesis
Alternative hypothesisB,C. Sample and random variables
D. Level of significance
Power
Test statisticA,B. Probability distribution of
random variable under HO
Decision ruleA,B. Critical region
Innocence assumptionAccusation of guiltEvidenceRisk of "guilty" wheninnocent
Ability to prove guilt
Quantity and type ofevidence
Conclusive evidence ornot
IV. Perform test
A. Obtain sampleB. Compute the value of the
test statisticC. DecisionD. Conclusion statementE. P-value
Collect evidenceJudge evidence
VerdictSentenceLikelihood of moreincriminating evidencegiven innocence