the tanfield group plc annual report and financial
TRANSCRIPT
The Tanfield Group PLCAnnual report and financial statements 2006

Tanfield Group plcMaking Zero Emission Vehicles a Reality
The Tanfield Group Plc is a progressive, innovative manufacturingcompany which operates in two of the world’s most exciting growthmarkets – zero emission electric vehicles and aerial work platforms.
Tanfield’s future is about executing a strategy to become a worldleader in both of these fields, with shrewd business acquisitionsand innovation driving excellent organic growth.
Cover imageThe front cover features the new Edison sub-3.5t van which is part of a significantorder for Scottish & Southern Energy.
01 Highlights02 Our Business10 Chairman’s Statement12 Business Review18 Directors and Advisers20 Directors’ Report23 Corporate Governance25 Directors’ Remuneration Report28 Directors’ Responsibilities in the Preparation of Financial Statements29 Independent Auditor’s Report to the Members of Tanfield Group PLC30 Consolidated Income Statement31 Consolidated Balance Sheet32 Company Balance Sheet33 Consolidated Statements of Changes in Equity33 Company Statements of Changes in Equity34 Consolidated Cash Flow Statement35 Company Cash Flow Statement36 Consolidated Financial Statements Summary of Significant Accounting Policies40 Notes to the Financial Statements56 Notice of Annual General Meeting

Notes:
1. Every member entitled to attend and vote at the meeting may appoint a proxy or proxies to attend and on a poll vote on their behalf.A proxy need not be a member of the Company. A form of proxy is enclosed. Completed forms of proxy must be returned to the Company’s Registrars at the address shown on the form of proxy not less than 48 hours before the time appointed for the holding of the meeting. Where a form of proxy is signed under power of attorney or other authority, the authorising instrument or a notarially certified copy should accompany the form of proxy. The sending of a completed form of proxy to the Company’s Registrars will not preclude members from attending and voting at the meeting, or any adjournment thereof, in person, should they so wish.
2. The Company, pursuant to Regulation 41 of the Uncertificated Securities Regulations 2001, specifies that only those holders of ordinary shares of 1p each of the Company registered in the register of members of the Company as at 10:00am on 26th September 2007 shall be entitled to attend or vote at the meeting in respect of the number of ordinary shares of 1p each of the Company registered in their name at that time. Changes to entries on the register of members as at 10:00am on 26th September 2007 shall be disregarded in determining the rights of any person to attend or vote at the meeting.
3. Copies of contracts of service between Directors and the Company or any of its subsidiary undertakings together with the Register of Directors’ share interests will be available for inspection by members at the registered office of the Company during normal business hours on each business day prior to the date of the Annual General Meeting and at the place of the Annual General Meeting for fifteen minutes prior to and during that meeting.
Design and productionCarr Kamasa Designtel +44 (0)20 7566 0190www.carrkamasa.co.uk
PhotographyCharlie Fawell
PrintSpin OffsetThis Report is printed on Mega Silkwhich is derived from sustainableforests and produced at a mill that isaccredited with ISO14001. The paperis recyclable and biodegradable.

Tanfield Group PlcVigo Centre, Birtley RoadWashingtonTyne & WearNE38 9DA, UK
Tel +44 (0) 845 1557 755Fax +44 (0) 845 1557 756

The Tan
field
Gro
up P
LC
Annual report and financial statem
ents 2006

2006Highlights
• Turnover increased to £40.9m, from £22.4m• Operating profit increased to £5.4m up 160%• Robust balance sheet; £44m net assets• Built & delivered world’s first high performance 7.5t electric truck• Substantially increased levels of enquiry• Significant working capital to fund strong growth in 2007
Tanfield Group PLCAnnual report and financial statements 200601
This Year’s Annual Report – a New FormatTanfield continues to be committed to clear andeffective communications with its stakeholders. This year’s Annual Report adopts a new format to takeaccount of best practice and the requirements for anenhanced Directors’ Report. A substantial amount ofinformation provided elsewhere in previous years’annual reports is now contained in the Directors’Report. This information includes the Chief Executive’sReview, the Chairman’s Statement and discussion ofTanfields’ products, goals, strategy and the risks facedby the business. In addition, In line with last year, wehave also provided financial information in accordancewith the requirements of International FinancialReporting Standards (“IFRS”).
Forward-Looking StatementsThis document contains statements that are nothistorical facts, but forward-looking statements thatinvolve risks and uncertainties, including the timing andresults of vehicle trials, product development andcommercialisation risks. These forward-lookingstatements are based on knowledge and informationavailable to the Directors at the date the Directors’Report was prepared, and are believed to bereasonable at the time of preparation of the Directors’Report, though are inherently uncertain and difficult topredict. Actual results or experience could differmaterially from the forward-looking statements.
Key DriversLegislation
Tanfield Group PLCAnnual report and financial statements 2006 Our Business02
Adoption of Green Policies
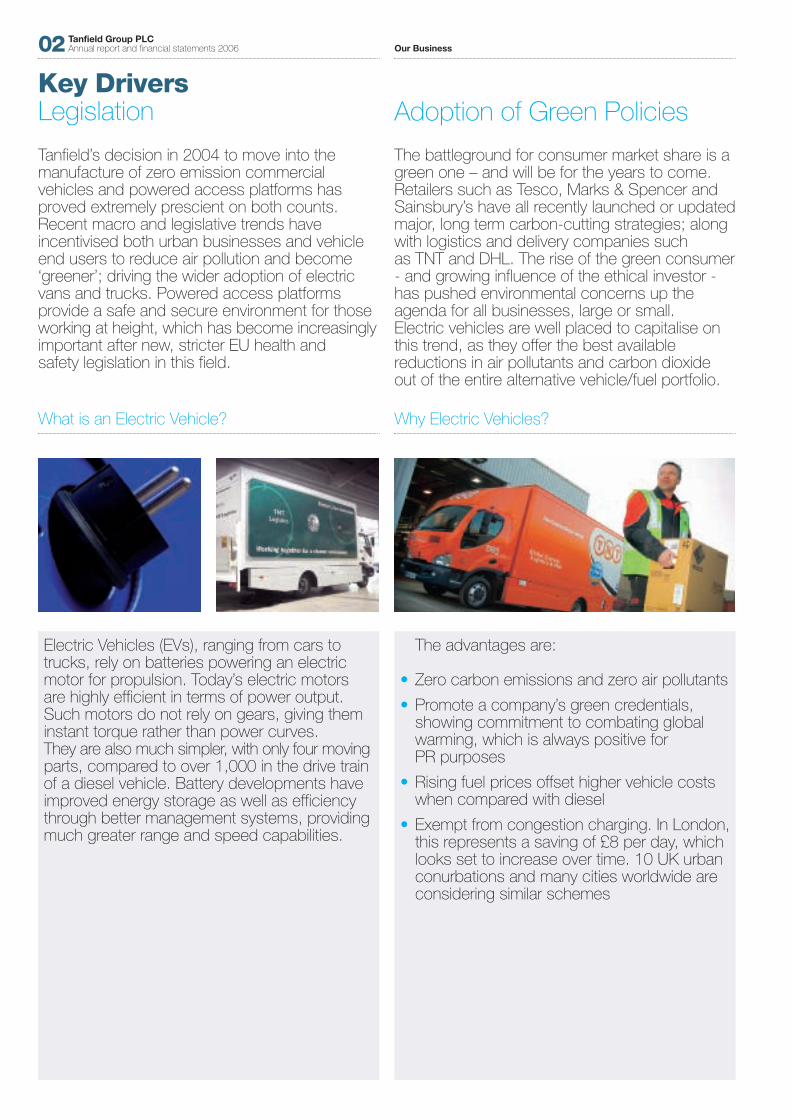
Tanfield’s decision in 2004 to move into themanufacture of zero emission commercialvehicles and powered access platforms hasproved extremely prescient on both counts.Recent macro and legislative trends haveincentivised both urban businesses and vehicleend users to reduce air pollution and become‘greener’; driving the wider adoption of electricvans and trucks. Powered access platformsprovide a safe and secure environment for thoseworking at height, which has become increasinglyimportant after new, stricter EU health and safety legislation in this field.
The battleground for consumer market share is agreen one – and will be for the years to come.Retailers such as Tesco, Marks & Spencer andSainsbury’s have all recently launched or updatedmajor, long term carbon-cutting strategies; alongwith logistics and delivery companies such as TNT and DHL. The rise of the green consumer- and growing influence of the ethical investor -has pushed environmental concerns up theagenda for all businesses, large or small. Electric vehicles are well placed to capitalise onthis trend, as they offer the best availablereductions in air pollutants and carbon dioxideout of the entire alternative vehicle/fuel portfolio.
What is an Electric Vehicle? Why Electric Vehicles?
Electric Vehicles (EVs), ranging from cars totrucks, rely on batteries powering an electricmotor for propulsion. Today’s electric motorsare highly efficient in terms of power output.Such motors do not rely on gears, giving theminstant torque rather than power curves. They are also much simpler, with only four movingparts, compared to over 1,000 in the drive trainof a diesel vehicle. Battery developments haveimproved energy storage as well as efficiencythrough better management systems, providingmuch greater range and speed capabilities.
The advantages are:
• Zero carbon emissions and zero air pollutants
• Promote a company’s green credentials, showing commitment to combating global warming, which is always positive for PR purposes
• Rising fuel prices offset higher vehicle costs when compared with diesel
• Exempt from congestion charging. In London, this represents a saving of £8 per day, which looks set to increase over time. 10 UK urban conurbations and many cities worldwide are considering similar schemes
Our BusinessTanfield Group PLCAnnual report and financial statements 200603
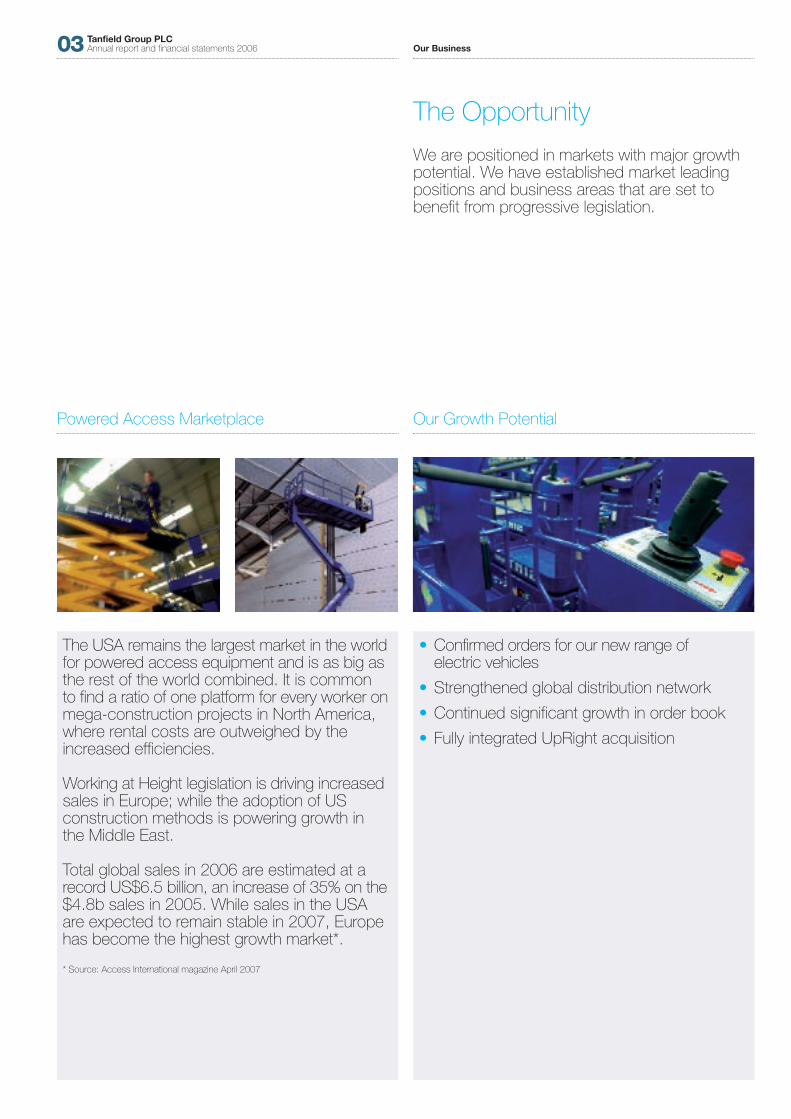
The Opportunity
We are positioned in markets with major growthpotential. We have established market leadingpositions and business areas that are set tobenefit from progressive legislation.
Powered Access Marketplace Our Growth Potential
The USA remains the largest market in the worldfor powered access equipment and is as big asthe rest of the world combined. It is commonto find a ratio of one platform for every worker onmega-construction projects in North America,where rental costs are outweighed by theincreased efficiencies.
Working at Height legislation is driving increasedsales in Europe; while the adoption of USconstruction methods is powering growth inthe Middle East.
Total global sales in 2006 are estimated at arecord US$6.5 billion, an increase of 35% on the$4.8b sales in 2005. While sales in the USAare expected to remain stable in 2007, Europehas become the highest growth market*.
* Source: Access International magazine April 2007
• Confirmed orders for our new range of electric vehicles
• Strengthened global distribution network
• Continued significant growth in order book
• Fully integrated UpRight acquisition

Zero Emission Specialist Vehicles
Smith Electric Vehicleswww.smithelectricvehicles.com
Founded in 1920, Smith Electric Vehicles isthe world’s most established manufacturerof battery powered vehicles – and easilythe world’s largest manufacturer of road-going commercial electric vehicles.
Since its acquisition by The TanfieldGroup Plc, Smith has become a worldleader in new technology electric vansand trucks, placing it at the forefront ofan exciting and rapidly expandingindustry. Smith has an unrivalled UK-wide service and support network,which already maintains over 5,000vehicles for major fleet operators.
Smith vehicles have greatly enhancedperformance capabilities, which make them attractive for all fleet operators inclosed urban environments – for the firsttime, these fleet operators have a viable,zero emission alternative to using dieselvans and trucks in city centres and airports.
Smith’s airport offering is complemented bytwo specialist airport vehicle sub-divisions;Jumbotugs and Norquip. This productportfolio is exported to Europe, the MiddleEast and Asia-Pacific territories.
Group OperationsTanfield GroupOur Business
Over the past twelve months the Group hasdeveloped a portfolio of businesses focused on providing zero emission vehicles and zero emission industrial products to customers operating in closed urban and industrialenvironments. This portfolio of businesses is supported by our well established engineering capability.
The Tanfield Group's operations are split broadly into three divisions: Specialist Vehicles, Powered Access and Engineering operating in two of the world’s most exciting growth markets – zero emission electric vehicles and aerial work platforms.
Tanfield Group PLCAnnual report and financial statements 2006 Our Business04
Powered Access
UpRight Powered Accesswww.upright.com
UpRight also has a proud tradition ofinnovation, dating back to its inception.
As recently as 2001, the company wasa top three global manufacturer in a$5bn industry. UpRight remains the thirdmost recognised aerial lift brand in theworld and its machines are well regardedby an extremely loyal customer base.
UpRight has assembly facilities in the UKand USA, plus a wholly-owned subsidiaryin Japan. Products are sold through astrong global network of independent,full-service distributors across Europe,North America, the Middle East andAsia-Pacific regions.
Since acquiring UpRight Powered Accessin June 2006, Tanfield’s managementteam has transferred production to anew 250,000 sq ft facility, whilesignificantly increasing both machineoutput and build quality; improving spareparts availability; growing the distributornetwork; saving key product lines fromdeletion; re-launching old product lines;and introducing new machines to theUpRight range.
Tanfield’s historic aerial work platformbusiness, Aerial Access, has been fullyintegrated into UpRight Powered Access.
Turnover
£20m% of Group Turnover
49%
Business
Smiths Electric VehiclesNorquipJumbotugs
Turnover
£11.3m% of Group Turnover
28%
Business
Upright Powered AccessAerial

Engineering Financial Results
Tanfield Engineering Systemswww.tanfieldengineeringsystems.co.uk
The Tanfield Group was born out of anengineering company and this remains an integral part of our business.
This division has undergone a radicaltransformation over the past few years. It has developed from being a sub-contractor with a short horizon orderbook, to one that delivers specialisttechnical assembly solutions on longterm contracts.
Delivering Performance
We have established considerable critical mass which is reflected in our growth andheadline performance.
Our BusinessTanfield Group PLCAnnual report and financial statements 200605
The division can now offer “single source”solutions for clients, from fabrication andmanufacture up to finishing and assembly.Other long-term outsourcing partnershipsinclude specialist suppliers for the Ministryof Defence, such as BAE Systems.
This engineering resource also supportsthe company’s two main divisions,Specialist Vehicles and Powered Access.
Turnover
£9.6m% of Group Turnover
23%
Business
Tanfield EngineeringSystems
Strong Financial Performance
The balance sheet is robust, with Net Assets at the end ofDecember standing at £44m... the Company has significantlevels of working capital, allowing it to fund strong organicgrowth in 2007.
Percentage increase 2005-06
Earnings per share before exceptional itemspence +10%2006
2005
2004 (3.98)
Operating Profit£’000
1.10
1.00
Percentage increase 2005-06
+68.9%2006
2005
2004 (2,268)
3,563
2,109

Tanfield Group PLCAnnual report and financial statements 2006 Orders for New Vehicles06
developing...Edison, the sub-3.5t van, waslaunched in April 2007. Majorcompanies who have alreadycommitted to orders of Edison includeScottish & Southern Energy, one of the UK's largest energy suppliers;TNT Express; and CEVA Logistics.
Orders for New VehiclesNewton, the 7.5t and 9t truck, was launched in December2006. TNT Express, which bought the first trial vehicle, hasordered a further 50 for the UK. TNT Express UK has alreadyindicated that it intends to replace up to 10% of its fleet -around 200 vehicles - with Smith Newtons. TNT has orderedanother five vehicles, to be deployed in Smith's first mainlandEurope trial, with TNT in Rotterdam, Holland.
Marks & Spencer has a 9t Newton on trial in logistics anddistribution operations in London. Marks & Spencer hasalready indicated that, if the trial proves a success, it willreplace diesel vehicles with Smith Newtons throughout itsurban fleet, where appropriate.
Further seed vehicles are on trial with DHL Logistics (LondonHeathrow) and CEVA Logistics (Starbucks, central London).
The wider market for commercial vehicles remains buoyant -figures from the SMMT show that an average of over325,000 new vans and trucks were registered in the UK eachyear, between 1997 and 2006.

GrowthTanfield Group PLCAnnual report and financial statements 200607
opportunitiesUpRight has accelerated Tanfield'sgrowth into a global business. We have successfully restored marketconfidence in the very strong brandthat is UpRight, by executing ourstrategy for a global distribution network.
GrowthAs the product portfolio of all access equipment manufacturersbecomes increasingly generic, we firmly believe that businesswill be won and lost on the ability to provide local language,rapid response service and maintenance. Tanfield hassuccessfully grown UpRight's global distributor network from15 at point of acquisition, to over 160 by June 2007.
Order Intake and Machine OutputThe growth of the distributor network led to average orderintake rising from £150,000 per week in June 2006 to £1.2min June 2007. Production output has grown from less than 20 machines per week in June 2006 to over 120 per week in June 2007. The product range has grown from 10 to over20, during the same period.
Rental MarketThe ability of the distributor network to provide local support,along with the doubling of the product range, has made UpRighta more attractive proposition to rental companies. During thefirst six months of 2007, Tanfield has won its first orders fromrental companies in the UK, Europe, Scandinavia and the USA.

Tanfield Group PLCAnnual report and financial statements 2006 Maintaining Growth08
increasing....The increase in sales of new technologyelectric vehicles has supported adoubling of sales in the service andmaintenance sub-division over thepast 12 months.
Maintaining GrowthThere continues to be further growth potential in this division,which operates out of over 20 nationwide depots and service centres.
SEV currently has over 120 engineers employed in servicingand maintaining electric vehicles throughout the UK,increasing from 80 at the half year. The Directors expect thatthis sub-division will be further supplemented by increasedbusiness from both its existing customers and new clientsfrom outside its traditional base.

Reaching New HighsTanfield Group PLCAnnual report and financial statements 200609
demandUpRight is now the UK’s largestmanufacturer of self-propelled aerialwork platforms and a leading brandin the global marketplace.
Reaching New HighsAt the point of acquisition in June 2006, UpRight wasproducing less than 20 machines per week and had a £3mforward order book. By the close of 2006, Tanfield wasmanufacturing more than 50 units per week and generatedsales of £6m. The order book now stands at over £35m andTanfield is building at more than 120 machines per week. The growth in sales correlates to the growth of the worldwidenetwork of independent UpRight distributors – increased from15 at acquisition to over 150. Tanfield has recently appointeddistributors in key strategic territories in the Middle East,Northern Europe and Eastern Europe. One new Europeandistributor placed a single order for over 1,300 aerial workplatforms, with a total value in excess of 14 million Euros.

Tanfield Group PLCAnnual report and financial statements 200610
Chairman’s Statement Turnover for the 12 month period grew to £40.9m, compared to£22.4m for the full year to December 2005. The Group deliveredthis substantial increase through organic growth of existingoperations and a contribution from the Upright Powered Accessbusiness, acquired midway through 2006.
Operating profit for the period of £5.4m before restructuring costsand after goodwill adjustments demonstrates significant growth fromthe £2.0m profit in the year to December 2005. After restructuring,the £3.5m operating profit before tax for the period (from continuingbusiness) is an increase of 75% against 2005.
The balance sheet is robust, with Net Assets at the end ofDecember standing at £44m (£11.8m at the end of December 2005).Net Current Assets were £32m (2005 £2.5m), with cash balances inexcess of £13m and borrowing limited to a £1.1m loan on Groupproperties. This underlines that the Company has significant levels ofworking capital, allowing it to fund strong organic growth in 2007.
Internal RestructuringThe UpRight acquisition paved the way for the internal restructuringof the Group into two key divisions: Powered Access, sold under theUpRight brand; and Specialist Electric Vehicles, sold under theprincipal brand of Smith Electric Vehicles and sub-brands of Norquipand Jumbotugs.
The highly profitable growth of the past year demonstrates thesuccess of the Group’s strategy to concentrate on the expansion of these two key divisions.
Growth of the GroupOver the past 12 months, the Group has continued to consolidateand develop its portfolio of businesses, focused on providing zeroemission vehicles and powered access platforms to customersoperating in closed urban and industrial environments.
The acquisition of UpRight inJune 2006 acceleratedTanfield’s growth as a globalbusiness. I am delighted withthe progress we have madewith UpRight and pleased to announce that it entered2007 with a strong order book.

SummaryThe Group has experienced another exciting year of exceptionalgrowth and improved profitability. The consolidation onto oneassembly site has improved efficiency and control, and has given ussignificant expansion potential to further continue this growth. We also see opportunities to increase capacity in the USA, both forpowered access and electric vehicles.
We operate in sizeable markets which present significant opportunitiesfor growth. The Group’s strategy remains to grow its two core divisions,both organically and – where opportunities arise – through acquisition.
There has been a major step change in our organisation over thepast 12 months. We now have 600 people in the business, led by a strong, integrated senior management team. We have facilities inthe UK, USA, and Japan, with an established manufacturing supplychain in China and Eastern Europe.
I would like to take this opportunity to thank all our people for theirefforts and for the continuing support of all our stakeholders.
Roy StanleyChairman
Chairman’s StatementTanfield Group PLCAnnual report and financial statements 200611
We significantly enhanced this portfolio with the acquisition ofUpRight in June 2006. This acquisition presented an ideal opportunityfor the Group to consolidate all UK product assembly operations on oneflagship site: Vigo Centre in Tyne & Wear, which was officially openedby the Prime Minister, the Rt Hon Tony Blair MP, in February 2007.
The acquisition of UpRight in June 2006 accelerated Tanfield’s growthas a global business. I am delighted with the progress we havemade with UpRight and pleased to announce that it entered 2007with a strong order book.
With UpRight, we have successfully restored market confidence inwhat was a very strong global brand. We have re-established aneffective worldwide distributor network, which now stands at over150 distributors, compared to 15 in June 2006. We have also beensuccessful in extending the UpRight product range. These achievementsare reflected in the huge increase in average weekly order intake.
UpRight has provided access to a well-established componentsupply chain from low cost countries and the move to Vigo Centre isproviding further cost synergies, by consolidating all Group productassembly operations on one flagship site.
The strong growth in our electric vehicle service and maintenanceoperations has underpinned overall growth in our Specialist ElectricVehicles Division. This core element of the business is beginning tofulfil its potential in terms of addressing the requirements of largeurban fleet operators, who want to reduce their operational costsand more importantly, greatly reduce their carbon footprint. This isevident in the increase in both the order book and enquiry levels.
Board ChangesIn June 2006 we welcomed Charles Brooks as our new FinancialDirector. Charles worked on the UpRight acquisition for severalmonths prior to this appointment, where he very ably demonstratedhis acumen, diligence and dedication to Tanfield.
In September 2006, Brendan Campbell joined the Board asOperations Director. Brendan has been with the Group for six yearsand has played a key role in the successful integration and de-riskingof the UpRight business; developing the low cost supply chain; anddelivering a five-fold increase in output.
Also in September, I stepped down from my dual role as ChiefExecutive and Chairman, with the appointment of Darren Kell asChief Executive. As Business Development Director, Darren played a key role in the substantial growth of the Group over the previous two years and subsequent successful integration of theUpRight business.
I am confident that this very strong team can continue to establishTanfield as a world leader in both commercial electric vehicles andpowered access platforms.
Establishing Critical Mass in 2006There has been a major step change in ourorganisation over the past 12 months. We nowhave 600 people in the business, led by a strong,integrated senior management team. We havefacilities in the UK, USA and Japan, with anestablished manufacturing supply chain in Chinaand Eastern Europe.

Tanfield Group PLCAnnual report and financial statements 2006 Business Review Operational Review12
IntroductionThe launch of the Smith Newton, the world’s largest high-performance, all-electric truck was a phenomenal success andTanfield remains uniquely positioned to win business in this sector,as the only company in the world with a zero emission productionmodel of this size and carrying capacity.
The acquisition of UpRight Inc in 2006 and the subsequentexpansion of its activities confirmed that we have the ability totransform a struggling company into a successful, profitable operation.Our sales and marketing strategy, allied to the strength of theUpRight brand, has proven to be so successful that we now have a record forward order book for aerial work platforms.
Vigo CentreThe move to Vigo Centre, a modern 250,000sq ft facility in North EastEngland, has been crucial to our operational success and provides asuperb foundation for future growth. Vigo Centre opened in November2006 and Tanfield immediately began transferring assembly of UpRightproducts from the incumbent Irish facility in Dublin.
In a time frame of just over two months, the Group simultaneouslyrecruited and trained a new, UK-based assembly workforce, whiletransferring the entire UpRight machine production operations fromDublin to Vigo Centre. The Group also quadrupled UpRight machineoutput during the same period.
Vigo Centre was fully operational and assembling the Group’s entireproduct portfolio by the beginning of December. This was deliveredahead of our internal schedule and under budget. The Companyendeavoured to keep down costs. To this end, the Chairman andfounder of Tanfield, Roy Stanley, successfully negotiated a 15-monthrent-free period at Vigo Centre. The Chairman also secured a £1.95mgrant for Tanfield, from Regional Development Agency, One NorthEast.
The overall operational synergies and improvements gained fromconsolidation into Vigo Centre and have led to reduced unit buildcosts and greatly improved output volumes.
In 2006, the Group also started manufacturing smaller products fromthe UpRight portfolio at a facility in Fresno, California. We anticipatesignificantly broadening manufacturing capability in North Americaduring 2007.
The accelerated growth in forward orders placed further demandson our Production team to increase output and they rose to thechallenge. Machine output hit 100 units per week at the end ofFebruary 2007, ahead of schedule. We are installing a third, largercrane line to accommodate larger machines and vehicles.
Business ReviewOperational Review
Our sales and marketingstrategy, allied to the strengthof the UpRight brand, hasproven to be so successfulthat we now have a recordforward order book for aerialwork platforms.

Business Review Operational ReviewTanfield Group PLCAnnual report and financial statements 200613
1 The UpRight production line at Vigo Centre in May 2007, already producing over 120 machines per week.2 The new UpRight AB46 boom lift engaged in power linemaintenance work. Since reintroducing the AB46 in early2007, Tanfield has already taken orders for over 100 units.
Divisional Progress ReportSpecialist Electric Vehicles DivisionThe division’s flagship brand is Smith Electric Vehicles, a leadingmanufacturer of zero emission commercial electric vehicles –principally vans and trucks. Its new technology vehicles have fastacceleration, top speeds of up to 55mph and a range betweenbattery charges of up to 150 miles. These characteristics make themideal for urban applications where vehicle emissions are becomingincreasingly important.
As zero emission vehicles, the entire Smith range qualifies for severalkey tax and legislative benefits – including exemption from the LondonCongestion Charge.
Jumbotugs and Norquip are airport-specific sub-brands, manufacturingairside ground support vehicles.
Overall, the division continues to benefit from a buoyant level ofenquiries and accelerated market interest created by the changingdrivers within the commercial vehicle market. The older technologyelectric vehicles - and the new technology Faraday, launched in2005 - have maintained strong sales growth in the traditional marketsectors of municipalities, dairies and waste removal applications.
The launch of the latest generation of high performance, zero-emissionvehicles, initially with the Smith Newton 7.5 tonne truck, has beenvery well received by the target market of urban delivery fleetoperators. This is a new market which is outside of the division’straditional customer base; and one which the Directors anticipate will be high growth.
The first of these Smith vehicles have entered service with business-to-business parcel delivery company TNT Express; and contractlogistics company CEVA Logistics (formerly TNT Logistics), on behalfof Starbucks. Attracting such high profile launch partners has led tothe division enjoying unprecedented levels of enquiries from potentialcustomers with broadly similar delivery applications.
TNT Express has indicated that there is the potential for it to replaceup to 10% of its UK fleet with zero-emission vehicles such as theSmith Newton. TNT’s global chief executive, Peter Bakker, has alsocommissioned a Europe-wide study into the adoption of Newtonthroughout TNT’s operations.
Trading UpdateIn February 2007, we entered into an agreement to supply Marks & Spencer with the Smith Newton and they have purchasedthe vehicle for distribution to their stores. Again, they are examiningthe potential to replace a proportion of their internal-combustionpowered fleet with the Newton.
Since then, this division has won new orders for the Smith Newtonfrom a significant number of other fleet operators, including DHL, the logistics company. DHL operates a fleet of 76,000 vehiclesworldwide and is part of Deutsche Post World Net. DHL will takedelivery of a 9 tonne version of Newton, with greater payloadcapabilities. The first vehicle, the largest higher function electric truck ever produced, will operate for DHL’s Department Stores &Fashion division.
I am pleased to announce that the ongoing field trials of our firstSmith Newtons with TNT Express UK and CEVA Logistics continueto be a success.
The TNT vehicle is deployed in business-to-business expressdelivery operations in and around London. The CEVA vehicle isdeployed in delivery operations for coffee retailer Starbucks in andaround London. Both TNT and CEVA have confirmed that Newton ismeeting or exceeding all of their expectations, in terms ofperformance; reliability; and driver acceptability.
TNT Express UK remains committed to replacing up to 10% of itsUK fleet with Newtons, a total of approximately 200 vehicles, if thetrial continues to be a success. Tanfield is in further negotiations withCEVA Logistics over the supply of more Newton vehicles, wherepertinent. TNT NV is examining opportunities where it could deploySmith Newtons in mainland Europe. Tanfield is also presently indiscussions to supply both CEVA and TNT with Edison, our higherfunction, all-electric, 3.5 tonne van.
150UpRight distributors
DistributionTanfield have strengthened the UpRight global distributionnetwork from 15 at point of acquisition, to over 150 sites.
£1.2m/wkGrowthTanfield since acquiring the upright UpRight brand haveincreased the average weekly order intake from £150,000at point of acquisition, to £1.2m.
1
2

Product DevelopmentDuring 2007, the division will launch a 12 tonne version of the Smith Newton. Along with our 9 tonne Newton, this will not onlyincrease the Company’s UK target market by offering greaterpayload capabilities, but will facilitate the development of thelucrative chilled-food distribution market. The 9 and 12 tonnevehicles will also provide solutions more suited to the regulatoryrequirements of markets in mainland Europe and North America.
The next vehicle in the high-performance, zero-emission range, theEdison, will be offered in 3.5 to 4.3 tonne sizes; and configurationsincluding chassis cab, panel van, crew cab and minibus. This will bethe world’s first 3.5 tonne, all-electric van and we anticipate there willbe widespread demand from urban fleet operators, in existing andnew market sectors. We have already secured confirmed orders andgenerated further significant interest for Edison - both from existingand new customers - and we will be announcing our launch partnersfor the vehicle at the Commercial Vehicle Show, held in the UK inApril 2007.
Other products in this family of vehicles are under development andthese will be launched over the course of the next 18 months.
Market DevelopmentAside from the exciting domestic opportunities and potential foradditional orders from existing customers, we are also receivingsignificant enquires from potential customers within territoriesincluding mainland Europe; the Asia-Pacific region; and in particularNorth America.
Converging market drivers such as congestion charging; oil pricing;energy security; vehicle maintenance costs; and punitive legislativemeasures on vehicle emissions, are now applicable to a globalmarketplace. Smith’s products are very pertinent for applications inthese markets and we are examining ways in which our vehicles canbe offered to customers outside the UK.
The North American market is extremely receptive to the concept ofthe higher function, zero emission, closed urban delivery vehicle.Discussions are ongoing with a number of existing, global customersand new USA customers, with regard to the most efficient methodto facilitate their requirements for our products within these markets.
Business ReviewOperational Review continued
Tanfield Group PLCAnnual report and financial statements 2006 Business Review Operational Review14
The UpRight Powered Accessbusiness was acquired on 9 June 2006. Since then wehave significantly increasedmachine output, in order tokeep pace with the growth in orders.
USA UpRight OrdersSuccessful UpRight brand re-launch in the USA in February 2007; average weekly order intake quadrupled to $2m.
EdisonWorlds FirstWe aunched the Smith Edison, the world’s first 3.5t electric van,in April 2007, to facilitate further penetration of the broader urbandelivery and logistics sector.
The Smith Electric Vehicle (SEV) has severalongoing trials with major fleet operators, many of which have lead to significant ordersincluding Marks & Spencer.
$2m

Business Review Operational ReviewTanfield Group PLCAnnual report and financial statements 200615
increaseOrdersIncrease in volume orders: 1,300 machines to Benelux region; orders of100+ machines to clients in UK, Southern Europe, Scandinavia and USA.
250,000sqft
Vigo CentreConsolidated all product assembly operations in Vigo Centre, a new 250,000sq ftUK production facility, providing cost savings and production synergies.
Service and MaintenanceThe service and maintenance sub-division, SEV, has doubled salesover the past twelve months. There continues to be further growthpotential in this division based out of our nationwide chain of depots.SEV currently has over 160 people employed in servicing andmaintaining electric vehicles. The sale of each new electric vehiclenormally involves a five year service and maintenance contract. A key USP for domestic vehicle sales is the coverage of this serviceand maintenance network, which gives existing and future buyers ofelectric vehicles the confidence that there is a high level of supportfor their fleets.
SEV is also in negotiation with a number of potential customersoutside its traditional operating sphere, further broadening the scaleand breadth of the infrastructure and service capability. Moving into new territories will also accelerate the growth of this part of the Group.
Powered Access DivisonUpRight Powered Access is an aerial work platform manufacturerwith a brand name recognised worldwide and a proven productportfolio. It has an established global network of independentdistributors and its own sales and service centres in the USA andJapan. UpRight products, which are largely battery powered, areused for safe working at height, in applications such as building andfacilities maintenance; and construction. They are known by a varietyof names, including powered access platforms, aerial workplatforms, aerial lifts and cherry pickers. The UpRight PoweredAccess business was acquired on 9 June 2006. Since then wehave significantly increased machine output, in order to keep pacewith the growth in orders. We have built on the extensive goodwillthat exists within the global market towards UpRight, bystrengthening and developing the sales and marketing structure.This, allied to the recruitment of new, high-quality dealers anddistributors, this has significantly increased order intake.
Output GrowthThe effectiveness of our Operations team is again demonstrated bythe fact that they continue to hit significant production milestones: 50 machines per week in 2006; and 100 machines per week by theend of February 2007. In order to meet anticipated demand,ongoing output growth is planned and the facility will be producing150 units per week by the third quarter of 2007. A third, largercapacity overhead crane line has been ordered and will be installedin the second quarter of 2007.
USAThe USA presents a significant market opportunity for this division,representing almost half of the global marketplace for poweredaccess equipment. We commenced limited manufacture of a selectcross-section of machine types towards the end of 2006 at theGroup’s facility in Fresno, California. This facility comfortably reachedour production target of 20 units per week by the end of February2007. The UpRight brand was re-launched in the USA at theAmerican Rental Association show in February 2007, where theemergence of another significant player in the US market was verywell received. This resulted in substantial machine order intake,averaging in excess of US$1m per week, within four weeks of theshow’s end. The Group is currently assessing the best method toaddress the strong market demand in the US market for UpRightproducts and further leverage brand equity. It is clear that this willrequire a significant expansion of our US assembly operations.
The new Vigo Centre a 250,000sq ftproduction facility in Washington, UK.

Business ReviewOperational Review continued
Tanfield Group PLCAnnual report and financial statements 2006 Business Review Operational Review16
Product DevelopmentWhen we acquired UpRight in 2006, the previous owners were at anadvanced stage in a programme of product rationalisation that in2006 cut the range from 18 models to just 10. This dwindlingportfolio became of limited interest to rental companies and strongerdistributors. During 2006, Tanfield re-launched dormant models andintegrated four products from the Aerial Access range, expandingthe UpRight portfolio to over 20 models. Throughout the course of2007, the division will be launching a number of mid-range productsfor the UpRight portfolio. These are updated versions of dormantmachines that were once made at UpRight’s US facilities. There isstrong global demand for these new products and we anticipateassembling these machines in both Europe and the USA. The appetite for these products was demonstrated by our recentannouncement regarding the re-launch of the UpRight AB46machine. UpRight had ceased production of the AB46 some timeprior to Tanfield’s acquisition. Within two weeks of announcing wewere bringing back this popular machine, we secured orders forover 100 units. We believe the addition of the AB46 to the range willsignificantly increase UpRight’s ability to penetrate the high volumemajor rental companies worldwide.
Customer BaseDuring 2006, Tanfield appointed new UpRight distributors worldwideand re-engaged with ex-UpRight distributors who had left as theUpRight product range dwindled. The global distributor network now stands at over 150 independent companies. Tanfield alsoappointed sales managers in the Scandinavia, Southern Europe and Asia-Pacific territories; and re-established a US sales team.
We anticipate that the recentEU legislation governing safe working at height willcontinue to drive sales inmember states.
UpRightRecord UpRight forward order book of £35m.
deliveryNew marketsSuccessfully penetrated parcel delivery & logistics market,with sales of Newton to TNT Express and CEVA Logistics(formerly TNT Logistics).
£35m
The UpRight AB46 boom lift; one ofseveral popular UpRight machinesreintroduced to the product portfolio by Tanfield during 2006 and 2007.Tanfield has already expanded therange from 10 models at point ofacquisition to more than 20.

We have also received an incremental order for 150 UpRight X32scissor lifts, with a market value in excess of £1m.
The machines will be supplied to meet a new order placed with onedistributor in mainland Europe. When we acquired UpRight in June2006, it was producing around 20 machines per week and had aforward order book of less than £3m. The value of the UpRightforward order book for 2007 now stands at over £35 million, whileoutput is 100 machines per week and climbing.
SummaryWe have two key brands which are well respected in their markets.We have a robust distribution model with strong sales channels. We are experiencing unprecedented enquiry and order intake levelsand we are poised to further accelerate this growth with theintroduction of additional new products and expansion into newgeographic markets and sectors. The business has never been inbetter health. The Board and senior management team have beenstrengthened and we continue to successfully penetrate all of ourtarget markets. These developments, allied to the operationalsynergies brought about by the move to Vigo Centre and thedeveloping supply chain from low-cost countries, mean that Tanfieldis well positioned for continued growth in 2007.
Darren KellChief Executive
Business Review Operational ReviewTanfield Group PLCAnnual report and financial statements 200617
Market DevelopmentGlobally, the powered access industry remains buoyant in allsectors. The well-regarded 2007 Access Confidence Survey,published by influential industry magazine Access International,recorded an unprecedented level of optimism. Half of rentalcompanies anticipate growing by more than 10% and another 46%expect to grow by 1 – 10%. Overall, 64% said they will grow theirfleets, with a further 18% still planning to buy new machines toreplace ageing stock. While the North American market hasmatured, anecdotal feedback indicates that there is a substantialappetite among access buyers for an alternative to the main twoOEM brands, JLG and Genie. This is demonstrable in another highlymature market – Scandinavia. Here, UpRight is already winningvolume orders from both its established distributor network and frommajor rental companies.
We anticipate that the recent EU legislation governing safe Workingat Height will continue to drive sales in member states. Other keygrowth markets include the Middle East, which is increasinglyeschewing labour-intensive scaffolding for mega-constructionprojects, in favour of more productive US building practices, whichrely on high intensity use of aerial work platforms.
Trading UpdateI am delighted to announce that UpRight has further strengthened itsindependent distributor network, with new distributors appointed inSaudi Arabia; South Korea and Turkey. All three companies areestablished and experienced, providing excellent sales channels intothese territories. Our strategy to grow the existing network of highquality independent distributors continues to translate into significantorders – the appointment of one new distributor for the Beneluxregion resulted in an order for over 1,300 UpRight machines. Further volume orders of 100+ units each have been received fromdistributors in the USA, Southern Europe, Russia and Scandinavia.This week, UpRight has won two more volume orders. A major UKaccess rental company has ordered 96 machines, with a value inexcess of £2m. This is particularly pleasing as UpRight had decliningmarket penetration in the UK under its previous owners. The ordercame via IPS Ltd, our Master Distributor for the UK, which furthervalidates our strategy of appointing well-regarded distributors whocan add real value to the product, in territories where UpRight saleshistorically were weak or in decline.
Our strategy moving forwardremains simple. We aim togrow our two divisions bothorganically and when appropriatethrough prudent acquisitions.
The Smith Edison electric van, launched in April 2007, is the world’s first 3.5 tonne higher function electricvehicle. Gross vehicle weight is a vital factor for fleetoperators, as higher weighted vehicles require betterqualified – and more costly – drivers.
Directors and Advisers
Tanfield Group PLCAnnual report and financial statements 200618
2
5
1
4
6
3

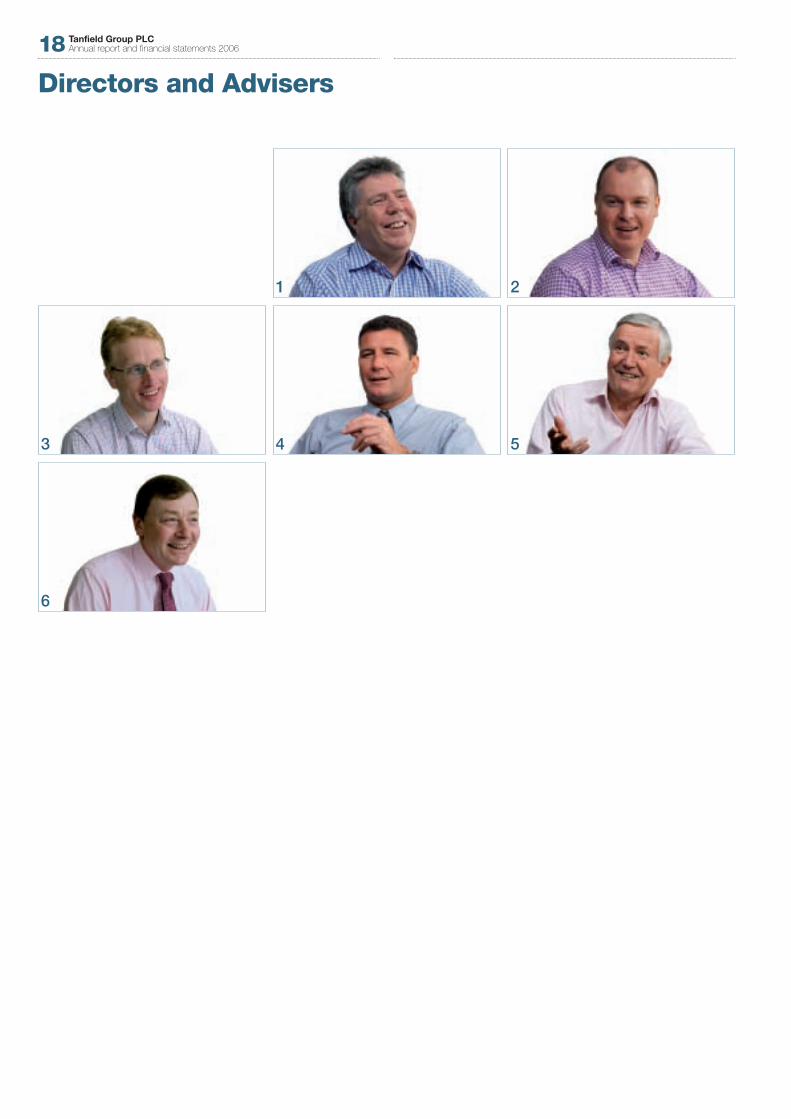
1. Roy Stanley ChairmanRoy founded The Tanfield Group in 1996, which subsequentlyreversed into the Comeleon in December 2003. For 10 years Roywas Chief Executive, a time during which the company started todevelop its strategic direction, leading it to focus on zero emissionsolutions. In September 2006 Roy became Executive Chairman soas to be able to focus on other business interests.
2. Darren Kell Chief Executive OfficerDarren’s career has been in a number of capital goods rolespredominantly in the North East, with a focus on production andmanufacturing plant operations and business development. Darrenworked for the Crabtree Group from1989 onwards as BusinessDevelopment Director, a time when revenues grew from £5m to£50m and the business was returned to profitability. In 2000 Darrenjoined the Tanfield Group, since when he has been instrumental inframing the zero emissions strategy and the acquisitions of SmithElectric Vehicles and Upright. Darren was promoted to ChiefExecutive in September 2006.
3. Charles Brooks Chief Financial OfficerCharles qualified as a chartered accountant with Arthur Andersen inthe late 1980s. Charles joined Tanfield from Agility Systems Limitedwhere he was Finance and Operations Director. Charles wasinstrumental in the Upright acquisition, as an external consultant,before being appointed in a full time capacity in June 2006.
4. Brendan Campbell Operations DirectorBrendan holds an honours degree in Industrial Chemistry and hasmanagement experience from his 18 years in the manufacturingenvironment. He joined Tanfield in 2001 after spending eight years at Viasystems Ltd, where he reached the position of ManufacturingDirector. Brendan is now responsible for Design, Purchasing andLogistics, Planning, Health & Safety, Quality, Engineering andProduction for whole Tanfield Group. Brendan was appointed to theboard in 2006.
Directors and AdvisersTanfield Group PLCAnnual report and financial statements 200619
SecretaryCharles Brooks
Registered OfficeVigo CentreBirtley RoadWashingtonTyne and Wear, NE38 9DA
AuditorsBaker Tilly1 St James’ GateNewcastle upon TyneNE1 4AD
SolicitorsWard HadawaySandgate House102 QuaysideNewcastle upon TyneNE1 6AE
5. John Bridge Non-Executive DirectorJohn Bridge is Chairman of Endeavour SCH plc, Chairman of theLand Restoration Trust and Chairman of the newly formed LevyBoard (UK). John is an economist by training and runs his ownconsultancy, as well as being a consultant to PricewatehouseCoopers.He is also Chairman of the Alnwick Garden Trust and was formerlyChairman of Regional Development Agency, One NorthEast.
6. Martin GroakNon-Executive DirectorMartin Groak (56) was appointed a director of the Company in June 2005. He is a Chartered Accountant with a degree ineconomics from the University of London and has over 30 years of worldwide business experience. He is multi-lingual, with a strongbackground in finance and financial control in the logistics, mining,steel, and energy industries. He is a director of three other publiclyquoted companies: The AIM VCT plc, The Creative EntertainmentGroup plc and Indago Petroleum Limited, of which he is Chief Executive.
Nominated AdvisorCenkos Securities plc6, 7, 8 Tokenhouse YardLondon, EC2R 7AJ
Nominated BrokersCenkos Securities plc6, 7, 8 Tokenhouse YardLondon, EC2R 7AJ
St. Helen’s Capital plc15 St. Helen’s PlaceLondon, EC3A 6DE
RegistrarsCapita RegistrarsNorthern HouseWoodsome ParkFenay BridgeHuddersfieldHD8 0LA

Directors’ Report
The directors submit their report and the financial statements of Tanfield Group PLC for the year ended 31 December 2006.
Principal ActivitiesThe company’s principal activity is that of a holding company. Tanfield Group PLC is the parent company of a group engaged mainly in thepowered access, zero emission vehicle industries and engineering.
Results and DividendsBuilding on the growth shown in 2005, the financial result for the twelve months to December 2006 reflect the further development ofTanfield Group plc into a high growth, profitable and robust business.
Turnover for the twelve month period grew to £40.9m which compares to £22.4m for the full year to December 2005. This results from a combination of organic growth in the group’s ongoing operations together with the growth resulting from our acquisition of Upright Powered access.
Profit before restructuring costs and tax for the period of £5.5m shows significant growth from the £2.0m profit in the year to December 2005.
After restructuring, operating profit (continuing business) before tax for the period of £3.6m shows an increase of 100% against 2005.
The balance sheet is very robust, with net assets at the end of December of £44m (£11.8m at the end of December 2005). Net CurrentAssets were £31m (2005: £2.5m) with cash balances in excess of £13m and borrowing limited to £1.1m loan on group properties. Thisdemonstrates that the company has significant levels of working capital allowing it to fund strong growth in 2007.
During the year the company raised new equity. £10m in June to fund the Upright acquisition, and a further £20m in November to provideworking capital to accelerate the growth of the Powered Access Division in response to strong customer demand.
No dividend has been paid or proposed for the year (2005: £nil). The retained profit of £2.5m (2005: £1.7m) has been added to reserves.
Review of the BusinessThe two major developments during the year were the launch of Smith’s new generation of electric vehicles and Tanfield’s acquisition ofUpright Powered Access in June 2006.
Adding Upright to the existing Aerial Access brand has allowed the business to create another significant business division and the businessis now presented as three principal divisions, Zero Emission Vehicles, Powered Access Platforms and Engineering, reflecting the way thebusiness is managed. The Powered Access Platforms and Zero Emission Vehicle Divisions have been relocated to Vigo Centre, inWashington, which has become Tanfield Group’s new headquarters.
A detailed review of the business is included in the Business and Financial Review on pages 12 to 17.
Future DevelopmentsThe growth of the Powered Access Division together with the strength of the orderbook for the new generation electric vehicles indicate thatTanfield Group plc will continue to grow strongly in 2007. This growth, together with the resultant efficiencies from increased overheadutilisation achieved by operating out of a single manufacturing plant, will ensure continued increases in profitability.
Management policies will continue to be reviewed in the light of changing trading conditions.
Political and Charitable ContributionsDuring the year, the group has made no political or charitable donations (2005: £nil).
Financial InstrumentsThe Group’s financial instruments comprise cash, finance leases, mortgages, bank loans, unsecured loan notes and short term debtors and creditors arising from its operations. The principal financial instruments used by the Group are loans and mortgages which, together with cash raised from share issues by the company are applied in financing the group’s fixed assets. The Group has not established a formal policy on the use of financial instruments but assesses the risks faced by the Group as economic conditions and the Group’soperations develop.
Market Value of Land and BuildingsThe directors are of the opinion that the market value of properties at 31 December 2006 would exceed the net book values included in the financial statements, but they are unable to quantify this excess in the absence of a professional valuation, the costs of which are not considered justifiable in view of the group’s intention to retain ownership of its existing properties for use in its business for theforeseeable future.
Tanfield Group PLCAnnual report and financial statements 200620

Tanfield Group PLCAnnual report and financial statements 200621
Research and DevelopmentThe Group maintains a development programme as continuity of investment in this area is essential for the maintenance of the Group’smarket position and for future growth.
Events Since the End of the YearThere have been no significant events since the end of the year.
Disabled PersonsThe group will employ disabled persons when they appear to be suitable for a particular vacancy and every effort is made to ensure that theyare given full and fair consideration when such vacancies arise. Where existing employees become disabled, it is the Group’s policywherever practicable to provide continuing employment under normal terms and conditions and to provide training and career developmentto disabled employees wherever appropriate.
Employee InvolvementThe Group encourages the involvement of its employees though regular dissemination of information of particular concerns to employees.
To facilitate this, during the year, the company introduced a Communications Forum where all employees are represented by a colleaguewithin their department at regular meetings with senior managers.
DirectorsThe present membership of the board is set out on page 19. Changes since 1 January 2006 are as follows:
Resigned:
TP Robinson: Resigned: 13 June 2006JP Pither: Resigned: 27 January 2006
Appointed:
CD Brooks: Appointed: 13 June 2006BJ Campbell: Appointed: 20 October 2006
RRE Stanley resigned from his post as Chief Executive Officer on 25 September 2006 and was replaced by DS Kell.
Ordinary shares of £ 0.01eachDirectors shareholding 31 December 31 December
2006 2005
BeneficialRRE Stanley 24,649,292 29,499,292DS Kell — —CD Brooks — —BJ Campbell 6,119 —M Groak — —JN Bridge 27,541 27,541
All directors have the right to acquire shares in the company via the exercise of options granted under the terms of their service contracts,copies of which may be inspected by shareholders upon written application to the company secretary. Details of the directors’ options toacquire shares are set out in the Directors’ Remuneration Report on pages 25 to 27.
Policy on Payment of CreditorsIt is group policy to agree and clearly communicate the terms of payment as part of the commercial arrangements negotiated with suppliersand then to pay according to those terms based on the timely receipt of an accurate invoice. The company supports and the UK basedbusinesses follow the CBI Prompt Payers Code. A copy of the code can be obtained from the CBI at Centre Point, 103 New Oxford Street,London WC1A 1DU.
Trade creditor days based on creditors at 31 December 2006 were 58 days. (2005: 45 days)
Directors’ Report continued
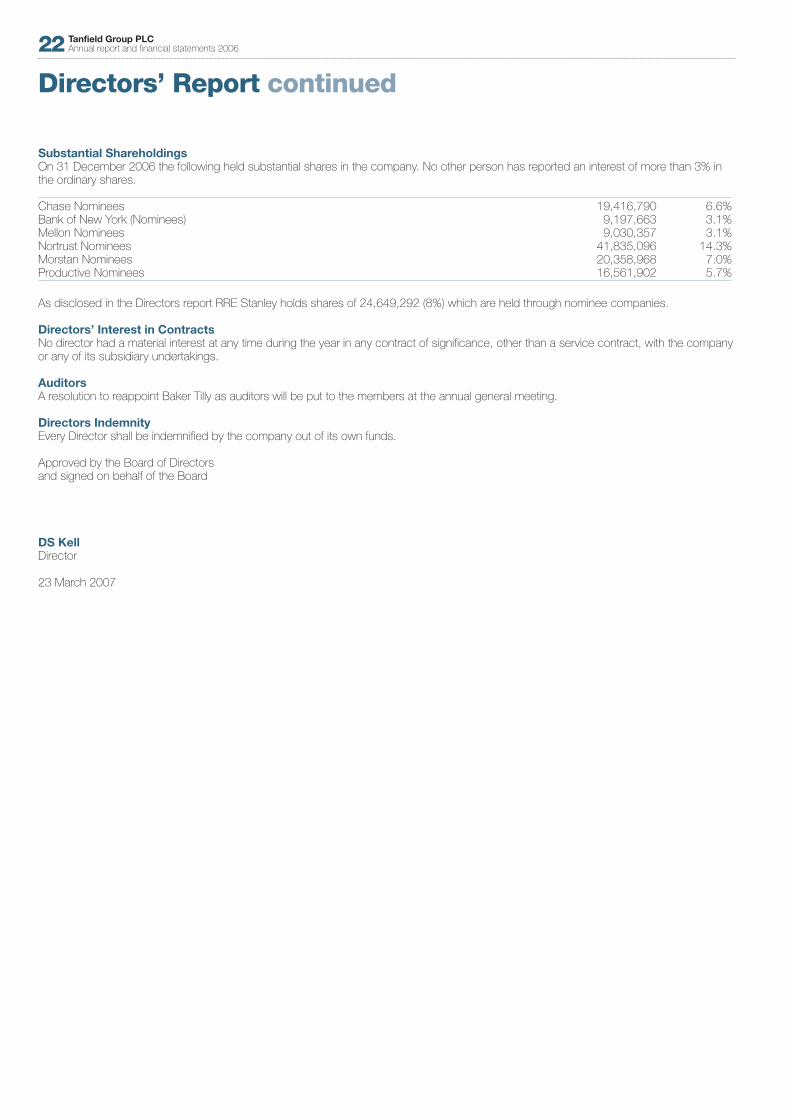
Substantial ShareholdingsOn 31 December 2006 the following held substantial shares in the company. No other person has reported an interest of more than 3% inthe ordinary shares.
Chase Nominees 19,416,790 6.6%Bank of New York (Nominees) 9,197,663 3.1%Mellon Nominees 9,030,357 3.1%Nortrust Nominees 41,835,096 14.3%Morstan Nominees 20,358,968 7.0%Productive Nominees 16,561,902 5.7%
As disclosed in the Directors report RRE Stanley holds shares of 24,649,292 (8%) which are held through nominee companies.
Directors’ Interest in ContractsNo director had a material interest at any time during the year in any contract of significance, other than a service contract, with the companyor any of its subsidiary undertakings.
AuditorsA resolution to reappoint Baker Tilly as auditors will be put to the members at the annual general meeting.
Directors IndemnityEvery Director shall be indemnified by the company out of its own funds.
Approved by the Board of Directors and signed on behalf of the Board
DS KellDirector
23 March 2007
Tanfield Group PLCAnnual report and financial statements 200622

Corporate Governance
Tanfield Group PLCAnnual report and financial statements 200623
Principles of Corporate GovernanceThe Company’s Board appreciates the value of good corporate governance not only in the areas of accountability and risk management butalso as a positive contribution to business prosperity. The Board is committed to achieving high standards of corporate governance andsupports the Combined Code on Corporate Governance (the “Code”), published in July 2003 by the Financial Reporting Council.
Board StructureDuring the year the Board comprised the Executive Chairman and Chief Executive, two other Executive Directors, and two independent Non-Executive Directors. From 1 January 2006 to 25 September 2006 the role of Chief Executive and Chairman were combined. From 25 September 2006 to 31 December 2006 the roles were split when RRE Stanley stepped down as Chief Executive.
Board RoleThe Board is responsible to shareholders for the proper management of the Group. The Non-Executive Directors have a particularresponsibility to ensure that the strategies proposed by the Executive Directors are fully considered. To enable the Board to discharge itsduties, all Directors have full and timely access to all relevant information and there is a procedure for all Directors, in furtherance of theirduties, to take independent professional advice, if necessary, at the expense of the Group. The Board has a formal schedule of mattersreserved to it. It is responsible for overall group strategy, approval of major capital expenditure projects and consideration of significantfinancing matters. The Board met on six separate occasions in the year and all Directors attended.
Appointment and Induction of DirectorsThe composition of the Board is kept under review with the aim of ensuring that the directors collectively possess the necessary skills andexperience to direct the Group’s business activities.
Board CommitteesThe Board delegates certain matters to its two principal committees, which deal with remuneration and audit.
Remuneration CommitteeThe Remuneration Committee comprises John Bridge (Chair) and Martin Groak.
The Remuneration Committee determines and agrees with the Board the framework of remuneration for the Executive Directors. The Boarditself determines the remuneration of the Non-Executive Directors.
The report on Directors’ remuneration is set out on pages 25 to 27.
Audit CommitteeThe Audit Committee comprised the Non-Executive Directors Martin Groak (Chair) and John Bridge. Meetings are also attended, by invitation, by the Executive Chairman, Chief Executive and Group Finance Director.
The Audit Committee is responsible for:
• Reviewing the scope of external audit, to receive regular reports from Baker Tilly.
• Reviewing the half-yearly and annual accounts prior to their recommendation to the Board.
• Reviewing the Group’s internal financial controls and risk management systems and processes.
• Making recommendations on the appointment, re-appointment and removal of external auditors and approving the terms of engagement.
• Reviewing the nature of the work and level of fees for non-audit services provided by the external auditors.
• Assessing the independence, objectivity and effectiveness of the external auditor.
The committee met on one occasion during the year and it was fully attended.
Internal ControlThe Board has overall responsibility for the Group’s system of internal control and risk management and for reviewing the effectiveness of thissystem. Such a system can only be designed to manage, rather than eliminate, the risk of failure to achieve business objectives and cantherefore only provide reasonable, and not absolute assurance against material misstatement or loss.
The Board is developing an ongoing process for identifying, evaluating and managing significant risks faced by the Group.
The Board are of the view that due to the current size and composition of the Group, that it is not necessary to establish an internal audit function.

Corporate Governance continued
Relations with ShareholdersThe Company values its dialogue with both institutional and private investors. Effective two-way communication with fund managers,institutional investors and analysts is actively pursued and this encompasses issues such as performance, policy and strategy. During theyear the directors had many meetings with institutional investors whose combined shareholdings represented over 80% of the total issuedshare capital of the Company.
Private investors are encouraged to participate in the Annual General Meeting at which the Chairman presents a review of the results andcomments on current business activity. The Chairmen of the Audit and Remuneration Committees will be available at the Annual GeneralMeeting to answer any shareholder questions.
This year’s Annual General Meeting will be held on 28 September 2007. The notice of the Annual General Meeting may be found on page 56.
Going ConcernThe directors confirm that they are satisfied that the Company and Group have adequate resources to continue in business for theforeseeable future. For this reason, they continue to adopt the going concern basis in preparing the financial statements.
Statement by the Directors on compliance with the Provisions of the Combined CodeThroughout the year ended 31 December 2006, the Group has partially complied with the provisions set out in Section 1 of the CombinedCode. The Board is planning to review this position and put processes in place in order to achieve substantial compliance by the end of thenext financial year.
Roy StanleyChairman
23 March 2007
Tanfield Group PLCAnnual report and financial statements 200624

Directors’ Remuneration Report
Tanfield Group PLCAnnual report and financial statements 200625
Remuneration CommitteeThe company has established a Remuneration Committee which is constituted in accordance with the recommendations of the Combined Code. The members of the committee are JN Bridge and M Groak who are both non-executive directors and the committee is chaired by JN Bridge.
In determining the directors’ remuneration for the year, the committee consulted the Chief Executive DS Kell and the Finance Director CD Brooks about its proposals.
Remuneration PolicyThe policy of the committee is to reward executive directors in order to recruit, motivate and retain high quality executives within acompetitive market place.
There are four main elements of the remuneration packages for executive directors and senior management:
• Basic annual salary (including directors’ fees) and benefits;• Annual bonus payments which cannot exceed 50 % of basic salary;• Share option incentives; and• Pension arrangements.
Basic salaryBasic salary is reviewed annually in March with increases taking effect from 1 April. In addition to basic salary, the executive directors alsoreceive certain benefits in kind, principally private medical insurance.
Annual bonusThe committee establishes the objectives which must be met for each financial year if a cash bonus is to be paid. The purpose of the bonusis to reward executive directors and other senior employees for achieving above average performance which also benefits shareholders. Themaximum performance related bonus that can be paid is 50% of basic salary. Incentive payments for the year ended 31 December 2006varied between 40% and 50%.
Share optionsThe executive directors have options granted to them under the terms of the Share Option Scheme. There are no performance conditionsattached to the share options.
Pension arrangements Executive directors are members of money purchase pension scheme to which the group contributes. Their dependants are eligible fordependants’ pension and the payment of a lump sum in the event of death in service. No other payments to directors are pensionable.
Directors’ ContractsIt is the company’s policy that executive directors should have contracts with an indefinite term providing for a maximum of one year’s notice.In the event of early termination, the directors’ contracts provide for compensation up to a maximum of basic salary for the notice period.
Non-Executive DirectorsThe fees of non-executive directors are determined by the board as a whole having regard to the commitment of time required and the levelof fees in similar companies.
Non-executive directors are employed on renewable fixed term contracts not exceeding three years.

Directors’ Remuneration Report continued
Performance GraphThe following graph shows the company’s performance, measured by closing share price, compared with the performance of the FTSE AimAll Share Index which has been selected by the Board as being the most appropriate measure as no readily identifiable benchmark group ofcompanies exists.
Audited InformationAggregate directors’ remunerationThe total amounts for director’s remuneration were as follows:
2006 2005£000’s £000’s
Emoluments 685 499Gain on exercise of share options 257 200Money purchase pension contributions 34 36
Total 976 735
Directors emolumentsPension Pension
Benefits Total Total Total Total Salary in kind Bonuses 2006 2005 2006 2005
£000’s £000’s £000’s £000’s £000’s £000’s £000’s
Executive DirectorsRRE Stanley 173 2 75 250 186 15 15TP Robinson 63 1 — 64 153 5 11DS Kell 123 1 75 199 136 11 10CD Brooks 60 1 30 91 — — —BJ Campbell 31 1 30 62 — 3 —
Non Executive DirectorsJP Pither — — — — 12 — —JN Bridge 8 — — 8 6 — —M Groak 11 — — 11 6 — —
469 6 210 685 499 34 36
0
200
400
600
800
1,000
1,200
1,400
1,600
1,800
Dec 03 Apr 04 Aug 04 Dec 04 Apr 05 Aug 05 Dec 05 Apr 06 Aug 06 Dec 06
Tanfield AIM All Share
Share Price
Reb
ased
Clo
sing
Pric
eTanfield Group PLCAnnual report and financial statements 200626

Tanfield Group PLCAnnual report and financial statements 200627
Directors Share Options
As at As at Exercise Date from31 December Granted/ 31 December Price which
2005 Lapsed Exercised 2006 (pence) exercisable Expiry Date
DS Kell 3,052,170 — — 3,052,170 0.01p 30/12/2003 04/12/2013— 3,500,000 — 3,500,000 20p 01/03/2009 01/03/2016
1,528,671 — — 1,528,671 2p 30/12/2003 04/12/2013
RRE Stanley — 3,500,000 — 3,500,000 20p 01/03/2009 01/03/2016
CD Brooks — 1,250,000 — 1,250,000 23p 14/06/2009 14/06/2016
BJ Campbell 1,000,000 — — 1,000,000 1p 14/09/2008 14/09/2015— 250,000 — 250,000 20p 01/03/2009 01/03/2016
JN Bridge — 150,000 — 150,000 20p 01/03/2009 01/03/2016
M Groak — 150,000 — 150,000 20p 01/03/2009 01/03/2016
On 29 December 2006 the market price of the ordinary shares was 55.25p. The range during 2006 was 18.0p to 56.0p.
ApprovalThis report was approved by the board of directors and authorised for issue on 23 March 2007 and signed on its behalf by:
John BridgeChairman of Remuneration Committee
23 March 2007

Directors’ Responsibilities in the Preparation of Financial StatementsThe directors are responsible for preparing the Annual Report and the financial statements in accordance with applicable law and regulations.UK company law requires the directors to prepare Group and Company Financial Statements for each financial year. Under that law thedirectors are required to prepare Group financial statements in accordance with International Financial Reporting Standards (“IFRS”) adoptedby the EU and have elected to prepare the company financial statements in accordance with IFRS.
The group financial statements are required by law and IFRS adopted by the EU to present fairly the financial position and performance of thegroup; the Companies Act 1985 provides in relation to such financial statements that references in the relevant part of that Act to financialstatements giving a true and fair view are references to their achieving a fair presentation.
The company financial statements are required by law to give a true and fair view of the state of affairs of the company.
In preparing each of the group and company financial statements, the directors are required to:
a. select suitable accounting policies and then apply them consistently;b. make judgements and estimates that are reasonable and prudent;c. for the group and company financial statements, state whether they have been prepared in accordance with IFRSs adopted by the EU;d. prepare the financial statements on the going concern basis unless it is inappropriate to presume that the group and the company will
continue in business.
The directors are responsible for keeping proper accounting records which disclose with reasonable accuracy at any time the financial positionof the company and to enable them to ensure that the financial statements comply with the requirements of the Companies Act 1985.
They are also responsible for safeguarding the assets of the group and hence for taking reasonable steps for the prevention and detection offraud and other irregularities.
The directors are also responsible for the maintenance and integrity of the Tanfield Group plc website.
Legislation in the United Kingdom governing the preparation and dissemination of financial statements may differ from legislation in other jurisdictions.
Tanfield Group PLCAnnual report and financial statements 200628

Independent Auditor’s Report to the Members of Tanfield Group PLC
Tanfield Group PLCAnnual report and financial statements 200629
We have audited the group and parent company financial statements which comprise Group Income Statement, the Group and ParentCompany Balance Sheets, the Group and Parent Company Cash Flow Statement, the Group and Parent Company Statement of Change inShareholders’ Equity, and the related notes.
This report is made solely to the company’s members, as a body, in accordance with section 235 of the Companies Act 1985. Our auditwork has been undertaken so that we might state to the company’s members those matters we are required to state to them in an auditor’sreport and for no other purpose. To the fullest extent permitted by law, we do not accept or assume responsibility to anyone other than thecompany and the company’s members as a body, for our audit work, for this report, or for the opinions we have formed.
Respective Responsibilities of Directors and AuditorsThe directors’ responsibilities for preparing the Annual Report and the financial statements in accordance with applicable law andInternational Financial Reporting Standards (IFRSs) as adopted by the European Union (“EU”) are set out in the Statement of Directors’Responsibilities.
Our responsibility is to audit the financial statements in accordance with relevant legal and regulatory requirements and InternationalStandards on Auditing (UK and Ireland).
We report to you our opinion as to whether the financial statements give a true and fair view and whether the financial statements have beenproperly prepared in accordance with the Companies Act 1985. We also report to you whether in our opinion the information given in theDirectors’ Report is consistent with the financial statements.
In addition we report to you if the company has not kept proper accounting records, if we have not received all the information andexplanations we require for our audit, or if information specified by law regarding directors’ remuneration and other transactions is notdisclosed.
We read other information contained in the Annual Report and consider whether it is consistent with the audited financial statements. The other information comprises only the Financial and Business Review, the Directors’ Report, Corporate Governance Report and Directors’Remuneration Report. We consider the implications for our report if we become aware of any apparent misstatements or materialinconsistencies with the financial statements. Our responsibilities do not extend to any other information.
Basis of Audit OpinionWe conducted our audit in accordance with International Standards on Auditing (UK and Ireland) issued by the Auditing Practices Board. An audit includes examination, on a test basis, of evidence relevant to the amounts and disclosures in the financial statements. It alsoincludes an assessment of the significant estimates and judgements made by the directors in the preparation of the financial statements,and of whether the accounting policies are appropriate to the group’s and company’s circumstances, consistently applied and adequatelydisclosed.
We planned and performed our audit so as to obtain all the information and explanations which we considered necessary in order to provideus with sufficient evidence to give reasonable assurance that the financial statements are free from material misstatement, whether causedby fraud or other irregularity or error. In forming our opinion we also evaluated the overall adequacy of the presentation of information in thefinancial statements.
OpinionIn our opinion:• the group financial statements give a true and fair view, in accordance with IFRSs as adopted by the European Union, as applied in
accordance with the provisions of the Companies Act 1985, of the state of the group’s affairs as at 31 December 2006 and of its profitfor the year then ended;
• the parent company financial statements give a true and fair view, in accordance with IFRSs as adopted by the European Union as appliedin accordance with the provisions of the Companies Act 1985, of the state of the parent company’s affairs as at 31 December 2006;
• the financial statements have been properly prepared in accordance with the Companies Act 1985; and• the information given in the Directors’ Report is consistent with the financial statements.
Baker TillyRegistered AuditorChartered Accountants1 St James’ GateNewcastle upon TyneNE1 4AD
23 March 2007

Consolidated Income Statementfor the year ended 31 December 2006
2006 2006 2005 2005Note £000’s £000’s £000’s £000’s
Continuing OperationsRevenue 2 40,913 22,431
Other operating income — 42Changes in inventories of finished goods and WIP 1,222 1,983Raw materials and consumables used (20,275) (9,112)Reversal of previously impaired assets — 69Staff costs 4 (11,290) (9,080)
Depreciation of tangible fixed assets (775) (742)Amortisation of intangible fixed assets (539) (158)Negative goodwill 2,130 1,356
Depreciation and amortisation expense 5 816 456Other operating expenses (5,946) (4,680)Restructuring costs (1,877) —
Profit from continuing operations 6 3,563 2,109
Finance costs 7 (105) (109)
Net Profit before tax for year 3,458 2,000Income tax expense 8 (846) (344)
Profit for the year from continuing operations 2,612 1,656Discontinued operations(Loss)/Profit for period from discontinued operations 9 (108) 38
Net profit for the year 2,504 1,694
Earnings per share 10From continuing operationsBasic 1.10p 1.00pDiluted 1.03p 0.97p
From continuing and discontinued operationsBasic 1.05p 1.03pDiluted 0.99p 0.99p
Tanfield Group PLCAnnual report and financial statements 200630

Consolidated Balance Sheetas at 31 December 2006
Tanfield Group PLCAnnual report and financial statements 200631
2006 2005Note £000’s £000’s
AssetsNon Current AssetsProperty, Plant and Equipment 11 3,734 4,015Goodwill 12 5,143 5,143Intangible Assets 13 5,792 3,213
14,669 12,371
Current AssetsInventories 15 14,158 4,377Trade and Other Receivables 16 13,833 5,700Investments 17 94 —Cash and Cash Equivalents 16 13,605 1,478
41,690 11,555
Total Assets 56,359 23,926
LiabilitiesCurrent LiabilitiesTrade and Other Payables 18 6,801 5,511Tax Liabilities 1,178 299Obligations Under Finance Leases 19 421 631Bank & Other Loans and Overdrafts 20 163 1,048Other Creditors 21 2,221 1,583
10,784 9,072
Non Current LiabilitiesBank & Other Loans 20 948 1,392Other Creditors 21 310 211Obligations Under Finance Leases 19 549 723Deferred Tax Liability 22 19 45Convertible Loan Notes 23 69 69Provisions 24 262 661
2,157 3,101
Total Liabilities 12,941 12,173
EquityShare Capital 25 2,921 1,905Share Premium Account 26 29,578 1,509Share Option reserve 26 255 308Loan Stock Equity Reserve 26 6 6Merger Reserve 26 1,534 1,534Capital Reduction Reserve 26 7,228 7,228Profit And Loss Account 27 1,896 (737)
Total Equity 43,418 11,753
Total Equity and Liabilities 56,359 23,926
The financial statements on pages 30 to 55 were approved by the board of directors and authorised for issue on 23 March 2007 and aresigned on its behalf by:
Roy StanleyChairman

Company Balance Sheetas at 31 December 2006
2006 2005Note £000’s £000’s
AssetsNon Current AssetsInvestments in Subsidiary 14 2,286 2,286
2,286 2,286
Current AssetsTrade and Other Receivables 16 25,885 10,034Cash and Cash Equivalents 16 13,093 1,421
38,978 11,455
Total Assets 41,264 13,741
LiabilitiesCurrent Liabilities Trade and other payables 18 178 432Bank Loans and Overdrafts 20 — 438
178 870
Non-current LiabilitiesBank Loans 20 — 312Convertible Loan Notes 23 69 69
69 381
Total Liabilities 247 1,251
EquityCalled up share capital 25 2,921 1,905Share premium Account 26 29,578 1,509Share Option Reserve 26 255 308Merger reserve 26 1,534 1,534Loan Stock Equity Reserve 26 6 6Capital Reduction Reserve 26 7,228 7,228Profit & Loss Account 27 (505) —
Total Equity 41,017 12,490
Total Equity and Liabilities 41,264 13,741
Tanfield Group PLCAnnual report and financial statements 200632

Consolidated Statement of Changes in Equityfor the year ended 31 December 2006
Tanfield Group PLCAnnual report and financial statements 200633
Capital Loan stock Profit and Share Share option Share reduction equity Merger loss Totalcapital reserve premium reserve reserve reserve account equity£000’s £000’s £000’s £000’s £000’s £000’s £000’s £000’s
Balance at 1 January 2006 1,905 308 1,509 7,228 6 1,534 (737) 11,753
Issue of new share capital 1,000 — 28,055 — — — — 29,055Exercise and Grant of share options 16 (53) 14 — — — 129 106Net profit for the year — — — — — — 2,504 2,504
Balance at 31 December 2006 2,921 255 29,578 7,228 6 1,534 1,896 43,418
Company Statement of Changes in Equityfor the year ended 31 December 2006
Capital Loan stock Profit and Share Share option Share reduction equity Merger loss Totalcapital reserve premium reserve reserve reserve account equity£000’s £000’s £000’s £000’s £000’s £000’s £000’s £000’s
Balance at 1 January 2006 1,905 308 1,509 7,228 6 1,534 — 12,490
Issue of new share capital 1,000 — 28,055 — — — — 29,055Exercise and Grant of share options 16 (53) 14 — — — 129 106Net loss for the year — — — — — — (634) (634)
Balance at 31 December 2006 2,921 255 29,578 7,228 6 1,534 (505) 41,017

Consolidated Cash Flow Statementfor the year ended 31 December 2006
2006 2005Note £000’s £000’s
Operating ActivitiesCash used in operations 28 (7,248) (1,990)Interest paid (208) (207)
Net Cash used in Operating activities (7,456) (2,197)
Investing ActivitiesAcquisitions 29 (6,851) (324)Purchase of property, plant and equipment (503) (2,562)Proceeds from sale of property plant and equipment 150 —Purchase of investments (94) —Purchase of intangible fixed assets (312) (1,488)Interest received 34 98
Net cash used in investing activities (7,576) (4,276)
Financing ActivitiesIssue of ordinary share capital 29,055 6,886Repayment of bank loan (870) 742Capital element of finance leases (567) (121)
Net cash from financing 27,618 7,507
Net Increase in Cash and Cash Equivalents 12,586 1,034Cash and cash Equivalents at beginning of Year 960 (74)
Cash and Cash equivalents at end of the year 13,546 960
Tanfield Group PLCAnnual report and financial statements 200634

Company Cash Flow Statementfor the year ended 31 December 2006
Tanfield Group PLCAnnual report and financial statements 200635
2006 2005£000’s £000’s
Operating ActivitiesLoss before tax and interest expense (700) (4,407)Amortisation of loan capital interest — 24(Increase) in debtors (15,751) (6,230)(Decrease)/Increase in creditors and other provisions (177) (216)Interest paid (38) (21)
Net Cash used in Operating activities (16,666) (10,850)
Investing ActivitiesInterest Received 34 99
Net cash from investing activities 34 99
Financing ActivitiesProceeds from issue of share capital 29,055 6,886(Repayment)/Increase in Bank Loans (750) 750
Net Cash from Financing Activities 28,305 7,636
Net (decrease)/increase in cash and cash equivalents 11,673 (3,115)Cash and cash equivalents at beginning of Year 1,420 4,535
Cash and Cash equivalents at end of the year 13,093 1,420

Consolidated Financial StatementsSummary of Significant Accounting PoliciesThe financial statements have been prepared in accordance with International Financial Reporting Standards (“IFRS”).
The financial statements have been prepared on the historical cost basis. The principal accounting policies adopted are set out below.
Basis of consolidationThe consolidated financial statements incorporate the financial statements of the Company and enterprises controlled by the Company (itssubsidiaries) made up to 31 December each year. The excess of cost of acquisition over the fair values of the Group’s share of identifiablenet assets acquired is recognised as goodwill. Any deficiency of the cost of acquisition below the fair value of identifiable net assets acquired(i.e. discount on acquisition) is recognised directly in the income statement.
The purchase method of accounting is used to account for the acquisition of subsidiaries by the Group. The costs of an acquisition aremeasured as the fair value of the assets given equity instruments issued and liabilities incurred or assumed at the date of exchange, pluscosts directly attributable to the acquisition. Identifiable assets acquired and liabilities and contingent liabilities assumed in a businesscombination are initially measured at fair value at acquisition date irrespective of the extent of any minority interest.
The results of subsidiaries acquired or disposed of during the year are included in the consolidated income statement from the effective dateof acquisition or up to the effective date of disposal, as appropriate.
Where necessary, adjustments are made to the financial statements of subsidiaries to bring the accounting policies used into line with thoseused by other members of the Group.
All intra-group transactions, balances, and unrealised gains on transactions between group companies are eliminated on consolidation.Unrealised losses are also eliminated unless the transaction provides evidence of an impairment of the asset transferred.
GoodwillGoodwill arising on consolidation represents the excess of the cost of acquisition over the Group’s interest in the fair value of the identifiableassets and liabilities of a subsidiary, associate or jointly controlled entity at the date of acquisition.
Goodwill on acquisition of subsidiaries is included in intangible assets.
Goodwill is recognised as an asset and reviewed for impairment at least annually. Any impairment is recognised immediately in the incomestatement and is not subsequently reversed.
Goodwill is allocated to cash generating units for the purpose of impairment testing.
On disposal of a subsidiary the attributable amount of goodwill is included in the determination of the profit or loss on disposal.
Goodwill arising on acquisitions before the date of transition to IFRS has been retained at the previous UK GAAP amounts subject to beingtested for impairment at that date. Goodwill written off to reserves under UK GAAP prior to 1998 has not been reinstated and is not includedin determining any subsequent profit or loss on disposal.
Goodwill has been re-stated on transition to IFRS as certain intangible assets, which were not recognised under UK GAAP, have now beenseparately classified.
No negative goodwill was eliminated on transition to IFRS.
Revenue recognitionService revenue is measured at the fair value of the consideration received or receivable and represents amounts receivable for goods andservices provided in the normal course of business, net of discounts, VAT and other sales related taxes.
Revenue from the sale of goods is recognised when goods are delivered and title has passed.
LeasingLeases are classified as finance leases whenever the terms of the lease transfer substantially all the risks and rewards of ownership to thelessee. All other leases are classified as operating leases.
Assets held under finance leases are recognised as assets of the Group at their fair value or, if lower, at the present value of the minimumlease payments, each determined at the inception of the lease. The corresponding liability to the lessor is included in the balance sheet as a finance lease obligation. Lease payments are apportioned between finance charges and reduction of lease obligation so as to achievea constant rate of interest on the remaining balance of the liability. Finance charges are charged directly against income.
Rentals payable under operating leases are charged to income on a straight-line basis over the term of the relevant lease.
Tanfield Group PLCAnnual report and financial statements 200636

Tanfield Group PLCAnnual report and financial statements 200637
Borrowing costsAll borrowing costs are recognised in the income statement in the period in which they are incurred.
Foreign currenciesTransactions in currencies other than pounds are recorded at the rates of exchange prevailing on the dates of the transactions. At eachbalance sheet date, monetary assets and liabilities that are denominated foreign currencies are retranslated at the rates prevailing on thebalance sheet date. Non-monetary assets and liabilities carried at fair value that are denominated in foreign currencies are translated at therates prevailing at the date when the fair value was determined. Gains and losses arising on retranslation are included in the incomestatement for the period, except for exchange differences on non-monetary assets and liabilities where the changes in fair value arerecognised directly in equity.
On consolidation, the assets and liabilities of the Group’s overseas operations are translated at exchange rates prevailing on the balancesheet date. Income and expense items are translated at the average exchange rates for the period. Unrealised exchange differences arising,if any, are classified as equity and transferred to the Group’s translation reserve. Such translation differences are recognised as income or asexpenses in the period in which the operation is disposed of.
PensionsPayments to defined contribution retirement benefit schemes are charged as an expense as they fall due.
Share Based PaymentsThe Group issues equity-settled share based payments to certain employees and has applied the requirements of IFRS2 “Share-basedpayments”.
Equity settled share-based payments are measured at fair value at the date of the grant. Fair value is measured using a Black-Scholes model.The fair value is expensed on a straight line basis over the vesting period, based on the Group’s estimate of shares that will eventually vest.
TaxationThe tax expense represents the sum of the tax currently payable and deferred tax.
The tax currently payable is based on taxable profit for the year. Taxable profit differs from net profit as reported in the income statementbecause it excludes items of income or expense that are taxable or deductible in other years and it further excludes items that are nevertaxable or deductible. The Group’s liability for current tax is calculated by using tax rates that have been enacted or substantively enacted bythe balance sheet date.
Deferred tax is the tax expected to be payable or recoverable on differences between the carrying amount of assets and liabilities in thefinancial statements and the corresponding tax bases used in the computation of taxable profit, and is accounted for using the balancesheet liability method. Deferred tax liabilities are recognised for all taxable temporary differences and deferred tax assets are recognised tothe extent that it is probable that taxable profits will be available against which deductible temporary differences can be utilised. Such assetsand liabilities are not recognised if the temporary difference arises from goodwill or from the initial recognition (other than in a businesscombination) of other assets and liabilities in a transaction which affects neither the tax profit nor the accounting profit.
Deferred tax liabilities are recognised for taxable temporary differences arising on investments in subsidiaries except where the Group is ableto control the reversal of the temporary difference and it is probable that the temporary difference will not reverse in the foreseeable future.
Deferred tax is calculated at the tax rates that are expected to apply to the period when the asset is realised or the liability is settled. Deferredtax is charged or credited in the income statement, except when it relates to items credited or charged directly to equity, in which case thedeferred tax is also dealt with in equity.
Consolidated Financial Statements Summary of Significant Accounting Policies continuedProperty, plant and equipmentLand and buildings held for use in the production or supply of goods or services, or for administrative purposes, are stated in the balancesheet at cost less any subsequent accumulated depreciation.
Fixtures and equipment are stated at cost less accumulated depreciation and any recognised impairment loss.
Depreciation is charged so as to write off the cost of assets over their estimated useful lives, using the straight-line method, on the following bases:
Plant and Machinery over 3-10 yearsShort Leasehold Property Alterations over the lifetime of the leaseFixtures, fittings and equipment over 3-10 yearsMotor Vehicles over 3-5 years
Assets held under finance leases are depreciated over their expected useful lives on the same basis as owned assets or, where shorter, theterm of the relevant lease.
The gain or loss arising on the disposal or retirement of an asset is determined as the difference between the sales proceeds and thecarrying amount of the asset and is recognised in income.
Internally-generated intangible assets – research and development expenditureExpenditure on research activities is recognised as an expense in the period in which it is incurred.
An internally-generated intangible asset arising from the Group’s business development is recognised only if all of the following conditions are met:
• an asset is created that can be identified;• it is probable that the asset created will generate future economic benefits; and• the development cost of the asset can be measured reliably.
Where no internally-generated intangible asset can be recognised, development expenditure is recognised as an expense in the period inwhich it is incurred.
Internally-generated intangible assets are amortised on a straight-line basis over their useful lives. (10 to 15 years)
Intangible assets Computer Software is stated at cost less any accumulated amortisation. The software is amortised over a period of 5 years on a straight line basis.
Other intangible assets have been brought in on the acquisition of businesses and capitalised at a fair value. The intangible assets areamortised over the relevant accounting period, ranging from 5 to 10 years on a straight line basis.
Impairment of tangible and intangible assets excluding goodwillAt each balance sheet date, the Group reviews the carrying amounts of its tangible and intangible assets to determine whether there is anyindication that those assets have suffered an impairment loss. If any such indication exists, the recoverable amount of the asset is estimatedin order to determine the extent of the impairment loss. Where the asset does not generate cash flows that are independent from otherassets, the Group estimates the recoverable amount of the cash-generating unit to which the asset belongs. An intangible asset with anindefinite useful life is tested for impairment annually and whenever there is an indication that the asset may be impaired.
Recoverable amount is the higher of fair value less costs to sell and value in use. In assessing value in use, the estimated future cash flowsare discounted to their present value using a pre-tax discount rate that reflects current market assessments of the time value of money andthe risks specific to the asset for which the estimates of future cash flows have been adjusted.
If the recoverable amount of an asset (or cash-generating unit) is estimated to be less than its carrying amount, the carrying amount of theasset (cash-generating unit) is reduced to its recoverable amount. An impairment loss is recognised as an expense immediately, unless therelevant asset is carried at a revalued amount, in which case the impairment loss is treated as a revaluation decrease.
Where an impairment loss subsequently reverses, the carrying amount of the asset (cash-generating unit) is increased to the revisedestimate of its recoverable amount, but so that the increased carrying amount does not exceed the carrying amount that would have beendetermined had no impairment loss been recognised for the asset (cash-generating unit) in prior years. A reversal of an impairment loss isrecognised as income immediately, unless the relevant asset is carried at a revalued amount, in which case the reversal of the impairmentloss is treated as a revaluation increase.
Tanfield Group PLCAnnual report and financial statements 200638

Tanfield Group PLCAnnual report and financial statements 200639
InventoriesInventories are stated at the lower of cost and net realisable value. Cost comprises direct materials and, where applicable, direct labourcosts and those overheads that have been incurred in bringing the inventories to their present location and condition. Cost is calculatedusing the weighted average method. Net realisable value represents the estimated selling price less all estimated costs to completion andcosts to be incurred in marketing, selling and distribution.
Financial instrumentsFinancial assets and financial liabilities are recognised on the Group’s balance sheet when the Group has become a party to the contractualprovisions of the instrument.
Trade receivablesTrade receivables do not carry any interest and are stated at their nominal value as reduced by appropriate allowances for estimatedirrecoverable amounts.
Cash and cash equivalentsCash and cash equivalents comprise cash on hand less short term bank overdrafts.
Financial liability and equityFinancial liabilities and equity instruments are classified according to the substance of the contractual arrangements entered into. An equityinstrument is any contract that evidences a residual interest in the assets of the group after deducting all of its liabilities.
Bank borrowingsInterest-bearing bank loans and overdrafts are recorded at the proceeds received, net of direct issue costs. Finance charges, includingpremiums payable on settlement or redemption, are accounted for on an accrual basis and are added to the carrying amount of theinstrument to the extent that they are not settled in the period in which they arise.
Convertible loan notesConvertible loan notes are regarded as compound instruments, consisting of a liability component and an equity component. At the date ofissue, the fair value of the liability component is estimated using the prevailing market interest rate for similar non-convertible debt. Thedifference between the proceeds of issue of the convertible loan notes and the fair value assigned to the liability component, representingthe embedded option to convert the liability into equity of the Group, is included in equity.
Issue costs are apportioned between the liability and equity components of the convertible loan notes based on their relative carryingamounts at the date of issue. The portion relating to the equity component is charged directly against equity.
Trade payablesTrade payables are not interest bearing and are stated at their nominal value.
Equity instrumentsEquity instruments issued by the company are recorded at the proceeds received, net of direct issue costs.
ProvisionsProvisions are recognised when the Group has a present obligation as a result of a past event which it is probable will result in an outflow ofeconomic benefits that can be reliably estimated.
Critical accounting estimates and judgementsEstimates and judgements are continually evaluated and are based on historical experience and other factors, including expectations offuture events that are believed to be reasonable under the circumstances. There are no estimates and assumptions in the financialstatements which could have a critical effect on the next financial year.

Notes to the Consolidated Financial Statementsfor the year ended 31 December 2006
1. Presentation of Financial StatementsThe financial statements have been prepared in accordance with International Financial Reporting Standards (“IFRS”).
These financial statements are presented in Sterling since that is the currency in which the majority of the Group’s transactions aredenominated.
2. Revenue (Group)
2006 2005An analysis of the Group’s Revenue is as follows: £000’s £000’s
Continuing OperationsPowered Access Platforms 11,330 4,416Zero Emission Vehicles 19,966 9,564Engineering 9,617 8,451
40,913 22,431
3. Business and Geographical Segments (Group)Business segmentsFor management purposes, the Group is currently organised into three operating divisions – Powered Access Platforms, Zero EmissionVehicles and Engineering. These divisions are the basis on which the Group reports its primary segment information.
Principal activities are as follows:Powered Access Platforms: design and manufacture of powered access equipment.Zero Emission Vehicles: design, manufacture, service and maintenance of electric vehicles.Engineering: design and manufacture of engineering parts.
As disclosed in the Directors report the structure of the business has changed into the segments outlined above, to reflect the way inwhich the business is managed. The 2005 segmental analysis has been restated to show prior year comparatives.
Segment information about these businesses is presented on the next page.
Tanfield Group PLCAnnual report and financial statements 200640
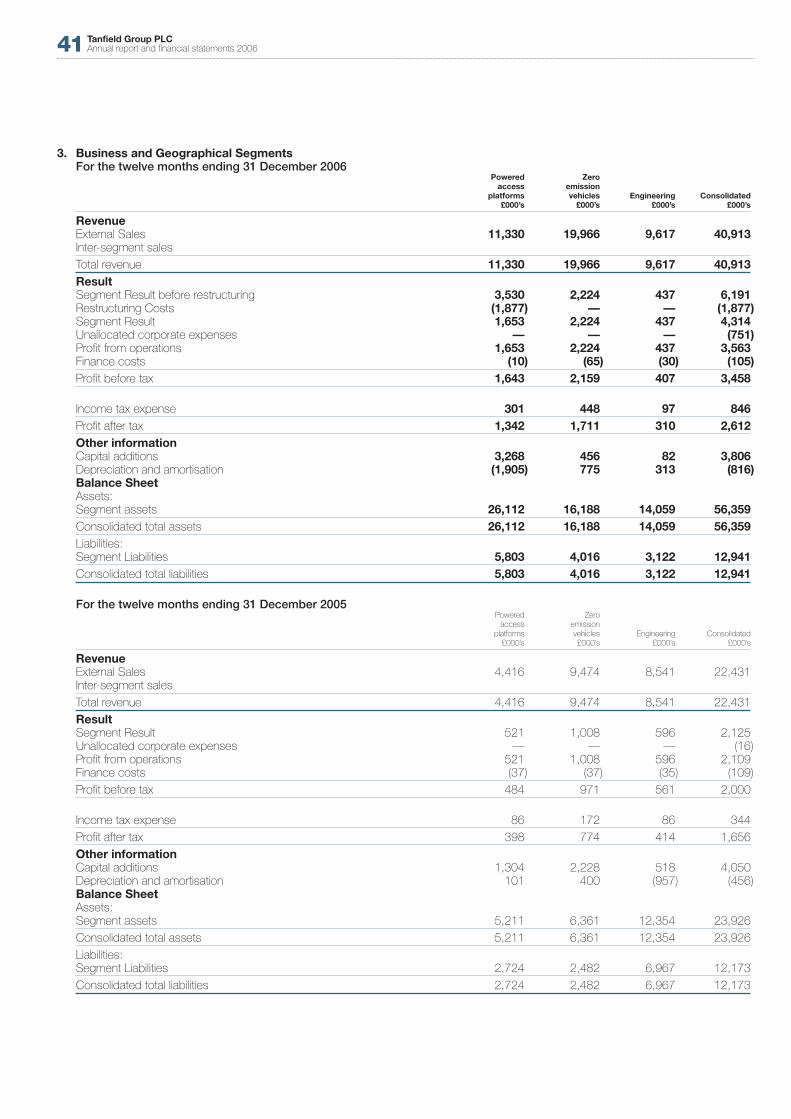
Tanfield Group PLCAnnual report and financial statements 200641
3. Business and Geographical SegmentsFor the twelve months ending 31 December 2006
Powered Zero access emission
platforms vehicles Engineering Consolidated£000’s £000’s £000’s £000’s
RevenueExternal Sales 11,330 19,966 9,617 40,913Inter-segment sales
Total revenue 11,330 19,966 9,617 40,913ResultSegment Result before restructuring 3,530 2,224 437 6,191Restructuring Costs (1,877) — — (1,877)Segment Result 1,653 2,224 437 4,314Unallocated corporate expenses — — — (751)Profit from operations 1,653 2,224 437 3,563Finance costs (10) (65) (30) (105)Profit before tax 1,643 2,159 407 3,458
Income tax expense 301 448 97 846Profit after tax 1,342 1,711 310 2,612Other informationCapital additions 3,268 456 82 3,806Depreciation and amortisation (1,905) 775 313 (816)Balance SheetAssets:Segment assets 26,112 16,188 14,059 56,359Consolidated total assets 26,112 16,188 14,059 56,359Liabilities:Segment Liabilities 5,803 4,016 3,122 12,941Consolidated total liabilities 5,803 4,016 3,122 12,941
For the twelve months ending 31 December 2005Powered Zero
access emissionplatforms vehicles Engineering Consolidated
£000’s £000’s £000’s £000’s
RevenueExternal Sales 4,416 9,474 8,541 22,431Inter-segment sales
Total revenue 4,416 9,474 8,541 22,431
ResultSegment Result 521 1,008 596 2,125Unallocated corporate expenses — — — (16)Profit from operations 521 1,008 596 2,109Finance costs (37) (37) (35) (109)
Profit before tax 484 971 561 2,000
Income tax expense 86 172 86 344
Profit after tax 398 774 414 1,656
Other informationCapital additions 1,304 2,228 518 4,050Depreciation and amortisation 101 400 (957) (456)Balance SheetAssets:Segment assets 5,211 6,361 12,354 23,926
Consolidated total assets 5,211 6,361 12,354 23,926
Liabilities:Segment Liabilities 2,724 2,482 6,967 12,173
Consolidated total liabilities 2,724 2,482 6,967 12,173

Notes to the Consolidated Financial Statementsfor the year ended 31 December 2006
3. Business and Geographical Segments (continued)Geographical SegmentsThe Group’s operations are located in the UK, US and Japan.
The following table provides an analysis of the Group’s sales by geographic market, irrespective of the origin of the goods/services.
2006 2005£000’s £000’s
UK 17,193 17,093Europe 18,709 425USA 2,850 2,992Other 2,161 1,921
40,913 22,431
In 2005, revenue from discontinued operations totalled £387,000 and was from the UK.
The following is an analysis of the carrying amount of segment assets, and additions to property, plant and equipment and intangibleassets analysed by the geographical area in which the assets are located:
Additions to property, plant, Carrying amount of segment assets equipment and intangible assets
2006 2005 2006 2005£000’s £000’s £000’s £000’s
UK 52,591 23,926 3,761 4,050USA 1,936 — 30 —Japan 1,832 — 15 —
56,359 23,926 3,806 4,050
4. Staff Costs (Group)2006 2005
Average monthly number of employees Production 356 386Head Office and Administration 166 78
Total 522 464
2006 2005£000’s £000’s
Aggregate remuneration comprisedWages and Salaries 10,498 8,228Social Security Costs 968 720Other Pension Costs 236 132
Total 11,702 9,080
Details of Directors’ fees and salaries, bonuses, pensions, benefits in kind and other benefit schemes together with details in respect ofDirectors’ share option plans are given in the audited section of the Directors Remuneration Report on pages 25 to 27.
5. Depreciation and Amortisation2006 2005
£000’s £000’s
Depreciation of tangible fixed assets 775 742Amortisation of intangible fixed assets 539 158Negative goodwill (2,130) (1,356)
Total (816) (456)
Tanfield Group PLCAnnual report and financial statements 200642

Tanfield Group PLCAnnual report and financial statements 200643
6. Profit from Operations (Group)Profit from operations has been arrived at after charging /(crediting):
2006 2005£000’s £000’s
Operating lease rentals (206) (71)Depreciation– owned assets 615 597– leased assets 161 145Directors emoluments 685 735Amortisation of intangible fixed assets 539 159(Profit)/Loss on sale of fixed assets (7) 102Money purchase pension contributions 41 28Negative goodwill (2,130) (1,356)Staff costs (see Note 4) 11,702 9,080Share options granted 76 192Net loss on foreign exchange 19 —Auditors’ remuneration (see below) 158 80
The negative goodwill arises from the difference between the fair value and costs of assets purchased under the Upright PoweredAccess deal.
Negative goodwill in the prior year arose on the purchase of Norquip.
Restructuring costs of £1.8m are from the acquisition of the Upright Business. The costs relate to moving the business from Ireland tothe UK, employment costs in respect of cross training and rent of additional factory space whilst the new building was being completed.
2006 2005Amounts payable to Baker Tilly in respect of both audit and non audit services £000’s £000’s
Audit Services– statutory audit 100 68Further assurance servicesTax services– compliance services — 12– advisory services 11 —Other Services 47 —
158 80
Comprising:– audit services 100 68– non audit services 58 12
158 80
7. Finance Costs (Group)2006 2005
£000’s £000’s
Interest on bank overdrafts and loans 124 10Interest on Invoice Discounting 50 15Interest on obligations under finance leases 34 182
Total borrowing costs 208 207
Less Interest Receivable 103 98
105 109

Notes to the Consolidated Financial Statementsfor the year ended 31 December 2006
8. Income Tax Expense (Group)2006 2005
£000’s £000’s
Current TaxDomestic – current year 1,055 299Domestic – prior year (224) —Foreign 41 —
872 299
Deferred TaxCurrent year 4 45Prior Year (30) —
(26) 45
846 344
2006 2005£000’s £000’s
Profit before tax 3,350 2,038
Tax at the domestic income tax rate 30% (2005: 30%) 1,005 611Tax effect of expenses that are not deductiblein determining taxable profit 115 —Capital allowances in excess of depreciation 26 (26)Short term timing differences (19) (29)Tax losses for which no relief available 52 (257)Tax effect of utilisation of tax losses not previously recognised (125) —Effect of different tax rates of subsidiaries operating in other jurisdictions 42 —
Tax expense and effective tax rate for the year 1,096 299
9. Discontinued Operations (Group)2006 2005
£000’s £000’s
Revenue — 387Operating costs (84) (139)Finance costs (24) (210)
Profit/(loss) before tax (108) 38Income tax expense — —
Profit/(Loss) on ordinary activities after tax (108) 38
Discontinued operations relate to the costs of a non trading company, Express 2 Automotive Ltd, in respect of leasing costs, financecosts and management charges.
Tanfield Group PLCAnnual report and financial statements 200644

Tanfield Group PLCAnnual report and financial statements 200645
10. Earnings per Share (Group)Including discontinuing operations
The calculation of the basic and diluted earnings per share is based on the following data:2006 2005
Earnings £000’s £000’s
Earnings for the purposes of basic earnings per share 2,504 1,694Effect of dilutive potential ordinary shares:– interest on convertible loan notes 14 14
Earnings for the purposes of diluted earnings per share 2,490 1,680
Number of shares 2006 2005
Weighted average number of ordinary shares for the purposes of basic earnings per share 237,396,217 165,038,027 Effect of dilutive potential ordinary shares:Convertible Loan Notes 789,474 789,474 Share Options 14,453,671 4,057,342
Weighted average number of ordinary shares for the purposes of diluted earnings per share 252,639,361 169,884,843
From continuing operationsThe calculation of the basic and diluted earnings per share is based on the following data:
2006 2005Earnings £000’s £000’s
Earnings for the purposes of basic earnings per share 2,614 1,656Effect of dilutive potential ordinary shares:– interest on convertible loan notes 14 14
Earnings for the purposes of diluted earnings per share 2,600 1,642
From discontinued operations
2006 2005
Basic (0.05)p 0.02pDiluted (0.05)p 0.02p
11. Property, Plant and Equipment (Group)Leasehold Fixtures,
property and Plant & Fittings & Motoralterations Machinery equipment Vehicles Total
£000’s £000’s £000’s £000’s £000’s
At 1 January 2005Cost 1,344 4,743 806 751 7,644Accumulated Depreciation (797) (3,879) (669) (10) (5,355)
Net Book Value 547 864 137 741 2,289
Year Ended 31 December 2005Opening Net Book Value 547 864 137 741 2,289Additions 1,366 685 73 436 2,560Acquired on Acquisition of Subsidiary — — 7 — 7Disposals (633) (1,286) (4) (304) (2,227)Reversal of assets previously impaired — 2 — — 2Depreciation Charge (86) (280) (76) (300) (742)Depreciation eliminated on disposals 633 1,286 2 205 2,126
Closing Net Book Value 1,827 1,271 139 778 4,015
At 31 December 2005Cost 2,077 4,144 967 883 8,071Accumulated Depreciation (250) (2,873) (828) (105) (4,056)
Net Book Value 1,827 1,271 139 778 4,015

Notes to the Consolidated Financial Statementsfor the year ended 31 December 2006
11. Property, Plant and Equipment (Group) (continued)Leasehold Fixtures,
property and Plant & Fittings & Motoralterations Machinery equipment Vehicles Total
£000’s £000’s £000’s £000’s £000’s
Year Ended 31 December 2006Opening Net Book Value 1,827 1,271 139 778 4,015Additions 104 114 52 418 688Disposals — — (47) (384) (431)Depreciation Charge (107) (403) (53) (262) (825)Depreciation eliminated on disposals — — 6 281 287Closing Net Book Value 1,824 982 97 831 3,734
At 31 December 2006Cost 2,181 4,258 972 917 8,328Accumulated Depreciation (357) (3,276) (875) (86) (4,594)Net Book Value 1,824 982 97 831 3,734
The net book value of assets held under finance leases and hire purchase agreements is £877,050 (2005: £924,000). The net bookvalue of £877,050 is split with £317,050 being motor vehicles and £560,000 being plant and machinery.
12. Goodwill (Group)2006
£000’s
CostAt 1 January and 31 December 2006 5,644
Accumulated Impairment LossesAt 1 January and 31 December 2006 501
Carrying AmountAt 1 January and 31 December 2006 5,143
13. Intangible Assets (Group)Other
Development intangible Computercosts assets software Total
£000’s £000’s £000’s £000’s
At 1 January 2005Cost — 560 145 705Accumulated Amortisation — — (101) (101)
Net Book Value — 560 44 604
Year Ended 31 December 2005Opening Net Book Value — 560 44 604Additions 1,460 — 28 1,488Acquired on Acquisition of Subsidiary — 1,256 — 1,256Amortisation Charge — (112) (23) (135)
Closing Net Book Value 1,460 1,704 49 3,213
At 31 December 2005Cost 1,460 1,816 173 3,449Accumulated Amortisation — (112) (124) (236)
Net Book Value 1,460 1,704 49 3,213
Tanfield Group PLCAnnual report and financial statements 200646

Tanfield Group PLCAnnual report and financial statements 200647
13. Intangible Assets (Group) (continued)Other
Development intangible Computercosts assets software Total
£000’s £000’s £000’s £000’s
Year Ended 31 December 2006Opening Net Book Value 1,460 1,704 49 3,213Additions 249 — 64 313Acquired on Acquisition of Subsidiary — 2,805 — 2,805Amortisation Charge (146) (363) (30) (539)Closing Net Book Value 1,563 4,146 83 5,792
At 31 December 2006Cost 1,709 4,621 237 6,567Accumulated Amortisation (146) (475) (154) (775)Net Book Value 1,563 4,146 83 5,792
The development costs in the year are in relation to the new product developments commenced in the year which includes the Newtonand other Zero Emission vehicles.
Other intangible assets include trademarks, manufacturing schedule, customer order book and customer list which arose on acquisitionof the Upright business in the current year. The brought forward values of other intangible assets arose on the acquisition of the Norquipand the SEV business.
14. Subsidiaries (Group)Details of the Company’s subsidiaries at 31 December 2006 are as follows:
Place of Proportion of Proportion of incorporation ownership voting power
(or registration) interest heldName of subsidiary and operation % % Principal activity
Tanfield Engineering Systems Ltd UK 100 100 Powered Access Equipment,Zero Emmission Vehicles & Engineering
SEV Group Ltd UK 100 100 Vehicle Service, Hire & MaintenanceE-Comeleon Ltd UK 100 100 Graphical ImagingJoeKnowsIt? Ltd UK 74 74 Software TrainingClick Here Ltd UK 100 100 TrainingExpress 2 Automotive Ltd UK 100 100 Non TradingSandco 854 Ltd UK 100 100 Holding CompanySaxon Specialist Vehicles Ltd UK 100 100 DormantHMH Sheet Metal Fabrications Ltd UK 100 100 DormantNorquip Ltd UK 100 100 DormantYEV Ltd UK 100 100 Dormant
The minority interest in JoeKnowsIt? Limited has not been recognised as JoeKnowsIt? Limited has net liabilities which are unlikely to berecoverable from the third party.
The investments held in the Company accounts represent £2.1m in Tanfield Engineering Systems Limited and £0.2m in E-Comeleon Limited.
15. Inventories (Group)2006 2005
£000’s £000’s
Raw materials and consumables 9,924 2,612Work-in-progress 3,342 1,263Finished Goods and goods for resale 892 502
14,158 4,377

Notes to the Consolidated Financial Statementsfor the year ended 31 December 2006
16. Other Financial Assets (Group)Trade and other receivables comprise amounts receivable from the sale of goods of £13.2m (2005: £4.7m). An allowance has beenmade for estimated irrecoverable amounts from the sale of goods of £0.06 million (2005: £0.06m). This allowance has been determinedby reference to past default experience.
The average credit period taken on sale of goods is 95 days.
The group has an invoice discounting facility with Five Arrows Commercial Finance. The utilisation of the facility at the year end was 35%and interest is chargeable at 5.25%. (Base Rate plus 1.25%). See note 21.The directors consider that the carrying amount of trade and other receivables approximates their fair value.
Bank balances and cash comprise cash and short-term deposits held by the group treasury function. The carrying amount of theseassets approximates their fair value.
Credit risk – The Group’s principal financial assets are bank balances and cash and trade and other receivables, which represent theGroup’s maximum exposure to credit risk in relation to financial assets.The Group’s credit risk is primarily attributable to its trade receivables. The Group has no significant concentration of credit risk, withexposure spread over a large number of counterparts and customers.
17. Investments2006
£000’s
Additions 94Balance as at 31 December 2006 94
18. Other Financial LiabilitiesTrade and other payables principally comprise amounts outstanding for trade purchases and ongoing costs. The average creditperiod taken for trade purchases is 58 days.
The directors consider that the carrying amount of trade payables approximates to their fair value.
19 Obligations Under Finance Leases (Group)Present value Present value
Minimum lease Minimum lease of minimum of minimumpayments payments lease payments lease payments
2006 2005 2006 2005£000’s £000’s £000’s £000’s
Amounts payable under finance leasesWithin one year 476 709 421 631In the second to fifth years (inclusive) 611 789 549 723
1,087 1,498 970 1,354Less future finance charges (117) (144)
Present value of lease obligations 970 1,354 970 1,354
Less: Amount due for settlement within 12 months (shown under current liabilities) (421) (631)
Amount due for settlement after 12 months 549 723
It is the Group’s policy to lease certain of its fixtures and equipment under finance leases. The average lease term is 5 years. For the yearended 31 December 2006, the average effective borrowing rate was 10% [2005: 10%]. Interest rates are fixed at the contract date.
Obligations under finance leases are secured on the assets to which they relate.
Tanfield Group PLCAnnual report and financial statements 200648
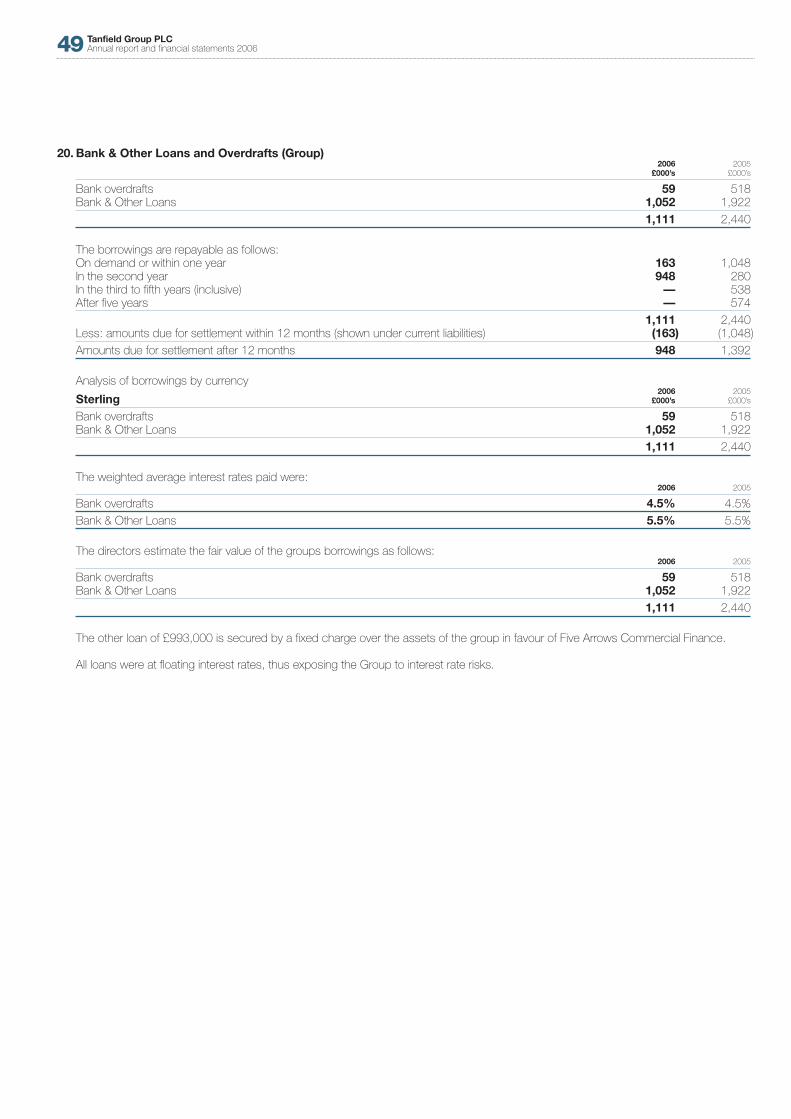
Tanfield Group PLCAnnual report and financial statements 200649
20. Bank & Other Loans and Overdrafts (Group)2006 2005
£000’s £000’s
Bank overdrafts 59 518Bank & Other Loans 1,052 1,922
1,111 2,440
The borrowings are repayable as follows:On demand or within one year 163 1,048In the second year 948 280In the third to fifth years (inclusive) — 538After five years — 574
1,111 2,440Less: amounts due for settlement within 12 months (shown under current liabilities) (163) (1,048)
Amounts due for settlement after 12 months 948 1,392
Analysis of borrowings by currency2006 2005
Sterling £000’s £000’s
Bank overdrafts 59 518Bank & Other Loans 1,052 1,922
1,111 2,440
The weighted average interest rates paid were:2006 2005
Bank overdrafts 4.5% 4.5%
Bank & Other Loans 5.5% 5.5%
The directors estimate the fair value of the groups borrowings as follows:2006 2005
Bank overdrafts 59 518Bank & Other Loans 1,052 1,922
1,111 2,440
The other loan of £993,000 is secured by a fixed charge over the assets of the group in favour of Five Arrows Commercial Finance.
All loans were at floating interest rates, thus exposing the Group to interest rate risks.

Notes to the Consolidated Financial Statementsfor the year ended 31 December 2006
20. Bank Loans and Overdrafts (Company)2006 2005
£000’s £000’s
Bank loans — 750
— 750
The borrowings are repayable as follows:On demand or within one year — 438In the second year — 125In the third to fifth years (inclusive) — 187
— 750Less: amounts due for settlement within 12 months (shown under current liabilities) — (438)
Amounts due for settlement after 12 months — 312
Analysis of borrowings by currency2006 2005
Sterling £000’s £000’s
Bank loans — 750
— 750
The weighted average interest rates paid were:2006 2005
Bank loans — 5.5%
The directors estimate the fair value of the groups borrowings as follows:2006 2005
Bank Loans — 750
— 750
21. Other Creditors (Group)2006 2005
£000’s £000’s
Buyback Lease Liability 262 211Invoice Discounting 1,834 1,583Other Creditors 435 —
2,531 1,794
22. Deferred Tax (Group)2006 2005
£000’s £000’s
Analysis for financial reporting purposes:Deferred tax liabilities 19 45
Net position at 31 December 19 45
The movement in the year in the Group’s net deferred tax position was as follows:2006 2005
£000’s £000’s
At 1 January 45 —Charge to income for the year 4 45Release to income for the prior year (30) —
At 31 December 19 45
The following are the major deferred tax liabilities recognised by the Group and the movements thereon during the period:Deferred tax liabilities
Accelerated tax depreciation
£000’s
At 1 January 2006 45Charge to income for the year 4Release to income for the prior year (30)
At 31 December 2006 19
Tanfield Group PLCAnnual report and financial statements 200650

Tanfield Group PLCAnnual report and financial statements 200651
23. Convertible Loan NotesThe convertible unsecured loan notes were issued on 31 December 2003. The notes are convertible into ordinary shares of theCompany at the option of the holder in half yearly intervals between the date of issue of the notes and their settlement date. On issue,the loan notes were convertible at 1000/95 shares per £1 loan note.
If the notes have not been converted, they will be redeemed on 30 May 2009 at par. Interest of 8.5 per cent will be paid annually up untilthat settlement date.
The net proceeds received from the issue of the convertible loan notes have been split between the liability element and an equitycomponent, representing the fair value of the embedded option to convert the liability into equity of the Group. The effective interest rateon the liability component is 10.5%.
2006 2005£000’s £000’s
Nominal value of convertible loan notes issued 75 75Equity component (net of deferred tax) (6) (6)
Liability component at date of issue 69 69Interest accrued — —Interest charged 6 6Interest paid (6) (6)
Liability component at 31 December 2006 69 69
24. Provisions (Group)Warranty Legal Onerousprovision reserve lease Total
£000’s £000’s £000’s £000’s
At 1 January 2006 53 466 142 661Utilisation of provision (53) (204) (142) (399)
At 31 December 2006 — 262 — 262
The legal reserve represents a provision for corrective costs under a product warranty, which was identified in 2004. It is expected thatthe work identified will be completed in 2007.
The directors are looking to recover this amount in full from the previous owners of SEV Group Ltd.
25. Share Capital (Group)2006 2006 2005 2005
Number £000’s Number £000’s
Ordinary Shares of £0.01 eachAuthorised: 400,000,000 3,000 200,000,000 2,000
Issued and Fully Paid: 292,072,387 2,921 190,543,716 1,905
On 26 April 2006, 50,000,000 shares were placed on the Stock Exchange at a price of 20p per share.
On 16 November 2006, 50,000,000 shares were placed on the Stock Exchange at a price of 40p per share.
On 12 May 2006, 1,528,671 share options were exercised by TP Robinson. 94,920 were exercised at 1p per share and 1,433,751were exercised at 2p per share.
The Company has one class of ordinary shares which carry no right to fixed income.

Notes to the Consolidated Financial Statementsfor the year ended 31 December 2006
26. Capital Reserves (Group)Share Loan Stock Capital
Share Option Share Equity Reduction Merger Totalcapital Reserve Premium Reserve Reserve Reserve Equity£000’s £000’s £000’s £000’s £000’s £000’s £000’s
Balance at 1 January 2006 1,905 308 1,509 6 7,228 1,534 12,490Share Options exercised 16 (129) 14 — — — (99)Share Options granted — 76 — — — — 76Issue of new share capital 1,000 — 28,055 — — — 29,055
Balance at 31 December 2006 2,921 255 29,578 6 7,228 1,534 41,522
The issue cost of the new share capital of £635k has been charged to the share premium account.
Capital Reserves (Company)Share Loan Stock Capital
Share Option Share Equity Reduction Merger Totalcapital Reserve Premium Reserve Reserve Reserve Equity£000’s £000’s £000’s £000’s £000’s £000’s £000’s
Balance at 1 January 2006 1,905 308 1,509 6 7,228 1,534 12,490Share Options exercised 16 (129) 14 — — — (99)Share Options granted — 76 — — — — 76Issue of new share capital 1,000 — 28,055 — — — 29,055
Balance at 31 December 2006 2,921 255 29,578 6 7,228 1,534 41,522
27. Profit & Loss Account (Group)£000’s
Balance at 1 January 2006 (737)
Net profit for the year 2,504Transfer from share option reserve 129
Balance at 31 December 2006 1,896
Profit & Loss Account (Company)£000’s
Balance at 1 January 2006 —
Net loss for the year (634)Transfer from share option reserve 129
Balance at 31 December 2006 (505)
28. Reconciliation of profit from operations to net cash used in operating activities (Group)2006 2005
£000’s £000’s
Operating Activities (continuing and discontinuing)Profit before tax and interest expense 3,455 2,147Depreciation of property, plant and equipment 825 742Negative goodwill (2,130) (1,356)Amortisation of intangible fixed assets 539 159(Profit)/Loss on disposal of fixed assets (7) 102(Increase) in receivables (7,031) (1,622)Increase in payables 1,708 205(Decrease) in provisions (322) (788)(Increase) in inventories (4,285) (1,579)
Net Cash used in Operating activities (7,248) (1,990)
Tanfield Group PLCAnnual report and financial statements 200652

Tanfield Group PLCAnnual report and financial statements 200653
29. Acquisition On 10 June 2006, the Group acquired the Upright Powered Access Business from Upright Manufacturing Limited for a consideration of£7.4m. This transaction has been accounted for by the purchase method of accounting.
Fair value2006
Net assets acquired: £000’s
Order Book 933Trademarks 575Jigs and Fixtures 250Customer Lists 575Manufacturing Schedules 125Intellectual Property Rights 347Inventories 5,497Trade receivables 1,004Cash 226
9,532Negative goodwill (2,130)Total Consideration 7,402
Satisfied by:Retainer 325Legal Expenses 328Cash 6,749Total 7,402
Net cash outflow arising on acquisition: 6,851
The profit due to the acquisition of Upright has not been disclosed separately. The business has been successfully merged into theTanfield Group PLC business and hence any profits attributable solely to the new business are not identifiable.
30. Non-cash transactionsAdditions to fixtures and equipment during the year amounting to £184,000 were financed by new finance leases.
31. Contingent LiabilitiesThere are no contingent liabilities of which the Directors are aware.
32. Operating Lease ArrangementsThe Group as a lessee:At the balance sheet date, the Group had total commitments under non-cancellable operating leases, which fall due as follows:
2006 2005£000’s £000’s
Within one year 349 180In the second to fifth years inclusive 510 229
859 409
Operating lease payments represent rentals payable by the Group for certain of its office properties and fixed assets. The average leaseterm is 5 years the minimum lease term is 3 years.

Notes to the Consolidated Financial Statementsfor the year ended 31 December 2006
33. Share Based Payments (Group)Equity settled share based payment transactions
Details of the Company’s and group share option scheme are given in the audited section of the Directors Remuneration Report onpages 25 to 27.
Movement in outstanding options
2006 2006 2005 2005Weighted Weighted
average averageOptions exercise price Options exercise price
(Number) (£) (Number) (£)
Outstanding at 1 January 4,057,342 0.017 4,090,260 0.017Granted during the year 11,925,000 0.225 1,000,000 0.01Forfeited during the year — —Exercised during the year (1,528,671) 0.019 (1,032,918) 0.01Expired during the year — —
Outstanding at 31 December 14,453,671 0.188 4,057,342 0.017
Exercisable at 31 December 14,453,671 4,057,342
The weighted average share price at the date of exercise for share options exercised during the year was £0.18. The optionsoutstanding at 31 December 2006 had a weighted average exercise price of £0.188, and a weighted average remaining contractual lifeof 9.1 years. The range of exercise price is 1p to 35p.
On 29 December 2006 the market price of the ordinary shares was 55.25p. The range during 2006 was 18.0p to 56.0p.
Income statement chargeA charge to the income statement has been made for options issued on or after 7 November 2002 that had not vested as at 1 January2005 in accordance with IFRS2 ‘Share Based Payments’.
The inputs into the Black-Scholes model are as follows:
2006
Weighted average share price 19.63pWeighted average exercise price 18.88pExpected volatility 10%Expected life 3Risk free rate 2%Expected dividends —
Expected volatility was determined by calculating the historical volatility of the Group’s share price over the previous 3 years. Theexpected life used in the model has been adjusted, based on management’s best estimate, for the effects of non-transferability, exerciserestrictions, and behavioural considerations.
Tanfield Group PLCAnnual report and financial statements 200654

Tanfield Group PLCAnnual report and financial statements 200655
34. Related Party TransactionsGroupTransactions between the Company and its subsidiaries and between subsidiaries, which are related parties, have been eliminated on consolidation. These transactions are a management charge from Tanfield Group PLC to is subsidiaries. The bank hold a crossguarantee in relation to all the Group Company bank accounts. There are no other related party transactions.
CompanyDetails of the Company’s share in Group undertakings are given in note 14.
The Company entered into transactions with its subsidiaries as disclosed below.Subsidiaries Subsidiaries
2006 2005£000’s £000’s
Provision of services 1,302 1,397Amounts owed by related parties at year end 25,801 9,982
Remuneration of key management personnelThe remuneration of the key management personnel, which includes Directors, is set out below in aggregate for each of the categoriesspecified in IAS 24 Related Party Disclosures. Further information about the remuneration of individual directors is provided in the auditedpart of the Directors’ Remuneration Report on pages 25 to 27.
Directors Emoluments2006 2005
£000’s £000’s
Short-term employee benefits 685 715Post-employment benefits 34 51Share-based payment 257 200
976 966
Directors’ transactionsThere were no other transactions with Directors during the year. There have been no related party transactions with any Director.

Notice is hereby given that the Annual General Meeting of the Company will be held at Tanfield Group Plc,Vigo Centre, Birtley Road, Washington, Tyne and Wear, NE38 9DA on 28th September 2007 at 10:00 am for the following purposes:
Ordinary BusinessTo consider and, if thought fit, to pass the following resolutions as Ordinary Resolutions of the Company:
1. To receive the financial statements for the year ended 31 December 2006 and the reports of the directors and auditors thereon.2. To elect Colin Thomas Billiet as a director.3. To re-elect Darren Stephen Kell as a director, who retires by rotation in accordance with the Articles of Association.4 To re-elect John Neville Bridge as a director, who retires by rotation in accordance with the Articles of Association.5. To re-appoint Baker Tilly UK Audit LLP (having been appointed as successor auditor to Baker Tilly with effect from 1 April 2007) as
auditor and to authorise the directors to fix their remuneration.
Special Business1. To consider and, if thought fit, to pass the following resolution as an Ordinary Resolution of the Company:
THAT the Directors of the Company be and are hereby generally and unconditionally authorised (in substitution for any previous authority) for the purposes of section 80 of the Companies Act 1985 (as amended) (the “Act”) to exercise all the powers of the Company to allot relevant securities (as defined in Section 80(2) of the Act) on such terms and in such manner as they shall think fit, up to an aggregate nominal value equal to £966,774 at any time (unless and to the extent previously revoked, varied or renewed by the Company in general meeting) during the period from the date hereof until the conclusion of the Company’s annual general meeting held in 2008 provided that the Directors of the Company may make an offer or enter into an agreement which would or might require relevant securities to be allotted after the expiry of such authority and the Directors may allot relevant securities after such expiry under this authority in pursuance of any such offer or agreement as if this authority had not expired. The authority hereby given may at any time (subject to the provisions of section 80 of the Act) be renewed, revoked or varied by ordinary resolution of the Company in general meeting;
2. To consider and, if thought fit, to pass the following resolution as a Special Resolution of the Company:
THAT the Directors of the Company be given power pursuant to Section 95 of the Act to allot equity securities (as defined in Section 94 of the Act) for cash pursuant to the Section 80 authority referred to above as if Section 89(1) of the Act did not apply to any such allotment, such power to expire at the conclusion of the Company’s annual general meeting held in 2008 or, if earlier, the revocation of the Section 80 authority referred to above provided that before such expiry the Directors of the Company may make an offer or enter into an agreement which would or might require equity securities to be allotted after the expiry of such power and the Directors may allot equity securities after such expiry under this power in pursuance of any such offer or agreement as if this power had not expired. The power is limited to:
2.1 the allotment of equity securities for cash in connection with a rights issue to holders of Ordinary Shares where the equity securities respectively attributable to the interests of such holders are proportionate (as nearly as may be practicable) to the respective numbers of Ordinary Shares held by them but subject to such exclusions or other arrangements as the Directors may deem necessary or expedient to deal with any fractional entitlements or any legal or practical problems under the laws of, or the requirements of any regulatory body or any recognised stock exchange in any territory; and
2.2 the allotment (other than pursuant to paragraph 2.1 of this Special Resolution) of equity securities up to a maximum aggregate nominal amount of £146,481.
This power applies in relation to any sale of shares which is an allotment of equity securities by virtue of Section 94(3A) of the Act as if in the first paragraph of this resolution the words “pursuant to the Section 80 authority referred to above” were omitted.
By order of the Board
CD Brooks ACACompany Secretary
2007Registered Office:
Notice of Annual General Meeting
Tanfield Group PLCAnnual report and financial statements 200656
Vigo Centre,Birtley Road,Washington,Tyne and Wear.NE38 9DA