the weir group plc - annualreports.com weir group plc annual report and financial statements 2014...
TRANSCRIPT
The Weir Group PLC Annual Report and Financial Statements 2014
The Weir G
roup PLC A
nnual Report and Financial S
tatements 2014

The Weir Group PLC is one of the world’s leading engineering businesses. Since our foundation in 1871, we have been committed to creating innovative engineering solutions for our global customers and delivering long-term value to our shareholders.
Our mission is to be wherever and whenever our global customers need us delivering innovative products and services
Our strategy and business model provides a robust platform for sustainable growth across the economic cycle.
We have developed global leadership positions in structurally strong markets and used our scale to successfully expand our range of products and services.
Our competitive advantage is sustained by investing in the best people, products and services to continue to make our customers more efficient and ensure we capture future growth opportunities.
We are committed to being a trusted partner of choice to our customers, suppliers and the communities in which we operate around the world.
Read more about Our Strategy and Business Model from page 8.
Read more in our Operational Review from page 32.
Read more in our Chief Executive’s Strategic Review from page 10.
Read more in our Sustainability Review from page 52.

Strategic Report Financial StatementsCorporate Governance
1The Weir Group PLC Annual Report and Financial Statements 2014
Strong constant currency growth.
14% increase in aftermarket orders and revenues.
Innovation: New products driving growth. Comminution and premium fluid end input of £105m; R&D up 15%.
Collaboration: Second global customer agreement secured with major mining house.
Value Chain Excellence: £46m in procurement savings achieved in 2014.
Global Capability: Trio acquisition strengthening presence in Chinese mining markets and US aggregates.
Total exceptional costs of £212m: Primarily in relation to £49m of efficiency review costs and the non-cash £160m oil price driven impairment of Pressure Control goodwill.
1. Continuing operations adjusted to exclude exceptional items and intangibles amortisation.
2. 2013 restated at 2014 average exchange rates.
Revenue
£2,438m0%
Operating profit1
£450m-4%
Dividend per share
44.0p+5%
Net debt
£861m-£114m
Profit before tax1
£409m-2%
Order input2
£2,473m+9%
Earnings per share1
141.3p-3%
Cash from operations
£421m-11%
2014 Highlights
Strategic Report 1–682014 Highlights 1Weir at a Glance 2Understanding Our Markets 4Chairman’s Statement 6Our Strategy and Business Model 8Chief Executive’s Strategic Review 10Strategy in Action 14Key Performance Indicators 22How We Manage Risk 24Operational Review 32Financial Review 46Sustainability Review 52
Corporate Governance 69–112Group Executive 69Board of Directors 70Corporate Governance Report 72Nomination Committee Report 83Report of the Audit Committee 85Remuneration Report 91Directors’ Report 109
Financial Statements 113–182Independent Auditor’s Report 113Consolidated Income Statement 118Consolidated Statement of Comprehensive Income 119Consolidated Balance Sheet 120Consolidated Cash Flow Statement 121Consolidated Statement of Changes in Equity 122Notes to the Group Financial Statements 123Company Balance Sheet 170Notes to the Company Financial Statements 171
Principal Companies of the Group 183Shareholder Information 185Glossary 187Financial Calendar 188

2 The Weir Group PLC Annual Report and Financial Statements 2014
The Weir Group consists of three complementary divisions which operate in markets and share strong prospects for long-term growth. Our products and services help meet the demands of the world’s growing population for energy and natural resources. You can learn more in ‘Understanding Our Markets’ on pages 4 and 5.
Weir at a Glance
Global capability, local delivery
Designing, manufacturing and supporting products used in mining and minerals processing. Weir Minerals is the global market leader in slurry handling equipment.
Designing, manufacturing and supporting products used in the upstream pressure pumping, upstream pressure control and downstream refining operations. Weir Oil & Gas is the global market leader in pressure pumping equipment.
Designing, manufacturing and supporting valves, pumps and turbines which are used in conventional and renewable power and industrial operations and in oil and gas production, mid-stream and refining markets.
2014 Revenue*
£1,128m -4%2014 Operating profit*
£226m -7%
2014 Revenue*
£992m +32%2014 Operating profit*
£225m +32%
2014 Revenue*
£318m +1%2014 Operating profit*
£19m -37%
Key brands: Warman, GEHO, Linatex, Vulco, Cavex, Enduron and Trio.
Main markets: Mining and minerals processing, including comminution, slurry transportation and mine dewatering; sand and aggregates; and oil sands.
Major operational locations: US, Chile, Brazil, Peru, UK, Netherlands, South Africa, Malaysia, China and Australia.
Key brands: SPM, Seaboard, Mathena, Novatech, Gabbioneta and Weir Oil & Gas Services.
Main markets: Oil and gas drilling, completion, production and refining.
Major operational locations: US, Canada, UK, Middle East, China and Australia.
Key brands: Hopkinsons, Atwood & Morrill, Blakeborough, Sarasin-RBSD, Sebim, Tricentric, BDK, Roto-Jet, Weir American Hydro and Batley Valve.
Main markets: Nuclear, conventional and renewable power generation; water and waste water; mid and downstream oil and gas; and general industrial processes.
Major operational locations: US, Canada, UK, France, South Korea, South Africa, India and China.
Major customers: Major and junior mining houses; Engineering, Procurement and Construction Management companies (EPCMs); national and international oil companies.
Main competitors: Metso, FLSmidth, KSB and Outotec.
Employees: 8,900
Addressable market: £6.3bn
Major customers: Oilfield service companies; national and international oil companies; and EPCMs.
Main competitors: FMC Technologies, Gardner Denver, Cameron, Sulzer and Flowserve.
Employees: 4,200
Addressable market: £8.1bn
Major customers: Utility companies; general industrial companies; EPCMs.
Main competitors: Flowserve, Pentair, Velan, GE, IMI, Hayward Gordon, Voith and Andritz.
Employees: 3,200
Addressable market: £8.1bn
Minerals Read more on page 32
Oil & Gas Read more on page 36
Power & Industrial Read more on page 42
* In constant currency terms.

Strategic Report Financial StatementsCorporate Governance
3The Weir Group PLC Annual Report and Financial Statements 2014
Minerals 35%Oil and gas 47%
Industrial and other 9%Power 9%
North America 46%South America 11%
Europe 12%
Australasia 8%
Middle East and Africa 13%
Asia-Pacific 10%
North America
Our Oil & Gas premium fluid end product, designed at our advanced research centre, is gaining market share by helping reduce our customers’ breakeven costs.
Read more on page 59
Europe
In Europe, nuclear opportunities are emerging as a result of the UK’s development of new power stations.
Read more on page 43
Asia-Pacific
In Asia-Pacific, the acquisition of Trio Engineered Products expanded our exposure to domestic Chinese mining markets.
Read more on page 21
Middle East and Africa
In the Middle East and Africa, the Group opened a new regional headquarters and manufacturing facility in Dubai.
Read more on page 80
South America
Weir Minerals has a service centre within 200km of every major mine.
Read more on page 33
Australasia
In Australia, the Minerals division is using its extensive network to support the growing internationalisation of the Oil & Gas division.
Read more on page 38
2014 Group input by market 2014 Group input by geography
85 facilities
5,000 people
North America
34 facilities
3,200 people
Asia-Pacific
37 facilities
2,000 people
Middle East and Africa
22 facilities
1,200 people
Australasia
50 facilities
3,000 people
Europe
25 facilities
1,900 people
South America
Weir’s commitment to being wherever and whenever our global customers need us, means we have developed a regional manufacturing strategy and a market-leading global network of service centres. This delivers real competitive advantage in the need-it-now industries we serve.
Total facilities
253Total people
16,300
4 The Weir Group PLC Annual Report and Financial Statements 2014
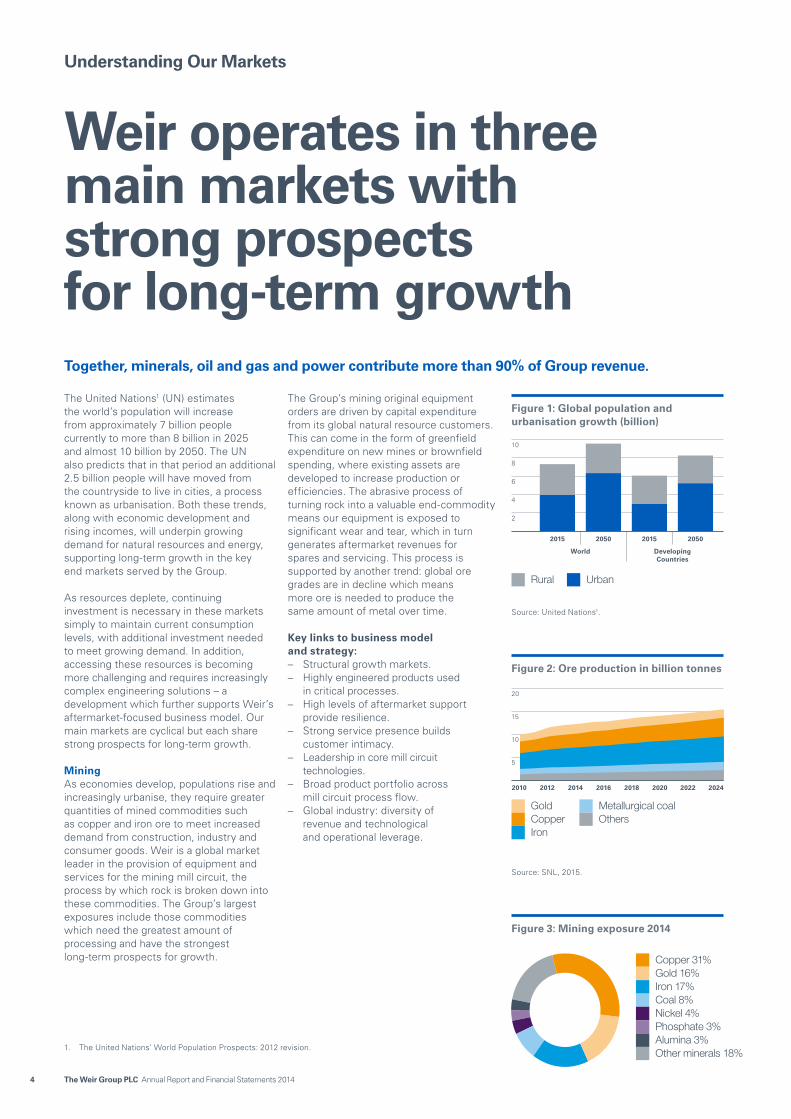
Copper 31%Gold 16%
Coal 8%Iron 17%
Nickel 4%Phosphate 3%
Other minerals 18%Alumina 3%
10
8
6
4
2
2015
World DevelopingCountries
2050 2015 2050
Rural Urban
20
5
10
15
2010 2012 2014 2016 2018 2020 2022 2024
Gold Metallurgical coalCopper OthersIron
Together, minerals, oil and gas and power contribute more than 90% of Group revenue.
Understanding Our Markets
Weir operates in three main markets with strong prospects for long-term growth
The United Nations1 (UN) estimates the world’s population will increase from approximately 7 billion people currently to more than 8 billion in 2025 and almost 10 billion by 2050. The UN also predicts that in that period an additional 2.5 billion people will have moved from the countryside to live in cities, a process known as urbanisation. Both these trends, along with economic development and rising incomes, will underpin growing demand for natural resources and energy, supporting long-term growth in the key end markets served by the Group.
As resources deplete, continuing investment is necessary in these markets simply to maintain current consumption levels, with additional investment needed to meet growing demand. In addition, accessing these resources is becoming more challenging and requires increasingly complex engineering solutions – a development which further supports Weir’s aftermarket-focused business model. Our main markets are cyclical but each share strong prospects for long-term growth.
MiningAs economies develop, populations rise and increasingly urbanise, they require greater quantities of mined commodities such as copper and iron ore to meet increased demand from construction, industry and consumer goods. Weir is a global market leader in the provision of equipment and services for the mining mill circuit, the process by which rock is broken down into these commodities. The Group’s largest exposures include those commodities which need the greatest amount of processing and have the strongest long-term prospects for growth.
The Group’s mining original equipment orders are driven by capital expenditure from its global natural resource customers. This can come in the form of greenfield expenditure on new mines or brownfield spending, where existing assets are developed to increase production or efficiencies. The abrasive process of turning rock into a valuable end-commodity means our equipment is exposed to significant wear and tear, which in turn generates aftermarket revenues for spares and servicing. This process is supported by another trend: global ore grades are in decline which means more ore is needed to produce the same amount of metal over time.
Key links to business model and strategy: – Structural growth markets. – Highly engineered products used
in critical processes. – High levels of aftermarket support
provide resilience. – Strong service presence builds
customer intimacy. – Leadership in core mill circuit
technologies. – Broad product portfolio across
mill circuit process flow. – Global industry: diversity of
revenue and technological and operational leverage.
Figure 1: Global population and urbanisation growth (billion)
Figure 2: Ore production in billion tonnes
Figure 3: Mining exposure 2014
1. The United Nations’ World Population Prospects: 2012 revision.
Source: SNL, 2015.
Source: United Nations1.

Strategic Report Financial StatementsCorporate Governance
5The Weir Group PLC Annual Report and Financial Statements 2014
500
400
300
200
100
2010 2025 2040
Gas Oil
2,500
2,000
1,500
1,000
500
2015 2025 2035
Gas Oil
Natural gas
Oil
300
200
100
Oil NuclearGas HydroCoal Wind and other renewables
2010 2025 2040
Oil and gasIncome growth in emerging economies has been the largest driver of recent energy demand. According to the World Bank, crude oil consumption in developing countries increased 40% in the period 2004 to 2014. The year also saw developing countries consume more oil than developed countries for the first time in history. However, on a per capita basis, people in developed economies consume five times more oil than those in emerging economies. As these economies develop and incomes rise, so will long-term demand for energy.
All three divisions have some exposure to this end market with Weir Oil & Gas operating in the conventional and unconventional upstream oil and gas markets, with a niche position supplying engineered to order pumps to downstream markets. Weir Minerals’ technology is deployed in applications including oil sands projects in Canada, and Weir Power & Industrial increasingly provides safety valve products to the Liquefied Natural Gas (LNG) industry and other mid and downstream process applications.
The Group’s largest exposure is to the North American onshore unconventional market with international unconventional opportunities beginning to emerge. Unconventional drilling involves the extraction of tight oil and shale gas using hydraulic fracturing (fracking) where high-pressure water, sand and chemicals are used to release gas and oil from rock far below the surface. The International Energy Agency estimates the United States will remain “the top source of [oil] growth up to 2020”2 with most of the expansion from tight oil production.
Unconventional oil and gas has become increasingly cost-competitive – with costs reducing between 20-30% in the last two years. Natural gas is estimated to grow strongly in the medium to long term as it is increasingly used as a feedstock for power generation in developed economies.
Weir Oil & Gas serves these markets in three main ways: pressure control equipment and services to Exploration and Production (E&P) companies, to ensure drilling, completion and production processes can be carried out efficiently and safely; pressure pumping equipment and services, which provide original equipment to oil and gas service companies for use in hydraulic fracturing; and Weir Oil & Gas Services, where dedicated engineering support and spares are provided to both conventional and unconventional markets in Europe and the Middle East. We also serve mid and downstream oil and gas markets with products for use in Floating Production Storage and Offloading (FPSO) and refining operations.
Weir operates in three main markets with strong prospects for long-term growth
Figure 4: Global oil and gas demand quadrillion British Thermal Units (BTUs)
Figure 6: Power Generation in quadrillion BTUs
Figure 5: North America oil and gas production forecast
2. IEA medium term oil outlook, February 2015.3. IEA World Energy outlook, 2014.
To meet greater long-term demand for oil and gas, operators are increasing the intensity and the complexity of their drilling and completion applications.
Key links to business model and strategy: – Structural growth markets. – Highly engineered products used
in critical processes. – High pressure abrasive applications
increase aftermarket requirements. – Leading service presence in all
North American shale plays; strong customer partnership.
– Pump to wellhead capability; broad portfolio provides opportunities in conventional and unconventional markets.
– Global manufacturing and service footprint to capture international opportunities.
Power The International Energy Agency3 (IEA) estimates the world needs to build 7,200 gigawatts of additional capacity by 2040 to satisfy increasing global electricity demand and replace power stations due to be decommissioned3. The greatest increases in demand come from emerging economies. The IEA estimates renewable energy, such as hydropower, will make an increasingly important contribution to meeting electricity demand. It also predicts low-carbon alternatives, such as nuclear power will grow strongly particularly in China, India and Korea. Increased natural gas supplies are also supporting increasing adoption of combined cycle gas turbine stations, which are seen as lower-emission than other conventional power sources.
Weir Power & Industrial operates in the conventional, nuclear and renewables power generation markets. It serves these markets through the design and manufacture of valves, pumps and turbines and the provision of specialist support services.
Key links to business model and strategy: – Highly engineered products used
in critical processes. – High temperature, high pressure
applications. – Global manufacturing and service
footprint to capture international opportunities.
– Broad valves portfolio provides cross-selling opportunities.
Source: Exxon Mobil Energy Outlook 2015.
Source: Exxon Mobil Energy Outlook 2015.
Source: BP energy outlook 2035, February 2015.

6 The Weir Group PLC Annual Report and Financial Statements 2014
Chairman’s Statement
Responding to fast- changing markets
ResultsReported revenues were stable at £2.4bn, with pre-tax profits from continuing operations, before exceptional items and intangibles amortisation, of £409m: a slight decrease of 2% on 2013. Revenues and operating profits were affected by movements in foreign currency exchange rates, an issue which impacted the majority of UK listed corporations with substantial operations overseas. In 2014, 95% of the Group’s revenues were generated outside the United Kingdom. On a constant currency basis, revenues were 9% higher year on year with pre-tax profits increasing 7%.
The Group’s robust underlying performance, in a very challenging end market environment, is a tribute to Weir’s 16,000 people and their continuing commitment to delivering the best engineering solutions in the oil, gas, minerals and power industries we serve.
Dividend We are proposing a final dividend payment of 29p per share, making 44p for the full year, an increase of 5% and marking the 31st consecutive year of dividend growth for the Group. The Board rebalanced the phasing of dividend payments across the year with the interim dividend now representing around one-third of the total payment.
Our markets in 2014 Commodity prices declined as the year progressed as a result of increased supplies and weaker than expected global economic growth, particularly in China. Upstream oil and gas markets in North America grew strongly over the year, with technology and operational enhancements enabling operators to reduce their breakeven costs substantially. However, at the end of 2014 we saw the first sign of the impacts on industry activity of a very significant fall in oil prices, which has continued into 2015. In mining markets, major commodities also suffered significant price reductions in 2014, most notably iron ore, although ore production levels continued to increase and supported aftermarket demand. Power markets were generally weak, reflecting global economic sentiment.
These market conditions posed challenges for the Group but one of the great advantages of Weir’s long history is our experience in responding rapidly to changing market conditions. We have developed a strong business platform but have maintained the agility to act quickly where it is necessary to support performance and promote the long-term interests of shareholders.
In 2014, this was demonstrated with the Oil & Gas division’s response to the speedy recovery in unconventional upstream North American markets.
It showed the necessary flexibility to seize opportunities as they emerged, increasing market share.
Following the change in market sentiment, the division took early action at the end of 2014 to reduce costs and position itself to respond to much tougher market conditions. Similarly, the Minerals division responded to continued reductions in spending by mining companies by consolidating its manufacturing footprint to increase efficiency and competitiveness. In Power & Industrial, the division restructured its operations to align them more closely with future growth prospects.
You can read more about the performance of all three divisions in the operational review section starting on page 32.
Strategy This was my first full year as Chairman and it has been a great pleasure to reacquaint myself with a company which has played such a large part in my family’s life. My father worked for Weir up until his retirement and I was fortunate to serve as an apprentice with the Company before beginning my engineering studies at university. The Group has been transformed in the intervening years but I am glad to report its commitment to innovation and serving its global customers remains as strong as ever.
2014 saw the Group return to good constant currency growth as it benefited from its market leadership positions and strong aftermarket focus.
Charles BerryChairman

Strategic Report Financial StatementsCorporate Governance
7The Weir Group PLC Annual Report and Financial Statements 2014
This is demonstrated in the Group’s strategy of building a strong installed base of highly engineered original equipment and supporting it with a market-leading service centre network, ensuring we can be highly responsive to our customers’ aftermarket demands for replacement parts and services. Chief Executive Keith Cochrane details the Group’s strategy in action from page 10.
The Group has continued to accelerate its strategy through carefully targeted acquisitions. This was the case with the purchase of Chinese-American equipment provider Trio Engineered Products. It complements Weir Minerals’ organic entry into the comminution segment of the mining mill circuit for crushing, grinding and screening. Earlier in the year, the Board made a merger approach to Finnish mining equipment maker Metso Corporation. However, Metso rejected our proposal and as a consequence, the offer was withdrawn. The Board’s approach to mergers and acquisition activity is to focus on opportunities that fit our strategy but also meet our strict financial criteria. Indeed, the financial strength of the Group was emphasised by the award of strong investment grade credit ratings during 2014.
Safety As a Board, we are proud of the many achievements in 2014 but the continued improvement in the Group’s safety performance is particularly important with the Total Incident Rate falling 20%. Keeping our people safe is the first agenda item on every Board meeting and we are determined to achieve our ambition of making Weir a zero-accident workplace.
A proud partner in our communities The Group has reinvigorated the culture and values which have defined the business throughout its long history: focusing on our customers’ needs now and in the future; innovating and consistently delivering high quality products and services; supporting each other as we work towards a common purpose; and acting with integrity, supported by a refreshed code of conduct. You can learn more on page 67.
As a company operating in more than 70 countries, our people call many communities home. Weir spent £1.2bn in 2014 on our supply chain, helping to create and support employment around the world. The Group also devoted approximately £600,000 to local charitable causes, with a special focus on health and education.
During 2014, we continued to strengthen many of our sustainability programmes. I was pleased to see a significant increase in our score under the ‘CDP Climate Change’ programme for the quality, transparency and completeness of information; in 2014 we achieved 90%, compared to 77% in 2013. It is rewarding to receive this external recognition of our progress, particularly for the many people who have contributed to our energy and carbon reduction initiatives. I recognise the efforts that all of our colleagues have made in this area and would like to thank them for their continuing work.
We have also reviewed how we identify and assess sustainability business risks at a Group level and are in the process of completing a formal materiality assessment to confirm those sustainability issues most important for our business. We recognise the importance of the wider value chain to our business success and have therefore considered, not only our own operations in the assessment, but also those of our customers and suppliers.
The Group was happy to support our home city of Glasgow as it hosted the successful 2014 Commonwealth Games. In a historic year for Scotland, the Group was pleased to make a constructive contribution to the constitutional debate which included publishing a report about the potential implications of independence for the business community.
The BoardAs part of the Board’s annual programme, we visited the Group’s new regional headquarters in Dubai in the United Arab Emirates. The facility builds on the long-standing success we have had in the region since first setting up a business in Dubai in 1976 and reflects the opportunities for future growth in this strategically important part of the world.
We also expressed our appreciation to Lord Robertson of Port Ellen, who retired from the Board on 31 January 2015. Lord Robertson was an invaluable source of wise counsel to his fellow Board members over the past decade and I would like to take this opportunity to publicly thank him again for his commitment to the Group and his contribution to the success of the business in that period.
Rick Menell, who has been a Non-Executive Director since 2009, succeeded Lord Robertson as Senior Independent Director. I was also delighted to welcome Professor Sir Jim McDonald, Principal and Vice Chancellor of the University of Strathclyde, as a Non-Executive Director. Sir Jim is one of the UK’s leading engineers and academics and he brings to the Board a wealth of experience in industry and developing world class research and development programmes.
As we look forward to the rest of 2015, our end markets will undoubtedly be challenging, but Weir has substantial experience of managing changes across the economic cycle. The fundamental drivers of our long-term growth remain intact, our strategy is clear and we have a team with a strong record of delivery. This combination gives me great confidence in our ability to safely navigate the headwinds we face and continue to provide value for all shareholders.
Charles BerryChairman25 February 2015

8 The Weir Group PLC Annual Report and Financial Statements 2014
Oil and Gas
Power
Mining
InnovationWe have a culture which supports innovation and is focused on making our customers and our operations more efficient and effective.
Value Chain ExcellenceWe invest in the best people, technology and safety performance while continuing to develop our lean operating platform across the value chain.
Why our customers choose Weir
Our strategic pillars
Read more on page 15
Read more on page 18
Our Strategy and Business Model
A robust platform for sustainable growth
Our mission and strategy
Our chosen markets
The Group has chosen to operate in markets which support structural changes in the global economy: so called megatrends.
Our markets
Emergingmarket growth
Watersecurity
Environmental changesUrbanisation
Energydemand
Resourcescarcity
Global megatrends
Mission
Our mission is to be wherever and whenever our global energy and resources customers need us, delivering innovative products and services and becoming their trusted partner of choice.
Strategy
We achieve our mission through our core strategy, which is to strengthen and extend our position in the structural growth markets of minerals, oil and gas, and power, and achieve sustainable growth ahead of these markets.
We execute our strategy by focusing on the four strategic pillars which define our distinctive approach and support our competitive advantage: Innovation; Collaboration; Value Chain Excellence; and Global Capability.
Our business model is robust and provides long-term earnings resilience across the economic cycle. We first establish a strong installed base of our highly engineered equipment with customers operating in abrasive environments. This leads to aftermarket opportunities which are captured by our leading service centre network. Our close relationship with our customers then gives the opportunity to cross-sell complementary products or services.
Through this strategy and business model we seek to sustainably grow revenues faster than our markets, deliver top quartile margins and increase returns on capital while at the same time retaining a strong financial base from which to pursue organic and acquisition-led opportunities.
Our strategy is derived with reference to our appetite for risk. Further details on our Principal Risks and Uncertainties can be found from page 24.

Strategic Report Financial StatementsCorporate Governance
9The Weir Group PLC Annual Report and Financial Statements 2014
CollaborationWe work closely with customers, colleagues, suppliers and communities to better understand and respond to the demands of our markets and promote mutually-beneficial relationships with all our key stakeholders.
Global CapabilityWherever and whenever our global customers need us, we provide a consistent quality of highly engineered products and services, ensuring we are their trusted partner of choice.
We sustain growth by:
Continuing to provide highly engineered equipment for critical processes;
Investing in innovative engineering technology;
Further strengthening our close relationships with customers;
Enhancing our market-leading service centre network;
Successfully integrating acquisitions;
Improving efficiency, on-time delivery and safety;
Developing talent to its full potential.
Our strategic pillars
Read more on page 17
Read more on page 20
How we serve these markets
Highly engineered products
Designing and manufacturing engineering solutions which help make our customers more efficient and grow our installed base of original equipment.
Market-leading service centre network
We give our global customers the aftermarket support for servicing and repairs which is critical to their operations: a crucial differentiator in the need-it-now energy and natural resource industries.
Partnership
Our close proximity to our customers allows us to better understand their needs and gives us the opportunity to cross-sell complementary products from the rest of our extensive portfolio; further strengthening our relationships and informing the products and services we develop in the future.

10 The Weir Group PLC Annual Report and Financial Statements 2014
Chief Executive’s Strategic Review
A strategy to deliver long-term growth
Weir has chosen to operate in the minerals, oil and gas and power markets because they each have excellent long-term growth prospects: as the world’s population continues to increase and urbanise, it will need access to more energy and natural resources. While our end markets are subject to business cycles, they fundamentally offer excellent structural growth prospects and a solid platform from which to deliver sustainable returns for shareholders across the economic cycle. This is achieved by the successful execution of the Group’s clear strategy which relies on the hard work and dedication of our 16,000 employees. I would like to thank them for all their hard work and commitment in 2014.
A challenging year for commodity pricesA weaker than expected global economy coupled with increases in supply contributed to a very challenging year for most commodity prices in 2014. In mining, iron ore prices fell by almost 50%, and copper fell by 14%. Gold prices were broadly flat over the period and remained below the levels required to drive higher capital investment. However, growing ore production levels, combined with declining ore grades, supported increased aftermarket demand.
The trend among major mining companies to reduce capital spending continued with an estimated 17% reduction in industry capital expenditure. There was a limited number of new, or greenfield, projects started and a cautious attitude towards
plant optimisation or brownfield expenditure. These factors led to a further reduction in demand for original equipment.
More positively, a number of greenfield projects in South America, which were approved in earlier years, moved from their construction phase to production during the year. Global ore production increased by around 3% in 2014 with strong iron ore production growth in particular. African mining markets were impacted by the Ebola outbreak in West Africa and by significant industrial action in South Africa, particularly the platinum miners’ strike through the first half of the year. Overall, markets in Australia, Brazil and China gained momentum. North America remained subdued while weak demand and geopolitical concerns in the east of the continent reduced activity in Europe.
In oil and gas markets, a multi-year period of stability lasted until the fourth quarter of 2014 when oil prices experienced their largest fall since 2009. This reflected concerns that the global market would be over-supplied in 2015, as a result of strong production growth, particularly in North America, combined with relatively weak demand growth. International benchmarks, Brent and WTI, both fell more than 40% in the final three months of the year and continued to fall steeply in early 2015. Throughout 2014 North American natural gas prices remained below incentive levels despite a brief spike caused by the harsh
winter at the start of the year. The average US onshore rig count increased 6% while the average number of wells drilled rose 5% as a result of greater efficiencies.
Pressure pumping markets benefited as US customers worked through their excess stocks, with frack fleet utilisation increasing to an estimated 87% from 82%, stimulating demand for original equipment, in contrast to recent overcapacity. Aftermarket activity was also supported by the trend towards more intense shale well completions as operators increased the number of frack stages per well, ran 24/7 operations and pumped higher volumes of water and sand per stage, leading to greater wear and tear on components.
The growing well count also ensured growth in pressure control markets which benefited from more complex drilling and completion solutions in higher pressure shale basins, with pad drilling techniques now used on the majority of well sites.
Across pressure pumping and pressure control markets there was a slowdown in activity towards year end as customers started to revise their spending plans to reflect the reduction in oil prices.
Internationally, there were good activity levels in Saudi Arabia and increased production in southern Iraq. Mid and downstream markets continued to grow as a result of Liquefied Natural Gas (LNG)
2014 showed the strength of our strategy and business model which continues to deliver sustainable long-term value for our shareholders.
Keith CochraneChief Executive

Strategic Report Financial StatementsCorporate Governance
11The Weir Group PLC Annual Report and Financial Statements 2014
and refinery developments, particularly in emerging markets, although project delays were a common feature in the second half of the year.
North American hydro power markets saw a recovery after difficult conditions in 2013. Nuclear new build progress also increased including the announcement of the first development of a new nuclear power station in the UK for almost 20 years.
Our financial performance in 2014 Overall, in a challenging year, order input in constant currency was up 9% on 2013, with each quarter ahead of the prior year comparator. Aftermarket input was up 14%, driven by strong growth in Oil & Gas, positive trends in Minerals and good growth from Power & Industrial’s valve operations. This was offset by flat original equipment input across the Group reflecting sharp declines in greenfield mining orders and power project delays, offset by a 47% increase in Oil & Gas as demand for Pressure Pumping equipment recovered from the depressed levels seen in 2012 and 2013. Aftermarket input accounted for 67% of total orders, up from 64% in 2013.
Group revenues were up 9% on a constant currency basis while the proportion of revenues from aftermarket sales increased to 66% from 63% last year. In Minerals, revenues were down 4% as aftermarket growth was more than offset by lower demand for original equipment. Both original equipment and aftermarket revenues in Oil & Gas increased by 32%, reflecting higher average rig count, increasing frack intensity and market share gains. Power & Industrial revenues were broadly flat, on a reported basis, following a £185m foreign exchange headwind.
Group margins declined by 70bps on a constant currency basis. This reflected the impact of industrial actions in South Africa on Minerals’ margins and operational challenges in Power & Industrial. Combined with flat reported revenues, this translated into a 4% fall in underlying operating profits to £450m. On a constant currency basis operating profit increased by 5% and pre-tax profits by 7%, reflecting a record second half profit performance for the Group. After a £35m foreign exchange
impact, chiefly as a result of the strength of Sterling compared to the US Dollar and emerging market currencies, reported pre-tax profits of £409m were 2% down on 2013. This foreign exchange exposure was largely translational and had limited impact on our competitive positioning.
Free cash flow decreased to £79m, reflecting investment in the first half in working capital to support record second half activity levels and £101m capital investment. Return on capital employed, excluding 2014 acquisitions, increased by 60bps to 18.1%.
Delivering our growth strategyAs the financial performance demonstrates, the Group’s strategy delivered good underlying constant currency revenue and profit growth in 2014.
Our distinctive strategy and business model is supported by our four strategic pillars. Innovation, which has been part of the Group’s DNA since it was founded by two engineers almost 150 years ago. Collaboration, which brings colleagues, customers and suppliers together to help achieve better engineering solutions. Value Chain Excellence (VCE), which drives greater efficiency in our own operations and helps make our customers more effective. And finally, Global Capability, ensuring we are there wherever and whenever our worldwide customers need us.
These strategic pillars have helped underpin the Group’s past success and remain central to our future growth. In 2014, I am pleased to report we made significant strategic progress in all four areas.
Innovation is critical to the future success of a global engineering company. In recent years we have significantly increased research and development efforts to ensure we maintain our market leadership positions. In 2014, this has involved: the design, manufacture and installation of the world’s largest slurry pump in a mine in Chile; gaining market share through our new premium fluid end technology in oil and gas markets which also supports the reduction in breakeven costs in the unconventional industry; the launch of a new vertical slurry pump, which allows upgrades to take place at reduced
cost to customers; and the commercialisation of a new turbine by-pass valve which was developed by Power & Industrial.
You can read more about our approach to innovation in the products and technology section on page 59.
The Group’s commitment to Collaboration is aimed at ensuring the best ideas are shared among colleagues, customers and suppliers. It also means working with other companies, particularly where we can benefit mutual customers. That was the motivation for entering into a development agreement with Rolls-Royce Holdings PLC subsidiary MTU America. The agreement will see our engineers jointly develop purpose-built power systems for hydraulic fracturing that will be entirely integrated so that the engine, transmission and pump are specifically designed to work together in a complete packaged power system. This will meet customer demands for technology which increases flow and pressure rates and provides longer run times.
Our collaboration with Anglo American, one of the world’s largest diversified mining and natural resources groups, was recognised with the award of the prestigious External Collaboration Award at the 2014 Procurement Leaders Awards. Our Global Framework Agreement (GFA) is designed to provide improvements in reliability and power savings by retro-fitting Weir-developed technology to existing pumps. In doing so, the life of key components has doubled, and in some cases trebled, while power consumption has been reduced significantly. The division added a further GFA in 2014 with Kinross Gold Corporation, one of the world’s leading gold mining companies, which will see Weir Minerals become Kinross’ preferred supplier of a range of mining equipment.
Value Chain Excellence (VCE) was introduced as a strategic pillar to recognise the importance of aligning our operations more closely to the specific needs of our customers – ultimately helping us achieve our ambition of becoming their trusted partner of choice.
Revenue
£2,438m0%
Operating profit
£450m-4%

12 The Weir Group PLC Annual Report and Financial Statements 2014
Chief Executive’s Strategic Review continued
Delivering our growth strategy (continued)In 2014, our continued focus on streamlining our operations and leveraging the Group’s global scale, helped improve customer responsiveness while at the same time supporting the Group’s overall performance through cost savings of £46m. A new VCE management system was developed to further integrate this approach across all of the Group’s businesses to support our culture of continuous improvement.
Key to our success is the competitive advantage we derive from our Global Capability, ensuring Weir is wherever and whenever our customers need us. In 2014, this included extending our comminution strategy which has seen the Minerals division further expand its product offering into the crushing, screening and grinding segment of the mining mill circuit, which helps separate rock from ore. In addition to our own strong organic growth the Group acquired Chinese-American equipment provider Trio Engineered Products in October 2014. Trio’s crushing technology will extend Weir’s comminution product portfolio and give real scale in the domestic Chinese mining markets, while also providing opportunities for growth in the expanding US aggregates market.
The Oil & Gas division extended its pressure control presence in Canada with the acquisition of Metra Equipment Inc, a small Saskatchewan-based wellhead manufacturer. Carefully selected and successfully integrated acquisitions are an important part of the Group’s growth plan and these acquisitions, along with the Board’s approach to Metso Corporation, demonstrate the range of large and small opportunities we continue to pursue to help accelerate our organic development.
The Group’s capacity in the growing Middle East market was extended with the opening of a new regional headquarters for the Oil & Gas division in Dubai. This will allow products to be manufactured locally for the first time, capturing opportunities as shale energy production internationalises, while also serving the region’s conventional wellhead market.
Good progress was made in the planning for a best-cost campus in Malaysia which will include construction of a new foundry, machine shop and continuous rubber processing plant. Work is also under way to upgrade the Group’s Information Technology capacity including the roll- out of a common Enterprise Resource Planning (ERP) across the Minerals division.
The Group undertook an efficiency review to identify areas to further align resources to capture future growth prospects. This resulted in a programme which will see the consolidation of a number of smaller
manufacturing and service operations into larger facilities, improving efficiency and customer responsiveness while also maintaining appropriate capacity. It is estimated these changes will produce annualised savings of £35m; £20m of this benefit will be realised in 2015, with one-off exceptional costs of £49m recognised in 2014. The Group also recognised a non-cash £160m oil price driven impairment of Pressure Control goodwill.
In addition, the Oil & Gas division announced additional plans to reduce around 550 posts as a direct response to the sharp fall in oil prices and in anticipation of the consequent reduction in activity. When added to the efficiency review and other measures taken earlier in 2014, the Group will have reduced approximately 1,200 posts across the workforce with the majority of these actions completed by the end of the first quarter of 2015. These have been difficult decisions but they are necessary to closely align the Group to current customer demand and position it to take advantage of future growth prospects. In 2015, additional exceptional costs of circa £20m, based on current cost reduction plans, are expected in relation to completion of the Group-wide efficiency review and additional measures taken subsequent to the financial year end in response to oil and gas market conditions.
Globally, Weir has also continued to promote a working environment which allows all of our employees to achieve their potential. In 2014, we continued to offer comprehensive professional development opportunities and rolled out our refreshed values to our global workforce.
I would also like to record my appreciation to Steve Noon following his retirement as Divisional Managing Director of the Oil & Gas division. Steve was instrumental in the development of the division and its contribution to Weir’s growth story. He has been succeeded by Paul Coppinger, previously president of Weir Pressure Pumping, the division’s biggest business unit.
In September, I was pleased to welcome the UK Prime Minister, David Cameron, to our facility in Yateley, Hampshire to see the hard work of our employees in serving the European minerals market.
Delivering on 2014 key prioritiesIn last year’s Annual Report, I set out a series of key priorities for the year:
Increasing technical differentiation through the pursuit of innovative new products.The Group continued to invest in fundamental research and development, extending our product portfolio. This has included the development of new products
which meet the demands of our customers including producing the world’s largest slurry pump.
We have also increased academic partnerships with some of the world’s leading universities, including Imperial College, London to develop research programmes into new technologies.
Improving working capital performance by further extending Value Chain Excellence initiatives.The Group continued to leverage its global scale to deliver significant procurement direct savings of £46m. Pressure Pumping reduced its older inventory by more than 50% and there were significant reductions in working capital in Weir Minerals North America, but there remains more to do across the Group.
Further embedding safety at the heart of our culture.The first stages of the Weir Behavioural Safety Programme have been adopted throughout the Group’s global businesses. Total Injury Rate fell by 20% in 2014. While I am pleased with this progress we must continue to focus on doing even better until we become a zero-accident workplace.
Fully capturing growing aftermarket opportunities in Minerals and accelerating progress in our comminution strategy.The Minerals division completed the acquisition of Trio Engineered Products, helping accelerate organic growth in its comminution strategy. It also benefited from the first aftermarket orders for its recently introduced range of High Pressure Grinding Rolls (HPGRs). Comminution orders increased 63% year on year and aftermarket orders were up 86%.
Driving growth in frack rentals, flowback and broadening international oil and gas opportunities.Pressure Control frack rentals and zipper manifolds gained market share. There was strong growth in the Middle East, including opening a new regional headquarters and manufacturing facility. Pressure Pumping opened two new service centres in China. A large order was won in Australia for our combined Pressure Pumping and Pressure Control offering in the country.
Accelerate Valves growth, building on a strengthened operational platform.Aftermarket order input growth of 26% followed increased targeting of the Power & Industrial division’s installed base of original equipment. There was good growth in some markets but others were impacted by project delays. Overall, orders were broadly flat. A restructuring programme to save £10m across the division and increase efficiency in the supply chain and Valves operating structure is being implemented.

Strategic Report Financial StatementsCorporate Governance
13The Weir Group PLC Annual Report and Financial Statements 2014
2014 demonstrated the strength of Weir’s strategy and aftermarket-focused business model as we captured good growth opportunities in fast changing markets. Significant progress was made in developing new products, working in partnership with customers, expanding into new markets through the acquisition of Trio, and streamlining our operations to maintain cost competitiveness.
OutlookWeir’s global market leadership positions and the significant strategic progress the Group has made in recent years mean it is well placed to benefit from the structural growth trends in our key end markets. Long-term growth in demand for energy and commodities will be driven by increasing world population and accelerated by greater urbanisation. In addition, the Group will benefit from the need for more complex engineering solutions to replace depleting natural resources.
In 2015, global GDP is expected to continue to increase. However, uncertainty over the pace of that growth, combined with growing supply, is expected to lead to continued price volatility in many commodities including copper and oil, the Group’s two largest exposures. We will continue to make progress in delivering our strategy while remaining agile in responding to market conditions as they evolve. The Group has already acted following steep price declines in key commodities, particularly oil, by taking additional measures to reduce operating costs.
While visibility in oil and gas remains limited, it is clear these initiatives will only partly offset the impact of a substantial reduction in demand and the associated pricing pressure. As a result we are planning for a significant reduction in constant currency Group revenues and lower operating margins in 2015. However, we will continue to invest in extending the Group’s global leadership positions and increasing market share, supported by a strong balance sheet and the cash generative nature of the Group.
2015 priorities1. Deliver benefits from the Minerals
facility restructuring programme, the integration of Trio and the investment in a common Enterprise Resource Planning (ERP) platform.
2. Ensure agile response to oil and gas end market conditions and maximise opportunities from new product launches.
3. Drive improved performance in Power & Industrial, including benefits from divisional reorganisation.
4. Accelerate pace of new technology developments.
5. Drive reductions in lead times and working capital through application of the Value Chain Excellence roadmap.
Keith CochraneChief Executive25 February 2015
UK Prime Minister David Cameron visits Weir Minerals Yateley site in Hampshire, UK.

14 The Weir Group PLC Annual Report and Financial Statements 2014

Strategic Report Financial StatementsCorporate Governance
15The Weir Group PLC Annual Report and Financial Statements 2014
Strategy in Action
InnovationDeveloping new products and services which deliver a competitive advantage.
How we do it: – Invest in engineering skills,
research and partnerships with leading universities.
– Invest in operational capability. – Develop innovation as part of
our culture. – Adopt a disciplined, four-stage
innovation process.
What we did in 2014: – Continued to invest in the Weir
Advanced Research Centre. – Continued the development of
our cone crusher range. – Developed a new Gabbioneta
pump for sale in North America. – Commenced roll-out of next
generation slurry pump range. – Commissioned external innovation
management expertise to critique our approach and provide guidance for further enhancements.
Benefits to Weir: – Technological advantage. – Faster concept-to-market time. – Higher proportion of revenue
generated by new products (‘vitality index’).
– Maintain market leadership. – Access to adjacent markets. – Increased sales and returns.
Benefits to our customers: – Greater operating efficiencies. – Higher process reliability. – Predictable maintenance cycles. – Lower total cost of ownership. – Lower environmental impact. – Sustainable competitive advantage.
Case study:
Meeting the changing demands of our global customersAs mine sites mature, the quality of the ore they produce diminishes leading to the need to process more volume. Over recent years this has led to the demand for larger-scale equipment which can operate for longer periods without downtime.
To address these customer needs, Weir Minerals has introduced two of the world’s largest mill circuit pumps. These pumps are the latest in a series dating back to 1999. Back then, with an inlet diameter of around 65cm, the original 550 model was seen as a big pump. Now, one of the new pumps has an inlet diameter of around 90cm and Weir has had to expand its manufacturing capabilities in order to produce it.
This feat of engineering involved international collaboration, with the pumps designed in the US and Chile and with components coming from Weir facilities around the world. In order to manufacture the large rubber linings these pumps require, Weir’s Chile plant had to rethink its manufacturing process and, by innovating, design and manufacture the largest rubber press in the world. The pumps are designed specifically for hard rock copper mining, meeting strict customer requirements to operate continuously for over 100 days in harsh environments; reinforcing Weir’s position as the market leader in mill circuit pumps worldwide.
By the end of 2014, the pumps were already supporting BHP Billiton’s operations at the Escondida mine in Chile and a third pump is on order to support Glencore’s operation at Antappacay in the Peruvian Andes.

16 The Weir Group PLC Annual Report and Financial Statements 2014

Strategic Report Financial StatementsCorporate Governance
17The Weir Group PLC Annual Report and Financial Statements 2014
Strategy in Action
CollaborationWorking with customers, suppliers, communities and colleagues ensures a better understanding of the markets we serve, and their evolving technology and support requirements.
How we do it: – Work together to secure contracts,
develop products and expand globally. – Develop deep relationships with
customers to provide engineering and aftermarket solutions across the product life cycle.
– Create industry alliances to support growth into new markets.
What we did in 2014: – Signed an agreement with MTU
to develop new, innovative fracking equipment.
– Continued the development of the Minerals’ Gladiator pump for the oil and gas end market.
– Signed a Global Framework Agreement (GFA) with Kinross Gold Corporation.
– Won a Procurement Leaders Award for the cost savings made through our GFA with Anglo American.
Benefits to Weir: – Customer intimacy. – Providing Group capability across
all markets. – Strong, sustainable relationships
with local communities. – Maximising returns on assets
and intellectual capital.
Benefits to our customers: – Greater efficiency and reduced
downtime. – Technology and solutions partnerships. – Anticipation of future needs. – Reduction of operating complexity. – Multi-end market knowledge.
Case study:
Working together to benefit our shared customersIn May, Weir’s Oil & Gas division signed an agreement with Rolls-Royce Power Systems company MTU to jointly develop power systems specifically engineered for hydraulic fracturing. The two companies are working together to address the need for more reliable and continuous duty equipment.
The companies will focus on developing a system which integrates the three critical components of a frack pump – the engine, transmission and fracturing pump. The complete system will use smart controls which provide continuous performance monitoring, optimising performance for the operator and reducing down-time during fracking operations.
The two companies have a long history of producing and supporting highly reliable and safe products specifically for use in harsh fracturing environments. Combining Weir’s expertise as a leading manufacturer of frack pumps with MTU’s market-leading knowledge of heavy-duty diesel engines, the equipment will be used for hydraulic fracking operations during the well completion stage of shale oil and gas projects.
The agreement also provides for full service and preventative maintenance of the entire power system, which will be achieved by using Weir’s market-leading service network combined with MTU’s service capability, ensuring close proximity to customers. The new system is expected to be available to customers in mid-2015.

18 The Weir Group PLC Annual Report and Financial Statements 2014
Strategy in Action
Value Chain ExcellenceDeveloping an efficient operating platform across the customer fulfilment process, from order to delivery.
How we do it: – Embedding customer needs
in technology development. – Working with suppliers to
improve process effectiveness. – Working with each other to
pool expertise across our three end markets.
What we did in 2014: – Expanded global manufacturing
facilities in best-cost locations. – Rolled out a VCE Management
System. – Achieved £46m of direct cost
procurement savings.
Benefits to Weir: – Culture of continuous improvement. – Reduces waste. – Supply chain savings. – Increased profitability, cash and
returns on capital. – Improved on-time delivery. – Reduced working capital.
Benefits to our customers: – Enhanced product and service quality. – Greater understanding of customer
operations. – Competitively priced solutions. – Reduced lead times and improved
on-time delivery.
Case study:
Improving efficiency throughout the value chainValue Chain Excellence (VCE) is a strategic pillar which underpins the future success of the Weir Group. VCE is designed to improve performance across the Group by aligning business processes to the needs of Weir’s customers.
The Group has rolled out a VCE management system throughout the organisation which sets out the five primary components of Value Chain Excellence: customer focus; engineering; planning; procurement; and lean enterprise. The management system helps Weir to segment customers’ needs and organise its internal processes and resources in a way which optimises performance.
Using its global network, Weir looks for the best quality goods at the best possible price around the world. Best cost sourcing is the preferred term over a more traditional low-cost country sourcing strategy. In one recent instance, sourcing goods from Western Europe proved to be much more cost effective than locally sourcing the same materials in the US due to the technical capability of the supplier.
A combination of these efforts has resulted in over £80 million of savings in two years. However, Value Chain Excellence goes far beyond the supply chain. The establishment of a VCE Management System helps Weir’s global businesses to consistently understand and respond to customer needs. By identifying and addressing areas for improvement, Weir can concentrate resources on areas which focus on the needs of its customers. This helps the Group sustain its competitive advantage while increasing revenue, customer loyalty and reinforcing its position as a trusted partner of choice.

Strategic Report Financial StatementsCorporate Governance
19The Weir Group PLC Annual Report and Financial Statements 2014
20 The Weir Group PLC Annual Report and Financial Statements 2014
Strategy in Action
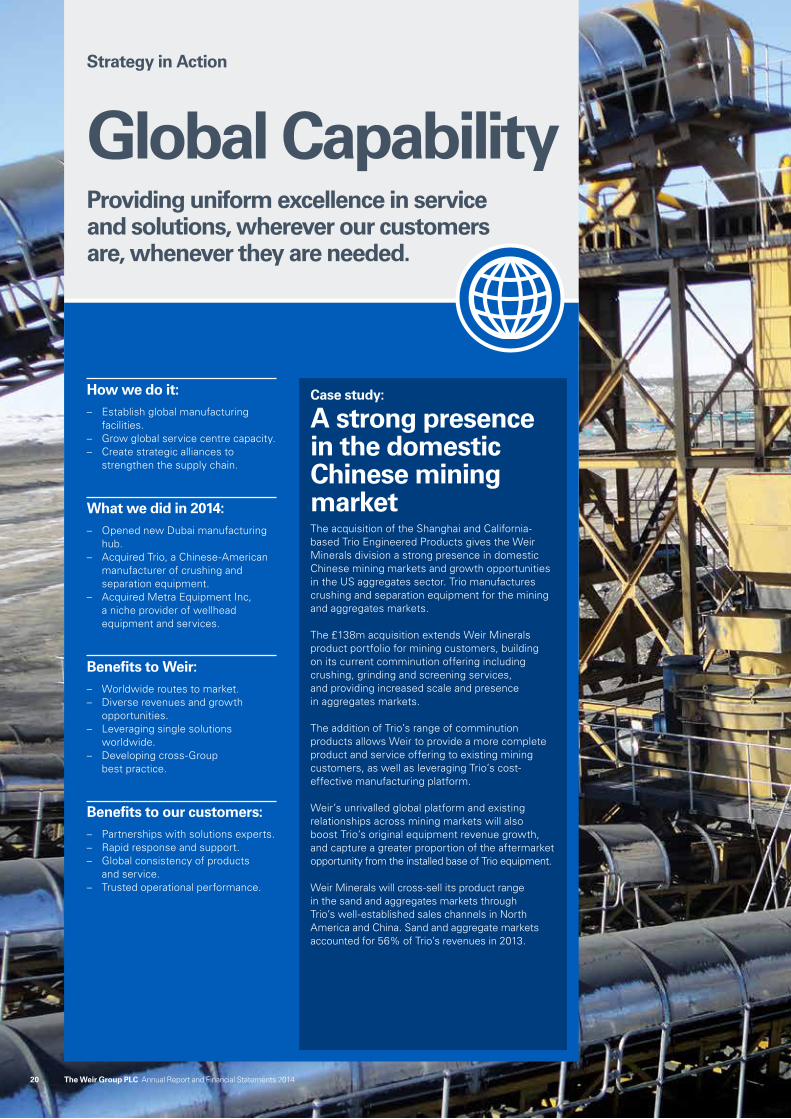
Global CapabilityProviding uniform excellence in service and solutions, wherever our customers are, whenever they are needed.
How we do it: – Establish global manufacturing
facilities. – Grow global service centre capacity. – Create strategic alliances to
strengthen the supply chain.
What we did in 2014: – Opened new Dubai manufacturing
hub. – Acquired Trio, a Chinese-American
manufacturer of crushing and separation equipment.
– Acquired Metra Equipment Inc, a niche provider of wellhead equipment and services.
Benefits to Weir: – Worldwide routes to market. – Diverse revenues and growth
opportunities. – Leveraging single solutions
worldwide. – Developing cross-Group
best practice.
Benefits to our customers: – Partnerships with solutions experts. – Rapid response and support. – Global consistency of products
and service. – Trusted operational performance.
Case study:
A strong presence in the domestic Chinese mining marketThe acquisition of the Shanghai and California-based Trio Engineered Products gives the Weir Minerals division a strong presence in domestic Chinese mining markets and growth opportunities in the US aggregates sector. Trio manufactures crushing and separation equipment for the mining and aggregates markets.
The £138m acquisition extends Weir Minerals product portfolio for mining customers, building on its current comminution offering including crushing, grinding and screening services, and providing increased scale and presence in aggregates markets.
The addition of Trio’s range of comminution products allows Weir to provide a more complete product and service offering to existing mining customers, as well as leveraging Trio’s cost-effective manufacturing platform.
Weir’s unrivalled global platform and existing relationships across mining markets will also boost Trio’s original equipment revenue growth, and capture a greater proportion of the aftermarket opportunity from the installed base of Trio equipment.
Weir Minerals will cross-sell its product range in the sand and aggregates markets through Trio’s well-established sales channels in North America and China. Sand and aggregate markets accounted for 56% of Trio’s revenues in 2013.

Strategic Report Financial StatementsCorporate Governance
21The Weir Group PLC Annual Report and Financial Statements 2014

22 The Weir Group PLC Annual Report and Financial Statements 2014
Key Performance Indicators
Monitoring and evaluating our performance
Priorities
Innovation
Collaboration
Value Chain Excellence
Global Capability
Strategic goals
Input1 (£m)
Operating
margin2 (%)
Free cash flow (£m)
Return on capital employed3
(%)
Inventory turns4
Total Incident
Rate (TIR)5
Strengthen and extend addressable markets in minerals, oil and gas and power sectors
Attain status of partner of choice for engineered products and services in our chosen markets
Key Performance Indicators
The Board uses a range of financial and non- financial metrics, reported on a periodic basis, to monitor the Group’s performance over time.

Strategic Report Financial StatementsCorporate Governance
23The Weir Group PLC Annual Report and Financial Statements 2014
1,000
2,000
3,000
2012 2013 2014
2,204 2,2742,473
10
15
25
2012 2013 2014
22.3
17.5 18.1
5
10
15
20
2012 2013 2014
19.1 19.218.4
2.0
1.5
1.0
2.5
3.0
3.5
2012 2013 2014
3.1 3.02.8
100
200
2012 2013 2014
62
168
79
1.0
1.5
2.0
2012 2013 2014
1.6
1.00.8
Input increased by 9% in a challenging year, with each quarter ahead of the prior year comparator. – Strong input growth in Oil & Gas
more than offset declines in Minerals and Power & Industrial.
– Aftermarket orders were up more than 14% and represented 67% of overall input.
– Each division continued to broaden its portfolio through the development and launch of new innovative products.
Continuing to invest to support growth over the long term. – Free cash flow impacted by investment
in working capital, driven by the strong growth in Oil & Gas.
– Cash outflows also impacted by re-phasing of interim dividend and higher cash tax.
– Capital expenditure of £101m was committed to support the long term growth plans of each division, substantially ahead of depreciation.
Group margins decreased by 80 basis points. – Minerals’ margins declined slightly
reflecting lower-margin product, with Oil & Gas stable after the strong flow through from Pressure Pumping was offset by lower margins in Pressure Control.
– Margins in Power & Industrial declined as a result of operational issues and product mix.
– Continuing focus on lean principles and taking rapid action to align the cost base to reflect the changing end market conditions helped support margins.
Input1 (£m)
£2,473m+9%
Operating margin2 (%)
18.4%-80bps
Free cash flow2 (£m)
£79m-53%
Return on capital employed (ROCE)3 (%)
18.1%+60bps
Inventory turns fell as stock levels increased faster than revenues. – Inventory increase driven by strong
growth seen in Oil & Gas year on year. – Good progress in reducing underlying
slow moving inventory. – Improvements expected in 2015 from
continued roll-out of Value Chain Excellence initiatives.
Generating strong returns on capital through the business cycle. – Return on capital employed increased
slightly year on year. – Oil & Gas’ returns improved reflecting
strong Pressure Pumping performance. – Minerals’ and Power & Industrial’s returns
fell reflecting lower activity levels and a disappointing performance respectively.
Incident rate reduced by 20% over the course of 2014. – Weir EHS roadmap continues to be
implemented and is being updated to ensure it continues to drive further improvements.
– Progress made in the roll-out of our ‘Weir Zero Harm’ Behavioural Safety programme.
– Completed our target of having all operational employees trained in strand one.
Inventory turns4
2.8 times-0.2 times
Total Incident Rate (TIR)5
0.8 -20%
1. Calculated at 2014 average exchange rates.2. Adjusted to exclude exceptional items and intangibles amortisation.3. Continuing operations EBIT (excluding Trio EBIT and exceptional items) divided by average net assets excluding net debt,
pension deficit (net of deferred tax asset) and Trio net assets. 2012: As 2013/14 but also excluding Mathena and Wales.4. As reported.5. 2014 average v 2013 average measuring medical treatment of any kind required by employees divided by 200,000 hours worked.

24 The Weir Group PLC Annual Report and Financial Statements 2014
Identifythe risks
Quantify the
gross risk
Mon
itor
and
repo
rt
controls are required
Iden
tify if further
mitigat
ing
cont
rols
Identify t
he e
xist
ing
mitigat
ing
cont
rols
Identify t
he e
xist
ing
the net risk
Quantifymiti
gatin
g co
ntro
ls
Identify
the
exis
tin
g
the net riskQuantify
con
trol actions
are requiredId
entify if further
Mon
itor
and
repo
rt
Identifythe risks
Quantify the
gross risk
Managing risk effectively
We operate in a complex global environment, where risks offer opportunities as well as challenges. Our objective is to allow our people to be decisive, so we can take advantage of attractive opportunities whilst ensuring we are not exposing the organisation to excessive risk.
The risk agendaDuring the year, the Board reviewed the Risk Appetite Statement which was approved in 2013. The Board determined that the Group’s risk appetite remains consistent and therefore the Risk Appetite Statement was approved without amendment and is set out below. The aim of the Risk Appetite Statement remains to highlight the risks that we should be willing to take, as well as those which are unacceptable. The statement includes a series of risk assertions which are aligned to our strategy, together with the risk parameters within which we expect our people to work. The risk appetite is all of the risk assertions and the parameters taken together. The parameters can apply to more than one risk assertion, and therefore the individual risk assertions should not be read in isolation. Compliance with the Risk Appetite Statement is monitored through the Group’s standard monitoring and reporting mechanisms. The Board will continue to review and update the Risk Appetite Statement on an annual basis. Details of the review of the internal control and risk management systems undertaken during the year are contained in the Audit Committee Report on page 89.
Risk management The management of risks is at the core of the internal control framework. We have a risk management policy which defines how we expect risks to be identified, assessed and managed throughout the organisation.
Risks are assessed, and quantified, in terms of impact and likelihood of occurrence, both before and after control mitigation. Assessing the gross risk before control mitigation also allows the business to review the relative impact of the existing controls by comparing the gross and net risk assessment.
This also allows the business to avoid wasting resources on mitigating controls and actions which have a negligible impact on the risk assessment.
The impact of risks is quantified across a range of factors including: financial; reputation; people and property; ability to perform services; regulation, environment and health & safety; and investors and funding. The risk management policy includes defined criteria for each risk
impact factor, supporting a consistent measurement approach. Risk management takes place at the grassroots level, for example in individual projects, all the way up to Group level assessments, thereby providing an integrated bottom-up and top-down approach to risk management.
Figure 1: Risk Management Cycle
How We Manage Risk

Strategic Report Financial StatementsCorporate Governance
25The Weir Group PLC Annual Report and Financial Statements 2014
Not all risks are controllable or foreseeable, a key example being natural disasters. Our response to such risks is having controls which lessen the impact to our business should they occur. For example, in the case of natural disasters, we have controls in place to reduce the risk of harm to our people, as well as response planning protocols, with clear accountability, to minimise disruption to operations and our customers.
Risk appetite statementThe Group is strategically positioned in markets with long term high growth potential. We will pursue ambitious growth targets, and we are willing to accept a higher level of risk to increase the likelihood of achieving or exceeding our strategic objectives, subject to the parameters below.
Risk assertions Risk parameters
1. Organic growth: We will aggressively pursue divisional organic growth strategies to meet our market growth objectives.
Investment of resources will be consistent with divisional strategies, and divisional compound annual growth rates over five-year plans.
2. Mergers and acquisitions: We will actively pursue M&A opportunities that enhance our strategic platform, subject to meeting investment criteria.
Post-tax returns should exceed our cost of capital within three years of the acquisition.
3. Returns and profitability: We will not pursue growth at all costs, and expect high margins, strong returns on capital, and working capital discipline.
Short term margin dilution is acceptable in gaining market entry but over the cycle we aim for top quartile operating margins and returns on capital.
4. Capital allocation: We will encourage capital expenditure (capex) in pursuit of our growth ambitions, subject to Internal Rate of Return (IRR) and achievement of Group free cash flow targets.
Planned IRR on capital expenditure projects should not be less than 20%.
5. Capital structure: We are prepared to use leverage in pursuit of our growth agenda and will actively seek low cost debt to fund the Group but will maintain significant headroom against our financial covenants.
We will seek to maintain the ratio of net debt/EBITDA below 2 times at any time (current financial covenants below 3.5 times).
Financing facility headroom of at least £150m.
6. Reputation and brand image: We will manage/avoid situations or actions that could have a negative impact on our reputation and brands.
No tolerance for breaches of:
- Legislative/statutory requirements. - Weir Code of Conduct. - International sanctions. - Delegated authority levels. - Group and divisional policies.
7. Environment, health and safety: We will not undertake or pursue activities that pose unacceptable hazard or risk to our people, the communities in which we operate, or the broader environment.
- Total Incident Rate ≤1 and EHS Audit Score >40%. - Active community and environmental engagement is expected. - No tolerance for breaches of Weir EHS system.
8. New entry to countries: We are prepared to enter new countries which offer opportunities for growth consistent with our overall strategy. We will not enter countries which present a high risk of harm to our people, damage to our reputation, or breach of international sanctions.
No tolerance for breaches of:
- Legislative/statutory requirements. - Weir Code of Conduct. - International sanctions. - Delegated authority levels. - Group and divisional policies.
Strategic riskIndustry and market downturns.
Technological advances.
Pricing pressures.
Acquisitions and mergers.
Planning and resource allocation.
Hazard riskPolitical and social instability.
Natural disasters and other major incidents.
External fraud and corruption.
Operational riskPeople.
Delivery and supply chain.
Quality.
Commercial.
Communication.
IT.
Compliance riskLaws and regulations.
Code of Conduct.
Environment, health & safety.
Governance.
Intellectual property.
Financial risk Financial management.
Credit.
Debt and interest rates.
Foreign exchange.
Accounting and reporting.
Taxation.
Internal fraud.
The specific risks identified across the business generally fall under one of the categories within the ‘Risk Universe’ as shown below.
Figure 2: Risk Universe

26 The Weir Group PLC Annual Report and Financial Statements 2014
Board and sub-committees
Group Executive
Risk Committee
Operating company management
Divisional management
Repo
rtin
g
Policies and decisions
Risk responsibilities and reporting
Ultimately, the Board is responsible for the Group’s risk and internal control framework. It has set out the decisions, and hence the level of risk, which can be delegated to the Group Executive, divisional and operational company management without requiring escalation. This is articulated in a series of Group policies and delegated authority matrices, as well as the parameters within the approved Risk Appetite Statement. The Board and committee structure can be viewed on page 77.
The bottom-up risk reporting approach requires key risks identified, and reported, at project level to be escalated to the operating company management, which in turn may be escalated to divisional management, and ultimately to the Risk Committee and the Board. This is achieved through risk dashboard reports, which are maintained at operating company, divisional and Group level. The dashboards provide a summary of the major net risks at each respective level, as well as a summary of the key mitigating controls and actions, and further control actions required.
The Risk Committee monitors quarterly risk dashboard reports from the operating companies and divisions. In addition, the Risk Committee has oversight of the Group Risk Dashboard, providing an update to the Board at each Board meeting. The Board obtains assurance over risks and risk management through the internal control framework. More information on the internal control framework can be found within the Corporate Governance Report on page 81 and within the Audit Committee Report on page 89.
Figure 3: Risk responsibilities and reporting
How We Manage Risk continued

Strategic Report Financial StatementsCorporate Governance
27The Weir Group PLC Annual Report and Financial Statements 2014
The key roles and responsibilities for risk management are set out below:
Risk management responsibilities
BoardOverall responsibility for the Group’s risk management and internal control frameworks, and strategic decisions within the Group.
- Annual review and ongoing monitoring of the effectiveness of the risk management and internal control frameworks.
- Review of risks which have the potential to impact the delivery of the Group’s strategic objectives.
- Taking decisions in accordance with the delegated authority matrices.
Audit Committee Delegated responsibility from the Board to review the effectiveness of the Group’s risk and internal control frameworks.
- Annual assessment of the effectiveness of the risk management and internal control frameworks.
- Review of reports from the internal and external auditors. - Review of the results from the six-monthly self-assessment compliance scorecards.
Risk CommitteeManagement committee responsible for governance of the Group’s Risk Management Policy and Framework.
- Review of the design and operation of the Group Risk Management Policy and Framework. - Identification and assessment of the key risks facing the Group, identification of the key
controls mitigating those risks, and identification of further actions where necessary. - Review of the Divisional Risk Dashboards, considering the appropriateness of
management’s responses to identified risks, and assessing whether there are any gaps. - Reporting key Group and divisional risks to the Board.
Group ExecutiveExecutive committee with overall responsibility for managing the Group to ensure it achieves its strategic objectives.
- Managing risks which have the potential to impact the delivery of the Group’s strategic objectives.
- Monitoring business performance, in particular key performance indicators relating to strategic objectives.
- Taking strategic decisions in accordance with the delegated authority matrices. - Escalating issues to the Board as required.
Excellence CommitteesEngineering Environment, Health & Safety Finance HR IT Value Chain
Management committees with representatives from across the Group in their respective areas of focus. The committees govern activities and performance in the individual functional areas.
- Monitoring the management of key risks across the Group associated with the respective remits of the Excellence Committees.
- Monitoring performance and compliance with Group objectives, policies and standards related to the respective remits of the Excellence Committees.
- Taking decisions in accordance with the delegated authority matrices. - Escalating issues to the Group Executive as required. - Reviewing the results from relevant assurance activities.
Divisional ManagementResponsible for managing the businesses within the divisions to ensure divisional strategic objectives are achieved and there is compliance with Group policies and standards throughout their division.
- Managing risks which have the potential to impact the delivery of the divisions’ strategic objectives.
- Monitoring performance and compliance with Group objectives, policies and standards within the divisions with regard to the outputs from the Excellence Committees.
- Taking decisions in accordance with the delegated authority matrices. - Escalating issues to the Group Executive as required. - Reviewing the results from relevant assurance activities.
Operating Company Management Responsible for ensuring company objectives are achieved and business activities are conducted in accordance with Group policies and standards.
- Managing risks which have the potential to impact the delivery of their company’s strategic objectives.
- Monitoring performance and compliance with Group objectives, policies and standards within their company.
- Taking decisions in accordance with the delegated authority matrices. - Escalating issues to divisional management and Excellence Committees as required. - Reviewing the results from relevant assurance activities.

28 The Weir Group PLC Annual Report and Financial Statements 2014
Principal risks and uncertainties
As in any business, there are risks and uncertainties which could impact the Group’s ability to achieve its objectives in the future. However, we believe the Group’s risk management and assurance framework makes this less likely. The principal risks set out below are those which we believe to have the greatest potential to impact our ability to achieve the Group’s strategic objectives.
Risk Why we think this is important How we are mitigating the risk
Global economic conditions
Changes in key markets, including commodity prices affecting mining and oil and gas, have an adverse impact on customers’ expenditure plans. This may include delaying existing expenditure commitments.
We need to remain sufficiently flexible to allow us to anticipate downturns, to allow us to adjust our operations accordingly, and equally to meet growth in demand when our customers’ markets are buoyant and therefore capital investment is high. Otherwise, we are at risk of incurring unnecessary costs during downturns, and not maximising our potential for growth in buoyant markets.
In challenging market conditions, our working capital risks are increased. These are described in more detail on page 29.
- We maintain regular engagement with our customers to understand their needs and challenges, and ensure our business is appropriately aligned.
- Our strategic planning utilises extensive market intelligence to assist in forecasting opportunities and dips in markets.
- We maintain contingency plans for downturns.
Changes during 2014Market conditions have become more challenging during 2014, with commodity prices in oil and gas joining those in minerals markets at recent historical lows. Necessary adjustments have been made to our operations to accommodate our customers’ responses to these market conditions.
Technology and innovation
We fail to drive innovation or to react to emerging technology developments, and therefore fail to ensure that the business continues to deliver sustainable and attractive solutions for our customers.
The strength of our business is built upon a history of delivering innovative and sustainable solutions for our customers. If we fail to keep abreast of market needs or to innovate solutions, we are at risk of losing market share to our competitors and lowering margins as demand will reduce.
- Continual investment in research and development, including the Weir Advanced Research Centre (WARC) in conjunction with the University of Strathclyde.
- We have a dedicated governance team (Engineering Excellence Committee) focused on the delivery of our strategic objectives for technological advances and innovation to meet the needs of our customers.
Changes during 2014The pace of technological innovation continues to increase as we and our competitors seek to provide customers with solutions that improve the efficiency of their operations. To ensure we continue to retain competitive advantage in this area, our existing research and development initiatives within the business, at WARC, and at certain universities around the world, have been enhanced through our partnership with Imperial College, London. This partnership will help the Group develop game-changing solutions to our customers’ challenges. We are also devoting additional resources to reviewing and responding to developing technologies, including appointment into the new role of Head of Engineering & Technology Development. Further information on progress made in this area is set out in the Products and Technology section of the Sustainability Review on pages 59 and 60.
Risk trend – post mitigation
Increasing
Unchanged
Decreasing
How We Manage Risk continued

Strategic Report Financial StatementsCorporate Governance
29The Weir Group PLC Annual Report and Financial Statements 2014
Risk Why we think this is important How we are mitigating the risk
Political and social risk
Adverse political action, or political and social instability, in territories in which we operate may result in strategic, financial or personnel loss to the Group.
We operate across the globe and therefore have to work within a wide range of political and social conditions. Adverse events may occur in the territories in which we operate that may require us to act swiftly to protect our people, our property and to maintain our competitiveness, and we need to be flexible and able to anticipate such issues. Expansions into new territories are only undertaken after rigorous assessment of the risks, including the social and political situation within the territory.
- Regular review of market attractiveness. - Monitoring travel by Weir employees to higher
risk locations. - External expert risk assessments and regular
monitoring in higher risk locations. - Contingency plans and exit strategy planning. - Our strategic planning assists in forecasting potential
political and social instability in regions.
Changes during 2014 In response to increased security risks, arising from changes in the political environment in certain countries where the Group has operations, enhancements have been made to the Group’s access to expert risk assessments and plans to respond to adverse events in higher risk locations. During the course of 2014, it became evident that the environment in which a number of the Group’s businesses operate is becoming increasingly challenging and uncertain, especially from a security perspective. As the safety of our staff is of paramount importance, a new position of Group Head of Security has been created to improve the ways in which these concerns are addressed and mitigated. This position will report directly to the Group General Counsel. A Group Head of Security has now been recruited and is due to start work in April 2015.
Supply chain and working capital
Failure to achieve supply chain management improvements and the associated reduction in costs, working capital and enhanced flexibility.
If we fail to improve our supply chain management, we risk:
- losing the opportunity to invest capital which is currently committed to working capital into alternative value creating opportunities;
- damaging our reputation and as a consequence losing customers and market share;
- incurring penalties as a result of late delivery contractual clauses;
- reducing margins by incurring unnecessary additional costs associated with late remedial actions taken to avoid missing delivery targets; and
- holding excess inventory in the event of a market downturn.
- Regular KPI monitoring of the supply chain throughout the organisation.
- The Group’s operations are currently implementing Value Chain Excellence initiatives which are intended to enhance operations’ working capital management and shorten lead times, amongst other business improvement objectives.
- Established Centres of Excellence drive cost savings, efficiencies and enhance delivery standards whilst maintaining quality.
- The Group’s forward purchase commitments are being closely monitored to manage inventories at levels appropriate to market conditions.
- Our credit risk management procedures are under continuous appraisal and their application is subject to specific internal audit review.
Changes during 2014Supply chain remains an area of strategic focus for the Group. Supply chain improvements continue to be recognised year on year as the Group realises benefits from its focused approach to these matters. A programme of Value Chain Excellence initiatives has been launched throughout the Group to drive supply chain improvements.
Environment, health and safety (EHS)
Failure to adequately protect our people and other stakeholders from harm associated with a breach in EHS standards.
We operate in hazardous environments, and therefore have a fundamental duty to protect our people and other stakeholders from harm whilst conducting our business. As well as the personal impact on our people resulting from a failure to meet this obligation, we would also be at risk of:
- reputational damage leading to a loss of customers;
- legal action from regulators, including fines and penalties; and
- exclusion from markets important for our future growth.
- The Weir Behavioural Safety system is in place to reduce the risk of safety incidents. In addition, there are initiatives to prevent the most common accident types. The Weir global EHS standards are continually reviewed.
- The EHS Excellence Committee is responsible for monitoring performance and compliance with Group objectives, policies and standards relating to EHS.
- There is a formal EHS assurance programme with issues escalated as required through the reporting structures.
Changes during 2014 The Group is never complacent in relation to EHS matters. Committed to achieving the highest of standards, the Group continues to set higher benchmarks for EHS compliance and roll out cohesive programmes to address EHS risks and drive safe and sustainable working practices. Improvements have been made through the year to our EHS board reporting and assurance activities and our key performance indicators in place to measure our success in mitigating EHS risks have shown an improvement on 2013.

30 The Weir Group PLC Annual Report and Financial Statements 2014
Risk Why we think this is important How we are mitigating the risk
Contract risk
We fail adequately to manage contract risk and as a result commit to obligations which the Group is unable to meet without incurring significant unplanned costs.
In addition, failure to follow Group policies and procedures may lead to commitments without the desired level of contractual protections.
We operate in an increasingly complex and competitive environment where customers are not only highly focused on price and service but are also more challenging in contract negotiations.
As we offer a broader range of products and services to our customers, including those that are more technologically advanced, we risk exposing the Group to reputational and financial loss should our contract acceptance, negotiation and approval processes fail to protect the Group accordingly.
- The Group has policies and procedures for contract acceptance and approval.
- These are under continuous review and improvement to ensure they are adequate for current and future circumstances.
- The tools and training available to employees responsible for contract management are similarly under continuous review.
Changes during 2014 Contract management has become an area of increased focus for the Group, given the competitive environment and the breadth and depth of our product offerings, and therefore during 2014 was identified as a principal risk. Amongst other initiatives, certain of the Group’s policies and procedures have been reviewed and refreshed to provide employees with improved tools to assist them in their contract management activities.
IT security and continuity
Failure to maintain business systems or technical infrastructure that serves the business needs.
Failure to successfully execute changes to these business systems or technical infrastructure; together with failure to minimise disruption and maintain business as usual activity during technical infrastructure or business system changes.
Failure to adequately protect the business operations from cybercrime.
Up-to-date data allows us to make informed decisions about our business. Therefore, we require reliable and efficient IT systems and infrastructure to provide our data requirements. Breaches of our IT security could have serious consequences for our business, including:
- interruption to business operations; and - loss of intellectual property and other
sensitive data.
The Group is investing in a significant IT transformation programme. If this is not managed effectively, the consequences could include interruption to business operations if data is unavailable due to unsuccessful execution of change, impacting our ability to compete and our reputation in the market.
At present, the Group’s principal exposures to cybercrime relate to the misappropriation of cash and data. Our revenue streams are largely protected as our products are not currently electronic in nature and we do not, as a rule, transact over the internet.
- We continually review the effectiveness of our key IT security controls in consultation with external experts.
- There is regular reporting of unplanned outages and potential security breaches, with lessons learned across the Group.
- We have an IT Governance Framework with a focus on structured change management techniques, including setting project governance levels in line with risk.
- External assurance being obtained on the Tier 1 IT transformation projects reporting through Internal Audit.
- The security arrangements around all of the Group’s information assets will be revised following the transition to the Weir Cloud infrastructure.
- Policies, procedures and baseline standards in relation to cyber risk and IT security more generally are continuously updated and rolled out to operations. A programme of user training in relation to cyber risk is being rolled out.
Changes during 2014 IT security and continuity continues to be a matter of strategic priority for the Group. Progress to strengthen the Group’s defences in this respect is being made according to plan as Tier 1 IT projects, such as Weir Cloud, and divisional IT improvements and other projects are put in place.
How We Manage Risk continued

Strategic Report Financial StatementsCorporate Governance
31The Weir Group PLC Annual Report and Financial Statements 2014
Risk Why we think this is important How we are mitigating the risk
Cost competitiveness
Failure to deliver cost competitive products and services, or failure to deliver sufficiently differentiated products and services which justify a price premium through lowest total cost of ownership value propositions.
Customers are increasingly focused on the price competitiveness of products and services as they seek to lower operating costs. If the Group fails to demonstrate the value of our products and services, it risks losing market position.
- There is continual focus on maximising the efficiency of our products to ensure the solutions provided to customers deliver the best overall value, allowing our customers to meet their cost reduction strategies through lower energy costs and improved productivity.
- The key component Centres of Excellence are driving cost efficiencies, whilst maintaining quality.
- Expansion of production in best-cost locations, including foundry expansions in Malaysia and South Africa.
- We regularly monitor market activity to ensure we remain competitive.
Changes during 2014Cost competitiveness remains a strategic priority for the Group. Initiatives to expand production in best-cost locations are developing in South Africa and Malaysia and the procurement function continues to drive cost and quality improvements through the Group’s supply chain.
Ethics and governance
Interactions with our people, customers, suppliers and other stakeholders are not conducted with the highest standards of integrity which devalues our reputation.
We are unwilling to accept dishonest or corrupt behaviour from our people, or external parties acting on our behalf, whilst conducting our business. If we fail to act with integrity, we are at risk of:
- reputational damage leading to a loss of customers;
- increased scrutiny from regulators; - legal action from regulators including fines,
penalties and imprisonment; and - exclusion from markets important for our
future growth.
- The Code of Conduct, supplemented with Group policies on related topics, provides a clear benchmark for how we expect our business will be conducted.
- Regular training is provided using a range of mechanisms including Town Hall style sessions, online and induction training.
- The financial control framework is continually monitored for effectiveness.
- Internal Audit’s remit includes regular review of the anti-bribery and corruption and financial controls across the Group. The Group Legal team is responsible for monitoring compliance with the Code of Conduct.
Changes during 2014 The governance and legislative environment in which the Group operates continues to evolve and become more complex. The Group has further developed and grown its operations in geographies where ethical standards may not be as well established as in other countries. The Group has reinforced its commitment to high standards of ethics and governance, having reviewed, updated and reissued the Code of Conduct during 2014 and completed a programme of training for key individuals. In addition, the Group has developed and issued a Group Competition Law Manual, which again is being accompanied by related training for those in relevant roles.
Acquisitions and expansion into new territories
Inadequate planning and management of the integration and expansion processes impacts the ability to generate growth opportunities, synergies and cost savings within expected timescales.
Acquisitions and expansions into new territories are only undertaken after rigorous review and identification of expected synergies, cost savings and growth opportunities. However, there is a risk that these benefits may not be achieved, or may not be achieved within the anticipated timescales, thereby tying up the Group’s funds in investments with insufficient returns. There is also a risk that we could be left liable for past acts or omissions of the acquired businesses without adequate right of redress.
- The strategic planning process includes market and competitive position assessments to drive the acquisition agenda.
- Comprehensive due diligence is performed on all potential acquisitions.
- We have a formal 100 day integration plan with dedicated integration directors and managers appointed to oversee and manage the full integration programme.
- The Group’s pre- and post-acquisition processes are subject to continuous review and improvement based on our experience of past acquisitions.
- We seek to secure appropriate legal protection against potential liabilities and to secure rights of redress against sellers where such liability arises.
Changes during 2014 With the acquisition of Trio in October 2014, the Group has continued to pursue its strategy of broadening its product offering through the mining production cycle. This acquisition, together with those made in prior periods, continues to be successfully integrated in accordance with the Group’s established processes.

32 The Weir Group PLC Annual Report and Financial Statements 2014
Operational Review
Weir Minerals Delivering in challenging market conditions

Strategic Report Financial StatementsCorporate Governance
33The Weir Group PLC Annual Report and Financial Statements 2014
Our focus on enhanced service capability and forging ever-stronger relationships with customers helped to deliver a resilient performance in what continue to be challenging end markets.
Dean JenkinsDivisional Managing Director
Invest in comminution process knowledge and materials wear technology:
– Global Product Managers in place to lead crushing, grinding and screening initiatives. – Development of cone crusher range continues, assisted by the acquisition of Trio. – Several projects initiated focused on High Pressure Grinding Rolls (HPGRs) upgrades. – Trials under way for new family of castings with positive early results.
Identify new platforms for potential growth aligned to our core strategy and competences:
– Acquisition of Trio further extends the product portfolio into the adjacent comminution segment of the mill circuit, providing scale and presence in the growing aggregates end market.
– Strong performance from recent acquisitions of R Wales (rubber and wear-resistant linings for mining, minerals processing and oil sands industries) and Aspir (centrifuges).
– As part of the Group efficiency review, consolidation of manufacturing sites expected to save £15m.
Reduce lead times and working capital through global supply chain initiatives:
– Achieved significant improvements in lead times and best-cost country sourcing. – Global capacity plan and inventory management system implemented. – Good progress was made in reducing working capital in North America.
Continue development of Minerals and Oil & Gas product portfolios through collaboration and innovation:
– Progress made in development of Gladiator pump for the oil and gas end market, and in extending the range of swellable packers, using the division’s rubber technologies.
– Collaboration initiatives between Floway, Gabbioneta and Weir Specialty Pumps proceeding well. A new Gabbioneta pump is available for Minerals to sell in North America.
Help make our customers’ existing operations more efficient by continuous improvement of our core products, wherever they need us:
– Commenced roll-out of next generation slurry pump range. – Cost savings and efficiency gains achieved by Anglo American as a result
of strategic alliance recognised with Procurement Leaders award. – Signed a Global Framework Agreement with Kinross Gold Corporation. – New service centres opened or planned for Philippines, Mongolia and Russia.
Key priorities and progress in 2014
Strategic Goals
Innovation
Collaboration
Value Chain Excellence
Global Capability
Market driversPrice declines were experienced across a number of key commodities in 2014, as increased global supplies of iron ore, coal and copper combined with slowing demand growth, principally as a result of economic conditions in China and other emerging markets. Iron ore prices fell by almost 50% in the year, resulting in a notable impact on brownfield project activity. While copper prices fell by 14%, brownfield investment remained resilient. Gold prices were broadly flat over the period and remained below the levels required to drive higher capital investment. Ore production from existing mines continued to increase, supported by the move from construction to full operation of several new mines, particularly in South America, and miners seeking to maximise production from existing sites to partially offset commodity price declines.
Both these trends supported aftermarket demand with global ore production growing 3% in 2014.
Mining sector capital expenditure fell by an estimated 17% in 2014. As a result there were very few greenfield project opportunities and customers displayed caution in proceeding with brownfield investment. Industrial action in South Africa significantly impacted local production levels, and the outbreak of the Ebola virus also caused disruption in West Africa. In Europe, weak economic conditions and geopolitical unrest in Eastern Europe impacted activity. Non-mining end markets also declined with lower project activity across power, oil and gas, although oil sands aftermarket demand remained stable.

34 The Weir Group PLC Annual Report and Financial Statements 2014
2014 £226m
2013 £243m
2012 £228m
2014 £1,128m
2013 £1,178m
2012 £1,178m
Operational Review continued
Strategic progressThe division’s comminution (crushing, grinding and screening) strategy advanced significantly with over 60% growth in order input and the award of original equipment contracts for High Pressure Grinding Rolls (HPGRs) in North America and Europe. In addition, the acquisition of Trio Engineered Products expands the division’s product offering and end market presence into aggregates.
Investment in new product development has continued with a focus on helping our customers achieve their aim of increasing efficiency. A new vertical slurry pump was launched with retrofit capability for existing customers, enabling upgrades to take place at reduced cost. In addition, the division designed, built and installed the world’s largest mill circuit slurry pump at a mine in Chile. Our Global Framework Agreement with Anglo American has seen one of the division’s key customers achieve immediate gains in component life and power-saving, by applying our technology to existing pumps. A second Global Framework Agreement was signed in 2014 with Kinross Gold Corporation.
New service centre facilities were established in Asia-Pacific and Europe, further enhancing our global capability and extending the division’s market- leading service centre network. Planning is continuing for a new best-cost campus in Malaysia which will include a new foundry, machine shop and continuous rubber processing plant. In oil sands markets, there was an increase in demand for our barge products and aftermarket performance was supported by growth from the R Wales group of companies which was acquired in early 2013.
The division’s Value Chain Excellence initiatives included progress in the roll- out of a best-in-class Enterprise Resource Planning (ERP) platform to increase efficiency, decrease working capital and deliver lead time reductions to customers. As part of the Group-wide efficiency review the division announced in November 2014 the consolidation of four smaller manufacturing units into larger facilities across Europe, North America and Australia, which combined with other actions including workforce reductions in Africa, Europe and South America, is expected to contribute annualised benefits of £15m by the end of 2015.
Order Input decreased by 4% to £1,127m (2013: £1,180m), with strong aftermarket growth more than offset by a material fall in original equipment orders. Original equipment orders were 22% lower year on year, driven by a reduction in the number of brownfield projects reaching the procurement stage and lower orders from non-mining markets, although a good level
of quotation was maintained. Although down year on year, original equipment order trends improved slightly through the year with second half input up 3% compared to the first half, despite the non-recurrence of a large HPGR order received in H1.
Aftermarket orders grew by 6%, at the upper end of original expectations and represented 69% of total input (2013: 62%). This was supported by the benefits of a large and growing active installed base, underlying ore production trends and the commissioning of greenfield sites. Aftermarket growth of more than 4% was achieved in three out of four quarters with Q4 impacted by the cancellation of a large £11m HPGR order, previously booked in Q3.
The division continued to make good progress in comminution with input of £49m (2013: £30m). Slurry pump orders were materially lower year on year, reflecting market conditions. Good progress was made in growing the valves product line. In oil sands markets, there was an increase in demand for barge products and aftermarket performance was supported by growth from the R Wales group of companies.
Emerging markets accounted for 47% of input (2013: 45%) with higher activity levels in South America and the Middle East offsetting the impact of industrial action in South Africa. Orders from mining end markets were flat year on year and accounted for 77% of input (2013: 74%). Input from non-mining markets declined by 16% compared to 2013, which included large orders from coal bed methane and wastewater projects which were not repeated in 2014.
Revenue was 4% lower at £1,128m on a constant currency basis (2013: £1,178m) but with second half revenues showing 6% sequential growth. Original equipment sales were 17% lower and accounted for 33% (2013: 38%) of divisional revenue. Production-driven aftermarket revenues increased by 4% with sequential growth each quarter.
Double-digit growth in Asia-Pacific, supported by the acquisition of Trio in late October 2014, was offset by a £42m reduction in African revenues, primarily as a result of strikes in South Africa. Revenues from European and South American markets also fell, reflecting subdued end market conditions although output in Australasia increased slightly, supported by strong aftermarket demand. Reported revenues declined by 14%, reflecting a 10% foreign exchange headwind (2013 reported: £1,304m).
Operating profit decreased 7% on a constant currency basis to £226m (2013: £243m), as a result of lower revenues and a fall in contribution from African operations of £18m and investment in the comminution
Operating profit*
£226m-7%
Revenue*
£1,128m-4%
platform. One-off integration and acquisition costs of £1m were incurred in relation to Trio, largely offsetting its operating contribution in the period. Reported operating profit fell by 16% after a 10% foreign exchange headwind (2013 reported: £269m).
Operating margin declined by 50bps to 20.1% (2013: 20.6%), reflecting a higher mix of lower margin products, increased investment in the comminution platform and a circa 30bps impact on a constant currency basis from materially lower revenues in Africa and the effects on the division’s supply chain and operations, of direct strike action in the second half. These adverse factors were somewhat offset by the benefit of cost reduction and procurement initiatives and a higher proportion of aftermarket revenues.
InvestmentCapital expenditure of £45m (2013: £53m) included investment in the initial development of a new best-cost campus in Malaysia. The division is also investing in a common ERP platform over the next three years to support global capacity planning. Research and development spending of £11m (2013: £13m) was focused on developing the division’s materials technology, mechatronics capability and expanding its product portfolio.
OutlookTotal mining capital expenditure is expected to reduce for the third year in succession in 2015, albeit at a lower rate than 2014. Maintenance capital expenditure is anticipated to remain broadly in line with recent years; however, further reductions are forecast in brownfield and greenfield investment. The growth rate for global ore production is expected to be in the
* 2012 and 2013 restated at 2014 average exchange rates.

Strategic Report Financial StatementsCorporate Governance
35The Weir Group PLC Annual Report and Financial Statements 2014
Minerals 77%Oil and gas 9%
Power 3%Other 2%
Industrial 9%
Market input breakdown
South America 23%North America 23%
Middle East/Africa 14%
Asia-Pacific 10%
Australasia 18%
Europe 12%
Geographic input breakdown
Partners in production worldwide
Working with our customers to improve efficiencyWeir recently signed a Global Framework Agreement with Kinross Gold Corporation which will reduce operating costs and increase productivity at Kinross’ mine sites and operations.
The agreement covers all of Kinross’ global locations including North America, South America, West Africa and Russia.
Kinross is a Canadian gold mining company which maintains listings on both the Toronto Stock Exchange and the New York Stock Exchange. Founded in 1993, Kinross has become one of the world’s leading gold mining groups with total annual gold equivalent production of 2.6 million to 2.7 million ounces forecast in 2014.
The agreement will see the two companies work together to identify opportunities to reduce Kinross’s operating costs, ensure security
of supply and identify solutions which create value for both companies. Weir Minerals will become Kinross’ preferred supplier of mining equipment, including centrifugal slurry and positive displacement pumps, hydrocyclones, slurry valves, crushers, screens, rubber and mill liners.
Weir’s reputation for delivering innovative, highly engineered and efficient mining equipment, supported by its market-leading global service centre network, complements Kinross’ operating model and will help to deliver total cost of ownership reductions. This builds on the agreement Weir signed with Anglo American in 2013.
Key priorities in 2015
Execute comminution strategy through effective integration of Trio.
Increase investment in research and development to position the division for future growth.
Strengthen interface with our customers through enhanced service capability and greater on-site presence.
Progress implementation of new divisional ERP system.
Increase efficiency and deliver the benefits of the global rationalisation programme.
low single digits, supported by growing global demand.
Oil sands capital expenditure is anticipated to decline materially, reflecting recent oil price reductions, although production levels are expected to be resilient. The impact on mining original equipment revenues is expected to be largely offset
by a strengthening comminution presence, particularly in the growing aggregates end market and including a full year contribution from Trio. Aftermarket revenues are anticipated to benefit from increasing ore production volumes and a growing active installed base as customers commission and continue to ramp up activity levels at new mines, particularly in South America.
In addition, profits will be supported by the first benefits from the previously announced efficiency review and a more normalised operating environment in South Africa. Operating margins are expected to be slightly lower year on year, as a result of reduced profitability and volumes in oil and gas markets.

36 The Weir Group PLC Annual Report and Financial Statements 2014
Operational Review continued
Weir Oil & Gas Staying flexible in dynamic markets

Strategic Report Financial StatementsCorporate Governance
37The Weir Group PLC Annual Report and Financial Statements 2014
2014 saw every business in the division grow by swiftly reacting to increasing demands of customers and leveraging its market-leading service centre network to deliver a strong increase in constant currency revenues and profits.
Paul CoppingerDivisional Managing Director
Capitalise on growing international opportunities across each business:
– China accounted for 29% of Asia-Pacific revenue. – Expanded production and geographic presence in the Middle East and introduced
Seaboard and Mathena products. – Opened new Oil & Gas Services manufacturing facility in Dubai, UAE which will enable
the manufacturing of Pressure Control equipment in the region.
Accelerate customer uptake of recent product and service launches:
– More than 40% of all fluid end sales from new premium technologies. – 260% growth in Seaboard zipper manifold sales. – The SPM® 8 Station Manifold Skid with Safety Iron® connections launched provides
a compact footprint for easy transport and use. – Seaboard NWH-C Overshot Connector launched and securing first orders in 2014.
Continue to grow share in the pressure pumping market:
– Fluid end market share increased to 27% in 2014. – Power systems strategic partnership formed with Rolls-Royce Holdings PLC
subsidiary – MTU America.
Expand maintenance services capacity in Iraq, in support of the LUKOIL contract awarded in January 2014:
– API and ISO certified facility in Basra having API 6A, 16A, 5CT, 7-1 & ISO 9001, 14001 and 18001 certifications.
– Successful mobilisation and expansion of capabilities and capacity in Iraq in support of US$100m two-year contract with LUKOIL.
– Acquired additional OCTG threading/machine shop facility Iraq, increasing capability to serve Southern Iraq’s oil and gas industry.
Deliver benefits from upstream and downstream oil and gas forums:
– £8m of revenues from the organically developed Swellable Packers range. – Contract wins for bundled offering of centrifugal pump offering from across the Group.
Increase supply chain flexibility and improve working capital ratios through working Value Chain Excellence Initiatives:
– Introduced maturity model and developed business unit improvement plans using Value Chain Excellence methodologies.
– Excess pressure pumping inventories reduced by £53m. – API certification awarded to Mathena.
Key priorities and progress in 2014
Strategic Goals
Innovation
Collaboration
Value Chain Excellence
Global Capability
Market driversGlobal oil and gas markets continued to grow strongly for the majority of the year with average US rig count, an indicator of activity in our Pressure Pumping and Pressure Control operations, increasing by 6% in 2014. A prolonged period of stability in global oil prices ended in the fourth quarter, as oil prices began to fall dramatically with a subsequent pull back in activity levels beginning at the very end of 2014.
For the majority of the year, increased investment supported strong growth in North American oil production with a 5% rise in the number of wells drilled in the US. Production was supported by increased intensity in operations which resulted in the number of horizontal wells rising 11% and the number of frack stages rising by 22%. Alongside increasing intensity of completion techniques, this contributed to strong growth in aftermarket demand.

38 The Weir Group PLC Annual Report and Financial Statements 2014
2014 £225m
2013 £171m
2012 £202m
2014 £992m
2013 £754m
2012 £810m
Operational Review continued
Market drivers (continued)North American activity continued to be dominated by oil and liquids which accounted for 82% of North American drilling and completion. Gas activity was subdued as natural gas prices remained below incentive levels, despite briefly increasing early in the year as a result of a harsh winter in the US.
In pressure pumping markets, demand for original equipment increased from 2013 levels as frack fleet utilisation reached 87% in North America, reflecting greater demand and increased intensity of operations. Internationally, Chinese frack fleet growth was subdued but Australia grew strongly, albeit from a low base.
Average rig count in the Middle East continued to grow, increasing by 9% with continued positive trends in Iraq and Saudi Arabia in particular. Mid and downstream markets were impacted by project delays in the second half of the year.
Strategic progress The division’s market-leadership position in pressure pumping and developing a Tier 1 offering in pressure control ensured it was able to gain market share as upstream North American markets grew strongly. This was supported by the division’s extensive service centre network which captured increased aftermarket demand for spare parts, services and the cross selling of the expanded product range. All business units delivered strong organic order growth with international expansion positioning the Group to benefit from development in markets such as China, Argentina, Brazil, Australia and Indonesia.
Pressure Pumping further enhanced its lean manufacturing and supply chain platform, giving it the operational flexibility to increase production rapidly as its markets expanded. In flow control and fluid ends for instance, this helped the business increase market share by 4% and 5% respectively over the last two years. There was strong organic growth over the course of the year, with fluid end sales nearly doubling and over 40% of orders coming from the business’ new premium range. Development of a next generation frack pump, incorporating patented design features, is progressing well with field trials scheduled for the first quarter of 2015. The division is also partnering with MTU America – part of Rolls-Royce Holdings PLC – to design the industry’s first purpose built integrated power system for hydraulic fracturing.
Pressure Control increased its market share by launching new products such as its range of zipper manifolds, a new hydraulic choke and a well-overshot solution for subsea applications. The business cross-sold its full portfolio to existing customers and leveraged the division’s market-leading
service network to attract new customers to its core product range.
Internationally, a new Middle East headquarters was completed in Dubai alongside increasing service centre capability in Azerbaijan and Iraq. The new Dubai facility will meet regional demand for locally manufactured wellhead and valve manufacturing, supporting the internationalisation of Pressure Control, while also expanding service centre capacity to capture fast-growing regional opportunities. This included a ramp-up of activity to support the LUKOIL maintenance contract in southern Iraq, which is utilising the division’s Basra service capability – the first in the region to secure API and ISO licenses.
As part of the Group-wide efficiency review, the division announced the consolidation of a Pressure Control manufacturing unit in California into a larger Houston facility, with a consequent reduction in workforce of approximately 100. This and other measures are expected to deliver annualised savings of £10m. In addition, and in response to the steep reduction in oil prices which began in the fourth quarter of 2014, the Group has taken further actions to reduce costs. This includes an additional planned reduction in the division’s workforce of approximately 550 by March 2015, the insourcing of sub-contracted manufacturing and further reducing operational costs.
Order input at £1,032m (2013: £768m) was 34% higher with good growth from each business in the division. Aftermarket input was up 30% year on year, driven by strong growth in Pressure Pumping and accounted for 70% (2013: 73%) of divisional orders. Original equipment input was 47% higher, primarily driven by demand for new Pressure Pumping equipment.
Pressure Pumping input increased by 50%, with strong trading until almost the year end, when there was a reduction in demand in North America as customers started to revise spending plans in response to the steep fall in oil prices. This growth was driven by a strong aftermarket performance as the division’s comprehensive product and service offering allowed it to gain market share. Fluid end input was up nearly 90% on 2013, supported by differentiated new products. Flow control orders exceeded their previous record in 2011 and accounted for nearly 30% of Pressure Pumping input. Original equipment orders more than doubled from a low base in 2013, with some initial signs in the second quarter of a frack pump replacement cycle starting, but this did not materialise in the second half, as the oil price declined. Pressure Control also benefitted from strong North American demand and increased its share of rigs, supported by the expansion of its product and service offering including launching a range of zipper manifolds, a new hydraulic choke and a well-overshot system
Operating profit*
£225m+32%
Revenue*
£992m+32%
for subsea applications. Input increased by 20% over the year, although order rates softened at the end of 2014, reflecting changing market conditions.
Services enjoyed strong double-digit input growth, supported by higher operations and maintenance (O&M) activity as a result of the LUKOIL contract in Iraq, which was secured at the start of 2014. Downstream orders also increased as Gabbioneta secured a number of large LNG and refinery contracts across the Middle East and Asia.
Revenue increased by 32% to £992m on a constant currency basis (2013: £754m), reflecting the strong order input trends across the business. Original equipment and aftermarket revenues both increased by 32% with aftermarket accounting for 72% of output (2013: 72%). Revenues increased sequentially each quarter with record second half divisional sales.
Pressure Pumping delivered strong revenue growth broadly mirroring input trends and only slightly down on the previous 2011 peak. Pressure Control revenues also increased in line with order trends, supported by positive North American activity levels for the majority of the year. Both operations saw a slightly softer than expected finish to the year as the result of oil price declines. Services grew strongly although Gabbioneta was down year on year as a result of a lower opening order book and customers delaying project delivery dates. Reported divisional revenues increased by 25% after a 5% foreign exchange headwind (2013: £796m).
* 2012 and 2013 restated at 2014 average exchange rates.

Strategic Report Financial StatementsCorporate Governance
39The Weir Group PLC Annual Report and Financial Statements 2014
Oil and gas 99%Industrial 1%
Market input breakdown
North America 75%Middle East/Africa 13%
Asia-Pacific 5%
South America 1%
Europe 5%
Australasia 1%
Geographic input breakdown
Key priorities in 2015
Respond with agility to changing market dynamics and improve overall business performance through delivery of Value Chain Excellence improvement plans.
Continue to globalise leadership position in Pressure Pumping and progress towards a Tier 1 offering in Pressure Control.
Enhance product offerings in Pressure Control and Pressure Pumping.
Expand capabilities of Weir Oil & Gas Services in the UAE, Iraq and Saudi Arabia, including the benefits of its new regional manufacturing hub in Dubai.
Leverage Weir’s total centrifugal pump capabilities to increase share in the global oil and gas processing markets.
Operating profit including joint ventures was 32% higher on a constant currency basis at £225m (2013: £171m), primarily driven by strong Pressure Pumping profit growth. Reported operating profit increased by 25% after a 5% foreign exchange headwind (2013: £181m).
Operating margin was unchanged at 22.7% (2013: 22.7%) reflecting positive operating leverage in Pressure Pumping offset by increased bonus costs and lower margins in Pressure Control. Margins were slightly below prior expectations as a result of softer than anticipated trading at the end of the year in higher margin Pressure Pumping and Pressure Control operations.
InvestmentCapital expenditure of £50m (2013: £38m) included additional facilities for Services in Iraq and Dubai, additional Pressure Control rental assets, a new R&D facility in Fort Worth, US and the commencement of construction of a new facility in Milan, Italy for Gabbioneta. Total research and development expenditure of £8m was focused on developing new frack pump design and related sensor and control technologies (2013: £5m).
OutlookOil prices are expected to remain substantially below their average of the last three years as a result of oversupply. As such, the market is expected to take longer to reach a balance than during the demand driven downturns in 2008-9 and 2012-13. However, global demand continues to grow and unconventional oil is well positioned to react quickly when market conditions improve.
Many Exploration and Production (E&P) and service companies have already announced plans to significantly reduce their capital spending in response to lower oil prices – a trend reflected in the fall in US onshore rigs in the first two months of 2015. Visibility in these upstream markets is limited as customers continue to adjust their operations to the evolving pricing environment, although a significant fall in activity levels is anticipated with resulting pricing pressure. Conditions are also expected to be more challenging in international and mid and downstream markets, although the impacts will be less pronounced.
The division has already acted to reduce costs and increase efficiency and will continue to monitor the need for further actions to support operational performance. However, these measures will not fully offset market impacts with a substantial reduction in divisional revenues and lower operating margins expected in 2015.

40 The Weir Group PLC Annual Report and Financial Statements 2014
Operational Review continued
Partners in production worldwide
Supporting developing oilfields In January 2014, the Group signed a contract with LUKOIL Oil Company to provide general maintenance services for the West Qurna-2 oilfield in Southern Iraq.
The agreement, worth around US$100m (£60m), sees Weir engineers deliver mechanical, electrical, maintenance and pipeline services for the related production facilities, including the Mishrif Central Processing Plant.
Weir has significantly invested in establishing its service centre in Basra, Iraq and it is the first in-country location to offer fully comprehensive maintenance services for all kinds of rotating equipment, valves and wellheads. The facility is also the first in Iraq to obtain API and ISO licences.
West Qurna-2 is one of the largest undeveloped oilfields in the world. Mishrif began production in March 2014, at which time Weir commenced work under the terms of its contract.
By the end of the year production reached a peak of around 400,000 barrels per day.
This substantial contract demonstrates the importance of Weir’s long experience of working in Iraq and its reputation for delivering high-quality engineering services in support of the country’s developing oilfield infrastructure. It also reflects the Group’s ability to capture opportunities in high-growth markets and be a partner of choice to its worldwide customers.
In late 2014 Weir expanded its footprint in Iraq by acquiring Weatherford OCTG’s threading/machine shop and moving into a purpose-built workshop facility in North Rumaila, Basra, Iraq.
In-keeping with Weir’s safety culture, the facility includes employee accommodation on-site, reducing the need for travel in the country and enhancing security for our employees.
The new facility increases Weir’s capacity in the country by adding new machines and capabilities, enabling it to provide wellheads and ‘Christmas trees’ to oil and gas producers.

Strategic Report Financial StatementsCorporate Governance
41The Weir Group PLC Annual Report and Financial Statements 2014

42 The Weir Group PLC Annual Report and Financial Statements 2014
Operational Review continued
Weir Power & Industrial Improving operations to drive future growth
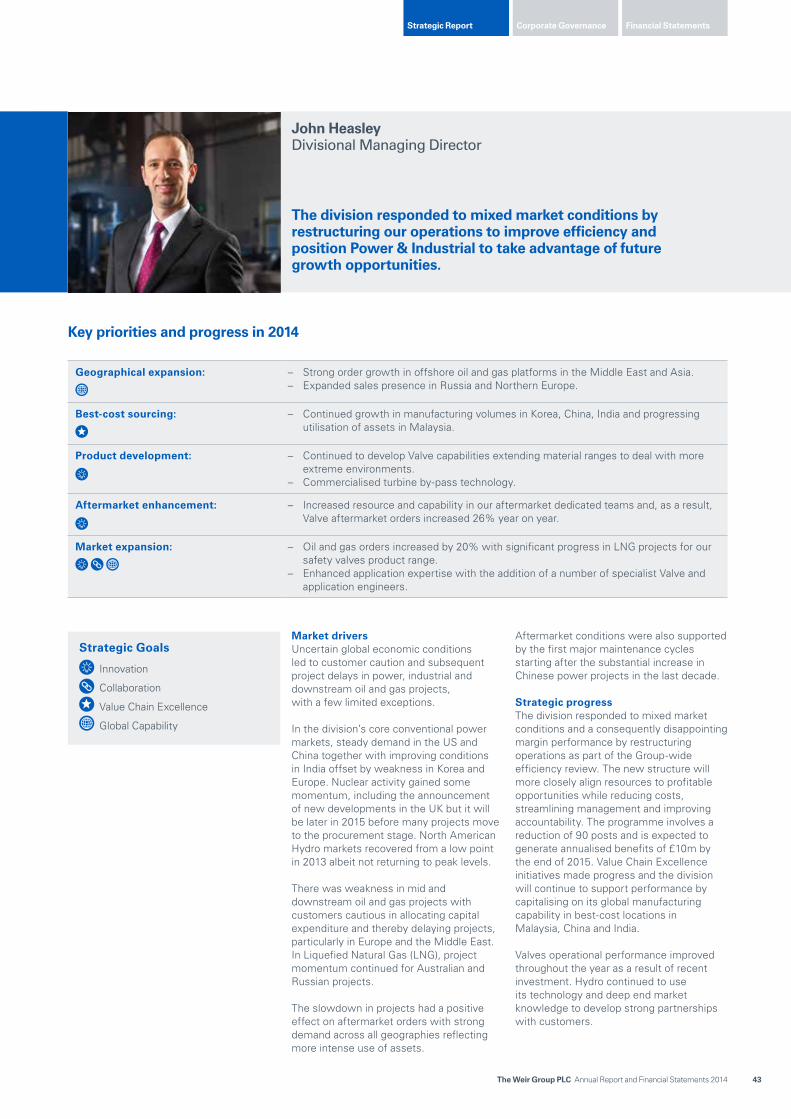
Strategic Report Financial StatementsCorporate Governance
43The Weir Group PLC Annual Report and Financial Statements 2014
The division responded to mixed market conditions by restructuring our operations to improve efficiency and position Power & Industrial to take advantage of future growth opportunities.
John HeasleyDivisional Managing Director
Geographical expansion: – Strong order growth in offshore oil and gas platforms in the Middle East and Asia. – Expanded sales presence in Russia and Northern Europe.
Best-cost sourcing: – Continued growth in manufacturing volumes in Korea, China, India and progressing utilisation of assets in Malaysia.
Product development: – Continued to develop Valve capabilities extending material ranges to deal with more extreme environments.
– Commercialised turbine by-pass technology.
Aftermarket enhancement: – Increased resource and capability in our aftermarket dedicated teams and, as a result, Valve aftermarket orders increased 26% year on year.
Market expansion:
– Oil and gas orders increased by 20% with significant progress in LNG projects for our safety valves product range.
– Enhanced application expertise with the addition of a number of specialist Valve and application engineers.
Key priorities and progress in 2014
Strategic Goals
Innovation
Collaboration
Value Chain Excellence
Global Capability
Market driversUncertain global economic conditions led to customer caution and subsequent project delays in power, industrial and downstream oil and gas projects, with a few limited exceptions.
In the division’s core conventional power markets, steady demand in the US and China together with improving conditions in India offset by weakness in Korea and Europe. Nuclear activity gained some momentum, including the announcement of new developments in the UK but it will be later in 2015 before many projects move to the procurement stage. North American Hydro markets recovered from a low point in 2013 albeit not returning to peak levels.
There was weakness in mid and downstream oil and gas projects with customers cautious in allocating capital expenditure and thereby delaying projects, particularly in Europe and the Middle East. In Liquefied Natural Gas (LNG), project momentum continued for Australian and Russian projects.
The slowdown in projects had a positive effect on aftermarket orders with strong demand across all geographies reflecting more intense use of assets.
Aftermarket conditions were also supported by the first major maintenance cycles starting after the substantial increase in Chinese power projects in the last decade.
Strategic progress The division responded to mixed market conditions and a consequently disappointing margin performance by restructuring operations as part of the Group-wide efficiency review. The new structure will more closely align resources to profitable opportunities while reducing costs, streamlining management and improving accountability. The programme involves a reduction of 90 posts and is expected to generate annualised benefits of £10m by the end of 2015. Value Chain Excellence initiatives made progress and the division will continue to support performance by capitalising on its global manufacturing capability in best-cost locations in Malaysia, China and India.
Valves operational performance improved throughout the year as a result of recent investment. Hydro continued to use its technology and deep end market knowledge to develop strong partnerships with customers.

44 The Weir Group PLC Annual Report and Financial Statements 2014
2014 £19m
2013 £30m
2012 £30m
2014 £318m
2013 £314m
2012 £310m
Power 58%Industrial 15%
Other 12%Minerals 1%
Oil and gas 14%
Market input breakdown
North America 33%Europe 31%
Middle East/Africa 8%Asia-Pacific 26%
South America 2%
Geographic input breakdown
Operational Review continued
Strategic progress (continued)There was further progress in oil and gas markets with notable success in a number of LNG projects and other severe service applications.
In South Korea, we were pleased to commission a number of turbine bypass valves in the year which represents a key strategic opportunity for our Control Valve business.
Order input decreased by 4% to £314m (2013: £326m) primarily due to a large £20m one-off Services order in 2013 which was not repeated and we withdrew from low margin projects in Libya. Excluding this, order input was up 3%. Original equipment orders were down 3%, with strong growth in Hydro more than offset by tougher end market conditions and project delays in Valves. Aftermarket input declined by 4%, with strong double-digit Valves growth offset by lower Services input. Total Valves input was slightly down year on year.
Power markets represented 58% of orders (2013: 61%) and the proportion of orders from oil and gas markets increased to 14% (2013: 12%), supported by the division’s move into adjacent sectors such as LNG and Floating Production, Storage and Offloading (FPSO). Emerging markets accounted for 35% of input (2013: 33%).
Revenue increased by 1% on a constant currency basis to £318m (2013: £314m), with aftermarket growth of 3% and original equipment revenues broadly flat on the prior year. Valves revenues were higher year on year but slightly below expectations due to customers delaying shipments and the impacts of a four-week strike from late November at its US facility. Hydro sales fell as a result of the lower opening order book. Full year divisional book-to-bill was marginally negative at 0.99 (2013: 1.04). Reported revenues fell by 3% after a 5% foreign exchange headwind (2013: £330m).
Operating profit was down 37% at £19m on a constant currency basis (2013: £30m) as a result of margin declines across Valves, Services and Hydro operations. Valve operating profits were lower as a result of £0.6m additional costs incurred following strike action at its US facility in December. Reported operating profits fell 41% after a 6% foreign exchange headwind (2013: £31m).
Operating margin was down 360bps to 5.8% (2013: 9.4%) on a constant currency basis, reflecting the disappointing operational performance and product mix within Valves and Services as higher-margin nuclear revenues were replaced by lower-margin commercial valve opportunities. Margins also declined in Hydro, reflecting negative operating leverage.
InvestmentCapital expenditures of £9m (2013: £11m) was primarily focused on expanding the capacity of the division’s Valves facility in South Korea.
Investment in research and development declined slightly to £2.4m (2013: £2.9m) with a new range of municipal pumps progressing to field trials.
OutlookPower end markets are expected to remain subdued in 2015, with expenditure in Europe impacted by low projected economic growth rates and the majority of project activity continuing to be located in emerging markets. Mid and downstream oil and gas markets will be impacted by the recent fall in oil prices, with existing and new projects subject to delays.
Supported by the opening order book and good aftermarket opportunities, the division is targeting constant currency revenue growth and is expected to benefit from measures taken at the end of 2014 to improve the profitability of the business.
Operating profit*
£19m-37%
Revenue*
£318m+1%
* 2012 and 2013 restated at 2014 average exchange rates.

Strategic Report Financial StatementsCorporate Governance
45The Weir Group PLC Annual Report and Financial Statements 2014
Partners in production worldwide Key priorities in 2015
Complete and deliver the benefits of the division’s restructuring programme.
Expand low-cost sourcing and leverage VCE to deliver further operational efficiency benefits.
Continue to grow Valve aftermarket revenues.
Expand application and product range through new product development.
Expand geographical reach.
Serving South Korea’s growing need for electricity South Korea’s electricity suppliers have historically relied on nuclear and coal power generation to meet consumption needs of a growing population.
Liquefied natural gas (LNG) combined cycle generation is an attractive and fast-growing application in the region due to its high-efficiency and cleaner performance.
In 2014, the Power & Industrial division delivered turbine bypass valves to two new combined cycle LNG power plants located in South Korea. The project represented the successful execution of the division’s strategy to serve global power generation customers with newly developed engineering solutions.
The new valves allow safer, more flexible operation of combined cycle turbines. During power plant commissioning, the product allows the boiler to be tested without running the turbine, saving significant fuel costs and time in the process. Weir International South Korea delivered the valves to the 950 megawatt Shin-Ulsan power plant in February and then the same set of valves to the Shin-Pyeongtaek power plant in March. The project marked a breakthrough in
the country’s domestic power market as they were the first valves of their type manufactured locally for use in the South Korean domestic market.
The technical expertise and product innovation involved in turbine bypass valves is market leading. The valves use high alloy steels to cope with operating temperatures up to 605 degrees Celsius and have a forged- body design incorporating a number of key features which enable safe and reliable operation at high temperatures and extreme pressures.
Since delivering the project Weir has continued to develop the product further and is now engaging with Korean engineering, procurement and construction companies involved in the global power market including North American and European customers.

46 The Weir Group PLC Annual Report and Financial Statements 2014
Financial Review
Good underlying performance in fast changing markets
Operating profit (before exceptional items and intangibles amortisation) on a reported basis was down 4% on the previous year and was after an adverse foreign exchange impact of £37m.
Order input at £2,473m increased 9% on a constant currency basis. Original equipment orders were flat with the impact of lower mining capex in Minerals offset by a recovery in upstream Oil & Gas. Aftermarket orders were up 14% supported by strong growth in Oil & Gas and continued progress in Minerals. Aftermarket orders represented 67% of overall input (2013: 64%). Minerals order input was £1,127m, slightly down on 2013 with the decline in original equipment orders outweighing the growth in aftermarket. Input in Oil & Gas of £1,032m was 34% up on 2013 driven by a strong performance in both Pressure Pumping and Pressure Control. Input in Power & Industrial was down 4% to £314m due to a weakening project environment in the second half of the year and with 2013 including a £20m, one-off order.
Revenue of £2,438m was 9% up on a constant currency basis. Aftermarket accounted for 66% of revenues, a three percentage point increase over the prior year. Minerals revenues were down 4% at £1,128m (2013: £1,178m) on a constant currency basis, impacted by the industrial action in South Africa and challenging original equipment markets. Oil & Gas revenues increased by 32% to £992m
as a result of strong growth in both original equipment and the aftermarket. Power & Industrial revenues increased by 1% to £318m in 2014. The 2014 acquisitions of Trio and Metra contributed £12m in revenue. On a reported basis revenue was flat following a £185m (8%) foreign exchange headwind.
Operating profit from continuing operations (before exceptional items and intangibles amortisation) decreased by 4% to £450m on a reported basis. The movement in the average exchange rates year on year resulted in a significant adverse translational impact of £37m; the main driver being the US Dollar which moved from an average of $1.56:£1 in 2013 to $1.65:£1 in 2014. On a constant currency basis, operating profit increased by £20m (5%), with strong growth in Oil & Gas partly offset by decreases in Minerals and Power & Industrial. One-off costs incurred in the period, excluding exceptional items, were £2m (2013: £8m) and related solely to acquisition and integration costs, compared to the equivalent charge of £3m in 2013. Acquisitions contributed operating profit of £2m, before integration costs. Unallocated costs were £20m (2013: £14m), reflecting increased investment in our strategic initiatives of Value Chain Excellence and Innovation.
Operating margin from continuing operations (before exceptional items and intangibles amortisation) was 18.4%, a decrease of 80 basis points on the prior
year (2013: 19.2%; 19.1% on a constant currency basis). Minerals reported an operating margin, on a constant currency basis, of 20.1% (2013: 20.6%) for the full year reflecting a higher mix of lower margin products and investment in our comminution platform. The Oil & Gas full year operating margin was in line with the prior year at 22.7% (2013: 22.7% constant currency) with strong flow-through on revenue in Pressure Pumping offset by lower margins in Pressure Control and the impact of higher bonus costs compared to the prior year. The operating margin in Power & Industrial was 5.8% (2013: 9.4% constant currency) and declined as a result of operational issues and the impact of the different product mix within Valves compared to 2013.
Earnings before Interest, Tax, Depreciation and Amortisation (‘EBITDA’)Depreciation of property, plant and equipment in the period was £61m (2013: £59m) resulting in EBITDA of £511m (2013: £526m).
Exceptional items and intangibles amortisationAn exceptional charge of £212m (2013: gain of £71m) and intangibles amortisation of £45m (2013: £47m) resulted in total Group operating profit for the year of £193m (2013: £490m). The primary components of the exceptional items in the current year were the charge relating to the Group-wide efficiency review announced in November of £49m and the impairment of intangible assets within the Pressure Control Cash Generating Unit (CGU) of £160m.
The Group performed well in 2014 in what were fast changing markets. On a constant currency basis, operating profit (before exceptional items and intangibles amortisation) of £450m represented an increase of 5% year on year which clearly demonstrates the strength of our operating model and the continued benefits of the diverse end markets and geographies in which we operate.
Jon StantonFinance Director

Strategic Report Financial StatementsCorporate Governance
47The Weir Group PLC Annual Report and Financial Statements 2014
The purpose of the efficiency review was to identify opportunities to reduce costs, increase customer responsiveness and efficiency while aligning resources globally to capture end market opportunities. The total charge comprised an anticipated cash cost of £30m, of which £8m was reflected in the current year cash flow statement, and an impairment of tangible assets of £19m.
The main components of the Group-wide efficiency review within the Minerals division were (i) rationalisation of the North American businesses; (ii) closure and downsizing of certain sites in Europe; and (iii) reductions in headcount in response to market conditions in a number of other operations including Africa, Europe and South America. In the Oil & Gas division the actions were primarily in the Pressure Control business in anticipation of changing market conditions. Within Power & Industrial, the review will result in a new operating structure to bring clearer accountability for satisfying customers’ needs and improved profitability through reductions in headcount and the exit from low margin contracts, product lines and activities. As a result of the continued decrease in the oil price subsequent to the year end, further actions have been identified and are expected to lead to additional exceptional costs of circa £20m in 2015.
The very significant decline in the oil price towards the end of 2014 and at the start of 2015, and the resultant impact on the North American rig count and related activity levels, has had a substantial impact on the short to medium term forecasts of our upstream oil and gas business. The Group has already reacted to market conditions through implementation of actions under the Group-wide efficiency review and is well placed to manage the current downturn.
The cash flow forecasts underpinning the impairment testing reflect the current oil price and depressed activity levels enduring for the next two years, with pressure on both volumes and pricing, and a measured return to more ‘normal’ levels thereafter. With regard to impairment testing of the Pressure Pumping CGU, this business is more mature than Pressure Control and had significant levels of headroom between net asset value and value in use prior to the current market downturn. On this basis and even under the stress testing undertaken,
no impairment has been assessed in respect of the carrying value of assets in this CGU. The impact on the Pressure Control CGU is such that an impairment charge of £160m has been recognised at the end of the year, allocated entirely against goodwill. Of the total impairment charge, £60m relates to goodwill remaining on the balance sheet post release of the contingent consideration liability in 2013 and is essentially consideration that will ultimately not be paid. Further detail is presented in note 14. No impairment has been identified in relation to any of the other CGUs.
The other exceptional costs in the period (note 5) relate to: (i) costs associated with the proposed acquisition of Metso Corporation of £2m; and (ii) an uplift of £1m in the net present value of contingent consideration payable in respect of the Weir International acquisition. The exceptional gain in the prior year related to the release of the contingent consideration liability for Weir Mathena of £68m and the curtailment gain of £3m recorded following the decision to close our main UK pension scheme to future accrual with effect from 30 June 2015.
Amortisation decreased to £45m from £47m in the prior year as a result of favourable foreign exchange movements, partly offset by the impact of the Trio acquisition.
Net finance costsTotal net finance costs, including exceptional items, were £43m (2013: £59m). There were four components of this net charge, the most significant being the interest cost of £44m (2013: £48m) on the Group’s borrowings (including amounts in relation to derivative financial instruments). The other elements were finance income of £6m (2013: £3m), a charge of £3m (2013: £4m) in relation to the Group’s defined benefit pension plans and an exceptional cost of £2m (2013: £11m) being the unwind of the discount on contingent consideration liabilities.
The unwind of the discount on the contingent consideration liability is lower than the prior year due to the non-recurring impact of Mathena in 2013. The total contingent consideration liability recorded on the balance sheet in respect of all acquisitions is £35m (2013: £28m).
Net finance costs (excluding retirement benefit related amounts and exceptional items) were covered 11.7 times by operating profit from continuing operations, before exceptional items and intangibles amortisation (2013: 10.4 times).
Profit before tax from continuing operations (before exceptional items and intangibles amortisation) decreased by 2% to £409m (2013: £418m). Taking foreign exchange into consideration, the 2013 result on a constant currency basis would have been £35m lower with 2014 representing growth of 7% year on year. Reported profit before tax from continuing operations decreased by 65% to £149m (2013: £431m).
The tax charge for the year of £106m (2013: £108m) on profit before tax from continuing operations (before exceptional items and intangibles amortisation) of £409m (2013: £418m) represents an underlying effective tax rate of 25.8% (2013: 25.7%). The Group’s policy with regard to tax matters is discussed later in this report.
Discontinued operationsThe Group has recognised income from discontinued operations of £1m (2013: £nil) representing the release of unutilised provisions in relation to previous disposals on expiration of the tax warranty periods.
Earnings per shareEarnings per share from continuing operations (before exceptional items and intangibles amortisation) decreased by 3% to 141.3p (2013: 145.4p). Reported earnings per share including exceptional items, intangibles amortisation and profit from discontinued operations was 33.8p (2013: 157.2p). The weighted average number of shares in issue increased slightly to 213.3m (2013: 213.0m).
Cash flowsCash generated from operations before working capital movements was down £12m at £503m (2013: £515m). Cash generated from operations decreased by 11% from £474m to £421m representing an EBITDA to cash conversion ratio of 82% (2013: 90%). Working capital cash outflows of £82m (2013: £41m) reflect an outflow in the first half of £79m but only £3m in the second half.

48 The Weir Group PLC Annual Report and Financial Statements 2014
20
15
10
5
2012 2013 2014
19.1 19.218.4
500
400
300
200
100
2012 2013 2014
440418 409
Financial Review continued
Cash flows (continued)Outflows in relation to both inventory and receivables were driven by the strong growth seen in Oil & Gas year on year. Exceptional items in the period resulted in cash outflows of £11m in relation to the Group-wide efficiency review and the Metso proposed acquisition (2013: £nil).
Net capital expenditure increased slightly from £97m in 2013 to £101m in 2014, reflecting strategic investments in production capacity in Malaysia and Information Systems across the Group, as well as building new facilities for our Middle East services business and a new R&D facility in SPM. The settlement of financing derivatives resulted in a net cash outflow of £3m (2013: £5m) and additional pension contributions of £11m (2013: £12m) were paid in the year in respect of agreed deficit recovery contributions.
Free cash flow from continuing operations, before cash exceptional items and after dividends of £103m (2013: £83m), was £79m (2013: £168m). Outflows in respect of the acquisition of subsidiaries of £138m resulted in a closing net debt of £861m (2013: £747m, £791m constant currency). On a reported basis, the ratio of net debt to EBITDA was 1.7 times and on a debt covenant basis was 1.6 times.
Return on Capital Employed (ROCE)The Group’s ROCE of 18.1% for 2014 (on a constant currency and like for like basis, excluding Trio) was slightly higher than the prior year (2013: 17.5%).
DividendsThe Board is recommending a 5% increase in the full year dividend, with a final dividend of 29.0p (2013: 33.2p). This reflects a rephasing of the dividend such that the final payment will represent approximately two-thirds of the full dividend for 2014, making a total of 44.0p for the year (2013: 42.0p). Dividend cover (being the ratio of earnings per share from continuing operations before exceptional items and intangibles amortisation to dividend per share) is 3.2 times. If approved at the Annual General Meeting, the final dividend will be paid on 29 May 2015 to shareholders on the register on 1 May 2015.
Acquisitions and disposalsOn 22 October 2014, the Group completed the acquisition of Trio Engineered Products (‘Weir Trio’) for a total consideration of US$236m (£146m) inclusive of net cash balances and a contingent consideration of US$13m (£8m). Details of the contingent consideration and related accounting are presented in note 13. During the year the Group also acquired 100% of the voting shares of Metra Equipment Inc, (‘Weir Metra’) for a cash consideration of CAD$6m (£3m).
Tax policyThe Group’s strategic tax objectives are to: – comply with all applicable tax laws
and regulations, including the timely submission of all tax returns and tax payments; and
– develop and maintain strong working relationships with local tax authorities and undertake all dealings with them in a professional and timely manner.
The Group has strong controls and clear policies and procedures covering tax, which must be followed by all finance personnel. We take a conservative approach to all tax planning with the overarching aim of paying the right amount of tax at the right time in each tax jurisdiction in which we operate. As a large multi-national, we conduct our business affairs in a way which is efficient from a tax perspective, for example by looking to take into account available global tax incentives and allowances, but we do not undertake tax planning for its own sake.
In terms of cash tax, the Group paid income tax of £94m in 2014 across all of its jurisdictions compared to £72m in 2013. Net cash tax paid in the UK in 2014 across corporation tax, VAT and payroll taxes was approximately £41m (2013: £45m).
Treasury managementThe Group is financed through a combination of bank debt, fixed rate private placement notes and equity. The capital structure is managed centrally with the objectives of optimising capital efficiency, diversifying the investor base, achieving an orderly maturity of funding yet maintaining a good degree of financial headroom.
The principal financial risks faced by the Group are those relating to liquidity, foreign currency and credit risk. The Group’s treasury policies and procedures, which are reviewed and updated on a regular basis, seek to reduce these financial risks. Within this framework, the Group uses financial assets and liabilities including derivatives to hedge certain foreign exchange and interest rate risks.
Funding and liquidityThe Group’s objective is to maintain a balance between continuity of funding and flexibility through the use of bank overdrafts, bank loans and long term fixed rate notes. During the year, the Group obtained public credit ratings from Moody’s (Baa1) and Standard & Poor’s (BBB+) to expand the range of financing options available. The Group held net cash balances of £167m at the end of 2014 (2013: £69m) representing operating balances held by the Group’s subsidiaries.
In September 2014, the Group amended the US$800m multi-currency revolving credit facility, which was previously refinanced in July 2013 and due to mature in July 2018. The amendment extended the maturity date to July 2019, with the option of two one-year extensions. At 2 January 2015, US$210m was drawn under the revolving credit facility. Total unamortised issue costs at 2 January 2015 were £5m (2013: £5m).
On 12 January 2015, the Group repaid US$90m fixed rate notes and £12m fixed rate notes as these fell due. These were refinanced using existing facilities including the US$800m multi-currency revolving credit facility and various uncommitted Sterling borrowing facilities in place.
All covenants were met at 2 January 2015 with significant headroom under each financial ratio.
The Group has additional committed and uncommitted bonding facilities under which guarantees are issued in order to support commercial activities.
Profit before tax1, 2 (£m)Operating margins1 (%)
1. Continuing operations excluding exceptional items and intangibles amortisation.
2. 2012 restated to reflect the impact of IAS 19R on pension costs.

Strategic Report Financial StatementsCorporate Governance
49The Weir Group PLC Annual Report and Financial Statements 2014
Credit managementThe Group’s credit risk is primarily attributable to its trade receivables with risk spread over a large number of countries and customers. There is no significant concentration of credit risk. Credit worthiness checks are undertaken before entering into contracts with new customers and credit limits are set as appropriate. We also use trade finance instruments such as letters of credit and insurance to mitigate any identified risk. The Group’s exposure to the credit risk of financial institutions is limited by the adherence to counterparty limits and by only trading with counterparties that have a strong credit standing based on ratings provided by the major credit rating agencies.
Interest rate risk managementThe Group’s debt is in a combination of fixed and variable rates of interest. It is our policy to maintain a proportion of debt at fixed rates of interest subject to the future outlook for the level of interest rates. As at the end of 2014, the proportion of the Group’s debt at fixed rates was 78% compared to 92% as at the end of 2013 due to additional borrowing on the revolving credit facility and uncommitted facilities during the year.
Foreign exchangeThe Group is exposed to movements in exchange rates for transactions undertaken in non-functional currencies of the operating companies concerned and the translation of foreign currency denominated net assets and profit and loss items.
All material transactional currency exposures are hedged, usually by means of forward contracts thereby ensuring certainty over revenue and costs. Subject to local exchange controls, foreign exchange transactions are executed by the central treasury function. No speculative transactions are undertaken. Although hedging is carried out for all material economic exposures, only five subsidiaries applied cash flow hedge accounting under IAS 39 during the period.
In respect of translational risk, the Group has a policy to partially hedge United States Dollar (US$), Australian Dollar (AUD) and South African Rand (ZAR) net asset exposures. This is achieved through designating an element of foreign currency borrowings, forward foreign currency contracts and cross currency swaps as net investment hedges against the Group’s investments. The Group does not hedge the foreign currency translational exposure arising from profit and loss items.
The strengthening of Sterling relative to 2013 against most main currencies resulted in a net gain on translation of net assets of £45m, including the effect of the balance sheet hedging programme. The fair value of derivatives designated as net investment hedges at 2 January 2015 was a liability of £3m (2013: net £nil).
Further information on financial risk management objectives and policies can be found in note 30 to the Group financial statements.
Retirement benefitsThe Group has four defined benefit pension plans, the largest of these being the two UK plans. The Group has sought to pro-actively manage its exposure to its pension plans and more than half of the liabilities of the main plan are hedged using insurance policies, providing significant protection against changes in market conditions. During the period to 3 January 2014, agreement was reached with the Trustees of the main plan to close the plan to future accrual of benefits with effect from 30 June 2015 and accordingly a curtailment gain of £3m was recorded in 2013 as an exceptional item in the Income Statement. With regard to the key assumptions underpinning the IAS 19 (Revised) valuation, the discount rate applied to the pension liabilities has decreased from 4.4% to 3.5% with RPI inflation also decreasing from 3.4% to 3.0% since 2013.
These changes have led to increases in the liabilities which are only partially offset by the returns on net assets and contributions in excess of benefit accrual. Combined these have led to an increase in the net deficit in the Group’s retirement benefit obligations from £70m to £94m over the year.
Net assetsNet assets at the end of 2014 were £1,482m, a decrease of £5m on the prior year (2013: £1,487m). This decrease is driven by the total net comprehensive income for the year of £93m less dividends paid of £103m.
LitigationThe Company and certain subsidiaries are, from time to time, parties to legal proceedings and claims which arise in the normal course of business. To the extent not already provided for, the Directors do not anticipate that the outcome of these proceedings or claims, either individually or in aggregate, will have a material adverse effect on the Group’s financial position. All actions are robustly defended.
i) Asbestos-related claimsCertain of the Group’s US-based subsidiaries are co-defendants in lawsuits pending in the United States in which plaintiffs are claiming damages arising from alleged exposure to products previously manufactured which contained asbestos. The Group has comprehensive insurance cover for these cases and since the inception of the litigations in 2002 all claims have been directly managed by the Group’s insurers who have, in the intervening period, made settlements totalling approximately £10m as well as meeting all associated defence costs. The insurers and their legal advisers agree and execute the defence strategy between them and there are no related cash flows to or from the Group. We expect this to continue for the foreseeable future as long as the litigation arises.

50 The Weir Group PLC Annual Report and Financial Statements 2014
200
150
100
50
2012 2013 2014
62
168
79
25
20
15
10
5
2012 2013 2014
22.3
17.5 18.1
Financial Review continued
Litigation (continued)i) Asbestos-related claims (continued)At the end of 2014, there were 1,503 asbestos-related claims outstanding in the US (2013: 1,129). In light of the recent significant increase in claims, a review was completed to assess the adequacy of the Group’s insurance policies to meet future settlement and defence costs. As a result of this review we have estimated settlement and defence costs for existing and projected claims which may be received in the next five years and recorded a provision of £28m within ‘employee related provisions’ (note 22) with an equivalent receivable for insurance proceeds recognised in ‘other receivables’.
This provision represents the Directors best estimate of the future liability at this time although given the lack of consistent claims and settlement history, these estimates and the period over which they are assessed will continue to be refined.
Due to the inherent uncertainty associated with estimating future costs in respect of asbestos-related diseases, there can be no guarantee that the assumptions used to estimate the provision will result in an accurate prediction of the actual costs that may be incurred. However, we do not expect there to be a net financial exposure to the Group given the comprehensive insurance cover in place.
In the UK, there are 26 (2013: 26) outstanding asbestos-related claims which are not the subject of insurance cover. The expected settlement costs of these and anticipated future claims in the UK are fully provided for within ‘employee related provisions’ in note 22.
ii) Contingent liabilitiesA claim has been made by Philippines Gold Processing & Refining Corporation against Weir Services Australia Pty Limited (WSA), a subsidiary of the Company, in arbitration proceedings in respect of two contracts relating to the refurbishment and installation of a mill undertaken by WSA in 2007-2008 and 2008-2009, respectively. The amount claimed, which totals approximately £58m plus interest, seeks damages for the cost of repair and subsequent replacement of the mill together with business interruption loss at the processing plant. The original value of the contracts was around £1m. WSA is contesting the claim on multiple grounds. The claim is being vigorously defended although the outcome remains uncertain. The arbitration process is expected to conclude by the end of 2015. A contingent liability has been disclosed in note 27.
The Directors are of the view that the outcome of legal proceedings in 2014 in relation to the UN Oil for Food programme is such that a contingent liability no longer exists in relation to this matter.
Critical accounting policiesThe financial statements have been prepared in accordance with IFRS and the material accounting policies are set out on pages 123 to 129 of this report. There have been no significant changes to the accounting policies adopted in 2014.
In the process of applying the Group’s accounting policies, management has applied certain judgements, assumptions and estimates. These estimates and assumptions are based on historical experience, information available at the time and other factors considered relevant.
Those with the most significant effect on the amounts recognised in the financial statements are set out below. Further judgements, assumptions and estimates are set out on page 123.
Acquisition accountingOn the acquisition of a business management assess: (i) the Purchase Price Allocation (PPA) in order to attribute fair values to separately identifiable intangible assets providing they meet the recognition criteria; (ii) the fair values of other assets and liabilities; and (iii) compliance with the disclosure requirements of IFRS 3, ‘Business Combinations’.
The fair values of these intangible assets are dependent on estimates of attributable future revenues, margins and cash flows, as well as appropriate discount rates. In addition, the allocation of useful lives to acquired intangible assets requires the application of judgement based on available information and management expectations at the time of recognition. The valuation of other tangible assets and liabilities involves aligning accounting policies with those of the Group, reflecting appropriate external market valuations for property, plant & equipment, assessing recoverability of receivables and inventory and exposures to unrecorded liabilities. In deriving appropriate fair values the process will inevitably involve the use of estimates and the application of management judgement. The disclosure in relation to the acquisition of Trio in the current year is provided in note 13.
Return on Capital Employed1 (%)Free Cash Flow (£m)
1. Continuing operations EBIT (excluding Trio EBIT and exceptional items) divided by average net assets excluding net debt, pension deficit (net of deferred tax asset) and Trio net assets. 2012: As 2013/14 but also excluding Mathena and Wales.

Strategic Report Financial StatementsCorporate Governance
51The Weir Group PLC Annual Report and Financial Statements 2014
ImpairmentIFRS requires companies to carry out impairment testing on any assets that show indications of impairment as well as annually for goodwill and other intangible assets with indefinite lives and so not subject to amortisation. This testing includes exercising management judgement about future cash flows and other events which are, by their nature, uncertain. During 2014, we completed impairment testing over the Group’s cash generating units (CGUs) and the details of this exercise are disclosed above and reported in note 14.
Retirement benefitsThe assumptions underlying the valuation of retirement benefits assets and liabilities are important and based on actuarial advice. Changes in these assumptions could have a material impact on the measurement of the Group’s retirement benefit obligations. Sensitivities to changes in key assumptions are provided in note 24.
ProvisionsProvisions are recognised where the Group has an obligation, as a result of a past event, that can be measured reliably and where an outflow of economic benefit is considered probable. Management judgement is used to determine the amount of such provisions, taking into account the commercial drivers which gave rise to them, the Group’s previous experience of similar obligations and the progress of any associated legal proceedings. Provisions for inventory and trade receivables are assessed along with those provisions set out in note 22. With regard to inventory provisioning, historical usage, as well as anticipated future demand is considered (note 16). Where changes to these factors occur during the period this may impact on the assumption integral to management’s assessment of the provision and the overall valuation. Any changes are recognised in the income statement in the period.
TaxationUncertainties exist with respect to the interpretation of complex tax regulations and the amount and timing of future taxable income. Given the wide range of international business relationships and the long term nature and complexity of existing contractual arrangements, differences arising between the actual results and the assumptions made or future changes to such assumptions could result in future adjustments to tax income and expense already recorded. Provisions are established based on reasonable estimates for possible consequences of audits by the tax authorities of the respective countries in which the Group operates. Management judgement is used to determine the amount of such provisions taking into account that differences of interpretation may arise on a wide variety of issues depending on the conditions prevailing in the respective Group company’s domicile. Detailed tax disclosures are provided in notes 7 and 23.
Jon StantonFinance Director25 February 2015

52 The Weir Group PLC Annual Report and Financial Statements 2014
Sustainability Review
Sustainability: Essential for business success

Strategic Report Financial StatementsCorporate Governance
53The Weir Group PLC Annual Report and Financial Statements 2014
Engaging with stakeholders
Employees Investors Communities Suppliers and customers
Government and regulators
- Code of Conduct - Global intranet - Formalised staff
meetings (‘Town Halls’)
- Net Promoter® surveys
- Personal Development Plans
- Training programmes
- Weir University (e-learning facility)
- Social media
- Calls and face-to- face meetings
- AGM - Reports and
announcements - Website - Roadshows - Capital
Markets Day - Investor Relations
app for mobile devices
- Social media
- Fundraising events - Sponsorship - Partnerships
with educational institutes
- Trainee and mentorship programmes
- Volunteering - Armed Forces
Covenant - Social media
- Face-to-face meetings
- Weir customer experience programme
- Global supplier scorecard for strategic suppliers
- Code of Conduct - ISO 14001
certification - Trade shows and
industry events - Social media
- Consultation responses
- Commissioning of reports
- Face-to-face meetings
- Visits to sites - Briefing papers - Industry events
The Group seeks to balance the broad societal benefits of our growing business with potential environmental and social impacts arising from our operations. Our business strategy is created with a fundamental premise that acting responsibly and sustainably is unconditional.
We believe that acting responsibly and sustainably aligns with our core ethos and creates long-term value for all key stakeholders. Our goal is to operate efficiently, minimise our environmental impact, work in an ethically and socially considerate manner and build confidence and trust with our stakeholders.
Sustainability underpins the Group’s strategic priorities outlined on pages 8 and 9 and is inherent in the Company’s purpose and values.
Launched in 2013, our fourth strategic pillar of Value Chain Excellence (VCE) recognises the vital importance of ongoing sustainability. In the VCE system, we consider not only our own operations, but in addition assess those of our customers and suppliers.
Our sustainability approach is embedded in our business through six key areas: environment, health and safety, products and technology, our people, our communities and ethics.
This Sustainability Review outlines the importance of these six areas to the business, our performance in these areas over the past year and the policies and practices applied to help monitor and manage this performance.
During 2014, we reviewed how sustainability priorities are identified and assessed at a Group level. We are in the process of completing a formal materiality assessment to confirm those issues with the greatest importance for our business.
Following the outcomes of our materiality assessment, the changes which we believe need to be made to our existing processes will be incorporated into our management systems.
The materiality assessment is being conducted in line with the Global Reporting Initiative G4 guidelines, which are generally considered to comprise global best practice for sustainability reporting.
Engagement with stakeholders during 2014
The Group has six sustainability priorities:
Environment
Health and safety
Products and technology
Our People
Our Communities
Ethics

54 The Weir Group PLC Annual Report and Financial Statements 2014
Identify
the risksQuantify the
gross risk
Mo
nito
ran
d re
port
controls are required
Identify if further
mit
igat
ing
cont
rols
Iden
tify
the
exi
stin
gm
itig
atin
g co
ntro
ls
Iden
tify
the
exi
stin
g
the net riskQuantify
Identify
and quantify
and minimiseManage
Trac
kan
d re
po
rt
Sustainability Review continued
those sustainability issues with the greatest importance for our business, and will reflect the outcomes in our existing processes and management systems.
Managing environmental riskEnvironmental, Health & Safety (EHS) Management SystemIdentifying and managing environmental risks is a key component of Weir’s internal control framework. The Weir EHS Management System sets out the 11 priorities for assessing and measuring potential environmental impacts and details required control measures. These include, for instance, the use of registers to support compliance with permit and authorisation requirements, adherence to storage, containment and management criteria to mitigate potential impact on soil and groundwater, and assessment of environmental noise for all operations. Together, these measures are designed to enable conformance with all applicable legislation.
ISO 14001: Environmental Management SystemISO 14001 is an internationally recognised standard which sets out a framework for effective environmental management systems. Certification to ISO 14001 not only provides the mechanism to adequately manage environmental considerations but also demonstrates our ongoing environmental performance in terms of legal and environmental policy requirements.
Under the Weir EHS Management System, all continuing operations are required to maintain ISO 14001 accreditation. As part of the integration process, new acquisitions are expected to implement an environmental management system and to seek external ISO 14001 accreditation.
Monitoring impacts The Group operates an EHS audit programme which assesses compliance against a set of globally applicable EHS standards. A minimum standard has been prescribed against each of the criteria within the 76 EHS standards and ensures that there is both a leading EHS indicator of performance and an assurance process for all relevant stakeholders that EHS risks are adequately controlled across our operations. The 2014 audit programme gave an average 14% increase across our subsidiaries.
Environmental incidents and finesNo significant environmental incidents were reported at sites under the operational control of the Group during the 52 weeks to 2 January 2015. A minor environmental incident was reported at a Weir Seaboard customer site in Pennsylvania on 5 January 2014. No injuries were sustained, however natural gas and production fluid were released during the disassembling of equipment. A well control contractor repaired the well, removed contaminated soil and monitored the groundwater. A formal field complaint report was completed with root cause and corrective action analysis. There was also a minor non-conformance in relation to the reporting of environmental data from one of the Group’s subsidiary companies.
We operate under an awareness not just of the potential impact our business can have on the environment, but equally the risk to our operations from extreme weather or other environmental events. One incident of adverse business impact relating to a climatic event during 2014 has been reported: tropical cyclones in Southern India caused landslides and affected transport infrastructure, impacting operations of key customers. More details on risk can be found on pages 24 to 31.
Gavin NicolDirector of Operations, Support & Development
Environment
We continue to incorporate environmental sustainability into both our strategic decision making and our daily operational activities.
The Group’s strategy for environmental management is three-fold: 1. Identify and quantify key potential
risks within the business;2. Manage and minimise potentially
adverse impacts arising from its operations; and
3. Track and report on the potentially most significant impacts.
Where we acquire or open new sites, we assess the means by which potentially material environmental risks can be minimised and look to adopt new technologies and recognised good practice to help achieve this.
We also strive to innovate and enhance the positive benefit of our products and services.
Identifying potential risks and impactsRisks are assessed, and quantified, in terms of impact and likelihood of occurrence, both before and after control mitigation. Risk is assessed across a range of factors, one of which is environment. As noted in the introduction to this Sustainability Review, we are in the process of completing a formal materiality assessment to identify

Strategic Report Financial StatementsCorporate Governance
55The Weir Group PLC Annual Report and Financial Statements 2014
Greenhouse gas emissionsWe are a growing business and the markets that we work in mean the majority of our businesses are energy, and thus carbon, intensive. However, we also have operations in the hydro, wind and nuclear energy industries which are contributing to the production of cleaner, low-carbon energy. Weir Minerals Africa provides high efficiency WRT impeller technology for both new and existing slurry pumps. This reduces energy input for the pumps and increases the operating life of the equipment. The result is a smaller overall carbon footprint, due to fewer parts being replaced less frequently, as well as fewer parts being manufactured. Recycled high chrome iron scrap is used to manufacture these parts.
A review of our approach and systems for measuring our global greenhouse gas (GHG) emissions was undertaken in 2013 to evolve best practice and to enable compliance with the new carbon reporting requirements under The Companies Act 2006 (Strategic Report and Directors’ Report) Regulations 2013. In our last report, we reported that we had procured a new software solution to enable more complete data collation and accurate emissions calculation.
Implementation of the system, including user training and data entry, was completed during 2014. Regular review of our data management system, processes and procedures is planned in order to maintain and improve the relevance, accuracy and scope of our reporting over time.
Our calculation methodology remains aligned with the principles of the ‘Greenhouse Gas Protocol: A Corporate Accounting and Reporting Standard’ developed by the World Business Council for Sustainable Development and the World Resources Institute.
The Group has chosen to follow the ‘operational control’ approach, whereby it accounts for 100% of the GHG emissions from operations over which it has control. This is consistent with our approach to financial accounting and reporting. On this basis, all subsidiary companies are included in reported annual GHG emissions, whilst our joint ventures which are not under our operational control are not. However, in reviewing our reporting, we have excluded some sites on the basis of materiality or because of the type of site. The Group GHG Inventory Management Plan provides guidance on our operational control approach.
The UK government GHG Conversion Factors 2014 have been used to calculate UK emissions. Factors from other credible sources have been used for overseas operations, specifically those published by the US Environmental Protection Agency, the International Energy Agency and the Intergovernmental Panel on Climate Change.
All elements considered likely to make a material contribution to Scope 1 and Scope 2 emissions have been included. Scope 1 sources are those emissions for which the Group is directly responsible, i.e. combustion of fuel for the operation of our facilities.
Scope 2 sources comprise those emissions for which the Group is indirectly responsible, i.e. from the electricity, heat, steam and cooling we purchase to use in our operations or equipment.
Activities in recent years have focused on improving systems for GHG data capture and reporting across our global business, with a focus on Scope 1 and 2 emissions. We do not currently measure or report Scope 3 emissions, which relate to sources not within our direct control, third-party warehouses and transport in vehicles not owned by the Group. However, we have conducted a high level qualitative assessment of which sources of Scope 3 emissions may be more material for our business. Those identified include purchased goods and services, transportation and distribution and use of sold products, and we are considering how to manage these in the future.
The Group’s GHG data collection process is subject to ongoing review, resulting in improvements in the consistency and accuracy of the reported data. In particular, 2013 was the initial year of implementing our comprehensive global GHG reporting system. During the course of updating the system with 2014 data, and conducting a review and assessment of data with our external consultants, we have enhanced the methodology and therefore the quality and consistency of the 2013 data set, enabling us to report an updated baseline as 217,772 tonnes of Carbon Dioxide equivalent (tCO2e) for 2013. This compares against the reported total emissions of 212,000 tCO2e, representing a variance of 2.7%.
Total Annual GHG emissions and emissions intensity by scopeTotal annual GHG emissions
(tCO2e)Emissions intensity
(tCO2e per £m revenue)
2014 2013 2014 2013
Scope 1: On-site combustion of fuel 76,418 85,245 31.3 35.1
Scope 2: Purchased electricity, heat, steam and cooling for own use 132,339 132,527 54.3 54.5
Total 208,757 217,772 85.6 89.6
2013 versus 2014 – Foundry Emissions
Annual GHG emissions (tCO2e)
Proportion of total global annual GHG emissions
GHG emissions intensity (tCO2e per tonne of metal poured)
2014 2013 2014 2013 2014 2013
Scope 1: On-site combustion of fuel – all foundries 19,769 22,545 9.5% 10.4% 0.6 0.6
Scope 2: Purchased electricity, heat, steam and cooling for own use – all foundries 65,109 66,946 31.2% 30.7% 2.0 1.9

56 The Weir Group PLC Annual Report and Financial Statements 2014
Sustainability Review continued
Monitoring impacts (continued)Greenhouse gas emissions (continued)The restatement has been applied in accordance with recognised international standards, including the World Resources Institute, and in line with the principles set out in our Inventory Management Plan, approved in 2013 and revised and updated in 2015 to promote best practice in the collection of data across the Group.
The Group’s total annual GHG emissions in tCO2e for the 52 weeks ended 2 January 2015 and the updated data for the 53 weeks ended 3 January 2014 are set out on page 55.
GHG emissions figures for 2013 (as updated) are presented as the baseline against which year on year performance is measured.
The Group now operates seven foundries, which are the most energy intensive areas of the business. We have presented foundry GHG emissions separately to enable closer performance review in a separate table, also on page 55.
Case study: Environment
Rubber as an engineering materialNatural rubber is an engineering material with unique properties.
Natural rubber is used in many Weir products, including seals for valves, liners for pumps and cyclones, as well as linings for process vessels and pipes. Natural rubber is preferred due to its outstanding toughness which gives it superb abrasion resistance properties, exemplified by Weir Minerals’ Linatex® Premium Rubber known throughout the mining industry due to outstanding performance as well as its familiar red colour.
The primary rubber tree species cultivated as a crop is the Hevea Brasiliensis tree with the main producers of natural rubber latex being Thailand, Indonesia, Malaysia and India. Over 12 million metric tonnes of natural rubber were produced globally in 2013.
Natural rubber’s unique physical properties are due to its inherent molecular structure created by nature. For 90 years, Weir Minerals Malaysia, the home of Linatex® production, has perfected the art of optimising the properties of Linatex® and maximising its abrasion resistance by uniquely processing directly from latex.
Linatex® Premium Rubber is a 95% natural rubber that exhibits outstanding resilience, strength and resistance to cutting, tearing and abrasion. In addition, natural rubber is a highly sustainable crop. Rubber plantations not only provide employment but rubber trees are also an important raw material source for furniture, manufacturing and as a bio-fuel. More importantly, rubber trees can be used to ‘sequester’ carbon dioxide from the atmosphere.
The Kyoto Protocol (1997) requires developed nations to cut their greenhouse gas emissions in order to tackle climate change. Carbon dioxide (CO2) is one of the major greenhouse gases created due to economic activity but each rubber tree can ‘fix’ one metric tonne of CO2 during its 30 year economic life. It is estimated that one hectare of natural rubber plantation can sequester up to 30 metric tonnes of CO2 per year. Carbon is also returned to the ground as leaves fall and is also captured in natural latex itself. Rubber trees have an optimum period of productive life
As with total global GHG emissions, restated 2013 emissions figures for the foundries have been provided as a performance baseline.
For the first time in four years, we are reporting a reduction in absolute GHG emissions across the Group. It is very encouraging to see a change in the trend in both absolute emissions and emissions normalised by revenue. This suggests that the results of our energy efficiency and carbon reduction projects are now being reflected in performance. Our foundries account for approximately 40% of our total GHG emissions and therefore monitoring foundry performance is particularly important for driving onward performance. We have started to analyse the GHG emissions from these on an emissions per tonne of cast weight and between 2013 and 2014 there has been a marginal increase in carbon intensity of energy at the foundries. This is to be expected, given a slight reduction in throughput but a minimum energy base load required to maintain operations.
Minimising potential impactsEnergy/GHG reduction measures One of our sustainability improvement priorities is to reduce our energy use and in relative terms associated GHG emissions. Our focus to date has been to set and manage targets at an operating company level. We have aspirations to define carbon and potentially broader sustainability performance goals across the business to supplement the site level process. We will review this following completion of the sustainability materiality assessment.
Details of some of the sustainability improvement measures undertaken and targets set during 2014 are: – Weir Minerals Africa implemented power
factor correction at the Isando foundry, delivering a predicted reduction in electricity usage of some 80 to 100 Megawatt hours (MWh) per month.
– Weir Gabbioneta replaced fluorescent light tubes with LED light fittings and this project has saved over £10,000 and 51 tonnes of CO2e in the first year.
after which they are cut down and a new tree planted. Weir Minerals Malaysia only uses natural rubber from such a sustainable source.
Developing products that use natural rubber as an engineering material helps increase the sustainability of our products and practices.

Strategic Report Financial StatementsCorporate Governance
57The Weir Group PLC Annual Report and Financial Statements 2014
40
30
20
10
Foundry MetalReused Internally
Tonnes
Foundry Scrap Metal
Purchased from Customer
Tonnes
Foundry Metal Recycled to Third
Party Tonnes
Foundry Timber Recycled
Tonnes
2012 2013 2014
12.9
3.1
4.5 0.7
11.9
2.63.6 0.6
13.2
2.5 3.81.0
– Weir Minerals Europe in Todmorden reduced gas usage for space heating by 45% in the machine shop and 25% in the main office by improving employee awareness. Overall, this saved 603MWh of gas energy, equivalent to over 111 tonnes of CO2e.
– Weir Minerals India installed electric heated thermic fluid rather than a diesel fired boiler for the rubber plant in Bangalore. CO2e emissions were reduced by 27% from 916 tonnes to 670 tonnes.
The Group continues to install and make use of telepresence video-conferencing facilities at its major sites worldwide. There are now 16 sites in eight countries with dedicated telepresence conference rooms. These allow meetings to be held throughout the Group as though attendees were in the same location. The facilities were used for both Board and Group Executive meetings as well as budget review meetings during the year, and their use has resulted in a notable reduction in air travel and related GHG emissions. We estimate that the use of telepresence has saved over 1,300 tonnes of CO2e.
RecyclingAs part of our environmental sustainability strategy, our businesses also focus on improving resource efficiency; for instance, increasing the proportion of waste materials that are recycled and reducing the total quantity of waste going to landfill.
Nearly 13,000 tonnes of metal were reused internally in our foundry operations in 2014. 39% of all metal poured in the foundries in 2014 was reused internally, compared to 34% in 2013. The increase in the amount of metal being reused compared to the prior year is a reflection of the full year recycling data for the foundries acquired during 2013 in Malaysia and South Africa being included in the 2014 data.
Additional reporting mechanismsCDP Climate Change Initiative The CDP scheme (formerly known as the Carbon Disclosure Project) is a global, voluntary initiative for major companies to measure, disclose and share information about sustainability performance and associated risk management and performance with transparency and accountability.
In 2014, we achieved a disclosure score of 90 out of a possible 100 and a ‘C’ rating for our sustainability performance relative to that of other participants. This notable improvement on our 2013 score (77 D) reflects our ongoing commitment to continued improvement for all aspects of environmental sustainability.
UK Carbon Reduction Commitment Energy Efficiency SchemeHaving met the qualification criteria, the Group was required to participate in Phase 1 of the UK Carbon Reduction Commitment Energy Efficiency (‘CRC’) Scheme. The mandatory scheme aims to encourage large organisations to reduce GHG emissions through energy efficiency interventions.
During specific scheme years, participants are required to purchase and surrender sufficient CRC allowances for their relevant GHG emissions. In 2014, the Company purchased and surrendered 3,437 CRC allowances at a cost of £41,244. A legal and technical assessment has confirmed that the Group does not qualify as a participant in Phase 2 of the scheme and was therefore no longer obligated to participate in the CRC Scheme after Phase 1 ended in March 2014.
UK Energy Savings Opportunity Scheme Following a regulatory review, it has been determined that the Group will be required to participate in Phase 1 of the Energy Saving Opportunities Scheme (ESOS) Regulations 2014. ESOS is part of the UK’s implementation of the EU Energy Efficiency Directive 2012 (EED), which requires EU member states to introduce a framework of measures for promoting energy efficiency. The purpose of ESOS is to measure the energy consumption of large organisations from buildings, transport and industrial processes, determine participants’ significant areas of energy consumption and identify cost effective energy saving measures though auditing a representative sample of key areas of consumption.
The Group is in the process of determining the most effective means of meeting the requirements of these regulations, which are to be complied with by early December 2015.
Foundry recycling (’000 tonnes)

58 The Weir Group PLC Annual Report and Financial Statements 2014
2.0
1.5
1.0
0.5
2012 2013 2014
1.6
1.0
0.8
Health and SafetyThe Weir Group is committed to a zero harm environment. Every Board meeting begins with a discussion of the Group’s progress towards its ambition of achieving a Total Incident Rate (TIR) of zero.
In order to achieve that ambition, the Group has a range of initiatives to keep our people, customers, suppliers, sub-contractors and the environments in which they operate safe. In 2014, no fatalities were reported.
EHS Excellence CommitteeThe action towards a zero-accident workplace is led by the Environment, Health & Safety (EHS) Excellence Committee. Its remit is to set and monitor rigorous standards to improve EHS performance across the Group. In 2014, the committee continued to implement the Weir Group EHS Roadmap, which charts the path to a safer workplace and which is now in its third year of implementation. The committee has started the process of updating the roadmap to ensure it continues to drive progress in further years.
Weir EHS Management System The Weir EHS Management System establishes a common set of EHS standards and expectations for addressing the risks that our operations face. Its purpose is to embed health and safety within our culture,
behaviours and actions. The Duty of Care System provides an unbroken chain of accountability from the Chief Executive to our newest apprentice and details individual responsibilities for managing EHS risks. The EHS standards cover nine primary areas of risk, from supply chain to field operations, and provide step-by-step guidance on the minimum requirements expected at all of Weir’s operations anywhere in the world. Each division has a dedicated EHS director and they are jointly responsible for developing and delivering EHS strategy across the Group. In addition, they lead the implementation of the Weir EHS Management System and delivery of our EHS objectives. In 2014, employees in every Weir business received training in the standards.
Individual business units and all employees are engaged in delivering health and safety improvements. This includes employee safety committees, hazard and near miss reports and intra-departmental auditing.
Weir Zero Harm Behavioural Safety SystemProgress continued in the roll-out of the Behavioural Safety System, known as Weir Zero Harm. The Weir Zero Harm programme is focused on establishing demonstrable behavioural change across the entire Group.
Case study: Health and safety
A critical priority for Weir Weir’s products are designed to operate in some of the world’s harshest environments, supported by a global service centre network.
At the heart of this operation is safety. Weir assesses its safety performance using a Total Incident Rate (TIR) which measures medical treatment of any kind required by employees, excluding first aid injuries, divided by 200,000 hours worked.
In the last three years, the Group has implemented the Weir Environmental, Health and Safety (EHS) Management System. This has resulted in a significant improvement in the Group’s TIR performance of nearly 80%, from 3.4 in 2011 to 0.8 in 2014.
Safety is discussed at every Board meeting which helps to set a culture of continuous improvement throughout the business. The EHS management system sets minimum standards of performance and, through a stringent audit process, safety compliance is carefully monitored. Through continuous improvement, compliance scores have increased by over 30% since 2012, despite increases in the scope and level of standard required.
The EHS management system focuses on improving safety through the publication of
best practice and protocols for high-risk activities. The system encourages visibility and transparency of all incidents, with rigorous reviews and corrective actions being taken as appropriate. This work is complemented by ongoing training and education programmes throughout the organisation.
The Board is committed to maintaining EHS as a critical priority for the Weir Group and does not tolerate complacency. Weir continues to target a TIR of ≤1 and an EHS audit score of >40% throughout the organisation.
Sustainability Review continued
It consists of three major strands: i) Safe Start; ii) climate surveys; and iii) participant observations. In 2014, we have completed our target of having all operational employees trained in strand one. Overall, Weir Zero Harm promotes a culture that values behaviours which continually improve EHS performance. The system involves face to face training in identifying behavioural types and behavioural states, and the critical errors that these can cause. The training is designed to promote safe behaviours and to increase awareness of how personal behaviours and habits influence risks.
Measuring progressThese efforts contributed to a reduction in the Group’s TIR which measures lost time and recordable incidents divided by 200,000 hours worked. The results for 2014 show that our incident rate reduced by 20% compared to the previous year.
TIR performance

Strategic Report Financial StatementsCorporate Governance
59The Weir Group PLC Annual Report and Financial Statements 2014
Products and TechnologyAs one of the world’s leading engineering businesses, we are committed to developing sustainable products and technology. We continue to target our innovation efforts on products and services which make our customers more efficient by improving performance, durability and safety, as well as reducing potential environmental impacts.
The Group recognises the benefits of collaborating with a wide range of partners to turn the best ideas into effective products and services for our customers. In 2014, this involved working with some of the world’s leading universities to help us develop and exploit emerging technologies that create new products for our end markets and provide competitive advantages to our customers. During 2014, Weir invested resources in building a collaborative relationship with Imperial College, London, a world-renowned research establishment. This culminated in the recent commitment to a partnership to develop radical, new solutions to some of the most aggressive challenges experienced by our customers.
Engineering Excellence CommitteeWeir’s Engineering Excellence Committee comprises senior engineering and technology leaders from around the business, including the Group Head of Technology, technology directors from each of our three divisions, the business head of our Bangalore-based engineering services team and the director and project manager of the Weir Advanced Research Centre. Its role is to ensure that through collaboration we are sharing and implementing best practice across all of our engineering teams, and, specifically, driving leading edge technology and innovation.
The Committee drives the product innovation strategy across the Group and during 2014 defined four key areas of focus to support the growth and development ambitions of the business. Firstly, three core technologies have been identified that are critical to the current and future product portfolio. These will attract increased focus during 2015. Secondly, resources will be assigned to the development of a Weir engineering system. Thirdly, the further development and enhancement of our engineering talent, building on demonstrable improvements in the last three years. Finally, some fine tuning of the Weir engineering culture to ensure an even greater engagement with our customers to ensure an increased and better understanding of their future technical challenges.
Case study: Products and technology
Duralast™ Fluid End systemHydraulic fracturing, the process of creating fractures in oil and gas bearing rock formations to release trapped hydrocarbons, requires large, robust reciprocating pumps that operate in adverse environments.
The last few years have seen a rise in pumping pressures due to rock formations becoming increasingly difficult to access. Gradually, the mechanical stresses in the pump components have approached their design limits.
The Weir Advanced Research Centre embarked on a programme to extend pump longevity. Three primary failure modes were identified and separate research projects were initiated to address each. Once the wear mechanisms and failure modes were fully understood, an innovative approach was taken to create and assess options to extend the operating life by reducing the peak mechanical stresses in the critical areas of the highly loaded components. A number of solutions were selected for detailed analysis, then prototype testing. The final combination of improvements selected was determined using a scientific approach, combining advanced finite element analysis and computational fluid dynamics with controlled prototype testing. Field testing in collaboration with some of the Group’s customers was conducted to validate the changes before a full market launch.
The most significant and yet simplest change was to offset the valve and plunger bore axes in the fluid, or wet end of the pump, resulting in a reduction in peak stress of over 30%. This increased the service life of the fluid end to nearly twice the life of conventional technology. Design and utility patents have been granted for this feature. Combined with advanced materials, the offset bores extend the service life by more than five times that of previous products.
Other enhancements delivered by this programme, resulting in a fluid end with superior life, include optimisation of the design of the valve and seat, and further enhancements to the advanced manufacturing processes used by the Group in the preparation of the critical components. Together, these have enabled our customers to be more efficient by improving the service life of fluid ends. By utilising finite element stress analysis and fluid dynamics, the Weir Advanced Research Centre and the Group’s Pressure Pumping engineering team optimised the geometrical design of the fluid end system specifically for today’s pressure pumping applications. The results have been publicly recognised by many of Weir’s customers and development of the Duralast™ Fluid End system continues into 2015.

60 The Weir Group PLC Annual Report and Financial Statements 2014
Design and innovationThe Group spent £24.8m (2013: £21.5m) on research and development during the financial year. Weir has more than doubled its spend on fundamental research and development since 2009 and views meaningful investment in this arena as an essential element in supporting innovation, one of our four strategic pillars. We expect this growth in investment to continue as we work towards developing products and technologies which not only reduce environmental impact but are also capable of operating in the most challenging conditions. Weir is recognised as a world leader in the development and application of wear resistant materials technology.
Now in its fourth year of operation, the Weir Advanced Research Centre (WARC) is Weir’s central research and development hub, supporting each of the three divisions and complementing the R&D activity ongoing around the world by the individual businesses. The Group has links with over 18 universities around the globe, each carrying out fundamental and applied research into the following areas: materials and surface treatments, advanced manufacturing processes, fluid flow and wear mechanisms.
As WARC continues to evolve and the earlier projects near completion, the newly developed technologies continue to bring benefit to the businesses and support the launch of innovative new products into the market place. WARC is currently processing two patent applications for innovative technologies which are being developed in the research centre.
Early in 2015, WARC will transition to the newly built Technology and Innovation Centre (TIC) based at the University of Strathclyde in Glasgow, Scotland. TIC is a hub for world-leading research, transforming the way academics, business, industry and the public sector collaborate. Construction of the TIC building has been completed following a total investment of £89m from the University of Strathclyde, Scottish Enterprise and the European Development Fund.
During 2014, the Group, in collaboration with the University of Strathclyde and other strategic partners, has made a number of applications for both UK and European research funding. This includes Horizon 2020, which is the biggest EU Research and Innovation programme ever. Leveraging research grants such as these enables the Group to maximise its investment in research and development.
Weir’s operating companies work with their customers to optimise the design and benefits available in their products. For example, in 2014, Weir Minerals India’s mill circuit optimisation initiative for customer Hindustan Zinc resulted in an estimated increase in recovery of 10%. For Trimex Sands, truck transportation of sand for two kilometres was replaced by pumping slurry through a pipeline, thereby resulting in an estimated saving of 15% of fuel consumed. In the same year, another customer, Gujarat Industries Power Company, benefited from an optimisation of the hydraulic design of the rotor of their boiler feed pumps which resulted in an estimated power consumption reduction of 65 kilowatt hours per pump.
Many of the Group’s products and services are also used in low carbon applications such as nuclear and renewables power generation. For example, Weir American Hydro creates state-of-the-art hydro-turbine designs. Hydropower generates cleaner energy that helps to offset carbon emissions. In 2014, Weir American Hydro developed and put into production new turbine design software to improve the efficiency and performance of its Francis turbine designs. This software is called AHRDS (American Hydro Runner Design System) and the benefits realised during this process include time-saving for other departments in the value chain and a reduction in lead time for our customers.
Weir Mathena identified the opportunity to modify the design of its Shale Gas Separator in 2014. The Shale Gas Separator has proven to be a critical solution as energy operators drill for liquids and natural gas utilising large volumes of air verses traditional drilling fluid. The purpose of the modification was to extend the life of discharge piping; reduce water usage related to plugging; and reduce compressor use for discharge air jet. The discharge assembly was re-engineered to optimise the balance of pressure drop without plugging. The result was a dramatic decrease in the volume of compressed air required to operate the unit and thus a significant decrease in the diesel fuel required to run the generator for the compressor.
Product stewardshipEffective product stewardship ensures that every aspect of our products and services is incorporated in the design process. This includes environmental, health and safety and social considerations, from the drawing board to decommissioning and 2014 saw significant progress being made on the product stewardship initiative launched the previous year. Risk assessments have now been completed on the majority of the existing product portfolio. This involved taking an objective and systematic approach to the assessment of potential hazards associated with each product family, then determining an appropriate mitigation strategy for each. Product stewardship has now been embedded in the Weir New Product Introduction (NPI) process, making it a business-as-usual activity.
In product stewardship, Weir Minerals Netherlands is currently participating in a three year sustainability research project with the objective of determining the metrics of product design to review the environmental impact throughout the life cycle of a product. In parallel, the company is establishing a roadmap for business development in which the environmental benefits of its applications are considered as an integral aspect of the product offering alongside the technical and durability requirements of the market.
During 2014, product stewardship was also formally integrated into the Weir Environmental, Health and Safety system.
Sustainability Review continued
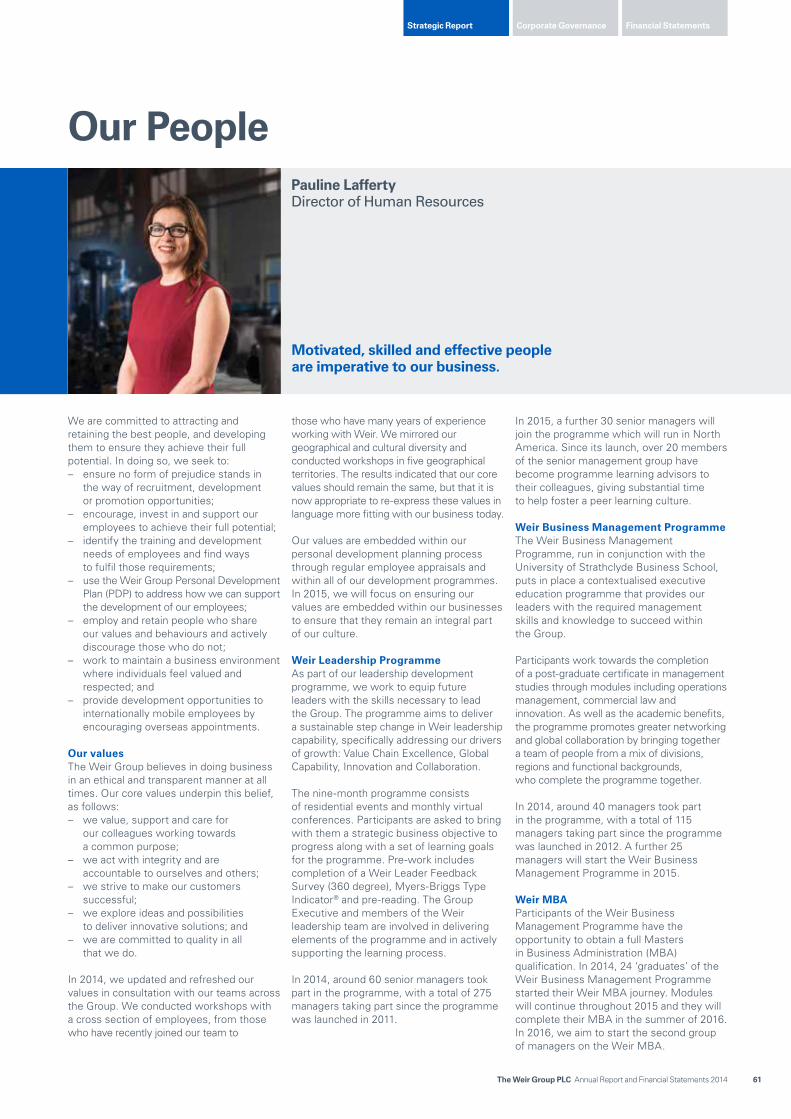
Strategic Report Financial StatementsCorporate Governance
61The Weir Group PLC Annual Report and Financial Statements 2014
We are committed to attracting and retaining the best people, and developing them to ensure they achieve their full potential. In doing so, we seek to: – ensure no form of prejudice stands in
the way of recruitment, development or promotion opportunities;
– encourage, invest in and support our employees to achieve their full potential;
– identify the training and development needs of employees and find ways to fulfil those requirements;
– use the Weir Group Personal Development Plan (PDP) to address how we can support the development of our employees;
– employ and retain people who share our values and behaviours and actively discourage those who do not;
– work to maintain a business environment where individuals feel valued and respected; and
– provide development opportunities to internationally mobile employees by encouraging overseas appointments.
Our valuesThe Weir Group believes in doing business in an ethical and transparent manner at all times. Our core values underpin this belief, as follows: – we value, support and care for
our colleagues working towards a common purpose;
– we act with integrity and are accountable to ourselves and others;
– we strive to make our customers successful;
– we explore ideas and possibilities to deliver innovative solutions; and
– we are committed to quality in all that we do.
In 2014, we updated and refreshed our values in consultation with our teams across the Group. We conducted workshops with a cross section of employees, from those who have recently joined our team to
those who have many years of experience working with Weir. We mirrored our geographical and cultural diversity and conducted workshops in five geographical territories. The results indicated that our core values should remain the same, but that it is now appropriate to re-express these values in language more fitting with our business today.
Our values are embedded within our personal development planning process through regular employee appraisals and within all of our development programmes. In 2015, we will focus on ensuring our values are embedded within our businesses to ensure that they remain an integral part of our culture.
Weir Leadership ProgrammeAs part of our leadership development programme, we work to equip future leaders with the skills necessary to lead the Group. The programme aims to deliver a sustainable step change in Weir leadership capability, specifically addressing our drivers of growth: Value Chain Excellence, Global Capability, Innovation and Collaboration.
The nine-month programme consists of residential events and monthly virtual conferences. Participants are asked to bring with them a strategic business objective to progress along with a set of learning goals for the programme. Pre-work includes completion of a Weir Leader Feedback Survey (360 degree), Myers-Briggs Type Indicator® and pre-reading. The Group Executive and members of the Weir leadership team are involved in delivering elements of the programme and in actively supporting the learning process.
In 2014, around 60 senior managers took part in the programme, with a total of 275 managers taking part since the programme was launched in 2011.
In 2015, a further 30 senior managers will join the programme which will run in North America. Since its launch, over 20 members of the senior management group have become programme learning advisors to their colleagues, giving substantial time to help foster a peer learning culture.
Weir Business Management ProgrammeThe Weir Business Management Programme, run in conjunction with the University of Strathclyde Business School, puts in place a contextualised executive education programme that provides our leaders with the required management skills and knowledge to succeed within the Group.
Participants work towards the completion of a post-graduate certificate in management studies through modules including operations management, commercial law and innovation. As well as the academic benefits, the programme promotes greater networking and global collaboration by bringing together a team of people from a mix of divisions, regions and functional backgrounds, who complete the programme together.
In 2014, around 40 managers took part in the programme, with a total of 115 managers taking part since the programme was launched in 2012. A further 25 managers will start the Weir Business Management Programme in 2015.
Weir MBAParticipants of the Weir Business Management Programme have the opportunity to obtain a full Masters in Business Administration (MBA) qualification. In 2014, 24 ‘graduates’ of the Weir Business Management Programme started their Weir MBA journey. Modules will continue throughout 2015 and they will complete their MBA in the summer of 2016. In 2016, we aim to start the second group of managers on the Weir MBA.
Pauline LaffertyDirector of Human Resources
Our People
Motivated, skilled and effective people are imperative to our business.

62 The Weir Group PLC Annual Report and Financial Statements 2014
Weir First Line Leadership Programme During 2014, the Weir First Line Leadership Programme was developed and rolled out across the Group, targeted at our people who are stepping up to their first line management role (or are preparing to do so). This programme has added to our Management and Leadership Development Framework and is a key building block developing future managers and leaders to ensure the ongoing success of our business.
The programme offers a blended solution that is built around 12 key Weir leadership attributes and is accessible via the Weir University (see below), making it a flexible development resource that first time managers can fit round the demands of their job.
Since its launch in June 2014, over 600 people have started the programme, with over 1,000 learning modules accessed.
Weir UniversityThe Weir University is an online learning resource which provides all employees with access to continuous professional development materials such as e-learning courses, presentations and reading material. This online resource continues to evolve, providing modules on topics such as health and safety, engineering, procurement, marketing, lean manufacturing principles, planning and project management, diversity, leadership, finance, IT and supply chain.
Access to the Weir University is available to employees across the Group and user numbers continue to increase. Since its launch in 2011, over 7,700 hours of training have been delivered. More content, aligned to business requirements, will be added to Weir University in 2015, including ‘Infosmart’: modules on information security and intellectual property; and further Code of Conduct online training.
Developing our graduatesOur graduate development programme was established in 2011 and is designed to provide people joining Weir as a graduate with greater leadership understanding and experience. It prepares our graduates to take on more demanding roles as their career within the Group develops. In 2014, we recruited a total of 19 graduates from a variety of professional disciplines. A further 17 graduates (from a previous intake) from across the world attended the well-established Weir Graduate Development Programme in Scotland. In 2015, another 20 graduates will attend this programme.
During 2015, we will continue to improve our Graduate Development Framework to ensure that we provide a best-in-class personal development offering to our graduate population.
Supporting society and developing our peopleWe undertake various initiatives across the organisation in support of the needs of local people within the regions in which we operate.
Arkwright Scholarships: The Arkwright Scholarships Trust is a registered UK charity that identifies, selects and engages the engineering industry in offering two-year scholarships to 15-16 year old students who are focused on pursuing a career in engineering, either through apprenticeships, further or higher education. We supported three scholars in 2012 and 2013 and have engaged with another two students in 2014. In 2015, we will look to expand this type of initiative into our international markets.
Armed Forces Covenant: The Weir Group is among a growing list of organisations which have signed the UK Government’s Armed Forces Covenant. The document is a written and publicised voluntary pledge from businesses and charitable organisations which wish to demonstrate their concrete support for the armed forces community. The covenant commits Weir to supporting the armed forces and its alumni by employing veterans, offering flexibility to employees who are reservists and supporting local cadet units. While the document has been produced by the UK Armed Forces community, the Group aims to adopt these principles, where possible, in every region in which it operates.
CSCLeaders: A number of our leaders undertook specialist leadership development programmes during the year. One such programme was CSCLeaders, a global leadership development conference run by Common Purpose which “assembles exceptional senior people from across the Commonwealth to tackle challenges that businesses, governments and society face today”, with the aim of building global relationships for the future.
Primary Engineer: Primary Engineer is a UK not-for-profit organisation established in 2005 which aims to encourage young people to consider careers in Science, Technology, Engineering and Mathematics (STEM) related professions. In July 2014, Weir became a founding member of Primary Engineer’s Institution of Primary Engineers and Institution of Secondary Engineers which was launched at the House of Lords in London.
33Fifty: 33Fifty is a Global Leader Experience for young Commonwealth leaders aged between 18 and 25. The name comes from the fact that 33% of the world’s population lives in the Commonwealth, and 50% of those are under 25. In July, as the corporate
partner for the programme, Weir hosted a group of students in Glasgow ahead of the Commonwealth Games. The next event is planned for the 2018 Games in the Gold Coast, Australia.
Diversity and inclusionWe seek to recruit and develop people regardless of background or personal circumstance. All of our businesses operate in compliance with the inclusion and diversity laws and regulations in their respective countries. The majority of our operating companies have a diversity and inclusion policy in place.
On 2 January 2015, we employed 16,347 people across the Group, an increase of 1,127 since last year. Of our 16,347 employees, 14,317 are male and 2,030 are female. There are nine Directors of The Weir Group PLC: seven males and two females. The Board Diversity Policy is to maintain a significant level of female representation on the Board.
The Senior Management Group is made up of 302 people, 269 of which are male and 33 are female. In addition, there are 99 individuals who are directors of subsidiary companies of The Weir Group PLC, who are not part of our Senior Management Group. Of these, 90 are male and 9 are female.
A joint cross-business group is in place to drive best practice in embracing diversity and inclusion across the organisation and our Finance Director, Jon Stanton, is the executive sponsor for diversity and inclusion.
In 2014, Jon and our customer EDF Energy were interviewed about the importance of diversity and inclusion in the customer/supplier relationship. The video was promoted internally to employees through Weir’s internal employee blog and can be viewed online at weir.co.uk/careers/working-at-weir/diversity. In addition, we developed a global project plan to address diversity and inclusion issues, changing our recruitment protocol accordingly, including equal opportunity monitoring and engaging our Group Executive in an unconscious bias workshop.
We are a member of Race for Opportunity, the race campaign from Business in the Community, and Opportunity Now, the women at work campaign from Business in the Community. Race for Opportunity is committed to improving employment opportunities for ethnic minorities across the UK. Opportunity Now empowers employers to accelerate change for women in the workplace.
Sustainability Review continued

Strategic Report Financial StatementsCorporate Governance
63The Weir Group PLC Annual Report and Financial Statements 2014
Succession planningOver 140 years of knowledge and expertise has enabled Weir to become the global engineering solutions provider that it is today. We recognise the absolute importance of strong succession planning to identify our engineers and leaders of the future. As such, we have developed a robust management and leadership development framework which supports the succession planning process across each of our businesses.
We recognise the importance of balance in developing talent from within the Group, as well as bringing in external expertise in order to successfully compete in the competitive markets of the future.
Initiatives at a local level seek to ensure knowledge is retained within the business. In various parts of our business, we pair high potential employees with mentors who are nearing retirement. This programme actively supports succession planning and knowledge transition from our highly-skilled workforce.
Employee engagementWe believe strong employee engagement is an important attribute of a successful and innovative organisation. In the past 12 months, we have been developing our employee engagement channels.
At our offices, factories, workshops and service centres across the globe, our employees take part in regular meetings known as ‘Town Halls’. These sessions typically last 60 minutes and are designed to educate, inform and share knowledge and understanding of best practice and occasionally include external speakers. Topics regularly featured include safety, conduct and operational performance.
An internal employee blog called ‘Talking Weir’ was introduced in late 2013 and is consistently one of the most popular areas of our intranet. In 2014, the blog featured articles on a range of subjects including safety, diversity, working with our communities, innovation, personal development and ethics from employees at all levels of the organisation. Comments on articles are encouraged.
Members of the Group Executive meet monthly to discuss operational issues and Group strategy. In August, we began publishing monthly blogs from members of the Group Executive, highlighting what is discussed at these meetings and demonstrating openness and transparency from the most senior level of the Group.
In 2014, the Group began to make greater use of video to communicate internally. In January, the Chief Executive published a ‘start of the year’ message focusing on safety and performance. In March and July, an internal interview with the Chief Executive was published, talking about
Case study: Our people
Developing our graduate networkWeir has recruited around 150 graduates since its graduate development framework was established in 2011.
In 2014, the inaugural Weir Graduate Alumni Programme was held close to Weir Minerals’ Venlo operational base in the Netherlands and was attended by 24 graduates who were recruited in 2011 and 2012. The week-long event enabled the graduates to continue their personal, team and business learning and develop their network with their peers.
Working as a group, the graduates undertook a problem-solving exercise relevant to the Weir Group and designed to test their knowledge, skills and ability to work together. With input from external facilitators, the graduates were given a refresher on essential business skills including effective public speaking, leadership and personal development. There was also an opportunity to reflect on their experience of the Weir Group Graduate Development Programme with Weir’s Head of Learning and Development, Jim McHarg.
The week included a tour of Weir’s facility in Venlo which manufactures equipment for the mining and aggregates market. The graduates, who are based across Weir’s global operations, had the opportunity to learn more about the Minerals division, the Venlo facility and the products which are manufactured locally. In 2015, around 30 graduates who were recruited in 2013 will attend this programme in Fort Worth, Texas.
our financial performance and highlighting areas of focus, including safety. Videos were also used to support Value Chain Excellence communications, diversity and inclusion, education and understanding of our markets.
The Group publishes an online news- letter, available at weir-bulletin.co.uk in eight languages.
Employee engagement is measured throughout the year using a combination of methods, including Net Promoter® scoring which assesses and evaluates employee satisfaction.
Further information on our employment policies and employee involvement and feedback initiatives is contained in the Directors’ Report section below at page 109.

64 The Weir Group PLC Annual Report and Financial Statements 2014
Case study: Our communities
Weir Cares in the communityWeir Cares is the name of the corporate social responsibility (CSR) programme at Weir India, which started in 2008 and is largely driven by employee volunteers.
During 2014, Weir India undertook a review of its CSR activities, with a CSR committee being formed in March 2014. The agreed budget and activities were determined with the involvement of the core volunteer groups at all the business units in India.
During 2014, over 1,500 hours were spent volunteering by employees at Weir India. Weir Cares identifies underprivileged groups and works alongside or in partnership with non-governmental organisations (NGOs) whose focus is on education, health and sustainable livelihoods. During the past six years, the number of partners has increased from two to eighteen. One of the main projects undertaken includes responding to the healthcare needs in Gokul Village, Hubli. The Sanjeevini Health Clinic was set up by Weir BDK in 2011 and employs medical staff to provide highly subsidised treatment to the community.
Weir BDK also adopted the Government Higher Primary School, in Gokul, Hubli, in 2011. Since then, the company has supported infrastructure development through the building of a new school block with three classrooms, toilet facilities and an activity centre. In addition, they have invested in the educational needs of the children through the provision of a full-time computer teacher and English speaking
classes. The school received the award of Best Regional School in 2014. Weir volunteers also support the high school in the same village, conducting health education for the pupils and sponsoring the development of a science activity centre.
In Peenya, an industrial area in Bangalore, Weir India supports various initiatives including working in partnership with the local Government Industrial Training Institute (ITI). Since 2008, Weir volunteers have been coaching students at the ITI on writing their resumes and interview techniques, enhancing their chances of employment. In 2014, volunteers also explored a new livelihood enhancing initiative to improve hands-on training for students of the ITI, where Weir is undertaking to repair and maintain five turner section machines and provide monthly hands-on training sessions for groups of students using these machines. In addition, in June 2014, Weir volunteers and NGO staff at Bangalore Medical Services Trust provided HIV/AIDS education to over 500 students at the ITI. In the wider community, Weir Cares volunteers facilitated the STOP Malnutrition initiative during 2014. A health screening camp was set up to help malnourished and underprivileged children in Peenya and 40 children were provided with free medication.
Our CommunitiesThe Group is fortunate to be a part of many communities around the world. We value the contributions these communities make to our businesses and strive to make a positive impact in return.
Wherever we operate, we aim to: – be responsible employers and neighbours; – respect the communities we operate in; – strive to make a positive impact by the
responsible running of our operations; and – invest in the communities for the long
term mutual benefit of the community and Weir.
We believe the best people to look after the interests of communities are those who live and work there. That is why we devolve responsibility for community relations to the people who know them best – our local businesses. Like any good neighbour, we build close relationships by regularly having open conversations so that local people are well informed about any of our projects that might affect them. Where issues do arise, we listen carefully and do our best to help find a solution.
We support our local communities through charitable contributions and by being a source of employment, education and training. In addition, we support our employees in their community initiatives and fundraising activities. For instance, Weir Gabbioneta in Italy participated in Green Day which is part of an ongoing initiative called Zero Impact. Employees planted trees and helped maintain a local park in order to reduce CO2 emissions. Weir Oil & Gas Services in Aberdeen has also engaged a local furniture manufacturing company which employs individuals who receive training in joinery and associated trades to help them gain employment in those fields.
2014 marked the hundredth anniversary of the outbreak of World War I and Weir helped to commemorate the sacrifices made by so many in that conflict by sponsoring the UK’s Armed Forces Day celebrations, which took place in June.
The interaction of our businesses is far reaching but is governed by our desire to support and improve the communities in which we work. Key priorities are the improvement of health and education of both our employees and the local community. It is viewed that contributing to these two areas can have an enduring effect on the wellbeing of the individuals and the community as a whole.
Sustainability Review continued

Strategic Report Financial StatementsCorporate Governance
65The Weir Group PLC Annual Report and Financial Statements 2014
Community 42%Education 36%Health 22%
Community 42%Education 36%Health 22%
Charitable donations
As a 144 year old engineering company, we are particularly keen to develop engineering excellence. Weir was the first company in Scotland to set up an apprentice school and our commitment to training is as strong in the 21st century as it was in the 19th.
Charitable givingIn 2014, the total amount of charitable donations made by Group companies was £597,700 (2013: £457,000). We do not make any political donations. This includes cash and non-cash items such as services, materials, employee time and use of corporate facilities.
The Group continues to work in partnership with AMAR International Charitable Foundation (AMAR), a British not-for-profit organisation. In 2013, we made a commitment to support AMAR financially over the next three years to improve health, education and training in Basra, Iraq, where Weir has operations. In 2014, the Group contributed approximately £100,000 to AMAR, which has been used to support a health conference and the running of two women’s training centres.
EducationOur businesses provide experience and training to develop the next generation of engineers. Whilst our focus may be on engineering, we also provide work placements and internships across all sectors. Our placement projects allow school children and young people from around the world to see the opportunities available to them by working for a global business.
With the aim of promoting opportunities for education and careers in engineering, the Weir Group holds an Engineering in Schools competition. For the third consecutive year, secondary school pupils across Scotland were asked to produce a report and present on the topic ‘The importance of engineering in Scotland’. This year’s winners were a team from Arbroath High School, who impressed the panel with their insights into renewable energy and won £3,000 for their school.
Following its pilot run in 2013, the Group continues to support the Primary Engineer initiative, and also the Arkwright scholarships, both detailed above in the Our People section. 2014 also marked the third successive year of support from the Group towards a 3D printing programme, run in partnership with Scottish Council for Development and Industry and the Department of Design, Manufacture and Engineering Management at the University of Strathclyde. Funding of £11,650 was provided by Weir to cover the purchase of ten 3D printers to selected secondary schools and a contribution towards the support provided by student mentors.
In 2014, the Group agreed to a sustainable partnership in the development and operation of the Newlands Junior College in Glasgow. This is a newly established vocational school giving career opportunities to young people who may be disengaged with the traditional education system, and who have the potential to excel in their field.
In May 2014, the Group was one of the main sponsors of the ‘Be Your Personal Best’ campaign with 150 young school pupils from all over Scotland being inspired by Sir Chris Hoy and Katherine Grainger to “be their personal best in life“. This was run in partnership with The Winning Scotland Foundation.
Weir Minerals Multiflo supports the Mechanical Engineering Scholarship at the University of the Sunshine Coast in Australia, by the provision of funds to the scholarship winners. These individuals, along with others from universities in Queensland, seek work experience placements as part of their engineering programme. Support for these initiatives provides a career pathway into engineering for the undergraduates and develops an engineering employee pipeline for our business.
Weir Minerals Latin America participates in programmes in Brazil, Chile and Peru, where students are invited from schools and universities to work as apprentices within the local businesses. At the end of the apprenticeship, if they match the required competencies they may be offered a job with the Group.
HealthBeing a truly global company, health can play a key issue in the communities in which we operate. The Group supports the health of its employees, their families and communities through various programmes and initiatives, which are often run in partnership with local service providers. A small selection of the activities undertaken by Weir companies is outlined below.
Weir SPM held a health fair in 2014 where employees were offered free screenings, including blood pressure, BMI and cholesterol, by a health care provider.
Weir Minerals Brasil promoted a health week which involved a variety of workshops, nutritional advice and medical diagnosis sessions at their plant in Jundiaí, São Paulo. The event was for all employees and contractors and approximately 380 people took part.
As well as contributing funds or time towards several non-profit organisations locally in California, Weir Minerals Floway is partnered with Valley Children’s Healthcare (formerly Children’s Hospital Central California). ‘Big Heart, Little Hands’ is a project the hospital has created as an opportunity for volunteers to donate a designated period of time to conduct an activity for the hospitalised children, which employees at Weir Minerals Floway participate in each month during working hours.
Employee activitiesThe Group is very proud of the charitable work that our people undertake. Our businesses operate their own policies for supporting these, whether by matching donations, providing support or equipment or by allowing employees to participate in charitable activities during working hours.
A small selection of the numerous projects undertaken by our employees in 2014 is highlighted below: – Employees at Weir Specialty Pumps built a
patio at a home for adults with disabilities. – Each month, employees at Weir SPM in
Texas, USA, cook meals for families with sick children at nearby hospitals.
– At Weir SPM in Canada, employees made a contribution of CAD$4,000 to a local food bank.
– Employees at Weir Minerals Netherlands dedicated 100 working hours to charitable initiatives during the year.
– Weir Minerals Andean employees spent a day building a local community garden.
– Employees at Weir Minerals Linatex North America volunteer for a variety of roles, including sitting on various non-profit boards or as firefighters or emergency medical technicians in their communities.

66 The Weir Group PLC Annual Report and Financial Statements 2014
All employees are expected to maintain the highest standards of integrity consistent with our Code of Conduct.
A revised edition of the Code of Conduct was launched in January 2014 and full details are provided below on page 67. As noted in the Our People section above, we also redefined our values in consultation with business teams across the Group. As part of this process, we have also created a set of behaviours which underpin our values. These behaviours are not new to us and are already demonstrated in our operations across the world. By defining these behaviours, however, we are clearly setting out what we expect of our people now and in the future. These behaviours should be exhibited in all aspects of our day to day business operations.
The Group has been a member of the FTSE4Good Index since September 2013.Created by the global index company FTSE Group, FTSE4Good is an equity index series that is designed to facilitate investment in companies that meet globally recognised corporate responsibility standards. FTSE Group confirms that the Company has been independently assessed according to the FTSE4Good criteria, and has satisfied the requirements to become a constituent of the FTSE4Good Index Series.
Companies in the FTSE4Good Index Series have met stringent environmental, social and governance criteria, and are positioned to capitalise on the benefits of responsible business practice. The Company is very proud to be included in the FTSE4Good Index.
The Company is also a member of Transparency International UK’s Business Integrity Forum, having joined in September 2011. Transparency International UK (TI-UK) is the country’s leading anti-corruption
organisation and part of the global Transparency International (TI) movement. The Business Integrity Forum is the UK’s leading anti-corruption forum for businesses in all sectors, comprising companies and professional firms of all sizes. Through their membership, companies are demonstrating their support for TI’s work, helping TI in its mission to reduce corruption in both the public and the private sector throughout the world. All members sign up to a set of principles and are dedicated to ensuring their operations and business dealings are corruption free. Through the Forum, companies have the opportunity to have well-informed discussions with peers and experts, increasing their knowledge in relation to risks, mitigating measures and emerging trends, as well as making a positive contribution to TI-UK’s thought leadership and to the wider international debate on corruption.
Code of ConductThe Code of Conduct provides a clear framework for decision-making, highlighting the values and behaviours we expect our people to demonstrate whilst making those decisions. It provides details on how we expect our people to conduct themselves on a day-to-day basis and guidance on where to go for help.
Supporting the second edition of the Code of Conduct is a mandatory e-learning programme. A new provider was appointed during 2014, with the programme being rolled out towards the end of the year. The first wave of training was targeted at head office and other Group functions, Weir China, Weir India and Weir Africa employees who are deemed to have a potentially higher risk of exposure to bribery and corruption as a consequence of their decision-making responsibilities with regard to third parties, including customers, suppliers, and sales agents.
This includes the Senior Management Group, as well as sales and marketing, purchasing and finance employees within certain sectors of the Company’s operations. Subsequent training will be targeted at all divisional business employees. Approximately 2,300 employees have already completed the online compliance training programme, and a further 1,700 are currently undertaking the training. After completion of the assessment, all participants are asked to complete a compliance statement to confirm that they have read, understood and comply with the Code of Conduct in their work for Weir. The completion of the e-learning programme and online certification is monitored by the Company Secretary.
The Code of Conduct is also reinforced through various means of communications with our employees, such as induction training, Town Hall meetings, conferences, training courses and our 100 day integration plan for new acquisitions. The Code applies to everyone who is employed by the Weir Group and compliance is of the utmost importance. Anyone found in breach of the Code may be liable to disciplinary action, up to and including termination of employment or cancellation of contract.
Competition lawDuring 2014, the Company completed a comprehensive review of its competition law (anti-trust) policies and procedures.
As a result, the Weir Group Competition Law Manual was produced and is accessible to all employees via the Weir intranet.
The document was designed specifically to meet our business needs in very close cooperation with our businesses. It provides an overview of competition law; a description of how competition law is enforced across the world; guidance with respect to dealings and meetings with competitors; guidance
Keith RuddockGroup General Counsel and Company Secretary
Ethics
A critical feature of the Group operating as a well-managed and sustainable company is our commitment to doing business at all times in an ethical and transparent manner.
Sustainability Review continued

Strategic Report Financial StatementsCorporate Governance
67The Weir Group PLC Annual Report and Financial Statements 2014
on dealings with customers, distributors and agents; a review of illegal and high risk matters such as price fixing, bid-rigging activities, market and territory sharing or allocation agreements and abusing market powers; and guidance on exchanging information about competitors or customers.
Accompanying the manual, the Company will be delivering both face to face and e-learning competition law training during 2015, focusing in particular on employees in roles which have been identified as potentially high risk.
Human rights As part of its human rights policy, the Group has adopted a series of human rights principles across all of its businesses. These principles relate to anti-discriminatory attitudes and respect for ethical values; employee rights, which include health and safety, living wages, working hours, freedom of association and the right to collective bargaining; and prohibition of child labour.
By promoting sound ethical values and human rights principles, Weir aims to be a business with which people are proud to be involved. The Weir Group Human Rights Policy expresses the organisation’s commitment to promoting and upholding the “common standard of achievement for all people and all nations”, as endorsed by the Universal Declaration of Human Rights. Other guiding principles include those of the Conventions of the International Labour Organisation and the United Nations Convention on the Rights of the Child. These manifest themselves in Weir’s anti-discriminatory attitudes and respect for ethical values, providing our people with a safe and healthy working environment and fairness in employment terms. For example, national living wage is applied and working hours determined in accordance with applicable laws, as well as the recognition and non-discrimination of rights of association in collective bargaining. In addition, the Group has a zero tolerance of the employment of children in any of its businesses.
We will not exploit anyone, wherever in the world we are working. We will respect the human rights of all those working for or with us, and of the people in the communities where we operate. We will not do business with companies, organisations or individuals that we believe are not working to acceptable human rights standards.
We expect employees to maintain the highest standards of conformity with these principles and their adoption, and adherence is contained within Weir’s Code of Conduct.
Case study: Ethics
Updated Code of ConductThe Code of Conduct (the ‘Code’) covers a wide range of topics, including anti-bribery and corruption, competition (anti-trust) law, developing our people, health and safety, use of Group property and resources, and conflicts of interest.
A major review of the Code was undertaken during 2013 with input from various sectors of the Group. The revised Code received Board approval in January 2014 and was rolled out during 2014. The revised edition reflects developments in a number of areas, both externally and within the Group, since it was first introduced in January 2011. In particular, these changes address developments in the areas of anti-bribery and corruption and in relation to competition (anti-trust) law.
Reflecting the global nature of our business, we have translated the document into 12 languages. The Code can be accessed by our employees via our Global Intranet, as well as being available to download from our website. Copies are also shared with our key suppliers, customers, agents and distributors. As before, it reinforces our shared core values and behaviours – known to us all as the Weir Way.
The Code has three main purposes: – firstly, to clearly set out the behaviour
we expect from all of our employees;
– secondly, to provide guidelines to help our people follow the Weir Way; and
– thirdly, to enable all employees to raise concerns or ask questions if they have any doubts about someone’s actions or activities.
The Code of Conduct provides our people with a clear framework on which to base decision making and ensure that the Company consistently operates to a high standard. It supports our teams to ensure that they demonstrate both integrity in the workplace and in conducting the Group’s business activities while respecting our working relationships and place in the world.
If there is any doubt about their potential conduct, employees are asked to consider the following questions: – Is what I am doing or being asked
to do legal? – Does it comply with the Code
of Conduct? – Am I setting a good example? – Would I be comfortable reading about
this in the media?

68 The Weir Group PLC Annual Report and Financial Statements 2014
Human rights (continued)To ensure this policy is upheld in practice, in addition to Group wide assurance activity, all operating companies complete a compliance scorecard self-assessment twice per annum which assesses compliance with Group policies and procedures.
Suppliers and third partiesWe source raw materials, components and services across the globe. Our suppliers play a critical role in our business and our relationships with them are based on achieving best performance, product, delivery, service and total cost in an ethical and sustainable manner. Embracing a closer relationship with our key suppliers is fundamental to our Value Chain Excellence initiative. In 2014, we have introduced a supplier business review programme designed to fully engage our key suppliers in performance reviews and mutually agreed improvement programmes.
The Group recognises that its responsibilities extend to our supply chain. We have a Supply Chain Policy which sets out the minimum standards we expect our suppliers to abide by with respect to: – how they treat their workforce; – legal and regulatory compliance; – health and safety; – business ethics; and – environmental standards.
During 2014, the Group has continued to work on increasing the level of contractual agreements in place with our supply base. These now equate to over 50% of our total spend. Weir has also joined the UK Government sponsored Prompt Payment Code, which is a scheme designed to support on time payment to small and medium sized suppliers (SMEs).
In addition, our Code of Conduct is issued to our key suppliers. Assessments are undertaken with regard to compliance with Group standards as part of the vetting process for new suppliers. We also audit our key suppliers regularly to assess ongoing compliance with the Supply Chain Policy and other relevant Group standards. Wherever possible, we work with our suppliers to support them to address weaknesses identified.
The Group is committed to working only with third parties, including customers, sub-contractors, suppliers and joint venture and strategic alliance partners, whose business ethics and behaviours are consistent with our own Code of Conduct.
During 2015, we will be increasing our focus in this area through the introduction of a web based compliance tool, designed to assess our key suppliers’ compliance with our Code of Conduct.
External sales agentsThe Group engages a number of external sales agents across the globe to act on its behalf in locations where it does not have a permanent sales presence, or in regard to specific projects. The Group has a sales agents’ manual which sets out the Group requirements with regard to appointing and reappointing agents, as well as the ongoing monitoring requirements. Due diligence is performed prior to all appointments and reappointments and overseen by the legal department. The standard Weir contract must be used unless the legal department has agreed modifications, but the terms of the agreements always include stipulation that agents must comply with the Code of Conduct. The agents are required to confirm in writing their compliance with the Code of Conduct.
Gifts and hospitalityWe recognise that gifts and hospitality have the potential to create a conflict of interest, or the perception of a conflict of interest. As a result, there are Group policies with regard to receiving and giving gifts and hospitality from, and to, third parties. In no circumstances should gifts or hospitality be solicited, and they should not place the recipient under any obligation.
All gifts and hospitality above the minimum threshold must be pre-approved using an online gifts and hospitality register. Our Internal Audit team assess compliance with the Group’s gifts and hospitality policies during audit visits and undertake monthly reviews of the register, which are shared with senior management.
Reporting issuesThe Group encourages our people to discuss any ethical concerns they may have with local management or the legal department. In addition, the Weir Ethics Hotline, an independent and confidential telephone helpline and an online reporting system is available for our employees, partners and third parties to call or email with any concerns that they have concerning unethical behaviour. Calls to the helpline are free and lines are open 24 hours a day, seven days a week. Reports can be made in a wide range of languages, reflecting our global footprint. Online reporting remains the most common form of reporting matters, with 76% of reports being made in this way.
All reports are investigated. During 2014, 51 reports were submitted via the Weir Ethics Hotline and each report was fully investigated. Confidentiality and anonymity are important features of the Ethics Hotline, and both elements are maintained where requested by the reporting party. In 2014, both anonymity and confidentiality was sought in 73% of the cases, and confidentiality only in 26% of the cases. Complainants can receive updates and the details of the outcome of the investigation via the Ethics Hotline when it is possible to provide this in adherence with privacy or local legal restrictions.
The Strategic Report, covering pages 1 to 68 of the Annual Report and Financial Statements 2014, has been approved by the Board of Directors in accordance with The Companies Act 2006 (Strategic Report and Directors’ Report) Regulations 2013.
On behalf of the Board of Directors
Keith RuddockCompany Secretary25 February 2015
Sustainability Review continued

Strategic Report Financial StatementsCorporate Governance
69The Weir Group PLC Annual Report and Financial Statements 2014
Group Executive
Name and title Paul Coppinger Oil & Gas Divisional Managing Director (53)
John Heasley Power & Industrial Divisional Managing Director (40)
Dean Jenkins Minerals Divisional Managing Director (43)
Keith Ruddock Group General Counsel and Company Secretary (54)
Biography Paul is the Divisional Managing Director of the Oil & Gas Division, based in Fort Worth, Texas, USA. He has held this position since January 2015. Prior to this, he held the position of President of the Pressure Pumping business within the Oil & Gas Division. He joined Weir in 2011 as President of SPM. Prior to joining Weir, Paul was the President of the Energy Group for ten years at Circor International, Inc., a diversified manufacturer of valves and related products. He has been a director of the Petroleum Equipment & Services Association since 2007 and presently is the Association’s Chairman.
John joined the Group Executive in January 2014 as Divisional Managing Director for Weir Power & Industrial. He is based at the divisional headquarters in East Kilbride, Scotland. A chartered accountant, he has held a number of senior financial, commercial and operational roles. At PwC, he worked in mergers and acquisitions before joining Scottish Power in business development and financial posts. John joined Weir in 2008 as Group Financial Controller before becoming Valves Managing Director in the Power & Industrial Division.
Dean is the Minerals Divisional Managing Director, based in Melbourne, Australia. He joined the Group in November 2010, becoming Power & Industrial Divisional Managing Director in January 2011. He was appointed to his current role in August 2012. Dean previously worked for Qantas Airlines and the Australian listed infrastructure services company UGL Ltd, most recently as Chief Executive of the latter’s Rail Division.
Keith is Group General Counsel and Company Secretary and is based at the Group’s Head Office in Glasgow. He joined the Group in April 2012 from Royal Dutch Shell plc, where he was General Counsel for Upstream International, Shell’s largest business unit, based in The Hague. He has extensive international commercial and legal experience, having worked in the Middle East, North America, Africa, Australasia and Europe. He is also a member of the Development Board of the Bingham Centre for the Rule of Law.
Name and title Pauline Lafferty Director of Human Resources (49)
Andrew Neilson Director of Strategy & Corporate Affairs (39)
Gavin Nicol Director of Operations, Support & Development (53)
Biography Pauline is the Director of Human Resources, based at the Group’s Head Office in Glasgow. She joined the Group in 2011. Pauline was previously in executive search with Miles Partnership and Russell Reynolds Associates in the UK and Australia. Prior to this, she held business planning and operational roles for 11 years with Motorola and Digital Equipment Corporation (DEC) in Scotland, Australia and Hong Kong, ultimately becoming Asia Pacific Director of Supply for DEC. Pauline is also a Non-Executive Director of the Scottish Exhibition Centre.
Andrew joined the Group Executive in January 2014 as Director of Strategy & Corporate Affairs. He is based at the Group’s Head Office in Glasgow. Andrew holds a Masters degree in engineering from the University of Strathclyde and is a qualified accountant. Before joining Weir in 2010, he held a variety of senior roles with banking, energy and professional services companies, including HSBC, HBOS, Scottish Power and KPMG.
Gavin is the Director of Operations, Support & Development, based at the Group’s Head Office in Glasgow. He was previously President of Weir SPM for two years, based in Fort Worth, Texas, USA. Gavin joined Weir in 2005 and was managing director of the Weir Pumps business prior to its sale in 2007. Before joining Weir, he worked for a number of multinationals, including the Terex Corporation, PwC and Coats Viyella. Gavin is also a member for the council of the CBI in Scotland and has recently been appointed to a Visiting Professorship at the University of Strathclyde.
Keith Cochrane and Jon Stanton are also members of the Group Executive Committee. Their biographical information can be found on the pages overleaf.
Steve Noon held the position of Oil & Gas Divisional Managing Director until 31 December 2014.
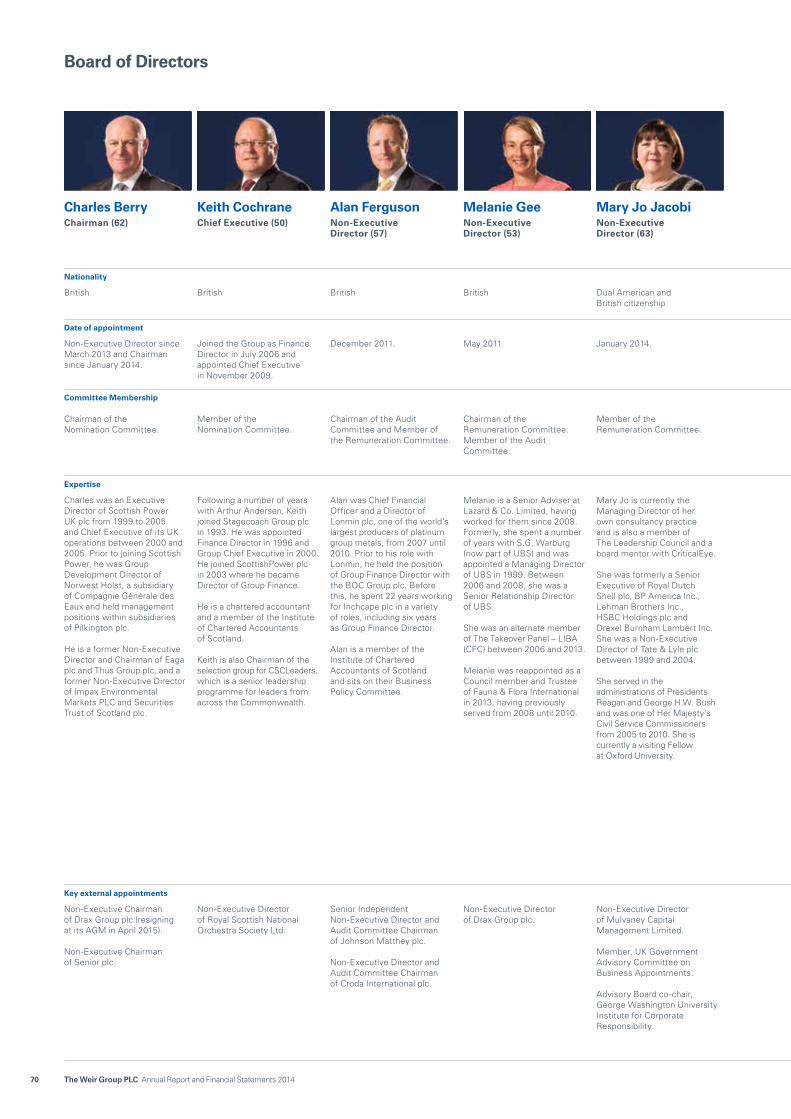
70 The Weir Group PLC Annual Report and Financial Statements 2014
Board of Directors
Charles Berry Chairman (62)
Keith Cochrane Chief Executive (50)
Alan Ferguson Non-Executive Director (57)
Melanie Gee Non-Executive Director (53)
Mary Jo JacobiNon-Executive Director (63)
Professor Sir Jim McDonald Non-Executive Director (57)
Richard (Rick) Menell Non-Executive Director (59)
John Mogford Non-Executive Director (61)
Jon Stanton Finance Director (47)
Lord Robertson of Port Ellen Former Non-Executive Director (68)
Nationality
British British British British Dual American and British citizenship
British South African British British British
Date of appointment
Non-Executive Director since March 2013 and Chairman since January 2014.
Joined the Group as Finance Director in July 2006 and appointed Chief Executive in November 2009.
December 2011. May 2011. January 2014. January 2015. April 2009.Senior Independent Director from 1 February 2015.
June 2008. April 2010. February 2004. Retired 31 January 2015 (including as Senior Independent Director).
Committee Membership
Chairman of the Nomination Committee.
Member of the Nomination Committee.
Chairman of the Audit Committee and Member of the Remuneration Committee.
Chairman of theRemuneration Committee.Member of the Audit Committee.
Member of the Remuneration Committee.
Member of the Audit Committee.
Member of the Nomination and Remuneration Committees. Audit Committee Member – January 2014 to January 2015.
Member of the Audit and Nomination Committees.
None. Member of the Nomination and Remuneration Committees until his retirement on 31 January 2015.
Expertise
Charles was an Executive Director of Scottish Power UK plc from 1999 to 2005 and Chief Executive of its UK operations between 2000 and 2005. Prior to joining Scottish Power, he was Group Development Director of Norwest Holst, a subsidiary of Compagnie Générale des Eaux and held management positions within subsidiaries of Pilkington plc.
He is a former Non-Executive Director and Chairman of Eaga plc and Thus Group plc, and a former Non-Executive Director of Impax Environmental Markets PLC and Securities Trust of Scotland plc.
Following a number of years with Arthur Andersen, Keith joined Stagecoach Group plc in 1993. He was appointed Finance Director in 1996 and Group Chief Executive in 2000. He joined ScottishPower plc in 2003 where he became Director of Group Finance.
He is a chartered accountant and a member of the Institute of Chartered Accountants of Scotland.
Keith is also Chairman of the selection group for CSCLeaders, which is a senior leadership programme for leaders from across the Commonwealth.
Alan was Chief Financial Officer and a Director of Lonmin plc, one of the world’s largest producers of platinum group metals, from 2007 until 2010. Prior to his role with Lonmin, he held the position of Group Finance Director with the BOC Group plc. Before this, he spent 22 years working for Inchcape plc in a variety of roles, including six years as Group Finance Director.
Alan is a member of the Institute of Chartered Accountants of Scotland and sits on their Business Policy Committee.
Melanie is a Senior Adviser at Lazard & Co. Limited, having worked for them since 2008. Formerly, she spent a number of years with S.G. Warburg (now part of UBS) and was appointed a Managing Director of UBS in 1999. Between 2006 and 2008, she was a Senior Relationship Director of UBS.
She was an alternate member of The Takeover Panel – LIBA (CFC) between 2006 and 2013.
Melanie was reappointed as a Council member and Trustee of Fauna & Flora International in 2013, having previously served from 2008 until 2010.
Mary Jo is currently the Managing Director of her own consultancy practice and is also a member of The Leadership Council and a board mentor with CriticalEye.
She was formerly a Senior Executive of Royal Dutch Shell plc, BP America Inc., Lehman Brothers Inc., HSBC Holdings plc and Drexel Burnham Lambert Inc. She was a Non-Executive Director of Tate & Lyle plc between 1999 and 2004.
She served in the administrations of Presidents Reagan and George H.W. Bush and was one of Her Majesty’s Civil Service Commissioners from 2005 to 2010. She is currently a visiting Fellow at Oxford University.
Sir Jim McDonald has been Principal and Vice Chancellor of the University of Strathclyde since March 2009 and has held the Rolls-Royce Chair in Electrical Power Systems since 1993.
Sir Jim is Chairman of both the Institute for Energy and Environment, the largest power engineering and energy systems research group internationally, and the Rolls-Royce Technology Centre.
He is also a member of the Scottish Enterprise Board, Scottish Science Advisory Council and has recently become a member of the UK Trade and Investment Energy Excellence Board.
He co-chairs (with the First Minister of Scotland) the Energy Advisory Board in Scotland. He is a fellow of the Royal Academy of Engineering and of the Institution of Engineering and Technology.
Rick worked as an investment banker before joining Anglovaal Group in 1992. He was appointed Chief Executive of Anglovaal Mining in 1996, then Executive Chairman in 2002. In 2005, he left to become President and Chief Executive of TEAL Exploration & Mining Inc. He was formerly Chairman of Avgold Ltd (1996-2004) and Bateman Engineering BV (2005-2009) and Director of Mutual & Federal Insurance Company Ltd (1996-2010) and Standard Bank Group Ltd (1997-2011).
Rick is a Senior Advisor to Credit Suisse and Chairman of Credit Suisse Securities (Johannesburg) (Pty) Limited.He serves as a Director on a number of unlisted companies and non-profit organisations.
He is a fellow of the Geological Society (London), and both the Australasian and South African Institutes of Mining and Metallurgy.
John is currently a Managing Director for First Reserve, a large global energy focused private equity firm. As part of this role, he sits on several boards.
He was formerly an Executive Vice President of BP plc, having been with BP for over 30 years, initially in their exploration division and progressively rising to Executive Vice President (Chief Operating Officer US Downstream & Head of Refining). He held numerous positions in every area of operations from gas and renewables to upstream and downstream oil.
He was formerly Chairman of Amromco Energy LLC in Romania, White Rose Energy Ventures LLP in the UK and a Non-Executive Director of Deep Gulf Energy LP in America.
He was also formerly a Non-Executive Director of CHC Helicopters SA in Luxembourg.
He is a fellow of the Institution of Mechanical Engineers.
Jon was formerly a partner with Ernst & Young, having joined as a graduate trainee in their Birmingham office in 1988. He was appointed as a partner in their London office in 2001 with lead responsibility for the audit of a number of FTSE 100 multinational clients.
He is a chartered accountant and a member of the Institute of Chartered Accountants in England and Wales.
Lord Robertson is an Adviser to Cable and Wireless Communications plc, Special Adviser to BP plc and a Senior Counsellor with The Cohen Group (USA). He was the Secretary of State for Defence from 1997 until 1999 before becoming Secretary General of NATO from 1999 until 2003. He was formerly a Director of Smiths Group plc (2004-2006) and Deputy Chairman of Cable & Wireless plc (2004-2006) and TNK-BP Ltd (2006-2013).
A member of Her Majesty’s Privy Council, he is Chairman of the Ditchley Foundation and of the Commission on Global Road Safety. He is honorary Professor of Politics at Stirling University, an honorary Fellow of the Royal Society of Edinburgh, an Elder Brother of the Corporation of Trinity House and is Chancellor of the Order of St Michael and St George.
Key external appointments
Non-Executive Chairman of Drax Group plc (resigning at its AGM in April 2015).
Non-Executive Chairman of Senior plc.
Non-Executive Director of Royal Scottish National Orchestra Society Ltd.
Senior Independent Non-Executive Director and Audit Committee Chairman of Johnson Matthey plc.
Non-Executive Director and Audit Committee Chairman of Croda International plc.
Non-Executive Director of Drax Group plc.
Non-Executive Director of Mulvaney Capital Management Limited.
Member, UK Government Advisory Committee on Business Appointments.
Advisory Board co-chair, George Washington University Institute for Corporate Responsibility.
Non-Executive Director of Allt Dearg Educational Trust.
Non-Executive Director of Glasgow Science Centre Charitable Trust.
Non-Executive Director of UK Offshore Renewable Energy Catapult Board.
Non-Executive Director of Gold Fields Ltd and Sibanye Gold Limited, both South African companies listed on the Johannesburg Stock Exchange and the New York Stock Exchange.
Non-Executive Director of Rockwell Diamonds Inc., a South African company listed on both the Johannesburg Stock Exchange and the Toronto Stock Exchange.
Non-Executive Director of DOF Subsea AS in Norway and Midstates Petroleum Company, Inc. in America.
None. Non-Executive Director of Western Ferries (Clyde) Ltd.

Strategic Report Financial StatementsCorporate Governance
71The Weir Group PLC Annual Report and Financial Statements 2014
Charles Berry Chairman (62)
Keith Cochrane Chief Executive (50)
Alan Ferguson Non-Executive Director (57)
Melanie Gee Non-Executive Director (53)
Mary Jo JacobiNon-Executive Director (63)
Professor Sir Jim McDonald Non-Executive Director (57)
Richard (Rick) Menell Non-Executive Director (59)
John Mogford Non-Executive Director (61)
Jon Stanton Finance Director (47)
Lord Robertson of Port Ellen Former Non-Executive Director (68)
Nationality
British British British British Dual American and British citizenship
British South African British British British
Date of appointment
Non-Executive Director since March 2013 and Chairman since January 2014.
Joined the Group as Finance Director in July 2006 and appointed Chief Executive in November 2009.
December 2011. May 2011. January 2014. January 2015. April 2009.Senior Independent Director from 1 February 2015.
June 2008. April 2010. February 2004. Retired 31 January 2015 (including as Senior Independent Director).
Committee Membership
Chairman of the Nomination Committee.
Member of the Nomination Committee.
Chairman of the Audit Committee and Member of the Remuneration Committee.
Chairman of theRemuneration Committee.Member of the Audit Committee.
Member of the Remuneration Committee.
Member of the Audit Committee.
Member of the Nomination and Remuneration Committees. Audit Committee Member – January 2014 to January 2015.
Member of the Audit and Nomination Committees.
None. Member of the Nomination and Remuneration Committees until his retirement on 31 January 2015.
Expertise
Charles was an Executive Director of Scottish Power UK plc from 1999 to 2005 and Chief Executive of its UK operations between 2000 and 2005. Prior to joining Scottish Power, he was Group Development Director of Norwest Holst, a subsidiary of Compagnie Générale des Eaux and held management positions within subsidiaries of Pilkington plc.
He is a former Non-Executive Director and Chairman of Eaga plc and Thus Group plc, and a former Non-Executive Director of Impax Environmental Markets PLC and Securities Trust of Scotland plc.
Following a number of years with Arthur Andersen, Keith joined Stagecoach Group plc in 1993. He was appointed Finance Director in 1996 and Group Chief Executive in 2000. He joined ScottishPower plc in 2003 where he became Director of Group Finance.
He is a chartered accountant and a member of the Institute of Chartered Accountants of Scotland.
Keith is also Chairman of the selection group for CSCLeaders, which is a senior leadership programme for leaders from across the Commonwealth.
Alan was Chief Financial Officer and a Director of Lonmin plc, one of the world’s largest producers of platinum group metals, from 2007 until 2010. Prior to his role with Lonmin, he held the position of Group Finance Director with the BOC Group plc. Before this, he spent 22 years working for Inchcape plc in a variety of roles, including six years as Group Finance Director.
Alan is a member of the Institute of Chartered Accountants of Scotland and sits on their Business Policy Committee.
Melanie is a Senior Adviser at Lazard & Co. Limited, having worked for them since 2008. Formerly, she spent a number of years with S.G. Warburg (now part of UBS) and was appointed a Managing Director of UBS in 1999. Between 2006 and 2008, she was a Senior Relationship Director of UBS.
She was an alternate member of The Takeover Panel – LIBA (CFC) between 2006 and 2013.
Melanie was reappointed as a Council member and Trustee of Fauna & Flora International in 2013, having previously served from 2008 until 2010.
Mary Jo is currently the Managing Director of her own consultancy practice and is also a member of The Leadership Council and a board mentor with CriticalEye.
She was formerly a Senior Executive of Royal Dutch Shell plc, BP America Inc., Lehman Brothers Inc., HSBC Holdings plc and Drexel Burnham Lambert Inc. She was a Non-Executive Director of Tate & Lyle plc between 1999 and 2004.
She served in the administrations of Presidents Reagan and George H.W. Bush and was one of Her Majesty’s Civil Service Commissioners from 2005 to 2010. She is currently a visiting Fellow at Oxford University.
Sir Jim McDonald has been Principal and Vice Chancellor of the University of Strathclyde since March 2009 and has held the Rolls-Royce Chair in Electrical Power Systems since 1993.
Sir Jim is Chairman of both the Institute for Energy and Environment, the largest power engineering and energy systems research group internationally, and the Rolls-Royce Technology Centre.
He is also a member of the Scottish Enterprise Board, Scottish Science Advisory Council and has recently become a member of the UK Trade and Investment Energy Excellence Board.
He co-chairs (with the First Minister of Scotland) the Energy Advisory Board in Scotland. He is a fellow of the Royal Academy of Engineering and of the Institution of Engineering and Technology.
Rick worked as an investment banker before joining Anglovaal Group in 1992. He was appointed Chief Executive of Anglovaal Mining in 1996, then Executive Chairman in 2002. In 2005, he left to become President and Chief Executive of TEAL Exploration & Mining Inc. He was formerly Chairman of Avgold Ltd (1996-2004) and Bateman Engineering BV (2005-2009) and Director of Mutual & Federal Insurance Company Ltd (1996-2010) and Standard Bank Group Ltd (1997-2011).
Rick is a Senior Advisor to Credit Suisse and Chairman of Credit Suisse Securities (Johannesburg) (Pty) Limited.He serves as a Director on a number of unlisted companies and non-profit organisations.
He is a fellow of the Geological Society (London), and both the Australasian and South African Institutes of Mining and Metallurgy.
John is currently a Managing Director for First Reserve, a large global energy focused private equity firm. As part of this role, he sits on several boards.
He was formerly an Executive Vice President of BP plc, having been with BP for over 30 years, initially in their exploration division and progressively rising to Executive Vice President (Chief Operating Officer US Downstream & Head of Refining). He held numerous positions in every area of operations from gas and renewables to upstream and downstream oil.
He was formerly Chairman of Amromco Energy LLC in Romania, White Rose Energy Ventures LLP in the UK and a Non-Executive Director of Deep Gulf Energy LP in America.
He was also formerly a Non-Executive Director of CHC Helicopters SA in Luxembourg.
He is a fellow of the Institution of Mechanical Engineers.
Jon was formerly a partner with Ernst & Young, having joined as a graduate trainee in their Birmingham office in 1988. He was appointed as a partner in their London office in 2001 with lead responsibility for the audit of a number of FTSE 100 multinational clients.
He is a chartered accountant and a member of the Institute of Chartered Accountants in England and Wales.
Lord Robertson is an Adviser to Cable and Wireless Communications plc, Special Adviser to BP plc and a Senior Counsellor with The Cohen Group (USA). He was the Secretary of State for Defence from 1997 until 1999 before becoming Secretary General of NATO from 1999 until 2003. He was formerly a Director of Smiths Group plc (2004-2006) and Deputy Chairman of Cable & Wireless plc (2004-2006) and TNK-BP Ltd (2006-2013).
A member of Her Majesty’s Privy Council, he is Chairman of the Ditchley Foundation and of the Commission on Global Road Safety. He is honorary Professor of Politics at Stirling University, an honorary Fellow of the Royal Society of Edinburgh, an Elder Brother of the Corporation of Trinity House and is Chancellor of the Order of St Michael and St George.
Key external appointments
Non-Executive Chairman of Drax Group plc (resigning at its AGM in April 2015).
Non-Executive Chairman of Senior plc.
Non-Executive Director of Royal Scottish National Orchestra Society Ltd.
Senior Independent Non-Executive Director and Audit Committee Chairman of Johnson Matthey plc.
Non-Executive Director and Audit Committee Chairman of Croda International plc.
Non-Executive Director of Drax Group plc.
Non-Executive Director of Mulvaney Capital Management Limited.
Member, UK Government Advisory Committee on Business Appointments.
Advisory Board co-chair, George Washington University Institute for Corporate Responsibility.
Non-Executive Director of Allt Dearg Educational Trust.
Non-Executive Director of Glasgow Science Centre Charitable Trust.
Non-Executive Director of UK Offshore Renewable Energy Catapult Board.
Non-Executive Director of Gold Fields Ltd and Sibanye Gold Limited, both South African companies listed on the Johannesburg Stock Exchange and the New York Stock Exchange.
Non-Executive Director of Rockwell Diamonds Inc., a South African company listed on both the Johannesburg Stock Exchange and the Toronto Stock Exchange.
Non-Executive Director of DOF Subsea AS in Norway and Midstates Petroleum Company, Inc. in America.
None. Non-Executive Director of Western Ferries (Clyde) Ltd.

72 The Weir Group PLC Annual Report and Financial Statements 2014
Corporate Governance Report
Corporate Governance Report
Charles BerryChairman
Dear StakeholderAchieving excellence in corporate governance remains vitally important to us as a Board, recognising that it is crucial to the overall delivery of the Group’s strategy. I have now been Chairman of the Group for over a year, having been a Non-Executive Director for ten months before that. I am very proud to set the tone of both the Board and the Company with regards to corporate governance and strive to ensure that this is at the highest standard possible. I am supported in this endeavour by the committed individuals forming both the Board of Directors and the senior executives of the Company, who establish and maintain business practices and policies that exemplify best practice within the Group.
Within the Our People section of the Sustainability Review above at page 61, we detail the review of our core values undertaken in 2014. This consultation exercise across the Group confirmed our fundamental drive to do business in an ethical and transparent manner, underpinned by core values which include acting with integrity, being accountable and committing to quality in all that we do. As a Board, we work hard to deliver consistently in line with these values, demonstrating the behaviours in a manner which inspires our teams across the world to do the same.
UK Corporate Governance CodeAs Chairman, I am responsible for ensuring that under my leadership the Board operates effectively and in compliance with the UK Corporate Governance Code (the ‘2012 Code’). In accordance with the Listing Rules, the Group is reporting on how it has applied the main principles and whether we have complied with the relevant provisions of the 2012 Code.
I am pleased to report that the Group has complied fully with all the principles of the 2012 Code, for the 52 weeks to 2 January 2015, and from that date to the date of approval of this Annual Report, with the exception of one part of a provision which is detailed on page 74.
In September 2014, a revised Code (the ‘2014 Code’) and related Guidance on Risk Management and Internal Controls were issued, and these apply to accounting periods beginning on or after 1 October 2014. The amendments are welcomed by us as part of a move towards further transparency and good reporting for the benefit of all our stakeholders. Key changes include disclosures with regards to longer-term viability, risk management/internal controls, and also directors’ remuneration. Both the Audit and Remuneration Committees, along with the Board, are reviewing current practices with a view to ensuring compliance with the 2014 Code during 2015, which fits with our goal of continuous improvement in our governance arrangements.
Changes to the BoardBoard and Committee changes during 2014 and early 2015 were as follows, and will enable fresh perspectives to be brought to different aspects of the Group’s governance framework. – I was appointed Chairman of the Board and Nomination Committee Chairman on 1 January 2014. – Mary Jo Jacobi was appointed Non-Executive Director on 1 January 2014 and to the Remuneration Committee on 21 January 2014. – John Mogford was appointed to the Nomination Committee on 21 January 2014. – Sir Jim McDonald was appointed Non-Executive Director and as member of the Audit Committee on 1 January 2015. – Lord Robertson resigned as a Non-Executive Director with effect from 31 January 2015. He therefore also ceased to be Senior
Independent Director, and a member of the Remuneration and Nomination Committees, on that date.

Strategic Report Financial StatementsCorporate Governance
73The Weir Group PLC Annual Report and Financial Statements 2014
– Rick Menell was appointed Senior Independent Director on 1 February 2015. He was appointed to the Audit Committee on 21 January 2014 and ceased to be a member of the Audit Committee on 1 January 2015.
– Alan Ferguson was appointed to the Remuneration Committee on 1 February 2015.
We review our composition and have spent time on succession planning to ensure that we continue to evolve as a Board, enabling us to further enhance our leadership of the Group. The induction of our new Directors and Committee members remains an important focus, and we continue to work hard towards a cohesive approach between the Executive Directors and the Non-Executive Directors, while maintaining a robust challenge of matters presented for discussion.
Board effectivenessDuring 2014, the Group submitted an indicative all-share acquisition proposal to the board of Metso Corporation which was subsequently rejected. As a result of this proposed transaction, the Board of Directors held five additional meetings, as well as extended communications by phone and email. I felt that the composition and time commitments of the various Board members were tested during this time and found to be highly effective. I am confident that the Board and its Committees have the experience, skill and commitment to handle additional responsibilities as and when they are required, and have an excellent range of talents which will enable us to respond to challenges faced by the Group.
The Board of Directors and the Board Committees underwent an external evaluation by Independent Board Review during 2014, and the review concluded that the Board was functioning well, with a strong combination of skills and experience being brought by both Executive and Non-Executive Directors. It is recognised that the Non-Executive Directors are keen to contribute even more to further support the Company’s continued growth, and there are aspects of the meeting cycle and agenda format which we can develop to enhance the way we function as a Board. Further details of the Board evaluation are set out below at pages 80 and 81, and the reports on the Nomination, Audit and Remuneration Committees are set out on pages 83, 86 and 103 respectively, each reflecting the progress which those Committees have made over the course of 2014.
All of our stakeholders are important to us at Weir and contribute greatly to our continued strength as a Group. We will therefore endeavour to maintain and enhance our high standards of corporate governance in order to protect your interests, and I welcome this opportunity to report in detail on our activities as a Board and our progress during the past year.
Charles BerryChairman25 February 2015
74 The Weir Group PLC Annual Report and Financial Statements 2014
The UK Corporate Governance CodeThe UK Corporate Governance Code is published by the Financial Reporting Council and sets out standards of good practice in relation to issues such as board composition and effectiveness, the role of board committees, risk management, remuneration and relations with shareholders. Paper and downloadable versions can be obtained from the Financial Reporting Council via its website at frc.org.uk.
As a listed company, we must detail how we have complied with the Code and provide an explanation of instances where we have not. This report, in addition to the Nomination, Audit and Remuneration Committee reports, details how the Company has applied the main principles of the Code. For the 52 weeks ended 2 January 2015 and from that date to the date of approval of this Annual Report, except in the instance of one part of a provision detailed below, the Board considers that the Company has complied fully with the UK Corporate Governance Code 2012 (the ‘Code’).
Code provision E.1.1 states that the Senior Independent Director should attend sufficient meetings with a range of major shareholders to listen to their views in order to help develop a balanced understanding of the issues and concerns of major shareholders. During 2014, Lord Robertson undertook engagement with various stakeholders but he did not attend meetings with a range of major shareholders. It is considered that the Company has a robust Investor Relations department who oversee such meetings and that there are sufficient processes in place for the issues and concerns of major shareholders to be communicated to all members of the Board such that it is not necessary for the Senior Independent Director to attend these meetings. He was of course willing to attend such meetings had the need arisen. The Board does not feel that this in any way impeded its good corporate governance and believes that the practice was in compliance with the main and supporting principles under section E of the Code regarding dialogue with shareholders. Further details of the Company’s relations with its shareholders can be found on page 82.
LeadershipThe Board of Directors The current Directors of the Company as at the date of this report are as follows:
Table of the Board of Directors
Name Designation Date of Appointment Date of most recent re-election
Charles Berry Chairman 1 March 2013 1 May 2014
Keith Cochrane Chief Executive 3 July 2006 1 May 2014
Alan Ferguson Non-Executive Director 13 December 2011 1 May 2014
Melanie Gee Non-Executive Director 4 May 2011 1 May 2014
Mary Jo Jacobi Non-Executive Director 1 January 2014 1 May 2014
Sir Jim McDonald Non-Executive Director 1 January 2015 –
Rick Menell Non-Executive Director 1 April 2009 1 May 2014
John Mogford Non-Executive Director 1 June 2008 1 May 2014
Jon Stanton Finance Director 19 April 2010 1 May 2014
Biographical information on the Board of Directors, including their relevant experience and significant appointments, can be found on pages 70 and 71. Their relevant skills and experiences are further detailed in the Board composition section below.
Sir Jim McDonald was appointed as a Non-Executive Director on 1 January 2015. Lord Robertson resigned as Senior Independent Director and as a Non-Executive Director with effect from 31 January 2015. Lord Robertson was succeeded by Rick Menell as Senior Independent Director.
The role and responsibilities of the BoardThe Board of Directors has a collective duty to promote the long term success of the Company for its shareholders. The Board provides leadership of the Company and sets the Group’s strategic aims. It ensures that the necessary resources are in place to achieve the agreed strategic priorities and provides guidance to senior management. In determining the long term strategy and objectives of the Group, the Board is mindful of its duties and responsibilities not just to shareholders but also to customers, employees and other stakeholders. The Board reviews management and financial performance and monitors the delivery of strategy and the achievement of business objectives. At all times, it works within a robust framework of internal controls and risk management. The Board both develops and promotes the collective vision of the Group’s purpose, culture, values and behaviours.
Board compositionDuring the period, the Board has comprised two Executive Directors, the Chairman and six Non-Executive Directors. During January 2015, the number of Non-Executive Directors rose to seven on the appointment of Sir Jim McDonald before returning to six following the resignation of Lord Robertson. There is a Company Secretary to the Board. More information on their respective positions and the division of their responsibilities is outlined below.
Chairman and Chief ExecutiveCharles Berry was appointed Chairman of the Board on 1 January 2014. The Chairman leads the Board and is responsible for ensuring conditions that allow for the effectiveness of individual Directors and the Board as a whole. The Chairman’s additional commitments are summarised on page 70 and he will step down as chairman of Drax Group plc at its AGM in April 2015. The independent Board evaluation carried out for 2014 confirmed that the Chairman is widely respected for his inclusive and highly professional approach to conducting meetings and overseeing the business of the Board generally. His leadership demonstrates the values and behaviours at the core of the Group.
Corporate Governance Report continued

Strategic Report Financial StatementsCorporate Governance
75The Weir Group PLC Annual Report and Financial Statements 2014
The Chairman, in consultation with the Chief Executive and the Company Secretary, sets the agenda for the Board’s meetings and ensures that there is sufficient time available for the discussion of all items, in particular strategic issues, whilst giving the appropriate weighting of time to their relative importance.
Keith Cochrane is the Chief Executive and is responsible for the day-to-day management of the Company. He provides leadership to the Group to successfully plan and execute the objectives and strategy agreed by the Board. The Chief Executive is supported in his role by the Group Executive and various management committees, known as ‘Excellence Committees’.
The roles of the Chairman and Chief Executive are separate, with each having clearly defined duties and responsibilities. Following Charles Berry’s appointment as Chairman in January 2014, the division of responsibilities of the Chairman and Chief Executive was reviewed and adopted by the Board in February 2014.
Non-Executive DirectorsThe Non-Executive Directors contribute independent challenge and rigour to the Board’s deliberations and assist in the development of the Company’s strategy. In addition, they are responsible for monitoring the performance of the Executive Directors against agreed goals and objectives. Their views are essential in overseeing the performance of the Company and ensuring the integrity of the financial information, controls and risk management processes. In order to carry out these functions appropriately, the Non-Executive Directors meet regularly with senior management and make periodic site visits. Senior managers are also regularly invited to Board meetings to make business presentations to the Board. As encouraged by the Code, the Non-Executive Directors (including the Chairman) also met during the year (in February 2014) without Executive Directors present.
Senior Independent DirectorRick Menell is the Senior Independent Director of the Company. He replaced Lord Robertson, who had held the role during 2014, following his resignation from the Board with effect from 31 January 2015. The Senior Independent Director works alongside the Chairman and is available to serve as an intermediary for the other Directors if necessary. He is also available to shareholders if direct contact with the Chairman, Chief Executive or other Executive Directors has failed to resolve the concerns of shareholders or for which such contact is inappropriate. As Senior Independent Director, he also leads the annual review of the performance of the Chairman.
Company SecretaryKeith Ruddock was appointed as Company Secretary in May 2012. He is secretary to the Board of Directors and to all of the Board Committees. He is also Group General Counsel and a member of the Group Executive and his biography is set out on page 69.
The Company Secretary advises the Board on any changes in legislation, governance codes or regulatory requirements. He reports to the Chairman on corporate governance matters and oversees, in parallel with the Chairman, the governance procedures of the Board. The Company Secretary has a responsibility to ensure that these Board procedures are adhered to and periodically reviews them with regards to best practice. The Company Secretary’s additional responsibilities include ensuring good information flows within the Board and its Committees and between senior management and Non-Executive Directors, as well as facilitating induction and assisting with professional development.
Board meetingsThe Board’s scheduled meetings are held in person or by telepresence videoconferencing. During 2014, there were eight scheduled meetings. Five additional meetings were also held in relation to proposals made to Metso Corporation. In October 2014, the Board meeting was held in Dubai. This was part of a Board visit to view both the old and new facilities of the Company’s operations in Dubai. More information on this can be found on page 80. In addition to the formal Board meetings, the Board maintains an open dialogue throughout the year and contact by telephone occurs whenever necessary.
The table below details the attendance at Board meetings of each of the Directors during their term of office for the 52 weeks to 2 January 2015.
Name Attendance
Charles Berry 13 of 13
Keith Cochrane 13 of 13
Alan Ferguson 13 of 13
Melanie Gee 13 of 13
Mary Jo Jacobi 13 of 13
Rick Menell 12 of 131
John Mogford 13 of 13
Lord Robertson 13 of 13
Jon Stanton 13 of 13
1. Rick Menell was unable to attend one of the Board meetings convened at short notice in connection with the Company’s approach to Metso Corporation, as he was travelling on a flight at the relevant time.
There were no Board meetings held between the date of Sir Jim McDonald’s appointment to the Board on 1 January 2015 and 2 January 2015.

76 The Weir Group PLC Annual Report and Financial Statements 2014
Strategy
Setting strategy targets.
Reviewing potential mergers and acquisitions.
Products and technology.
Risk
Risk Appetite Statement.
Group’s risk and internal control framework.
Crisis management.
Governance
Legal updates and new disclosure requirements.
External Board review.
Succession planning.
Finance
Oversight of the preparation and management of the financial statements.
Dividend policy.
Pensions.
Stakeholder engagement
AGM and other shareholder feedback.
Investor calls, meetings and roadshows.
Oversight of remuneration consultation process.
Safety
EHS Standards and Management System.
EHS Audit System.
Board
Group Executive
Board and Group Executive meeting locations for 2009-2014
Corporate Governance Report continued
Leadership (continued)Board meetings (continued)During the year, the Chairman, supported by the Chief Executive and Company Secretary, continued the practice of maintaining a rolling 12 month agenda for Board and Committee meetings. At each meeting, the Board receives reports from the Chief Executive and other members of the Group Executive, including information on safety, strategy, human resources, finance and legal. The Board also receives periodic updates from the Committee Chairmen, who in particular report to the Board on Committee meetings. Other standing items include reviewing the risk register and internal controls, strategy and succession planning.
The Board’s time during 2014 can be grouped into six key areas as outlined below. A portion of their time is also spent on administrative matters.
Board activities during 2014The Board receives presentations by members of the Weir Group senior management team and external advisors as required.
The annual timetable is discussed in May of the preceding year and circulated as soon as it is finalised, which ensures that the Chairman can be comfortable that each Director is able to devote the time and resources required to act as a Director during that period. The system for establishing agenda items means both the Chairman and the Board have the confidence that all required items are included at the most appropriate time of the year and there is sufficient time allocated for discussion by the Board, allowing the Directors to discharge their duties effectively.

Strategic Report Financial StatementsCorporate Governance
77The Weir Group PLC Annual Report and Financial Statements 2014
Audit Committee Remuneration Committee Nomination CommitteeGeneral Administration
Committee
Group Executive Committee
Risk Committee
Board and committee structure
Board Committees
Engineering Excellence Committee
Finance Excellence Committee
EHS Excellence Committee
IT Excellence Committee
HR Excellence Committee
Value Chain Excellence Committee
Chief Executive
Board of Directors
Management Committees
Matters Reserved for Approval by the BoardThe Board recognises that to ensure the long term success of the Company, certain specific matters should be reserved for the consideration and decision of the Board alone. Other matters may be delegated by the Board to its committees or executive management. Decisions specifically reserved for approval by the Board are formally recorded in a document entitled Matters Reserved for Approval by the Board, and include: – annual and interim accounts and financial statements; – dividend policy; – Board appointments; – Group strategy and the annual operating budget; – changes relating to the Group’s capital structure; – changes to the Group’s management and control structure; – major capital expenditure, acquisitions and disposals; – treasury policies; – risk management strategy; – Group corporate governance policy; and – environmental, health and safety and sustainability policies.
The matters reserved for approval by the Board are reviewed by the Board on an annual basis to ensure they remain appropriate and adhered to.
Board committees
The Board has established a number of committees to assist in the discharge of its responsibilities. The principal committees are the Nomination Committee, the Audit Committee and the Remuneration Committee. The responsibilities of these Board committees are set out in the individual Terms of Reference of each committee, which are available on the Company’s website. The roles and responsibilities of the committees, along with the activities undertaken during the period, are outlined in each of their respective reports found on pages 83 to 108. The Company Secretary acted as secretary to the committees in 2014. In 2015, the Deputy General Counsel will act as secretary to the Audit Committee.
Only committee members are entitled to attend meetings. However, other Directors may attend at any time, while professional advisors and members of the senior management team may attend when invited to do so.
When the need arises, separate ad hoc committees may be set up by the Board to consider specific issues.
General Administration CommitteeThe General Administration Committee is a sub-committee of the Board which comprises any two Directors of the Company, at least one of whom must be an Executive Director. The Committee is responsible to the Board as a whole and meets as required. The principal duties of the Committee include attending to administrative and procedural matters in relation to existing bank and finance facilities and the issue and allotment of shares under Group share plans. It also attends to other matters of a routine manner relating to the Company’s share capital, including the administration of unclaimed dividends and the Company’s Dividend Reinvestment Plan. The Committee has written Terms of Reference which are periodically reviewed to ensure their continuing appropriateness. Minutes of meetings of the General Administration Committee are made available to all Directors.

78 The Weir Group PLC Annual Report and Financial Statements 2014
Corporate Governance Report continued
Leadership (continued)Group ExecutiveThe Group Executive comprises the Chief Executive, the Finance Director, the Group General Counsel and Company Secretary, the three Divisional Managing Directors, the Director of Operations, Support & Development, the Director of Strategy & Corporate Affairs and the Director of Human Resources. Biographical details of the members of the Group Executive can be found on page 69. The Group Executive is chaired by the Chief Executive, Keith Cochrane.
In the 52 weeks ended 2 January 2015, the Group Executive met 12 times. The Group Executive is responsible for ensuring that each of the Group’s businesses is managed effectively and that the key performance indicators of the Group, as approved by the Board, are achieved. The Group Executive’s role includes the preparation of the Group budget for approval by the Board, management of business performance to achieve the Group budget, establishing and maintaining reporting systems which provide clear and consistent information on all aspects of business performance, managing and minimising corporate risk, and ensuring that the necessary mechanisms are in place to achieve effective inter-divisional coordination in areas such as purchasing, branding and career development planning. It also approves major items of capital expenditure within limits authorised by the Board.
Management committeesIn addition to the committees detailed above at page 77, there exist several management committees, known as Excellence Committees. These have been created to deal with specific areas and under their clearly defined remits they work across the Group promoting best practice and information sharing. In 2014, the Manufacturing Excellence Committee (a sub-committee of the Value Chain Excellence Committee) evolved into the Lean Enterprise Excellence Committee. This reflects the recognition and need to apply a lean philosophy throughout the value chain following the success of deploying the lean based Weir Production System to the factories throughout the Group.
The Executive Directors and members of the Group Executive are able to delegate their responsibilities to these committees and utilise the areas of expertise contained within them. The Excellence Committees report to the Group Executive and to the Board as required.
The composition of the various committees along with their accompanying terms of reference, the matters reserved for approval by the Board, and delegated authority matrices combine to create a clear authority matrix across the Group for timely and effective decision-making. This structure provides the Board with confidence that the appropriate decisions are being taken at the appropriate levels, and information flows both up and down reporting lines.
EffectivenessBoard skills and attributes
Skills and experience
IndependenceBanking
& finance Governance International Leadership Engineering Mining Oil and gas Power
Charles Berry1 x x x x x
Keith Cochrane x x x
Alan Ferguson x x x x x
Melanie Gee x x x x
Mary Jo Jacobi x x x x x
Sir Jim McDonald x x x x x
Rick Menell x x x x
John Mogford x x x
Lord Robertson x x x x
Jon Stanton x x
Note1. Charles Berry was considered independent on his appointment as Chairman in January 2014.
The Board considers that it has the right combination of skills, experience, independence and knowledge to be useful and effective in meeting the needs of the business. More than half of the Board are independent Non-Executive Directors. All the Non-Executive Directors are considered by the Board to be independent in character and judgement.
This combination of individuals and skills ensures that the Board is sufficiently balanced such that no individual or group of individuals can dominate decision-making and allows for an effective division of responsibilities within the Board and its committees. The positions of Chairman and Chief Executive are held separately. Each Director devotes sufficient time and attention as is necessary in order to perform their duties.
The Board is supplied in a timely manner with the appropriate information to enable it to discharge its duties and any further back-up papers and information are readily available to all Directors on request to the Company Secretary. The Chairman ensures that Non-Executive Directors are properly briefed on any issues arising at Board meetings and Non-Executive Directors have access to the Chairman at any time.

Strategic Report Financial StatementsCorporate Governance
79The Weir Group PLC Annual Report and Financial Statements 2014
Appointment and tenure
Name
Length of tenure at 2 January 2015 Date of next election or re-election1 year 2 years 3 years 4 years 5 years 6 years 7 years 8 years 9 years 10 years 11 years
Charles Berry 29 April 2015
Keith Cochrane 29 April 2015
Alan Ferguson 29 April 2015
Melanie Gee 29 April 2015
Mary Jo Jacobi 29 April 2015
Sir Jim McDonald 29 April 2015
Rick Menell 29 April 2015
John Mogford 29 April 2015
Lord Robertson –
Jon Stanton 29 April 2015
The Executive Directors have contracts of service with one year’s notice, whilst Non-Executive Directors’ appointments can be terminated at any time with six months’ notice. The letters of appointment of the Chairman and the Non-Executive Directors, which are available for inspection at the Company’s registered office, set out the required commitment to the Company. Further details can also be found in the Directors’ Remuneration Report.
In accordance with the Company’s Articles of Association and good practice, Sir Jim McDonald will resign and offer himself for election at the Company’s AGM on 29 April 2015. All other Directors on the Board at 2 January 2015, with the exception of Lord Robertson who resigned on 31 January 2015, will seek re-election at the Company’s AGM in compliance with the Code.
Induction and ongoing trainingWhen a new Director joins the Company, he or she is provided with information on the Group’s structure, operations, policies and other relevant documentation. New Directors are able to attend the Group’s senior management induction programme which provides an insight into the Group’s key processes and controls and includes presentations from the heads of departments located at the Group’s Head Office in Glasgow. Following her appointment as a Non-Executive Director in January 2014, Mary Jo Jacobi attended such an induction in April 2014. The induction process for Sir Jim McDonald has included introductory meetings with senior executives in the Company and planned visits to the Company’s facilities in Todmorden in the UK and Fort Worth in the USA, in addition to a formal briefing on legal and governance matters from the Company Secretary.
Directors are informed of relevant material changes to laws and regulations affecting the Group’s business and their duties as Directors. The Company Secretary advises the Board on governance matters and is available to all Directors for advice as required. In addition, the Board meets once a year or more at one of the Group’s operational sites, which includes presentations from key senior employees and the opportunity to meet employees across the global operations.
The Chairman regularly reviews and agrees with each Director their training and development needs, and additional induction and training is also available to new committee members as required.
During 2014, the Board received its annual training on competition law at the December Board meeting, which was provided by outside counsel, to coincide with the roll out of the Group’s new Competition Law Manual.
Directors and their other interestsUnder the Companies Act 2006, a director of a company must avoid a situation in which he or she has, or can have, a direct or indirect interest that conflicts, or may possibly conflict, with the interests of the company. The Company has a formal procedure in place to manage the disclosure, consideration and, if appropriate, the authorisation of any such possible conflict. Each Director is aware of the requirement to notify the Board, via the Company Secretary, as soon as they become aware of any possible future conflict or a material change to an existing authorisation. Upon receipt of any such notification, the Board, in accordance with the Company’s Articles of Association, will consider the situation before deciding whether to approve the perceived conflict. At the outset of every Board meeting, the Chairman also checks that no new conflicts have arisen. Only Directors who have no interest in the matter being considered are able to take the relevant decision and Directors are able to impose limits or conditions when giving authorisation if they think this is appropriate. The Director in question will then be notified of the outcome. Overall, the Board is satisfied that there are appropriate procedures in place to deal with conflicts of interest and that they have operated effectively.
None of the Non-Executive Directors has any material business or other relationship with the Company or its management. Although Sir Jim McDonald is the Principal and Vice Chancellor of the University of Strathclyde, he has no direct involvement on a day-to-day basis in relation to the Weir Advanced Research Centre (‘WARC’) which is operated in conjunction with the University of Strathclyde. In particular, he will offer to recuse himself from any discussions in relation to the relationship between the Group and the University of Strathclyde, whether in relation to WARC or otherwise.
Details of the Directors’ service contracts, emoluments, the interests of the Directors in the share capital of the Company and options to subscribe for shares in the Company are disclosed in the Directors’ Remuneration Report.

80 The Weir Group PLC Annual Report and Financial Statements 2014
Corporate Governance Report continued
Effectiveness (continued)Board evaluationFollowing the internal effectiveness review undertaken in 2013, the Company Secretary implemented a number of logistical suggestions from Directors in relation to the way in which Board and Committee papers were distributed and to enable the Board to receive market and media information on a more regular basis. In addition, specific comments received on aspects of the operation of the Nomination and Audit Committees were addressed during the course of the year.
An external review of the Board and its Committees in 2014 was undertaken by Independent Board Review, a division of Independent Audit Limited. The most recent independent review was carried out by other external consultants in 2011, and Independent Audit Limited had undertaken the previous review of Board effectiveness in 2010. Otherwise, Independent Audit Limited has no connections with the Company.
Board site visit to Dubai In October 2014, the Board of Directors visited Weir’s Oil & Gas Services facilities in Dubai.
The Middle East was chosen for the visit because it is one of the fastest growing areas of the Group’s business and a key region for the success of the Oil & Gas Division.
Given the complexities of the Middle East, it was felt important for the Board to gain direct experience of the environment, and in particular to hear directly from local customers and other stakeholders about the opportunities, issues and challenges of operating in the region.
A reflection of the Group’s success in the Middle East is the construction of a brand new facility and regional head office in Dubai. The Group has been active in the region for many years, and throughout its presence there has recognised that establishing strong relationships with local partners has made a key contribution to its success.
The current facility which was visited by the Board has been in use since 1982. Due to the expanding requirements of the business, it was determined in 2013 that a new, purpose built facility should be created. The Board also visited this newly constructed facility and Charles Berry formally opened the site in the presence of WESCO Abu Dhabi joint venture partner, Mr Faraj Ali Bin Hamoodah, Mr Samir Al Gharbi, Ms Salma Hareby, CEO of Jebel Ali Free Zone (‘Jafza’), and Mr Ibrahim Al Janahi, Deputy CEO and COO of Jafza. The Board undertook a tour of the new facility, which is due to become fully operational in 2015.
Following the tour, Vikas Handa, the Managing Director of Weir Oil & Gas Services Middle East, presented an overview on strategy for the Oil & Gas Division in the Europe, Middle East
and Africa (EMEA) region. In addition, Paul Coppinger, now Oil & Gas Divisional Managing Director, provided a presentation on the pressure pumping business in the Asia Pacific and EMEA regions. The scheduled Board meeting was held later on that day in the new facility, which included an Oil & Gas Division strategy review.
The following day, the Board received a presentation on the region from a senior representative of Shell in Iraq, and then met with the joint venture partner for its Saudi Arabian business. In both cases, the presenters provided invaluable insights into the current political, security and economic environment in the region, which was extremely helpful to the Board.
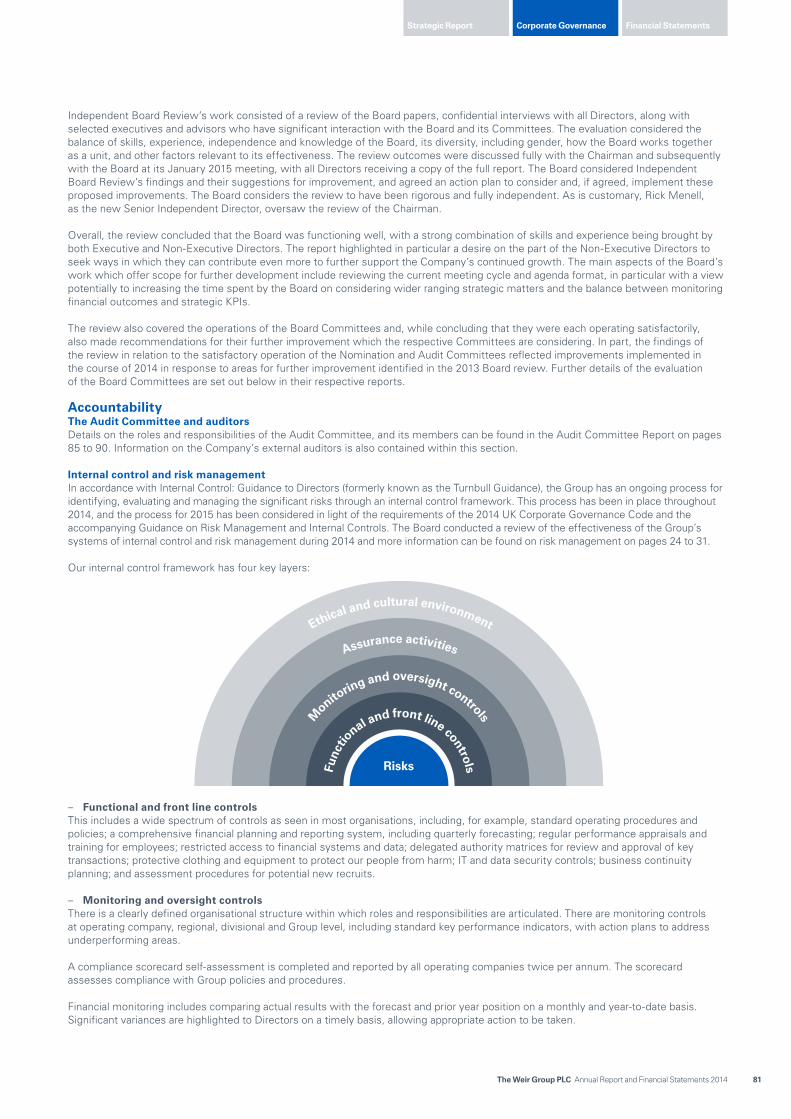
Strategic Report Financial StatementsCorporate Governance
81The Weir Group PLC Annual Report and Financial Statements 2014
Independent Board Review’s work consisted of a review of the Board papers, confidential interviews with all Directors, along with selected executives and advisors who have significant interaction with the Board and its Committees. The evaluation considered the balance of skills, experience, independence and knowledge of the Board, its diversity, including gender, how the Board works together as a unit, and other factors relevant to its effectiveness. The review outcomes were discussed fully with the Chairman and subsequently with the Board at its January 2015 meeting, with all Directors receiving a copy of the full report. The Board considered Independent Board Review’s findings and their suggestions for improvement, and agreed an action plan to consider and, if agreed, implement these proposed improvements. The Board considers the review to have been rigorous and fully independent. As is customary, Rick Menell, as the new Senior Independent Director, oversaw the review of the Chairman.
Overall, the review concluded that the Board was functioning well, with a strong combination of skills and experience being brought by both Executive and Non-Executive Directors. The report highlighted in particular a desire on the part of the Non-Executive Directors to seek ways in which they can contribute even more to further support the Company’s continued growth. The main aspects of the Board’s work which offer scope for further development include reviewing the current meeting cycle and agenda format, in particular with a view potentially to increasing the time spent by the Board on considering wider ranging strategic matters and the balance between monitoring financial outcomes and strategic KPIs.
The review also covered the operations of the Board Committees and, while concluding that they were each operating satisfactorily, also made recommendations for their further improvement which the respective Committees are considering. In part, the findings of the review in relation to the satisfactory operation of the Nomination and Audit Committees reflected improvements implemented in the course of 2014 in response to areas for further improvement identified in the 2013 Board review. Further details of the evaluation of the Board Committees are set out below in their respective reports.
AccountabilityThe Audit Committee and auditorsDetails on the roles and responsibilities of the Audit Committee, and its members can be found in the Audit Committee Report on pages 85 to 90. Information on the Company’s external auditors is also contained within this section.
Internal control and risk managementIn accordance with Internal Control: Guidance to Directors (formerly known as the Turnbull Guidance), the Group has an ongoing process for identifying, evaluating and managing the significant risks through an internal control framework. This process has been in place throughout 2014, and the process for 2015 has been considered in light of the requirements of the 2014 UK Corporate Governance Code and the accompanying Guidance on Risk Management and Internal Controls. The Board conducted a review of the effectiveness of the Group’s systems of internal control and risk management during 2014 and more information can be found on risk management on pages 24 to 31.
Our internal control framework has four key layers:
Func
tio
nal and front line controlsM
onitoring and oversight controls
Assurance activities
Ethical and cultural environment
Risks
– Functional and front line controlsThis includes a wide spectrum of controls as seen in most organisations, including, for example, standard operating procedures and policies; a comprehensive financial planning and reporting system, including quarterly forecasting; regular performance appraisals and training for employees; restricted access to financial systems and data; delegated authority matrices for review and approval of key transactions; protective clothing and equipment to protect our people from harm; IT and data security controls; business continuity planning; and assessment procedures for potential new recruits.
– Monitoring and oversight controlsThere is a clearly defined organisational structure within which roles and responsibilities are articulated. There are monitoring controls at operating company, regional, divisional and Group level, including standard key performance indicators, with action plans to address underperforming areas.
A compliance scorecard self-assessment is completed and reported by all operating companies twice per annum. The scorecard assesses compliance with Group policies and procedures.
Financial monitoring includes comparing actual results with the forecast and prior year position on a monthly and year-to-date basis. Significant variances are highlighted to Directors on a timely basis, allowing appropriate action to be taken.

82 The Weir Group PLC Annual Report and Financial Statements 2014
Corporate Governance Report continued
Accountability (continued)Internal control and risk management (continued) – Assurance activities
We obtain a wide range of assurance to provide comfort to management and the Board that our controls are providing adequate protection from risk and are operating as we would expect. Following the Board and Committee structure set out on page 77, various internal and external sources of assurance report to the Board and management. These are principally external audit, internal audit, EHS audits, intellectual property audits, engineering audits, procurement audits, IT audits, and production system lean audits. The legal function introduced a legal audit programme in 2014.
The various audit teams plan their activities on a risk basis, ensuring resources are directed at the areas of greatest need. Issues and recommendations to enhance controls are reported to management to ensure timely action can be taken, with oversight provided from the relevant governance committees, including the Audit Committee and the Excellence Committees.
– Ethical and cultural environmentWe are committed to doing business at all times in an ethical and transparent manner. This is supported by the Weir values which are the core behaviours we expect our people to live by in their working lives. The Weir Code of Conduct, updated and reissued during the year, also contributes to our culture, providing a high benchmark by which we expect our business to be conducted. Any examples of unethical behaviour are dealt with robustly and promptly. The Ethics section within the Sustainability Review on page 66 provides more details on the Group’s activities to promote ethical behaviour.
The Group’s internal control procedures described on page 89 of the Audit Committee Report do not cover joint venture interests. We have Board representation on each of our joint venture companies where separate, albeit similar, internal control frameworks have been adopted.
RemunerationDetails of the Company’s Remuneration Committee, including its roles, responsibilities and members are contained within the Remuneration Report on pages 91 to 108. The Remuneration Report also details the Company’s approved remuneration policy table and the remuneration received by Directors in 2014.
Relations with shareholdersThe Board recognises the importance of establishing and maintaining good relationships with all of the Company’s shareholders. The Company’s investor relations programme includes formal presentations of full year and interim results and meetings with individual investors. Through this programme, the Company has directly engaged with 478 investors in 2014 either face-to-face or via telephone or video-conferencing. Other areas where the Company engages with shareholders include attendance at investor conferences held by the financial community and roadshows and Investor Relations events held by the Company, of which there were 23 during the year held in Canada, Denmark, Finland, Germany, The Netherlands, Sweden, the UK, Singapore and the USA.
The Company holds an annual capital markets day, which in 2014 was held in London in June. This event allows shareholders to meet the broader management team and to gain a more in-depth understanding of one business or one aspect of the business. The capital markets day this year focused on progress in our Power & Industrial Division and initiatives relating to procurement and supplier development.
During the period under review, the Chief Executive, Finance Director, Chairman and Remuneration Committee Chairman have met with analysts and institutional shareholders to keep them informed of significant developments and report to the Board accordingly on the views of these stakeholders. Each of the other Non-Executive Directors is also offered the opportunity to attend meetings with major shareholders and would do so if requested by any major shareholder.
Our brokers and public relation advisors undertake investor roadshow feedback which is shared with the Board, and the Group appointed Goldman Sachs International in September 2014 as its joint brokers, alongside UBS. The Company Secretary is also charged with bringing to the attention of the Board any material matters of concern raised by the Company’s shareholders.
The primary means of communicating with the Company’s shareholders are the Weir Group’s Annual Report and Financial Statements and the Interim Report. Both are available on the Company’s website and the Annual Report is posted out to all shareholders who elect to receive it. Copies are available upon request to the Company Secretary.
The Board recognises the importance of the internet as a means of communicating widely, quickly and cost-effectively and a Group website is maintained to facilitate communications with shareholders. As well as the Interim and Annual Report, the website contains information on the business of the Company and corporate governance, all Group press releases and Company news, key dates in the financial calendar and other important shareholder information. The terms of reference for the Audit, Nomination and Remuneration Committees can also be found on the website.
The Board is committed to the constructive use of the Annual General Meeting as a forum to meet with shareholders and to hear their views and answer their questions about the Group and its business. The 2015 AGM is to be held on Wednesday 29 April 2015 at the Radisson Blu Hotel in Glasgow. Together with the rest of the Board, the Chairmen of the Remuneration, Nomination and Audit Committees will be available to answer questions relevant to the work of the Board and the Committees. It is the Company’s practice to propose separate resolutions on each substantive issue at the AGM. Details on proxy voting will be contained in the proxy form and the Notice of Meeting sent to shareholders and the Chairman will also advise shareholders at the meeting. Electronic proxy voting is available and details of this are also included in the Notice of Meeting.

Strategic Report Financial StatementsCorporate Governance
83The Weir Group PLC Annual Report and Financial Statements 2014
Nomination Committee Report
Nomination Committee Report
Charles BerryChairman of the Nomination Committee
The Nomination Committee consists of the Chairman, the Chief Executive and two Non-Executive Directors. John Mogford joined the Committee at the start of 2014, and Lord Robertson retired from the Committee on 31 January 2015. The Committee is chaired by Charles Berry. Senior members of management and advisors are invited to attend meetings as appropriate.
There were three scheduled meetings and two additional meetings held during the year. Details of the attendance of the members of the Committee for the 52 weeks to 2 January 2015 are contained in the table above.
The Chairman does not chair the meeting when the matters under consideration relate to him or his position. Similarly, should a matter under discussion relate to any of the other Committee members, they would excuse themselves from the meeting.
Committee’s roleThe Committee has responsibility for considering the size, structure and composition of the Board of the Company, for reviewing senior management succession plans, retirements and appointments of additional and replacement Directors and making appropriate recommendations so as to maintain an appropriate balance of skills and experience on the Board. The terms of reference of the Committee are available on the Company’s website.
The Committee was evaluated as part of the 2014 Board evaluation process, conducted externally by Independent Board Review. In particular, the process around Sir Jim McDonald’s appointment was highlighted as being smoothly handled, as well as the continued progress towards enhanced transparency of decision-making.
Current members
Charles Berry (Chairman)
Keith Cochrane
Rick Menell
John Mogford1
Name Attendance
Charles Berry 5 of 5
Keith Cochrane 5 of 5
Rick Menell 5 of 5
John Mogford 4 of 4
Lord Robertson2 5 of 5
Notes1. John Mogford was appointed to the Committee on 21 January 2014.2. Lord Robertson retired from the Committee on 31 January 2015.

84 The Weir Group PLC Annual Report and Financial Statements 2014
IndependenceThe Nomination Committee reviewed and confirmed the independence of all Non-Executive Directors and in particular Lord Robertson who, before his retirement in January 2015, had been a Non-Executive Director of the Company for a period of 11 years. In accordance with the Code, a rigorous review was undertaken which examined his continued contribution to the Board and its Committees and his external interests and roles. It was concluded that the Board still considered all of its Non-Executive Directors, including Lord Robertson prior to his retirement, to be independent in character and judgement. The continued service as directors for both Rick Menell and John Mogford was specifically reviewed, in light of their respective lengths of service, as noted above at page 79.
Processes are in place to identify any business relationships held by Non-Executive Directors or additional directorships or significant links with other directors through involvement in other companies or bodies which may be of relevance in determining the independence of a Non-Executive Director. The Nomination Committee is satisfied that all Non-Executive Directors continue to be independent in character and judgement and that there are no relationships or circumstances which are likely to affect, or could appear to affect, the Directors’ judgement.
Board appointmentsThe Committee has established a process for Board appointments that it considers to be formal, rigorous and transparent and involves the use of external executive recruitment agencies. This process includes drawing up a description of the role and capabilities required for the particular appointment, together with a review of the skills, knowledge and experience of the existing Directors. The existing balance of the Board and the time commitment required are also taken into consideration when assessing candidates.
A formal search process was undertaken in 2014 to recruit a new Non-Executive Director to succeed Lord Robertson. The Company engaged an external search consultancy, The Inzito Partnership, to identify a successor. The Inzito Partnership has no other connection with the Company. A sub-committee was formed to produce a short list of candidates from the long list produced by the Inzito Partnership and the Committee recommended the appointment of Sir Jim McDonald to the Board.
Succession planningThe Committee continued to give significant meeting time and focus to senior executive succession planning, identifying the talent pool for potential candidates and succession planning within the Group. During the year, the Director of Human Resources presented a review of senior executive succession planning, containing details of ongoing or proposed talent development, the methods for identifying and cultivating potential internal candidates, and the balance of internal and external recruiting for the most senior positions. Attention and consideration was given in 2014 to developing a longer-term succession pool and establishing development roles to provide additional experience and opportunities for high-potential talent. The Committee also spends time on succession planning for the various Board level roles.
Boardroom diversityThe considerations to be taken into account in each appointment to the Board are stipulated in the terms of reference of the Nomination Committee which are available on the Company’s website. Specifically, the Nomination Committee must ‘consider candidates on merit and against objective criteria, and with due regard for the benefits of diversity on the Board, including gender’ in identifying and recommending candidates. The Nomination Committee recommends appointments to the Board based on the existing balance of skills, knowledge and experience on the Board, on the merits and capabilities of the nominee and on the time they are able to devote to the role in order to promote the success of the Company.
The Board acknowledges the benefits a diverse pool of talent can bring to a boardroom. Among other things, a diverse board encompasses diversity of experience, social background, education and training, life skills and personal attributes, as well as differences in age, nationality, race and gender. The Board approved a policy with respect to Board diversity at its meeting in January 2014 and the Nomination Committee has operated under and reported against this policy from this date.
The recent focus on Board diversity has centred on gender and the Board aspires to maintain a significant level of female representation on the Board. At the end of the financial year, two of the ten Board members of the Company were female (20%). Following the resignation of Lord Robertson at the end of January 2015, this percentage increased to 22%. The Board will continue to consider its policy with respect to Board diversity on future appointments but will not place a higher regard for one form of diversity over any other. The appropriate composition of the Board as a whole with regard to the size and activity of the Company will be taken into account at all times.
Charles BerryOn behalf of the Nomination Committee25 February 2015
Nomination Committee Report continued

Strategic Report Financial StatementsCorporate Governance
85The Weir Group PLC Annual Report and Financial Statements 2014
Report of the Audit Committee
Report of the Audit Committee
Alan FergusonChairman of the Audit Committee
IntroductionAs Chairman of the Audit Committee, I am pleased to present our report to shareholders in accordance with the UK Corporate Governance Code (the ‘Code’). Through this report, I hope we will demonstrate our commitment, as an Audit Committee, to our responsibilities under the Code and how we have discharged them effectively during the year. The revised Code issued by the Financial Reporting Council in September 2014, effective for accounting periods starting on or after 1 October 2014, will be reflected in next year’s report.
Key objectiveOur key objective is to provide effective governance over the appropriateness of the Group’s financial reporting. We do this by focusing on, amongst other things: – the adequacy of accounting policies, practices and disclosures; – the performance of both the internal audit function and the external auditor; and – oversight of the Group’s systems of internal control, framework for identification and management of business risks and related
compliance activities.
MembershipI chair the Committee with the current members being Melanie Gee, John Mogford and Sir Jim McDonald, all of whom are independent Non-Executive Directors. Rick Menell was appointed to the Committee on 21 January 2014 and resigned from the Committee on 1 January 2015. Jim was appointed to the Committee coincident with his appointment to the Board on 1 January 2015. Both Melanie and John have been members of the Committee for the full year and to the date of this report.
Each of the Committee members has, through their other business activities, significant experience in financial matters and has been selected with the aim of providing the wide range of financial and commercial expertise necessary to fulfil our responsibilities. Summary biographies have been presented on pages 70 and 71.
ResponsibilitiesAs a Committee, we are responsible for: – reviewing the announcements of the Group’s financial results, including the Interim Report and Annual Report and Financial
Statements, and monitoring compliance with relevant statutory and Listing Rules requirements; – reporting to the Board on the appropriateness of the Group’s accounting policies and practices, including critical accounting policies
and those judgements and estimates with the most significant effect on the amounts recognised in the financial statements; – advising the Board on whether the Committee believes that the processes underlying the compilation of the Annual Report and Financial
Statements are robust and supportive of the assertion reached by the Board that the document, taken as a whole, is fair, balanced and understandable and provides the information necessary for shareholders to assess the Group’s performance, business model and strategy;
– overseeing the relationship with the external auditor, covering their appointment, audit quality and effectiveness, independence and fees; – reviewing and approving the remit of the Internal Audit function, ensuring its independence and that there are the necessary resources
and access to information available in order for it to fulfil its mandate; – reviewing the effectiveness of the Group’s systems for financial control, financial reporting and risk management, incorporating a
review of reports on any significant frauds, misappropriation of assets or unethical behaviour;

86 The Weir Group PLC Annual Report and Financial Statements 2014
Responsibilities (continued) – oversight of the Anti-Bribery & Corruption (AB&C) programme and providing input to the Board on ethics compliance; and – reviewing treasury policy including foreign exchange exposure.
The terms of reference can be found on the Group’s website, weir.co.uk.
Committee evaluationThe Committee was evaluated as part of the 2014 Board evaluation process, conducted externally by Independent Board Review. It concluded that the performance of the Committee has continued to improve over recent years, with good levels of challenge on key issues, persistence and a comprehensive annual agenda. The Committee receives well-presented papers and good reports from management and internal audit. However, there are always areas where improvements can be made, for example risk assurance will be an area of focus in 2015; we can do more here and the revised Code places more responsibilities on boards and audit committees in this regard.
MeetingsWe met four times during the period. Each Committee meeting takes place prior to a Board meeting, during which I provide a report on our activities.
There is at least one meeting each year when we meet with each of the Head of Internal Audit and the external auditors separately, without any executive management present. This provides us with the opportunity for any issues of concern to be raised by, or with, the auditors.
We have the ability to call on Group employees to assist in our work and to obtain any information required from Executive Directors in order to carry out our roles and duties. We are also able to obtain outside legal or independent professional advice if required.
The table below details the Board members and members of senior management who were invited to attend meetings as appropriate during the calendar year. In addition, Ernst & Young LLP (EY) attended the meetings as auditors to the Group by invitation.
Audit Committee attendees
Charles Berry Chairman Attends by invitation
Keith Cochrane Chief Executive Attends by invitation
Jon Stanton Finance Director Attends by invitation
Keith Ruddock Group General Counsel & Company Secretary Attends as secretary to the Committee
Christopher Morgan Deputy General Counsel Attends as nominee of Keith Ruddock (from 18/2/15)
Lindsay Dixon Group Financial Controller Attends by invitation
Sarah Caldwell Head of Internal Audit (to 10/2/14) Attended by invitation
Brian Gibson Head of Internal Audit (from 10/2/14) Attends by invitation
The Committee members’ attendance at the meetings held during the calendar year is summarised in the table below.
Current members Name Attendance
Alan Ferguson (Chairman) Alan Ferguson 4 of 4
Melanie Gee Melanie Gee 4 of 4
John Mogford John Mogford 4 of 4
Sir Jim McDonald1 Rick Menell 4 of 4
Note1. Sir Jim McDonald joined the Committee on 1 January 2015 and has attended both meetings held since that date.
Between the end of the calendar year and the date of this report, there were two meetings of the Audit Committee, both of which were attended by all members of the Committee during that period.
Main activities Over the course of the period since the last Annual Report, our work was focused in the following areas:(i) financial reporting;(ii) internal control and risk management; (iii) internal audit; and(iv) external audit.
Report of the Audit Committee continued

Strategic Report Financial StatementsCorporate Governance
87The Weir Group PLC Annual Report and Financial Statements 2014
The following sections provide more detail on our specific items of focus under each of these headings, explaining the work we, as a Committee, have undertaken and the results of that work.
(i) Financial reportingOur principal responsibility in this area is the review and challenge, where necessary, of the actions and judgements of management in relation to the half year and annual financial statements before submission to the Board, paying particular attention to: – critical accounting policies and practices, and any changes therein; – decisions requiring judgements and estimates with the most significant effect or where there has been discussion with the
external auditor; – the existence of any adjustments resulting from the audit; – the clarity of the disclosures and compliance with accounting standards and relevant financial and governance reporting requirements; and – the processes surrounding the compilation of the annual report and financial statements with regard to fair, balanced and understandable.
We received formal reports from the Finance Director and the external auditor, summarising the main discussion points for both the half year and full year reporting and explored these in detail at our meetings in January, February and July.
The significant financial reporting issues discussed in the current year are summarised below.
Current period matters(1) Accounting for the acquisition of Trio Engineered Products (‘Trio’) – note 13The specific items we have discussed and reviewed with management and the external auditors, EY, in relation to the £146m acquisition of Trio were: (a) the Purchase Price Allocation (PPA) exercise to attribute provisional fair values to separately identifiable intangible assets and the related accounting for deferred tax; (b) the assessment of provisional acquisition fair values of other assets and liabilities, specifically property, plant & equipment, inventory and provisions; and (c) compliance of the disclosures in the financial statements with IFRS 3, ‘Business Combinations’.
Management engaged with an independent external advisor to complete the PPA exercise and reported a summary of the underpinning assumptions and related results to us. We reviewed that summary and also compared the assumptions used to those for other recent acquisitions where appropriate. The accounting for deferred tax has included technical input from the Group Head of Tax. We examined the nature and extent of provisional fair value adjustments to other assets and liabilities noting a rigorous process was being undertaken and would be finalised, as required by IFRS 3, in 2015. Finally, we challenged management on the completeness of the related disclosures and satisfied ourselves that they were complete, accurate, understandable and compliant with IFRS 3.
(2) Exceptional items – Group-wide efficiency review – note 5The Group announced in November 2014 that it had undertaken a Group-wide review in the third quarter to identify opportunities to reduce costs, increase customer responsiveness and efficiency while aligning resources globally to capture end market opportunities. This programme was extended towards the end of the fourth quarter in response to the very significant decline in the oil price. The financial impact of the initiatives underpinning the programme is a cost in 2014 of £49m, which has been reported as exceptional on the face of the Income Statement. This figure comprises asset impairments of £19m and reorganisation costs (which have or will result in a cash out flow for the Group) of £30m. Further detail in relation to the initiatives is provided in the Financial Review on page 46.
As well as being party to discussions at Board level on this subject, the Audit Committee has received detailed reporting from the Finance Director covering the following aspects: (i) costs by initiative, by division; (ii) accounting treatment adopted in relation to recognition of provisions and impairments; and (iii) disclosure of the amounts and related narrative reporting. The Committee has probed management to understand and confirm that the requirements of IAS 37 ‘Provisions, contingent liabilities and contingent assets’ have been met in terms of recognising a provision at the end of the year and received reporting from EY that confirms management’s treatment as appropriate. Furthermore, we considered the nature of these costs in light of the Group’s accounting policy for exceptional items. The Committee agrees with the accounting treatment and disclosure of these items in the 2014 Annual Report.
(3) Exceptional items – impairment of intangible assets – notes 5 and 14At least once every year, as required, management undertakes a detailed, formal impairment review of goodwill and other intangible assets and related reporting is provided to the Audit Committee. The most significant judgements are in setting the assumptions underpinning the calculation of the value in use of the Cash Generating Units (CGUs), specifically the achievability of the long-term business plan and macroeconomic assumptions underlying the valuation process. In the current year, and as a direct result of the recent very significant drop in the oil price, specific focus has been given to the basis of the assumptions underpinning the business plans of the Pressure Control and Pressure Pumping CGUs. In addition, consideration has been given to the long term growth rates and discount rates used in the cash flow models for all the CGUs. Business plans and budgets were Board approved and underpin the cash flow forecasts.
Specifically in relation to Pressure Control, we have discussed the cash flow forecasts underpinning the impairment test with management to understand the main assumptions around macroeconomic factors, volume/price effect and any strategic initiatives. We agreed that the assumption of the current oil price of around US$50 a barrel, and consequent activity levels, enduring for the next two years with a measured return to more ‘normal’ levels thereafter is the most appropriate one given what we know today. On that basis, we agree with the best estimate impairment charge of £160m of the Pressure Control CGU and concur with its allocation against goodwill.
With regard to Pressure Pumping, this business is more mature and had significant levels of headroom between net asset value and discounted cash flows going into the current market downturn. Management have included in their reporting to us the stress test scenarios that have been applied and we agreed, following a detailed review, that no impairment charge is required. Although the Weir Gabbioneta CGU is an Oil & Gas business, its focus is on downstream operations and so is not expected to be as adversely impacted by the current market downturn. However a sensitivity analysis has been undertaken by management and we agreed that no impairment charge is required.
Finally, we have reviewed the disclosures in the financial statements and agree with the reporting of the impairment charge as an exceptional item and the related narrative provided in note 14.

88 The Weir Group PLC Annual Report and Financial Statements 2014
Report of the Audit Committee continued
Main activities (continued)(i) Financial reporting (continued)Current period matters (continued)(4) Contingent liability – Philippines Gold Processing & Refining Corporation – note 27A claim has been made by Philippines Gold Processing & Refining Corporation against Weir Services Australia Pty Limited (WSA), a subsidiary of the Company as disclosed in note 27.
In relation to this claim, the Group has engaged external legal advisors to support and advise throughout the legal proceedings. These external legal advisors have provided a letter to the Audit Committee setting out the current status of the claim and discussions have been held with both management and EY with regard to the accounting treatment applied. On the basis of the external advice and these discussions, the Committee agrees that the disclosure of a contingent liability is appropriate given the significant uncertainty surrounding the outcome of the claim at the balance sheet date and at the date of this report.
Recurring agenda items(1) Accounting for pensions – note 24We have examined these disclosures and we are satisfied they are complete and accurate. In reaching this conclusion, we have challenged management on the key assumptions used underpinning the valuation, taking assurance from the fact that external advice is taken by them. During the current year, we gave specific consideration to the additional disclosure provided by management summarising the most recent actuarial funding valuation deficits under the two main UK plans as well as the agreed future contributions under the respective schedules of contributions. We consider that these disclosures enable users of the financial statements to better understand the risk and impact of the agreed future contributions on the Group.
(2) Tax charge and provisioning – note 7The Audit Committee receives a detailed report from the Finance Director every six months, which covers the following key areas: (i) status of on-going enquiries and tax audits with local tax authorities; (ii) the Group’s effective tax rate for the current year; and (iii) the level of provisioning for known and potential liabilities, including significant movements on the prior period. In addition, the Committee takes comfort from the presentation to the main Board on tax strategy and risk, given by the Group Head of Tax, every year. A summary of the Group’s tax policy is provided in the Financial Review on page 48. Based on the work we have undertaken in the current year, we are satisfied that the position presented in these financial statements is reasonable and understandable.
(3) Accounting for provisions – note 22Total provisions on the Group Balance Sheet are £113m (2013: £55m) at the end of the period with the breakdown by category presented in note 22. The increase on 2013 is a direct result of two factors. Firstly the recognition of the provision in relation to obligations that existed at the balance sheet date as part of the Group-wide efficiency review (£22m), which will result in cash outflows over 2015 and, secondly, the recognition of a provision for US asbestos-related claims (£28m).
As explained in detail in the Financial Review on page 49, in light of the recent increase in the US of asbestos-related claims, a review was completed by the Group to assess the adequacy of its insurance policies to meet future settlement and defence costs. The outcome of this review was the recognition of a provision and equivalent receivable for insurance proceeds for £28m, the latter reported within ‘other receivables’ (note 17).
In addition to receiving Board reporting on this matter, we have challenged management on the assumptions underpinning the liability assessment. We agree that, given the inherent uncertainty associated with estimating future costs in respect of asbestos-related diseases, the current approach is appropriate. Furthermore, we agree that the matched receivable representing the insurance cover available is appropriate.
With regard to provisions in overall terms, we have examined the other key movements between the opening and closing provision balances and challenged management on the commercial drivers which caused them. We have also examined, through discussion and updates provided by the Group General Counsel (where it is relevant to do so based on the nature of the provision), the appropriateness of the closing positions. Nothing arose from our work that gave the Committee any concern.
(4) Valuation of inventory – note 16In the prior year, we reported on our work in this area as it related to the excess capacity remaining in certain pressure pumping equipment sectors within the North American gas drilling market as a result of the shift to oil and liquids rich shale formations in Q1 2012 and the related impact on customer activity. We received an update from management in the current year on this inventory and also considered the implications for inventory valuation of the recent sharp decline in oil price, particularly in light of the increased activity that had been generated in those businesses over the majority of 2014. Based on the information provided in the areas of inventory reduction initiatives, provisioning and forward purchase commitments, we concluded that management action had been effective and that the level of provisioning was appropriate.
Fair, balanced and understandableThe Audit Committee has reviewed the contents of this year’s annual report and financial statements and the process that has been followed in the preparation of the document. With regard to the latter, the Committee received a report from management summarising the detailed approach that had been taken which covered, but was not limited to, the following: – involvement of a cross section of management across the organisation, including the Group Executive, Group Communications,
Group Finance (including Group Tax and Group Treasury) and Company Secretariat; – input and advice from appropriate external advisers, including the Company’s brokers and PR agency; – use of available disclosure checklists for both Corporate Governance and financial statement reporting; – regular research to identify emerging practice and guidance from relevant regulatory bodies, for example the Financial Reporting Lab; – regular weekly meetings of the Disclosure Committee (from December to February inclusive), which comprises the key contributors
to the document, during which specific consideration was given to the fair, balanced and understandable assertion; and – use of two cold readers; one an employee and member of the Senior Management Group and the other an external, independent proof reader.
The successful completion of this work has been reported to the Board.

Strategic Report Financial StatementsCorporate Governance
89The Weir Group PLC Annual Report and Financial Statements 2014
(ii) Internal control and risk managementDuring the year, we reviewed the process by which the Group evaluated its internal control environment. Our work in this area was supported by reporting from the Head of Internal Audit on the results of the programme of audit visits undertaken; the overall assessment of the internal control environment; and the incidence of any significant frauds or any fraud that involved management or employees with a significant role in internal controls.
The Committee also receives regular reporting on the Group’s compliance related activities from the Group General Counsel and Company Secretary and Head of Internal Audit. In addition, reporting, either verbal or written, from senior management covering any investigations into known or suspected fraudulent activities, including assertions of such via the Group’s whistleblowing arrangements, is reviewed.
Since the last Annual Report and Financial Statements, there have been presentations from two of the three Divisional Finance Directors (DFDs) on the divisional risk dashboards, the significant findings from the internal audit visits and the Compliance Scorecard process over the last 12 months, as well as an overview of their divisional finance teams.
The Compliance Scorecard is a control mechanism whereby each operating company undertakes a self-assessment every six months of their compliance with Group policies and procedures, including key internal controls across a range of categories including finance, Anti-Bribery & Corruption, tax, treasury, Trade & Customs, HR, IT and legal. As far as the elements relating to finance are concerned, these cover (but are not limited to) management accounts and financial reporting, balance sheet controls, employee costs and other financial policies. The scorecard for the second half of the year was enhanced through the addition of new questions in relation to the management of remote locations and treasury operations.
Operating companies are required to gather evidence and undertake sample testing to validate their self-assessment responses. Internal Audit then has responsibility for confirming the self-assessment responses during planned visits. Any significant variances are reported to local, divisional and Group management. Any companies reporting lower levels of compliance are required to prepare improvement plans to demonstrate how they will improve over a reasonable period of time. The overall compliance scores (in percent) are tracked over time and reported to the Audit Committee twice a year with the Committee paying particular attention to the variances between self-assessed and Internal Audit assessed scores as well as trends and the performance of newly acquired companies.
Our role with regard to risk is to look at the process of formulating the risk matrix and the assurance provided over internal controls and other mitigating factors. The ultimate responsibility for reviewing and approving the principal risks included in the Annual Report and Financial Statements remains with the Board.
(iii) Internal auditOne of the main duties of the Committee is to review the annual internal audit programme and ensure that the internal audit function is adequately resourced, effective (which includes assessing the independence of the function) and has appropriate standing within the Company. As far as the scope of the Internal Audit programme is concerned, the aim is to carry out visits to each operating company in the Group on a periodic, rotational basis. A risk based approach is taken when deciding which businesses to audit and the scope of each audit. The factors considered are, amongst other things, the volatility of end markets, critical system or senior management changes in the period, financial results, the timing of the most recent Internal Audit visit and any other assurance reviews undertaken, and whether the business is a recent acquisition. In addition, the emergence of any common themes or trends in the findings of recent internal audits or compliance scorecard submissions (see previous section) are taken into consideration. As part of the annual plan, Anti-Bribery & Corruption reviews are undertaken, focusing on areas such as relationships with agents, accounting for employee expenses and corporate hospitality/gifts.
The Internal Audit Plan is reviewed and approved by the Committee each year. Twice annually the Head of Internal Audit reports on audit activities, progress against the plan and the results of audit visits with particular focus on high priority findings and the action plans, including management responses, to address these areas.
Private discussions between me and the Head of Internal Audit are held during the year and once a year with the full Committee. I also receive copies of all internal audit reports issued during the year.
(iv) External auditAuditor effectivenessThe effectiveness of the external audit process is dependent on appropriate audit risk identification at the start of the audit cycle. EY present their detailed audit plan to us each year identifying their assessment of these key risks. For the current period, the significant risks identified were the carrying value of goodwill and intangible assets, valuation of inventory, adequacy of liability provisioning, including provisions for legal obligations, exceptional items and the exposure to significant tax risks due to the inherent management judgement required in all these areas. Our work in each of these areas has been covered in detail earlier in this report.
Our assessment of the effectiveness and quality of the audit process in addressing these matters is formed by, amongst other things, a review of the reporting from the auditors to the Committee and also by seeking feedback from management on the effectiveness of the audit process. During the first half of the year, management issued a detailed questionnaire to every Finance Manager/Director and Divisional Finance Director to collect feedback on the 2013 audit process. This covered resource and expertise of the audit teams, quality of planning, execution and deliverables as well as an assessment of overall performance.
Resultant themes and findings were discussed between ourselves, management and EY with both management and the auditors reporting to us on the actions being implemented in response. In addition, on a periodic basis, the Finance Director and Group Financial Controller meet with the overseas external audit teams.

90 The Weir Group PLC Annual Report and Financial Statements 2014
Report of the Audit Committee continued
Main activities (continued)(iv) External audit (continued)Auditor effectiveness (continued)The Committee discussed the Audit Quality Inspection report on EY issued by the FRC in May 2014 at its meetings in July and September and I also had a separate meeting with the lead audit partner to discuss the report. Although the principal findings of the FRC report indicated a deterioration on the previous year, the Committee agreed that this report, in itself, did not have an impact on our assessment of audit effectiveness at Weir.
Overall management were satisfied that there had been appropriate focus and challenge on the primary areas of audit risk, although there are of course some areas where improvements can be made, and assessed the quality of the audit process to be good. Based on the input from management and discussions we have had with EY and key finance individuals, we also hold this view. This process will be repeated in respect of the 2014 audit in advance of the Committee’s meeting in July 2015.
The Committee holds private meetings with the external auditor each year to provide additional opportunity for open dialogue and feedback from the Committee and the auditor without management being present. Matters typically discussed include the auditor’s assessment of business risks and management activity thereon, the transparency and openness of interactions with management, confirmation that there has been no restriction in scope placed on them by management and how they have exercised professional scepticism. I also meet with the lead audit partner outside the formal committee process as necessary throughout the year.
Independence policy and non-audit servicesThe Audit Committee is responsible for the appointment and role of the auditor. This includes keeping under review the auditor’s independence by providing guidelines on any non-audit services that are to be provided by them. In addition, a formal policy exists which ensures that the nature of the advice to be provided could not impair the objectivity of the auditor’s opinion on the Group’s financial statements. All non-audit services require the approval of management and, where the expected cost of the service is in excess of £75,000, the approval of the Audit Committee. No changes have been made to the policy in the current year. The auditors confirm their independence at least annually.
Fees payable to EY in respect of audit and assurance services for 2014 of £2.0m (2013: £1.9m) were approved by the Committee after a review of the level and nature of work to be performed, including the impact of acquisitions, and after being satisfied by EY that the fees were appropriate for the scope of the work required.
Non-audit fee work conducted by EY over the past year for assurance services amounted to £0.1m, which represented 5% of the total fees, including audit fees, and were incurred primarily in relation to other assurance services. We are of the view that the level and nature of non-audit work does not compromise the independence of the external auditors.
Auditor choice, tenure, tendering and reappointmentThe Committee considers the reappointment of the external auditor, including rotation of the audit partner, each year. The external auditor is required to rotate the audit partner responsible for the Group audit every five years and the current lead audit partner has been in place for three years, including 2014.
EY, or its predecessor firms, has been the Company’s external auditor, with no formal tender process, since prior to its stock market listing in 1946. As part of our annual review of the objectivity and effectiveness of the audit, we conduct an in depth review of their performance as noted above. There were no matters arising from the review in the current year, which we felt required the service to be tendered immediately. We have considered the audit tendering provisions outlined in the Code of which we are supportive. We have also reviewed the subsequent guidance provided by the European Commission and the Competition & Markets Authority (CMA). The European transitional provisions relating to Mandatory Firm Rotation are likely to require rotation of the external auditor of the Group within 6 years from July 2014, effectively the 2020 year end, which is also when the CMA mandates a tender process. However, we intend to tender the external audit, at the latest, coincident to the next rotation of the incumbent lead audit partner, which would be for the 2017 year end and are starting to plan for this process. Taking into account the circumstances noted above, this timing is viewed by the Committee as being in the best interests of shareholders.
Having considered the relationship with the independent auditor, their qualifications, expertise, resources and effectiveness, the Committee concluded that the external auditors remain independent and effective and recommended to the Board that EY be re-appointed as the Company’s external auditors for 2015. There are no contractual obligations restricting the Group’s choice of external auditors.
A resolution to re-appoint EY as the Company’s auditor will be put to the forthcoming Annual General Meeting.
Our focus for 2015In addition to our routine business, the Committee will increase its focus on risk assurance as part of the adoption of the revised UK Corporate Governance Code and the FRC’s Guidance on Risk Management, Internal Control and Related Financial and Business Reporting. In addition we will progress the audit tender plans so that we are well prepared for this important process.
Alan FergusonOn behalf of the Audit Committee25 February 2015

Strategic Report Financial StatementsCorporate Governance
91The Weir Group PLC Annual Report and Financial Statements 2014
Remuneration Report
Directors’ Remuneration Report
Melanie GeeChairman of the Remuneration Committee
Dear ShareholderAs Chairman of the Remuneration Committee, I am pleased to present this 2014 Remuneration Report, incorporating our remuneration policy table as approved at the 2014 AGM. This year, we have sought to make the detail of our remuneration arrangements easier to follow by including an ‘At a Glance’ section at the beginning of the report.
Business context 2014 was a challenging year for most commodity prices, with the downward trend in mining company capital expenditure continuing and oil prices, having been stable through the year, experiencing their biggest fall since 2009 in the fourth quarter. Against this background, and as described more fully in the Chief Executive’s Strategic Review (at page 10), management has focused on accelerating operational efficiencies through our four strategic pillars (as detailed on pages 15 to 21). This includes significant progress on Value Chain Excellence, and we continue to build on our operational and strategic initiatives through Innovation, Collaboration and extending our Global Capability.
We remain confident in the long term growth trends in our key end markets. However, in 2015 we expect continued price volatility in many commodities, including those to which we are most exposed, with our mining customers remaining focused on optimising their current assets to support increased production. Many of our oil and gas customers have already significantly reduced their capital spending plans in response to lower oil prices, and our visibility in these markets is limited as they adjust plans in the evolving pricing environment. In light of the near term uncertainties and emerging pricing pressure in oil and gas markets, which represented nearly 50% of our 2014 revenues, senior management undertook an efficiency review across all divisions in the third quarter of 2014, with a view to ensuring that the Group entered 2015 optimally placed to tackle what is expected to be a challenging year. The oil and gas division took further action at the start of 2015.
In this letter and in the report itself, we have demonstrated how the various elements of compensation link to the implementation of our strategy and align Executive Directors with the long-term interests of our shareholders, in particular in these times of unpredictable oil and gas markets.
2014 remuneration outcomesAs part of implementing our approved remuneration policy, the salaries of the Chief Executive and the Finance Director were unchanged in 2014. During the year, the Company made changes to the pension arrangements for all UK staff in response to the introduction of pension auto-enrolment and, as of July 2014, senior executives had the option to join the Company’s defined contribution scheme or receive an equivalent cash amount. Prior to this, there had been no specific pension provision for senior executives. Both the Chief Executive and the Finance Director have chosen to take the cash amount.
The 2014 annual bonus payout, as a percentage of maximum opportunity for both the Chief Executive and Finance Director, was 61.2%. The 2014 bonus had two performance metrics – financial (80% of bonus entitlement) and personal (20% of bonus entitlement). The financial element was based on the achievement of Normalised Profit Before Tax and Amortisation (NPBTA), and capable of being reduced to the extent that Group working capital targets were not achieved. Given challenging markets, the relative performances of our two main businesses were strong during the year and performance under the NPBTA measure was just below target. The Group working capital target was not achieved and, as a result, the Committee has reduced the bonus entitlement under the financial performance element by 10%.
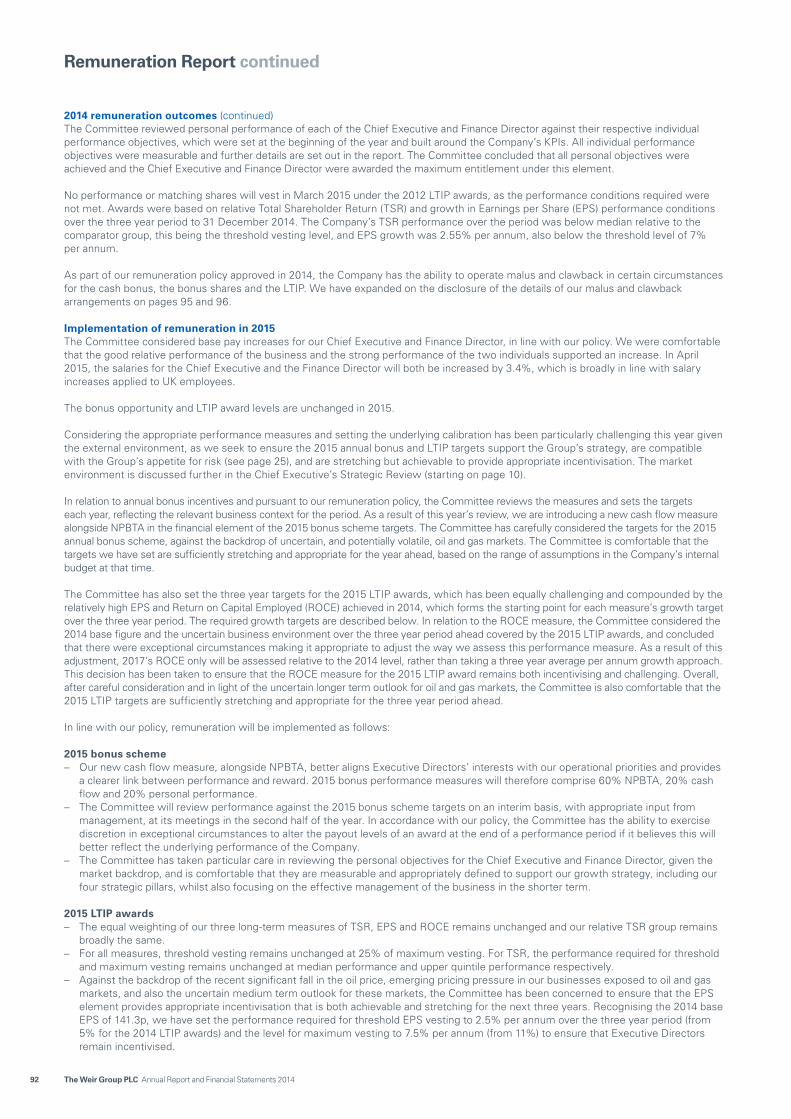
92 The Weir Group PLC Annual Report and Financial Statements 2014
2014 remuneration outcomes (continued)The Committee reviewed personal performance of each of the Chief Executive and Finance Director against their respective individual performance objectives, which were set at the beginning of the year and built around the Company’s KPIs. All individual performance objectives were measurable and further details are set out in the report. The Committee concluded that all personal objectives were achieved and the Chief Executive and Finance Director were awarded the maximum entitlement under this element.
No performance or matching shares will vest in March 2015 under the 2012 LTIP awards, as the performance conditions required were not met. Awards were based on relative Total Shareholder Return (TSR) and growth in Earnings per Share (EPS) performance conditions over the three year period to 31 December 2014. The Company’s TSR performance over the period was below median relative to the comparator group, this being the threshold vesting level, and EPS growth was 2.55% per annum, also below the threshold level of 7% per annum.
As part of our remuneration policy approved in 2014, the Company has the ability to operate malus and clawback in certain circumstances for the cash bonus, the bonus shares and the LTIP. We have expanded on the disclosure of the details of our malus and clawback arrangements on pages 95 and 96.
Implementation of remuneration in 2015The Committee considered base pay increases for our Chief Executive and Finance Director, in line with our policy. We were comfortable that the good relative performance of the business and the strong performance of the two individuals supported an increase. In April 2015, the salaries for the Chief Executive and the Finance Director will both be increased by 3.4%, which is broadly in line with salary increases applied to UK employees.
The bonus opportunity and LTIP award levels are unchanged in 2015.
Considering the appropriate performance measures and setting the underlying calibration has been particularly challenging this year given the external environment, as we seek to ensure the 2015 annual bonus and LTIP targets support the Group’s strategy, are compatible with the Group’s appetite for risk (see page 25), and are stretching but achievable to provide appropriate incentivisation. The market environment is discussed further in the Chief Executive’s Strategic Review (starting on page 10). In relation to annual bonus incentives and pursuant to our remuneration policy, the Committee reviews the measures and sets the targets each year, reflecting the relevant business context for the period. As a result of this year’s review, we are introducing a new cash flow measure alongside NPBTA in the financial element of the 2015 bonus scheme targets. The Committee has carefully considered the targets for the 2015 annual bonus scheme, against the backdrop of uncertain, and potentially volatile, oil and gas markets. The Committee is comfortable that the targets we have set are sufficiently stretching and appropriate for the year ahead, based on the range of assumptions in the Company’s internal budget at that time. The Committee has also set the three year targets for the 2015 LTIP awards, which has been equally challenging and compounded by the relatively high EPS and Return on Capital Employed (ROCE) achieved in 2014, which forms the starting point for each measure’s growth target over the three year period. The required growth targets are described below. In relation to the ROCE measure, the Committee considered the 2014 base figure and the uncertain business environment over the three year period ahead covered by the 2015 LTIP awards, and concluded that there were exceptional circumstances making it appropriate to adjust the way we assess this performance measure. As a result of this adjustment, 2017’s ROCE only will be assessed relative to the 2014 level, rather than taking a three year average per annum growth approach. This decision has been taken to ensure that the ROCE measure for the 2015 LTIP award remains both incentivising and challenging. Overall, after careful consideration and in light of the uncertain longer term outlook for oil and gas markets, the Committee is also comfortable that the 2015 LTIP targets are sufficiently stretching and appropriate for the three year period ahead.
In line with our policy, remuneration will be implemented as follows:
2015 bonus scheme – Our new cash flow measure, alongside NPBTA, better aligns Executive Directors’ interests with our operational priorities and provides
a clearer link between performance and reward. 2015 bonus performance measures will therefore comprise 60% NPBTA, 20% cash flow and 20% personal performance.
– The Committee will review performance against the 2015 bonus scheme targets on an interim basis, with appropriate input from management, at its meetings in the second half of the year. In accordance with our policy, the Committee has the ability to exercise discretion in exceptional circumstances to alter the payout levels of an award at the end of a performance period if it believes this will better reflect the underlying performance of the Company.
– The Committee has taken particular care in reviewing the personal objectives for the Chief Executive and Finance Director, given the market backdrop, and is comfortable that they are measurable and appropriately defined to support our growth strategy, including our four strategic pillars, whilst also focusing on the effective management of the business in the shorter term.
2015 LTIP awards – The equal weighting of our three long-term measures of TSR, EPS and ROCE remains unchanged and our relative TSR group remains
broadly the same. – For all measures, threshold vesting remains unchanged at 25% of maximum vesting. For TSR, the performance required for threshold
and maximum vesting remains unchanged at median performance and upper quintile performance respectively. – Against the backdrop of the recent significant fall in the oil price, emerging pricing pressure in our businesses exposed to oil and gas
markets, and also the uncertain medium term outlook for these markets, the Committee has been concerned to ensure that the EPS element provides appropriate incentivisation that is both achievable and stretching for the next three years. Recognising the 2014 base EPS of 141.3p, we have set the performance required for threshold EPS vesting to 2.5% per annum over the three year period (from 5% for the 2014 LTIP awards) and the level for maximum vesting to 7.5% per annum (from 11%) to ensure that Executive Directors remain incentivised.
Remuneration Report continued

Strategic Report Financial StatementsCorporate Governance
93The Weir Group PLC Annual Report and Financial Statements 2014
– We introduced our ROCE measure last year, which is a KPI used within the business (as detailed in the Strategic Report on page 23). Whilst it drives operational excellence, as it is calculated on a constant currency basis it is less influenced by external factors than the other two measures. For the 2014 LTIP awards, the ROCE measure was expressed as a three year average percentage increase per annum and the range was set at 0.5% per annum to 4% per annum. The Committee has decided that for the 2015 LTIP awards, instead of using the average per annum growth for the ROCE measurement it will assess the comparable 2017 ROCE against the base 2014 ROCE of 17.3%. This is different from the 2014 ROCE of 18.1% (as referred to on page 23) because, in accordance with our remuneration policy, we have included our recent Trio acquisition in the base figure, in order to make an appropriate comparator for our 2015 LTIP award ROCE targets. These targets have been set with a threshold ROCE of 18.8% (0.5% per annum improvement) to a maximum of 24.8% (2.5% per annum improvement).
Shareholder engagement The Committee welcomes the views of shareholders on remuneration on an ongoing basis. In 2013 and early 2014, the Committee consulted extensively with shareholders on changes to our remuneration policy and received strong support for our proposals at the 2014 AGM. The Committee’s activities following the 2014 AGM have focused on implementing this approved policy. We continue to value shareholders’ views on our remuneration arrangements and I can be contacted via the Company Secretary.
Further details of the implementation of the policy and the outturn for 2014 are set out in the rest of this Remuneration Report and shareholders will be invited to approve the report in an advisory vote at the Company’s AGM on 29 April 2015. We look forward to shareholders’ continued support.
Melanie GeeChairman of the Remuneration Committee25 February 2015
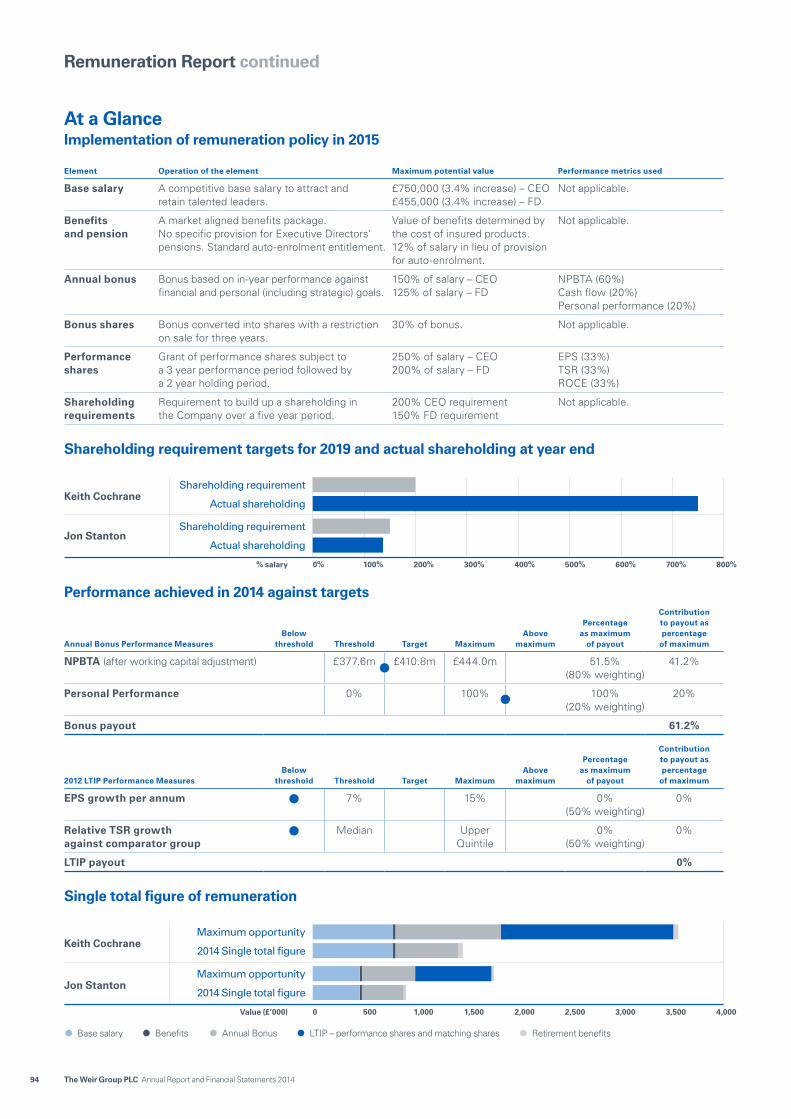
94 The Weir Group PLC Annual Report and Financial Statements 2014
Element Operation of the element Maximum potential value Performance metrics used
Base salary A competitive base salary to attract and retain talented leaders.
£750,000 (3.4% increase) – CEO£455,000 (3.4% increase) – FD
Not applicable.
Benefits and pension
A market aligned benefits package.No specific provision for Executive Directors’ pensions. Standard auto-enrolment entitlement.
Value of benefits determined by the cost of insured products.12% of salary in lieu of provision for auto-enrolment.
Not applicable.
Annual bonus Bonus based on in-year performance against financial and personal (including strategic) goals.
150% of salary – CEO 125% of salary – FD
NPBTA (60%)Cash flow (20%)Personal performance (20%)
Bonus shares Bonus converted into shares with a restriction on sale for three years.
30% of bonus. Not applicable.
Performance shares
Grant of performance shares subject to a 3 year performance period followed by a 2 year holding period.
250% of salary – CEO200% of salary – FD
EPS (33%) TSR (33%) ROCE (33%)
Shareholding requirements
Requirement to build up a shareholding in the Company over a five year period.
200% CEO requirement 150% FD requirement
Not applicable.
Implementation of remuneration policy in 2015At a Glance
Shareholding requirement targets for 2019 and actual shareholding at year end
Shareholding requirement
Shareholding requirement
Actual shareholding
Actual shareholding
Keith Cochrane
Jon Stanton
0% 100% 200% 300% 400% 500% 600% 700% 800%% salary
Performance achieved in 2014 against targets
Annual Bonus Performance MeasuresBelow
threshold Threshold Target MaximumAbove
maximum
Percentage as maximum
of payout
Contribution to payout as percentage
of maximum
NPBTA (after working capital adjustment) £377.6m £410.8m £444.0m 51.5%(80% weighting)
41.2%
Personal Performance 0% 100% 100%(20% weighting)
20%
Bonus payout 61.2%
2012 LTIP Performance MeasuresBelow
threshold Threshold Target MaximumAbove
maximum
Percentage as maximum
of payout
Contribution to payout as percentage
of maximum
EPS growth per annum 7% 15% 0%(50% weighting)
0%
Relative TSR growth against comparator group
Median Upper Quintile
0%(50% weighting)
0%
LTIP payout 0%
Remuneration Report continued
Single total figure of remuneration
Maximum opportunity
Maximum opportunity
2014 Single total figure
2014 Single total figure
Keith Cochrane
Jon Stanton
0 500 1,000 1,500 2,000 2,500 3,000 3,500 4,000Value (£’000)
• Base salary • Annual Bonus• Benefits • Retirement benefits• LTIP – performance shares and matching shares

Strategic Report Financial StatementsCorporate Governance
95The Weir Group PLC Annual Report and Financial Statements 2014
Annual Report on RemunerationNote: certain sections of the report have been audited, which are identified either in text or with the ‘#’ symbol.
Statement of Implementation of Directors’ Remuneration Policy in 2015In 2015, the approved Directors’ Remuneration Policy will be implemented as follows.
Executive DirectorsFixed elements – Base salaryThe Committee made the following 2015 base salary decisions which are in line with the approved Directors’ Remuneration Policy:
2015 salary £
2014 salary £
Percentage change
Keith Cochrane 750,000 725,000 3.4%
Jon Stanton 455,000 440,000 3.4%
Salaries are effective from 1 April each year. The Committee has considered the broader employee context and economic factors in determining salaries. In 2015, the increase in base salaries for UK employees will be up to 4%.
Fixed elements – Retirement and other benefitsThe implementation of policy in relation to pension and benefits is in line with the approved Directors’ Remuneration Policy.
Short term incentives – Annual bonusThe implementation of policy in relation to annual bonus is in line with the approved Directors’ Remuneration Policy.
The annual bonus is based on in-year performance against targets. The performance measures are: 60% Group Normalised Profit before Tax and Amortisation (NPBTA) measured over the financial period, 20% cash flow and 20% personal performance targets.
The cash flow measure is defined as cash generated from operations, including additional pension contributions paid and excluding the impact of derivative financial instruments on working capital cash flows. The performance targets are determined annually by the Committee. The performance targets for the cash flow measure are set at levels equivalent to the threshold, target and maximum levels for the NPBTA measure, with similar pay out percentages at each. The performance target of cash flow is adjusted to match the actual foreign exchange rates during the financial period and is also increased or decreased to reflect the impact of any acquisitions or disposals made in the year that are of a size requiring Board approval. Exceptional items or extraordinary items as agreed by the Remuneration Committee are excluded.
Targets are approved by the Remuneration Committee at the beginning of the performance year. As set out in the Directors’ Remuneration Policy, the Company will disclose the NPBTA and cash flow targets and the main groupings of individual performance measures retrospectively in the Annual Report on Remuneration. Performance targets will not be disclosed prospectively for commercial reasons.
30% of bonus payable will be converted into shares with a restriction on sale under the 2014 LTIP. There are no performance conditions on the bonus shares.
Malus and clawback arrangements operate in respect of the annual bonus and bonus shares. These arrangements enable the Company not to release any bonus shares before the end of the restriction period. This policy also enables the Company to clawback the annual bonus after the payment date and the bonus shares (or their relevant value) after the restriction period has ended for a period of up to three years. Malus and clawback may be applied in certain circumstances where there is found to be a material misstatement in the audited accounts of the Group or a Group company accounts, where the executive’s action or conduct amounts to gross misconduct, or where there is a significant detrimental reputational impact on the Company for which the executive is responsible.
Long term incentives – performance sharesThe Committee has determined that the following awards be made for 2015, in line with the approved Directors’ Remuneration Policy.
Awards vest after three years, subject to performance conditions. Awards for Executive Directors are then subject to a two year holding period.
Award type Basis on which award made
Face value of award at threshold vesting (% of 2015 salary)
Face value of award at maximum vesting (% of 2015 salary) Performance period
Keith Cochrane Performance shares A grant of shares will be made based on policy opportunity levels, the salary of the individual, and the share price on the three days prior to grant.
62.5% 250% 1 Jan 2015 – 31 Dec 2017
Jon Stanton Performance shares 50% 200% 1 Jan 2015 – 31 Dec 2017
Note The performance period for each LTIP award is based on calendar years. The TSR performance measure is calculated over calendar years. The EPS and ROCE measures are calculated over the relevant financial periods.
In all cases, awards will only vest subject to the achievement of the performance conditions and if the Committee determines that the underlying performance of the Company is sufficient to justify the vesting of the awards.

96 The Weir Group PLC Annual Report and Financial Statements 2014
Remuneration Report continued
Annual Report on Remuneration (continued)Statement of Implementation of Directors’ Remuneration Policy in 2015 (continued)Executive Directors (continued)Long term incentives – performance shares (continued)The three performance measures for the 2015 award apply in equal weighting and their performance targets are:
TSR EPS ROCE
Relative TSR growth against comparator group
Percentage of TSR proportion vesting
EPS growth per annum
Percentage of EPS proportion vesting 2017 ROCE
Percentage of ROCE proportion vesting
Upper quintile 100% 7.5% 100% 24.8% 100%
Median 25% 2.5% 25% 18.8% 25%
Below median 0% Less than 2.5% 0% Less than 18.8% 0%
The TSR comparator group for the 2015 LTIP grant is:Amec Foster Wheeler, Atlas Copco AB, Cameron International Corporation, Crane Company, Dover Corporation, Fenner PLC, FLSmidth & Co. A/S, Flowserve Corporation, FMC Corporation, Forum Energy Technologies Inc, IMI PLC, ITT Corporation, John Wood Group PLC, Joy Global Inc., Melrose Industries PLC, Metso Corporation, Outotec Oyj, Rotork PLC, Sandvik AB, Smiths Group PLC, Spirax-Sarco Engineering Plc, SPX Corporation, Sulzer Ltd and Vesuvius Plc.
The base 2014 EPS and ROCE used for the purposes of the 2015 LTIP award are 141.3p and 17.3% respectively. 2017 figures will be calculated on a consistent basis, in accordance with our approved Directors’ Remuneration Policy.
Malus and clawback arrangements operate in respect of performance shares. These enable the Company to reduce unvested awards and to clawback the relevant value of the vested shares for a period of up to three years after the date of vesting. Malus and clawback may be applied in certain situations where there is found to be a material misstatement in the audited accounts of the Group or a Group company accounts, where the executive’s action or conduct amounts to gross misconduct, or where there is a significant detrimental reputational impact on the Company for which the executive is responsible.
Non-Executive DirectorsAnnual fees for 2015The implementation of the Non-Executive Director remuneration is in line with the approved Directors’ Remuneration Policy. The fees per annum for Non-Executive Directors are set out in the table below. The fees for Non-Executive Directors, including those for additional responsibilities, were not increased in 2014.
2015 fees £
Percentage change
2014 fees £
Chairman’s fee for all responsibilities 290,000 5.5% 275,000
Non-Executive Directors’ base fee 58,000 5.5% 55,000
Additional fee for Senior Independent Director 12,000 20% 10,000
Additional fee for Audit Committee Chairman 15,000 50% 10,000
Additional fee for Remuneration Committee Chairman 15,000 50% 10,000
Fees are effective from 1 April each year. Additional allowances are made available to Non-Executive Directors, where appropriate, to reflect the additional time commitment in attending intercontinental Board meetings and operational visits.
Single total figure of remuneration for Executive DirectorsDetails of the remuneration for the 52 weeks ended 2 January 2015 and the 53 weeks ended 3 January 2014 received by the Executive Directors who served on the Board during the 2014 financial period are set out in the table below. The summary table comprises a number of key components which are set out in further detail in the relevant sections that follow. The table and accompanying notes have been audited.
Fixed elements Short term incentives Long term incentives Pension Total
Base salary (i) Benefits (ii) Annual bonus (iii)
LTIP – performance shares and matching
shares (iv)Retirement benefits
(v) Total
2014 £
2013 £
2014 £
2013 £
2014 £
2013 £
2014 £
2013 £
2014 £
2013 £
2014 £
2013 £
Keith Cochrane 725,000 718,750 22,781 21,656 665,564 108,750 – 938,171 43,500 – 1,456,845 1,787,327
Jon Stanton 440,000 435,000 18,804 18,334 336,607 44,000 – 401,687 26,400 – 821,811 899,027
Notes to the single figure of remuneration for Executive Directors tableThere were no other payments made during 2013 and 2014 and no Executive Director received remuneration for external appointments during 2014.
i) Base salaryCorresponds to the amounts received during the 2014 financial year.Salary is paid monthly to Executive Directors. No salary increases were made for Executive Directors in 2014.

Strategic Report Financial StatementsCorporate Governance
97The Weir Group PLC Annual Report and Financial Statements 2014
ii) BenefitsCorresponds to the taxable value of all benefits paid in respect of the 2014 financial year.
Keith Cochrane
2014 £
Jon Stanton
2014 £
Life insurance cover 4,143 4,336
Car allowance 17,015 13,970
Group healthcare 498 498
Other benefits 1,125 –
Total 22,781 18,804
iii) Short term incentivesCorresponds to the total bonus earned under the annual bonus in respect of 2014 performance and includes both the cash element (70%) and the bonus to be converted into shares with a restriction on sale (30%).The 2014 annual bonus was based on achievement of Group Normalised Profit before Tax and Amortisation (NPBTA) (80%), capable of being reduced by 10% to the extent that Group working capital targets were not met, and personal performance targets (20%). Executive Directors’ 2014 performance was assessed relative to both the financial targets and other performance considerations further outlined below.
2014 performance measures for Executive Directors
NPBTA
2014 performance required
£m
Actual performance
£m
Payout as a percentage of
maximum
Weighting as percentage of
total bonus opportunity
Contribution to payout as
percentage of maximum bonus
opportunity
Based on the achievement of NPBTA targets measured over the financial period.
Threshold 377.6Target 410.8Stretch 444.0
£408.5 57.2% (before
adjustment*)51.5% (after
adjustment*)
80% 41.2% (after
adjustment*)
NoteThe performance measure is Normalised Profit before Tax and Amortisation as disclosed in the Group’s financial reporting for the relevant financial year. The targets are set at the start of the period and are subsequently adjusted at the end of the period to ensure comparability. The adjustments are approved by the Remuneration Committee and include restating targets on a constant currency basis and adjusting for certain other items, including to reflect the direct impact of industrial actions on Group facilities.
* Payouts under the NPBTA element may be reduced to the extent that Group working capital is above target. The Remuneration Committee considered the 2014 Group working capital targets (20.8% of revenues) and actuals (22.1% of revenues) and determined a reduction of 10% was appropriate.
Individual performance objectives 2014 performance required
Payout as a percentage of
maximum
Weighting as percentage of
total bonus opportunity
Contribution to payout as
percentage of maximum bonus
opportunity
Individual performance objectives are robustly set and are customised for each individual. All objectives are measurable and are objectively determined. Individual objectives for 2014 were built around the Company’s key performance indicators.
Keith Cochrane:Objectives included areas such as strategic growth of the Company, stakeholder engagement, organisational capability and innovation.
100% 20% Keith Cochrane:20.0%
Jon Stanton:Objectives included areas such as delivery of IT strategy, optimisation of capital structure, and finance team succession planning and talent development.
100% 20% Jon Stanton:20.0%

98 The Weir Group PLC Annual Report and Financial Statements 2014
Remuneration Report continued
Annual Report on Remuneration (continued)Single total figure of remuneration for Executive Directors (continued)iii) Short term incentives (continued)2014 short term incentive awardsBased on the outcome of 2014 performance as outlined above, the Committee approved the following annual bonus awards under the Executive Bonus Scheme to Executive Directors:
Executive Director
Payout as percentage
of maximum bonus
opportunity
Payout as percentage
of salaryPayout
£
Keith Cochrane 61.2% 91.8% 665,564
Jon Stanton 61.2% 76.5% 336,607
Notes1. Includes 30% conversion into shares with restriction on sale over three years.2. Bonus award is based on salary as at 31 December in the relevant financial year.3. Bonus to be paid in March 2015.
iv) Long term incentivesThe value represents an estimate of the market value of the 2012 Performance and Matching Share awards at year end.
LTIP awards vesting in 2015In accordance with The Large and Medium-sized Companies and Groups (Accounts and Reports) (Amendment) Regulations 2013 (the ‘Regulations’), the single total remuneration figure for 2014 includes the vesting value of the performance and matching shares made under the 2012 LTIP Award, with a performance period from 1 January 2012 to 31 December 2014.
The 2012 performance share and matching share awards for Keith Cochrane and Jon Stanton were due to vest on 9 March 2015. The table below sets out a summary of the performance conditions, performance against these conditions as well as the resulting gross vesting value using the share price over Q4 of 2014 in accordance with the Regulations.
The Committee reserves the right to make adjustments to the performance conditions to reflect significant one-off items which occur during the performance period. No discretion was exercised in respect of the awards.
2012 performance share awards
Performance conditions and targets set Maximum potential value
Maximum number of shares granted
Performance metrics, weighting and period and method of determining performance
Resulting vesting
£
Keith Cochrane Performance conditions set out on page 100.
Performance period of three years ended on 31 December 2014 due to vest on 9 March 2015.
Shares with value of 100% of salary on the date of grant.
35,953 Overall level of vesting 0%.
50% of award is based on EPS growth. Actual EPS growth was 2.55% p.a., resulting in 0% vesting1.
50% of award is based on TSR growth. Actual TSR growth was 19%, corresponding to below median performance relative to peers between January 2012 and December 2014, resulting in 0% vesting.
Dividend equivalents are paid on vested shares based on dividend payments over the performance period. Dividend equivalents to be delivered in shares.
–
Jon Stanton 21,572 –
2012 matching share awards
Resulting vesting
£
Keith Cochrane Performance conditions set out on page 100.
Performance period of three years ended on 31 December 2014 due to vest on 9 March 2015.
Shares with value of 200% of compulsory and voluntary deferred annual bonus on the date of grant, subject to continued employment and retention of compulsory investment shares and voluntary investment shares where applicable.
45,573 –
Jon Stanton 12,327 –
Note1. The EPS outcome has been adjusted to remove the impact of IAS 19R on the 2014 result to ensure a consistent measurement basis across the performance period.
Note that compulsory and voluntary investment shares will be released in 2015 to individuals. The number of shares expected to be released in 2015 is 19,166 for Keith Cochrane and 6,163 for Jon Stanton. The compulsory investment shares also have the right to receive dividend equivalents in the form of shares to the value of 120.8p per share at the date of vesting. The value of these shares does not form part of the single total figure table as they have not been subject to performance measures since they were granted.
LTIP awards vested in 2014In accordance with the Regulations, the estimate shown in the Annual Report and Financial Statements 2013 of the value for 2013 for the performance and matching awards under the 2011 LTIP has now been restated based on the actual share price at the date of vesting
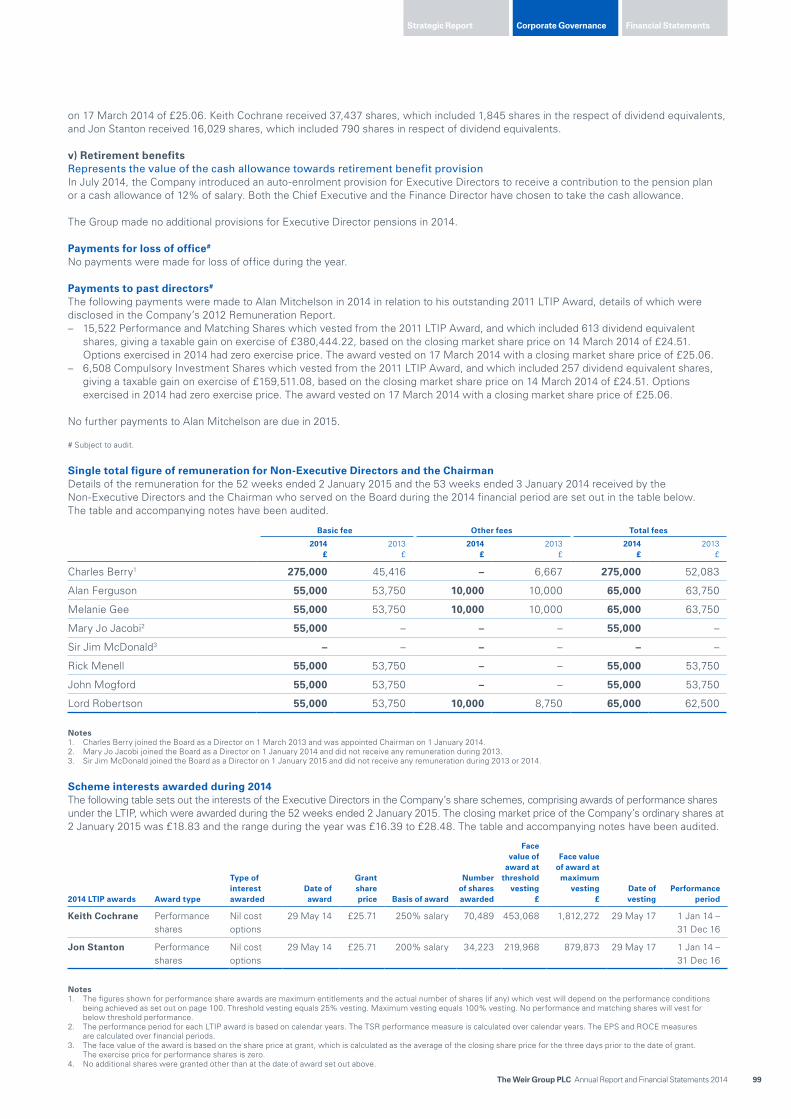
Strategic Report Financial StatementsCorporate Governance
99The Weir Group PLC Annual Report and Financial Statements 2014
on 17 March 2014 of £25.06. Keith Cochrane received 37,437 shares, which included 1,845 shares in the respect of dividend equivalents, and Jon Stanton received 16,029 shares, which included 790 shares in respect of dividend equivalents.
v) Retirement benefitsRepresents the value of the cash allowance towards retirement benefit provision In July 2014, the Company introduced an auto-enrolment provision for Executive Directors to receive a contribution to the pension plan or a cash allowance of 12% of salary. Both the Chief Executive and the Finance Director have chosen to take the cash allowance.
The Group made no additional provisions for Executive Director pensions in 2014.
Payments for loss of office#
No payments were made for loss of office during the year.
Payments to past directors#
The following payments were made to Alan Mitchelson in 2014 in relation to his outstanding 2011 LTIP Award, details of which were disclosed in the Company’s 2012 Remuneration Report. – 15,522 Performance and Matching Shares which vested from the 2011 LTIP Award, and which included 613 dividend equivalent
shares, giving a taxable gain on exercise of £380,444.22, based on the closing market share price on 14 March 2014 of £24.51. Options exercised in 2014 had zero exercise price. The award vested on 17 March 2014 with a closing market share price of £25.06.
– 6,508 Compulsory Investment Shares which vested from the 2011 LTIP Award, and which included 257 dividend equivalent shares, giving a taxable gain on exercise of £159,511.08, based on the closing market share price on 14 March 2014 of £24.51. Options exercised in 2014 had zero exercise price. The award vested on 17 March 2014 with a closing market share price of £25.06.
No further payments to Alan Mitchelson are due in 2015.
# Subject to audit.
Single total figure of remuneration for Non-Executive Directors and the ChairmanDetails of the remuneration for the 52 weeks ended 2 January 2015 and the 53 weeks ended 3 January 2014 received by the Non-Executive Directors and the Chairman who served on the Board during the 2014 financial period are set out in the table below. The table and accompanying notes have been audited.
Basic fee Other fees Total fees
2014 £
2013 £
2014 £
2013 £
2014 £
2013 £
Charles Berry1 275,000 45,416 – 6,667 275,000 52,083
Alan Ferguson 55,000 53,750 10,000 10,000 65,000 63,750
Melanie Gee 55,000 53,750 10,000 10,000 65,000 63,750
Mary Jo Jacobi2 55,000 – – – 55,000 –
Sir Jim McDonald3 – – – – – –
Rick Menell 55,000 53,750 – – 55,000 53,750
John Mogford 55,000 53,750 – – 55,000 53,750
Lord Robertson 55,000 53,750 10,000 8,750 65,000 62,500
Notes1. Charles Berry joined the Board as a Director on 1 March 2013 and was appointed Chairman on 1 January 2014.2. Mary Jo Jacobi joined the Board as a Director on 1 January 2014 and did not receive any remuneration during 2013.3. Sir Jim McDonald joined the Board as a Director on 1 January 2015 and did not receive any remuneration during 2013 or 2014.
Scheme interests awarded during 2014The following table sets out the interests of the Executive Directors in the Company’s share schemes, comprising awards of performance shares under the LTIP, which were awarded during the 52 weeks ended 2 January 2015. The closing market price of the Company’s ordinary shares at 2 January 2015 was £18.83 and the range during the year was £16.39 to £28.48. The table and accompanying notes have been audited.
2014 LTIP awards Award type
Type of interest awarded
Date of award
Grant share price Basis of award
Number of shares awarded
Face value of
award at threshold
vesting £
Face value of award at maximum
vesting £
Date of vesting
Performance period
Keith Cochrane Performance shares
Nil cost options
29 May 14 £25.71 250% salary 70,489 453,068 1,812,272 29 May 17 1 Jan 14 – 31 Dec 16
Jon Stanton Performance shares
Nil cost options
29 May 14 £25.71 200% salary 34,223 219,968 879,873 29 May 17 1 Jan 14 – 31 Dec 16
Notes1. The figures shown for performance share awards are maximum entitlements and the actual number of shares (if any) which vest will depend on the performance conditions
being achieved as set out on page 100. Threshold vesting equals 25% vesting. Maximum vesting equals 100% vesting. No performance and matching shares will vest for below threshold performance.
2. The performance period for each LTIP award is based on calendar years. The TSR performance measure is calculated over calendar years. The EPS and ROCE measures are calculated over financial periods.
3. The face value of the award is based on the share price at grant, which is calculated as the average of the closing share price for the three days prior to the date of grant. The exercise price for performance shares is zero.
4. No additional shares were granted other than at the date of award set out above.

100 The Weir Group PLC Annual Report and Financial Statements 2014
Remuneration Report continued
Annual Report on Remuneration (continued)Performance conditions for the LTIP
2012 2013 2014
TSR
Weighting 50% 50% 33.3%
Target structure Relative TSR Growth against
comparator group
Percentage of the TSR portion of the award that
vests
Relative TSR Growth against
comparator group
Percentage of the TSR portion of the award that
vests
Relative TSR Growth against
comparator group
Percentage of the TSR portion of the award that
vests
Maximum performance
Upper quintile 100% Upper quintile 100% Upper quintile 100%
Threshold performance
Median 25% Median 25% Median 25%
Below threshold performance
Below median 0% Below median 0% Below median 0%
Comparator group Amec Foster Wheeler2, Cameron, Crane, Dover, Dresser Rand, FLSmidth, Flowserve, FMC, Halma, IMI, Joy Global, Meggitt, Melrose, Metso, Outotec, Rotork, Smiths Group, Spirax Sarco, SPX, Sulzer, Vesuvius3, Wood Group
Amec Foster Wheeler2, Cameron, Crane, Dover, Dresser Rand, Fenner, FLSmidth, Flowserve, FMC, Forum Energy4, Halma, IMI, Joy Global, Meggitt, Melrose, Metso, Outotec,Rotork, Smiths Group, Spirax Sarco, SPX, Sulzer, Vesuvius, Wood Group
Amec Foster Wheeler2, Atlas Copco, Cameron, Crane, Dover, Dresser Rand, Fenner, FLSmidth, Flowserve, FMC, IMI, ITT, Joy Global, Melrose, Metso, Outotec, Rotork, Sandvik, Smiths Group, Spirax Sarco, SPX, Sulzer, Vesuvius, Wood Group
EPS1
Weighting 50% 50% 33.3%
Target structure EPS Growth per annum
Percentage of EPS portion
of the award that vests
EPS Growth per annum
Percentage of EPS portion
of the award that vests
EPS Growth per annum
Percentage of EPS portion
of the award that vests
Maximum performance
15% 100% 11% 100% 11% 100%
Threshold performance
7% 25% 5% 25% 5% 25%
Below threshold performance
Less than 7% 0% Less than 5% 0% Less than 5% 0%
ROCE1
Weighting 0% 0% 33.3%
Target structure – – – – Improvement in average ROCE
per annum
Percentage of ROCE portion
of the award that vests
Maximum performance
– – – – 4% 100%
Threshold performance
– – – – 0.5% 25%
Below threshold performance
– – – – Less than 0.5% 0%
Performance periods
Single three year performance period for both elements
Single three year performance period for both elements
Single three year performance period for all elements
Notes1. EPS and ROCE are subject to adjustments in line with policy.2. AMEC has been renamed to Amec Foster Wheeler following its acquisition of Foster Wheeler in 2014. 3. Cookson Group demerged on 1 November 2012, with the new company Alent Plc being separated from the rest of the business, which has been renamed Vesuvius Plc.
Vesuvius Plc has succeeded Cookson Group in the comparator group.4. Gardner Denver was acquired and delisted in 2013. It has been removed from the 2012 comparator group and replaced by Forum Energy Technologies in the 2013
comparator group.5. Lufkin was acquired during 2013 and has been removed from the 2012 and 2013 comparator groups.
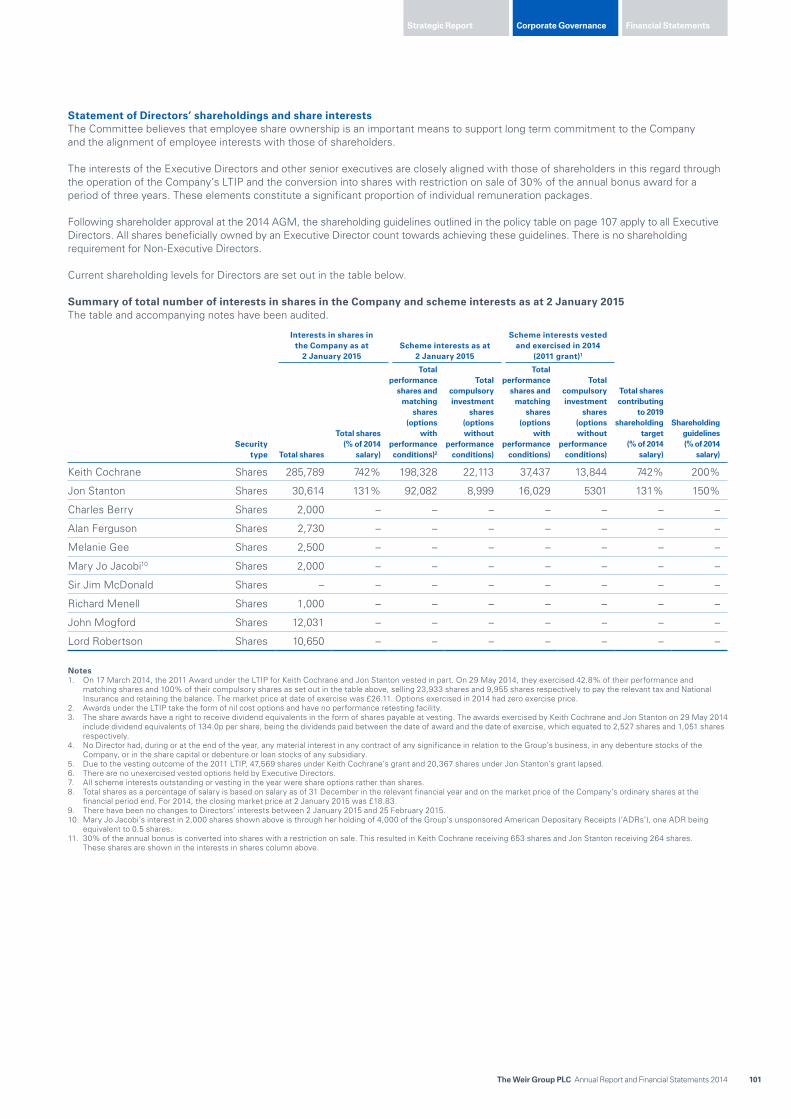
Strategic Report Financial StatementsCorporate Governance
101The Weir Group PLC Annual Report and Financial Statements 2014
Statement of Directors’ shareholdings and share interestsThe Committee believes that employee share ownership is an important means to support long term commitment to the Company and the alignment of employee interests with those of shareholders.
The interests of the Executive Directors and other senior executives are closely aligned with those of shareholders in this regard through the operation of the Company’s LTIP and the conversion into shares with restriction on sale of 30% of the annual bonus award for a period of three years. These elements constitute a significant proportion of individual remuneration packages.
Following shareholder approval at the 2014 AGM, the shareholding guidelines outlined in the policy table on page 107 apply to all Executive Directors. All shares beneficially owned by an Executive Director count towards achieving these guidelines. There is no shareholding requirement for Non-Executive Directors.
Current shareholding levels for Directors are set out in the table below.
Summary of total number of interests in shares in the Company and scheme interests as at 2 January 2015The table and accompanying notes have been audited.
Interests in shares in the Company as at
2 January 2015Scheme interests as at
2 January 2015
Scheme interests vested and exercised in 2014
(2011 grant)1
Security type Total shares
Total shares (% of 2014
salary)
Total performance
shares and matching
shares (options
with performance conditions)2
Total compulsory investment
shares (options without
performance conditions)
Total performance
shares and matching
shares (options
with performance
conditions)
Total compulsory investment
shares (options without
performance conditions)
Total shares contributing
to 2019 shareholding
target (% of 2014
salary)
Shareholding guidelines (% of 2014
salary)
Keith Cochrane Shares 285,789 742% 198,328 22,113 37,437 13,844 742% 200%
Jon Stanton Shares 30,614 131% 92,082 8,999 16,029 5301 131% 150%
Charles Berry Shares 2,000 – – – – – – –
Alan Ferguson Shares 2,730 – – – – – – –
Melanie Gee Shares 2,500 – – – – – – –
Mary Jo Jacobi10 Shares 2,000 – – – – – – –
Sir Jim McDonald Shares – – – – – – – –
Richard Menell Shares 1,000 – – – – – – –
John Mogford Shares 12,031 – – – – – – –
Lord Robertson Shares 10,650 – – – – – – –
Notes1. On 17 March 2014, the 2011 Award under the LTIP for Keith Cochrane and Jon Stanton vested in part. On 29 May 2014, they exercised 42.8% of their performance and
matching shares and 100% of their compulsory shares as set out in the table above, selling 23,933 shares and 9,955 shares respectively to pay the relevant tax and National Insurance and retaining the balance. The market price at date of exercise was £26.11. Options exercised in 2014 had zero exercise price.
2. Awards under the LTIP take the form of nil cost options and have no performance retesting facility.3. The share awards have a right to receive dividend equivalents in the form of shares payable at vesting. The awards exercised by Keith Cochrane and Jon Stanton on 29 May 2014
include dividend equivalents of 134.0p per share, being the dividends paid between the date of award and the date of exercise, which equated to 2,527 shares and 1,051 shares respectively.
4. No Director had, during or at the end of the year, any material interest in any contract of any significance in relation to the Group’s business, in any debenture stocks of the Company, or in the share capital or debenture or loan stocks of any subsidiary.
5. Due to the vesting outcome of the 2011 LTIP, 47,569 shares under Keith Cochrane’s grant and 20,367 shares under Jon Stanton’s grant lapsed.6. There are no unexercised vested options held by Executive Directors.7. All scheme interests outstanding or vesting in the year were share options rather than shares.8. Total shares as a percentage of salary is based on salary as of 31 December in the relevant financial year and on the market price of the Company’s ordinary shares at the
financial period end. For 2014, the closing market price at 2 January 2015 was £18.83.9. There have been no changes to Directors’ interests between 2 January 2015 and 25 February 2015.10. Mary Jo Jacobi’s interest in 2,000 shares shown above is through her holding of 4,000 of the Group’s unsponsored American Depositary Receipts (‘ADRs’), one ADR being
equivalent to 0.5 shares.11. 30% of the annual bonus is converted into shares with a restriction on sale. This resulted in Keith Cochrane receiving 653 shares and Jon Stanton receiving 264 shares.
These shares are shown in the interests in shares column above.
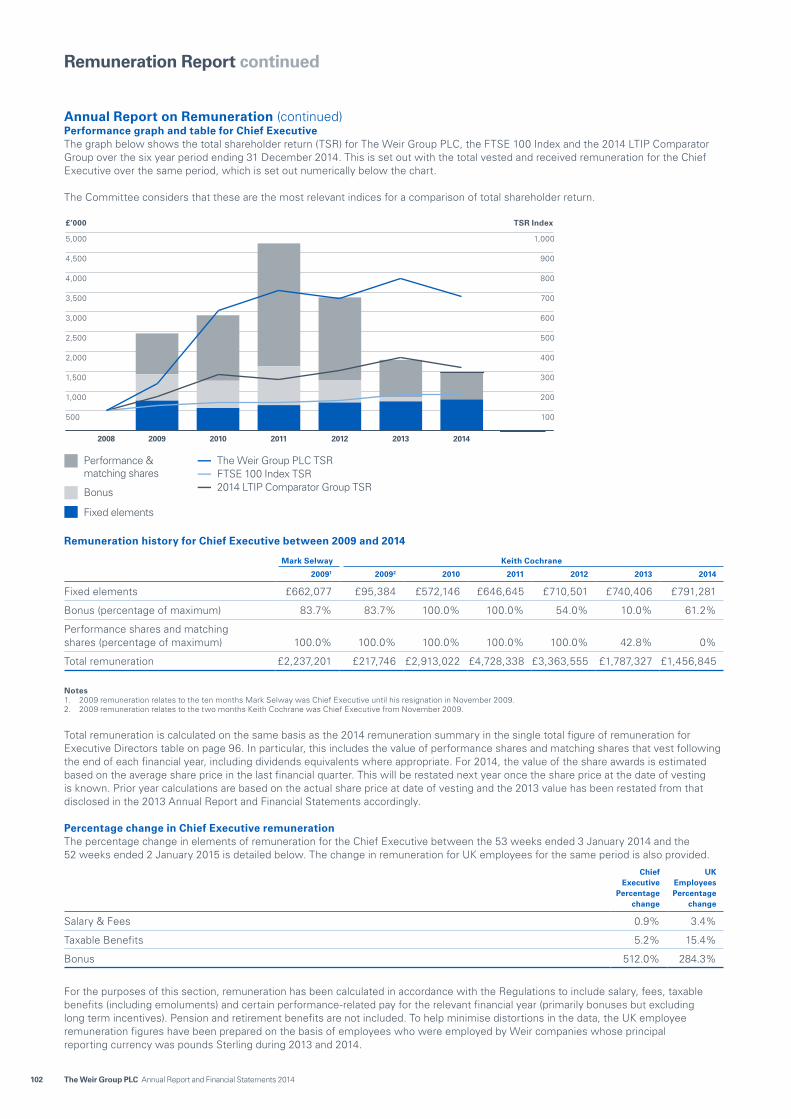
102 The Weir Group PLC Annual Report and Financial Statements 2014
0500
100015002000250030003500400045005000
01002003004005006007008009001000
2008 2009 2010 2011 2012 2013 2014
500
1,000
1,500
2,000
2,500
3,000
3,500
4,000
4,500
5,000
£’000 TSR Index
100
200
300
400
500
600
700
800
900
1,000
Performance & matching shares
Bonus
Fixed elements
The Weir Group PLC TSRFTSE 100 Index TSR2014 LTIP Comparator Group TSR
Remuneration Report continued
Annual Report on Remuneration (continued)Performance graph and table for Chief ExecutiveThe graph below shows the total shareholder return (TSR) for The Weir Group PLC, the FTSE 100 Index and the 2014 LTIP Comparator Group over the six year period ending 31 December 2014. This is set out with the total vested and received remuneration for the Chief Executive over the same period, which is set out numerically below the chart.
The Committee considers that these are the most relevant indices for a comparison of total shareholder return.
Remuneration history for Chief Executive between 2009 and 2014
Mark Selway Keith Cochrane
20091 20092 2010 2011 2012 2013 2014
Fixed elements £662,077 £95,384 £572,146 £646,645 £710,501 £740,406 £791,281
Bonus (percentage of maximum) 83.7% 83.7% 100.0% 100.0% 54.0% 10.0% 61.2%
Performance shares and matching shares (percentage of maximum) 100.0% 100.0% 100.0% 100.0% 100.0% 42.8% 0%
Total remuneration £2,237,201 £217,746 £2,913,022 £4,728,338 £3,363,555 £1,787,327 £1,456,845
Notes1. 2009 remuneration relates to the ten months Mark Selway was Chief Executive until his resignation in November 2009.2. 2009 remuneration relates to the two months Keith Cochrane was Chief Executive from November 2009.
Total remuneration is calculated on the same basis as the 2014 remuneration summary in the single total figure of remuneration for Executive Directors table on page 96. In particular, this includes the value of performance shares and matching shares that vest following the end of each financial year, including dividends equivalents where appropriate. For 2014, the value of the share awards is estimated based on the average share price in the last financial quarter. This will be restated next year once the share price at the date of vesting is known. Prior year calculations are based on the actual share price at date of vesting and the 2013 value has been restated from that disclosed in the 2013 Annual Report and Financial Statements accordingly.
Percentage change in Chief Executive remunerationThe percentage change in elements of remuneration for the Chief Executive between the 53 weeks ended 3 January 2014 and the 52 weeks ended 2 January 2015 is detailed below. The change in remuneration for UK employees for the same period is also provided.
Chief
Executive Percentage
change
UK
Employees Percentage
change
Salary & Fees 0.9% 3.4%
Taxable Benefits 5.2% 15.4%
Bonus 512.0% 284.3%
For the purposes of this section, remuneration has been calculated in accordance with the Regulations to include salary, fees, taxable benefits (including emoluments) and certain performance-related pay for the relevant financial year (primarily bonuses but excluding long term incentives). Pension and retirement benefits are not included. To help minimise distortions in the data, the UK employee remuneration figures have been prepared on the basis of employees who were employed by Weir companies whose principal reporting currency was pounds Sterling during 2013 and 2014.
Strategic Report Financial StatementsCorporate Governance
103The Weir Group PLC Annual Report and Financial Statements 2014
The increase in bonus for the Chief Executive reflects the figures in the single total figure table in 2013 and 2014. In 2013, the NPBTA element of the bonus did not meet threshold and the bonus paid out at 10.0% of maximum. In 2014, the NPBTA element of the bonus was just below target and the bonus paid out at 61.2% of maximum. The total of the single total figure for the Chief Executive decreased by 18.5% from 2013 to 2014.
The UK employee population has been selected as it reflects a broad sample of employees which includes Head Office employees and other individuals located in the same country as the Executive Directors.
Relative importance of spend on payThe table below shows the expenditure of the Company on employee remuneration costs in the 2014 financial year and 2013 financial year. In addition, it details the disbursements from profit made by way of dividend payments during the same periods.
2014 £m
2013 £m
Percentage change
Profit distributed by way of dividend 102.7 82.6 24.3%
Overall spend on pay for employees 630.7 602.0 4.8%
Details of the overall spend on pay for employees can be found in note 4 to the Financial Statements on page 133. Employees include Executive Directors but not Non-Executive Directors. The Company considers employee remuneration costs in the context of the general financial performance and position of the Company, including when determining the salary increase budget, annual bonus funding, long term incentive grant budget, and pension levels.
Consideration by the Directors of matters relating to Directors’ remuneration, Terms of Reference and EvaluationTo ensure reward arrangements support the Company’s philosophy, strategy and culture, the Committee reviews compensation and benefit plans for the Executive Directors, senior leadership, and the broader employee population. In December 2014, the Committee reviewed its Terms of Reference. The Remuneration Committee was evaluated as part of the 2014 Board evaluation process, conducted externally by Independent Board Review, and it was concluded that the Committee continued to function strongly in accordance with good corporate governance. The report highlighted that in a busy year involving the formulation of the new remuneration policy, there had been a cohesive approach and in particular a significant amount of good work undertaken on shareholder consultation. Improvements can always be made and the Committee has agreed a number of these for implementation in 2015.
More details of the Board evaluation can be found on pages 80 and 81. The Terms of Reference of the Committee are available on the Company’s website.
Remuneration Committee membership and attendance
Current members Name Attendance
Alan Ferguson1 Melanie Gee 5 of 5
Melanie Gee (Chairman) Mary Jo Jacobi 4 of 4
Mary Jo Jacobi2 Rick Menell 5 of 5
Rick Menell Lord Robertson3 5 of 5
Remuneration Committee attendees
Charles Berry Group Chairman Attends by invitation
Keith Cochrane Chief Executive Attends by invitation
Keith Ruddock Group General Counsel & Company Secretary Attends as Secretary to the Committee
Pauline Lafferty Director of Human Resources Attends by invitation
PricewaterhouseCoopers LLP (‘PwC’) Attends as adviser to the Committee
Notes1. Alan Ferguson was appointed to the Committee on 1 February 2015.2. Mary Jo Jacobi was appointed to the Committee on 21 January 2014.3. Lord Robertson retired from the Committee on 31 January 2015.
There were five meetings held during the 52 weeks to 2 January 2015, and the attendance of the individual members of the Committee during that period is detailed in the table above. All members of the Committee are considered to be independent Non-Executive Directors and no Director plays a part in the determination of their own remuneration. Executive Directors and senior management attend committee meetings at the invitation of the Committee Chairman. No member of the Committee has any personal financial interest, other than as a shareholder, in the matters decided by the Committee.

104 The Weir Group PLC Annual Report and Financial Statements 2014
Remuneration Report continued
Annual Report on Remuneration (continued)Remuneration Committee activities in 2014In 2014, the Committee discussed the key agenda items set out in the following table:
Date Agenda items
January Approval of salaries and 2014 annual bonus targets/measures for Executive Directors/Group Executive; approval of Chairman fee; review of internal operating guidelines for remuneration; review of draft 2013 Remuneration Report; update on consultation process; review of terms of reference; feedback on Committee effectiveness review; change of Committee members.
February Approval of 2013 bonus payments for Executive Directors/Group Executive; note payment of 2013 bonuses to senior managers; approval of vesting for 2011 LTIP; approval of new LTIP rules; approval of participants/performance conditions for 2014 annual bonus and LTIP; finalisation of 2013 Remuneration Report.
May Update on remuneration related matters with regards to current business strategy.
July Approval of LTIP grants for new joiners; review outcome of Weir AGM and update on the AGM season; approval of standing items for Remuneration Committee calendar; and consideration of the role of PwC as advisors to the Committee.
December Consideration of draft Directors’ Remuneration Report in context of current market practice; review of business outlook and timing for approval of 2015 LTIP award performance targets and measures and targets for the 2015 annual bonus plan; review of initial proposals for 2015 salaries of Executive Directors and the wider Group; review of the Remuneration Committee Terms of Reference; and review of the 2015 calendar for the Remuneration Committee.
Advisors to the CommitteeIn discharging its responsibilities in 2014, the Committee was materially assisted by the Director of Human Resources and the Company Secretary.
PwC was appointed following a review of providers by the Committee in 2011. In July 2014, the Committee considered the role of PwC and agreed to extend their tenure as independent external advisor to the Committee. Fees paid to PwC in relation to remuneration services provided to the Committee in 2014 totalled £50,815. This included advice on remuneration policy and practice, as well as guidance to the Committee on corporate governance trends and best practice. PwC is a signatory to the Remuneration Consultants’ Group Voluntary Code of Conduct.
The Committee recognises the need to obtain independent advice and given that PwC provides additional services to the Group, the Remuneration Committee Chairman has discussed this with PwC and management. The Committee is confident that any potential conflicts are managed appropriately by the Company and PwC. For information, the additional services provided by PwC include advice on pension schemes, IT project assurance, and global mobility services. PwC also provided advice on taxation, company secretarial services, internal audit services and due diligence and corporate finance advice in relation to acquisitions.
Statement of voting at general meetingThe Company is committed to maintaining an open shareholder dialogue and takes an active interest in voting outcomes. In the event of a substantial vote against the Directors’ Remuneration Report, the Company would explain when announcing the results of voting what actions would be taken to understand the reasons for any such vote and would also set out in the following Annual Report actions implemented in response.
At the Company’s last Annual General Meeting on 1 May 2014, the resolutions to approve the Directors’ Remuneration Report and the Directors’ Remuneration Policy as contained in the Annual Report and Financial Statements 2013 were supported as follows:
Voting outcomeVotes
for PercentageVotes
against PercentageVotes total
Votes withheld
2013 Directors’ Remuneration Report (excluding the Directors’ Remuneration Policy) 146,473,090 99.84% 227,564 0.16% 146,700,654 467,724
Directors’ Remuneration Policy 144,926,563 99.61% 564,376 0.39% 145,490,939 1,676,889
Directors’ Remuneration PolicyThe full Directors’ Remuneration Policy, as approved at the 2014 AGM on 1 May 2014, is set out on the Company’s website in the Remuneration Committee section. The Company is not proposing any changes to this policy.
Below and incorporated by reference into this Annual Report on Remuneration, we set out the Directors’ policy table for reference, updated only to remove information which is now historic. This reflects the structure of remuneration for future awards and does not replace or override the full approved Directors’ Remuneration Policy.
On behalf of the Board of Directors
Melanie GeeChairman of the Remuneration CommitteeSigned and approved for and on behalf of the Board25 February 2015

Strategic Report Financial StatementsCorporate Governance
105The Weir Group PLC Annual Report and Financial Statements 2014
Directors’ policy tableThe Group’s overarching remuneration policy is designed to ensure that remuneration supports the Group’s strategy and business objectives. The policy and practice have been developed to support the creation of value for shareholders, drive appropriate behaviours and incentivise outperformance, while being clearly linked to both individual and corporate performance. The Committee is mindful of a broad range of stakeholders in setting this policy and has considered best practice guidelines from shareholders and representative bodies. The Committee has adopted a set of principles which are used as the basis against which remuneration arrangements have been established.
The Group’s remuneration principles are that reward should enable the Group to: – attract, motivate and retain senior executives with the necessary abilities to manage and develop the Group’s activities successfully
for the benefit of shareholders; – clearly align remuneration outcomes with the long term interests of the Group and its shareholders; – drive appropriate behaviours that are in line with the culture of the Group and focus senior executives on the critical business
objectives by rewarding them against challenging performance criteria; and – provide a significant part of potential reward through performance based incentive plans.
Base salary
How the element supports our strategic objectivesThe provision of a competitive base salary as part of an overall compensation package enables the Group to attract and retain talented leaders.
Operation of the elementReviewed annually with effect from 1 April. Set by reference to market practice for a similar role in a peer group of global companies of a similar size and complexity; personal performance; the wider employee context; and economic and labour market conditions.
Maximum potential value and payment at thresholdIt is expected that salary increases for Executive Directors will be made broadly in line with salary increases applied to UK employees or the relevant jurisdiction if an Executive Director is based outside the UK.
Higher increases may apply if there is a change in role or responsibility, the individual is relatively new in role, or there is significant variance to the market. Any significant salary increases will be appropriately explained. The maximum salary level for each Executive Director is set by reference to a peer group of FTSE 51-100 companies and appropriate overseas comparators of similar size and complexity.
The Remuneration Committee has the discretion to change the peer group during the life of this policy.
Performance metrics used, weighting and time period applicableNot applicable.
Benefits and pension
How the element supports our strategic objectivesTo provide a market aligned benefits package.
Operation of the elementBenefits include, but are not limited to: Group health care; car allowance; travel allowance; and death in service insurance.
The Company may also meet certain mobility costs and pay additional tax arising due to an international assignment, and may also provide for long term disability benefits. Additional benefits may be provided where required by legislation or to align the package with market practice where these are not significant in value. Directors and Officers’ Liability insurance will also be provided.
The Group makes no specific provision for Executive Directors’ pensions. However, the Board has considered the implications of the new UK government legislation on auto-enrolment for UK employees and has adopted a policy for all UK employees to be implemented when the auto-enrolment regulations come into force.
Maximum potential value and payment at thresholdThe value of relevant benefits will be determined by the cost of the provision of insured products. As the cost of providing such insurance benefits varies according to premium rates and the cost of other benefits is dependent on market rates and other factors, there is no formal maximum monetary value. Car allowance will normally be no greater than £20,000 per annum. As part of the Company’s provision in respect of auto-enrolment, at senior levels individuals are eligible for a contribution into the pension plan or a cash allowance of 12% of salary per annum from July 2014.
Performance metrics used, weighting and time period applicable Not applicable.

106 The Weir Group PLC Annual Report and Financial Statements 2014
Remuneration Report continued
Directors’ policy table (continued)
Annual bonus (see also notes 1 and 3)
How the element supports our strategic objectivesTo reward the achievement of stretching Group performance for the current year, supporting our strategy of delivering sustainable growth in our key markets.
Operation of the elementThe annual bonus (the Executive Bonus Scheme) is based on in-year performance against financial, personal and strategic goals.The annual bonus plan has two parts – a cash element (70%) and an element converted into shares where there is a restriction on sale for three years (30%). The size of both elements is determined by performance in the year.
Targets are set at the beginning of the performance year which runs from the start to the end of each financial period.
Any changes to original targets, measures or payout levels will be fully explained in the relevant Annual Report on Remuneration.
On change of control, the bonus payment will be pro-rated for time and an assessment of performance over the appropriate period, with the Committee having discretion to make adjustments to this figure if appropriate.
Maximum potential value and payment at threshold150% of salary for Chief Executive.125% of salary for other Executive Directors.
The achievement of stretch targets results in maximum bonus payout. 20% of bonus will pay out for performance at threshold, with payment on a straight line basis between threshold and stretch.
Performance metrics used, weighting and time period applicable The measures, as well as the weightings within these measures, will depend on the strategic focus of the Company in any given year.
The financial element of the annual bonus is based on the achievement of a Group Normalised Profit before Tax and Amortisation (NPBTA) target measured over the financial period.
No more than 20% of the annual bonus will be based on personal performance targets.
Payouts under the NPBTA element may be reduced to the extent that Group working capital targets are not achieved.
The Committee has discretion in exceptional circumstances to alter the measures and/or targets during the performance period if it believes the original measures and/or targets are no longer appropriate.
The Committee also has discretion in exceptional circumstances to alter the payout levels of an award at the end of the performance period if it believes this will better reflect the underlying performance of the Company but in no circumstances will exceed the maximum bonus potential.
Bonus shares subject to restriction on sale
How the element supports our strategic objectivesBonus converted into shares with restriction on sale (Bonus shares), which supplements the long term elements of pay and further aligns executives to the interests of shareholders.
Operation of the element30% of the annual bonus paid in respect of the performance year is converted into shares with a restriction on sale.
Bonus shares are subject to malus and clawback which enables the Company not to release any bonus shares before the end of the restriction period, or to clawback the relevant value after the restriction period has ended for a period of up to three years.
Malus and clawback may be applied in certain circumstances where there is found to be a material misstatement in the audited accounts of the Group or a Group company accounts, where the executive’s action or conduct amounts to gross misconduct, or where there is a significant detrimental reputational impact on the Company for which the executive is responsible.
Bonus shares subject to a restriction on sale may vest on a change of control and on certain other corporate events in accordance with the rules of the 2014 LTIP.
Bonus shares are subject to a restriction on sale under the rules of the 2014 LTIP.
Maximum potential value and payment at threshold30% of any bonus payable is converted into shares.
Performance metrics used, weighting and time period applicable The Bonus shares are subject to a restriction on sale for three years. No performance conditions apply.

Strategic Report Financial StatementsCorporate Governance
107The Weir Group PLC Annual Report and Financial Statements 2014
Performance shares (see also notes 2 and 3)
How the element supports our strategic objectivesTo incentivise executives to achieve sustained growth through superior long term performance and create alignment with shareholders.
The performance share awards reward executives for performance against key measures which are critical to delivering our strategy.
Operation of the elementAllows for annual grants of performance shares. Awards vest after three years, subject to performance conditions. Vested shares for Executive Directors are then subject to a two year holding period.
Participants are entitled to dividend equivalents between award and vesting, paid in additional shares at vesting in respect of awards that vest.
Malus and clawback arrangements operate in respect of performance shares. These enable the Company to reduce unvested awards and to clawback the relevant value of the vested shares for a period of up to three years after the date of vesting. Malus and clawback may be applied in certain situations where there is found to be a material misstatement in the audited accounts of the Group or a Group company accounts, where the executive’s action or conduct amounts to gross misconduct, or where there is a significant detrimental reputational impact on the Company for which the executive is responsible.
Awards granted under the LTIP may vest on a change of control and certain other corporate events, assessed (unless the Committee in its discretion otherwise decides) against performance conditions and on a time pro-rated basis in accordance with the rules of the plan.
Maximum potential value and payment at thresholdAwards may be made to Executive Directors at the following levels: – Chief Executive: 250%. – Other Executive Directors: 200%.
300% of salary may be awarded in exceptional circumstances.
Performance metrics used, weighting and time period applicable Performance conditions measured over three financial years. Vested shares for Executive Directors are then subject to a two year holding period.
Performance measures and relative weightings are: – Earnings per share (EPS) growth (1/3 weighting). – Relative total shareholder return (TSR) (1/3 weighting).
- TSR relative to comparator group of global engineering companies.
- Threshold vesting at median. Maximum vesting at upper quintile.
– Improvement in average return on capital employed (ROCE) (1/3 weighting).
For all three measures, 25% of the maximum award vests at threshold and 100% at maximum, with vesting calculated on a straight line basis.
In exceptional circumstances, where the Committee believes that the original performance measures and targets are no longer appropriate, it has discretion to substitute or vary these measures and targets. The Committee will only take such a course of action where it considers it to be in the best interests of the shareholders. In these exceptional circumstances, the Committee will make full disclosure of the arrangements and their rationale in the following year’s Annual Report on Remuneration.
Shareholding guidelines
How the element supports our strategic objectivesTo ensure the interests of the Executive Directors remain aligned with those of shareholders.
Operation of the element Executive Directors are required to build up a shareholding in the Company over a five year period.
Under the 2014 LTIP, 30% of the annual bonus is converted into shares with a restriction on sale. The Company requires Executive Directors to retain 50% of performance shares received, after the deduction of applicable taxes, from the 2014 LTIP and the bonus shares subject to restriction on sale until the requirements are met.
All shares beneficially owned by an executive and shares subject to a restriction on sale count towards achieving these guidelines. The Committee reviews share ownership levels annually for this group. The Committee has flexibility in the application of this policy to take into account particular individual circumstances.
Maximum potential value and payment at thresholdThe minimum shareholding requirement is as follows: – Chief Executive: 200% of base salary. – Other Executive Directors: 150% of base salary.
Performance metrics used, weighting and time period applicable Not applicable.
Non-Executive Directors’ fees
How the element supports our strategic objectivesTo attract and retain experienced and skilled Non-Executive Directors.
Operation of the elementFees will be reviewed annually by reference to companies of similar size and complexity, economic and labour market conditions as well as time commitment and responsibilities.
Additional allowances are made available to Non-Executive Directors, where appropriate, to reflect the additional time commitment in attending intercontinental Board meetings and operational visits.
Maximum potential value and payment at thresholdIncreases are effective in April and any planned increases in fees will take into account general increases across the Group along with market practice.
The maximum fee level for each Non-Executive Director would be set within the range of fee levels in our peer group of companies of a similar size and complexity.
Performance metrics used, weighting and time period applicable The fees paid to the Chairman and the Non-Executive Directors are not performance related.

108 The Weir Group PLC Annual Report and Financial Statements 2014
Remuneration Report continued
Directors’ policy table (continued)Notes to the policy table1. Annual bonus performance measures and targets – The profit performance measure of Normalised Profit before Tax and Amortisation (NPBTA) was selected by the Company as
profitability is central to the Company’s overall strategy. The performance measure is adjusted to exclude items that are one off in nature, subject to Remuneration Committee approval.
– The performance targets are determined annually by the Committee. The performance targets for the NPBTA performance measure are set in the context of consensus forecasts and the internal budget.
– The performance required for maximum payout is typically set at a level that is above the level of the Company’s forecasts. If performance is in line with the forecast then typically part of the annual bonus would pay out.
– The performance target of NPBTA is adjusted to match the actual foreign exchange rates during the financial period and is also increased or decreased to reflect the impact of any acquisitions or disposals made in the year that are of a size requiring Board approval. For acquisitions, the target is increased by the expected NPBTA from the acquired business. For disposals, the target is reduced by the budgeted NPBTA from the business which was disposed of.
– The Committee is of the view that the performance target for the financial element under the annual bonus is commercially sensitive and that it would be detrimental to the interests of the Company to disclose this before the end of the financial year. Disclosure of the performance target of the financial element in advance could lead the Company to be at a competitive disadvantage as many competitors are not listed in the UK and would not be subject to this requirement. The Company would be releasing potentially commercially sensitive information which many of the Company’s direct competitors in its three end markets would not be required to disclose.
– The personal performance measures relate to achievement of personal and strategic goals. – Personal performance measures and targets are set by the Chairman for the Chief Executive and by the Chief Executive for other
Executive Directors. The Committee discusses and approves these targets for Executive Directors in consultation with the Director of Human Resources and they are linked to the Company’s annual appraisal process.
– The Committee is of the view that the performance targets for the personal element are commercially sensitive as they relate to internal management projects and personal goals.
– The performance targets for the financial elements of the bonus and the main groupings of individual performance measures will be retrospectively disclosed after the end of the relevant financial period in the Annual Report on Remuneration.
2. LTIP performance measures and targets – The Committee selected the performance conditions for the LTIP as these are central to the Company’s overall strategy and are
intended to link reward to long term sustainable growth. – The performance measures are EPS, TSR and ROCE:
- EPS is adjusted earnings per fully paid ordinary share in the capital of the Company calculated on such basis as the Committee may specify. In addition, the EPS figure used to calculate the award may be adjusted for changes in accounting standards to ensure a consistent measurement basis across the performance period.
- TSR is the increase in the net return index (the index that reflects movements in share price over a period and dividend reinvested net of any associated tax credit in shares on the ex-dividend date) for a company as calculated by Datastream (or such other financial information provider as selected by the Committee) over the performance period.
- ROCE is defined as earnings before interest and tax divided by capital employed. Earnings before interest and tax is taken as Group continuing operations after intangibles amortisation but before exceptional items for the relevant financial year. Capital employed is taken as the average of opening and closing Group net assets excluding net debt/cash and pension deficit (net of deferred tax asset) for the relevant financial year. To eliminate the impact of movements in foreign exchange rates over the period of the plan, the average foreign exchange rates for the base year are held constant throughout the plan period. With regard to acquisitions, those acquisitions made in the base year are included, based on a full year’s ownership, for the purposes of target setting. Where acquisitions are made in subsequent years of the plan period, these are excluded from the assessment of performance relative to the target. Where there are disposals during the plan period, the base and target ROCE calculations will be restated to eliminate the contribution from the disposed business in the period of ownership.
– The performance targets are determined annually by the Committee. EPS, TSR and ROCE targets are set to ensure they are sufficiently stretching but also motivational and consistent with the Company’s remuneration strategy. In setting targets the Committee considers the Company’s operating environment, and internal and external growth forecasts.
– The performance required for maximum vesting is typically set at a level that is above the level of the Company’s forecasts. If performance is in line with the forecast then typically part of the award would vest.
– EPS, TSR and ROCE targets are disclosed prospectively in the Annual Report on Remuneration for the relevant year.
3. Differences in remuneration policy for all employees – The Company seeks to operate a locally driven approach to pay and benefits in all its locations. – Employees in management roles are also eligible to participate in an annual bonus. The maximum opportunity available in the annual
bonus scheme is based on the seniority and responsibility of the role. – The LTIP seeks to encourage a shared focus on our corporate goals within the senior management and executive populations. Grants
under the 2014 LTIP may be made to around 300 of the most senior managers in the Group. The nature of the award depends on the individual’s location and seniority. When used, the performance conditions will be the same throughout the Group.
– In markets other than the UK, LTIP awards may be made in the form of a combination of performance shares and/or either restricted shares or share appreciation rights with a corresponding reduction in award level. The restricted shares or share appreciation rights are subject to a service condition of continued employment within the Group.

Strategic Report Financial StatementsCorporate Governance
109The Weir Group PLC Annual Report and Financial Statements 2014
Directors’ Report
The Directors present their report for the year ending 2 January 2015.
This Annual Report has been prepared for, and only for, the members of the Company, as a body, and no other persons. The Company, its directors, employees, agents and advisors, do not accept or assume responsibility to any other person to whom this document is shown or into whose hands it may come, and any such responsibility or liability is expressly disclaimed. This Annual Report may contain statements which are not based on current or historical fact and/or which are forward looking in nature. Please refer to the cautionary statement on page 188.
2015 Annual General MeetingThe Annual General Meeting will be held at 2.30pm on Wednesday 29 April 2015 at the Radisson Blu Hotel, Argyle Street, Glasgow. The Notice of Meeting along with an explanation of the proposed resolutions are set out in a separate circular to shareholders which accompanies this Annual Report and can be downloaded from the Company’s website.
Notice of the AGM is sent to shareholders at least 20 working days before the meeting. The Company conducts the vote at the AGM by electronic poll and the result of the votes, including proxies, is published on the Company’s website after the meeting.
DividendThe Directors have recommended a final dividend of 29.0p per share for the 52 weeks ended 2 January 2015. Payment of this dividend is subject to shareholder approval at the 2015 AGM.
Substantial shareholdersAt 2 January 2015, the Company had been notified in accordance with the UK Listing Authority’s Disclosure Rules and Transparency Rules that the following held, or were beneficially interested in, 3% or more of the Company’s issued share capital.
ShareholderNumber of
shares
Percentage of issued share
capital
Aberdeen Asset Managers Ltd 10,797,589 5.07%
AXA 10,637,959 4.99%
Norges Bank 8,503,919 3.99%
Note The entire shareholdings of AXA and Aberdeen Asset Managers Ltd are held indirectly.
No changes have been disclosed to the Company between 2 January 2015 and 25 February 2015. Since this date, the interest of any shareholder listed above may have increased or decreased. Information provided to the Company pursuant to the relevant Disclosure Rules and Transparency Rules is publicly available via the regulatory information services. No requirement to notify the Company of any increase or decrease would have arisen unless the holding moved up or down through a whole number percentage level. The percentage level may increase (if the Company cancelled shares pursuant to the power to purchase its own shares) or decrease (on the issue of new shares under the LTIP).
Employment policy and involvementThe average number of employees in the Group during the period is given in note 4 to the Group financial statements on page 133.
Group companies operate within a framework of HR policies, practices and regulations appropriate to their market sector and country of operation. Policies and procedures for recruitment, training and career development promote equality of opportunity regardless of gender, sexual orientation, age, marital status, disability, race, religion or other beliefs and ethnic or national origin.
The aim is to encourage a culture in which all employees have the opportunity to develop fully according to their individual abilities and the needs of the Group. The Group remains committed to the fair treatment of people with disabilities regarding applications, training, promotion and career development.
Employee involvement and feedback is actively encouraged. A variety of ways are used to consult and inform employees including a Groupwide bulletin, e-mail, intranet and local briefings. These are designed to facilitate dialogue while enabling the development of a common awareness among employees of what affects business performance.
Further details of the Group’s employment policies and involvement are detailed in the Our People section of the Sustainability Review on pages 61 to 63.
Greenhouse gas emissionsThe Company is required to state the annual quantity of emissions in tonnes of carbon dioxide equivalent from activities for which the Company is responsible, including the combustion of fuel and the operation of any facility. The Group’s global greenhouse gas (GHG) emissions for 2014 and related disclosures required under The Companies Act 2006 (Strategic Report and Directors’ Report) Regulations 2013 are contained in the Environment section of the Sustainability Review on pages 54 to 57 and form part of the Directors’ Report disclosures.
Financial instrumentsThe information required in respect of financial instruments as required by Schedule 7 of The Large and Medium-sized Companies and Groups (Accounts and Reports) Regulations 2008 is given in note 30 to the Group financial statements on pages 161 to 168.

110 The Weir Group PLC Annual Report and Financial Statements 2014
Share capital and rights attaching to the Company’s sharesDetails of the issued share capital of the Company, which comprises a single class of ordinary shares of 12.5p each are set out in note 25 to the Group financial statements on page 156. The rights attaching to the shares are set out in the Company’s Articles of Association. There are no special control rights in relation to the Company’s shares and the Company is not aware of any agreements between shareholders that may result in restrictions on the transfer of securities and/or voting rights.
The Weir Group has two employee benefit trusts: one with the trustees Kleinwort Benson (Guernsey) Trustees Limited (the ‘Kleinwort EBT’) and one with the trustees Appleby Trust (Jersey) Limited (the ‘Appleby EBT’).
During the period, the 2011 LTIP award vested and the trustees of the Kleinwort EBT transferred 36,239 ordinary shares to employees to satisfy the LTIP awards using ordinary shares purchased by the Kleinwort EBT in the market. In addition, a total of 222,521 ordinary shares, with an aggregate nominal value of £27,815.13, were allotted during the period in connection with the Company’s LTIP. The 222,521 shares were issued to senior managers of the Group pursuant to LTIP awards granted on 17 March 2011, on which date the closing share price was £16.06. The allotments of these 222,521 shares were made as follows: 17 March 2014 – 94,612 shares at a closing price of £25.06; 21 March 2014 – 10,042 shares at a closing price of £24.40; 1 April 2014 – 312 shares at a closing price of £25.18; 7 April 2014 – 1,930 shares at a closing price of £25.17; 25 April 2014 – 4,789 shares at a closing price of £26.62; 13 May 2014 – 3,022 shares at a closing price of £26.96; 15 May 2014 – 766 shares at a closing price of £25.98; 28 May 2014 – 942 shares at a closing price of £25.84, 29 May 2014 – 85,035 shares at a closing price of £26.11; 13 June 2014 – 4,499 shares at a closing price of £26.59; 11 August 2014 – 10,093 shares at a closing price of £26.07; 18 September 2014 – 6,479 shares at a closing price of £26.30.
Both EBTs have agreed to waive any right to all dividend payments on shares held by them, with the exception of shares held in respect of awards which have a dividend entitlement. Details of the shares held by the EBTs are set out in note 25 to the Group financial statements on page 156. The 83,850 shares held in the Appleby EBT for the deferred element are the shares in respect of which dividends have not been waived. The Kleinwort EBT holds, through its account nominee K.B. (CI) Nominees Limited, 0.03% of the issued share capital of the Company, as at 2 January 2015, in trust for the benefit of certain Executive Directors and senior executives of the Group. The Appleby EBT holds, through account nominee CGWL Nominees Ltd, 0.12% of the issued share capital of the Company as at 2 January 2015. 0.04% of this is held in trust for the benefit of certain senior executives of the Group, and 0.08% is held in trust on behalf of the Company for satisfaction of any future vesting of the Weir Group Deferred Bonus Plan. With the exception of the shares held for the benefit of certain senior executives, the voting rights in relation to these shares are exercised by the trustees. The EBTs may vote or abstain from voting with the shares or accept or reject any offer relating to shares, in any way they see fit, without incurring any liability and without being required to give reasons for their decision.
Repurchase of sharesAt the 2014 Annual General Meeting, shareholders renewed the Company’s authority to make market purchases of up to 21.3m ordinary shares (representing approximately 10% of the issued share capital excluding treasury shares). No shares were purchased under this authority during the 52 weeks ended 2 January 2015 and at the forthcoming Annual General Meeting, the Board will again seek shareholder approval to renew the annual authority for the Company to make market purchases at the same level.
Voting rightsThe Company’s Articles of Association provide that on a show of hands at a general meeting of the Company, every holder of ordinary shares present in person and by proxy and entitled to vote shall have one vote and on a poll, every member present in person or by proxy and entitled to vote shall have one vote for every ordinary share held. The Notice of the AGM specifies deadlines for exercising voting rights and appointing a proxy or proxies to vote in relation to resolutions to be passed at the AGM. The Company conducts the vote at the AGM by electronic poll. All proxy votes are counted and the numbers for, against or withheld in relation to each resolution are announced at the AGM and published on the Company’s website after the meeting.
The Articles of Association may only be amended by a special resolution passed at a general meeting of shareholders.
Transfer of sharesThere are no restrictions on the transfer of ordinary shares in the Company, other than as contained in the Articles of Association: – The Directors may refuse to register any transfer of any certificated share which is not fully paid up, provided that this power will
not be exercised so as to disturb the market in the Company’s shares. – The Directors may also refuse to register the transfer of a certificated share unless it is delivered to the registrar’s office, or such
other place as the Directors have specified, accompanied by a certificate for the shares to be transferred and such other evidence as the Directors may reasonably require to prove title of the intending transferor.
Certain restrictions may from time to time be imposed by laws and regulations, for example, insider trading laws, in relation to the transfer of shares.
Appointment and replacement of DirectorsThe provisions about the appointment and re-election of Directors of the Company are contained in the Articles of Association.
Powers of DirectorsThe business of the Company is managed by the Directors who may exercise all the powers of the Company, subject to the provisions of the Company’s Articles of Association, any special resolution of the Company and any relevant legislation.
Directors’ indemnitiesThe Company has granted indemnities to each of its Directors in respect of all losses arising out of or in connection with the execution of their powers, duties and responsibilities as Directors to the extent permitted by the Companies Act 2006 and the Company’s Articles of Association. In addition, directors and officers of the Company and its subsidiaries and trustees of its pension schemes are covered by directors and officers’ liability insurance.
Directors’ Report continued

Strategic Report Financial StatementsCorporate Governance
111The Weir Group PLC Annual Report and Financial Statements 2014
Pension scheme indemnitiesThe Group operates two defined benefit pension schemes in the UK which provide retirement and death benefits for employees and former employees of the Group. The corporate trustees of the pension schemes are The Weir Group Pension Trust Limited and The Weir Group Senior Executives Pension Trust Limited, which are subsidiary companies of the Group. Qualifying pension scheme indemnity provisions, as defined in section 235 of the Companies Act 2006, were in force for the financial year ended 2 January 2015 and remain in force for the benefit of each of the directors of the corporate trustees of the pension schemes. These indemnity provisions cover, to the extent permitted by law, certain losses or liabilities incurred as a director or officer of the corporate trustees of the pension schemes.
Change of control – significant agreementsThe following significant agreements contain provisions entitling the counterparties to require prior approval, exercise termination, alteration or similar rights in the event of a change of control of the Company.
The Group has in place a five year US$800m multi-currency revolving credit facility with a syndicate of 11 banks due to mature in September 2019. Under the terms of this agreement, if there is a change of control of the Company, any lender may request, by not less than 30 days’ notice to the Company, that its commitment be cancelled and all outstanding amounts be repaid to that lender at the expiry of such notice period.
The Company has in issue fixed rate private placement notes with a range of maturities: US$70m at an interest rate of 5.03% due on 11 January 2018, £43m at an interest rate of 5.36% due on 11 January 2018, US$210m at an interest rate of 3.69% due on 16 February 2019, US$590m at an interest rate of 4.27% due on 16 February 2022 and US$200m at an interest rate of 4.34% due on 16 February 2023. Under the terms of the applicable note purchase agreements, if there is a change of control of the Company, the notes must be offered for prepayment by the Company within seven days of the change of control. The prepayment date would be no later than 60 days after the offer of prepayment by the Company. Private placement notes for US$90m at an interest rate of 4.2% were repaid on 11 January 2015 and £12m at an interest rate of 4.58% were repaid on 11 January 2015.
There are no agreements between the Company and its Directors or employees providing for compensation for loss of office or employment (whether through resignation, purported redundancy or otherwise) that occurs because of a takeover bid.
Management reportThe Strategic Report and the Directors’ Report constitute the management report as required under the Disclosure and Transparency Rule 4.1.5R.
Directors’ Report disclosures contained in the Strategic ReportThe Company has chosen to disclose the following information in the Strategic Report on pages 1 to 68: – Particulars of any important events, if any, affecting the Company which have occurred since the end of the financial year. – An indication of likely future developments in the business of the Company. – An indication of the activities of the Company in the field of research and development. – Details of Employee Involvement. – Information on Greenhouse Gas emissions.
Corporate Governance StatementThe information which fulfils the requirements of the Disclosure Rules and Transparency Rules can be found in this Directors’ Report and in the Corporate Governance sections on pages 69 to 108, which form part of this Directors’ Report and are incorporated into it by reference.
Disclosure of information under Listing Rule 9.8.4The information that fulfils the reporting requirements relating to the following matters can be found on the pages identified.
Subject matter Page reference
Allotment of shares for cash (LR 9.8.4(7)) Page 110 – reference to allotment of 222,521 ordinary shares, with an aggregate nominal value of £27,815.13.
Waiver of dividends (LR 9.8.4(12)) Page 110 – reference to waiver of dividends by Kleinwort EBT and Appleby EBT (as defined at page 110), referencing note 25 to the consolidated financial statements on page 156.
ConfirmationsSo far as each of the Directors is aware, there is no relevant audit information (as defined by section 481 of the Companies Act 2006) of which the Company’s auditors are unaware.
Each of the Directors has taken all of the steps that he or she ought to have taken as a Director to make themselves aware of any relevant audit information and to establish that the Company’s auditors are aware of that information.

112 The Weir Group PLC Annual Report and Financial Statements 2014
Going concernThe Directors have a reasonable expectation that the Group has adequate resources to continue to operate for the foreseeable future. For this reason, they continue to adopt the going concern basis in preparing the financial statements. In forming this view, the Directors have reviewed the Group’s budgets, plans and cash flow forecasts, including market downturn sensitivities. In addition, the Directors have considered the potential impact of credit risk and liquidity risk detailed in note 30 to the Group financial statements on pages 161 to 168. Each of these items has been considered in relation to the Group’s banking facilities described in note 20 on pages 147 and 148.
The Directors’ Report has been approved by the Board of Directors in accordance with the Companies Act 2006.
Statement of Directors’ ResponsibilitiesThe Directors are responsible for preparing the annual report and the financial statements in accordance with applicable law and regulations.
Company law requires the Directors to prepare financial statements for each financial year. Under that law, the Directors have prepared the Group financial statements in accordance with International Financial Reporting Standards (IFRS) as adopted by the European Union and the Company financial statements in accordance with UK Accounting Standards and applicable law.
In preparing those financial statements, the Directors are required to: – Select suitable accounting policies and then apply them consistently. – Make judgements and estimates that are reasonable and prudent. – State that the Group financial statements have complied with IFRS as adopted by the European Union, subject to any material
departures being disclosed and explained. – State for the Company financial statements whether the applicable UK Accounting Standards have been followed, subject to any
material departures being disclosed and explained.
The Directors are responsible for keeping proper accounting records which disclose with reasonable accuracy at any time the financial position of the Group and enable them to ensure that the Group financial statements comply with the 2006 Act and Article 4 of the IASRegulation. They are also responsible for safeguarding the assets of the Group and hence for taking reasonable steps for the prevention and detection of fraud and other irregularities.
The Directors are responsible for the maintenance and integrity of the Company’s website. Legislation in the United Kingdom governing the preparation and dissemination of accounts may differ from legislation in other jurisdictions.
The Directors confirm that they have complied with the above requirements in preparing the financial statements.
The Directors consider that the Annual Report and Financial Statements, taken as a whole, are fair, balanced and understandable and provide the information necessary for shareholders to assess the Group’s performance, business model and strategy.
Each of the Directors, as at the date of this report, confirms to the best of their knowledge that: – The financial statements, prepared in accordance with the applicable set of accounting standards, give a true and fair view of the
assets, liabilities, financial position and profit of the Group. – The Strategic Report and the Directors’ Report include a fair review of the development and performance of the business and the
position of the Group, together with a description of the principal risks and uncertainties that it faces.
On behalf of the Board of Directors
Charles Berry Keith CochraneChairman Chief Executive25 February 2015 25 February 2015
Directors’ Report continued

Strategic Report Financial StatementsCorporate Governance
113The Weir Group PLC Annual Report and Financial Statements 2014
Independent Auditor’s Report to the Members of The Weir Group PLC
Opinion on the financial statements In our opinion: – the financial statements give a true and fair view of the state of the Group’s and of the Parent Company’s affairs as at 2 January 2015
and of the Group’s profit for the 52 weeks then ended; – the Group financial statements have been properly prepared in accordance with International Financial Reporting Standards (IFRSs)
as adopted by the European Union; – the Parent Company financial statements have been properly prepared in accordance with United Kingdom Generally Accepted
Accounting Practice; and – the financial statements have been prepared in accordance with the requirements of the Companies Act 2006 and, as regards the
Group financial statements, Article 4 of the IAS Regulation.
What we have auditedWe have audited the Group financial statements and Parent Company financial statements (together, the ‘financial statements’) of The Weir Group plc for the 52 weeks ended 2 January 2015 which comprise: – for the Group financial statements, the Consolidated Income Statement, the Consolidated Statement of Comprehensive Income,
the Consolidated Balance Sheet, the Consolidated Cash Flow Statement, the Consolidated Statement of Changes in Equity and the related notes 1 to 32; and
– for the Parent Company financial statements, the Company Balance Sheet and the related notes 1 to 17.
The financial reporting framework that has been applied in the preparation of the Group financial statements is applicable law and International Financial Reporting Standards (IFRSs) as adopted by the European Union. The financial reporting framework that has been applied in the preparation of the Company financial statements is applicable law and United Kingdom Accounting Standards (United Kingdom Generally Accepted Accounting Practice).
Scope of the audit of the financial statements An audit involves obtaining evidence about the amounts and disclosures in the financial statements sufficient to give reasonable assurance that the financial statements are free from material misstatement, whether caused by fraud or error. This includes an assessment of: whether the accounting policies are appropriate to the Group’s and the Parent Company’s circumstances and have been consistently applied and adequately disclosed; the reasonableness of significant accounting estimates made by the Directors; and the overall presentation of the financial statements. In addition, we read all the financial and non-financial information in the Annual Report to identify material inconsistencies with the audited financial statements and to identify any information that is apparently materially incorrect based on, or materially inconsistent with, the knowledge acquired by us in the course of performing the audit. If we become aware of any apparent material misstatements or inconsistencies we consider the implications for our report.
Our application of materiality We set certain thresholds for materiality. These provide a basis for determining the nature, timing and extent of risk assessment procedures, identifying and assessing the risk of material misstatement and determining the nature, timing and extent of further audit procedures.
Based on our professional judgement, we determined materiality for the Group to be £18.0m (2013: £20.0m), which is 5% of adjusted profit before tax from continuing operations. We have considered profit before tax from continuing operations, adjusted for the impact of exceptional items, as we consider this adjusted measure to be a key driver of business value and therefore a focus for shareholders. The decrease in materiality applied from the prior year is reflective of the reduction in this adjusted measure.
On the basis of our risk assessments, together with our assessment of the overall control environment, our judgement is that performance materiality was 75% (2013: 75%) of our materiality, namely £13.5 million (2013: £15.0 million). Our objective in adopting this approach was to ensure that uncorrected and undetected audit differences in all accounts did not exceed our planning materiality level.
We agreed with the Audit Committee that we would report to the Committee all individual unadjusted audit differences and significant judgemental items which either affect the Income Statement in excess of £0.5m (2013: £0.5m), or the Balance Sheet in excess of £2.0m (2013: £2.0m), as well as differences below that threshold that, in our professional judgement, warrant reporting on qualitative grounds. We also report to the Audit Committee on disclosure matters that we identified when assessing the overall presentation of the financial statements. Our assessment of risks of material misstatement Changes from prior yearWe no longer consider that the fair valuation assessment of contingent consideration is a risk that had the greatest effect on the audit strategy, following the exceptional gain on release of Mathena Inc. contingent consideration liability in 2013.
We no longer consider that acquisition accounting is a risk that had the greatest effect on the audit strategy, following consideration of the size and complexity of the acquisition fair values for current year acquisitions.
We have considered that a material misstatement arising from the presentation and consistency of costs and income within exceptional items is a risk that had the greatest effect on the audit strategy, following the Group-wide efficiency review announced in the current year.

114 The Weir Group PLC Annual Report and Financial Statements 2014
Independent Auditor’s Report to the Members of The Weir Group PLC continued
Our assessment of risks of material misstatement (continued)Current year assessmentWe identified the following risks of material misstatement that had the greatest effect on the audit strategy; the allocation of resources in the audit; and directing the efforts of the engagement team:
Risk How the scope of our audit responded to the risk
Exceptional items: Group-wide efficiency reviewRefer to page 46 (Financial Review), page 87 (Audit Committee report) and page 134 (note 5 to the financial statements).
The presentation, consistency and recognition of costs and income within exceptional items is a key determinant in the assessment of the quality of the Group’s underlying earnings.
We have evaluated this as a risk of material misstatement, given the increase in items presented as exceptional from prior years.
The primary components of the exceptional items in the current year – and therefore the focus of our audit – were the charge relating to the Group-wide efficiency review announced in November 2014 (£49.4m) and the impairment of goodwill within the Pressure Control Cash Generating Unit (CGU) (£160.0m).
We have considered the risk relating to the impairment of goodwill later within this report.
We obtained and assessed management’s summary of charges incurred under the Group-wide efficiency review, split by Division and principal business unit. We looked to understand with Management the rationale behind each business units’ charge, then selected the seven key business units for further consideration.
For these seven key business units, we obtained a breakdown of the charges and obtained supporting source documentation, rationale behind key assumptions or the estimation process undertaken to confirm the appropriateness of charges recognised.
We further considered the nature of these charges, to assess whether they are in line with the Group’s accounting policy for exceptional items, and the Financial Reporting Council’s reminder on consistency and clarity of presentation.
We also assessed whether the disclosures within the financial statements in note 5 and related narrative reporting provide sufficient detail for the reader to understand the nature of these items.
Carrying value of goodwill and intangible assetsRefer to page 46 (Financial Review), page 87 (Audit Committee report), page 134 (note 5 to the financial statements) and pages 143 to 144 (note 14 to the financial statements).
The key assumptions used in the assessment of the carrying value of goodwill and intangible assets are determined with reference to judgemental factors such as future projected cash flows, growth rates and appropriate discount rates. This therefore gives rise to inherent subjectivity in the carrying value of these assets recorded in the financial statements.
In particular, the Pressure Control and Pressure Pumping CGUs are noted as requiring specific focus as a direct result of the near-term lower oil price environment those CGU’s operate in.
An impairment charge of £160.0m was noted as recognised against Goodwill in the Pressure Control CGU at the year end.
We obtained and considered management’s impairment testing, considering the calculation methodology, sources for key assumptions and sensitivities applied.
We challenged the key assumptions behind the model, being discount rate, long term growth rate, revenue growth and EBIT margins; utilising our valuations specialists to assist in this review. The significant assumptions and their rationale are disclosed in note 14 to the financial statements.
We considered potential indicators of impairment for each Group entity with associated intangible assets, focusing on those businesses experiencing particularly challenging markets and subject to restructuring under the Group-wide efficiency review. We further considered the Group’s sensitivity analysis showing the impact of a reasonable change in impairment assumptions, to determine whether an impairment charge was required.
For the Pressure Control and Pressure Pumping CGUs, given the near-term lower oil price environment, we focused on the projected cash flows for these businesses under a range of oil price assumptions in the short and long terms, including scenarios generated from external analyst reports and internal EY economic projections.
For the Minerals CGU, we focused on challenging the short to medium term growth assumptions for these businesses through sensitivity analyses, following the rationalisation of certain businesses in that CGU as part of the Group-wide efficiency review.
Following management’s assessment of impairment, and related sensitivities, an impairment charge of £160.0m was recognised against Goodwill in the Pressure Control CGU at the year end. The rationale behind this charge is described in note 14 to the financial statements.

Strategic Report Financial StatementsCorporate Governance
115The Weir Group PLC Annual Report and Financial Statements 2014
Risk How the scope of our audit responded to the risk
Valuation of inventoryRefer to page 46 (Financial Review), page 88 (Audit Committee report) and page 145 (note 16 to the financial statements).
Following the shift of North American drilling activity from gas to oil and liquids rich shale formations in Q1 2012, the North American Oil and Gas pressure pumping business continues to have excess capacity in certain pressure pumping equipment sectors within that market.
Furthermore, the recent decline in oil prices leaving a near-term lower oil price environment and corresponding effect on oil rig count has increased the valuation risk within the Oil and Gas Division.
Focusing on the North American Oil & Gas Pressure Pumping business, we performed an aged analysis of the inventory, comparing specific inventory lines against market activity as well as current and forecast sales to identify excess or obsolete inventory exposures.
For full and specific scope business units within the Oil & Gas division, we performed further inquiries of management, review of the underlying product lines, detailed gross margin analysis and review of booked sales orders.
We also considered the application of the inventory provisioning accounting policy, including challenging the appropriateness of assumptions made by management, through comparison of the provisioning made against our analysis of excess or obsolete inventory.
Adequacy of the Group’s liability provisioning Refer to page 46 (Financial Review), page 88 (Audit Committee report), pages 149 to 150 (note 22 to the financial statements) and page 159 (note 27 to the financial statements).
The recognition and valuation of the expected outcome of employee related or other legal claims and exposures across the Group requires the exercise of management judgement in assessing the amounts recorded and the disclosures made in the financial statements.
For those exposures where provision is made, the use of estimates within those provisions gives rise to inherent subjectivity in the amounts recorded in the financial statements.
For those exposures where no provision has been made, the obligation to disclose the nature and estimate of its financial impact gives rise to further judgement in the disclosure within the financial statements.
We evaluated and challenged the assumptions and methodologies applied behind specific employee related provision calculations, and compared against our expectations. Where applicable, we have agreed projected costs against historical cost experience or supporting external evidence.
We have discussed the status of current litigation or regulatory issues with Group Legal Counsel and external lawyers throughout our audit process, reviewing correspondence with third parties and related contractual agreements.
We considered the current status of the UN Oil for Food programme and Philippines Gold contingent liability disclosures in note 27. This included review of current correspondence relating to these cases, meeting with Group Legal Counsel on several occasions and obtaining confirmations from external legal advisors engaged by management.
Following the increase in US asbestos-related claims during the year, we have considered management’s review to assess and estimate the settlement and defence costs associated with these claims, and the adequacy of the Group’s related insurance policies. This included review of correspondence with insurers and actuaries, examination of the calculation behind the Directors’ best estimate of the future liability and disclosure within note 22.
Exposure to significant tax risksRefer to page 46 (Financial Review), page 88 (Audit Committee report) and pages 135 to 136 (note 7 to the financial statements).
The value of the tax provisions recorded in respect of a number of uncertain tax positions which require judgements in respect of the likely outcome of negotiations with and enquiries from various tax authorities.
We have utilised internal national and appropriate international taxation specialists to assist the Group team in the evaluation and challenge of the assumptions and estimates in relation to the level of provisions recognised for significant tax risks.
We have considered the movements in these provisions during the period, and the closing balances against our expectations. We also considered any penalty regimes that could apply should any of the tax positions be successfully challenged.

116 The Weir Group PLC Annual Report and Financial Statements 2014
Independent Auditor’s Report to the Members of The Weir Group PLC continued
Our assessment of risks of material misstatement (continued)Current year assessment (continued)
Risk How the scope of our audit responded to the risk
Revenue and profit recognition on construction contractsRefer to page 125 (note 2 (iii) to the financial statements) and pages 129 to 132 (note 3 to the financial statements).
Auditing standards require that we consider the risk of fraud or management override of internal controls in revenue recognition.
We have evaluated that the key risk of misstatement due to management override, fraud and error specifically relates to: – revenue recognition where construction contract accounting
principles are followed (as this involves judgement over future cost elements and percentage of completion).
– manual journal adjustments to revenues made as a result of overriding existing processes or controls.
In relation to construction contract accounting risk, we tested controls around accounting for construction contracts at five specific scope components, performed reviews of those contracts at those components with operational management, and challenged the appropriateness of assumptions made by management following the outcome of similar assumptions made at the prior year end.
In relation to the revenue manual journal entry risk, we tested reconciliation and manual journal entry authorisation controls at those full scope and specific scope components where we deemed there to be a higher country, control or management risk. In our testing of revenue recognition at those components, we considered the timing of revenue recognised and validity of manual journal entries posted around the year end. For transactions close to the period end we tested that cut-off procedures were appropriately applied.
An overview of the scope of our audit Following our assessment of the risk of material misstatement to the Group financial statements, we selected twenty one (2013: twenty one) components which represent the principal business units within the Group’s three reportable segments.
Of the twenty one components selected we performed an audit of the complete financial information of three components (full scope components), which were selected based on their size or risk characteristics. For the remaining eighteen selected components (specific scope components) we performed audit procedures on specific accounts within the component that we considered had the potential for the greatest impact on the amounts in the Group financial statements either because of the size of these accounts or their risk profile.These twenty one components account for 74% (2013: 69%) of revenue, 78% (2013: 73%) of adjusted profit before tax from continuing operations and 70% (2013: 75%) of net assets, although for components where a specific scope audit was performed, not all balances that comprise these coverage percentages have been audited.
The audits of these components are performed at a materiality level calculated by reference to a proportion of the Group materiality appropriate to the relevant account size, risk profile, changes in the business environment and other factors for the business concerned. In the current year, the range of performance materiality allocated to components was £7.4m to £1.2m (2013: £7.5m to £1.5m).
In addition, certain central reporting entities and Group functions including those covering treasury, taxation, pensions and the Parent Company were subject to a full scope audit. In order to support our conclusion that there were no significant risks of material misstatement of the aggregated financial information of the remaining business units not subject to a full or specific scope audit, we tested the consolidation process, carried out analytical procedures and performed selected substantive procedures for any significant balance sheet items in excess of performance materiality at the Group level.
The Group audit team continued to follow a programme of planned visits and Video Conferencing that has been designed to ensure that the Senior Statutory Auditor or his designate visits those components with greatest exposure to the risks of material misstatements noted above. This year, visits included key business units in Australia, United States of America, Canada and the United Kingdom. We also ensure we have on-going communication with component teams throughout the year.
Opinion on other matters prescribed by the Companies Act 2006 In our opinion: – the part of the Remuneration Report to be audited has been properly prepared in accordance with the Companies Act 2006; and – the information given in the Strategic Report and the Directors’ Report for the financial year for which the financial statements are
prepared is consistent with the Group and Parent Company financial statements.

Strategic Report Financial StatementsCorporate Governance
117The Weir Group PLC Annual Report and Financial Statements 2014
Matters on which we are required to report by exception We have nothing to report in respect of the following:
Under the ISAs (UK and Ireland), we are required to report to you if, in our opinion, information in the annual report is: – materially inconsistent with the information in the audited financial statements; or – apparently materially incorrect based on, or materially inconsistent with, our knowledge of the Group acquired in the course
of performing our audit; or – is otherwise misleading.
In particular, we are required to consider whether we have identified any inconsistencies between our knowledge acquired during the audit and the Directors’ statement that they consider the Annual Report is fair, balanced and understandable and whether the Annual Report appropriately discloses those matters that we communicated to the Audit Committee which we consider should have been disclosed.
Under the Companies Act 2006 we are required to report to you if, in our opinion: – adequate accounting records have not been kept by the Parent Company, or returns adequate for our audit have not been received
from branches not visited by us; or – the Parent Company financial statements and the part of the Remuneration Report to be audited are not in agreement with the
accounting records and returns; or – certain disclosures of directors’ remuneration specified by law are not made; or – we have not received all the information and explanations we require for our audit.
Under the Listing Rules we are required to review: – the Directors’ statement, set out on page 112, in relation to going concern; and – the part of the Corporate Governance Report relating to the Company’s compliance with the nine provisions of the UK Corporate
Governance Code specified for our review.
Respective responsibilities of directors and auditor As explained more fully in the Directors’ Responsibilities Statement set out on page 112, the directors are responsible for the preparation of the Group financial statements and for being satisfied that they give a true and fair view.
Our responsibility is to audit and express an opinion on the Group financial statements in accordance with applicable law and International Standards on Auditing (UK and Ireland). Those standards require us to comply with the Auditing Practices Board’s Ethical Standards for Auditors.
This report is made solely to the company’s members, as a body, in accordance with Chapter 3 of Part 16 of the Companies Act 2006. Our audit work has been undertaken so that we might state to the company’s members those matters we are required to state to them in an auditor’s report and for no other purpose. To the fullest extent permitted by law, we do not accept or assume responsibility to anyone other than the company and the company’s members as a body, for our audit work, for this report, or for the opinions we have formed.
James Nisbet (Senior Statutory Auditor)for and on behalf of Ernst & Young LLP, Statutory AuditorGlasgow25 February 2015

118 The Weir Group PLC Annual Report and Financial Statements 2014
Consolidated Income Statement for the 52 weeks ended 2 January 2015
52 weeks ended 2 January 2015 53 weeks ended 3 January 2014
Notes
Before exceptional
items & intangibles
amortisation £m
Exceptional items &
intangibles amortisation
(note 5) £m
Total £m
Before exceptional
items & intangibles
amortisation £m
Exceptional items &
intangibles amortisation
(note 5) £m
Total £m
Continuing operations
Revenue 3 2,438.2 – 2,438.2 2,429.8 – 2,429.8
Continuing operations
Operating profit before share of results of joint ventures 439.8 (257.3) 182.5 458.1 23.8 481.9
Share of results of joint ventures 15 10.0 – 10.0 8.4 – 8.4
Operating profit 449.8 (257.3) 192.5 466.5 23.8 490.3
Finance costs 6 (44.5) (2.1) (46.6) (47.9) (10.7) (58.6)
Finance income 6 6.0 – 6.0 3.0 – 3.0
Other finance costs – retirement benefits 24 (2.8) – (2.8) (3.5) – (3.5)
Profit before tax from continuing operations 408.5 (259.4) 149.1 418.1 13.1 431.2
Tax expense 7 (105.5) 30.1 (75.4) (107.5) 12.0 (95.5)
Profit for the period from continuing operations 303.0 (229.3) 73.7 310.6 25.1 335.7
Profit for the period from discontinued operations 8 – 1.0 1.0 – – –
Profit for the period 303.0 (228.3) 74.7 310.6 25.1 335.7
Attributable to:
Equity holders of the Company 301.4 (228.3) 73.1 309.8 25.1 334.9
Non-controlling interests 1.6 – 1.6 0.8 – 0.8
303.0 (228.3) 74.7 310.6 25.1 335.7
Earnings per share 9
Basic – total operations 34.3p 157.2p
Basic – continuing operations 141.3p 33.8p 145.4p 157.2p
Diluted – total operations 34.2p 156.6p
Diluted – continuing operations 140.9p 33.7p 144.9p 156.6p

Strategic Report Financial StatementsCorporate Governance
119The Weir Group PLC Annual Report and Financial Statements 2014
Consolidated Statement of Comprehensive Income for the 52 weeks ended 2 January 2015
Notes
52 weeks ended
2 January 2015
£m
53 weeks ended
3 January 2014
£m
Profit for the period 74.7 335.7
Other comprehensive income
(Losses) gains taken to equity on cash flow hedges (4.0) 0.1
Exchange gains (losses) on translation of foreign operations 61.3 (111.3)
Exchange (losses) gains on net investment hedges (16.1) 16.5
Reclassification adjustments on cash flow hedges 0.9 0.2
Tax relating to other comprehensive income (expense) to be reclassified in subsequent periods 7 0.3 0.3
Items that are or may be reclassified to profit or loss in subsequent periods 42.4 (94.2)
Remeasurements on defined benefit plans 24 (31.1) 8.0
Tax relating to other comprehensive (expense) income that will not be reclassified in subsequent periods 7 6.8 (2.2)
Items that will not be reclassified to profit or loss in subsequent periods (24.3) 5.8
Net other comprehensive income (expense) 18.1 (88.4)
Total net comprehensive income for the period 92.8 247.3
Attributable to:
Equity holders of the Company 90.7 246.5
Non-controlling interests 2.1 0.8
92.8 247.3

120 The Weir Group PLC Annual Report and Financial Statements 2014
Consolidated Balance Sheetat 2 January 2015
Notes
2 January 2015
£m
3 January 2014
£m
ASSETS
Non-current assets
Property, plant & equipment 11 435.0 398.7
Intangible assets 12 1,638.3 1,614.5
Investments in joint ventures 15 33.7 27.1
Deferred tax assets 23 22.8 17.2
Other receivables 17 22.3 –
Retirement benefit plan assets 24 4.1 1.4
Derivative financial instruments 30 3.5 1.1
Total non-current assets 2,159.7 2,060.0
Current assets
Inventories 16 551.3 485.0
Trade & other receivables 17 625.0 497.1
Construction contracts 18 31.3 28.3
Derivative financial instruments 30 10.5 11.1
Income tax receivable 5.8 2.3
Cash & short-term deposits 19 178.7 79.1
Total current assets 1,402.6 1,102.9
Total assets 3,562.3 3,162.9
LIABILITIES
Current liabilities
Interest-bearing loans & borrowings 20 166.1 26.5
Trade & other payables 21 581.4 476.8
Construction contracts 18 13.8 12.1
Derivative financial instruments 30 11.3 9.6
Income tax payable 32.1 36.7
Provisions 22 65.1 28.9
Total current liabilities 869.8 590.6
Non-current liabilities
Interest-bearing loans & borrowings 20 873.3 799.6
Other payables 21 25.6 22.4
Derivative financial instruments 30 3.1 0.6
Provisions 22 47.4 25.7
Deferred tax liabilities 23 162.5 165.5
Retirement benefit plan deficits 24 98.4 71.8
Total non-current liabilities 1,210.3 1,085.6
Total liabilities 2,080.1 1,676.2
NET ASSETS 1,482.2 1,486.7
CAPITAL & RESERVES
Share capital 25 26.8 26.7
Share premium 38.0 38.0
Treasury shares (5.8) (5.8)
Capital redemption reserve 0.5 0.5
Foreign currency translation reserve (12.6) (57.3)
Hedge accounting reserve (2.0) 0.8
Retained earnings 1,430.5 1,479.3
Shareholders’ equity 1,475.4 1,482.2
Non-controlling interests 6.8 4.5
TOTAL EQUITY 1,482.2 1,486.7
Approved by the Board of Directors on 25 February 2015
Keith Cochrane Jon StantonDirector Director

Strategic Report Financial StatementsCorporate Governance
121The Weir Group PLC Annual Report and Financial Statements 2014
Notes
52 weeks ended
2 January 2015
£m
53 weeks ended
3 January 2014
£m
Continuing operations
Cash flows from operating activities 26
Cash generated from operations 421.3 473.9
Additional pension contributions paid (10.6) (12.1)
Exceptional cash items (10.6) –
Income tax paid (94.1) (71.9)
Net cash generated from operating activities 306.0 389.9
Continuing operations
Cash flows from investing activities
Acquisitions of subsidiaries 26 (137.7) (201.2)
Disposals of subsidiaries 26 – (0.3)
Investment in joint ventures – (14.0)
Purchases of property, plant & equipment and intangible assets (108.0) (108.4)
Other proceeds from sale of property, plant & equipment and intangible assets 6.7 11.1
Interest received 6.2 2.8
Dividends received from joint ventures 15 6.0 6.1
Net cash used in investing activities (226.8) (303.9)
Continuing operations
Cash flows from financing activities
Purchase of shares for equity settled share-based incentives (0.2) (2.2)
Proceeds from borrowings 404.0 312.5
Repayments of borrowings (237.5) (572.0)
Settlement of external debt of subsidiary on acquisition 26 – (1.3)
Settlement of derivative financial instruments (3.1) (5.0)
Interest paid (42.7) (43.3)
Proceeds from increase in non-controlling interests 0.2 0.6
Dividends paid to equity holders of the Company 10 (102.7) (82.6)
Net cash generated from (used in) financing activities 18.0 (393.3)
Net increase (decrease) in cash & cash equivalents from continuing operations 97.2 (307.3)
Cash & cash equivalents at the beginning of the period 68.6 384.2
Foreign currency translation differences 0.8 (8.3)
Cash & cash equivalents at the end of the period 19 166.6 68.6
Consolidated Cash Flow Statement for the 52 weeks ended 2 January 2015

122 The Weir Group PLC Annual Report and Financial Statements 2014
Consolidated Statement of Changes in Equityfor the 52 weeks ended 2 January 2015
Share capital
£m
Share premium
£m
Treasury shares
£m
Capital redemption
reserve £m
Foreign currency
translation reserve
£m
Hedge accounting
reserve £m
Retained earnings
£m
Attributable to equity
holders of the
Company £m
Non- controlling
interests £m
Total equity
£m
At 28 December 2012 26.7 38.0 (5.6) 0.5 37.5 0.2 1,209.8 1,307.1 3.2 1,310.3
Profit for the period – – – – – – 334.9 334.9 0.8 335.7
Gains taken to equity on cash flow hedges – – – – – 0.1 – 0.1 – 0.1
Exchange losses on translation of foreign operations – – – – (111.3) – – (111.3) – (111.3)
Exchange gains on net investment hedges – – – – 16.5 – – 16.5 – 16.5
Remeasurements on defined benefit plans – – – – – – 8.0 8.0 – 8.0
Reclassification adjustments on cash flow hedges – – – – – 0.2 – 0.2 – 0.2
Tax relating to other comprehensive income – – – – – 0.3 (2.2) (1.9) – (1.9)
Total net comprehensive income for the period – – – – (94.8) 0.6 340.7 246.5 0.8 247.3
Proceeds from increase in non-controlling interests – – – – – – – – 0.5 0.5
Cost of share-based payments inclusive of tax charge – – – – – – 12.6 12.6 – 12.6
Dividends – – – – – – (82.6) (82.6) – (82.6)
Purchase of shares* – – (1.4) – – – – (1.4) – (1.4)
Exercise of LTIP awards – – 1.2 – – – (1.2) – – –
At 3 January 2014 26.7 38.0 (5.8) 0.5 (57.3) 0.8 1,479.3 1,482.2 4.5 1,486.7
Profit for the period – – – – – – 73.1 73.1 1.6 74.7
Losses taken to equity on cash flow hedges – – – – – (4.0) – (4.0) – (4.0)
Exchange gains on translation of foreign operations – – – – 60.8 – – 60.8 0.5 61.3
Exchange losses on net investment hedges – – – – (16.1) – – (16.1) – (16.1)
Remeasurements on defined benefit plans – – – – – – (31.1) (31.1) – (31.1)
Reclassification adjustments on cash flow hedges – – – – – 0.9 – 0.9 – 0.9
Tax relating to other comprehensive income – – – – – 0.3 6.8 7.1 – 7.1
Total net comprehensive income for the period – – – – 44.7 (2.8) 48.8 90.7 2.1 92.8
Proceeds from increase in non-controlling interests – – – – – – – – 0.2 0.2
Cost of share-based payments inclusive of tax credit – – – – – – 5.2 5.2 – 5.2
Dividends – – – – – – (102.7) (102.7) – (102.7)
Exercise of LTIP awards 0.1 – – – – – (0.1) – – –
At 2 January 2015 26.8 38.0 (5.8) 0.5 (12.6) (2.0) 1,430.5 1,475.4 6.8 1,482.2
* These shares were purchased on the open market and are held by the Appleby EBT on behalf of the Group for satisfaction of any future vesting of the deferred bonus plan.

Strategic Report Financial StatementsCorporate Governance
123The Weir Group PLC Annual Report and Financial Statements 2014
1. Authorisation of financial statements and statement of complianceThe consolidated financial statements of The Weir Group PLC (the ‘Company’) and its subsidiaries (together, the ‘Group’) for the 52 weeks ended 2 January 2015 (‘2014’) were approved and authorised for issue in accordance with a resolution of the directors on 25 February 2015. The comparative information is presented for the 53 weeks ended 3 January 2014 (‘2013’). For practical reasons, the Group prepares its financial statements to the week ending closest to the Company reference date of 31 December. The results on this basis are unlikely to be materially different from those that would be presented for a period of one year. The Weir Group PLC is a limited company incorporated in Scotland and is listed on the London Stock Exchange.
The consolidated financial statements of The Weir Group PLC have been prepared in accordance with International Financial Reporting Standards (IFRS) as adopted by the European Union and applied in accordance with the provisions of the Companies Act 2006.
The principal activities of the Group are described in note 3.
2. Accounting policiesBasis of preparationThese financial statements are presented in Sterling. All values are rounded to the nearest 0.1 million pounds (£m) except where otherwise indicated.
The accounting policies which follow are consistent with those of the previous period except for the adoption of the following standards and interpretations. The standards listed below have not resulted in a change to the Group’s financial statements in the period of initial application.
IFRS 10, ‘Consolidated financial statements’ builds on existing principles by identifying the concept of control as the determining factor in whether an entity should be included within the consolidated financial statements of the parent company. The standard provides additional guidance to assist in the determination where it is difficult to assess.
IFRS 11, ‘Joint arrangements’ focuses on the rights and obligations of the parties to the arrangement rather than its legal form. There are two types of joint arrangement: joint operations and joint ventures. Joint operations arise where the investors have rights to the assets and obligations for the liabilities of the arrangement, while joint ventures arise where the investors have rights to the net assets of the arrangement.
IFRS 12, ‘Disclosures of interests in other entities’ includes the disclosure requirements for all forms of interests in other entities including joint arrangements, associates, structured entities and other off balance sheet vehicles.
There are several other standards and amendments which apply for the first time in 2014 which also do not impact the Group financial statements.
Exceptional itemsIn order to provide the users of the financial statements with a more relevant presentation of the Group’s underlying performance, profit for each financial period has been analysed between:i) profit before exceptional items and intangibles amortisation; andii) the effect of exceptional items and intangibles amortisation.
Exceptional items are items of income and expense which, because of the nature, size and /or infrequency of the events giving rise to them, merit separate presentation to allow a better understanding of the elements of the Group’s financial performance for the period and are presented on the face of the income statement to facilitate comparisons with prior periods and assessment of trends in financial performance. Exceptional items may include but are not restricted to: profits or losses arising on disposal or closure of businesses; the cost of significant business restructuring; significant impairments of intangible or tangible assets; adjustments to the fair value of acquisition related items such as contingent consideration and inventory; other items deemed exceptional due to their significance, size or nature; and the related exceptional taxation.
Intangibles amortisation has been shown separately to provide visibility over the impact of increased acquisition activity on intangible assets.
Further analysis of the items included in the column ‘Exceptional items & intangibles amortisation’ is provided in note 5 to the financial statements.
Use of estimates & judgementsThe Group’s significant accounting policies are set out below. The preparation of the consolidated financial statements, in conformity with IFRS, requires management to make judgements, estimates and assumptions that affect the application of accounting policies and the reported amounts of assets, liabilities, income and expense.
Management base these judgements, estimates and assumptions on a combination of past experience, professional expert advice and other evidence that is relevant to each individual circumstance. Actual results may differ from these estimates, judgements and assumptions, which are reviewed on an ongoing basis. Revisions to accounting estimates are recognised in the period in which the estimate is revised and in any future periods affected.
The areas where management consider the more complex estimates, judgements and assumptions are required are those in respect of acquired assets and liabilities – business combinations (note 13), exceptional items (above and note 5), retirement benefits (note 24), taxation (note 7), inventory valuation (note 16), provisions (note 22), impairment of non-current assets (note 14) and legal claims (note 27).
Further commentary on areas of estimation uncertainty and critical judgements made in applying accounting policies that have the most significant effect on the amounts recognised in the financial statements are provided in the Financial Review on page 50.
Notes to the Group Financial Statements

124 The Weir Group PLC Annual Report and Financial Statements 2014
Notes to the Group Financial Statements continued
2. Accounting policies (continued)Basis of consolidationThe consolidated financial statements include the results, cash flows and assets and liabilities of The Weir Group PLC and its subsidiaries, and the Group’s share of results of its joint ventures. The financial statements of subsidiaries and joint ventures are prepared for the same reporting period as the Company using consistent accounting policies.
A subsidiary is an entity controlled, either directly or indirectly, by the Company, where control is achieved when the Group is exposed, or has rights, to variable returns from its involvement with the investee and has the ability to affect those returns through its power over the investee. The results of a subsidiary acquired during the period are included in the Group’s results from the effective date on which control is transferred to the Group. The results of a subsidiary sold during the period are included in the Group’s results up to the effective date on which control is transferred out of the Group. All intragroup transactions, balances, income and expenses are eliminated on consolidation.
Non-controlling interests represent the portion of profit or loss and net assets in subsidiaries that are not held by the Group and are presented within equity in the Consolidated Balance Sheet, separately from the Company shareholders’ equity.
Joint venturesThe Group has a number of long-term contractual arrangements with other parties which represent joint ventures. A joint venture is a type of joint arrangement whereby the parties that have joint control of the arrangement have rights to the net assets of the joint venture. Joint control is the contractually agreed sharing of control of an arrangement, which exists only when decisions about the relevant activities require unanimous consent of the parties sharing control. The Group’s interests in the results and assets and liabilities of its joint ventures are accounted for using the equity method.
These investments are carried in the balance sheet at cost plus post-acquisition changes in the Group’s share of net assets less any impairment in value. The income statement reflects the share of results of operations of these investments after tax. Where there has been a change recognised directly in the investee’s equity, the Group recognises its share of any changes and discloses this when applicable in the Consolidated Statement of Comprehensive Income.
Any goodwill arising on the acquisition of a joint venture, representing the excess of the cost of the investment over the Group’s share of the net fair value of the joint venture’s identifiable assets, liabilities and contingent liabilities, is included in the carrying amount of the joint venture and is not amortised. To the extent that the net fair value of the joint venture’s identifiable assets, liabilities and contingent liabilities is greater than the cost of the investment, a gain is recognised and added to the Group’s share of the joint venture’s profit or loss in the period in which the investment is acquired.
Foreign currency translationThe financial statements for each of the Group’s subsidiaries and joint ventures are prepared using their functional currency. The functional currency is the currency of the primary economic environment in which an entity operates.
At entity level, transactions denominated in foreign currencies are translated into the entity’s functional currency at the exchange rate ruling on the date of the transaction. Monetary assets and liabilities denominated in foreign currencies are retranslated at the exchange rate ruling on the balance sheet date. Currency translation differences are recognised in the income statement except when hedge accounting is applied and for differences on monetary assets and liabilities that form part of the Group’s net investment in a foreign operation. These are recognised in other comprehensive income until the disposal of the net investment, at which time they are recognised in profit or loss.
On consolidation, the results of foreign operations are translated into Sterling at the average exchange rate for the period and their assets and liabilities are translated into Sterling at the exchange rate ruling on the balance sheet date. Currency translation differences, including those on monetary items that form part of a net investment in a foreign operation, are recognised in the foreign currency translation reserve.
In the event that a foreign operation is sold, the gain or loss on disposal recognised in the Consolidated Income Statement is determined after taking into account the cumulative currency translation differences that are attributable to the operation. As permitted by IFRS 1, the Group elected to deem cumulative currency translation differences to be £nil as at 27 December 2003. Accordingly, the gain or loss on disposal of a foreign operation does not include currency translation differences arising before 27 December 2003.
In the Consolidated Cash Flow Statement, the cash flows of foreign operations are translated into Sterling at the average exchange rate for the period.
Revenue recognitionRevenue is measured at the fair value of the consideration received or receivable and to the extent that it is probable that the economic benefits will flow to the Group and the revenue can be reliably measured. Revenue is shown net of sales taxes, discounts and after eliminating sales within the Group.
i. Sale of goodsRevenue from the sale of goods is recognised in the income statement when the significant risks and rewards of ownership have been transferred to the buyer, usually on despatch of goods, and reliable measurement is possible. No revenue is recognised where recovery of the consideration is not probable or there are significant uncertainties regarding associated costs, or the possible return of goods. Transfers of risks and rewards vary depending on the nature of the products sold and the individual terms of the contract of sale. Where the sale of product requires customer inspection, revenue is not recognised until the inspection has been completed and approved by the customer.
This policy is applicable to the sale of both original equipment and spare parts, whether sold individually, in bulk or as part of a cross- selling marketing strategy.

Strategic Report Financial StatementsCorporate Governance
125The Weir Group PLC Annual Report and Financial Statements 2014
ii. Provision of servicesRevenue from the rendering of services is generally recognised on completion if the service contract is short-term in nature. Where this is not the case, revenue from services is recognised in proportion to the stage of completion of the service at the balance sheet date. The stage of completion is assessed by reference to the contractual agreement with each separate customer and the costs incurred on the contract to date in comparison to the total forecast costs of the contract. Revenue recognition commences only when the outcome of the contract can be reliably measured otherwise it is recognised to the extent costs are incurred.
iii. Construction contractsConstruction contracts usually contain discrete elements separately transferring risks and rewards to the customer. The stage of completion of a contract is determined either by reference to the proportion that contract costs incurred for work performed to date bear to the estimated total contract costs, or by reference to the completion of a physical proportion of the contract work. The basis used is dependent upon the nature of the underlying contract and takes into account the degree to which the physical proportion of the work is subject to formal customer acceptance procedures. Losses on contracts are recognised in the period when such losses become probable. Construction contracts are primarily entered into by the Group’s ‘Engineer to Order’ businesses.
Property, plant & equipmentThe Group elected to use previous UK GAAP revaluations of land and buildings, amounting to £10.5m, prior to 27 December 2003 as deemed cost at the date of the revaluation.
Property, plant and equipment is stated at cost less accumulated depreciation and any recognised impairment losses. Cost includes borrowing costs for qualifying assets for which the commencement date for capitalisation is on or after 1 January 2009. Prior to this date, the Group recognised all borrowing costs as an expense immediately. Freehold land and assets under construction are not depreciated.
Depreciation of property, plant and equipment, other than freehold land and assets under construction, is provided on a straight-line basis so as to charge the cost less residual value, based on prices prevailing at the balance sheet date, to the income statement over the expected useful life of the asset concerned, and is in the following ranges:
Freehold buildings, long leasehold land & buildings 10 – 40 yearsShort leasehold land & buildings duration of leasePlant & equipment 3 – 20 years
GoodwillBusiness combinations are accounted for using the acquisition method.
Goodwill arises on the acquisition of subsidiaries and represents any excess of the cost of the acquired entity over the Group’s interest in the fair value of the entity’s identifiable assets, liabilities and contingent liabilities determined at the date of acquisition. Acquisition costs are expensed in the period in which they are incurred. Goodwill in respect of an acquired subsidiary is recognised as an intangible asset. Goodwill is tested at least annually for impairment and carried at cost less any recognised impairment losses.
Where the fair value of the interest acquired in an entity’s assets, liabilities and contingent liabilities exceeds the consideration paid, the excess is recognised immediately as a gain in the income statement.
Goodwill recognised as an asset as at 27 December 2003 is recorded at its carrying amount at that date and is not amortised. The carrying amount of goodwill allocated to a cash generating unit is taken into account when determining the gain or loss on disposal of the unit. Goodwill that was written off directly to reserves under UK GAAP is not taken into account in determining the gain or loss on disposal of acquired businesses on or after 27 December 2003.
Any contingent consideration is recognised at the acquisition date. Subsequent changes to the fair value of the contingent consideration are adjusted against the cost of acquisition where they qualify as measurement period adjustments (see below). All other subsequent changes in the fair value of contingent consideration classified as an asset or liability are accounted for in accordance with the relevant IFRS.
The measurement period is the period from the date of acquisition to the date the Group obtains complete information about facts and circumstances that existed as of the acquisition date, and is subject to a maximum of one year.
Other intangible assetsOther intangible assets are stated at cost less accumulated amortisation and any recognised impairment losses.
Intangible assets acquired separately are measured at cost on initial recognition. An intangible resource acquired in a business combination is recognised as an intangible asset if it is separable from the acquired business or arises from contractual or legal rights, is expected to generate future economic benefits and its fair value can be measured reliably. An intangible asset with a finite life is amortised on a straight-line basis so as to charge its cost, which in respect of an acquired intangible asset represents its fair value at the acquisition date, to the income statement over its expected useful life. An intangible asset with an indefinite life is not amortised but is tested at least annually for impairment and carried at cost less any recognised impairment losses.

126 The Weir Group PLC Annual Report and Financial Statements 2014
Notes to the Group Financial Statements continued
2. Accounting policies (continued)Other intangible assets (continued)Computer software that is not integral to an item of property, plant & equipment is recognised separately as an intangible asset. Amortisation is provided on a straight-line basis so as to charge the cost of the software to the income statement over its expected useful life, not exceeding eight years.
The expected useful lives of acquired intangible assets are as follows:
Brand names indefinite lifeCustomer & distributor relationships 5 – 25 yearsPurchased software 4 – 8 yearsIntellectual property & trade marks 6 – 15 yearsOther up to 6 years
Research & development costsAll research expenditure is charged to the income statement in the period in which it is incurred.
Development expenditure is charged to the income statement in the period in which it is incurred unless it relates to the development of a new product or technology and it is incurred after the technical feasibility and commercial viability of the product has been proven, the development costs can be measured reliably, future economic benefits are probable and the Group intends to and has sufficient resources to complete the development and to use or sell the asset. Any such capitalised development expenditure is amortised on a straight-line basis so that it is charged to the income statement over the expected life of the resulting product.
Impairment of non-current assetsAll non-current assets are tested for impairment whenever events or circumstances indicate that their carrying values might be impaired. Additionally, goodwill, intangible assets with an indefinite life and any capitalised development expenditure are subject to an annual impairment test.
An impairment loss is recognised to the extent that an asset’s carrying value exceeds its recoverable amount, which represents the higher of the asset’s fair value less costs to sell and its value in use. An asset’s value in use represents the present value of the future cash flows expected to be derived from the asset. Where it is not possible to estimate the recoverable amount of an individual asset, the impairment test is conducted for the cash generating unit to which it belongs. Similarly, the recoverable amount of goodwill is determined by reference to the discounted future cash flows of the cash generating units to which it is allocated.
Impairment losses are recognised in the income statement. Impairment losses recognised in previous periods for an asset other than goodwill are reversed if there has been a change in the estimates used to determine the asset’s recoverable amount. The carrying amount of an asset shall not be increased above the carrying amount that would have been determined had no impairment loss been recognised for the asset in prior periods. Impairment losses recognised in respect of goodwill are not reversed.
InventoriesInventories are valued at the lower of cost and net realisable value, with due allowance for any obsolete or slow moving items. Cost represents the expenditure incurred in bringing inventories to their existing location and condition and comprises the cost of raw materials, direct labour costs, other direct costs and related production overheads. Raw material cost is generally determined on a first in, first out basis. Net realisable value is the estimated selling price less costs to complete and sell.
Financial assets & liabilitiesThe Group’s principal financial assets and liabilities, other than derivatives, comprise bank overdrafts, short-term borrowings, loans and fixed rate notes, cash and short-term deposits. The Group also has other financial assets and liabilities such as trade receivables and trade payables which arise directly from its operations and contingent consideration in relation to acquisitions.
A financial asset is generally derecognised when the contract that gives rise to it is settled, sold, cancelled or expires.
A financial liability is derecognised when the obligation under the liability is discharged or cancelled or expires. Where an existing financial liability is replaced by another from the same lender on substantially different terms, or the terms of an existing liability are substantially modified, such an exchange or modification is treated as a derecognition of the original liability and the recognition of a new liability, such that the difference in the respective carrying amounts together with any costs or fees incurred are recognised in profit or loss.
Trade receivablesTrade receivables, which are generally of a short term nature, are recognised and carried at original invoice amount less an allowance for estimated irrecoverable amounts. Provision is made when there is objective evidence that the Group will not be able to recover balances in full. Balances are written off when the probability of recovery is assessed as being remote.
Cash & cash equivalentsCash and cash equivalents comprise cash in hand, deposits available on demand and other short-term highly liquid investments with a maturity on acquisition of three months or less and bank overdrafts and short-term borrowings with a maturity on acquisition of three months or less. Bank overdrafts are presented as current liabilities to the extent that there is no right of offset with cash balances.
Trade payablesTrade payables are recognised and carried at original invoice amount.

Strategic Report Financial StatementsCorporate Governance
127The Weir Group PLC Annual Report and Financial Statements 2014
Interest-bearing loans & borrowingsObligations for loans and borrowings are recognised when the Group becomes party to the related contracts and are measured initially at fair value less directly attributable transaction costs. After initial recognition, interest-bearing loans and borrowings are subsequently measured at amortised cost using the effective interest method. Amortised cost is calculated by taking into account any issue costs and any discount or premium on settlement. Borrowings are classified as current liabilities unless the Group has an unconditional right to defer settlement of the liability for at least 12 months after the balance sheet date.
ProvisionsA provision is recognised in the balance sheet when the Group has a legal or constructive obligation as a result of a past event, the obligation can be estimated reliably and it is probable that an outflow of economic benefits will be required to settle the obligation. If the effect is material, provisions are determined by discounting the expected future cash flows at a pre-tax rate that reflects current market assessments of the time value of money and, where appropriate, the risks specific to the liability.
Derivative financial instruments & hedge accountingThe Group uses derivative financial instruments, principally forward foreign currency contracts and cross currency swaps, to reduce its exposure to exchange rate movements. The Group also uses foreign currency borrowings as a hedge of its exposure to foreign exchange risk on its investments in foreign subsidiaries. Additionally, the Group uses interest rate swaps to manage its exposure to interest rate risk. The Group does not hold or issue derivatives for speculative or trading purposes.
Derivative financial instruments are recognised as assets and liabilities measured at their fair values at the balance sheet date. The fair value of forward foreign currency contracts is calculated as the present value of the estimated future cash flows based on spot and forward foreign exchange rates and counterparty and the Group’s own credit risk. The fair value of interest rate swaps and cross currency swaps is calculated as the present value of the estimated future cash flows based on interest rate curves, spot foreign exchange rates and counterparty and own credit risk. Changes in their fair values have been recognised in the income statement, except where hedge accounting is used, provided the conditions specified by IAS 39 are met. Hedge accounting is applied in respect of hedge relationships where it is both permissible under IAS 39 and practical to do so. When hedge accounting is used, the relevant hedging relationships will be classified as fair value hedges, cash flow hedges or net investment hedges.
Where the hedging relationship is classified as a fair value hedge, the carrying amount of the hedged asset or liability will be adjusted by the increase or decrease in its fair value attributable to the hedged risk and the resulting gain or loss will be recognised in the income statement where, to the extent that the hedge is effective, it will be offset by the change in the fair value of the hedging instrument.
Where the hedging relationship is classified as a cash flow hedge or as a net investment hedge, to the extent that the hedge is effective, changes in the fair value of the hedging instrument will be recognised directly in other comprehensive income rather than in the income statement. When the hedged item is recognised in the financial statements, the accumulated gains and losses recognised in other comprehensive income will be either recycled to the income statement or, if the hedged item results in a non-financial asset, will be recognised as adjustments to its initial carrying amount.
Hedge accounting is discontinued when the hedging instrument expires or is sold, terminated or exercised, or no longer qualifies for hedge accounting. At that point in time, any cumulative gain or loss on the hedging instrument recognised in other comprehensive income is kept in other comprehensive income until the forecasted transaction occurs. If a hedged transaction is no longer expected to occur, the net cumulative gain or loss recognised in other comprehensive income is transferred to net profit or loss for the period.
Derivatives embedded in non-derivative host contracts are recognised separately as derivative financial instruments when their risks and characteristics are not closely related to those of the host contract and the host contract is not stated at its fair value with changes in its fair value recognised in the income statement.
Share-based paymentsEquity settled share-based incentives are provided to employees under the Group’s Long Term Incentive Plan (‘LTIP’) and as a consequence of occasional one-off conditional awards made to senior executives. The last equity settled grant under the Executive Bonus Scheme (‘EBS’) was during 2013, with no award being made in the current year.
The fair value of the LTIP at the date of the grant is calculated using appropriate option pricing models and the cost is recognised on a straight-line basis over the vesting period. Adjustments are made to reflect expected and actual forfeitures during the vesting period due to failure to satisfy service or performance conditions. The changes to the LTIP which took effect in 2014 are summarised in the Directors’ Remuneration Report on page 91.
The previously granted equity settled incentives under the EBS were determined as a percentage of the annual bonus and were matched by the Group with a share award that would vest on the third anniversary of the grant date provided the individual continued to hold the original bonus shares awarded and continued to be employed by the company at the date of vesting. In addition the EBS included a strategic bonus shares element for a limited number of senior employees. The fair value of the matching and strategic elements of the EBS was determined at the date of grant of the bonus and the cost is recognised on a straight-line basis over the vesting period. The Group recognises a compensation cost in respect of this plan that is based on the fair value of the awards granted. The fair value was determined at the date of grant and is not subsequently re-measured unless the conditions on which the award was granted are modified.

128 The Weir Group PLC Annual Report and Financial Statements 2014
Notes to the Group Financial Statements continued
2. Accounting policies (continued)Treasury sharesThe Weir Group PLC shares held by the Company are classified in shareholders’ equity as treasury shares and are recognised at cost. Consideration received for the sale of such shares is also recognised in equity, with any difference between the proceeds from sale and the original cost being taken directly to revenue reserves. No gain or loss is recognised in total comprehensive income on the purchase, sale, issue or cancellation of equity shares.
Post-employment benefitsPost-employment benefits comprise pension benefits provided to certain current and former employees in the UK, US and Canada and post-retirement healthcare benefits provided to certain employees in the US.
For defined benefit pension and post-retirement healthcare plans, the annual service cost is calculated using the projected unit credit method and is recognised over the future service lives of participating employees, in accordance with the advice of qualified actuaries. Current service cost and administration expenses are recognised in operating costs and net interest on net pension liability is recognised in finance costs.
The finance cost recognised in the income statement in the period reflects the net interest on the net pension liability. This represents the change in the net pension liability resulting from the passage of time, and is determined by applying the discount rate to the opening net liability, taking into account employer contributions paid into the plan, and hence reducing the net liability, during the period.
Past service costs resulting from enhanced benefits are recognised immediately in the income statement. Actuarial gains and losses, which represent differences between interest on the plan assets, experience on the benefit obligation and the effect of changes in actuarial assumptions, are recognised in full in other comprehensive income in the period in which they occur.
The defined benefit liability or asset recognised in the balance sheet comprises the net total for each plan of the present value of the benefit obligation, using a discount rate based on yields at the balance sheet date on appropriate high quality corporate bonds that have maturity dates approximating the terms of the Group’s obligations and are denominated in the currency in which the benefits are expected to be paid, minus the fair value of the plan assets, if any, at the balance sheet date. The balance sheet amount recognised is limited to the present value of economic benefits which the Group expects to recover by way of refunds or a reduction in future contributions. In order to calculate the present value of economic benefits, consideration is also given to any minimum funding requirements.
For defined contribution plans, the costs represent the Group’s contributions to the plans and these are charged to the income statement in the period in which they fall due.
LeasesLeases which transfer to the Group substantially all of the risks and rewards of ownership of the leased asset are classified as finance leases. All other leases are classified as operating leases.
Assets held under finance leases are included within property, plant and equipment, initially measured at their fair value or, if lower, the present value of the minimum lease payments and a corresponding liability is recognised within obligations under finance leases. Subsequently, the assets are depreciated on a basis consistent with similar owned assets or the lease term if shorter. At the inception of the lease, the lease rentals are apportioned between an interest element and a capital element so as to produce a constant periodic rate of interest on the outstanding liability. Subsequently, the interest element is recognised as a charge to the income statement while the capital element is applied to reduce the outstanding liability.
Operating lease rentals and any incentives receivable are recognised in the income statement on a straight-line basis over the term of the lease.
TaxationCurrent tax is the amount of tax payable or recoverable in respect of the taxable profit or loss for the period.
Deferred tax is recognised on temporary differences between the carrying amount of an asset or liability in the balance sheet and its tax base with the following exceptions:i) Deferred tax arising from the initial recognition of goodwill, or of an asset or liability in a transaction that is not a business combination,
that, at the time of the transaction, affects neither accounting nor taxable profit or loss, is not recognised;ii) Deferred tax is provided on temporary differences arising on investments in subsidiaries and joint ventures, except where the timing
of the reversal of the temporary difference can be controlled and it is probable that the temporary difference will not reverse in the foreseeable future; and
iii) A deferred tax asset is recognised only to the extent that it is probable that future taxable profits will be available against which the asset can be utilised.
Deferred tax liabilities represent tax payable in future periods in respect of taxable temporary differences. Deferred tax assets represent tax recoverable in future periods in respect of deductible temporary differences, the carry forward of unutilised tax losses and the carry forward of unused tax credits. Deferred tax is measured on an undiscounted basis using the tax rates and tax laws that have been enacted or substantively enacted at the balance sheet date and are expected to apply when the deferred tax asset is realised or the deferred tax liability is settled.
Current and deferred tax is recognised in the income statement except if it relates to an item recognised directly in equity, in which case it is recognised directly in equity.

Strategic Report Financial StatementsCorporate Governance
129The Weir Group PLC Annual Report and Financial Statements 2014
New standards & interpretationsThe International Accounting Standards Board and International Financial Reporting Interpretations Committee have issued the following standards and interpretations, which are considered relevant to the Group, with an effective date after the date of these financial statements.
International Accounting Standards (IAS/IFRS)Effective date for periods
IFRIC Interpretation 21 Levies 17 June 2014
Defined Benefit Plans: Employee Contributions (Amendments to IAS 19) 1 July 2014
Annual Improvements to IFRSs 2010–2012 Cycle 1 July 2014
Annual Improvements to IFRSs 2011–2013 Cycle 1 July 2014
Annual Improvements to IFRSs 2012–2014 Cycle 1 January 2016*
Amendment to IAS 1: Disclosure Initiative 1 January 2016*
Amendments to IFRS 10 and IAS 28: Sale or Contribution of Assets between an Investor and its Associate or Joint Venture 1 January 2016*
Amendments to IAS 27: Equity Method in Separate Financial Statements 1 January 2016*
Amendments to IAS 16 and IAS 38: Clarification of Acceptable Methods of Depreciation and Amortisation 1 January 2016*
Amendments to IFRS 11: Accounting for Acquisitions of Interests in Joint Operations 1 January 2016*
IFRS 15 Revenue from Contracts with Customers 1 January 2017*
IFRS 9 Financial Instruments 1 January 2018*
* Not yet adopted for use in the European Union.
The above standards and interpretations will be adopted in accordance with their effective dates and have not been adopted in these financial statements. There is not expected to be a significant impact on the 2015 financial statements as a result of these standards. An exercise to assess the impact of standards applicable from 2016 and 2017 is due to commence during 2015.
3. Segment informationFor management purposes, the Group is organised into three operating divisions: Minerals, Oil & Gas and Power & Industrial. These three divisions are organised and managed separately based on the key markets served and each is treated as an operating and a reportable segment under IFRS 8. The operating and reportable segments were determined based on the reports reviewed by the Chief Executive which are used to make operational decisions.
The Minerals segment is the global leader in the provision of slurry handling equipment and associated aftermarket support for abrasive high wear applications used in the mining and oil sands markets. The Oil & Gas segment provides products and service solutions to upstream, production, transportation, refining and related industries. The Power & Industrial segment designs and manufactures valves, pumps and turbines as well as providing specialist support services to the global power generation, industrial and oil and gas sectors.
The Chief Executive assesses the performance of the operating segments based on operating profit from continuing operations before exceptional items (including impairments) and intangibles amortisation (‘segment result’). Finance income and expenditure and associated interest-bearing liabilities and derivative financial instruments are not allocated to segments as all treasury activity is managed centrally by the Group treasury function. The amounts provided to the Chief Executive with respect to assets and liabilities are measured in a manner consistent with that of the financial statements. The assets are allocated based on the operations of the segment and the physical location of the asset. The liabilities are allocated based on the operations of the segment.
Transfer prices between business segments are set on an arm’s length basis in a manner similar to transactions with third parties.

130 The Weir Group PLC Annual Report and Financial Statements 2014
Notes to the Group Financial Statements continued
3. Segment information (continued)The segment information for the reportable segments for 2014 and 2013 is disclosed below.
Minerals Oil & Gas Power & Industrial Total continuing operations
2014 £m
2013 £m
2014 £m
2013 £m
2014 £m
2013 £m
2014 £m
2013 £m
Revenue
Sales to external customers 1,127.9 1,304.3 992.1 795.9 318.2 329.6 2,438.2 2,429.8
Inter-segment sales 3.9 4.4 14.6 15.7 8.5 7.3 27.0 27.4
Segment revenue 1,131.8 1,308.7 1,006.7 811.6 326.7 336.9 2,465.2 2,457.2
Eliminations (27.0) (27.4)
2,438.2 2,429.8
Sales to external customers – 2013 at 2014 average exchange rates
Sales to external customers 1,127.9 1,177.7 992.1 753.6 318.2 314.0 2,438.2 2,245.3
2,438.2 2,245.3
Segment result
Segment result before share of results of joint ventures 226.4 268.7 214.9 172.1 18.6 31.3 459.9 472.1
Share of results of joint ventures – – 10.0 8.4 – – 10.0 8.4
Segment result 226.4 268.7 224.9 180.5 18.6 31.3 469.9 480.5
Unallocated expenses (20.1) (14.0)
Operating profit before exceptional items & intangibles amortisation 449.8 466.5
Total exceptional items & intangibles amortisation (259.4) 13.1
Net finance costs before exceptional items (38.5) (44.9)
Other finance costs – retirement benefits (2.8) (3.5)
Profit before tax from continuing operations 149.1 431.2
Segment result – 2013 at 2014 average exchange rates
Segment result before share of results of joint ventures 226.4 243.1 214.9 162.8 18.6 29.6 459.9 435.5
Share of results of joint ventures – – 10.0 8.0 – – 10.0 8.0
Segment result 226.4 243.1 224.9 170.8 18.6 29.6 469.9 443.5
Unallocated expenses (20.1) (14.0)
Operating profit before exceptional items & intangibles amortisation 449.8 429.5
There are no material revenues derived from a single external customer.

Strategic Report Financial StatementsCorporate Governance
131The Weir Group PLC Annual Report and Financial Statements 2014
Minerals Oil & Gas Power & Industrial Total continuing operations
2014 £m
2013 £m
2014 £m
2013 £m
2014 £m
2013 £m
2014 £m
2013 £m
Assets & liabilities
Intangible assets 536.9 397.0 991.3 1,109.4 102.0 101.6 1,630.2 1,608.0
Property, plant & equipment 214.6 198.7 167.0 147.2 52.3 50.9 433.9 396.8
Working capital assets 504.6 449.6 532.4 390.9 178.4 176.2 1,215.4 1,016.7
1,256.1 1,045.3 1,690.7 1,647.5 332.7 328.7 3,279.5 3,021.5
Investments in joint ventures – – 33.7 27.1 – – 33.7 27.1
Segment assets 1,256.1 1,045.3 1,724.4 1,674.6 332.7 328.7 3,313.2 3,048.6
Unallocated assets 249.1 114.3
Total assets 3,562.3 3,162.9
Working capital liabilities 286.0 243.4 242.8 149.9 113.8 87.3 642.6 480.6
Unallocated liabilities 1,437.5 1,195.6
Total liabilities 2,080.1 1,676.2
Other segment information
Segment additions to non-current assets 56.9 56.6 50.6 37.6 8.9 11.1 116.4 105.3
Unallocated additions to non-current assets 3.7 6.3
Total additions to non-current assets 120.1 111.6
Segment depreciation & amortisation 37.7 35.3 54.7 54.9 10.6 14.2 103.0 104.4
Impairment of property, plant & equipment 4.0 – 5.2 – – – 9.2 –
Impairment of intangible assets – – 160.0 – – – 160.0 –
Unallocated depreciation & amortisation 3.0 1.4
Total depreciation, amortisation & impairment 275.2 105.8
Unallocated assets primarily comprise cash and short-term deposits, derivative financial instruments, income tax receivable, deferred tax assets and retirement benefit surpluses as well as those assets which are used for general head office purposes. Unallocated liabilities primarily comprise interest-bearing loans and borrowings, derivative financial instruments, income tax payable, provisions, deferred tax liabilities and retirement benefit deficits as well as liabilities relating to general head office activities. Segment additions to non-current assets do not include those additions which have arisen from business combinations (note 13).
Geographical informationGeographical information in respect of revenue and non-current assets for 2014 and 2013 is disclosed below. Revenues are allocated based on the location to which the product is shipped. Assets are allocated based on the location of the assets and operations. Non-current assets consist of property, plant & equipment, intangible assets and investments in joint ventures.
52 weeks ended 2 January 2015UK £m
USA £m
Canada £m
Europe & FSU £m
Asia Pacific
£mAustralia
£m
South America
£m
Middle East & Africa
£mTotal
£m
Revenue from continuing operations
Sales to external customers 113.0 875.9 246.0 180.9 252.4 220.3 261.6 288.1 2,438.2
Non-current assets 144.7 1,130.5 59.0 144.6 304.6 163.0 49.5 111.1 2,107.0
53 weeks ended 3 January 2014UK £m
USA £m
Canada £m
Europe & FSU £m
Asia Pacific
£mAustralia
£m
South America
£m
Middle East & Africa
£mTotal
£m
Revenue from continuing operations
Sales to external customers 104.8 743.4 234.6 246.1 229.8 223.2 308.1 339.8 2,429.8
Non-current assets 102.8 1,251.5 58.1 141.7 180.3 157.5 50.2 98.2 2,040.3

132 The Weir Group PLC Annual Report and Financial Statements 2014
Notes to the Group Financial Statements continued
3. Segment information (continued)Geographical information (continued)The following disclosures are given in relation to continuing operations.
2014 £m
2013 £m
An analysis of the Group’s revenue is as follows
Original equipment 748.7 818.8
Aftermarket parts 1,145.3 1,074.4
Sales of goods 1,894.0 1,893.2
Aftermarket services 470.5 461.4
Revenue from construction contracts 73.7 75.2
Revenue 2,438.2 2,429.8
Finance income 6.0 3.0
Total revenue 2,444.2 2,432.8
4. Revenues & expensesThe following disclosures are given in relation to total continuing operations and include exceptional items and intangible amortisation.
2014 £m
2013 £m
A reconciliation of revenue to operating profit is as follows
Revenue 2,438.2 2,429.8
Cost of sales (1,632.2) (1,557.2)
Gross profit 806.0 872.6
Other operating income* 4.1 70.8
Selling & distribution costs (213.5) (222.6)
Administrative expenses (254.1) (238.9)
Goodwill impairment (160.0) –
Share of results of joint ventures 10.0 8.4
Operating profit 192.5 490.3
* Other operating income in the prior year includes the £67.8m exceptional gain on release of the Mathena contingent consideration liability (note 5).
2014 £m
2013 £m
Operating profit is stated after charging (crediting)
Cost of inventories recognised as an expense 1,632.2 1,557.2
Depreciation of property, plant & equipment (note 11) 61.1 59.1
Amortisation of intangible assets (note 12) 44.9 46.7
Acquisition transaction costs 0.9 2.7
Other one-off costs* 1.1 5.3
Group-wide efficiency review** 49.4 –
Metso aborted acquisition costs 2.4 –
Net foreign exchange losses 1.4 4.1
Net impairment of trade receivables excluding Group-wide efficiency review amounts (note 17) (0.6) 5.5
* Other one-off costs include acquisition integration costs.** Details of the Group-wide efficiency review are detailed in note 5.

Strategic Report Financial StatementsCorporate Governance
133The Weir Group PLC Annual Report and Financial Statements 2014
The following disclosures are given in relation to total operations.
2014 £m
2013 £m
Auditors remuneration
The total fees payable by the Group to Ernst & Young LLP and their associates for work performed in respect of the audit and other services provided to the Company and its subsidiary companies during the period are disclosed below.
Fees payable to the Company’s auditor for the audit of the Company & Group financial statements 0.4 0.4
Fees payable to the Company’s auditor and its associates for other services
The audit of the Company’s subsidiaries pursuant to legislation 1.5 1.4
Other assurance services 0.1 0.1
Fees payable in respect of the Group’s pension schemes
Audit 0.1 0.1
Research & development costsResearch & development costs amount to £24.8m (2013: £21.5m) of which £22.4m (2013: £17.6m) were charged directly to cost of sales in the income statement and £2.4m (2013: £3.9m) were capitalised (note 12).
Operating leasesMinimum lease payments under operating leases recognised as an expense in the period were £42.7m (2013: £42.1m).
2014 £m
2013 £m
Employee benefits expense
Wages & salaries 552.5 523.0
Social security costs 52.2 52.7
Pension costs
Defined benefit plans (note 24) 2.1 2.6
Defined benefit plans exceptional item (note 5) – (2.7)
Defined contribution plans 19.5 17.7
Share-based payments – equity settled transactions 4.4 8.7
630.7 602.0
2014 Number
2013 Number
The average monthly number of people employed by the Company and its subsidiaries is as follows
Minerals 8,271 7,699
Oil & Gas 3,923 3,234
Power & Industrial 3,015 2,752
Group companies 79 65
15,288 13,750
At 2 January 2015, the number of people employed by the Group including those under temporary contracts was 16,347 (2013: 15,220).
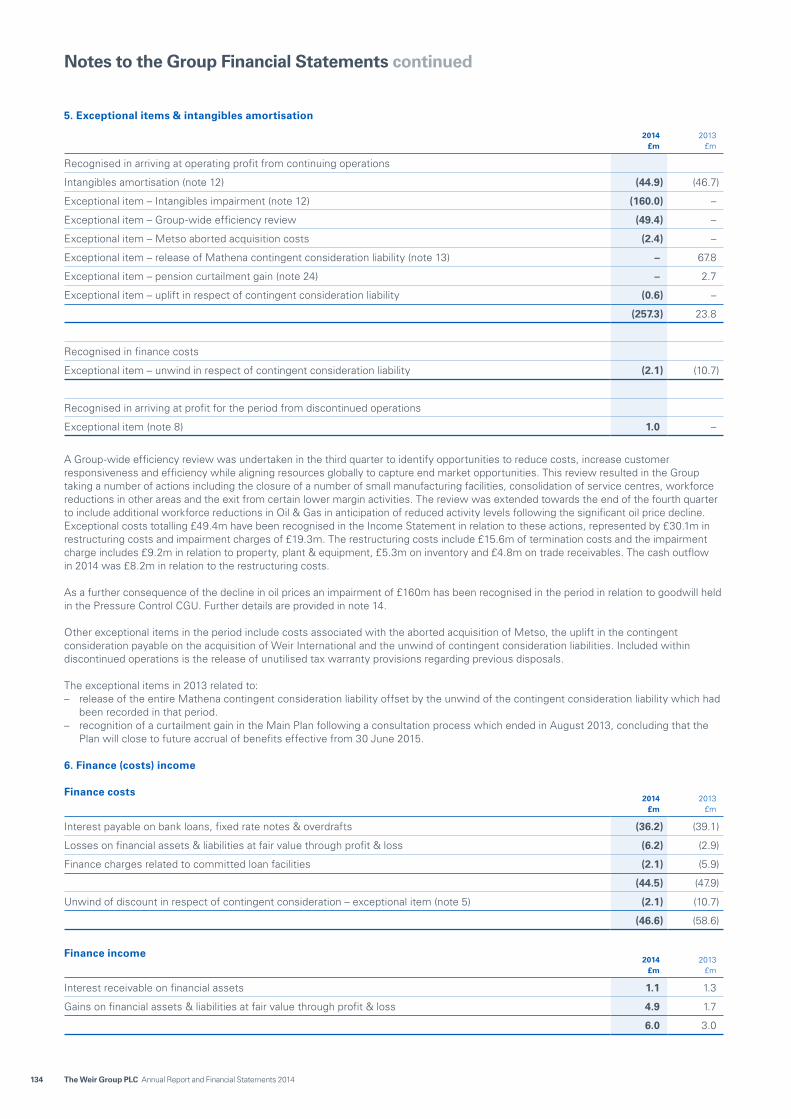
134 The Weir Group PLC Annual Report and Financial Statements 2014
Notes to the Group Financial Statements continued
5. Exceptional items & intangibles amortisation
2014 £m
2013 £m
Recognised in arriving at operating profit from continuing operations
Intangibles amortisation (note 12) (44.9) (46.7)
Exceptional item – Intangibles impairment (note 12) (160.0) –
Exceptional item – Group-wide efficiency review (49.4) –
Exceptional item – Metso aborted acquisition costs (2.4) –
Exceptional item – release of Mathena contingent consideration liability (note 13) – 67.8
Exceptional item – pension curtailment gain (note 24) – 2.7
Exceptional item – uplift in respect of contingent consideration liability (0.6) –
(257.3) 23.8
Recognised in finance costs
Exceptional item – unwind in respect of contingent consideration liability (2.1) (10.7)
Recognised in arriving at profit for the period from discontinued operations
Exceptional item (note 8) 1.0 –
A Group-wide efficiency review was undertaken in the third quarter to identify opportunities to reduce costs, increase customer responsiveness and efficiency while aligning resources globally to capture end market opportunities. This review resulted in the Group taking a number of actions including the closure of a number of small manufacturing facilities, consolidation of service centres, workforce reductions in other areas and the exit from certain lower margin activities. The review was extended towards the end of the fourth quarter to include additional workforce reductions in Oil & Gas in anticipation of reduced activity levels following the significant oil price decline. Exceptional costs totalling £49.4m have been recognised in the Income Statement in relation to these actions, represented by £30.1m in restructuring costs and impairment charges of £19.3m. The restructuring costs include £15.6m of termination costs and the impairment charge includes £9.2m in relation to property, plant & equipment, £5.3m on inventory and £4.8m on trade receivables. The cash outflow in 2014 was £8.2m in relation to the restructuring costs.
As a further consequence of the decline in oil prices an impairment of £160m has been recognised in the period in relation to goodwill held in the Pressure Control CGU. Further details are provided in note 14.
Other exceptional items in the period include costs associated with the aborted acquisition of Metso, the uplift in the contingent consideration payable on the acquisition of Weir International and the unwind of contingent consideration liabilities. Included within discontinued operations is the release of unutilised tax warranty provisions regarding previous disposals.
The exceptional items in 2013 related to: – release of the entire Mathena contingent consideration liability offset by the unwind of the contingent consideration liability which had
been recorded in that period. – recognition of a curtailment gain in the Main Plan following a consultation process which ended in August 2013, concluding that the
Plan will close to future accrual of benefits effective from 30 June 2015.
6. Finance (costs) income
Finance costs2014
£m2013
£m
Interest payable on bank loans, fixed rate notes & overdrafts (36.2) (39.1)
Losses on financial assets & liabilities at fair value through profit & loss (6.2) (2.9)
Finance charges related to committed loan facilities (2.1) (5.9)
(44.5) (47.9)
Unwind of discount in respect of contingent consideration – exceptional item (note 5) (2.1) (10.7)
(46.6) (58.6)
Finance income2014
£m2013
£m
Interest receivable on financial assets 1.1 1.3
Gains on financial assets & liabilities at fair value through profit & loss 4.9 1.7
6.0 3.0
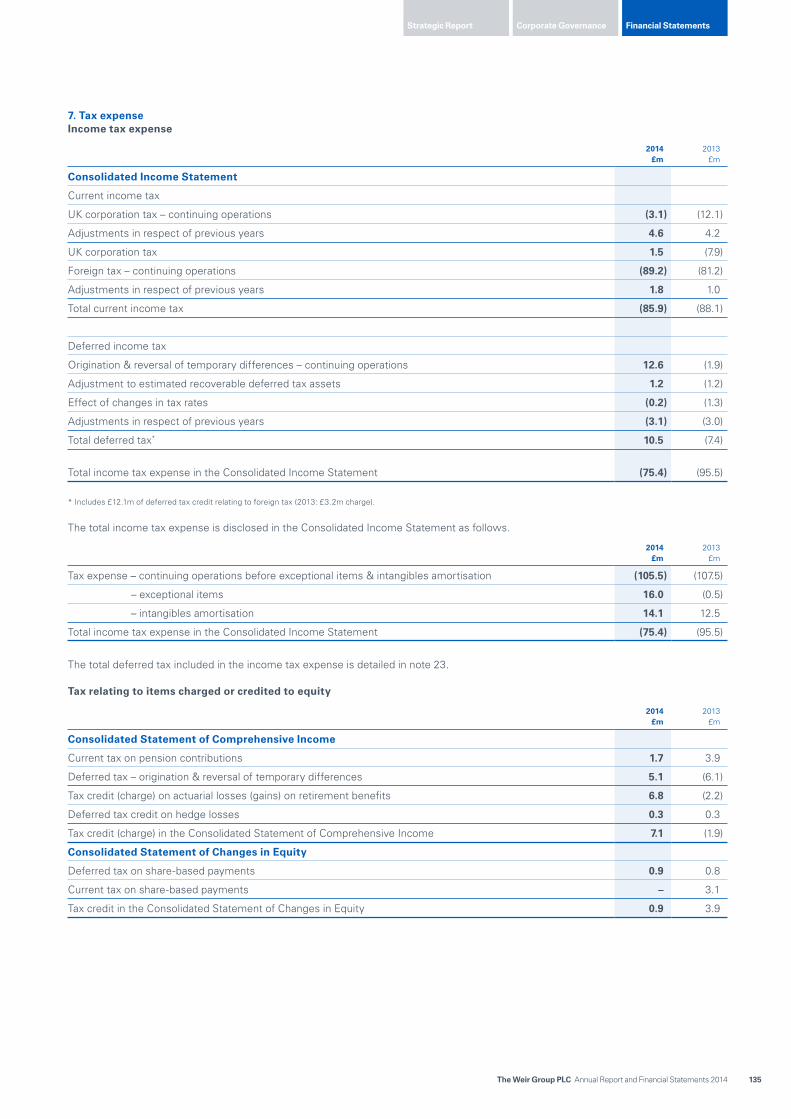
Strategic Report Financial StatementsCorporate Governance
135The Weir Group PLC Annual Report and Financial Statements 2014
7. Tax expenseIncome tax expense
2014 £m
2013 £m
Consolidated Income Statement
Current income tax
UK corporation tax – continuing operations (3.1) (12.1)
Adjustments in respect of previous years 4.6 4.2
UK corporation tax 1.5 (7.9)
Foreign tax – continuing operations (89.2) (81.2)
Adjustments in respect of previous years 1.8 1.0
Total current income tax (85.9) (88.1)
Deferred income tax
Origination & reversal of temporary differences – continuing operations 12.6 (1.9)
Adjustment to estimated recoverable deferred tax assets 1.2 (1.2)
Effect of changes in tax rates (0.2) (1.3)
Adjustments in respect of previous years (3.1) (3.0)
Total deferred tax* 10.5 (7.4)
Total income tax expense in the Consolidated Income Statement (75.4) (95.5)
* Includes £12.1m of deferred tax credit relating to foreign tax (2013: £3.2m charge).
The total income tax expense is disclosed in the Consolidated Income Statement as follows.
2014 £m
2013 £m
Tax expense – continuing operations before exceptional items & intangibles amortisation (105.5) (107.5)
– exceptional items 16.0 (0.5)
– intangibles amortisation 14.1 12.5
Total income tax expense in the Consolidated Income Statement (75.4) (95.5)
The total deferred tax included in the income tax expense is detailed in note 23.
Tax relating to items charged or credited to equity
2014 £m
2013 £m
Consolidated Statement of Comprehensive Income
Current tax on pension contributions 1.7 3.9
Deferred tax – origination & reversal of temporary differences 5.1 (6.1)
Tax credit (charge) on actuarial losses (gains) on retirement benefits 6.8 (2.2)
Deferred tax credit on hedge losses 0.3 0.3
Tax credit (charge) in the Consolidated Statement of Comprehensive Income 7.1 (1.9)
Consolidated Statement of Changes in Equity
Deferred tax on share-based payments 0.9 0.8
Current tax on share-based payments – 3.1
Tax credit in the Consolidated Statement of Changes in Equity 0.9 3.9

136 The Weir Group PLC Annual Report and Financial Statements 2014
Notes to the Group Financial Statements continued
7. Tax expense (continued)Reconciliation of the total tax chargeThe tax expense in the Consolidated Income Statement for the period is higher (2013: lower) than the weighted average of standard rates of corporation tax across the Group of 22.9% (2013: 29.7%). The differences are reconciled below.
2014 £m
2013 £m
Profit before tax from continuing operations 149.1 431.2
Profit before tax from discontinued operations 1.0 –
Accounting profit before tax 150.1 431.2
At the weighted average of standard rates of corporation tax across the Group of 22.9% (2013: 29.7%) 34.3 128.2
Adjustments in respect of previous years – current tax (6.4) (5.2)
– deferred tax 3.1 3.0
Joint ventures (3.1) (1.2)
Unrecognised deferred tax assets 1.2 1.2
Overseas tax on unremitted earnings 4.3 5.6
Permanent differences (2.7) 0.7
Tax effect of funding overseas operations (19.1) (17.6)
Effect of changes in tax rates (0.2) 1.1
Exceptional items ineligible for tax 64.0 (20.3)
At effective tax rate of 50.2% (2013: 22.1%) 75.4 95.5
8. Discontinued operationsThere were no disposals of core businesses during the current or prior period. As disclosed in note 5 an exceptional gain of £1.0m (2013: £nil) has been recognised in the period in relation to the release of unutilised tax warranty provisions relating to previous disposals.
Earnings per share from discontinued operations were as follows.
2014 pence
2013 pence
Basic 0.5 n/a
Diluted 0.5 n/a
These earnings per share figures were derived by dividing the net profit attributable to equity holders of the Company from discontinued operations by the weighted average number of ordinary shares, for both basic and diluted amounts, shown in note 9.
9. Earnings per shareBasic earnings per share amounts are calculated by dividing net profit for the period attributable to equity holders of the Company by the weighted average number of ordinary shares outstanding during the period. Diluted earnings per share is calculated by dividing the net profit attributable to equity holders of the Company by the weighted average number of ordinary shares outstanding during the period (adjusted for the effect of dilutive share awards).
The following reflects the profit and share data used in the calculation of earnings per share.
2014 2013
Profit attributable to equity holders of the Company
Total operations* (£m) 73.1 334.9
Continuing operations* (£m) 72.1 334.9
Continuing operations before exceptional items & intangibles amortisation* (£m) 301.4 309.8
Weighted average share capital
Basic earnings per share (number of shares, million) 213.3 213.0
Diluted earnings per share (number of shares, million) 213.9 213.8
* Adjusted for £1.6m (2013: £0.8m) in respect of non-controlling interests.

Strategic Report Financial StatementsCorporate Governance
137The Weir Group PLC Annual Report and Financial Statements 2014
The difference between the weighted average share capital for the purposes of the basic and the diluted earnings per share calculations is analysed as follows.
2014 Shares Million
2013 Shares Million
Weighted average number of ordinary shares for basic earnings per share 213.3 213.0
Effect of dilution: LTIP and deferred bonus awards 0.6 0.8
Adjusted weighted average number of ordinary shares for diluted earnings per share 213.9 213.8
The profit attributable to equity holders of the Company used in the calculation of both basic and diluted earnings per share from continuing operations before exceptional items and intangibles amortisation is calculated as follows.
2014 £m
2013 £m
Net profit attributable to equity holders from continuing operations* 72.1 334.9
Exceptional items & intangibles amortisation net of tax 229.3 (25.1)
Net profit attributable to equity holders from continuing operations before exceptional items & intangibles amortisation* 301.4 309.8
2014 pence
2013 pence
Basic earnings per share:
Total operations* 34.3 157.2
Continuing operations* 33.8 157.2
Continuing operations before exceptional items & intangibles amortisation* 141.3 145.4
Diluted earnings per share:
Total operations* 34.2 156.6
Continuing operations* 33.7 156.6
Continuing operations before exceptional items & intangibles amortisation* 140.9 144.9
* Adjusted for £1.6m (2013: £0.8m) in respect of non-controlling interests.
There have been no share options (2013: nil) exercised between the reporting date and the date of signing of these financial statements.
10. Dividends paid & proposed
2014 £m
2013 £m
Declared & paid during the period
Equity dividends on ordinary shares
Final dividend for 2013: 33.2p (2012: 30.0p) 70.7 63.8
Interim dividend for 2014: 15.0p (2013: 8.8p) 32.0 18.8
102.7 82.6
Proposed for approval by shareholders at the annual general meeting
Final dividend for 2014: 29.0p (2013: 33.2p) 61.9 70.8
The dividend has been re-phased such that the final payment will represent approximately two thirds of the total dividend for 2014.
The proposed dividend is based on the number of shares in issue, excluding treasury shares held, at the date the financial statements were approved and authorised for issue.
The final dividend may differ due to increases or decreases in the number of shares in issue between the date of approval of the report and financial statements and the record date for the final dividend.

138 The Weir Group PLC Annual Report and Financial Statements 2014
Notes to the Group Financial Statements continued
11. Property, plant & equipment
Land & buildings
£m
Plant & equipment
£m
Total property,
plant & equipment
£m
Cost
At 28 December 2012 145.3 444.9 590.2
Additions 17.4 73.0 90.4
Acquisitions 6.9 19.5 26.4
Disposals (3.3) (20.6) (23.9)
Reclassifications from intangible assets (note 12) – 1.0 1.0
Reclassifications 4.1 (4.1) –
Exchange adjustment (10.8) (33.6) (44.4)
At 3 January 2014 159.6 480.1 639.7
Additions 23.9 72.1 96.0
Acquisitions 5.2 5.7 10.9
Disposals (3.2) (19.9) (23.1)
Reclassifications to intangible assets (note 12) – (0.4) (0.4)
Reclassifications to inventory – (2.2) (2.2)
Reclassifications 0.6 (0.6) –
Exchange adjustment 4.0 5.8 9.8
At 2 January 2015 190.1 540.6 730.7
Accumulated depreciation & impairment
At 28 December 2012 34.2 182.0 216.2
Depreciation charge for the period 6.1 53.0 59.1
Disposals (1.0) (15.9) (16.9)
Reclassifications from intangible assets (note 12) – 0.4 0.4
Reclassifications 0.7 (0.7) –
Exchange adjustment (2.1) (15.7) (17.8)
At 3 January 2014 37.9 203.1 241.0
Depreciation charge for the period 6.0 55.1 61.1
Impairment 1.6 7.6 9.2
Disposals (2.3) (16.4) (18.7)
Reclassifications to intangible assets (note 12) – (0.1) (0.1)
Reclassifications to inventory – (0.6) (0.6)
Reclassifications 0.2 (0.2) –
Exchange adjustment 0.6 3.2 3.8
At 2 January 2015 44.0 251.7 295.7
Net book value at 28 December 2012 111.1 262.9 374.0
Net book value at 3 January 2014 121.7 277.0 398.7
Net book value at 2 January 2015 146.1 288.9 435.0
The carrying value of buildings held under finance leases is £1.0m (2013: £1.3m). The carrying value of plant & equipment held under finance leases is £0.4m (2013: £0.4m). Leased assets are pledged as security for the related finance lease liabilities. The carrying amount of assets under construction included in plant & equipment is £36.6m (2013: £29.2m). The impairment charges in the year are related to actions undertaken as a result of the Group-wide efficiency review as outlined in note 5.

Strategic Report Financial StatementsCorporate Governance
139The Weir Group PLC Annual Report and Financial Statements 2014
12. Intangible assets
Goodwill £m
Brand names
£m
Customer and
distributor relationships
£m
Purchased software
£m
Intellectual property &
trade marks £m
Development costs
£mOther
£mTotal
£m
Cost
At 28 December 2012 908.9 169.7 384.5 33.2 58.0 4.5 17.7 1,576.5
Additions – – – 6.6 10.4 3.9 0.3 21.2
Acquisitions 95.5 9.7 129.2 – 0.2 – – 234.6
Disposals – – – (0.9) – – – (0.9)
Reclassifications from property, plant & equipment (note 11) – – – (1.0) – – – (1.0)
Reclassifications – – – (0.7) – 0.7 – –
Exchange adjustment (32.6) (4.2) (11.6) (1.8) (1.7) (0.7) (1.0) (53.6)
At 3 January 2014 971.8 175.2 502.1 35.4 66.9 8.4 17.0 1,776.8
Additions – – 0.1 20.7 0.8 2.4 0.1 24.1
Acquisitions 77.1 14.7 21.9 0.1 7.2 – 4.8 125.8
Disposals – – – (1.1) – – – (1.1)
Reclassifications from property, plant & equipment (note 11) – – – 0.4 – – – 0.4
Reclassifications – – – 0.2 (0.2) – – –
Exchange adjustment 42.4 11.5 29.3 (0.1) 3.6 (0.2) 1.0 87.5
At 2 January 2015 1,091.3 201.4 553.4 55.6 78.3 10.6 22.9 2,013.5
Accumulated amortisation & impairment
At 28 December 2012 – – 67.4 18.8 19.9 0.3 16.0 122.4
Amortisation charge for the period – – 37.0 3.8 4.4 0.4 1.1 46.7
Disposals – – – (0.9) – – – (0.9)
Reclassifications from property, plant & equipment (note 11) – – – (0.4) – – – (0.4)
Reclassifications – – 1.0 0.4 – – (1.4) –
Exchange adjustment – – (3.0) (1.1) (0.7) – (0.7) (5.5)
At 3 January 2014 – – 102.4 20.6 23.6 0.7 15.0 162.3
Amortisation charge for the period – – 30.6 6.0 6.1 0.8 1.4 44.9
Impairment 160.0 – – – – – – 160.0
Disposals – – – (1.1) – – – (1.1)
Reclassifications from property, plant & equipment (note 11) – – – 0.1 – – – 0.1
Exchange adjustment – – 6.3 0.2 1.5 0.1 0.9 9.0
At 2 January 2015 160.0 – 139.3 25.8 31.2 1.6 17.3 375.2
Net book value at 28 December 2012 908.9 169.7 317.1 14.4 38.1 4.2 1.7 1,454.1
Net book value at 3 January 2014 971.8 175.2 399.7 14.8 43.3 7.7 2.0 1,614.5
Net book value at 2 January 2015 931.3 201.4 414.1 29.8 47.1 9.0 5.6 1,638.3
The impairment charge recorded in the period relates to the write down of goodwill in the Pressure Control CGU (note 14).
The increase in goodwill of £77.1m during 2014 is represented by the current year acquisitions of Trio and Metra (note 13).
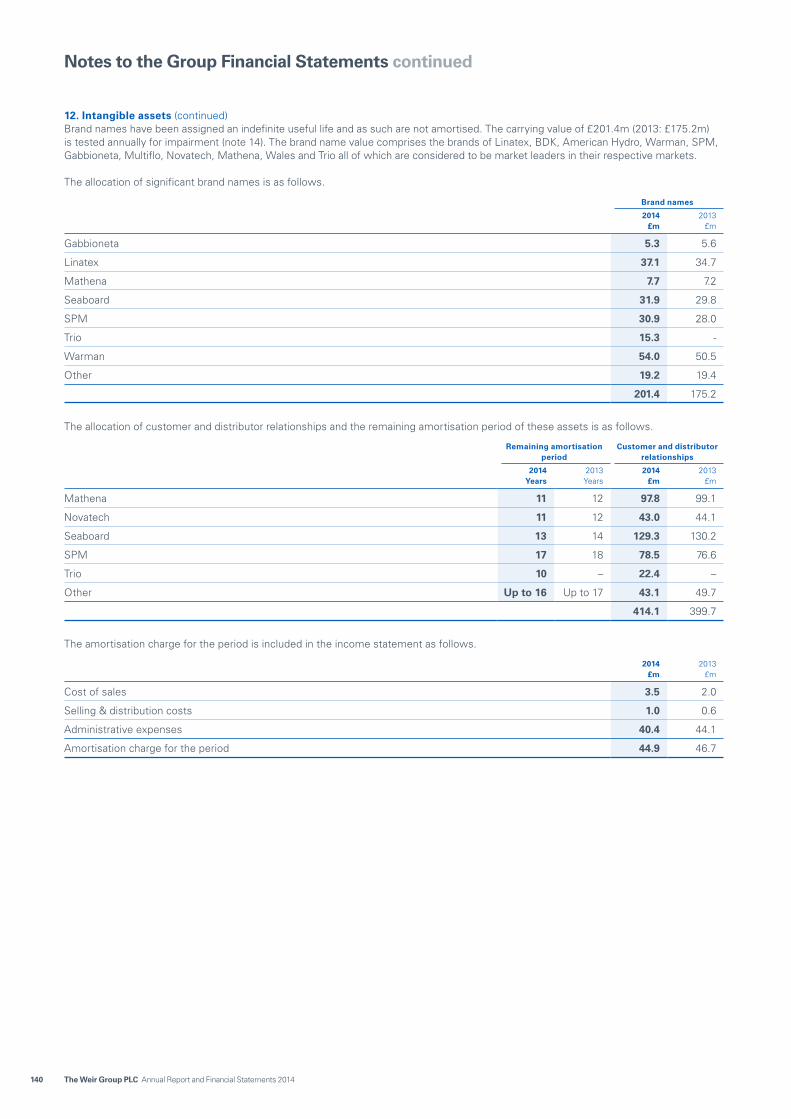
140 The Weir Group PLC Annual Report and Financial Statements 2014
Notes to the Group Financial Statements continued
12. Intangible assets (continued)Brand names have been assigned an indefinite useful life and as such are not amortised. The carrying value of £201.4m (2013: £175.2m) is tested annually for impairment (note 14). The brand name value comprises the brands of Linatex, BDK, American Hydro, Warman, SPM, Gabbioneta, Multiflo, Novatech, Mathena, Wales and Trio all of which are considered to be market leaders in their respective markets.
The allocation of significant brand names is as follows.
Brand names
2014 £m
2013 £m
Gabbioneta 5.3 5.6
Linatex 37.1 34.7
Mathena 7.7 7.2
Seaboard 31.9 29.8
SPM 30.9 28.0
Trio 15.3 -
Warman 54.0 50.5
Other 19.2 19.4
201.4 175.2
The allocation of customer and distributor relationships and the remaining amortisation period of these assets is as follows.
Remaining amortisation period
Customer and distributor relationships
2014 Years
2013 Years
2014 £m
2013 £m
Mathena 11 12 97.8 99.1
Novatech 11 12 43.0 44.1
Seaboard 13 14 129.3 130.2
SPM 17 18 78.5 76.6
Trio 10 – 22.4 –
Other Up to 16 Up to 17 43.1 49.7
414.1 399.7
The amortisation charge for the period is included in the income statement as follows.
2014 £m
2013 £m
Cost of sales 3.5 2.0
Selling & distribution costs 1.0 0.6
Administrative expenses 40.4 44.1
Amortisation charge for the period 44.9 46.7

Strategic Report Financial StatementsCorporate Governance
141The Weir Group PLC Annual Report and Financial Statements 2014
13. Business combinationsOn 25 July 2014, the Group completed the acquisition of 100% of the voting shares of Metra Equipment Inc, (Weir Metra) for a cash consideration of CAD$6.0m (£3.4m) less cash acquired of CAD$0.7m (£0.4m). Based in Saskatchewan, Canada, Weir Metra is a niche provider of wellhead equipment and services and will support and expand the existing Pressure Control business. The provisional fair value of the net assets has been assessed as £2.0m, giving rise to goodwill on acquisition of £1.4m. No separately identifiable intangible assets have been recognised in relation to the acquisition.
On 22 October 2014, the Group completed the acquisition of Trio Engineered Products (Weir Trio) a Chinese-American manufacturer of crushing and separation equipment for the mining and aggregate markets, for a consideration of US$236.0m inclusive of net cash balances held by Weir Trio. The consideration includes US$13.2m discounted contingent consideration deferred for up to 2 years conditional on the realisation of certain working capital targets and the achievement of agreed management goals. The provisional fair values are disclosed in the table below and are subject to change following completion of the fair value exercise during 2015. There are certain intangible assets in the £75.7m of goodwill recognised that cannot be individually separated and reliably measured due to their nature. These items include anticipated business growth, synergies and an assembled workforce.
Provisional fair values
Trio 2014
£m
Property, plant & equipment 10.1
Inventories 20.9
Intangible assets
– customer and distributor relationships 21.9
– brand name 14.7
– order backlog 3.5
– intellectual property 7.2
– purchased software 0.1
– other 1.3
Trade & other receivables 15.6
Cash & cash equivalents 8.0
Trade & other payables (20.0)
Provisions (10.9)
Current tax (1.2)
Deferred tax (1.0)
Fair value of net assets 70.2
Goodwill arising on acquisition 75.7
Total consideration 145.9
Cash consideration 137.7
Contingent consideration 8.2
Total consideration 145.9
The total net cash outflow on current year acquisitions was as follows
Weir Trio
– cash paid (137.7)
– cash & cash equivalents acquired 8.0
Weir Metra – net cash outflow (3.0)
Total cash outflow (note 26) (132.7)
The fair value of the Weir Trio trade receivables amounts to £15.6m. The gross amount of trade receivables is £20.2m, of which £4.6m have been impaired as it is expected that the full contractual amounts may not be collected.
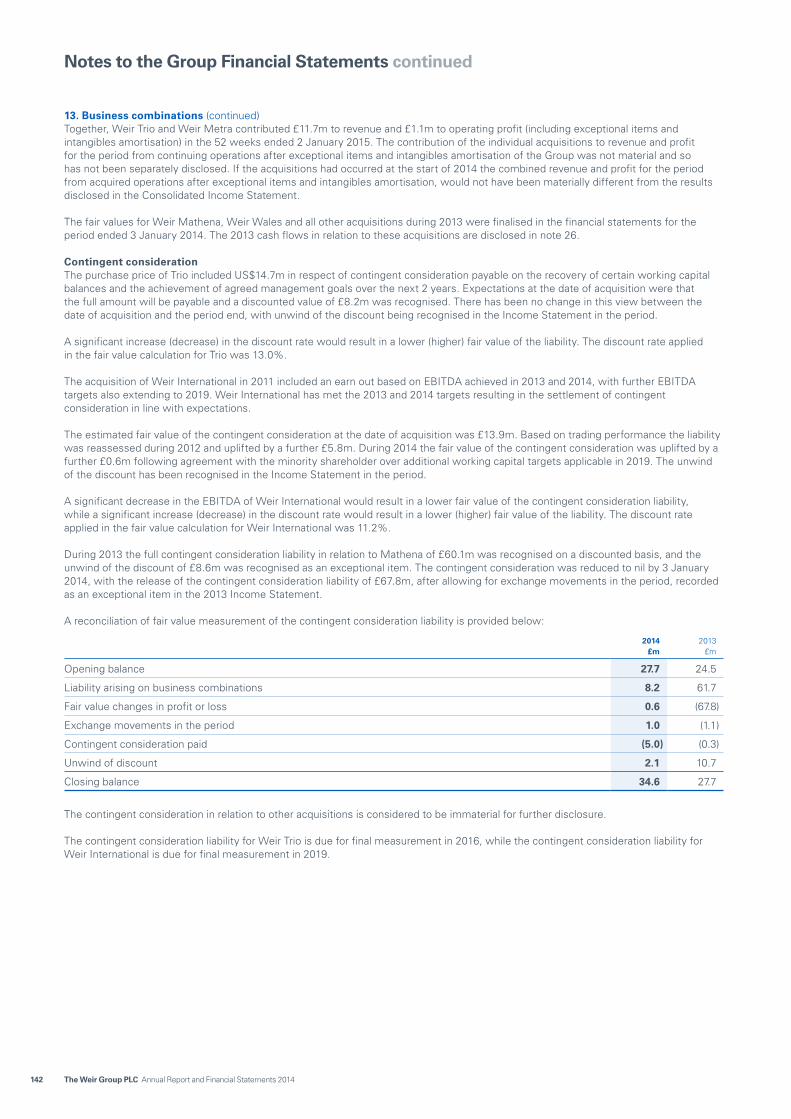
142 The Weir Group PLC Annual Report and Financial Statements 2014
Notes to the Group Financial Statements continued
13. Business combinations (continued)Together, Weir Trio and Weir Metra contributed £11.7m to revenue and £1.1m to operating profit (including exceptional items and intangibles amortisation) in the 52 weeks ended 2 January 2015. The contribution of the individual acquisitions to revenue and profit for the period from continuing operations after exceptional items and intangibles amortisation of the Group was not material and so has not been separately disclosed. If the acquisitions had occurred at the start of 2014 the combined revenue and profit for the period from acquired operations after exceptional items and intangibles amortisation, would not have been materially different from the results disclosed in the Consolidated Income Statement.
The fair values for Weir Mathena, Weir Wales and all other acquisitions during 2013 were finalised in the financial statements for the period ended 3 January 2014. The 2013 cash flows in relation to these acquisitions are disclosed in note 26.
Contingent considerationThe purchase price of Trio included US$14.7m in respect of contingent consideration payable on the recovery of certain working capital balances and the achievement of agreed management goals over the next 2 years. Expectations at the date of acquisition were that the full amount will be payable and a discounted value of £8.2m was recognised. There has been no change in this view between the date of acquisition and the period end, with unwind of the discount being recognised in the Income Statement in the period.
A significant increase (decrease) in the discount rate would result in a lower (higher) fair value of the liability. The discount rate applied in the fair value calculation for Trio was 13.0%.
The acquisition of Weir International in 2011 included an earn out based on EBITDA achieved in 2013 and 2014, with further EBITDA targets also extending to 2019. Weir International has met the 2013 and 2014 targets resulting in the settlement of contingent consideration in line with expectations.
The estimated fair value of the contingent consideration at the date of acquisition was £13.9m. Based on trading performance the liability was reassessed during 2012 and uplifted by a further £5.8m. During 2014 the fair value of the contingent consideration was uplifted by a further £0.6m following agreement with the minority shareholder over additional working capital targets applicable in 2019. The unwind of the discount has been recognised in the Income Statement in the period.
A significant decrease in the EBITDA of Weir International would result in a lower fair value of the contingent consideration liability, while a significant increase (decrease) in the discount rate would result in a lower (higher) fair value of the liability. The discount rate applied in the fair value calculation for Weir International was 11.2%.
During 2013 the full contingent consideration liability in relation to Mathena of £60.1m was recognised on a discounted basis, and the unwind of the discount of £8.6m was recognised as an exceptional item. The contingent consideration was reduced to nil by 3 January 2014, with the release of the contingent consideration liability of £67.8m, after allowing for exchange movements in the period, recorded as an exceptional item in the 2013 Income Statement.
A reconciliation of fair value measurement of the contingent consideration liability is provided below:
2014 £m
2013 £m
Opening balance 27.7 24.5
Liability arising on business combinations 8.2 61.7
Fair value changes in profit or loss 0.6 (67.8)
Exchange movements in the period 1.0 (1.1)
Contingent consideration paid (5.0) (0.3)
Unwind of discount 2.1 10.7
Closing balance 34.6 27.7
The contingent consideration in relation to other acquisitions is considered to be immaterial for further disclosure.
The contingent consideration liability for Weir Trio is due for final measurement in 2016, while the contingent consideration liability for Weir International is due for final measurement in 2019.

Strategic Report Financial StatementsCorporate Governance
143The Weir Group PLC Annual Report and Financial Statements 2014
14. Impairment testing of goodwill & intangible assets with indefinite livesGoodwill acquired through business combinations and intangible assets with indefinite lives have been allocated at acquisition to cash generating units (CGUs) that are expected to benefit from the business combination.
The acquisitions during 2014, as described in note 13, have been allocated to these CGUs. Trio has been included within the Minerals CGU, while Metra has been added to the Pressure Control CGU.
The carrying amount of goodwill and intangible assets with indefinite lives has been allocated as per the table below.
Goodwill 2014
£m
Intangibles* 2014
£m
Goodwill 2013
£m
Intangibles* 2013
£m
Pressure Pumping 298.5 35.5 279.3 33.2
Pressure Control 185.8 39.7 321.9 37.1
Gabbioneta 56.3 5.3 59.7 5.6
Minerals 318.1 111.7 239.6 90.7
Other 72.6 9.2 71.3 8.6
931.3 201.4 971.8 175.2
* Intangible assets with indefinite lives (brand names).
Impairment testing and sensitivity analysisThe very significant decline in the oil price towards the end of 2014 and at the start of 2015, and the resultant impact on the North American rig count, has had a substantial impact on the short to medium term forecasts of our Pressure Control CGU such that an impairment charge of £160m has been recognised at the end of the year. This has been entirely allocated against goodwill.
The estimated recoverable amount of the Pressure Control CGU is equal to its carrying value. Consequently, any adverse charge in key assumptions would, in isolation, cause a further impairment loss to be recognised.
The following table shows the changes to assumptions used in the Pressure Control impairment model that would, in isolation, lead to an (increase)/decrease in the impairment loss recognised in 2014.
Increase by 50bps
£m
Decrease by 50bps
£m
Increase by 5% £m
Decrease by 5% £m
Discount rate (27.4) 30.6 n/a n/a
Real growth rate 21.9 (19.7) n/a n/a
Forecast revenue growth* n/a n/a 13.3 (12.8)
EBIT margin 10.9 (10.3) n/a n/a
* Forecast revenue growth is expressed as the percentage increase/decrease in each of the initial five years used in the impairment testing.
As explained in other sections of this Annual Report (but specifically in the Financial Review on page 46 and in note 5), the Group has already reacted to market conditions through implementation of actions under the Group-wide efficiency review and is well placed to manage the current downturn.
The cash flow forecasts underpinning the impairment testing reflect the current oil price (and related activity levels) enduring for the next two years, with pressure on both volumes and pricing, and a measured return to more ‘normal’ levels thereafter.
No impairment has been identified in relation to any of the other CGUs. With regard to the Pressure Pumping CGU, this business is more mature and had significant levels of headroom between net asset value and discounted cash flows prior to the current market downturn. A number of stress test scenarios have been modelled which do not result in any impairment being identified.
For the Gabbioneta, Minerals and Other CGUs, base case forecasts show significant headroom above carrying value. Sensitivity analysis has been undertaken for each of these CGUs to assess the impact of any reasonable possible change in key assumptions. There is no reasonably possible change that would cause the carrying values to exceed recoverable amounts.
A description of each of the CGUs is provided below along with a summary of the key drivers of revenue growth and EBIT margin.
Pressure PumpingPressure Pumping includes the Weir SPM, Weir Novatech and Weir Mesa brands. Pressure Pumping is a supplier of oil and gas well service pumps, associated flow control equipment and services to the oil and gas production industry. Demand for Pressure Pumping products and services is closely related to the number of conventional and unconventional oil drilling rigs and gas well drilling rigs which is in turn dependent upon oil and natural gas prices and storage levels. Independent forecasts of North American oil and gas well drilling activity, which take into account forecast oil and natural gas prices and storage levels, have been used to derive revenue growth assumptions. These independent forecasts were updated during the first quarter of 2015 for the downturn in oil price.

144 The Weir Group PLC Annual Report and Financial Statements 2014
Notes to the Group Financial Statements continued
14. Impairment testing of goodwill & intangible assets with indefinite lives (continued)Pressure ControlPressure Control includes the Weir Seaboard, Weir Mathena and Weir Metra brands. Weir Pressure Control is a supplier of oil and gas wellhead solutions and associated rental equipment to the oil and gas production industry. A large proportion of the business’ revenues are generated in North America with demand being closely related to the number of conventional oil drilling rigs and gas well drilling rigs in operation which is in turn dependent upon oil and natural gas prices and storage levels. Independent forecasts of North American oil and gas well drilling activity, which take into account forecast oil and natural gas prices and storage levels, have been used to derive revenue growth assumptions. These independent forecasts were updated during the first quarter of 2015 for the downturn in oil price.
MineralsMinerals includes the Weir Warman, Weir Linatex, Weir Multiflo, Weir Wales and Weir Trio brands. Weir Minerals companies supply pumps and associated equipment and services to all global mining markets. The key drivers for revenues are (i) levels of mining capital expenditure which drives demand for original equipment and (ii) levels of actual mining activity which drives demand for spare parts and service. Independent forecasts of mining capital expenditure and activity have been used to derive revenue growth assumptions. These independent forecasts were prepared during the final quarter of 2014. Weir Trio was excluded from the Group impairment test as a fair value review of goodwill and intangible assets was performed in the final quarter of 2014 as part of the acquisition process. A breakdown of Weir Trio’s goodwill and intangible assets are disclosed in note 13.
GabbionetaGabbioneta is a supplier of heavy duty process applications to oil and gas refinery, petro-chemical and power generation industries. The key drivers for revenues are capital expenditure within oil refinery and petro-chemical industries. Independent forecasts of expenditure in these sectors have been used to derive revenue growth assumptions. These independent forecasts were prepared during the final quarter of 2014.
Other The amounts included in Other are not considered individually significant. There have been no changes in the period.
The Group tests goodwill and intangible assets with indefinite lives annually for impairment, or more frequently if there are indications that these might be impaired. The basis of the impairment tests for the four primary CGUs including key assumptions are set out in the table below.
CGUBasis of
valuationPeriod of forecast Discount rate1 Real growth2 Key assumptions Source
Pressure Pumping Value in use 5 years 12.9% (2013:12.2%) 1.5% (2013:1.5%)Revenue growth
EBIT marginsExternal forecast
Historic experience
Pressure Control Value in use 5 years 12.9% (2013:12.2%) 1.5% (2013:1.5%)Revenue growth
EBIT marginsExternal forecast
Historic experience
Gabbioneta Value in use 5 years 11.8% (2013:13.6%) 1.5% (2013:1.5%)Revenue growth
EBIT marginsExternal forecast
Historic experience
Minerals Value in use 5 years 13.7% (2013:14.7%) 1.5% (2013:1.5%)Revenue growth
EBIT marginsExternal forecast
Historic experience
1 Discount rateThe discount rates presented above reflect the pre-tax nominal weighted average cost of capital (WACC) in the most appropriate geographic region. The WACC is the weighted average of the pre-tax cost of debt financing and the pre-tax cost of equity finance. During the year, there have been reductions to the 10 year government bond yields for some countries, including Italy, which has led to a decrease in the cost of equity, and as a result, the overall discount rates for those countries.
2 Real growthReal growth beyond the five year forecast period of 1.5% is in line with 2013 reflecting the gradual return to a more stable economic environment.
EBIT marginsEBIT margins have been forecast based on historic levels taking cognisance of the likely impact of changing economic environments and competitive landscapes on volumes and revenues and the impact of associated management actions on costs.

Strategic Report Financial StatementsCorporate Governance
145The Weir Group PLC Annual Report and Financial Statements 2014
15. Investments in joint venturesThe significant investments in joint ventures are as follows.
£m
At 28 December 2012 12.0
Additions 14.0
Share of results 8.4
Share of dividends (6.1)
Exchange adjustment (1.2)
At 3 January 2014 27.1
Disposals 0.3
Share of results 10.0
Share of dividends (6.0)
Exchange adjustment 2.3
At 2 January 2015 33.7
Details of the Group’s share of the balance sheet, revenue and profit of each of its joint ventures are given below.
2014 £m
2013 £m
Share of joint ventures balance sheets
Goodwill 12.7 11.8
Current assets 33.4 19.9
Non-current assets 4.3 3.3
Current liabilities (15.1) (6.2)
Non-current liabilities (1.6) (1.7)
Net assets 33.7 27.1
Share of joint ventures revenue & profits
Revenue 56.2 36.8
Cost of sales (37.5) (22.9)
Selling & distribution costs (3.8) (2.6)
Administrative expenses (1.8) (1.5)
Income tax expense (3.1) (1.4)
Profit after tax 10.0 8.4
The Group’s significant investments in joint ventures are listed on page 183.
16. Inventories
2014 £m
2013 £m
Raw materials 171.6 150.8
Work in progress 120.9 112.8
Finished goods 258.8 221.4
551.3 485.0
In 2014 the cost of inventories recognised as an expense within cost of sales amounted to £1,632.2m (2013: £1,557.2m). In 2014 the write-down of inventories to net realisable value amounted to £13.8m (2013: £9.0m), which included £5.3m in relation to the Group-wide efficiency review, as disclosed in note 5. Write-downs in both years relate to on-going assessments of inventory obsolescence, excess inventory holding and inventory resale values across all of the Group’s businesses.

146 The Weir Group PLC Annual Report and Financial Statements 2014
Notes to the Group Financial Statements continued
17. Trade & other receivablesOther receivables presented as non-current on the face of the Consolidated Balance Sheet of £22.3m (2013: £nil) are in respect of insurance contracts relating to asbestos-related claims made in the US. Further detail is presented in note 22.
Current trade & other receivables are analysed in the following table.2014
£m2013
£m
Trade receivables 530.9 437.9
Allowance of doubtful debts (17.9) (15.4)
513.0 422.5
Other debtors 47.9 22.8
Sales tax receivable 12.9 11.4
Accrued income 24.1 21.8
Prepayments 27.1 18.6
625.0 497.1
The average credit period on sales of goods is 77 days (2013: 63 days). Other debtors includes £11.5m (2013: £0.3m) in respect of amounts due from joint ventures, and £5.9m (2013:nil) in respect of insurance contracts relating to asbestos-related claims in the US (note 22).
Analysis of trade receivables2014
£m2013
£m
Neither impaired nor past due 346.9 286.6
Past due but not impaired 166.1 135.9
Impaired 17.9 15.4
530.9 437.9
Ageing of past due but not impaired trade receivables2014
£m2013
£m
Up to 3 months 114.6 100.8
Between 3 & 6 months 24.5 21.1
More than 6 months 27.0 14.0
166.1 135.9
Movement in the allowance for doubtful debts2014
£m2013
£m
Balance at the beginning of the period (15.4) (12.6)
Impairment losses recognised on receivables (6.0) (7.1)
Amounts written off as uncollectable 1.4 1.5
Amounts recovered during the period 0.3 0.3
Impairment losses reversed 1.8 1.6
Exchange adjustment – 0.9
Balance at the end of the period (17.9) (15.4)
Impairment losses recognised in 2014 include £4.8m as a result of actions taken following the Group-wide efficiency review, as disclosed in note 5.
Ageing of impaired trade receivables2014
£m2013
£m
Up to 3 months 1.9 3.2
Between 3 & 6 months 1.5 0.8
More than 6 months 14.5 11.4
17.9 15.4

Strategic Report Financial StatementsCorporate Governance
147The Weir Group PLC Annual Report and Financial Statements 2014
18. Construction contracts
2014 £m
2013 £m
Gross amount due from customers for contract work (included in current assets) 31.3 28.3
Gross amount due to customers for contract work (included in current liabilities) (13.8) (12.1)
17.5 16.2
Contract costs incurred plus recognised profits less recognised losses to date 99.4 94.4
Less: progress billings (81.9) (78.2)
17.5 16.2
The amount of retentions held by customers for contract work amounted to £nil (2013: £nil) and the amount of advances received from customers for contract work amounted to £2.4m (2013: £4.9m).
19. Cash & short-term deposits
2014 £m
2013 £m
Cash at bank & in hand 160.4 70.9
Short-term deposits 18.3 8.2
178.7 79.1
For the purposes of the Consolidated Cash Flow Statement, cash & cash equivalents comprise the following
Cash & short-term deposits 178.7 79.1
Bank overdrafts & short-term borrowings (note 20) (12.1) (10.5)
166.6 68.6
Cash at bank & in hand earns interest at floating rates based on daily bank deposit rates. Short-term deposits are made for varying periods of between one day and three months depending on the immediate cash requirements of the Group and earn interest at the respective short-term deposit rates.
20. Interest-bearing loans & borrowings
2014 £m
2013 £m
Current
Bank overdrafts 10.7 8.1
Short-term borrowings 1.4 2.4
12.1 10.5
Fixed rate notes 70.6 –
Bank loans 83.3 15.8
Obligations under finance leases (note 27) 0.1 0.2
166.1 26.5
Non-current
Bank loans 135.2 40.3
Fixed rate notes 737.9 759.0
Obligations under finance leases (note 27) 0.2 0.3
873.3 799.6

148 The Weir Group PLC Annual Report and Financial Statements 2014
Notes to the Group Financial Statements continued
20. Interest-bearing loans & borrowings (continued)
Weighted average interest rate
Bank loans Maturity Interest basis2014
%2013
%2014
£m2013
£m
Revolving credit facility
United States Dollar variable rate loans 2019 US$ LIBOR 0.51 0.97 42.8 39.9
United States Dollar variable rate loans 2019 £ LIBOR 0.85 – 91.0 –
Other
Uncommitted facility loan 2015 £ LIBOR 0.89 0.82 83.2 15.8
United States Dollar buyer credit facility 2015 US$ LIBOR 2.11 2.24 0.1 0.4
South African Rand loan facility 2016 ZAR JIBAR 7.03 – 1.4 –
218.5 56.1
Less: current instalments due on bank loans
Uncommitted facility loan 2015 £ LIBOR (83.2) (15.8)
United States Dollar buyer credit facility 2015 US$ LIBOR (0.1) –
Non-current bank loans 135.2 40.3
Weighted average interest rate
Fixed rate notes Maturity Interest basis2014
%2013
%2014
£m2013
£m
Private placement
Sterling fixed rate notes 2015 FIXED 4.58 4.58 12.0 12.0
United States Dollar fixed rate notes 2015 FIXED 4.20 4.20 58.6 54.8
Sterling fixed rate notes 2018 FIXED 5.36 5.36 43.0 43.0
United States Dollar fixed rate notes 2018 FIXED 5.03 5.03 45.6 42.6
United States Dollar fixed rate notes 2019 FIXED 3.69 3.69 136.4 127.5
United States Dollar fixed rate notes 2022 FIXED 4.27 4.27 383.0 357.8
United States Dollar fixed rate notes 2023 FIXED 4.34 4.34 129.9 121.3
808.5 759.0
Less: current instalments due on fixed rate notes
Sterling fixed rate notes 2015 FIXED (12.0) –
United States Dollar fixed rate notes 2015 FIXED (58.6) –
Non-current fixed rate notes 737.9 759.0
US$ LIBOR is the United States Dollar London Inter Bank Offer Rate and £ LIBOR is the Great British Pound London Inter Bank Offer Rate. The weighted average interest rates include an applicable margin over and above the interest basis.
The disclosures above represent the interest profile and currency profile of financial liabilities before the impact of derivative financial instruments.
In September 2014, the Group amended the US$800m multi-currency revolving credit facility, which was previously refinanced in July 2013 and due to mature in July 2018. The amendment extended the maturity date to July 2019, with the option of two one-year extensions. At 2 January 2015, US$209.8m was drawn under the revolving credit facility. Total unamortised issue costs at 2 January 2015 were £4.6m (2013: £4.9m).
On 12 January 2015, the Group repaid US$90m US Dollar fixed rate notes and £12.0m Sterling fixed rate notes as these fell due. These were refinanced using existing facilities including the US$800m multi-currency revolving credit facility and various uncommitted Sterling borrowing facilities in place.

Strategic Report Financial StatementsCorporate Governance
149The Weir Group PLC Annual Report and Financial Statements 2014
21. Trade & other payables
2014 £m
2013 £m
Current
Trade payables 305.3 272.9
Other creditors 24.5 18.8
Other taxes & social security costs 18.3 12.9
Accruals 159.3 100.7
Contingent consideration 9.0 5.3
Deferred income 65.0 66.2
581.4 476.8
Non-current
Contingent consideration 25.6 22.4
22. Provisions
Warranties & onerous
sales contracts
£m
Employee related
£m
Exceptional rationalisation
£mOther
£mTotal
£m
At 3 January 2014 27.8 22.5 – 4.3 54.6
Additions 16.4 30.6 30.1 1.9 79.0
Acquisitions 8.7 1.5 – 0.7 10.9
Utilised (15.2) (1.7) (8.2) (1.8) (26.9)
Unutilised (3.1) (0.9) – (1.2) (5.2)
Exchange adjustment 1.0 (0.4) (0.3) (0.2) 0.1
At 2 January 2015 35.6 51.6 21.6 3.7 112.5
Current 2014 30.8 10.9 20.3 3.1 65.1
Non-current 2014 4.8 40.7 1.3 0.6 47.4
35.6 51.6 21.6 3.7 112.5
Current 2013 21.7 3.7 – 3.5 28.9
Non-current 2013 6.1 18.8 – 0.8 25.7
27.8 22.5 – 4.3 54.6
Warranties and onerous sales contractsProvision has been made in respect of actual warranty and contract penalty claims on goods sold and services provided and allowance has been made for potential warranty claims based on past experience for goods and services sold with a warranty guarantee. It is expected that all costs related to such claims will have been incurred within five years of the balance sheet date.
Provision has been made in respect of sales contracts entered into for the sale of goods in the normal course of business where the unavoidable costs of meeting the obligations under the contracts exceed the economic benefits expected to be received from the contracts. Provision is made immediately when it becomes apparent that expected costs will exceed the expected benefits of the contract. It is expected that the majority of these costs will be incurred within one year of the balance sheet date.
Employee relatedEmployee related provisions arise from legal obligations, some of which are for asbestos-related claims.
Asbestos-related claimsCertain of the Group’s US-based subsidiaries are co-defendants in lawsuits pending in the United States in which plaintiffs are claiming damages arising from alleged exposure to products previously manufactured which contained asbestos. The Group has comprehensive insurance cover for these cases with all claims directly managed by the Group’s insurers who also meet all associated defence costs. The insurers and their legal advisers agree and execute the defence strategy between them and there are no related cash flows to or from the Group. We expect this to continue for the foreseeable future as long as the litigation arises.

150 The Weir Group PLC Annual Report and Financial Statements 2014
Notes to the Group Financial Statements continued
22. Provisions (continued)Employee related (continued)Asbestos-related claims (continued)At the end of 2014, there are 1,503 asbestos-related claims outstanding in the US (2013: 1,129). In light of the recent increase in claims, a review was completed to assess the adequacy of the Group’s insurance policies to meet future settlement and defence costs. As a result of this review we have estimated settlement and defence costs for existing and projected claims received in the next five years and recorded a provision of £28m with an equivalent receivable for insurance proceeds (note 17).
This provision represents the Directors best estimate of the future liability at this time although given the lack of consistent claims and settlement history, these estimates and the period over which they are assessed will continue to be refined.
Due to the inherent uncertainty associated with estimating future costs in respect of asbestos-related diseases, there can be no guarantee that the assumptions used to estimate the provision will result in an accurate prediction of the actual costs that my be incurred. However, we do not expect there to be a net financial exposure to the Group given the comprehensive insurance cover in place.
In the UK, there are 26 (2013: 26) outstanding asbestos-related claims which are not the subject of insurance cover. The Group provides for both based on management’s best estimate of the likely costs given past experience of the volume and cost of similar claims brought against the Group. It is expected that these costs will be incurred in the period up to 2025.
Exceptional rationalisationAs part of the Group-wide efficiency review announced in November 2014 the Group has provided £30.1m, of which £8.2m was utilised in the year. The provision is based on expected costs for the closure of small manufacturing facilities, consolidation of service centres, workforce reductions and the exit from certain lower margin activities. The majority of the provision will be utilised in the next year, with the remainder utilised within the next 24 months.
OtherOther provisions relate to an environmental clean-up programme in the United States for a company acquired in 1992, the discontinued operations and indemnity provision, and various other legal claims and exposures across the Group. The environmental provision is based on management’s current best estimate of the expected costs under the programme. It is expected that these costs will be incurred in the period up to 2019. The discontinued operations warranty and indemnity provision was reduced in the year (note 8) leaving a closing balance of £0.3m (2013: £1.3m).
23. Deferred tax
2014 £m
2013 £m
Deferred income tax assets
Post-employment benefits 21.4 15.7
Decelerated depreciation for tax purposes 10.2 13.8
Intangible assets 5.4 –
Untaxed reserves 60.8 47.0
Offset against liabilities (75.0) (59.3)
Deferred income tax assets 22.8 17.2
Deferred income tax liabilities
Accelerated depreciation for tax purposes (48.0) (49.4)
Overseas tax on unremitted earnings (24.1) (24.3)
Intangible assets (165.4) (148.0)
Other temporary differences – (3.1)
Offset against assets 75.0 59.3
Deferred income tax liabilities (162.5) (165.5)
Net deferred income tax liability (139.7) (148.3)

Strategic Report Financial StatementsCorporate Governance
151The Weir Group PLC Annual Report and Financial Statements 2014
The movement in deferred income tax assets and liabilities during the period was as follows.
Post employment
benefits £m
Accelerated depreciation
for tax purposes
£m
Overseas tax on
unremitted earnings
£m
Intangible assets
£m
Untaxed reserves & other
temporary differences
£mTotal
£m
At 28 December 2012 23.0 (28.6) (24.1) (154.3) 51.9 (132.1)
Acquisitions – (0.1) – (5.8) 0.2 (5.7)
(Charged) credited to the income statement (note 7) (1.2) (7.9) (2.0) 9.7 (6.0) (7.4)
Credited (charged) to equity (6.1) – – – 0.8 (5.3)
Exchange adjustment – 1.1 1.8 2.5 (3.2) 2.2
At 3 January 2014 15.7 (35.5) (24.3) (147.9) 43.7 (148.3)
Prior year adjustments – 0.2 – – (0.2) –
Acquisitions – – – (11.3) 10.3 (1.0)
Credited (charged) to the income statement (note 7) 0.2 (1.6) (0.2) 8.2 3.9 10.5
Credited to equity 5.1 – – – 0.9 6.0
Exchange adjustment 0.4 (0.9) 0.4 (9.0) 2.2 (6.9)
At 2 January 2015 21.4 (37.8) (24.1) (160.0) 60.8 (139.7)
Untaxed reserves primarily relate to temporarily disallowed inventory/debtor provisions and accruals/provisions for liabilities where the tax allowance is deferred until the cash expense occurs.
Deferred tax asset balances for unused tax losses of £5.8m (2013: £4.9m) have not been recognised on the grounds that there is insufficient evidence that these assets will be recoverable. These assets will be recovered when future tax charges are sufficient to absorb these tax benefits. Deferred tax asset balances for capital losses in the UK amounting to £5.8m (2013: £5.8m) have not been recognised but would be available in the event of future capital gains being incurred by the Group.
Temporary differences associated with Group investmentsA deferred tax liability of £24.1m (2013: £24.3m) has been recognised in respect of taxes on the unremitted earnings of the South American and Canadian subsidiaries. As at 2 January 2015, this is the only recognised deferred tax liability in respect of taxes on unremitted earnings as the Group does not foresee a distribution of unremitted earnings from other subsidiaries or joint ventures which would result in a reversal of deferred tax. The temporary differences associated with investments in subsidiaries and joint ventures, for which a deferred tax liability has not been recognised, aggregate to £1,607.0m (2013: £1,513.2m).
There are no income tax consequences attaching to the payment of dividends by the Company to its shareholders.
24. Pensions & other post-employment benefit plansThe Group has four main defined benefit pension plans in the UK and North America. All defined benefit plans are closed to new members. The most significant of the defined benefit plans are the two funded UK plans.
UK PlansThe Group has two funded defined benefit plans (the Main Plan and the Executive Plan) and an unfunded retirement benefit plan for retired executive directors. The Group operates a defined contribution plan for new hires. Contributions to the defined contribution arrangements are in addition to those set out below and are charged directly to the income statement.
For the defined benefit plans, benefits are related to service and final salary. Contributory salary in respect of the Main Plan is subject to capped increases, with the cap being in line with RPI inflation up to a maximum of 5% per annum. Following a consultation process which ended in August 2013, the Main Plan will close to future accrual of benefits effective from 30 June 2015 and an exceptional curtailment gain of £2.7m was recognised in the previous period.
The weighted average duration of the expected benefit payments from the Main Plan is around 16 years and from the Executive Plan is around 12 years.
The current funding target for the UK plans is to maintain assets equal to the value of the accrued benefits based on projected salaries where relevant (subject to the cap above for the Main Plan). The Main Plan holds insurance policies in respect of a significant proportion of deferred and retired pensioners.
The regulatory framework in the UK requires the Trustees and Group to agree upon the assumptions underlying the funding target, and then to agree upon the necessary contributions required to recover any deficit at the valuation date. There is a risk to the Group that adverse experience could lead to a requirement for the Group to make considerable contributions to recover any deficit. This risk is significantly reduced for the Main Plan through the insurance policies held by the Plan.

152 The Weir Group PLC Annual Report and Financial Statements 2014
Notes to the Group Financial Statements continued
24. Pensions & other post-employment benefit plans (continued)North American PlansThe Group also sponsors two funded defined benefit pension plans in the United States and Canada and certain unfunded post-employment healthcare benefits for senior employees in the United States.
These plans combined make up 4% of the Group’s pension and other post-employment benefit plan commitments and 2% of the Group’s total associated assets. The weighted average duration of these plans is around 12 years.
AssumptionsThe significant actuarial assumptions used for accounting purposes reflect prevailing market conditions in each of the relevant countries in which the Group operates and are as follows.
UK pensions
North American pensions
North American post-retirement
healthcare
2014 2013 2014 2013 2014 2013
Significant actuarial assumptions
Discount rate (% pa) 3.5 4.4 3.9 4.7 3.9 4.7
Retail Prices inflation assumption (% pa) 3.0 3.4 n/a n/a n/a n/a
Post-retirement mortality (life expectancies in years)
Current pensioners at 65 – male 22.1 22.0 21.7 20.0 21.7 19.6
Current pensioners at 65 – female 24.6 24.5 23.9 21.9 23.9 21.5
Future pensioners at 65 – male 23.9 23.8 23.3 21.5 23.4 21.1
Future pensioners at 65 – female 26.5 26.5 25.5 22.7 25.6 22.4
Other related actuarial assumptions
Rate of increases for pensions in payment (% pa)
Pre 6 April 2006 service 2.9 3.3 n/a n/a n/a n/a
Post 5 April 2006 service 2.0 2.2 n/a n/a n/a n/a
Consumer Prices inflation assumption (% pa) 2.0 2.4 1.9 2.0 2.0 2.3
Rate of increase in healthcare costs n/a n/a n/a n/a * *
* 7.7% per annum decreasing to 4.5% per annum and remaining static at that level from 2028 onwards.
The assumptions used to determine end-of-year benefit obligations are also used to calculate the following period’s cost. For North America, weighted average assumptions are shown where applicable.
The post-retirement mortality assumptions allow for expected increases in longevity. The ‘current’ disclosures above relate to assumptions based on longevity (in years) following retirement at the balance sheet date, with ‘future’ being that relating to a member retiring in 2035 (in 20 years time).

Strategic Report Financial StatementsCorporate Governance
153The Weir Group PLC Annual Report and Financial Statements 2014
The assets and liabilities of the plans are as follows.
Total
2014 £m
2013 £m
Plan assets at fair value
Equities (quoted) 165.9 156.3
Diversified Growth Funds (primarily quoted) 42.3 38.4
Corporate bonds (quoted) 77.9 63.6
Government bonds (quoted) 86.0 67.9
Insurance policies (unquoted) 357.7 346.2
Cash (quoted) 12.1 8.6
Fair value of plan assets 741.9 681.0
Present value of funded obligations (827.0) (744.0)
Net funded obligations (85.1) (63.0)
Present value of unfunded obligations (9.2) (7.4)
Net liability (94.3) (70.4)
Plan in surplus 4.1 1.4
Plan in deficit (98.4) (71.8)
In 2013 the Plan in surplus was presented net against the Plan in deficit based on the size of the balance and the overall impact on the Group Consolidated Balance Sheet. Given the increase in the Plan surplus over 2014, separate disclosure has now been made in both the Consolidated Balance Sheet and the Segmental Information (note 3).
The government bonds held are primarily index-linked, with around only 7% of the total government bonds being fixed interest. The pension plans have not directly invested in any of the Group’s own financial instruments, or in properties or other assets used by the Group.
In the UK, where the majority of the Group’s pension assets are held, the investment strategy is to hold equities and other return seeking assets such as diversified growth funds and a mixture of bonds to meet the assessed value of the benefits promised for the current active member employees and some deferred pensioners. For the remaining deferred pensioners and the bulk of pensioners currently receiving their benefit, the liabilities are backed by insurance policies and suitable bonds.
The change in net liabilities recognised in the balance sheet is comprised as follows.
2014 £m
2013 £m
Opening net liabilities (70.4) (90.4)
Expense charged to profit and loss (4.9) (3.4)
Amount recognised in statement of comprehensive income (31.1) 8.0
Employer contributions 13.0 15.4
Currency adjustment (0.9) –
Closing net liabilities (94.3) (70.4)

154 The Weir Group PLC Annual Report and Financial Statements 2014
Notes to the Group Financial Statements continued
24. Pensions & other post-employment benefit plans (continued)Assumptions (continued)The amounts recognised in the Consolidated Income Statement and in the Consolidated Statement of Comprehensive Income for the period are analysed as follows.
2014 £m
2013 £m
Recognised in the Consolidated Income Statement
Current service cost (2.1) (2.2)
Administrative expenses (0.7) (0.4)
Past service settlement credit 0.5 –
Past service curtailment gain 0.2 2.7
Included in operating profit (2.1) 0.1
Interest on net pension liability (2.8) (3.5)
Total expense charged to profit & loss (4.9) (3.4)
Recognised in the Consolidated Statement of Comprehensive Income
Actual return on plan assets 84.6 49.5
Less: interest on plan assets (29.6) (27.5)
55.0 22.0
Other actuarial losses due to
Changes in financial assumptions (79.1) (14.0)
Changes in demographic assumptions (5.8) –
Experience on benefit obligations (1.2) –
Actuarial (losses) gains recognised in the Consolidated Statement of Comprehensive Income (31.1) 8.0
Current service cost and administration expenses are recognised in operating costs and net interest on net pension liability is recognised in other finance costs. The curtailment gain as a result of the Main Plan closing to future accrual with effect from 30 June 2015 was recognised as an exceptional item in 2013. Deficit reduction measures in two small North American plans resulted in a settlement credit of £0.5m and a curtailment gain of £0.2m in 2014.
Pension contributions are determined with the advice of independent qualified actuaries on the basis of regular valuations using the projected unit method. The Group made special contributions of £10.6m in 2014 (2013: £12.1m) in addition to the Group’s regular contributions.
The most recent actuarial funding valuation of the Main Plan was as at 31 December 2011 when the funding shortfall was £81.4m. The deficit recovery plan agreed with the Trustees at that time was for the Company to make recovery contributions of £8.0m per annum up to 2020, subject to reassessment at future triennial valuations. The next funding valuation of the Main Plan, as at 31 December 2014, is currently on-going.
The Executive Plan actuarial valuation at 31 December 2013 included a funding shortfall of £10.6m with agreed recovery contributions of £2.4m per annum to 31 December 2017, also subject to reassessment at future triennial valuations.
The Group has taken legal advice regarding its UK arrangements to confirm the accounting treatment under IFRIC14 with regard to recognition of a current surplus and also recognition of a minimum funding requirement. This confirmed that there is no requirement to adjust the balance sheet and that recognition of a current surplus is appropriate on the basis that the Group has an unconditional right to a refund of a current (or projected future) surplus at some point in the future. For the same reason, there is no requirement for the Group to adjust the balance sheet to recognise the future agreed deficit recovery contributions.

Strategic Report Financial StatementsCorporate Governance
155The Weir Group PLC Annual Report and Financial Statements 2014
Sensitivity AnalysisChanges in key assumptions can have a significant effect on the reported retirement benefit obligation and the income statement expense for 2015. The effects of changes in those assumptions are set out in the table below.
Increase 2014
£m
Decrease 2014
£m
Increase 2013
£m
Decrease 2013
£m
Discount rate
Effect on defined benefit obligation of a 1.0% change 121.4 (147.0) 106.0 (128.1)
Effect on net liability of a 1.0% change 87.0 (108.6) 73.4 (91.7)
RPI inflation (and associated assumptions)
Effect on defined benefit obligation of a 1.0% change (77.4) 72.8 (71.4) 71.2
Effect on net liability of a 1.0% change (54.4) 49.9 (53.1) 47.6
Life expectancy
Effect on defined benefit obligation of a 1 year change (22.9) 22.9 (20.5) 20.5
Effect on net liability of a 1 year change (12.2) 12.2 (10.1) 10.1
The impact on the net liability is significantly reduced as a result of the insurance policies held. In the absence of such policies, the impact on the net liability would be much closer to the significantly higher impact on the defined benefit obligation shown in the table.
These sensitivities have been calculated to show the movement in the defined benefit obligation and net liability in isolation and assume no other changes in market conditions at the accounting date. In practice, for example, a change in discount rate is unlikely to occur without any movement in the value of the invested (non-insurance policy) assets held by the plans.
Changes in the present value of the defined benefit obligations are analysed as follows.
2014 £m
2013 £m
Opening defined benefit obligations (751.4) (739.9)
Current service cost (2.1) (2.2)
Past service curtailment gain 0.2 2.7
Interest on benefit obligations (32.4) (31.0)
Benefits paid 34.6 32.6
Actuarial losses due to
Changes in financial assumptions (79.1) (14.0)
Changes in demographic assumptions (5.8) –
Experience on benefit obligations (1.2) –
Gains on curtailments and settlements 2.9 –
Exchange rate adjustment (1.9) 0.4
Closing defined benefit obligations (836.2) (751.4)
The past service curtailment gain of £2.7m in the prior period arose as a result of the decision taken, following consultation, to close the Main Plan to the future accrual of benefits with effect from 30 June 2015 onwards. This decision was announced to members in August 2013, at which point the curtailment gain was recognised under IAS 19 (R).

156 The Weir Group PLC Annual Report and Financial Statements 2014
Notes to the Group Financial Statements continued
24. Pensions & other post-employment benefit plans (continued)Sensitivity Analysis (continued)Changes in the fair value of plan assets are analysed as follows.
2014 £m
2013 £m
Opening plan assets 681.0 649.5
Interest on plan assets 29.6 27.5
Employer contributions 13.0 15.4
Administrative expenses (0.7) (0.4)
Benefits paid (34.6) (32.6)
Actuarial return on plan assets less interest on plan assets 55.0 22.0
Assets distributed on settlements (2.4) –
Exchange rate adjustment 1.0 (0.4)
Closing plan assets 741.9 681.0
25. Share capital & reserves
2014 Number
Million
2013 Number
Million
Issued & fully paid share capital
At the beginning of the period 213.9 213.6
Issued during the period in respect of LTIP awards 0.2 0.3
At the end of the period 214.1 213.9
Treasury shares
At the beginning of the period 0.7 1.1
Issued during the period in respect of LTIP awards – (0.4)
At the end of the period 0.7 0.7
The Company has one class of ordinary share with a par value of 12.5p which carries no rights to fixed income.
As at 2 January 2015, 68,590 shares (2013: 90,827 shares) were held by the Kleinwort EBT with a market value of £1.3m (2013: £1.9m).
As at 2 January 2015, 220,952 shares (2013: 168,764) were held by the Appleby EBT for the strategic and matching elements of the deferred bonus and 83,850 shares (2013: 82,667) for the deferred element. These shares have a market value of £5.7m (2013: £5.3m).
Capital redemption reserveThe capital redemption reserve was created by a repurchase and cancellation of own shares during the 53 weeks ended 1 January 1999.
Foreign currency translation reserveThe foreign currency translation reserve is used to record exchange differences arising from the translation of the financial statements of foreign operations and the Group’s hedge of its net investment in foreign operations.
Hedge accounting reserveThis reserve records the portion of the gains or losses on hedging instruments used as cash flow hedges that are determined to be effective. Net gains (losses) transferred from equity during the period are included in the following line items in the Consolidated Income Statement and Consolidated Balance Sheet.
2014 £m
2013 £m
Revenue – 0.3
Cost of sales (0.5) (0.4)
Interest – 0.4
Inventory (0.4) (0.5)
(0.9) (0.2)

Strategic Report Financial StatementsCorporate Governance
157The Weir Group PLC Annual Report and Financial Statements 2014
26. Additional cash flow information
2014 £m
2013 £m
Continuing operations
Net cash generated from operations
Operating profit 192.5 490.3
Exceptional items 52.4 (70.5)
Share of results of joint ventures (10.0) (8.4)
Depreciation of property, plant & equipment 61.1 59.1
Amortisation of intangible assets 44.9 46.7
Impairment of intangible assets 160.0 –
Gains on disposal of property, plant & equipment (1.4) (1.3)
Funding of pension & post-retirement costs (0.4) (0.5)
Employee share schemes 4.4 8.7
Net foreign exchange including derivative financial instruments 1.4 4.1
Decrease in provisions (1.9) (13.4)
Cash generated from operations before working capital cash flows 503.0 514.8
(Increase) decrease in inventories (45.5) 1.6
(Increase) in trade & other receivables and construction contracts (86.4) (37.1)
Increase (decrease) in trade & other payables and construction contracts 50.2 (5.4)
Cash generated from operations 421.3 473.9
Additional pension contributions paid (10.6) (12.1)
Exceptional cash items (10.6) –
Income tax paid (94.1) (71.9)
Net cash generated from operating activities 306.0 389.9
Exceptional items are detailed in note 5.
The employee-related provision and associated insurance asset in relation to US asbestos-related claims disclosed in note 22 will not result in any cash flows either to or from the Group and therefore they have been excluded from the table above.
The following tables summarise the cash flows arising on acquisitions.
2014 £m
2013 £m
Acquisitions of subsidiaries
Current period acquisitions (see below) (132.7) (200.9)
Prior period acquisitions contingent consideration paid (5.0) (0.3)
(137.7) (201.2)
Acquisition of subsidiaries – cash paid (140.7) (207.4)
Cash & cash equivalents acquired 8.0 6.5
Acquisition of subsidiaries – current period acquisitions (132.7) (200.9)
Settlement of external debt of subsidiary on acquisition – (1.3)
Total cash outflow on acquisition of subsidiaries – current year (note 13) (132.7) (202.2)
Prior period acquisitions contingent consideration paid (5.0) (0.3)
Total cash outflow relating to acquisitions (137.7) (202.5)
Disposals of subsidiaries
Prior period disposals – (0.3)
The settlement of the external debt of Weir Mathena on acquisition in 2013 was classified as a financing cash flow in accordance with IAS 7.

158 The Weir Group PLC Annual Report and Financial Statements 2014
Notes to the Group Financial Statements continued
26. Additional cash flow information (continued)
2014 £m
2013 £m
Reconciliation of net increase (decrease) in cash & cash equivalents to movement in net debt
Net increase (decrease) in cash & cash equivalents from continuing operations 97.2 (307.3)
Net (increase) decrease in debt (166.5) 260.7
Change in net debt resulting from cash flows (69.3) (46.6)
Lease inceptions (0.4) (0.1)
Loans acquired – (1.5)
Foreign currency translation differences (44.0) (9.9)
Change in net debt during the period (113.7) (58.1)
Net debt at the beginning of the period (747.0) (688.9)
Net debt at the end of the period (860.7) (747.0)
Net debt comprises the following
Cash & short-term deposits (note 19) 178.7 79.1
Current interest-bearing loans & borrowings (note 20) (166.1) (26.5)
Non-current interest-bearing loans & borrowings (note 20) (873.3) (799.6)
(860.7) (747.0)
27. Commitments & legal claimsOperating lease commitmentsThe Group has entered into commercial leases for land and buildings, motor vehicles and plant & equipment. Land and building leases have an average term of between two and ten years, motor vehicle leases have an average term of between two and four years and plant & equipment leases have an average term of between three and five years. Certain leases have terms of renewal, at the option of the lessee, but there are no purchase options or escalation clauses. Future minimum rentals payable under non-cancellable operating leases are shown in the table below.
2014 £m
2013 £m
Less than one year 32.0 24.1
After one year but no more than five years 70.6 57.1
More than five years 39.1 19.0
141.7 100.2
Finance lease commitmentsThe Group has finance leases for buildings and plant & equipment. Future minimum lease payments under finance leases together with the present value of the net minimum lease payments are shown in the table below.
Minimum payments
2014 £m
Present value of
payments 2014
£m
Minimum payments
2013 £m
Present value of payments
2013 £m
Less than one year 0.1 0.1 0.2 0.2
After one year but not more than five years 0.2 0.2 0.4 0.3
Total minimum lease payments 0.3 0.6
Less amounts representing finance charges – (0.1)
Present value of minimum lease payments 0.3 0.3 0.5 0.5
The weighted average outstanding lease term is 3.64 years (2013: 4.04 years). For the 52 weeks ended 2 January 2015, the weighted average effective borrowing rate was 4.60% (2013: 5.33%).
All leases are on a fixed repayment basis and no arrangements have been entered into for contingent rental payments.
Capital commitments2014
£m2013
£m
Outstanding capital commitments contracted but not provided for – property, plant & equipment 19.6 11.0
Outstanding capital commitments contracted but not provided for – intangible assets 3.5 –
The Group’s share of the capital commitments of its joint ventures amounted to £0.4m (2013: £0.5m).

Strategic Report Financial StatementsCorporate Governance
159The Weir Group PLC Annual Report and Financial Statements 2014
Legal claimsThe company and certain subsidiaries are, from time to time, parties to legal proceedings and claims which arise in the normal course of business.
A claim has been made by Philippines Gold Processing & Refining Corporation against Weir Services Australia Pty Limited (WSA), a subsidiary of the Company, in arbitration proceedings in respect of two contracts relating to the refurbishment and installation of a mill undertaken by WSA in 2007-2008 and 2008-2009, respectively. The amount claimed, which totals approximately £58m plus interest, seeks damages for the cost of repair and subsequent replacement of the mill together with business interruption loss at the processing plant. The original value of the contracts was around £1m. WSA is contesting the claim on multiple grounds. The claim is being vigorously defended although the outcome remains uncertain. The arbitration process is expected to conclude by the end of 2015.
The Directors are of the view that the outcome of legal proceedings in 2014 in relation to the UN Oil for Food programme are such that a contingent liability no longer exists in relation to this matter.
To the extent not already provided for, the Directors do not anticipate that the outcome of these proceedings and claims, either individually or in aggregate, will have a material adverse effect upon the Group’s financial position.
28. Equity settled share-based paymentsLTIPThere are three types of award which may be made under the LTIP to senior executives: performance shares, matching shares and investment shares. Details of each award are outlined in the Remuneration report on pages 91 to 108.
The following table illustrates the number and weighted average share prices (WASP) of shares awarded under the LTIP.
2014 Number
Million2014
WASP
2013 Number
Million2013
WASP
Outstanding at the beginning of the period 1.5 £15.44 1.7 £14.57
Awarded during the period 0.6 £26.20 0.4 £24.11
Exercised during the period (0.3) £16.13 (0.6) £7.57
Forfeited during the period (0.3) £16.78 – –
Outstanding at the end of the period 1.5 £23.43 1.5 £15.44
An amount of £3.1m (2013: £7.4m) has been charged to the Consolidated Income Statement in respect of the number of awards which are expected to be made at the end of the vesting period. This comprises an amount of £1.5m (2013: £2.4m) in respect of parent company employees and £1.6m (2013: £5.0m) in respect of employees of subsidiaries.
Certain subsidiary companies made a cash contribution to the parent company of £4.9m (2013: £3.2m) in the period in respect of their employees’ LTIP awards.
The remaining contractual lives of the outstanding LTIP awards at the end of the period are as follows.
Year of award
2014 Number
Million
2014 Remaining
contractual life
2013 Number
Million
2013 Remaining contractual
life
2011 – – 0.6 3 months
2012 0.5 3 months 0.5 15 months
2013 0.4 15 months 0.4 27 months
2014 0.6 27 months – –
The fair value of the conditional awards under the LTIP have been estimated using the Monte Carlo simulation model. The following table gives the assumptions made during the 52 weeks ended 2 January 2015 and the 53 weeks ended 3 January 2014 in the calculation of the fair value of awards made in those years.
2014 2013
Weighted average expected volatility (%) 34.88 39.91
Weighted average expected life (years) 3.00 3.00
Weighted average risk free rate (%) 1.22 0.37
Weighted average share price (£) 26.20 24.11
Weighted average fair value (£) 23.62 20.24
The expected life of the awards is based on historical data and is not necessarily indicative of exercise patterns that may occur. The expected volatility reflects the assumption that the historical volatility is volatility indicative of future trends which may also not necessarily be the actual outcome. Market related performance conditions have been taken into account in the calculation of fair values.

160 The Weir Group PLC Annual Report and Financial Statements 2014
Notes to the Group Financial Statements continued
28. Equity settled share-based payments (continued)Deferred Bonus PlanThere are three types of award which were made under the Deferred Bonus Plan: shares purchased on the employee’s behalf as part of the annual bonus, matching shares and strategic shares for senior executives.
The following table illustrates the number of shares awarded under the Deferred Bonus Plan.
2014 Number
Million
2013 Number
Million
Outstanding at the beginning of the period 0.2 0.1
Awarded during the period – 0.1
Outstanding at the end of the period 0.2 0.2
An amount of £1.3m (2013: £1.3m) has been charged to the Consolidated Income Statement in respect of the number of awards which are expected to be made at the end of the vesting period.
29. Related party disclosureThe following table provides the total amount of significant transactions which have been entered into with related parties for the relevant financial year and outstanding balances at the period end.
Related party
Sales to related
parties – goods
£m
Sales to related
parties – services
£m
Purchases from related
parties – goods
£m
Purchases from related
parties – services
£m
Amounts owed to related parties
£m
Joint ventures 2014 26.7 0.5 8.2 0.5 –
2013 5.6 0.5 2.7 1.7 –
Group pension plans 2014 – – – – 1.8
2013 – – – – 2.3
Contributions to the Group pension plans are disclosed in note 24.
Terms & conditions of transactions with related partiesSales to and from related parties are made at normal market prices. Outstanding balances at the period end are unsecured and settlement occurs in cash. There have been no guarantees provided or received for any related party balances. For 2014, the Group has not raised any provision for doubtful debts relating to amounts owed by related parties as the payment history has been excellent (2013: £nil). This assessment is undertaken each financial year through examining the financial position of the related party and the market in which the related party operates.
Compensation of key management personnel2014
£m2013
£m
Short-term employee benefits 6.3 4.6
Share-based payments 4.0 3.2
Post-employment benefits 0.2 –
10.5 7.8
Emoluments paid to the Directors of The Weir Group plc2014
£m2013
£m
Remuneration 2.9 2.0
Gains made on the exercise of Long Term Incentive Plan awards 1.9 2.8
4.8 4.8
Key management comprises the Board and the Group Executive. Further details of the Directors’ remuneration are disclosed in the Directors’ Remuneration Report.

Strategic Report Financial StatementsCorporate Governance
161The Weir Group PLC Annual Report and Financial Statements 2014
30. Financial assets & liabilitiesFinancial risk management objectives & policiesThe principal financial risks to which the Group is exposed are those relating to foreign currency, liquidity and credit risk. Foreign currency transactional risk arises when operating subsidiaries enter into transactions denominated in currencies other than their functional currencies. Translational risk arises on the translation of overseas earnings and investments into Sterling for consolidated reporting purposes. Credit risk is the risk that a customer or counterparty fails to meet an obligation under a contract and liquidity risk is the risk that the Group will be unable to meet its liabilities as they fall due. In addition, the Group is subject to a degree of interest rate risk on its borrowings. The Group uses financial assets and liabilities, including derivatives, to hedge certain foreign exchange and interest rate risks as set out below.
Foreign exchange risk policyForeign currency transactional and translational risk could result in volatility in reported consolidated earnings and net assets.
In respect of transactional foreign currency risk, the Group maintains a policy that all operating units eliminate exposures on material committed transactions, usually by undertaking forward foreign currency contracts through the Group’s treasury function. In addition, it is Group policy that those companies where a significant concentration of foreign exchange risk has been identified may also apply hedge accounting in accordance with IAS 39. Therefore, some of the Group’s forward foreign currency contracts form part of an effective cash flow hedge. Exchange rate fluctuations in respect of the forward foreign currency contracts which form part of a cash flow hedge will have an impact on shareholders’ equity. Exchange rate fluctuations in respect of the other forward foreign currency contracts will have an impact on profit or loss. It is Group policy not to engage in any speculative transaction of any kind.
In respect of translational risk, the Group has a policy to partially hedge United States Dollar (US$), Australian Dollar (AUD) and South African Rand (ZAR) net assets exposure. This is achieved through designating an element of foreign currency borrowings, forward foreign currency contracts and cross currency swaps as net investment hedges against the Group’s investments. The Group does not hedge the translational exposure arising from profit and loss items.
Liquidity risk policyLiquidity risk could impact negatively on the Group’s reputation, borrowing costs or ultimately its ability to continue as a going concern. Liquidity risk is managed by monitoring forecast and actual cash flows and ensuring that sufficient committed facilities are in place to meet possible downside scenarios. The Group’s objective is to maintain a balance between continuity of funding and flexibility through the use of bank overdrafts, bank loans and fixed rate notes. Further details of the Group’s borrowing facilities are disclosed in note 20.
During the year, the Group obtained public credit ratings from Moody’s (Baa1) and Standard & Poor’s (BBB+) to expand the range of financing options available.
Credit risk policyCredit risk could have a negative impact on reported earnings and cash and consequently the liquidity of the Group.
The Group is exposed to credit risk to the extent of non-payment by either its customers or the counterparties of its financial instruments. The Group’s credit risk is primarily attributable to its trade receivables with risk spread over a large number of countries and customers, with no significant concentration of risk. Where appropriate, the Group endeavours to minimise risk by the use of trade finance instruments such as letters of credit and insurance. Credit worthiness checks are also undertaken with external credit rating agencies before entering into contracts with new customers and credit limits are set as appropriate and adhered to. As shown in note 17, the trade receivables presented in the balance sheet are net of allowance for doubtful debts. An allowance for impairment is made where there is an identifiable loss event which, based on previous experience, is evidence of a reduction in the recoverability of cash flows. The Group’s exposure to the credit risk of financial institutions is limited by the adherence to counterparty limits, and by only trading with counterparties that have an investment grade credit rating or better at contract inception, based upon ratings provided by the major agencies. Exposures to those counterparties are regularly reviewed and, when the market view of a counterparty’s credit quality changes, adjusted as considered appropriate. Accordingly in normal market conditions, the probability of material loss due to non-performance by counterparties is considered to be low.
Interest rate risk policyThe Group’s borrowings are in a combination of fixed and variable rates of interest. Interest rate risk is regularly monitored to ensure that the mix of variable and fixed rate borrowing is appropriate for the Group in the short to medium-term. Details of changes to the Group’s loans and facilities has been included in note 20.
Net investment in foreign operationsAs at 2 January 2015, US Dollar fixed rate notes of US$435.9m (2013: US$1,160.0m) and US Dollar variable rate loans of US$70.0m (2013: US$70.0m), both included in interest-bearing loans and borrowings, cross currency swaps of US$89.4m and AUD151.0m (2013: US$89.4m) and net forward foreign currency liability contracts of US$170.4m and ZAR345.0m (2013: US$170.4m) have been designated as a hedge of the Group’s exposure to translational foreign exchange risk on its net investments in Weir SPM, Weir Warman, Weir Seaboard, Weir Novatech, Weir Mathena, Weir Minerals Australia, Weir Multiflo, Weir Heavy Bay Foundry and Weir Warman Africa. Gains or losses on the retranslation of the borrowings and contingent consideration and the fair value of the cross currency swaps and forward foreign currency contracts are transferred to equity to offset any gains or losses on translation of the net investments in these subsidiaries.

162 The Weir Group PLC Annual Report and Financial Statements 2014
Notes to the Group Financial Statements continued
30. Financial assets & liabilities (continued)Carrying amounts & fair valuesSet out below is a comparison by category of carrying amounts and fair values of the Group’s financial instruments that are reported in the financial statements.
Fair Value measurement using
Carrying amount
2014 £m
Fair value 2014
£m
Level 1 Quoted
prices in active markets
£m
Level 2 Significant observable
inputs £m
Level 3 Significant
unobservable inputs
£m
Financial assets
Derivative financial instruments recognised at fair value through profit or loss 10.0 10.0 – 10.0 –
Derivative financial instruments in designated hedge accounting relationships 4.0 4.0 – 4.0 –
Trade & other receivables excluding statutory assets & prepayments* 607.3 607.3
Cash & short-term deposits* 178.7 178.7
800.0 800.0
Financial liabilities
Derivative financial instruments recognised at fair value through profit or loss 6.1 6.1 – 6.1 –
Derivative financial instruments in designated hedge accounting relationships 8.3 8.3 – 8.3 –
Contingent consideration 34.6 34.6 – – 34.6
Amortised cost
Fixed rate borrowings 808.5 784.9 – 784.9 –
Floating rate borrowings 218.5 218.5 – 218.5 –
Obligations under finance leases 0.3 0.3 – 0.3 –
Bank overdrafts & short-term borrowings* 12.1 12.1
Trade & other payables excluding statutory liabilities & deferred income* 489.1 489.1
1,577.5 1,553.9
Fair Value measurement using
Carrying amount
2013 £m
Fair value 2013
£m
Level 1 Quoted
prices in active markets
£m
Level 2 Significant observable
inputs £m
Level 3 Significant
unobservable inputs
£m
Financial assets
Derivative financial instruments recognised at fair value through profit or loss 10.4 10.4 – 10.4 –
Derivative financial instruments in designated hedge accounting relationships 1.8 1.8 – 1.8 –
Trade & other receivables excluding statutory assets & prepayments* 467.1 467.1
Cash & short-term deposits* 79.1 79.1
558.4 558.4
Financial liabilities
Derivative financial instruments recognised at fair value through profit or loss 9.4 9.4 – 9.4 –
Derivative financial instruments in designated hedge accounting relationships 0.8 0.8 – 0.8 –
Contingent consideration 27.7 27.7 – – 27.7
Amortised cost
Fixed rate borrowings 759.0 716.2 – 716.2 –
Floating rate borrowings 56.1 56.1 – 56.1 –
Obligations under finance leases 0.5 0.5 – 0.5 –
Bank overdrafts & short-term borrowings* 10.5 10.5
Trade & other payables excluding statutory liabilities & deferred income* 395.8 395.8
1,259.8 1,217.0
* The fair value of cash and short-term deposits, trade and other receivables and trade and other payables approximates their carrying amount due to the short-term maturities of these instruments. As such disclosure of the fair value hierarchy for these items is not required.
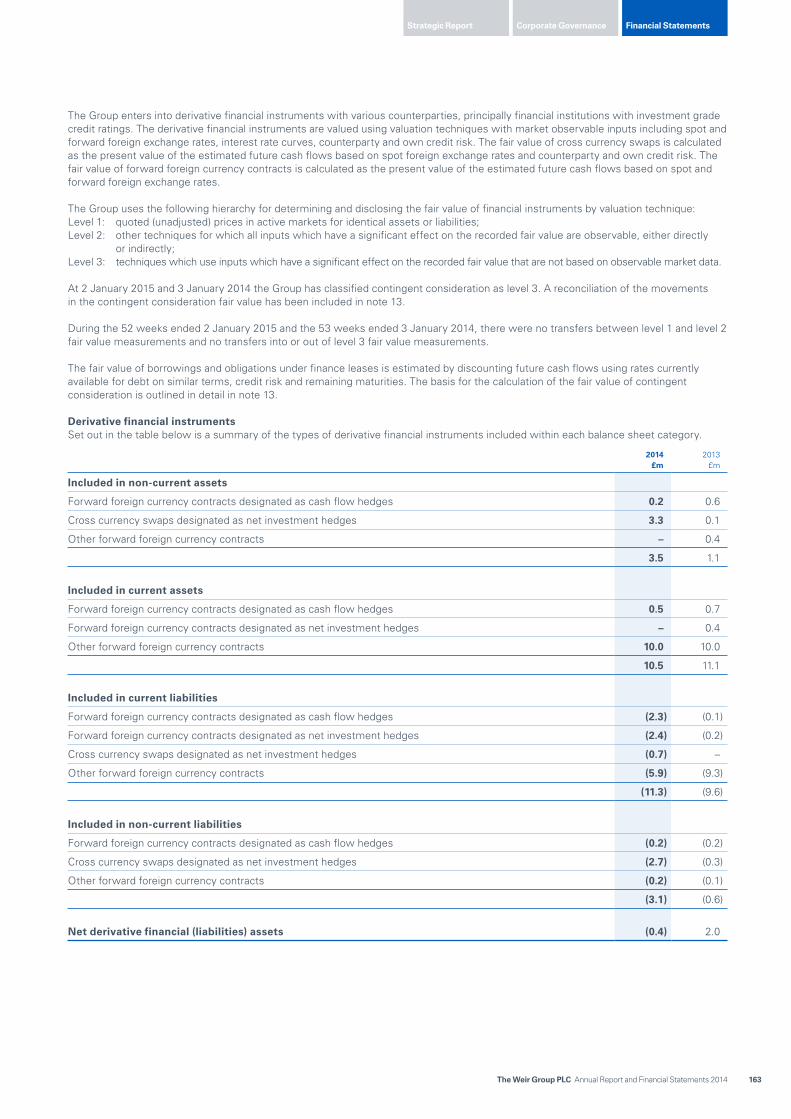
Strategic Report Financial StatementsCorporate Governance
163The Weir Group PLC Annual Report and Financial Statements 2014
The Group enters into derivative financial instruments with various counterparties, principally financial institutions with investment grade credit ratings. The derivative financial instruments are valued using valuation techniques with market observable inputs including spot and forward foreign exchange rates, interest rate curves, counterparty and own credit risk. The fair value of cross currency swaps is calculated as the present value of the estimated future cash flows based on spot foreign exchange rates and counterparty and own credit risk. The fair value of forward foreign currency contracts is calculated as the present value of the estimated future cash flows based on spot and forward foreign exchange rates.
The Group uses the following hierarchy for determining and disclosing the fair value of financial instruments by valuation technique:Level 1: quoted (unadjusted) prices in active markets for identical assets or liabilities;Level 2: other techniques for which all inputs which have a significant effect on the recorded fair value are observable, either directly
or indirectly;Level 3: techniques which use inputs which have a significant effect on the recorded fair value that are not based on observable market data.
At 2 January 2015 and 3 January 2014 the Group has classified contingent consideration as level 3. A reconciliation of the movements in the contingent consideration fair value has been included in note 13.
During the 52 weeks ended 2 January 2015 and the 53 weeks ended 3 January 2014, there were no transfers between level 1 and level 2 fair value measurements and no transfers into or out of level 3 fair value measurements.
The fair value of borrowings and obligations under finance leases is estimated by discounting future cash flows using rates currently available for debt on similar terms, credit risk and remaining maturities. The basis for the calculation of the fair value of contingent consideration is outlined in detail in note 13.
Derivative financial instrumentsSet out in the table below is a summary of the types of derivative financial instruments included within each balance sheet category.
2014 £m
2013 £m
Included in non-current assets
Forward foreign currency contracts designated as cash flow hedges 0.2 0.6
Cross currency swaps designated as net investment hedges 3.3 0.1
Other forward foreign currency contracts – 0.4
3.5 1.1
Included in current assets
Forward foreign currency contracts designated as cash flow hedges 0.5 0.7
Forward foreign currency contracts designated as net investment hedges – 0.4
Other forward foreign currency contracts 10.0 10.0
10.5 11.1
Included in current liabilities
Forward foreign currency contracts designated as cash flow hedges (2.3) (0.1)
Forward foreign currency contracts designated as net investment hedges (2.4) (0.2)
Cross currency swaps designated as net investment hedges (0.7) –
Other forward foreign currency contracts (5.9) (9.3)
(11.3) (9.6)
Included in non-current liabilities
Forward foreign currency contracts designated as cash flow hedges (0.2) (0.2)
Cross currency swaps designated as net investment hedges (2.7) (0.3)
Other forward foreign currency contracts (0.2) (0.1)
(3.1) (0.6)
Net derivative financial (liabilities) assets (0.4) 2.0

164 The Weir Group PLC Annual Report and Financial Statements 2014
Notes to the Group Financial Statements continued
30. Financial assets & liabilities (continued)Liquidity & credit riskThe maximum exposure to credit risk at the balance sheet date is represented by the carrying value of each financial asset, including derivative financial instruments. The liabilities which could impact liquidity risk are best represented by the carrying value and maturity profile of each financial liability, including derivative financial instruments. The following tables include the undiscounted cash flows of financial assets and liabilities based on the earliest date on which the Group can be required to receive or pay these financial assets or liabilities and include both interest and principal cash flows. In respect of derivative financial instruments the net credit/liquidity risk is best represented by the net inflows (outflows) shown below together with the Group’s headroom under the borrowing facilities as disclosed in note 20.
52 weeks ended 2 January 2015
Less than 1 year
£m1 to 2 years
£m2 to 5 years
£m
More than 5 years
£mTotal
£m
Trade & other receivables excluding statutory assets & prepayments 585.0 4.0 13.1 7.1 609.2
Cash & short-term deposits 178.7 – – – 178.7
Cash flows relating to non-derivative financial assets 763.7 4.0 13.1 7.1 787.9
Trade & other payables excluding statutory liabilities & deferred income (498.2) (2.8) (22.7) – (523.7)
Obligations under finance leases (0.1) (0.1) (0.1) – (0.3)
Bank overdrafts & short-term borrowings (12.1) – – – (12.1)
Bank loans (84.5) (2.7) (140.4) – (227.6)
Fixed rate notes (102.8) (32.2) (307.6) (566.2) (1,008.8)
Cash flows relating to non-derivative financial liabilities (697.7) (37.8) (470.8) (566.2) (1,772.5)
Net cash flows relating to non-derivative financial assets (liabilities) 66.0 (33.8) (457.7) (559.1) (984.6)
53 weeks ended 3 January 2014
Less than 1 year
£m1 to 2 years
£m2 to 5 years
£m
More than 5 years
£mTotal
£m
Trade & other receivables excluding statutory assets & prepayments 467.1 – – – 467.1
Cash & short-term deposits 79.1 – – – 79.1
Cash flows relating to non-derivative financial assets 546.2 – – – 546.2
Trade & other payables excluding statutory liabilities & deferred income (401.1) (4.4) – (27.7) (433.2)
Obligations under finance leases (0.2) (0.1) (0.3) – (0.6)
Bank overdrafts & short-term borrowings (10.5) – – – (10.5)
Bank loans (16.7) (1.0) (42.8) – (60.5)
Fixed rate notes (33.1) (97.0) (171.7) (678.0) (979.8)
Cash flows relating to non-derivative financial liabilities (461.6) (102.5) (214.8) (705.7) (1,484.6)
Net cash flows relating to non-derivative financial assets (liabilities) 84.6 (102.5) (214.8) (705.7) (938.4)
52 weeks ended 2 January 2015
Less than 1 year
£m1 to 2 years
£m2 to 5 years
£m
More than 5 years
£mTotal
£m
Cross currency swaps – outflow (20.1) (7.1) (131.3) – (158.5)
Cross currency swaps – inflow 17.8 5.5 131.1 – 154.4
Cross currency swaps – net outflow (2.3) (1.6) (0.2) – (4.1)
Forward foreign currency contracts – outflow (615.7) (18.1) (5.7) – (639.5)
Forward foreign currency contracts – inflow 615.6 17.9 5.7 – 639.2
Forward foreign currency contracts – net outflow (0.1) (0.2) – – (0.3)
Derivative financial instruments – net outflow (635.8) (25.2) (137.0) – (798.0)
Derivative financial instruments – net inflow 633.4 23.4 136.8 – 793.6
Derivative financial instruments – net outflow (2.4) (1.8) (0.2) – (4.4)
Effect of discounting 4.0
Net derivative financial liabilities (0.4)

Strategic Report Financial StatementsCorporate Governance
165The Weir Group PLC Annual Report and Financial Statements 2014
53 weeks ended 3 January 2014
Less than 1 year
£m1 to 2 years
£m2 to 5 years
£m
More than 5 years
£mTotal
£m
Cross currency swaps – outflow (2.8) (14.5) (48.4) – (65.7)
Cross currency swaps – inflow 2.9 14.6 48.8 – 66.3
Cross currency swaps – net inflow 0.1 0.1 0.4 – 0.6
Forward foreign currency contracts – outflow (642.1) (18.4) (16.7) – (677.2)
Forward foreign currency contracts – inflow 644.2 18.9 17.0 – 680.1
Forward foreign currency contracts – net inflow 2.1 0.5 0.3 – 2.9
Derivative financial instruments – outflow (644.9) (32.9) (65.1) – (742.9)
Derivative financial instruments – inflow 647.1 33.5 65.8 – 746.4
Derivative financial instruments – net inflow 2.2 0.6 0.7 – 3.5
Effect of discounting (1.5)
Net derivative financial assets 2.0
Interest rate risk & maturity profileThe following tables set out the carrying amount, by maturity, of the Group’s financial instruments that are exposed to interest rate risk and the Group’s notional value of derivative financial instruments, by maturity, exposed to interest rate risk.
52 weeks ended 2 January 2015
Less than 1 year
£m1 to 2 years
£m2 to 5 years
£m
More than 5 years
£mTotal
£m
Fixed rate debt
Fixed rate notes (70.6) – (225.0) (512.9) (808.5)
Obligations under finance leases (0.1) (0.1) (0.1) – (0.3)
(70.7) (0.1) (225.1) (512.9) (808.8)
Fixed rate derivatives
Notional cross currency swaps US Dollar leg (12.7) – (45.5) – (58.2)
Notional cross currency swaps Australian Dollar leg – – (79.7) – (79.7)
Notional cross currency swaps Sterling leg 12.0 – 126.1 – 138.1
(0.7) – 0.9 – 0.2
Net fixed rate financial instruments (71.4) (0.1) (224.2) (512.9) (808.6)
Floating rate net debt
Cash & short-term deposits 178.7 – – – 178.7
Bank overdrafts & short-term borrowings (12.1) – – – (12.1)
Bank loans (83.3) (1.4) (133.8) – (218.5)
83.3 (1.4) (133.8) – (51.9)
Net floating rate financial instruments 83.3 (1.4) (133.8) – (51.9)
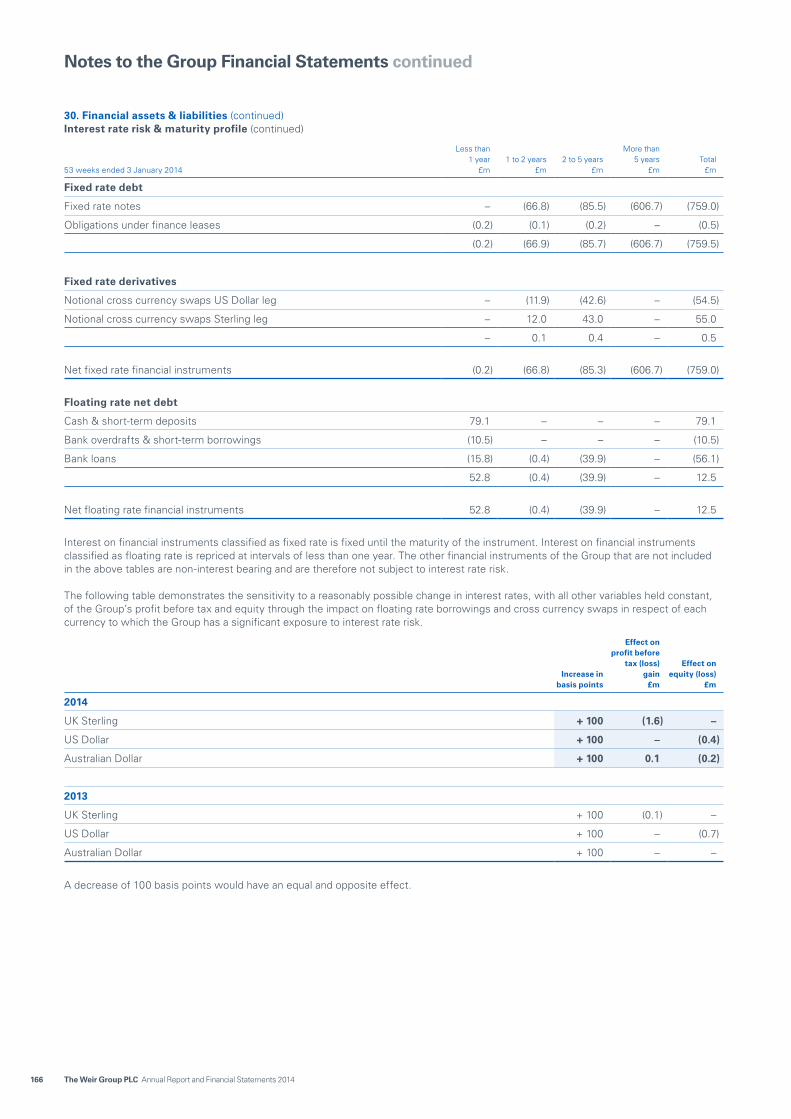
166 The Weir Group PLC Annual Report and Financial Statements 2014
Notes to the Group Financial Statements continued
30. Financial assets & liabilities (continued)Interest rate risk & maturity profile (continued)
53 weeks ended 3 January 2014
Less than 1 year
£m1 to 2 years
£m2 to 5 years
£m
More than 5 years
£mTotal
£m
Fixed rate debt
Fixed rate notes – (66.8) (85.5) (606.7) (759.0)
Obligations under finance leases (0.2) (0.1) (0.2) – (0.5)
(0.2) (66.9) (85.7) (606.7) (759.5)
Fixed rate derivatives
Notional cross currency swaps US Dollar leg – (11.9) (42.6) – (54.5)
Notional cross currency swaps Sterling leg – 12.0 43.0 – 55.0
– 0.1 0.4 – 0.5
Net fixed rate financial instruments (0.2) (66.8) (85.3) (606.7) (759.0)
Floating rate net debt
Cash & short-term deposits 79.1 – – – 79.1
Bank overdrafts & short-term borrowings (10.5) – – – (10.5)
Bank loans (15.8) (0.4) (39.9) – (56.1)
52.8 (0.4) (39.9) – 12.5
Net floating rate financial instruments 52.8 (0.4) (39.9) – 12.5
Interest on financial instruments classified as fixed rate is fixed until the maturity of the instrument. Interest on financial instruments classified as floating rate is repriced at intervals of less than one year. The other financial instruments of the Group that are not included in the above tables are non-interest bearing and are therefore not subject to interest rate risk.
The following table demonstrates the sensitivity to a reasonably possible change in interest rates, with all other variables held constant, of the Group’s profit before tax and equity through the impact on floating rate borrowings and cross currency swaps in respect of each currency to which the Group has a significant exposure to interest rate risk.
Increase in basis points
Effect on profit before
tax (loss) gain
£m
Effect on equity (loss)
£m
2014
UK Sterling + 100 (1.6) –
US Dollar + 100 – (0.4)
Australian Dollar + 100 0.1 (0.2)
2013
UK Sterling + 100 (0.1) –
US Dollar + 100 – (0.7)
Australian Dollar + 100 – –
A decrease of 100 basis points would have an equal and opposite effect.

Strategic Report Financial StatementsCorporate Governance
167The Weir Group PLC Annual Report and Financial Statements 2014
Effect of hedge & derivative financial instruments included in the income statement & equityThe Group uses forward foreign currency contracts to hedge currency risk associated with expected future sales or purchases for which the Group has firm commitments and on its net investments in foreign operations. The terms of the forward foreign currency contracts are negotiated to match the terms of the commitments. During the period six subsidiaries within the Group have applied cash flow hedge accounting to these forward foreign currency transactions. In addition the Group uses forward foreign currency contracts to hedge translation currency risk associated with its net investments in foreign operations. During the period the Group had eight relationships where net investment hedge accounting was applied to these forward foreign currency transactions. All other forward foreign currency contracts, while representing commercial hedges, are not subject to cash flow or net investment hedge accounting with all fair value movements being recognised in the income statement.
The net carrying amount, maturity dates and the amounts recognised for the period in profit or loss and equity for each derivative financial instrument are set out below.
52 weeks ended 2 January 2015
Net carrying amount
£m Maturity dates
Gain (loss) recognised in profit or
loss £m
Loss recognised
in equity £m
Loss recognised
in inventory £m
Forward foreign currency contracts designated as cash flow hedges (1.8) 2014 to 2017 (0.5) (3.2) (0.4)
Forward foreign currency contracts designated as net investment hedges (2.4) 2014 – (6.1) –
Cross currency swaps designated as net investment hedges (0.1) 2014 to 2018 – – –
Other forward foreign currency contracts at fair value through profit or loss 3.9 2014 to 2017 12.6 – –
(0.4) 12.1 (9.3) (0.4)
53 weeks ended 3 January 2014
Net carrying amount
£m Maturity dates
(Loss) gain recognised in profit or
loss £m
Gain recognised
in equity £m
Loss recognised in inventory
£m
Forward foreign currency contracts designated as cash flow hedges 1.0 2014 to 2017 0.3 0.3 (0.5)
Forward foreign currency contracts designated as net investment hedges 0.2 2014 0.3 5.3 –
Cross currency swaps designated as net investment hedges (0.2) 2015 to 2018 (0.1) 0.3 –
Other forward foreign currency contracts at fair value through profit or loss 1.0 2014 to 2017 (10.6) – –
2.0 (10.1) 5.9 (0.5)
The net £nil (2013: £0.2m gain) recognised in profit or loss in respect of cross currency swaps and forward foreign currency contracts designated as net investment hedges reflects the benefit of the US Dollar/Sterling interest rate differential. The Group’s forward foreign currency contracts subject to cash flow hedge accounting which were deemed to be ineffective during the period resulted in a net charge to the income statement of £nil (2013: £nil).
Foreign exchange riskThe Group considers the most significant foreign exchange risk relates to the Australian Dollar, Euro and United States Dollar. The following table demonstrates the sensitivity to a reasonably possible change in these foreign currency exchange rates with all other variables held constant. The sensitivity analysis shows the effect on profit or loss in respect of financial assets and liabilities denominated in foreign currency, including payables, receivables, borrowings and forward foreign currency contracts but excluding all financial assets and liabilities qualified as either cash flow or net investment hedges. The sensitivity analysis also shows the effect on equity in respect of financial assets and liabilities denominated in foreign currency qualifying as either cash flow or net investment hedges including forward foreign currency contracts, borrowings and cross currency swaps. The sensitivity analysis below has been presented to demonstrate the impact of a 25% strengthening of the relevant functional currency against the currencies shown below and therefore give an indication of the transactional foreign exposure that exists at a subsidiary level across the Group.
Increase in currency
rate
Effect on profit gain
(loss) £m
Effect on equity (loss)
£m
2014
Australian Dollar +25% 0.4 15.9
Euro +25% 2.6 0.6
US Dollar +25% (4.5) 99.7
2013
Australian Dollar +25% 0.7 –
Euro +25% 3.3 1.6
US Dollar +25% (3.7) 180.6

168 The Weir Group PLC Annual Report and Financial Statements 2014
Notes to the Group Financial Statements continued
30. Financial assets & liabilities (continued)Foreign exchange risk (continued)As noted above, the Group does not hedge translational exposure arising from profit and loss items. The Group’s operating profit from continuing operations before exceptional items and intangibles amortisation was denominated in the following currencies.
2014 £m
2013 £m
US Dollar 262.3 241.3
Australian Dollar 41.1 46.2
Euro 26.5 44.5
Canadian Dollar 42.3 42.6
United Arab Emirates Dirham 16.6 14.3
Chilean Peso 27.8 33.8
Russian Rouble 10.6 8.3
United Kingdom pound (5.4) 0.2
Other 28.0 35.3
Operating profit from continuing operations before exceptional items & intangibles amortisation 449.8 466.5
31. Capital managementThe primary objective of the Group’s capital management is to ensure that it maintains robust capital ratios in order to support its business and maximise shareholder value.
The Group manages its capital structure and makes adjustments to it in light of changes in economic conditions. To maintain or adjust the capital structure, the Group may adjust the dividend payment to shareholders, return capital to shareholders or issue new shares. The Group monitors capital using the following indicators.
Net debt to EBITDA coverNet debt to EBITDA comprises net debt divided by operating profit from continuing operations before exceptional items, depreciation, intangibles amortisation and impairment. The Group considers that the ratio of net debt to EBITDA is the key metric from a capital management perspective and seeks to maintain the ratio below two times.
2014 2013
Net debt (£m) 860.7 747.0
Operating profit (£m) 192.5 490.3
Exceptional items included in operating profit (note 5) (£m) 52.4 (70.5)
Depreciation, intangibles amortisation & impairment (£m) 266.0 105.8
EBITDA (£m) 510.9 525.6
Net debt to EBITDA cover (ratio) 1.7 1.4
Interest coverInterest cover comprises operating profit from continuing operations before exceptional items and intangibles amortisation divided by net finance costs (excluding exceptional items and other finance costs).
2014 2013
Operating profit before exceptional items & intangibles amortisation (£m) 449.8 466.5
Net finance costs (excluding exceptional items and other finance costs) (£m) 38.5 44.9
Interest cover (ratio) 11.7 10.4

Strategic Report Financial StatementsCorporate Governance
169The Weir Group PLC Annual Report and Financial Statements 2014
Gearing ratioGearing comprises net debt divided by total equity. Net debt comprises cash and short-term deposits and interest-bearing loans and borrowings (note 26).
2014 2013
Net debt (£m) 860.7 747.0
Total equity (£m) 1,482.2 1,486.7
Gearing Ratio (%) 58.1 50.2
The Group’s banking arrangements also require the calculation of net debt to EBITDA (not greater than 3.5) and interest cover (not less than 3.5) as part of the bi-annual financial covenant certifications. For the purposes of the covenants required by the Group’s lenders, the net debt is to be converted at the exchange rate used in the preparation of the Group’s income statement and cash flows, ie. average rate. In addition, profits of businesses acquired in the financial year have to be included as if the acquisitions occurred at the start of the financial year. The covenant calculations for the purposes of the Group’s lenders are shown below.
Net debt to EBITDA cover – lender covenants basis
2014 2013
Net debt at average exchange rates (£m) 819.8 775.9
Operating profit* (£m) 204.5 491.4
Exceptional item included in operating profit (note 5) (£m) 52.4 (70.5)
Depreciation, intangibles amortisation & impairment* (£m) 267.2 105.8
EBITDA* (£m) 524.1 526.7
Net debt to EBITDA cover (ratio) 1.6 1.5
Interest cover – lender covenants basis
2014 2013
Operating profit before exceptional items & intangibles amortisation* (£m) 461.9 467.6
Net finance costs (excluding exceptional items and other finance costs) (£m) 38.5 44.9
Interest cover (ratio) 12.0 10.4
* Adjusted for current year acquisitions.
32. Exchange ratesThe principal exchange rates applied in the preparation of these financial statements were as follows.
2014 2013
Average rate (per £)
US Dollar 1.65 1.56
Australian Dollar 1.83 1.61
Euro 1.24 1.18
Canadian Dollar 1.82 1.61
United Arab Emirates Dirham 6.01 5.74
Chilean Peso 940.16 771.29
Russian Rouble 63.32 49.70
Closing rate (per £)
US Dollar 1.54 1.64
Australian Dollar 1.89 1.83
Euro 1.28 1.21
Canadian Dollar 1.80 1.74
United Arab Emirates Dirham 5.64 6.03
Chilean Peso 942.64 869.82
Russian Rouble 90.99 54.53

170 The Weir Group PLC Annual Report and Financial Statements 2014
Company Balance Sheet At 2 January 2015
Notes
2 January 2015
£m
3 January 2014
£m
Non-current assets
Tangible assets 3 0.3 1.8
Intangible assets 4 0.1 3.8
Investments 5 2,689.4 2,239.7
Derivative financial instruments 11 3.7 1.2
Total non-current assets 2,693.5 2,246.5
Current assets
Debtors 6 122.8 95.8
Derivative financial instruments 11 19.2 13.4
Cash at bank & in hand 22.9 12.8
Total current assets 164.9 122.0
Creditors falling due within one year
Creditors 7 983.7 726.5
Derivative financial instruments 11 18.7 16.7
Total current liabilities 1,002.4 743.2
Net current liabilities 837.5 621.2
Total assets less current liabilities 1,856.0 1,625.3
Creditors falling due after more than one year
Loans 8 1,177.6 1,093.6
Derivative financial instruments 11 3.1 1.4
Total creditors falling due after more than one year 1,180.7 1,095.0
Provisions 9 1.1 2.1
Net assets excluding retirement benefits 674.2 528.2
Retirement benefits 10 1.1 1.1
Net assets including retirement benefits 673.1 527.1
Capital & reserves
Share capital 12 26.8 26.7
Share premium 13 38.0 38.0
Treasury shares 13 (5.8) (5.8)
Capital redemption reserve 13 0.5 0.5
Special reserve 13 1.8 1.8
Profit & loss account 13 611.8 465.9
Total equity 673.1 527.1
Approved by the Board of Directors on 25 February 2015.
Keith Cochrane Jon StantonDirector Director

Strategic Report Financial StatementsCorporate Governance
171The Weir Group PLC Annual Report and Financial Statements 2014
Notes to the Company Financial Statements
1. Accounting policiesThe accounting policies which follow have been applied consistently to all periods presented in these financial statements.
Basis of preparation The Company financial statements have been prepared in accordance with United Kingdom accounting standards.
Change of GAAPFor the period ending 1 January 2016, the Company intends to adopt FRS 101 ‘Reduced Disclosure Framework’.
Foreign currency translationThe presentational and functional currency of the Company is Sterling. Transactions denominated in foreign currencies are translated into the Company’s functional currency at the exchange rate ruling on the date of the transaction. Monetary assets and liabilities denominated in foreign currencies are retranslated at the exchange rate ruling on the balance sheet date. Currency translation differences are recognised in the profit and loss account except when hedge accounting is applied.
Tangible assetsTangible assets are stated at cost and the cost is depreciated over the estimated useful life by equal annual instalments at rates of 7.5% for office equipment and 25% for computer equipment.
Intangible assetsIntangible assets are stated at cost and the cost is amortised over the estimated useful life by equal annual instalments at the rate of 25%.
InvestmentsInvestments in subsidiaries are held at historical cost less a provision for impairment.
Deferred taxDeferred tax is recognised in respect of all timing differences that have originated but not reversed at the balance sheet date where transactions or events have occurred at that date that will result in an obligation to pay more, or a right to pay less or to receive more, tax, with the exception that deferred tax assets are recognised only to the extent that the directors consider that it is more likely than not that there will be suitable taxable profits from which the future reversal of the underlying timing differences can be deducted.
Deferred tax is measured on an undiscounted basis at the tax rates that are expected to apply in the periods in which timing differences reverse, based on tax rates and laws enacted or substantively enacted at the balance sheet date.
Post-employment benefitsThe Company and other UK subsidiaries of the Group participate in multi-employer defined benefit pension plans which are set up under separate trusts. These plans are operated on a basis that does not enable individual companies to identify their share of the underlying assets and liabilities and, in accordance with FRS 17, the Company accounts for its contributions to the plans as if they are defined contribution plans.
In addition, the Company has unfunded unapproved pension promises. Contributions are made to the plans on the advice of an independent qualified actuary. Pension plan liabilities are measured using the projected unit method and discounted at the current rate of return on a high quality corporate bond of equivalent term and currency to the liability. Any increase in the present value of the liabilities of the Company’s unfunded unapproved pension promises expected to arise from employee service in the period is charged against operating profit. Actuarial gains and losses are recognised in the statement of total recognised gains and losses.
Contributions to defined contribution pension plans are charged to the profit and loss account when they become payable.
Share-based paymentsEquity settled share-based incentives are provided to employees under the Group’s Long Term Incentive Plan (‘LTIP’) and as a consequence of occasional one-off conditional awards made to senior executives. The last equity settled grant under the Executive Bonus Scheme (‘EBS’) was during 2013, with no award being made in the current year.
The fair value of the LTIP at the date of the grant is calculated using appropriate option pricing models and the cost is recognised on a straight-line basis over the vesting period. Adjustments are made to reflect expected and actual forfeitures during the vesting period due to failure to satisfy service or performance conditions. The changes to the LTIP which took effect in 2014 are summarised in the Directors’ Remuneration Report on page 91.
The previously granted equity settled incentives under the EBS were determined as a percentage of the annual bonus and were matched by the Group with a share award that would vest on the third anniversary of the grant date provided the individual continued to hold the original bonus shares awarded and continued to be employed by the company at the date of vesting. In addition the EBS included a strategic bonus shares element for a limited number of senior employees. The fair value of the matching and strategic elements of the EBS was determined at the date of grant of the bonus and the cost is recognised on a straight-line basis over the vesting period. The Group recognises a compensation cost in respect of this plan that is based on the fair value of the awards granted. The fair value was determined at the date of grant and is not subsequently re-measured unless the conditions on which the award was granted are modified.

172 The Weir Group PLC Annual Report and Financial Statements 2014
Notes to the Company Financial Statements continued
1. Accounting policies (continued)Financial assets & liabilitiesThe Company’s principal financial assets and liabilities, other than derivatives, comprise bank overdrafts, short-term borrowings, loans and fixed rate notes, cash and short-term deposits.
A financial asset is generally derecognised when the contract that gives rise to it is settled, sold, cancelled or expires.
A financial liability is derecognised when the obligation under the liability is discharged or cancelled or expires. Where an existing financial liability is replaced by another from the same lender on substantially different terms, or the terms of an existing liability are substantially modified, such an exchange or modification is treated as a de-recognition of the original liability and the recognition of a new liability, such that the difference in the respective carrying amounts together with any costs or fees incurred are recognised in profit or loss.
Derivative financial instrumentsThe Company uses derivative financial instruments, principally forward foreign currency contracts, to reduce its exposure to exchange rate movements. The Company does not hold or issue derivatives for speculative or trading purposes.
Derivative financial instruments are recognised as assets and liabilities measured at their fair values at the balance sheet date. The fair value of forward foreign currency contracts is calculated as the present value of the estimated future cash flows based on spot and forward foreign exchange rates. The fair value of interest rate swaps and cross currency swaps is calculated as the present value of the estimated future cash flows based on interest rate curves and spot foreign exchange rates. Changes in their fair values have been recognised in the profit and loss account, except where hedge accounting is used, provided the conditions specified by FRS 26 are met. Hedge accounting is applied in respect of hedge relationships where it is both permissible under FRS 26 and practical to do so. When hedge accounting is used, the relevant hedging relationships will be classified as a cash flow hedge or fair value hedge.
To the extent that the hedge is effective, changes in the fair value of the hedging instrument will be recognised directly in equity rather than in the profit and loss account. When the hedged item is recognised in the financial statements, the accumulated gains and losses recognised in equity will be either recycled to the profit and loss account or, if the hedged item results in a non-financial asset, will be recognised as adjustments to its initial carrying amount.
Hedge accounting is discontinued when the hedging instrument expires or is sold, terminated or exercised, or no longer qualifies for hedge accounting. At that point in time, any cumulative gain or loss on the hedging instrument recognised in equity is kept in equity until the forecasted transaction occurs. If a hedged transaction is no longer expected to occur, the net cumulative gain or loss recognised in equity is transferred to net profit or loss for the period.
The Company has taken advantage of the exemption in FRS 29 and has not disclosed information required by that standard in relation to derivative financial instruments as the Group’s consolidated financial statements, in which the Company is included, provide equivalent disclosures for the Group under IFRS 7.
Treasury sharesThe Weir Group PLC shares held by the Company are classified in shareholders’ equity as treasury shares and are recognised at cost. Consideration received for the sale of such shares is also recognised in equity, with any difference between the proceeds from sale and the original cost being taken directly to revenue reserves. No gain or loss is recognised in the performance statements on the purchase, sale, issue or cancellation of equity shares.
2. Profit attributable to the CompanyThe profit dealt with in the accounts of the Company was £243.5m (2013: £24.3m). In accordance with the concession granted under section 408 of the Companies Act 2006, the profit and loss account of the Company has not been separately presented in these financial statements.
Dividends paid & proposed 2014
£m2013
£m
Declared & paid during the period
Equity dividends on ordinary shares
Final dividend for 2013: 33.2p (2012: 30.0p) 70.7 63.8
Interim dividend for 2014: 15.0p (2013: 8.8p) 32.0 18.8
102.7 82.6
Proposed for approval by shareholders at the annual general meeting
Final dividend for 2014: 29.0p (2013: 33.2p) 61.9 70.8
The proposed dividend is based on the number of shares in issue, excluding treasury shares held, at the date the financial statements were approved and authorised for issue. The final dividend may differ due to increases or decreases in the number of shares in issue between the date of approval of the report and financial statements and the record date for the final dividend.
DirectorsDetails of directors remuneration, benefits and LTIP awards are included in the Remuneration report on pages 91 to 108, and in note 29 to the Group financial statements.

Strategic Report Financial StatementsCorporate Governance
173The Weir Group PLC Annual Report and Financial Statements 2014
Auditors remunerationThe total fees payable by the Company to Ernst & Young LLP (EY) for work performed in respect of the audit of the Company were £15,000 (2013: £14,000). Fees paid to EY for non-audit services to the Company itself are not disclosed in these accounts as the Group’s consolidated financial statements, in which the Company is included, are required to disclose such fees on a consolidated basis.
3. Tangible assets
Office & computer
equipment £m
Cost
At 3 January 2014 2.7
Additions 0.1
Group transfers (1.4)
At 2 January 2015 1.4
Aggregate depreciation
At 3 January 2014 0.9
Charge for year 0.4
Group transfers (0.2)
At 2 January 2015 1.1
Net book value at 3 January 2014 1.8
Net book value at 2 January 2015 0.3
4. Intangible assets
Purchased Software
£m
Development Costs
£mTotal
£m
Cost
At 3 January 2014 3.7 1.0 4.7
Additions 2.5 – 2.5
Group transfers (5.4) (1.0) (6.4)
At 2 January 2015 0.8 – 0.8
Aggregate amortisation
At 3 January 2014 0.9 – 0.9
Group transfers (0.2) – (0.2)
At 2 January 2015 0.7 – 0.7
Net book value at 3 January 2014 2.8 1.0 3.8
Net book value at 2 January 2015 0.1 – 0.1

174 The Weir Group PLC Annual Report and Financial Statements 2014
Notes to the Company Financial Statements continued
5. Fixed asset investments
Subsidiaries Shares
£mLoans
£mTotal
£m
Cost
At 3 January 2014 772.9 1,472.4 2,245.3
Additions 294.1 155.6 449.7
At 2 January 2015 1,067.0 1,628.0 2,695.0
Impairment
At 2 January 2015 and at 3 January 2014 0.2 5.4 5.6
Net book value at 3 January 2014 772.7 1,467.0 2,239.7
Net book value at 2 January 2015 1,066.8 1,622.6 2,689.4
The principal subsidiaries and joint ventures of the Company are listed on page 183.
6. Debtors
2014 £m
2013 £m
Amounts recoverable within one year
Amounts owed by subsidiaries 116.7 91.2
Deferred tax recoverable (note 14) 1.9 1.5
Other debtors 3.6 2.4
Prepayments & accrued income 0.6 0.7
122.8 95.8
7. Creditors
2014 £m
2013 £m
Bank overdrafts & short-term borrowings 288.0 144.0
Loans from subsidiaries 609.7 509.3
Amounts owed to subsidiaries 53.2 49.6
Tax payable 5.5 0.9
Other taxes & social security costs 1.4 1.4
Other creditors 3.2 4.6
Accruals & deferred income 22.7 16.7
983.7 726.5

Strategic Report Financial StatementsCorporate Governance
175The Weir Group PLC Annual Report and Financial Statements 2014
8. Loans
2014 £m
2013 £m
Amounts due are repayable as follows
Less than one year
– bank loans 83.3 15.8
– fixed rate notes 70.6 –
– loans from subsidiaries 609.6 509.3
More than one year but not more than two years
– bank loans – 0.4
– fixed rate notes – 66.9
– loans from subsidiaries 20.1 15.1
More than two years but not more than five years
– bank loans 135.2 39.9
– fixed rate notes 224.3 85.7
– loans from subsidiaries 284.4 279.2
More than five years
– fixed rate notes 513.6 606.4
1,941.1 1,618.7
Less current instalments due on
– bank loans (83.3) (15.8)
– fixed rate notes (70.6) –
– loans from subsidiaries (609.6) (509.3)
1,177.6 1,093.6
The loans from subsidiaries with a maturity date greater than two years and less than five years are repayable in 2019 and have an interest rate of 6.23%. These loans are not secured.
Details of the interest and repayment terms of the bank loans and fixed rate notes can be found in note 20 to the Group financial statements.
9. Provisions
Subsidiaries Shares
£m
Discontinued operations warranty & indemnity
£mTotal
£m
At 3 January 2014 1.1 1.0 2.1
Released – unutilised – (1.0) (1.0)
At 2 January 2015 1.1 – 1.1
SubsidiariesAs at 2 January 2015, a provision of £1.1m (2013: £1.1m) has been made against the deficiency of underlying net assets in certain subsidiaries.
Discontinued operations warranty & indemnityThe discontinued operations warranty and indemnity provision was released in full in June 2014, on expiration of the related tax warranty periods.

176 The Weir Group PLC Annual Report and Financial Statements 2014
Notes to the Company Financial Statements continued
10. Retirement benefitsThe net pension liability in respect of the Company unapproved plan is reflected on the Company’s balance sheet. The liabilities of the Company unapproved plan are shown below.
2014 £m
2013 £m
Present value of plan liabilities (1.4) (1.4)
Related deferred tax asset (note 14) 0.3 0.3
Net pension liability (1.1) (1.1)
2014 £m
2013 £m
Recognised in the profit & loss account
Interest cost on plan liabilities 0.1 0.1
Other finance costs 0.1 0.1
The major assumptions used by the actuary for the Company unapproved plan were as follows.
2014 %
2013 %
Rate of increase in pensions in payment 2.9 3.3
Discount rate 3.5 4.4
Inflation assumption 3.0 3.4
The mortality assumptions used as follows.
2014 Years
2013 Years
Post-retirement mortality
Current pensioners at 65 – male 22.1 22.0
Current pensioners at 65 – female 24.6 24.5
Future pensioners at 65 – male 23.9 23.8
Future pensioners at 65 – female 26.5 26.5
The post-retirement mortality assumptions allow for expected increases in longevity. The ‘current’ disclosures above relate to assumptions based on longevity (in years) following retirement at the balance sheet date, with ‘future’ being that relating to an employee retiring in 2035 (in 20 years time).
Changes in the present value of the defined benefit obligations are analysed as follows.
2014 £m
2013 £m
Opening defined benefit obligations 1.4 1.4
Interest cost 0.1 0.1
Employer contributions 0.1 –
Benefits paid (0.1) (0.1)
Actuarial losses (0.1) –
Closing defined benefit obligations 1.4 1.4
Changes in the fair value of plan assets are analysed as follows.
2014 £m
2013 £m
Opening plan assets – –
Employer contributions 0.1 0.1
Benefits paid (0.1) (0.1)
Closing plan assets – –

Strategic Report Financial StatementsCorporate Governance
177The Weir Group PLC Annual Report and Financial Statements 2014
History of experience gains and losses
2014 £m
2013 £m
2012 £m
2011 £m
2010 £m
Present value of defined benefit obligation (1.4) (1.4) (1.4) (1.4) (1.3)
Deficit in the plans (1.4) (1.4) (1.4) (1.4) (1.3)
Changes in assumptions underlying plan liabilities (0.1) – – (0.1) (0.2)
In addition, the Company also participates in the defined benefit plan arrangements within The Weir Group Pension & Retirement Savings Scheme (Main Plan) and The Weir Group 1972 Pensions and Life Assurance Plan for Senior Executives (Executive Plan). These defined benefit plans are funded multi-employer plans which are operated by The Weir Group PLC and which are run on a basis that does not enable individual companies to identify their share of the underlying assets and liabilities. In accordance with FRS 17, the Company accounts for its contributions to these plans as if they were defined contribution plans. While assets and liabilities in respect of these plans are not reflected on the Company’s balance sheet, details of these are set out below.
Pension contributions are determined with the advice of independent qualified actuaries on the basis of regular valuations using the projected unit method. The Group made special contributions of £10.6m in 2014 (2013: £12.1m) in addition to the Group’s regular contributions.
The most recent actuarial funding valuation of the Main Plan was as at 31 December 2011, when the funding shortfall was £81.4m. The deficit recovery plan agreed with the Trustees at that time was for the Company to make recovery contributions of £8.0m per annum up to 2020, subject to reassessment at future triennial valuations. The next funding valuation of the Main Plan, as at 31 December 2014, is currently on-going.
The Executive Plan actuarial valuation at 31 December 2013 included a funding shortfall of £10.6m with agreed recovery contributions of £2.4m per annum to 31 December 2017, also subject to reassessment at future triennial valuations.
Plan assets are stated at their market values at the respective balance sheet dates and overall expected rates of return are established by applying published brokers forecasts to each category of plan assets and allowing for plan expenses. The actual return on plan assets in the year was a gain of £83.2m (2013: £46.7m).
The assets and liabilities of the plans and the long-term expected rates of return are as follows.
2014 %
2014 £m
2013 %
2013 £m
Equities 6.2 200.0 7.4 185.2
Bonds 2.8 156.9 3.9 124.6
Insurance policy 3.5 357.7 4.4 346.2
Other 0.9 11.7 1.3 8.1
Fair value of plan assets 726.3 664.1
Present value of plan liabilities (805.0) (723.6)
Net deficit in the plans (78.7) (59.5)
Amount not recognised due to asset limit (4.1) –
Net liability (82.8) (59.5)

178 The Weir Group PLC Annual Report and Financial Statements 2014
Notes to the Company Financial Statements continued
10. Retirement benefits (continued)History of experience gains and losses (continued)
2014 £m
2013 £m
Recognised in the profit & loss account
Current service cost 2.0 2.1
Past service curtailment gain – (2.7)
2.0 (0.6)
Expected return on plan assets (33.9) (29.6)
Restriction to expected return on assets (asset limit) 0.5 –
Interest cost on plan liabilities 31.1 29.8
Other finance costs (2.3) 0.2
Taken to the statement of total recognised gains & losses
Actual return on plan assets 83.2 46.7
Less: expected return on plan assets (33.9) (29.6)
49.3 17.1
Other actuarial losses (81.6) (16.6)
Total actuarial (losses) gain on the net deficit (32.3) 0.5
Adjustment to statement of total recognised gains & losses (asset limit) (3.6) –
Actuarial (losses) gains recognised in the statement of total recognised gains & losses (35.9) 0.5
The curtailment gain of £2.7m in the 53 weeks ended 3 January 2014 arose as a result of a decision taken, following consultation, to close the Main Plan to the future accrual benefits with effect from 30 June 2015. This decision was announced to members in August 2013, at which point the curtailment gain was recognised under FRS 17.
The major assumptions used by the actuary were as follows.
2014 %
2013 %
Rate of increase in salaries 3.0 3.3
Rate of increase in pensions in payment
Pre 6 April 2006 service 2.9 3.3
Post 6 April 2006 service 2.0 2.2
Discount rate 3.5 4.4
Inflation assumption 3.0 3.4
Consumer Prices Inflation assumption 2.0 2.4
The mortality assumptions used were as follows.
2014 Years
2013 Years
Post-retirement mortality
Current pensioners at 65 – male 22.1 22.0
Current pensioners at 65 – female 24.6 24.5
Future pensioners at 65 – male 23.9 23.8
Future pensioners at 65 – female 26.5 26.5
The post-retirement mortality assumptions allow for expected increases in longevity. The ‘current’ disclosures above relate to assumptions based on longevity (in years) following retirement at the balance sheet date, with ‘future’ being that relating to an employee retiring in 2035 (in 20 years time).

Strategic Report Financial StatementsCorporate Governance
179The Weir Group PLC Annual Report and Financial Statements 2014
Changes in the present value of the defined benefit obligations are analysed as follows.
2014 £m
2013 £m
Opening defined benefit obligations 723.6 708.5
Current service cost 2.0 2.1
Past service curtailment gain – (2.7)
Interest cost 31.1 29.8
Benefits paid (33.3) (30.7)
Actuarial losses 81.6 16.6
Closing defined benefit obligations 805.0 723.6
Changes in fair value of plan assets are analysed as follows.
2014 £m
2013 £m
Opening plan assets 664.1 634.0
Expected return on plan assets 33.9 29.6
Employer contributions 12.3 14.1
Benefits paid (33.3) (30.7)
Actuarial gains 49.3 17.1
Closing plan assets 726.3 664.1
History of experience gains and losses
2014 £m
2013 £m
2012 £m
2011 £m
2010 £m
Fair value of plan assets 726.3 664.1 634.0 591.7 580.6
Present value of defined benefit obligations (805.0) (723.6) (708.5) (660.9) (632.6)
Deficit in the plans (78.7) (59.5) (74.5) (69.2) (52.0)
Experience adjustments arising on plan obligations (1.2) – 14.5 0.9 (2.8)
Changes in assumptions underlying plan obligations (80.4) (16.6) (59.8) (42.5) (22.3)
Experience adjustments arising on plan assets 49.3 17.1 33.1 (0.5) 24.0
The cumulative amount of actuarial losses recognised in the statement of recognised gains and losses is £300.5m (2013: £264.6m).

180 The Weir Group PLC Annual Report and Financial Statements 2014
Notes to the Company Financial Statements continued
11. Derivative financial instruments
2014 £m
2013 £m
Non-current assets
Cross currency swaps 3.3 0.1
Forward foreign currency contracts 0.4 1.1
3.7 1.2
Current assets
Forward foreign currency contracts 19.2 13.4
19.2 13.4
Creditors falling due within one year
Cross currency swaps 0.7 –
Forward foreign currency contracts 18.0 16.7
18.7 16.7
Creditors falling due after more than one year
Cross currency swaps 2.7 1.1
Forward foreign currency contracts 0.4 0.3
3.1 1.4
The figures in the above table are inclusive of derivative financial instruments where the counterparty is a subsidiary of The Weir Group PLC.
12. Share capital
2014 £m
2013 £m
Allotted, called up & fully paid
Ordinary shares of 12.5p each 26.8 26.7
2014 Number
Million
2013 Number
Million
Shares allotted
Issued during the period in respect of LTIP awards 0.2 0.3
Treasury shares
At the beginning of the period 0.7 1.1
Issued during the period in respect of LTIP awards – (0.4)
At the end of the period 0.7 0.7
Equity settled share-based payments
LTIP awards outstanding at the end of the period 1.5 1.5
Further details of the equity settled share-based payments and the associated cost for the period can be found in note 28 to the Group financial statements.

Strategic Report Financial StatementsCorporate Governance
181The Weir Group PLC Annual Report and Financial Statements 2014
13. Reserves
Share Premium
£m
Treasury Shares
£m
Capital Redemption
Reserve £m
Special Reserve
£m
Profit & Loss
Account £m
At 28 December 2012 38.0 (5.6) 0.5 1.8 515.9
Profit for the period – – – – 24.3
Dividends – – – – (82.6)
Cost of share-based payment inclusive of tax credits – – – – 9.5
Purchase of shares – (1.4) – – –
Exercise of LTIP awards – 1.2 – – (1.2)
At 3 January 2014 38.0 (5.8) 0.5 1.8 465.9
Profit for the period – – – – 243.5
Dividends – – – – (102.7)
Cost of share-based payment inclusive of tax credits – – – – 5.2
Exercise of LTIP awards – – – – (0.1)
At 2 January 2015 38.0 (5.8) 0.5 1.8 611.8
14. Deferred tax asset
£m
At 3 January 2014 1.8
Included in profit for the period (0.5)
Credit for the period included in equity 0.9
At 2 January 2015 2.2
2014 £m
2013 £m
Included in debtors (note 6) 1.9 1.5
Included in retirement benefits (note 10) 0.3 0.3
2.2 1.8
Other timing differences 1.9 1.5
Retirement benefits 0.3 0.3
2.2 1.8
15. Contingent liabilities & legal claimsGuaranteesThe Company has given guarantees in relation to the bank and other borrowings of certain subsidiary companies. The net funds of the companies party to these facilities as at 2 January 2015 amounted to £203.0m (2013: £134.1m).
Legal claimsThe company and certain subsidiaries are, from time to time, parties to legal proceedings and claims which arise in the normal course of business.
A claim has been made by Philippines Gold Processing & Refining Corporation against Weir Services Australia Pty Limited (WSA), a subsidiary of the Company, in arbitration proceedings in respect of two contracts relating to the refurbishment and installation of a mill undertaken by WSA in 2007-2008 and 2008-2009, respectively. The amount claimed, which totals approximately £58m plus interest, seeks damages for the cost of repair and subsequent replacement of the mill together with business interruption loss at the processing plant. The original value of the contracts was around £1m. WSA is contesting the claim on multiple grounds. The claim is being vigorously defended although the outcome remains uncertain. The arbitration process is expected to conclude by the end of 2015.
The Directors are of the view that the outcome of legal proceedings in 2014 in relation to the UN Oil for Food programme are such that a contingent liability no longer exists in relation to this matter.
To the extent not already provided for, the Directors do not anticipate that the outcome of these proceedings and claims, either individually or in aggregate, will have a material adverse effect upon the Group’s financial position.

182 The Weir Group PLC Annual Report and Financial Statements 2014
16. Related party disclosuresThe Company has taken advantage of the exemption in FRS 8 from disclosing transactions with related parties that are wholly owned by a subsidiary of The Weir Group PLC. The following table provides the total amount of transactions which have been entered into with non-wholly owned related parties for the relevant financial year and outstanding balances at the period end.
Related party
Management charge
£m
Amounts due by
£m
Weir Minerals (India) Private Ltd 2014 – –
2013 0.2 0.3
Ynfiniti Engineering Services SL 2014 0.2 0.2
2013 0.3 0.3
Weir International Co. Ltd 2014 0.1 0.1
2013 – –
Vulca SA 2014 0.1 0.1
2013 – –
17. Financial risk management objectives and policiesThe description of the Group’s financial risk management objectives and policies is provided in note 30 to the Group financial statements.
These financial risk management objectives and policies also apply to the Company.
Notes to the Company Financial Statements continued

Strategic Report Financial StatementsCorporate Governance
183The Weir Group PLC Annual Report and Financial Statements 2014
Principal Companies of the Group
The principal subsidiaries and joint ventures of the Group are as follows.
Name
Country of registration or incorporation
% equity interest
2014
Subsidiaries
American Hydro Corporation USA 100
EnviroTech Pumpsystems, Inc. USA 100
Gema Industrigummi AB Sweden 100
Linatex Rubber Products Sdn Bhd Malaysia 100
Mathena Inc. USA 100
Mesa Manufacturing, Inc. USA 100
Seaboard International Inc. USA 100
Shengli Oilfield Weir Highland Pump Company Ltd China 60
SPM Flow Control, Inc. USA 100
SPM Flow Control Ltd Canada 100
Vulco SA Chile 99
Weir Canada Inc. Canada 100
Weir do Brasil Ltda Brazil 100
Weir Engineering Services Ltd Scotland 100
Weir Floway, Inc. USA 100
Weir Gabbioneta SrL Italy 100
Weir India Private Ltd India 100
Weir International Co. Ltd South Korea 60
Weir Minerals Africa (Pty) Ltd South Africa 100
Weir Minerals Australia Ltd Australia 100
Weir Minerals Europe Ltd England 100
Weir Minerals Netherlands BV Netherlands 100
Novatech, LLC USA 100
Weir Power & Industrial France SAS France 100
Weir Slurry Group Inc. USA 100
Weir Solutions FZE Dubai 100
Weir SOS Ltd The Bahamas 100
Weir Valves & Controls UK Ltd* England 100
Weir Valves & Controls USA Inc. USA 100
Weir Valves & Controls (Suzhou) Co. Ltd China 100
Ynfiniti Engineering Services SL Spain 77
Joint ventures
Weir Arabian Metals Company Saudi Arabia 49
Wesco LLC UAE 49
* Companies whose shares are owned directly by The Weir Group PLC.
The Company has taken advantage of the exemption under section 410(2) of the Companies Act 2006 by providing information only in relation to subsidiary undertakings whose results or financial position, in the opinion of the Directors, principally affected the financial statements.
Equivalent information as set out above for all the companies and joint ventures of the Group as at 2 January 2015 is available on the Company’s website at www.weir.co.uk. A complete list of subsidiary and associated undertakings is also attached to the annual return of The Weir Group PLC filed at Companies House, correct as at the date stated.
On 15 October 2014, the Group completed the acquisition of the Trio Engineered Products group, a Chinese-American manufacturer. The contribution to the Group results post-acquisition is not considered to have been significant in the period and therefore the entities acquired have not been included above, although will be considered for inclusion in 2015.

184 The Weir Group PLC Annual Report and Financial Statements 2014
Group productsSome of the key product trade marks owned by the Principal Companies are set out below, most of which are registered in one or more countries:
WARMAN is a trade mark of Weir Minerals Australia Ltd and Weir Group African IP Ltd; ASPIR, CAVEX, HAZLETON and MULTIFLO are trade marks of Weir Minerals Australia Ltd; LEWIS and LEWIS PUMPS are trade marks of Envirotech Pumpsystems Inc.; GEHO is a trade mark of Weir Minerals Netherlands BV; FLOWAY is a trade mark of Weir Floway Inc.; VULCO is a trade mark of Vulco SA; ISOGATE is a trade mark of Weir do Brasil Ltda.; LINATEX is a trade mark of Linatex Ltd; ENDURON is a trade mark of Weir Minerals Europe Ltd; TRIO is a trade mark of Trio China Ltd and Trio Engineered Products, Inc.; KHD is a trade mark used under licence by companies forming part of The Weir Group; SPM and MESA are trade marks of S.P.M. Flow Control, Inc.; SEABOARD is a trade mark of Seaboard International, Inc.; NOVATECH is a trade mark of Novatech, LLC; GABBIONETA is a trade mark of Weir Gabbioneta Srl; BEGEMANN is a trade mark of Weir Minerals Netherlands BV; MATHENA is a trade mark of Mathena, Inc.; ALLEN STEAM TURBINES is a trade mark of Weir Engineering Services Ltd; AMERICAN HYDRO is a trade mark of American Hydro Corporation; ATWOOD & MORRILL and TRICENTRIC are trade marks of Weir Valves & Controls USA, Inc; BDK is a trade mark of Weir India Pvt Ltd; BATLEY, BATLEY VALVE, BLAKEBOROUGH, HOPKINSONS and MAC VALVE are trade marks of Weir Valves and Controls UK Ltd; SARASIN-RSBD and SEBIM are trade marks of Weir Power & Industrial France SAS; ROTO-JET is a trade mark of Envirotech PumpSystems, Inc.; WEMCO is a trade mark used under licence by companies forming part of the Group; WEIR is a trade mark of Weir Engineering Services Ltd.
Principal Companies of the Group continued

Strategic Report Financial StatementsCorporate Governance
185The Weir Group PLC Annual Report and Financial Statements 2014
Shareholder Information
Shareholder enquiriesThe Company’s registrars are:Computershare Investor Services PLCThe PavilionsBridgwater RoadBristol, BS99 6ZZWebsite: www.investorcentre.co.ukTelephone: 0870 707 1402
Shareholder enquiries relating to shareholding, dividend payments, change of address, loss of share certificate, etc. should be addressed to Computershare.
Investor CentreInvestor Centre is a free, secure share management website provided by Computershare. This service allows you to view your share portfolio and see the latest market price of your shares, check your dividend payment and tax information, change your address, update payment instructions and receive your shareholder communications online. To take advantage of this service, please log in at www.investorcentre.co.uk and enter the name of the company in which you hold shares, your Shareholder Reference Number (‘SRN’), your postcode (or country if outside the UK or Channel Islands) and security code (provided on screen). For security purposes, Computershare will send a unique activation code to your registered address. Your SRN can be found on your share certificate or dividend tax voucher.
Dividends2015 final dividendThe directors have recommended a final dividend of 29.0 pence per share, for the 52 weeks ended 2 January 2015. Payment of this dividend is subject to approval at the 2015 Annual General Meeting. Key dates relating to this dividend are given below:
Annual General Meeting 29 April 2015Ex dividend date 30 April 2015Record date 1 May 2015Final day for receipt of DRIP elections 7 May 2015Payment date 29 May 2015
Dividend paymentsYou can choose to receive your dividend in a number of ways. Dividends will automatically be paid to you by cheque and sent to your registered address unless you have chosen one of the options below:
– Direct payment to your bank Cash dividends can be paid directly to a UK bank or building society account. This is more convenient and helps reduce the risk of
cheques becoming lost or delayed in the post. To switch to this method of payment you can apply online at www.investorcentre.co.uk or download a dividend mandate form from the FAQ section of the Company’s website (weir.co.uk), under ‘Shareholder Information’ in the ‘Investor’ section. Alternatively, you can contact Computershare, who will also be able to assist with any questions you may have. A Consolidated Tax Voucher (‘CTV’) detailing all payments made throughout the tax year will then be sent you once a year either electronically or to your registered address. In 2015, the CTV will be dispatched with the November 2015 dividend payment and contain the tax and payment information for dividends paid during the 2015/2016 tax year.
– Dividend Reinvestment Plan (‘DRIP’) The Company offers shareholders the opportunity to join the Computershare regulated DRIP to use their dividend to purchase further
Weir Group shares. Instead of receiving cash, shareholders receive as many whole shares as can be bought with their dividend, taking into account related purchase costs. Any residual cash will be carried forward and added to their next dividend. If you wish to participate in the DRIP, you can apply online at www.investorcentre.co.uk or alternatively, you can complete a DRIP mandate form obtainable from Computershare.
– Global Payment Service If you live overseas, Computershare offers a Global Payment Service which is available in certain countries. This may make it possible
to receive dividends direct into your bank account in your local currency. Please note that a payment charge would be deducted from each individual payment before conversion into your local currency. This service can be set up at www.investorcentre.co.uk or by contacting Computershare.
Capital gains taxFor the purpose of capital gains tax, the market value of an ordinary share of The Weir Group PLC as at 31 March 1982 was 29.75p. This market value has been adjusted to take account of the sub-division of the share capital whereby each ordinary share of 25p was sub-divided into two ordinary shares of 12.5p each on 28 June 1993. Rights issues of ordinary shares took place in April 1987 at 157p per share on the basis of one new ordinary share for every seven ordinary shares held, in July 1990 at 250p per share on the basis of one new ordinary share for every five ordinary shares held and in September 1994 at 252p per share on the basis of one new ordinary share for every four ordinary shares held.

186 The Weir Group PLC Annual Report and Financial Statements 2014
CommunicationsAnnual and Interim ReportsThe Weir Group publishes an Annual and Interim Report every year. The Annual Report is sent to all shareholders who have elected to receive a hard copy through the post as a printed document unless the shareholder has chosen to receive e-communications (see below). The Interim Report is published on the Company’s website and a printed copy is available from the Company Secretary on request.
E-communicationsThe Company offers shareholders the opportunity to access shareholder documents, such as Annual Reports and Notices of the AGM, via e-communications rather than receiving printed documents in the post. To sign up for e-communications, please register at www.investorcentre.co.uk. In order to do this, you will need your SRN which can be found on your share certificate or on your dividend tax voucher. Once registered, you will need to change your mailing preference to e-communications and provide your email address. We will then be able to notify you by email as soon as shareholder documents are available on the Company’s website.
Company websiteShareholders are encouraged to visit the Company’s corporate website (weir.co.uk), which contains a wealth of information about the Weir Group. The website includes information about the markets in which we operate, our strategy and business performance, recent news from the Group and product information. The Investor section is a key source of information for shareholders, containing details on the share price, our financial results, shareholder meetings and dividends, as well as a ‘Frequently asked questions’ section. Current and past Annual and Interim Reports are also available to view and download.
Share dealing servicesComputershare provides Weir Group shareholders with a quick and easy way to buy or sell Weir Group shares on the London Stock Exchange. Internet share dealing commission is 1%, subject to a minimum charge of £30. In addition, stamp duty, currently 0.5%, is payable on purchases. There is no need to open a trading account in order to deal. Real time dealing is available during market hours (08:00 to 16:30 Monday to Friday excluding bank holidays). In addition, there is a convenient facility to place your order outside of market hours. Up to 90 day limit orders are available for sales. To access the service, log on to www-uk.computershare.com/Investor/ShareDealing.asp. Shareholders should have their SRN available. The SRN appears on share certificates and tax dividend vouchers. Please note that, at present, this service is only available to shareholders in certain jurisdictions. Please refer to the Computershare website for an up-to-date list of these countries.
Telephone share dealing commission is 1%, plus £35. In addition, stamp duty, currently 0.5%, is payable on purchases. You can contact Computershare on 0870 703 0084. Shareholders should have their SRN ready when making the call. The SRN appears on share certificates and tax dividend vouchers. Detailed terms and conditions are available on request by telephoning 0870 707 1402. Please note this service is, at present, only available to shareholders resident in certain jurisdictions. Please refer to the Computershare website for an up-to-date list of these countries.
These services are offered on an execution only basis and subject to the applicable terms and conditions. Computershare Investor Services PLC is authorised and regulated by the Financial Conduct Authority.
This is not a recommendation to buy, sell or hold shares in The Weir Group PLC. Shareholders who are unsure of what action to take should obtain independent financial advice. Share values may go down as well as up which may result in a shareholder receiving less than he/she originally invested.
VotingInformation on how you can vote electronically can be obtained through our registrars by visiting www.investorcentre.co.uk/eproxy.
Shareholder alertsUnsolicited investment advice and fraudMany companies have become aware that their shareholders have received unsolicited phone calls or correspondence concerning investment matters. Share scams are often run from ‘boiler rooms’ where fraudsters cold-call investors offering them worthless, overpriced or even non-existent shares.
These callers can be very persistent and extremely persuasive and their activities have resulted in considerable losses for some investors. Whilst usually by telephone, the high-pressure sales tactics can also come by email, post, word of mouth or at a seminar. Shareholders are advised to be very wary of any unsolicited advice, offers to buy shares at a discount, sell your shares at a premium or offers of free company reports.
If you receive any unsolicited investment advice: – Make sure you get the correct name of the person and organisation and take a note of any other details they provide, such as
a telephone number or address. – Check that the caller is properly authorised by the Financial Conduct Authority (‘FCA’) by visiting www.fca.org.uk. – Report any approach from such organisations to the FCA using the share fraud reporting form at www.fca.org.uk/scams,
where you can also find out about the latest investment scams. You can also call the Consumer Helpline on 0800 111 6768. – If calls persist, hang up.
Please note that if you deal with an unauthorised firm, you will not be eligible to receive payment under the Financial Services Compensation Scheme.
Shareholder Information continued

Strategic Report Financial StatementsCorporate Governance
187The Weir Group PLC Annual Report and Financial Statements 2014
Glossary
AGM Annual General Meeting
Appleby EBT EBT Employee benefit trust (Appleby Trust (Jersey) Ltd)
Board The Board of Directors of The Weir Group PLC
bps Basis points
capex Capital expenditure
Company The Weir Group PLC
Director A Director of The Weir Group PLC
EBIT Earnings before interest and tax
EBITA Earnings before interest, tax and amortisation
EBITDA Earnings before interest, tax, depreciation and amortisation
EHS Environment, health and safety
emerging markets Asia-Pacific, South America, Africa and the Middle East
EPS Earnings per share
Excellence Committees Weir Group Management Committees ensuring best practice
free cash flow Net cash flow generated from continuing operations excluding the cash impact in relation to acquisitions, disposals and net proceeds from/repayments of borrowings
Group The Company together with its subsidiaries
HR Human resources
IAS International Accounting Standards
IFRS International Financial Reporting Standards
Independent auditors Ernst & Young LLP
Input Orders received from customers
ISO International Organisation for Standardisation
Kleinwort EBT Employee benefit trust (Kleinwort Benson (Guernsey) Trustees Ltd)
like for like On a consistent basis, excluding the impact of acquisitions
LTIP Long Term Incentive Plan
mill circuit The various stages of extracting and processing ore
NPBTA Normalised profit before tax and amortisation
operating margin Operating profit including our share of results of joint ventures divided by revenue
ordinary shares The ordinary shares in the capital of the Company of 12.5p each
PBTA Profit before tax and amortisation
Registrar Computershare Investor Services plc
R&D Research and development
ROCE Return on capital employed
RPI UK Retail Prices Index
subsidiary An entity that is controlled, either directly or indirectly, by the Company
TIR Total Incident Rate (medical treatment of any kind required by employees divided by 200,000 hours worked)
TSR Total Shareholder Return comprising dividends paid on ordinary shares and the increase or decrease in the market price of ordinary shares
UK GAAP United Kingdom Generally Accepted Accounting Practice
WTI West Texas Intermediate

188 The Weir Group PLC Annual Report and Financial Statements 2014
Financial Calendar
Annual General Meeting29 April 2015
Ex-dividend date for final dividend30 April 2015
Record date for final dividend1 May 2015Shareholders on the register at this date will receive the dividend.
Final day for receipt of DRIP elections7 May 2015
Final dividend paid29 May 2015
Cautionary StatementThis Annual Report contains forward-looking statements with respect to the financial condition, operations and performance of the Group. By their nature, these statements involve uncertainty since future events and circumstances can cause results and developments to differ materially from those anticipated. The forward-looking statements reflect knowledge and information available at the date of preparation of this Annual Report and the Company undertakes no obligation to update these forward-looking statements. Nothing in this Annual Report should be construed as a profit forecast.
Registered Office and Company Number20 Waterloo StreetGlasgow G2 6DBScotlandRegistered in ScotlandCompany Number 2934

Printed on an FSC-recognised paper, produced from well-managed forests. This publication was printed with vegetable oil-based inks by an FSC-recognised printer that holds an ISO 14001 certification.

The Weir G
roup PLC A
nnual Report and Financial S
tatements 2014
The Weir Group PLC20 Waterloo StreetGlasgow G2 6DB, Scotland
T: +44 (0)141 637 7111F: +44 (0)141 221 9789E: [email protected]
weir.co.uk