the taming of the app - seven networks - mobile traffic ... · the taming of the app ......
TRANSCRIPT
© 2013 Senza Fili Consulting • www.senzafiliconsulting.com |1|
The taming of the app Measuring the financial impact of mobile signaling optimization By Monica Paolini, Senza Fili
Sponsored by

White paper The taming of the app
1. Introduction: App-driven signaling traffic. The network burden of chatty apps affects performance and the bottom line
The proliferation of smartphones and apps has intensified pressure on mobile network
resources in multiple ways. The most obvious is skyrocketing mobile data usage due to the
growing popularity of social media and content streaming applications. Another significant,
though less obvious, source of pressure on the network is the background activity generated by
chatty mobile apps. Even when users are not actively using their phones, mobile apps create
background activity that affects network performance.
End users demand – and expect – an always-on mobile experience. To make subscribers feel
they are always connected, mobile apps frequently check for new content and updates. Every
time an app polls its server to check for an update, the device has to set up data access.
Establishing a data connection generates signaling activity that can create performance
bottlenecks, because the network’s ability to process these connection requests is limited. Each
connection also generates a small traffic payload, which in aggregate across users and apps
adds up to a significant contribution to the network load. In many instances, the polling of the
servers returns no change in status, and, hence, the use of network resources does not provide
any perceivable benefit to the user. Nevertheless, mobile operators have to invest in additional
network infrastructure to accommodate both the signaling and incremental bandwidth usage
due to background activity.
Signaling optimization tries to reduce this unnecessary signaling activity without compromising
the end-user experience, leading to a more efficient use of network resources. In turn, this
results in cost savings that can improve profitability for operators.
In this paper, we quantify the financial savings from the Open Channel Signaling Optimization
solution developed by SEVEN Networks, in terms of both fewer signaling events and reduced
bandwidth consumption from background activity. The model uses mobile-operator data
collected by SEVEN Networks on control-plane (i.e., signaling) and data-plane (or user-plane)
traffic to explore the performance implications of reducing the number of signaling-related
connections and data traffic load.
CONTENTS
1. Introduction: App-driven signaling
traffic. The network burden of chatty
apps affects performance and the
bottom line ..................................... 2
2. Control plane and data plane. The
evolution from 3G to 4G .................. 3
3. App-driven signaling traffic.
Identifying and reducing unnecessary
signaling ......................................... 4
4. Quantifying the impact of signaling
on mobile networks. A financial
model of signaling ........................... 6
5. App-driven traffic. Measuring the
impact of background and active app
usage .............................................. 8
6. Financial impact of reducing mobile
app background activity. Signaling
optimization lowers data-plane and
control-plane costs ....................... 10
7. Implications for mobile operators.
Optimizing the behavior of chatty
apps makes financial sense ........... 11
Acronyms .......................................... 12

White paper The taming of the app
© 2013 Senza Fili Consulting • www.senzafiliconsulting.com |3|
2. Control plane and data plane. The evolution from 3G to 4G
Control plane and data plane. There are two types of mobile traffic: the user-generated
traffic in the data plane (or user plane), and the signaling traffic in the control plane used to
manage data traffic and devices (Figure 1). The data plane accounts for most traffic, typically
over 95% of it. Signaling, however, is essential to the functioning of the network. If signaling is
disrupted, data plane traffic will not flow, and service may slow down or stop. While average
signaling traffic is not problematic because of its low volume, peaks in signaling traffic can
cause signaling floods, when one or more elements in the network become congested and
the network can no longer process control-plane – and hence data-plane – traffic. To ensure
network reliability, operators have to plan sufficient network resources to process signaling
traffic.
Limited scalability in 3G. The control plane in 3G1 is optimized for voice and, as a result, the
high number of signaling messages it generates does not scale well for networks with high
traffic loads, making 3G prone to congestion when traffic loads rise. Commonly the bottleneck
in 3G networks is in the RNC, the element in the RAN that collects both the signaling traffic
and the data traffic, and acts as the signaling interface to the core. To increase capacity,
mobile operators have to add RNCs, but this raises RAN costs.
A new approach in LTE. LTE has a more efficient control plane, designed to carry heavy data
traffic loads. While in 3G the RNC processes both user data and signaling, in LTE the control
and data planes are segregated. The MME manages the control plane traffic at the edge of
the core (Figure 2), and it interfaces with both the RAN and other core elements. In the LTE
core, the SS7 signaling protocol used in 2G and 3G is replaced by Diameter, a protocol used in
the interfaces among elements responsible for AAA, policy, charging, and IMS services such as
VoLTE.
1 . In this paper we focus on 3GPP technologies, and use the term 3G to refer to UMTS/HSPA technologies, and 4G to refer to LTE.
Figure 2. Control plane, Diameter and data plane in LTE. Source: Senza Fili
Figure 1. Control and data (user) plane. Source: Senza Fili
White paper The taming of the app
© 2013 Senza Fili Consulting • www.senzafiliconsulting.com |4|
3. App-driven signaling traffic. Identifying and reducing unnecessary signaling
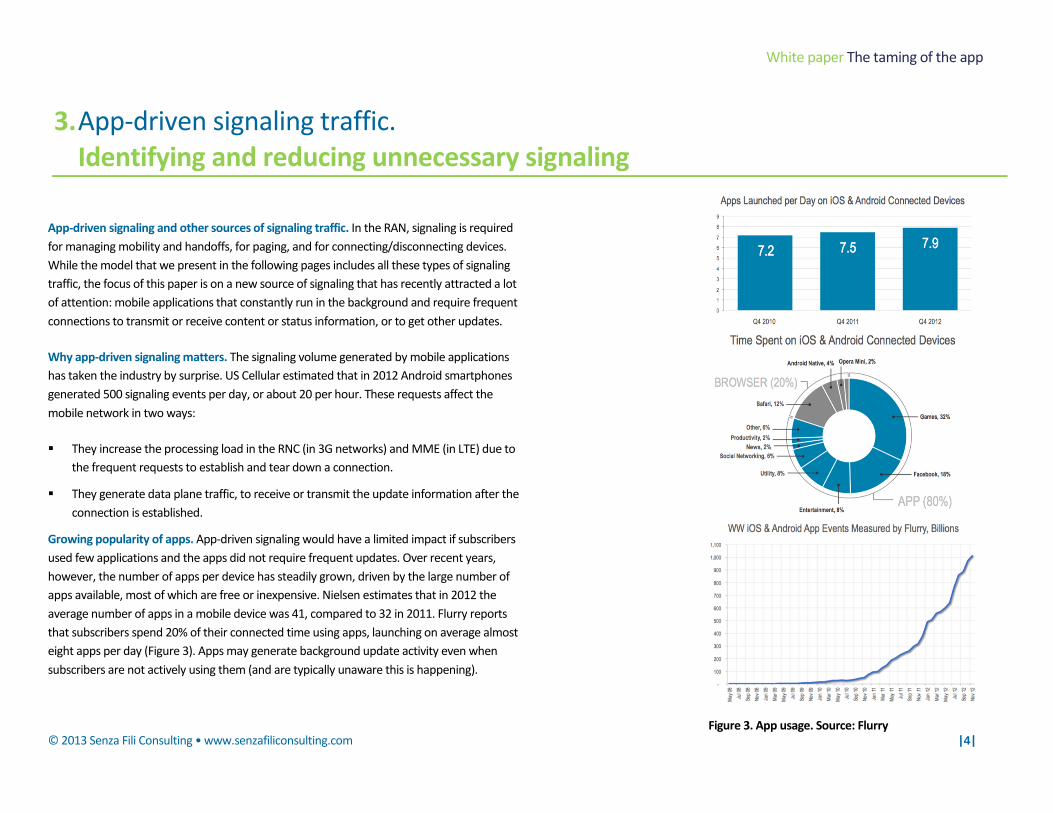
App-driven signaling and other sources of signaling traffic. In the RAN, signaling is required
for managing mobility and handoffs, for paging, and for connecting/disconnecting devices.
While the model that we present in the following pages includes all these types of signaling
traffic, the focus of this paper is on a new source of signaling that has recently attracted a lot
of attention: mobile applications that constantly run in the background and require frequent
connections to transmit or receive content or status information, or to get other updates.
Why app-driven signaling matters. The signaling volume generated by mobile applications
has taken the industry by surprise. US Cellular estimated that in 2012 Android smartphones
generated 500 signaling events per day, or about 20 per hour. These requests affect the
mobile network in two ways:
They increase the processing load in the RNC (in 3G networks) and MME (in LTE) due to
the frequent requests to establish and tear down a connection.
They generate data plane traffic, to receive or transmit the update information after the
connection is established.
Growing popularity of apps. App-driven signaling would have a limited impact if subscribers
used few applications and the apps did not require frequent updates. Over recent years,
however, the number of apps per device has steadily grown, driven by the large number of
apps available, most of which are free or inexpensive. Nielsen estimates that in 2012 the
average number of apps in a mobile device was 41, compared to 32 in 2011. Flurry reports
that subscribers spend 20% of their connected time using apps, launching on average almost
eight apps per day (Figure 3). Apps may generate background update activity even when
subscribers are not actively using them (and are typically unaware this is happening).
Figure 3. App usage. Source: Flurry

White paper The taming of the app
© 2013 Senza Fili Consulting • www.senzafiliconsulting.com |5|
Active use and background activity. Although the app background activity remains largely
invisible to the subscriber, it can be more insidious to the mobile operator than the traffic
generated when the subscriber directly engages with the app, for instance by watching a
video, tweeting, or checking Facebook. This is because the two types of activity have very
different profiles (Figure 4). Active application use generates a relatively high level of data
plane traffic and limited control plane traffic. For instance, watching a video is bandwidth-
intensive, but it requires only minimal signaling to establish and tear down the connection. At
the opposite end, background activity generates less user data but a higher level of signaling
traffic because of the frequent connection requests, which involve complex messaging
between the device and the RNC or MME.
The impact on mobile operators. App-driven background activity increases the capacity
requirements – and hence the costs – in the RAN and in the mobile core for both control and
data planes. At the same time, because this activity happens without the active engagement
or request of the subscriber, it is difficult for the operator to extract revenues from it.
Scope for improvement? Not only is background traffic invisible to subscribers – unless it
depletes their phone batteries – but in most cases it is of no benefit to them. If a subscriber
does not check email for hours, email downloads that arrive every few minutes have no value
– and the subscriber may not even be aware of them. A reduction in the volume of app-driven
background activity, if directed to traffic that does not bring benefits to the subscriber, can
provide relief to the operator while leaving the subscriber experience largely unaffected.
Figure 4. Data-plane and control-plane traffic. Source: Senza Fili Figure 5. Background activity and active use. Source: Senza Fili

White paper The taming of the app
© 2013 Senza Fili Consulting • www.senzafiliconsulting.com |6|
4. Quantifying the impact of signaling on mobile networks. A financial model of signaling
Estimating signaling traffic and costs. To estimate the traffic and cost impact of background
app-driven activity – both in the control plane and in the data plane – and the cost savings
that can be achieved if such activity is reduced, we developed a financial model that has two
main components:
Control-plane module. This component estimates the traffic and processing
requirements, along with the associated costs, for all signaling activity in both the RAN
and core. We benchmarked network signaling activity estimates against vendor and
operator data. SEVEN Networks provided extensive app- and OS-driven signaling-activity
data collected by their analytical tools from commercial networks.
Data-plane module. This component includes only the data traffic generated by
applications and the OS to keep them up to date, and to establish and tear down
connections during active app usage. We calculated this traffic component from the
same app-driven traffic estimates used in the control-plane module and derived from the
data set provided by SEVEN Networks. This module excludes all content-related traffic
generated by the active use of apps, other forms of data access (e.g., browsing) or other
services (e.g., voice calls).
Analysis. While the model can explore a wide range of scenarios by changing the underlying
assumptions, the paper focuses on a base case scenario of a medium-sized operator in a
developed market. We present the results on a per-handset basis, as this metric can be
generalized to any operator. (In contrast, network savings depend on the number of
subscribers, and that varies greatly across operators.) First, we computed the capex and opex
associated with transporting signaling traffic both in the RAN and in the core (but excluding
the costs associated with the adoption of SEVEN Networks solution), to generate a 5-year TCO
analysis. Then, using estimates of traffic reduction from SEVEN Networks, we computed the
cost savings accrued when app-driven signaling is optimized – i.e., kept to a minimum,
without affecting the subscriber experience in a noticeable way.
Control-plane module: data sources
Mobility, device and RAN management signaling. Sources: Senza Fili, operators and vendors
Service control signaling (SS7, Diameter). Sources: Senza Fili, operators and vendors
App- and OS-driven signaling for connection establishment and tear down. Source: Mobile operator data from SEVEN Networks
Data-plane module: data sources
App-driven activity for updates. Source: Mobile operator data from SEVEN Networks
Model analysis
Scenario 1: Base case: estimate of traffic volume and cost for a developed-market operator with a 3G and 4G network.
Scenario 2: SEVEN cost savings: estimate of traffic volume and cost savings for an operator that minimizes app-driven activity using SEVEN Networks solutions. Volume and cost savings data are from SEVEN Networks.
Costs and cost savings results:
- Per handset (presented in this paper) - Per RAT (i.e., 3G and 4G) (available upon request) - Per application type (available upon request) - For the entire network (presented in this paper).
White paper The taming of the app
© 2013 Senza Fili Consulting • www.senzafiliconsulting.com |7|
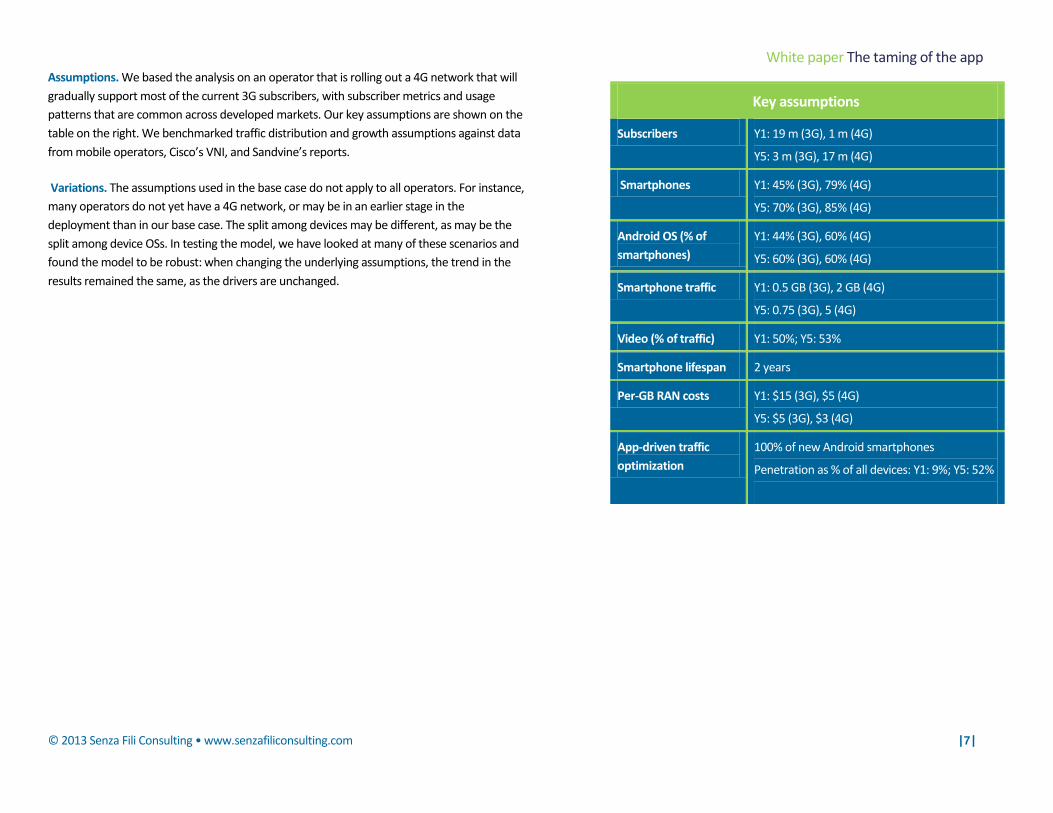
Assumptions. We based the analysis on an operator that is rolling out a 4G network that will
gradually support most of the current 3G subscribers, with subscriber metrics and usage
patterns that are common across developed markets. Our key assumptions are shown on the
table on the right. We benchmarked traffic distribution and growth assumptions against data
from mobile operators, Cisco’s VNI, and Sandvine’s reports.
Variations. The assumptions used in the base case do not apply to all operators. For instance,
many operators do not yet have a 4G network, or may be in an earlier stage in the
deployment than in our base case. The split among devices may be different, as may be the
split among device OSs. In testing the model, we have looked at many of these scenarios and
found the model to be robust: when changing the underlying assumptions, the trend in the
results remained the same, as the drivers are unchanged.
Key assumptions
Subscribers Y1: 19 m (3G), 1 m (4G)
Y5: 3 m (3G), 17 m (4G)
Smartphones Y1: 45% (3G), 79% (4G)
Y5: 70% (3G), 85% (4G)
Android OS (% of
smartphones)
Y1: 44% (3G), 60% (4G)
Y5: 60% (3G), 60% (4G)
Smartphone traffic Y1: 0.5 GB (3G), 2 GB (4G)
Y5: 0.75 (3G), 5 (4G)
Video (% of traffic) Y1: 50%; Y5: 53%
Smartphone lifespan 2 years
Per-GB RAN costs Y1: $15 (3G), $5 (4G)
Y5: $5 (3G), $3 (4G)
App-driven traffic
optimization
100% of new Android smartphones
Penetration as % of all devices: Y1: 9%; Y5: 52%
White paper The taming of the app
© 2013 Senza Fili Consulting • www.senzafiliconsulting.com |8|
5. App-driven traffic. Measuring the impact of background and active app usage
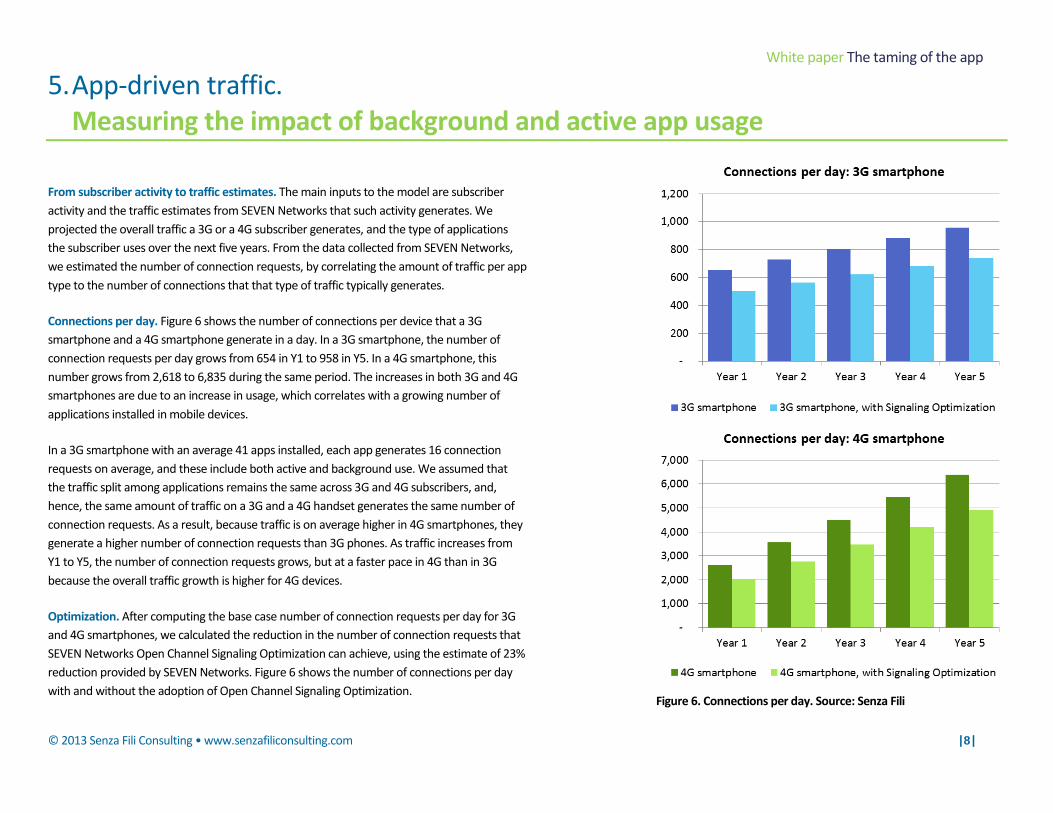
From subscriber activity to traffic estimates. The main inputs to the model are subscriber
activity and the traffic estimates from SEVEN Networks that such activity generates. We
projected the overall traffic a 3G or a 4G subscriber generates, and the type of applications
the subscriber uses over the next five years. From the data collected from SEVEN Networks,
we estimated the number of connection requests, by correlating the amount of traffic per app
type to the number of connections that that type of traffic typically generates.
Connections per day. Figure 6 shows the number of connections per device that a 3G
smartphone and a 4G smartphone generate in a day. In a 3G smartphone, the number of
connection requests per day grows from 654 in Y1 to 958 in Y5. In a 4G smartphone, this
number grows from 2,618 to 6,835 during the same period. The increases in both 3G and 4G
smartphones are due to an increase in usage, which correlates with a growing number of
applications installed in mobile devices.
In a 3G smartphone with an average 41 apps installed, each app generates 16 connection
requests on average, and these include both active and background use. We assumed that
the traffic split among applications remains the same across 3G and 4G subscribers, and,
hence, the same amount of traffic on a 3G and a 4G handset generates the same number of
connection requests. As a result, because traffic is on average higher in 4G smartphones, they
generate a higher number of connection requests than 3G phones. As traffic increases from
Y1 to Y5, the number of connection requests grows, but at a faster pace in 4G than in 3G
because the overall traffic growth is higher for 4G devices.
Optimization. After computing the base case number of connection requests per day for 3G
and 4G smartphones, we calculated the reduction in the number of connection requests that
SEVEN Networks Open Channel Signaling Optimization can achieve, using the estimate of 23%
reduction provided by SEVEN Networks. Figure 6 shows the number of connections per day
with and without the adoption of Open Channel Signaling Optimization. Figure 6. Connections per day. Source: Senza Fili
White paper The taming of the app
© 2013 Senza Fili Consulting • www.senzafiliconsulting.com |9|
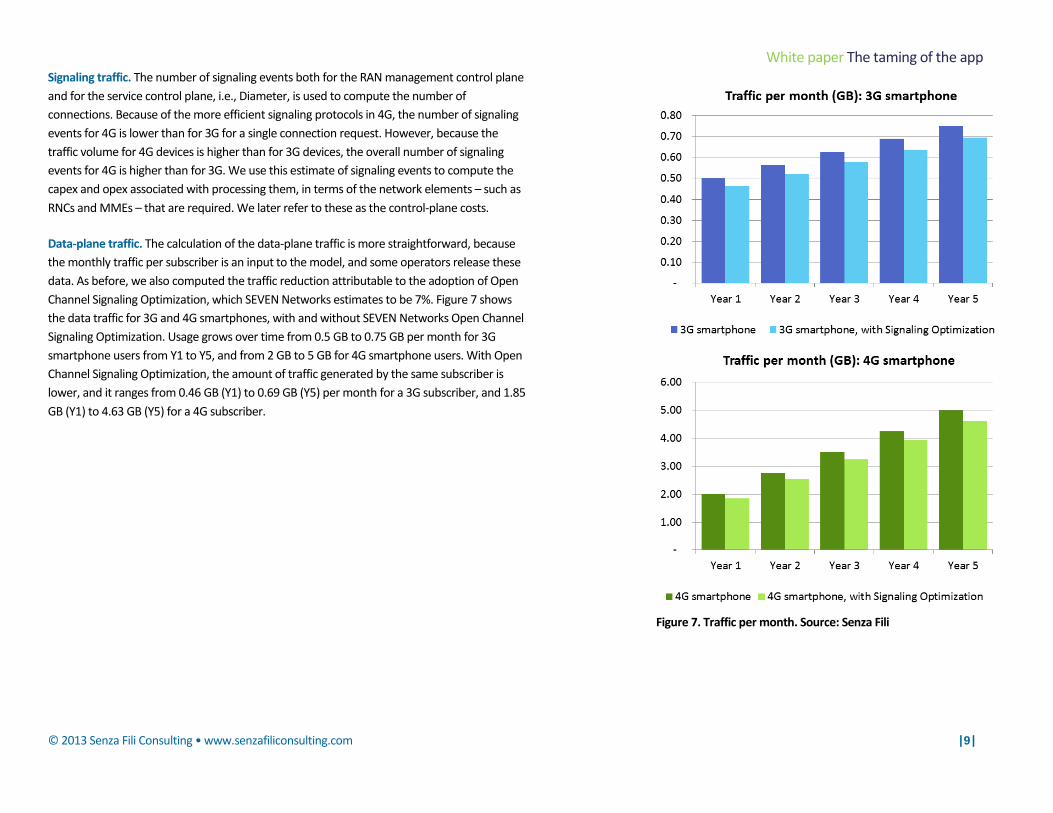
Signaling traffic. The number of signaling events both for the RAN management control plane
and for the service control plane, i.e., Diameter, is used to compute the number of
connections. Because of the more efficient signaling protocols in 4G, the number of signaling
events for 4G is lower than for 3G for a single connection request. However, because the
traffic volume for 4G devices is higher than for 3G devices, the overall number of signaling
events for 4G is higher than for 3G. We use this estimate of signaling events to compute the
capex and opex associated with processing them, in terms of the network elements – such as
RNCs and MMEs – that are required. We later refer to these as the control-plane costs.
Data-plane traffic. The calculation of the data-plane traffic is more straightforward, because
the monthly traffic per subscriber is an input to the model, and some operators release these
data. As before, we also computed the traffic reduction attributable to the adoption of Open
Channel Signaling Optimization, which SEVEN Networks estimates to be 7%. Figure 7 shows
the data traffic for 3G and 4G smartphones, with and without SEVEN Networks Open Channel
Signaling Optimization. Usage grows over time from 0.5 GB to 0.75 GB per month for 3G
smartphone users from Y1 to Y5, and from 2 GB to 5 GB for 4G smartphone users. With Open
Channel Signaling Optimization, the amount of traffic generated by the same subscriber is
lower, and it ranges from 0.46 GB (Y1) to 0.69 GB (Y5) per month for a 3G subscriber, and 1.85
GB (Y1) to 4.63 GB (Y5) for a 4G subscriber.
Figure 7. Traffic per month. Source: Senza Fili

White paper The taming of the app
© 2013 Senza Fili Consulting • www.senzafiliconsulting.com |10|
6. Financial impact of reducing mobile app background activity. Signaling optimization lowers data-plane and control-plane costs
Control plane and data plane savings. A reduction in connection requests from background
activity results in cost savings both in the control plane and in the data plane. The monthly
cost savings per smartphone with SEVEN Networks Open Channel Signaling Optimization rise
from $0.51 to $0.76 from Y1 to Y5 for a 3G smartphone, and from $1.26 to $1.42 for a 4G
smartphone (Figure 8, top). The increase in savings is due to the traffic growth per subscriber.
However, cost savings do not follow linearly 4G traffic growth, because the per-bit costs of
transporting traffic in 4G decrease thanks to a more efficient spectrum utilization. The peak
savings in Y3 for 4G smartphones in Figure 8 (bottom) is due to the interaction between these
two factors.
More cost savings in 4G. Despite the lower costs and higher efficiency of 4G, the reduction in
connection requests has a bigger financial impact in 4G than in 3G smartphones because of
the higher traffic load generated by 4G devices, and hence the higher number of connection
requests. As a result, cost savings for 4G smartphones are almost 2.5 times those for 3G
smartphones in Y1, and almost twice as much in Y5.
Greater cost savings in the data plane. Control-plane cost savings account for 28% to 26% (Y1
to Y5) of total costs savings in 3G smartphones, and for 17% (Y1 and Y5) in 4G smartphones.
Although SEVEN Networks Open Channel Signaling Optimization reduces traffic by a larger
percentage on the control plane than on the data plane, the resulting cost savings are higher
for the data plane, because the transport costs that dominate the data plane are higher than
the processing costs associated with the control plane. (Bandwidth requirements for control-
plane signaling are limited.)
Greater cost savings for 3G handsets for control plane. Control-plane cost savings are larger
for 3G smartphones (28% of total in Y1) than for 4G (17%). This is because each connection
request generates the same amount of data-plane traffic for 3G and 4G devices, but a
substantially higher number of signaling events for a 3G smartphone than a 4G smartphone.
The higher RAN costs to operate a 3G network only partially offset the signaling disparity. Figure 8. Cost savings per month. Source: Senza Fili
White paper The taming of the app
© 2013 Senza Fili Consulting • www.senzafiliconsulting.com |11|
7. Implications for mobile operators. Optimizing the behavior of chatty apps makes financial sense
Increasing app downloads and usage, coupled with higher traffic volumes per subscriber,
are responsible for a growth in background activity in smartphones that is necessary for
updating app-specific content – e.g., email, text messages, status updates, social
networking posts. This background activity gives subscribers a sense that their mobile
devices are always on, even though the updates depend on frequent, short connections
that leave devices offline for most of the time.
These frequent connection requests – whose number grows with the number of
applications in a phone – take place in the background without the active participation of
the subscriber. Because subscribers do not directly initiate this traffic, it is difficult for
operators to monetize it, and yet it contributes to the signaling and data traffic that the
mobile network has to transport. This traffic can be a source of network congestion,
especially at times of peak usage. As a result, background app-driven traffic increases the
operator’s capacity requirements and the network costs.
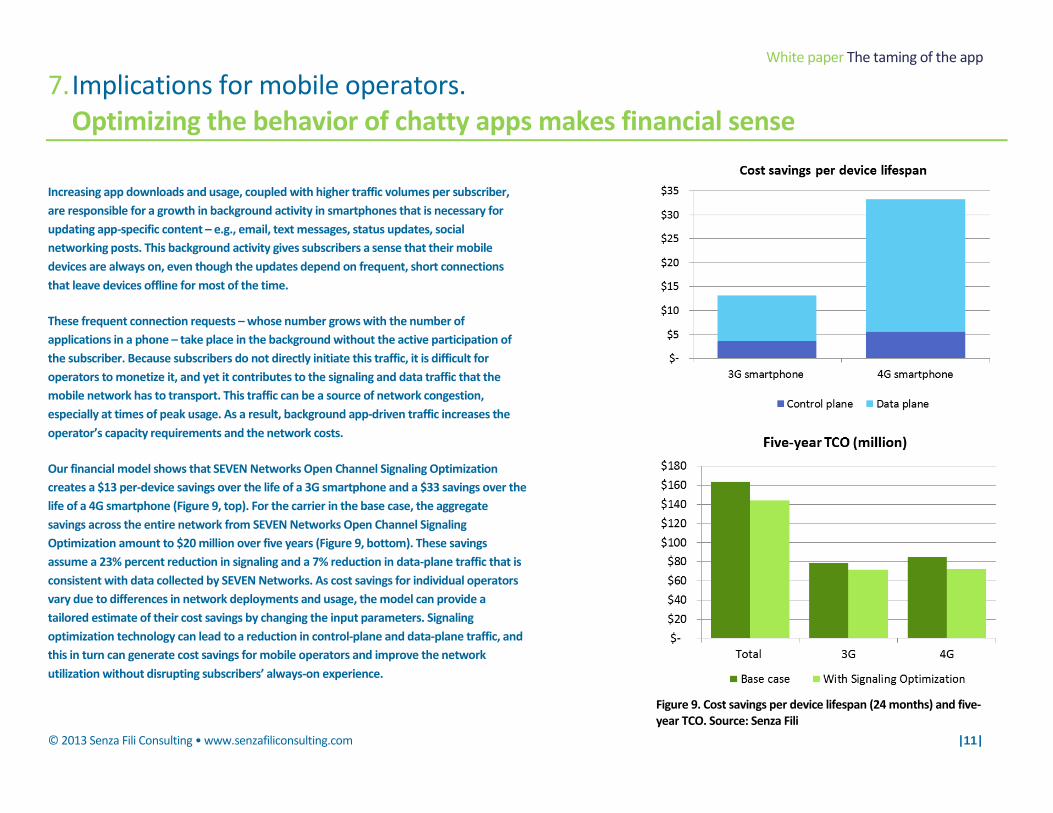
Our financial model shows that SEVEN Networks Open Channel Signaling Optimization
creates a $13 per-device savings over the life of a 3G smartphone and a $33 savings over the
life of a 4G smartphone (Figure 9, top). For the carrier in the base case, the aggregate
savings across the entire network from SEVEN Networks Open Channel Signaling
Optimization amount to $20 million over five years (Figure 9, bottom). These savings
assume a 23% percent reduction in signaling and a 7% reduction in data-plane traffic that is
consistent with data collected by SEVEN Networks. As cost savings for individual operators
vary due to differences in network deployments and usage, the model can provide a
tailored estimate of their cost savings by changing the input parameters. Signaling
optimization technology can lead to a reduction in control-plane and data-plane traffic, and
this in turn can generate cost savings for mobile operators and improve the network
utilization without disrupting subscribers’ always-on experience.
Figure 9. Cost savings per device lifespan (24 months) and five-year TCO. Source: Senza Fili
White paper The taming of the app
© 2013 Senza Fili Consulting • www.senzafiliconsulting.com |12|
Acronyms
3G Third generation AAA Authentication, authorization and accounting CSCF Call Session Control Function eNB eNodeB HSS Home subscriber server IMS IP Multimedia Subsystem LTE Long Term Evolution MME Mobility management entity OCS Online charging system OS Operating system PCRF Policy and charging rules function
PGW Packet gateway RAN Radio access network RAT Radio access technology RNC Radio network controller SGW Serving gateway SS7 Signaling System No. 7 TCO Total cost of ownership UE User equipment VNI Visual Networking Index VoLTE Voice over LTE
© 2013 Senza Fili Consulting, LLC. All rights reserved. This white paper was prepared on behalf of SEVEN Networks. The views and statements expressed in this document are those of Senza Fili Consulting LLC, and they should not be inferred to reflect the position of SEVEN Networks. The document can be distributed only in its integral form and acknowledging the source. No selection of this material may be copied, photocopied, or duplicated in any form or by any means, or redistributed without express written permission from Senza Fili Consulting. While the document is based upon information that we consider accurate and reliable, Senza Fili Consulting makes no warranty, express or implied, as to the accuracy of the information in this document. Senza Fili Consulting assumes no liability for any damage or loss arising from reliance on this information. Trademarks mentioned in this document are property of their respective owners. Icons by ©iStockphoto.com/Tom Nulens and thenounproject/George Agpoon. Cover page photo by tovovan/Shutterstock.
About SEVEN Networks SEVEN® Networks develops innovative software solutions that help wireless carriers manage and optimize mobile traffic before it impacts the
network. SEVEN Network’s flagship Open Channel® products reduce operator costs, increase efficiency in the use of wireless infrastructure, and
enhance end-user experience. Extending the management of data traffic from the network to the mobile client brings immediate capacity relief to
overloaded networks. Operators gain actionable intelligence on their networks, application activity is optimized, and unnecessary signaling activity is
significantly reduced.
About Senza Fili Senza Fili provides advisory support on wireless data technologies and services. At Senza Fili we have in-depth expertise in financial modelling, market
forecasts and research, white paper preparation, business plan support, RFP preparation and management, due diligence, and training. Our client base
is international and spans the entire value chain: clients include wireline, fixed wireless, and mobile operators, enterprises and other vertical players,
vendors, system integrators, investors, regulators, and industry associations. We provide a bridge between technologies and services, helping our
clients assess established and emerging technologies, leverage these technologies to support new or existing services, and build solid, profitable
business models. Independent advice, a strong quantitative orientation, and an international perspective are the hallmarks of our work. For additional
information, visit www.senzafiliconsulting.com or contact us at [email protected] or +1 425 657 4991.
About the author Monica Paolini, PhD, is the founder and president of Senza Fili. She is an expert in wireless technologies and has helped clients worldwide to understand
technology and customer requirements, evaluate business plan opportunities, market their services and products, and estimate the market size and
revenue opportunity of new and established wireless technologies. She has frequently been invited to give presentations at conferences and has
written several reports and articles on wireless broadband technologies. She has a PhD in cognitive science from the University of California, San Diego
(US), an MBA from the University of Oxford (UK), and a BA/MA in philosophy from the University of Bologna (Italy). She can be contacted at