the supermarket revolution food security in namibia
TRANSCRIPT

AFRICAN FOOD SECURITY URBAN NETWORK (AFSUN)
THE SUPERMARKET REVOLUTION
AND FOOD SECURITY IN NAMIBIA
URBAN FOOD SECURITY SERIES NO. 26

AFRICAN FOOD SECURITY URBAN NETWORK (AFSUN)
THE SUPERMARKET
REVOLUTION AND
FOOD SECURITY
IN NAMIBIA
NDEYAPO NICKANOR, LAWRENCE KAZEMBE,
JONATHAN CRUSH AND JEREMY WAGNER
SERIES EDITOR: PROF. JONATHAN CRUSH
URBAN FOOD SECURITY SERIES NO. 26

ACKNOWLEDGEMENTS
The project on South African Supermarkets in Growing African Cities is funded by the
Open Society Foundation for South Africa (OSF-SA). We wish to thank the following
for their assistance with the project and this report: Gareth Haysom, Maria Salamone,
Cameron McCordic, Bronwen Dachs and Ichumile Gqada. The IDRC and SSHRC
are acknowledged for their support of the Hungry Cities Partnership and Consuming
Urban Poverty 2 Project and for contributing in-kind resources to this project.
© AFSUN and HCP 2017
Published by the African Food Security Urban Network (AFSUN)
and Hungry Cities Partnership (HCP)
www.afsun.org and www.hungrycities.net
First published 2017
ISBN 978-1-920597-28-3
Cover photo: Jonathan Crush
Production by Bronwen Dachs Muller, Cape Town
Printed by Print on Demand, Cape Town
All rights reserved. No part of this publication may be reproduced or
transmitted, in any form or by any means, without prior permission from
the publishers.

AUTHORS
Ndeyapo Nickanor is Dean in the Faculty of Science at the University of Namibia,
Windhoek.
Lawrence Kazembe is Associate Professor in the Department of Statistics and Popula-
tion Studies, Faculty of Science, University of Namibia, Windhoek.
Jonathan Crush is CIGI Chair in Global Migration and Development, International
Migration Research Centre, Balsillie School of International Affairs, Waterloo, Canada.
Jeremy Wagner is a Research Fellow at the Balsillie School of International Affairs,
Waterloo, Canada.

Previous Publications in the AFSUN Series
No 1 The Invisible Crisis: Urban Food Security in Southern Africa
No 2 The State of Urban Food Insecurity in Southern Africa
No 3 Pathways to Insecurity: Food Supply and Access in Southern African Cities
No 4 Urban Food Production and Household Food Security in Southern African Cities
No 5 The HIV and Urban Food Security Nexus
No 6 Urban Food Insecurity and the Advent of Food Banking in Southern Africa
No 7 Rapid Urbanization and the Nutrition Transition in Southern Africa
No 8 Climate Change and Food Security in Southern African Cities
No 9 Migration, Development and Urban Food Security
No 10 Gender and Food Insecurity in Southern African Cities
No 11 The State of Urban Food Insecurity in Cape Town
No 12 The State of Food Insecurity in Johannesburg
No 13 The State of Food Insecurity in Harare, Zimbabwe
No 14 The State of Food Insecurity in Windhoek, Namibia
No 15 The State of Food Insecurity in Manzini, Swaziland
No 16 The State of Food Insecurity in Msunduzi Municipality, South Africa
No 17 The State of Food Insecurity in Gaborone, Botswana
No 18 The State of Food Insecurity in Blantyre City, Malawi
No 19 The State of Food Insecurity in Lusaka, Zambia
No 20 The State of Food Insecurity in Maputo, Mozambique
No 21 The State of Poverty and Food Insecurity in Maseru, Lesotho
No 22 The Return of Food: Poverty and Food Security in Zimbabwe after the Crisis
No 23 The Food Insecurities of Zimbabwean Migrants in Urban South Africa
No 24 Mapping the Invisible: The Informal Food Economy of Cape Town, South Africa
No 25 Food Insecurity in Informal Settlements in Lilongwe, Malawi

CONTENTS 1. Introduction 1
2. The Supermarket ‘Revolution’ 3
3. South Africa’s Supermarket Revolution 7
3.1 Urban Food and Corporate Control 7
3.2 Consumer Markets and Supermarket Location 13
3.3 Supermarkets and Informal Food Vendors 17
4. South African Supermarkets in Africa 21
4.1 Corporate Expansion 21
4.2 South Africa’s Supermarkets 22
4.3 Supermarkets in Question 30
5. Study Methodology 32
6. Supermarkets in Namibia and Windhoek 34
6.1 Spatial Distribution of Supermarkets 34
6.2 Supermarket Supply Chains 37
7. Poverty and Food Insecurity in Windhoek 42
7.1 The Geography of Poverty 42
7.2 Levels of Food Insecurity in Windhoek 45
7.3 Household Expenditure on Food 49
8. Supermarket Patronage in Windhoek 52
8.1 Main Sources of Food 52
8.2 Frequency of Food Purchase 54
8.3 Supermarket Domination of Food Purchasing 56
8.4 Consumer Attitudes to Supermarkets 59
8.5 Labour Disputes With Supermarkets 63
9. Impact of Supermarkets on Informal Food Sector 64
10. Conclusion71
References 76

TABLES
Table 1: JSE Top 30 by Turnover (ZAR billion), 2010 and 2015 8
Table 2: Number of Stores and Ownership in South Africa, 2016 12
Table 3: Supermarket Groups Ranked by JSE Market Capitalization,
2016
12
Table 4: Supermarkets and the Informal Sector in Southern African
Cities, 2008
20
Table 5: Africa’s Major Retail Companies, 2013 23
Table 6: Shoprite in Africa, 2015 24
Table 7: Household Survey Sample 33
Table 8: Top Supermarkets in Namibia, 2005 34
Table 9: Number of Supermarkets in Namibia and Windhoek, 2016 35
Table 10: Location of Supermarkets by Constituency 35
Table 11: Source of Supermarket Products, 2008 39
Table 12: Source of Processed Foods in Checkers and Shoprite,
Windhoek
41
Table 13: Income Poverty Levels and Household Characteristics 43
Table 14: Income Poverty Levels by Constituency 44
Table 15: Food Insecurity Prevalence by Housing Type and Location 46
Table 16: Dietary Diversity by Food Insecurity and Type of Housing 47
Table 17: Level of Household Consumption from Each Food Group 48
Table 18: Type of Foods Consumed by Level of Household Food Security 49
Table 19: Patterns of Household Expenditure in Windhoek 50
Table 20: Household Expenditure by Income Quintiles 51
Table 21: Proportion of Income Spent on Food by Household
Characteristics
52
Table 22: Frequency of Sourcing Food from Different Outlets 56
Table 23: HCFPM of Food Item Sources 58
Table 24: Popularity of Different South African Supermarkets 59
Table 25: Reasons for Shopping at Supermarkets 60
Table 26: Reasons for Not Shopping at Supermarkets 60
Table 27: HCFPM of Selected Food Item Sources 67

FIGURES
Figure 1: Number of Firms by Sector in JSE Top 40, 2015 7
Figure 2: The South African Agro-Food System 10
Figure 3: Value in the South African Agro-Food System, 2014 11
Figure 4: Food Retail Supply Chains in South Africa 13
Figure 5: Price Competition Between Supermarket Chains, 2008-2016 14
Figure 6: Target Consumer Base of South African Supermarket Chains 15
Figure 7: Supermarket Distribution in Cape Town 16
Figure 8: Usave Distribution in Cape Town 17
Figure 9: Mix of Supermarkets, Convenience Stores and Independent
Retailers, 2009 and 2015
18
Figure 10: South African Companies in Other African Countries by Sector 21
Figure 11: South African Companies in Rest of Africa 22
Figure 12: Shoprite Total Assets, 2010-2016 24
Figure 13: Pick n Pay Total Assets, 2010-2016 25
Figure 14: SPAR Total Assets, 2010-2016 26
Figure 15: Woolworths Total Assets, 2010-2016 27
Figure 16: Massmart Total Assets, 2010-2016 28
Figure 17: Supermarket Presence in Botswana, South Africa, Zambia
and Zimbabwe
29
Figure 18: Spatial Distribution of Supermarkets in Windhoek 36
Figure 19: Livestock Population in Namibia, 2009-2015 40
Figure 20: Beef Production, Trade and Consumption in Namibia,
2007-2012
40
Figure 21: Change in Poverty Headcount Rate, 2001-2011 43
Figure 22: Lived Poverty Index by Constituency 45
Figure 23: Household Dietary Diversity and Lived Poverty 47
Figure 24: Food Sources by Level of Household Food Security 53
Figure 25: Food Sources by Type of Housing 54
Figure 26: Frequency of Food Purchase by Type of Housing 55
Figure 27: South African and Local Supermarket Patronage by Type
of Housing
59

Figure 28: Patronage of Food Sources by Extremely Poor Households 70
Figure 29: Location of Open Food Markets in Windhoek 70
Figure 30: Location of Food Outlets in Windhoek 71

URBAN FOOD SECURITY SERIES NO. 26 1
“We recognize the urgent need to act now at local and national
levels to address the challenges in food and nutrition security our
country is facing today and ensure food and nutrition security for
future generations” (Windhoek Declaration, July 2014)
1. INTRODUCTION
Rapid urbanization in Africa has been accompanied by a major trans-
formation in national and local food systems. Thomas Reardon and col-
leagues were the first to argue that this transformation was being driven by
a “supermarket revolution” that involved increasingly greater control over
food supply and marketing by international and local supermarket chains
(Reardon et al 2003, Weatherspoon and Reardon 2003). The current
situation in Africa has been called the “fourth wave” of supermarketiza-
tion in the Global South (with the others being in Latin America, Asia,
and some African countries such as South Africa) (Dakora 2012). The
transformation is driven by the development of new urban mass markets
and the profit potential offered to large multinational and local supermar-
ket chains (Reardon 2011). The restructuring of urban food systems by
supermarkets involves “extensive consolidation, very rapid institutional
and organizational change, and progressive modernization of the procure-
ment system” (Reardon and Timmer 2012).
Integral to the process of food system restructuring is a simultaneous
“quiet” or “grass-roots” revolution in urban food supply chains with tens
of thousands of small and medium scale enterprises (SMEs) involved in
trucking, wholesale, warehousing, cold storage, first and second stage
processing, local fast food, and retail (Reardon 2015). These two views
of food system revolution – one emphasizing the domination of super-
markets over supply chains from farm to fork and the other emphasizing
the plethora of opportunities for small businesses in agri-food chains – are
likely to vary in relative importance from place to place depending on
local context.
The notion of the inevitability of a supermarket revolution in Africa
was driven by at least three arguments – first, that there are “stages” of
revolution and that the power of supermarkets in the Global North, and
increasingly in Latin America, would inevitably diffuse to Africa (Rear-
don et al 2003, 2007). South Africa, whose entire food system has been
revolutionized by a few supermarket chains, supposedly showed the rest
of the continent a mirror of its own future. Second, the aggressive expan-
sion of South African supermarkets into the rest of Africa after the end of

2 AFRICAN FOOD SECURITY URBAN NETWORK (AFSUN)
apartheid was both symptomatic of and would hasten the realization of an
African supermarket revolution (Miller et al 2008). Third, dietary change
led by Africa’s growing middle class was providing a massive new con-
sumer market that only supermarkets were equipped to meet. Still, some
researchers were sceptical, cautioning against the over-optimism and
inevitability of the supermarket revolution model for Africa, the speed
of the spread of supermarkets, and their potentially disruptive impact on
traditional forms of retail (Abrahams 2009, 2011, Humphrey 2007, Vink
2013). Abrahams (2009) even suggested that “supermarket revolution
myopia” neglected evidence of other potentially transformative processes
and the resilience of informal food economies in Africa. The transition
towards supermarkets is not a smooth evolution, nor does it entail the
end of the informal food economy: “the growth and dominance of super-
markets presents only one element of a larger, more resilient narrative”
(Abrahams 2009: 123).
The research and policy debate on the relationship between the super-
market revolution and food security focuses on four main issues:
t 8IFUIFS TVQFSNBSLFU TVQQMZ DIBJOT BOE QSPDVSFNFOU QSBDUJDFT NJUJ-
gate rural food insecurity through providing new market opportuni-
ties for smallholder farmers;
t 5IF QPUFOUJBM OFHBUJWF JNQBDU PG TVQFSNBSLFUT PO UIF VSCBO JOGPSNBM
food sector and its inefficient supply chains;
t 5IF JNQBDU PG TVQFSNBSLFUT PO UIF GPPE TFDVSJUZ BOE DPOTVNQUJPO
patterns of residents of African cities; and
t 5IF SFMBUJPOTIJQ CFUXFFO TVQFSNBSLFU FYQBOTJPO BOE HPWFSOBODF PG
the food system, particularly at the local municipal level.
Each of these issues frames the context and questions of this report on
South African supermarkets in Namibia. Against the backdrop of these
themes, the project looks at the drivers and impacts of the expansion of
South African supermarket companies into the rest of Africa. The larger
project, of which this is a part, focuses on five African countries: Botswa-
na, Mozambique, Namibia, Zambia and Malawi. This report presents
the findings from research in 2016-2017 in Windhoek, Namibia, and
addresses the following questions:
t 8IBU BSF UIF ESJWFST PG 4PVUI "GSJDBO TVQFSNBSLFU FYQBOTJPO XJUIJO
South Africa and what are the corporate strategies of the supermarket
chains in relation to the rest of Africa?
t 8IJDI 4PVUI "GSJDBO TVQFSNBSLFUT BSF JO /BNJCJB 8IBU MPDBUJPOT
do they occupy within Windhoek and how does this relate to high
and low-income consumers? What are the implications for the acces-
THE SUPERMARKET REVOLUTION AND FOOD SECURITY IN NAMIBIA

URBAN FOOD SECURITY SERIES NO. 26 3
sibility (geographical and economic) of urban consumers (including
the urban poor) to these outlets?
t )PX BSF UIF TVQFSNBSLFU TVQQMZ DIBJOT PSHBOJ[FE 5P XIBU FYUFOU EP
they involve the import of products from South Africa and interna-
tional markets? Are any products derived from Namibian sources and,
if so, which?
t 8IBU BSF UIF QBUSPOBHF QBUUFSOT PG TVQFSNBSLFUT CZ EJGGFSFOU JODPNF
groups in Windhoek and what is the impact on food security of low-
income groups (including food availability, accessibility, stability and
nutritional quality of diets)?
t 8IBU JT UIF JNQBDU PG TVQFSNBSLFU FYQBOTJPO PO UIF JOGPSNBM GPPE
economy and what kinds of relationships exist between formal and
informal markets and vendors and supermarkets?
The first section of this report reviews current information about the
four key issues identified above relating to the supermarket revolution in
Africa. The next section examines the structure and organization of the
South African supermarket sector. It also examines the spatial strategies of
supermarkets in urban areas and the debate on the impact of supermarkets
on the informal food sector. This is important background since Namib-
ia is increasingly integrated into and impacted by the organization and
corporate strategies of the South African supermarket sector. The report
then discusses the nature and drivers of South African corporate expan-
sion into the rest of Africa and demonstrates that supermarket chains are
leaders in this post-apartheid process. It identifies the major supermarket
chains and their footprint in Africa and reviews some of the criticisms
of the South African supermarket presence outside South Africa. The
remaining sections of the report discuss the research findings in Namibia.
2. THE SUPERMARKET
‘REVOLUTION’
As noted above, the debate on the supermarket revolution addresses four
main areas. Regarding the relationship between smallholders and super-
markets, the international food security agenda has focused for more
than a decade on improving the production and productivity of small-
holder farmers, or what used to be called “rural development” (Crush
and Frayne 2011a, Crush and Riley 2017). In the context of supermarket-
driven change, the question is whether smallholders might be integrated
into the vertically integrated operations that characterize the operations of

4 AFRICAN FOOD SECURITY URBAN NETWORK (AFSUN)
supermarkets and, as a consequence, whether rural food security might be
improved (Reardon 2009).
The initial prognosis was optimistic, as evidenced by the work of the
Regoverning Markets Project (Vorley et al 2008, Biénabe et al 2011) and
AGRA (the Alliance for a Green Revolution in Africa). However, vari-
ous case studies have since sounded a discordant note (Dawson et al 2016;
Gengenbach et al 2017). As Karaan and Kirsten (2008) note in the case
of South Africa, “large food and agribusiness companies and large retail-
ers are now dominant players in the South African agricultural and food
system. This is replicating the situation in the high income industrialised
nations of the world. Added to these realities are the low engagement
levels of South African agribusiness and retailers with black farmers.” The
prospect of large-scale integration of smallholders into supermarket sup-
ply chains has become increasingly pessimistic, not just in South Africa
(van der Heijden and Vink 2013), but also in other African countries
(Andersson et al 2015, Muchopa 2013), Latin America (Blandon et al
2009, Michelson et al 2012) and Asia (Moustier et al 2010, Trebbin 2014).
Increasingly, the consensus seems to be that the supermarket model is
“inherently hostile towards smaller producers” (van der Heijden and Vink
2013: 68).
The second area of debate about the supermarket revolution concerns
the relationship between the formal and informal food retail sectors. The
conventional wisdom is that the spread of supermarkets will inevitably
displace and even eradicate more traditional informalized supply chains
and vendors, destroying livelihoods and increasing unemployment in the
process. Kennedy et al (2004: 1), for example, argue that “competition for
a market share of food purchase tends to intensify with entry into the sys-
tem of…large multinational fast food and supermarket chains. The losers
tend to be small local agents and traditional food markets.” Reardon and
Gulati (2008: 17) similarly assert that “the mirror image of the spread
of supermarkets is the decline of the traditional retail sector.” Louw et
al (2007: 25) argue that in South Africa “one of the primary threats is
the encroachment of supermarkets into areas traditionally occupied by
the informal market.” A contrasting position is that the informal food
landscape in the South is extremely resilient in the face of competition.
In Brazil, for example, Farina et al (2005) argue that “different formats of
retail stores live together in the Brazilian market, compete for consumer
preference and, at the same time, complement each other.” Similar argu-
ments about the complementarity of supermarkets and the informal food
sector have been made in a number of Asian countries (Gorton et al 2011,
Huang et al, 2015, Minten et al 2010, Schipmann and Qaim 2011, Si et al
2016, Suryadarma et al 2010, Zhang and Pan 2013).
THE SUPERMARKET REVOLUTION AND FOOD SECURITY IN NAMIBIA

URBAN FOOD SECURITY SERIES NO. 26 5
A third general area of debate is the relationship between supermarket
growth and urban food security. Standard FAO definitions suggest that
food security has four main pillars: food availability, food accessibility,
food utilization (including food safety) and food stability. Proponents
argue that supermarket supply chains improve food security across all
four dimensions by increasing the quantity and variety of foodstuffs avail-
able in urban areas, making food more accessible by reducing food prices
through economies of scale, introducing quality controls that enhance
food safety, and ensuring a stable food supply that is not subject to sea-
sonal fluctuations or periodic shortages (Reardon et al 2003). There is
general agreement that supermarket supply chains have the potential to
improve food availability and food stability. However, there is little con-
sensus about their impact on the accessibility and utilization dimensions
of food security. Much of the global research on supermarket impacts on
food security has focused on food utilization, diet and nutrition. There is
incontrovertible evidence that the Global South is undergoing a dietary
transition leading to a double (undernutrition and overnutrition) burden
of malnutrition (Popkin et al 2012). Across the Global South, including
Africa, the prevalence of overweight, obesity and accompanying non-
communicable diseases (NCDs) is increasing rapidly (Popkin and Slining
2013).
The key question is whether and how supermarkets are implicated in
this process. Several studies suggest that supermarkets are driving dietary
change, unhealthy food choices and the consumption of ultra-processed
foods, and contributing to the obesity pandemic and NCDs (Asfaw 2008,
Hawkes 2008, Igumbor et al 2012, Kelly et al 2014, Monteiro et al 2011,
Umberger et al 2015). Others suggest that the impact of supermarkets is
variable. Gómez and Ricketts (2013) argue that negative dietary change
is confined to higher-income groups and that there is “little nutritional
impact” among the urban poor. Peyton et al (2015) argue that in Cape
Town, however, supermarkets do impact negatively on the urban poor,
primarily because they carry a narrow range of fresh food products and
focus on the marketing of cheap, processed foods that are energy-dense,
fatty, sugary and salty. Kimenju et al (2015) conclude that although
supermarkets and their food sales strategies in small-town Kenya con-
tribute to changing food consumption habits and nutritional outcomes,
these impacts differ by age cohort and initial nutritional status. As a result,
“simple conclusions on whether supermarkets are good or bad for nutri-
tion and public health are not justified.”
The final area of debate about supermarkets relates to the policy implica-
tions of supermarket expansion in urban food markets. Timmer (2009:
1816) suggests that the development policy issues presented by the super-

6 AFRICAN FOOD SECURITY URBAN NETWORK (AFSUN)
market revolution “cut across the entire economy, from agricultural
technology and farmer responsiveness, to concentration in processing and
retailing channels, to standards for food quality and safety, to food secu-
rity at both micro and macro levels.” The foundational policy issue con-
fronting national governments throughout the Global South is whether to
allow unfettered access to their consumer markets by supermarket chains.
This issue was crystallized in Indian opposition to the penetration of
multinational supermarkets and their potential negative impact on locally
owned small-scale retailers and their supply chain intermediaries (Rear-
don and Minten 2011). In South Africa, a coalition of labour unions, con-
sumer groups and local supermarket chains unsuccessfully opposed the
takeover of Massmart by American retail giant Walmart, whose motive
was to penetrate the profitable South African consumer market and use
South Africa as a bridgehead into the rest of Africa (Dralle 2017, Kenny
2014, Parker and Luiz 2015). The related question for national African
governments is what policies to adopt towards direct foreign investment
by South African supermarkets; a question that cannot be separated from
their policies towards direct investment by South African companies in
general, which spans the whole continent and numerous economic sec-
tors (Berkowitz et al 2012).
Timmer (2009) argues that “there are few policy implications that are
specific to managing the supermarket revolution” but that it does affect
the food policy agenda in two basic ways: (a) at the micro or household
level through the impact of supermarkets on poor consumers; and (b) at
the macro-level through the impact of supermarkets on staple food sup-
plies, price stability and links to external markets. National policy makers
should also be concerned about how to influence the behaviour of super-
markets “in ways that serve the interests of important groups in society,
especially small farmers and the owners of traditional, small-scale food
wholesale and retail facilities” (Timmer 2009: 1814). Reardon and Hop-
kins (2006) suggest that it is the role of government to proactively manage
the “emerging tensions” among supermarkets, suppliers and traditional
suppliers. Ruel et al (2017) are optimistic about the desire and capacity of
policy to enable positive food security outcomes. Timmer (2017) recently
suggested that “government policies can shape both the positive and nega-
tive dimensions (of supermarket expansion) at the margin, but most of the
dynamics of supermarket growth are stimulated by technological changes
and consumer demands that are beyond the control of governments.” In
many African countries, unconditional national and municipal support
for modern supermarket retail expansion accompanies efforts to curtail
or erase the informal food sector (Skinner 2016). This raises the question
of what kinds of policies are in place to manage the urban food system
THE SUPERMARKET REVOLUTION AND FOOD SECURITY IN NAMIBIA

URBAN FOOD SECURITY SERIES NO. 26 7
and food retail environment at the city level. Researchers in Africa have
argued that coherent city-level urban food security policies are largely
absent and, where they do exist, they focus primarily on promoting urban
agriculture (Brown 2015, Haysom 2015, Smit 2016).
3. SOUTH AFRICA’S SUPERMARKET
REVOLUTION
3.1 Urban Food and Corporate Control
Retail is the third largest sector on the Johannesburg Stock Exchange
(JSA) ranked by turnover, with six firms featuring in the top 40 (Figure 1)
(das Nair and Dube 2017). Five of the six retailers in the top 40 are super-
market chains – Shoprite Holdings (14th), Massmart Holdings (Walmart)
(16th), the Spar Group (20th), Pick n Pay Stores (23rd) and Woolworths
Holdings (27th), while the sixth is furniture retailer Steinhoff (Table
1). Financial turnover for the listed supermarkets increased significantly
between 2010 and 2015.
FIGURE 1: Number of Firms by Sector in JSE Top 40, 2015
Financials
Mining
Retailers
Telecoms
Hospitals
Packaging and...
Diversified...
Steel
IT
Pharmaceuticals
Tobacco
Transport
Food processors
Construction
Beverages...
Chemicals
Media
Luxury goods
0 1
2 3 4 5 6 7 8
Source: das Nair and Dube (2017)

TABLE 1: JSE Top 30 by Turnover (ZAR billion), 2010 and 2015
Company Sector
2010
Turnover
2015
Turnover
Increase/
Decrease
1 Glencore Mining 1,813 2,653 840
2 BHP Billiton Mining 404 636 232
3 Anglo American Mining 184 318 134
4 British American Tobacco 153 299 146
5 SABMiller Beverages/brewers 131 269 138
6 Sanlam Financials 123 239 116
7 Bidvest Group Industrials 110 205 95
8 Sasol Chemicals 122 185 63
9 MTN Group Telecoms 115 147 32
10 Old Mutual Financials 70 145 75
11 Steinhoff International Retailers 48 137 89
12 Richemont SA Luxury goods 48 136 88
13 Mondi Limited Packaging/paper 55 115 60
14 Shoprite Holdings Retailers 67 114 47
15 Imperial Holdings Transport 54 110 56
16 Massmart Holdings Retailers 47 85 38
17 Vodacom Group Telecoms 59 77 18
18 Datatec IT 29 75 46
19 Sappi Packaging/paper 46 75 29
20 Spar Group Retailers 35 73 38
21 Naspers Media 28 73 45
22 Anglogold Ashanti Mining 262 67 -195
23 Pick n Pay Stores Retailers 55 67 12
24 Standard Bank Group Financials 38 65 27
25 Barloworld Industrials 42 63 21
26 Anglo Platinum Mining 46 60 14
27 Woolworths Holdings Retailers 26 57 31
28 Liberty Holdings Financials 22 54 32
29 Aveng Construction 34 44 10
30 FirstRand Financials 18 40 22
Source: das Nair and Dube (2017)
Greenberg (2017) identifies three developments that facilitated the con-
centration of corporate power in the South African food retail system: (a)
the Uruguay Round of GATT (leading to the formation of the WTO
and locking countries into trade agreements with implications for produc-
tion and distribution systems); (b) the dismantling of the South African
statutory regulatory systems governing agricultural products and their
replacement with a combination of greater market forces and industry self-
regulation, embodied in the Marketing of Agricultural Products Act of
1996; and (c) amendments to the Cooperatives Act in 1993 that allowed
the cooperative infrastructure to be removed from farmer control and then
8 AFRICAN FOOD SECURITY URBAN NETWORK (AFSUN)
THE SUPERMARKET REVOLUTION AND FOOD SECURITY IN NAMIBIA

URBAN FOOD SECURITY SERIES NO. 26 9
corporatized and privatized. These processes of privatization, trade lib-
eralization, state deregulation and corporate self-regulation replaced the
earlier apartheid-era system of state control and regulation. Together with
rising consumer demand from urbanization, they fuelled the large-scale
expansion of a new corporate agro-food system within the country (Ber-
nstein 2013). Corporate retailing and the supermarket became the pre-
eminent format to market food to consumers (Greenberg 2017).
The transformation of South Africa’s food system by supermarket cor-
porations has involved extensive consolidation, rapid institutional and
organizational change throughout entire agro-food value chains, and
progressive technological modernization of their procurement systems.
The structures of South African supermarkets and their value chains have
changed and expanded over time, shifting from serving affluent consum-
ers in urban areas to new markets in lower-income communities (Peyton
et al 2015). Power in the food retail environment has been consolidated
primarily by local companies. South African-based corporate entities such
as Pick n Pay and Shoprite were able to expand rapidly in high-income
areas, becoming dominant players in the food retail industry. These com-
panies adopted many of the strategies of their North American and Euro-
pean counterparts, utilizing supply chain formalization and Western-style
layouts to establish a ubiquitous supermarket format (Peyton et al 2015).
The country’s retail outlets now offer a variety of formats similar to those
in the United States and, in the process, the agro-food system and its
value chains have been restructured. Figure 2 provides a diagrammatic
overview of the South African agro-food system and highlights the sig-
nificant corporate actors in the food value chain.
The largest food sector activity is wholesale and retailing, followed by
manufacturing and then primary production (Greenberg 2017). Food
passes through specific stages of activity and value is added as it moves
downstream. Downstream stages along the value chain are larger in terms
of value than those upstream (Figure 3). The five big food retailers in
South Africa, which are also the five largest retailers across all sectors
(Shoprite, Pick n Pay, Spar, Massmart and Woolworths), had a combined
profit of ZAR14.5 billion in 2014 (Greenberg 2017). Combined, they
control two-thirds of the total South Africa food retail market and their
profit is nearly three times that of the top five food processors. Although
processors may seek to shape demand through the creation of new prod-
ucts, the buying power of supermarkets is the most significant force with-
in the agro-industrial complex.
Large-scale supermarket chains dominate the food retail market in most
South African urban areas as anchor tenants in malls and mini-malls, as

10 AFRICAN FOOD SECURITY URBAN NETWORK (AFSUN)
stand-alone supermarkets on main streets, and along major transporta-
tion arteries. They also operate convenience-store formats including in
petrol stations as well as chains such as OK MiniMark and Friendly stores.
Whereas most food retailing in African countries is fragmented and
consumers buy primarily from neighbourhood kiosks or independently
owned convenience stores, South African consumers are an exception.
South Africa’s marketplace is much denser in terms of corporate retail,
with the number of hypermarkets and supermarkets increasing from 790
in 2009 to 2,875 in 2015 (Nortons Inc 2016). In 2013, there was one store
for every 16,000 people nationwide (Vink 2013). Branded convenience
stores have also increased to more than 4,500 outlets. Despite accounting
for only 5% of all retail outlets in number, supermarkets command over
two-thirds of the market in South Africa (Nortons Inc., 2016).
FIGURE 2: The South African Agro-Food System
Source: Greenberg (2017)
THE SUPERMARKET REVOLUTION AND FOOD SECURITY IN NAMIBIA

URBAN FOOD SECURITY SERIES NO. 26 11
FIGURE 3: Value in the South African Agro-Food System, 2014
Source: Greenberg (2017)
In terms of store numbers, South Africa’s food retail market is domi-
nated by four large supermarket chains: Shoprite Holdings (31% share),
Pick n Pay (30%), Spar (21%) and Woolworths (9%) (Table 2). The
other significant South African chain is Fruit & Veg City’s Food Lover’s
Market (around 2%). The top five supermarket retailers on the JSE can
also be ranked in terms of their market capitalization (Table 3) (das Nair
and Dube 2017). On this basis, Shoprite and Woolworths are the larg-
est supermarket chains in the retail industry in South Africa. While food
227.9bn 78.3bn
“Modern” food retail sales
Consumer food service sales
291.5bn 519.4bn
Food wholesale and retail
total sales
“Traditional” grocery retailers
and independent small
grocers sales
Distribution
117.7bn Retail property
15.1 bn
Transport out –
manufactured food, beverages and tobacco
56.4bn
Processed food exports
391.9bn 52.3bn
Food and beverages
Manufacturing containers and packaging
Processed food imports
21.6bn
Food and beverages
manufacturing sales
48.7bn Primary agriculture exports
16bn
Primary freight transport,
including forestry
Primary agriculture imports
Logistics
and trade
10.2bn
208.3bn Commercial sales
15.5bn Small-scale (subsistence and
informal market)
223.8bn Primary
production
Primary agricultural
production sales
29bn
Finance to farms
Animal purchases for primary
production
Animal feed
116.6bn 10.3bn
27.8bn Fertiliser Agricultural
inputs
5.5bn Seed and plant materials
138.2bn Expenditure on inputs to
primary agricultural production

12 AFRICAN FOOD SECURITY URBAN NETWORK (AFSUN)
retail is dominated by locally owned corporations, two external play-
ers have recently entered the country. One is Walmart, which acquired
a controlling interest in South Africa’s Massmart Holdings (including
Game Stores), and the other is Choppies, a much smaller but fast-growing
Botswana-based supermarket chain.
TABLE 2: Number of Stores and Ownership in South Africa, 2016
No. of stores Share %
Shoprite (SA) 1,284 31
Pick n Pay (SA) 1,280 30
Spar (SA) 890 21
Woolworths (SA) 382 9
Massmart/Walmart/Game (USA) 203 5
Food Lover’s Market (SA) (+100) 2
Choppies (Botswana) 64 2
Source: das Nair and Dube (2017)
TABLE 3: Supermarket Groups Ranked by JSE Market
Capitalization, 2016
ZAR billion
Shoprite Holdings 109.9
Woolworths Holdings 74.2
Spar Group 34.5
Pick n Pay 34.4
Massmart Holdings 32.6
Choppies Limited 4.3
Source: das Nair and Dube (2017)
South African supermarket chains have invested heavily in centralized
distribution centres that service in-country operations, as well as those in
neighbouring countries, including Namibia. Pick n Pay, for example, has
11 distribution centres distributed across South Africa. Shoprite’s distri-
bution centre in Centurion is the largest on the continent (at 180,000m2),
with over 1,100 suppliers and is the distribution point for 90% of ambient
products delivered to stores in Gauteng province and beyond. Shoprite’s
five distribution centres in the Western Cape province are currently being
consolidated into a single 120,000m2 facility. Supermarket corporations
either own their own vehicle fleets or outsource distribution of prod-
ucts to stores. Shoprite, for example, has its own transport fleet under
the Freshmark name, while Pick n Pay outsources to Imperial Logis-
tics. Supermarkets also obtain some of their products from wholesalers
and hybrid retailers. Independent buying groups play a role in the food
supply chain, selling both to independent retailers and wholesalers. The
THE SUPERMARKET REVOLUTION AND FOOD SECURITY IN NAMIBIA

URBAN FOOD SECURITY SERIES NO. 26 13
major buying groups include Unitrade Management Services, the Buying
Exchange Company, the Independent Buying Consortium, the Indepen-
dent Cash & Carry Group and Elite Star Training. Figure 4 illustrates the
relationship between suppliers, buying groups, distribution centres and
supermarkets (das Nair 2017).
FIGURE 4: Food Retail Supply Chains in South Africa
Source: das Nair (2017)
3.2 Consumer Markets and Supermarket Location
South Africa’s supermarket sector is a low profit margin industry char-
acterized by intense competition. With the exception of Woolworths,
which targets a higher-income demographic (Figure 5), there are high
levels of price competition across numerous categories of groceries. The
major retailers compete in offering not only the lowest prices but also
the most extensive range of products at the best value. The extent of
the competition is so intense that some retail grocers have introduced
programmes that match any price offered by competitors across a select
group of stocked products. In-store design and formatting innovations
are constantly being adapted to find a competitive advantage. Key food
retail strategies include product diversification beyond just groceries,
multi-channel approaches to reaching consumers, in-store financial ser-
vices, larger format stores, format diversification (such as forecourts and
convenience stores), and collection of consumer data to shape supply and
demand (Greenberg 2017). The supermarket chains have all introduced
their own brand/label products, e.g. Shoprite’s Ritebrand and House-
brand in its Checkers stores, which cover approximately 300 products,
and Pick n Pay’s No Name brand (das Nair 2017: 17).

Pick ‘n Pay
14 AFRICAN FOOD SECURITY URBAN NETWORK (AFSUN)
FIGURE 5: Price Competition Between Supermarket Chains,
2008-2016
130
125
120
115
110
105
100
95
Shoprite Spar Woolworths Food
Source: Nortons Inc. (2016)
Checkers
Supermarkets were once associated primarily with the small elite of
upper-income residents of African cities, but are now increasingly target-
ing middle and low-income residents. In South Africa, budget subsidiaries
of supermarket chains are penetrating low-income areas, often as anchor
tenants in mini-mall developments (Peyton and Battersby 2014). In an
AFSUN study of 11 cities in nine Southern African countries, over 80%
of poor urban households procured some of their food from supermarkets
(a figure higher than that for the informal sector) (Crush et al 2012). What
is less certain is whether, and in what ways, greater geographical proxim-
ity impacts on other forms of accessibility, such as the cost of food rela-
tive to income. Supermarket competitors differentiate their products and
marketing strategies on the basis of an assessment of their consumer base.
Figure 6 uses a Living Standards Measure (LSM) to assess differentiation
between the consumer bases of the major supermarket groups. Lower
LSM categories indicate lower living standards whereas higher categories
indicate higher living standards. Shoprite, Spar, and Pick n Pay cater pri-
marily to the LSM 5-7 categories, with Pick n Pay targeting a higher pro-
portion of LSM 8-10 consumers than the other two. Shoprite and Spar
both serve more LSM 1-4 consumers than Pick n Pay, while Woolworths
targets more LSM 8-10 consumers than Pick n Pay.
A spatial analysis of supermarket location in Cape Town found that
supermarkets are most commonly located in middle-class neighbour-
hoods within the city (Peyton et al 2015). The study classified incomes
into quintiles, with income group 1 being the lowest and 5 the highest.
Income group 4 had the highest density of supermarkets per square kilo-
THE SUPERMARKET REVOLUTION AND FOOD SECURITY IN NAMIBIA
Pick n Pay
Pri
ce
in
de
x r
ela
tive
to
mo
nth
ly p
rice
le
ad
er
De
c-0
8
Mar-
09
Ju
n-0
9
Sep-0
9
Dec-0
9
Mar-
10
Ju
n-1
0
Sep-1
0
Dec-1
0
Mar-
11
Ju
n-1
1
Sep-1
1
Dec-1
1
Mar-
12
Ju
n-1
2
Sep-1
2
Dec-1
2
Mar-
13
Ju
n-1
3
Sep-1
3
Dec-1
3
Mar-
14
Ju
n-1
4
Sep-1
4
Dec-1
4
Mar-
15
Ju
n-1
5
Sep-1
5
Dec-1
5
Mar-
16

URBAN FOOD SECURITY SERIES NO. 26 15
metre (Figure 7). The lower three income groups, and particularly Group
1, have the lowest concentration of supermarkets and thus the lowest level
of food provisioning from formal retail outlets. The supermarket density
of Group 4 is more than 16 times the density of Group 1. This suggests
that supermarkets have had limited success expanding into lower-income
areas, their capacity to alleviate food insecurity constrained by their for-
malized nature, which makes them inaccessible to the lowest-income
residents (Peyton et al 2015).
FIGURE 6: Target Consumer Base of South African Supermarket
Chains
Cambridge
Shoprite
Spar
Pick n Pay
Checkers
Woolworths
0 10 20 30 40 50 60 70 80 90 100
Percentage
LSM 1-4 LSM 5-7 LSM 8-10
Source: Nortons Inc (2016)
Determined attempts are being made by large-scale food retailers in South
Africa to draw in lower-income consumers. Shoprite-owned Usave, for
example, is a supermarket brand that stocks low-price bulk goods and
was developed for the purpose of targeting poor communities. Peyton
et al (2015) mapped the distribution of Usave outlets in Cape Town and
found that their distribution differed markedly from that of supermarkets
in general (Figure 8). Usave outlets are disproportionately located in the
lower-income Cape Flats area, rather than the higher-income suburbs and
CBD. To date, their distribution in low-income areas has been limited
mainly to the edges of the Cape Flats region, which “has provided many
in lower income neighbourhoods with a cheaper alternative food source,
but it has neglected those most in need; those in the central Cape Flats
region, where poverty is most heavily concentrated” (Peyton et al 2015).
A growing trend in South Africa is what Battersby (2017) calls the mallifi-
cation of South Africa’s food retail environment. Nationally, the number
of shopping malls increased from 1,053 in 2007 to 1,942 in 2015. An
increasing number of new supermarkets in South Africa are not stand-
alone stores but the main tenants in shopping malls. One of the issues
being investigated by the South African Competition Commission is col-
lusion between mall owners and supermarket chains to keep other super-

16 AFRICAN FOOD SECURITY URBAN NETWORK (AFSUN)
market chains out of malls. Most malls also have fast food courts or out-
lets, some of which (such as Hungry Lion) are owned by the supermarket
chain. The process of mallification can also be seen outside South Africa
including in Windhoek in Namibia.
FIGURE 7: Supermarket Distribution in Cape Town
Source: Peyton et al. (2015)
Supermarkets per square kilometre Supermarkets per 1,000 households
THE SUPERMARKET REVOLUTION AND FOOD SECURITY IN NAMIBIA

URBAN FOOD SECURITY SERIES NO. 26 17
FIGURE 8: Usave Distribution in Cape Town
Source: Peyton et al. (2015)
3.3 Supermarkets and Informal Food Vendors
The impact of supermarket expansion on the informal food economy is
now a subject of investigation by the South African Competition Com-
mission’s Retail Market Inquiry (Cheadle 2017). Between 2009 and
2015, the number of independent retailers across South Africa grew from
93,000 to 140,000 (a 45% increase) (Figure 9). The number of supermar-
kets (including hypermarkets) increased by 26% over the same period,
and the number of convenience stores by 17%. These numbers might

18 AFRICAN FOOD SECURITY URBAN NETWORK (AFSUN)
suggest that supermarket expansion is not having a negative impact on
the informal food retail sector. That, indeed, is the argument of corporate
South Africa before the Competition Commission. Pick n Pay’s public
submission asserts, for example, that its business activities do not “give
rise to a material reduction in competition, or to any prejudice to small
and independent retailers.” Furthermore:
The introduction of supermarkets in these communities has not
materially negatively affected small, informal businesses such as spaza
shops. There are only a limited number of studies which have been
conducted in this regard and their findings do not appear to support
any definitive conclusions that the introduction of shopping centres
and supermarkets are the direct cause of any potential decline in spaza
shops in these areas (Nortons Inc 2017).
FIGURE 9: Mix of Supermarkets, Convenience Stores and
Independent Retailers in South Africa, 2009 and 2015
150,000
140,000
130,000
120,000
110,000
100,000
90,000
80,000
70,000
2009 2015
Independents Convenience Branded hypers and supermarkets
Source: Nortons Inc (2017)
Such corporate self-justification contrasts sharply with a submission from
a consortium of research organizations which argues that:
By actively facilitating development of shopping malls in the vicin-
ity of the township, yet making no allowance for informal business,
local government and big business form a highly effective partnership
to outcompete and dominate over the township retail grocery sector
(Petersen 2017).
THE SUPERMARKET REVOLUTION AND FOOD SECURITY IN NAMIBIA
92,584
3,860
2,276
134,059
4,500
2,875

URBAN FOOD SECURITY SERIES NO. 26 19
Skinner and Haysom (2017) argue that the South African evidence is
mixed on the impact of supermarket expansion on the informal food sec-
tor because it is context dependent. A review of the research literature
on Southern Africa found a complex and nuanced picture, even in South
Africa where supermarkets command a major share of food retail and the
informal food sector is of comparatively recent origin (Crush and Frayne,
2011b). In some cities, such as Msunduzi, the food sector is completely
dominated by supermarkets (Crush and Caesar 2016). The balance sheet
on the impact of shopping mall development on small township retail-
ers in Johannesburg suggests a decline in informal market share. In Cape
Town, there is evidence to suggest a strong and co-dependent relationship
between street traders and the formal food system (Battersby et al 2017).
Recent research points to the vibrancy and resilience of the informal food
economy, as well as its many points of intersection with the formal sector
(Battersby and Peyton 2014, Battersby et al 2017, Peyton et al 2015).
Outside South Africa, the informal food economy co-exists with super-
markets, even in cities where the urban food supply is increasingly con-
trolled by corporate supply chains. On the basis of work in Lusaka, Abra-
hams (2009, 2011) suggests that the impact of supermarkets in Zambia
has been exaggerated and that the local food supply chains persist. In cities
where supermarket penetration is very recent, the informal food economy
does appear to be more robust as a food source for the urban poor (Crush
and Frayne 2011b):
Although supermarket penetration is very uneven at present, the ques-
tion is whether other countries will follow trends already documented
in South Africa…and what the impact will be on the informal food
economy. One general conclusion from the Zambian case seems to be
that the informal economy remains extremely vibrant and will not be
significantly impacted by modern supply chains orchestrated by South
African supermarket firms. In Southern Africa as a whole, informal
markets, informal traders and street foods continue to play a criti-
cal role in food provisioning. In 2006, for example, informal traders
still accounted for more than 90 per cent of the market share of fresh
fruit and vegetables marketed in most low-income SADC countries.
However, it would be premature to conclude that Southern Africa’s
supermarket revolution will therefore not radically transform urban
food supply systems in countries outside South Africa in the future
(Crush and Frayne 2011b).
Research by AFSUN found that while 79% of low-income households
across Southern Africa purchased food at supermarkets, the informal food
sector was also patronized by 70% of households. However, there was a
considerable degree of inter-city variation in the relative importance of

20 AFRICAN FOOD SECURITY URBAN NETWORK (AFSUN)
these two sources of food (Table 4). The data seems to suggest that there
are three types of scenario:
t 4PVUI "GSJDBO DJUJFT XJUI FYUSFNFMZ IJHI QBUSPOBHF PG UIF TVQFSNBS-
ket sector and variable use of the informal sector;
t $JUJFT JO DPVOUSJFT OFJHICPVSJOH 4PVUI "GSJDB XJUI FYUSFNFMZ IJHI
supermarket patronage and much lower patronage of the informal
food sector; and
t $JUJFT JO NPSF EJTUBOU DPVOUSJFT XJUI MPX TVQFSNBSLFU VTBHF BOE IJHI
levels of patronage of the informal sector.
The Windhoek picture was most similar to Cape Town, with very high
supermarket use (97%) but significant, though not as high, purchasing
from informal vendors (76%). The question, then, is whether the co-
existence model identified for Cape Town is also at work in Windhoek
or whether the proportion of households shopping at informal sites has
declined since the AFSUN survey in 2008.
TABLE 4: Supermarkets and the Informal Sector in Southern African
Cities, 2008
City Supermarkets
(% of households)
Informal vendors
(% of households)
South Africa
Msunduzi 97 42
Johannesburg 96 85
Cape Town 94 66
Other Southern Africa
Gaborone, Botswana 97 29
Windhoek, Namibia 97 76
Manzini, Swaziland 90 48
Maseru, Lesotho 84 49
Blantyre, Malawi 53 99
Harare, Zimbabwe 30 98
Maputo, Mozambique 23 98
Lusaka, Zambia 16 100
Source: AFSUN
THE SUPERMARKET REVOLUTION AND FOOD SECURITY IN NAMIBIA

URBAN FOOD SECURITY SERIES NO. 26 21
4. SOUTH AFRICAN
SUPERMARKETS IN AFRICA
4.1 Corporate Expansion
Since the end of apartheid, South African companies have rapidly expand-
ed into the rest of Africa. The penetration of supermarkets is thus part of
a broader process of corporate profit-seeking. As Figure 10 shows, the
main sectors (in terms of the number of countries with South African
operations) include chemicals, tourism, construction, ICT, telecoms and
transportation. Retailers (which include supermarket chains) are next,
with a presence in 17 countries. Fast food/restaurant companies are in
15 countries. The spatial distribution of investment varies considerably
(Figure 11). South Africa’s corporate footprint in Africa is heaviest in the
countries of the Southern African Development Community (SADC).
With the exception of Angola and the DRC, over 40 South African com-
panies operate in each SADC country. Botswana, Swaziland and Namibia
each have more than 50 South African companies. Namibia is thus one of
the major target countries for South African corporate expansion.
FIGURE 10: South African Companies in Other African Countries by
Sector
Chemicals (4)
Tourism and travel (6)
Construction and materials (7)
ICT (5)
Telecoms (3)
Distribution and logistics (8)
Retail trade (15)
Finance/banking/insurance (13)
FMCG (3)
Restaurants/fast food (3)
Engineering (2)
Paper and packaging (3)
Mining (8)
Agricultural (4)
Pharmaceutical (2)
Vehicles manufacturer (1)
Legal services (2)
Electricity (1)
Fishing (1)
Beverages and tobacco (1)
Healthcare (3)
Forestry/paper (1)
Petroleum (1)
Media (1)
Education (1)
Property (1)
0
5 10
15 20 25 30
Source: Berkowitz et al. (2012)
Number of African countries

22 AFRICAN FOOD SECURITY URBAN NETWORK (AFSUN)
FIGURE 11: South African Companies in Rest of Africa
Source: Berkowitz et al. (2012)
4.2 South Africa’s Supermarkets
Deloitte (2015) lists Africa’s top 25 retail companies by revenue earned
(Table 5). The top five are all South African supermarket chains. The
growing power and control of these supermarket chains over the food
system in South Africa has been accompanied by simultaneous expan-
sion in other African countries (Dakora et al. 2010). Their presence is
particularly strong in Southern Africa but they are also expanding in East,
Central, and West Africa.
4.2.1 Shoprite Holdings Ltd. (das Nair and Dube, 2017; Shoprite,
2016): The Shoprite Group is South Africa and Africa’s largest food re-
tailer (by store number) and, as of 2016, operated 1,514 corporate super-
market, hypermarket, and convenience outlets in 15 countries across the
continent. Another 123 new locations across all formats were set to be
opened by the end of 2017. The retail formats and store brands comprise
Shoprite supermarkets, Checkers supermarkets, Checkers hypers, Usave
Tunisia
Morocco
Algeria Libyan Arab Jamahiriya Egypt
Mauritania
Cape Verde Mali Niger Chad
Eritrea Senegal Sudan
Gambia Burkina Faso
Guinea Djibouti
Guinea-Bissau Nigeria
Ghana CAR Ethiopia
Sierra Leone
Liberia Cote d’Ivoire
Togo Benin
Cameroon Somalia
Sao Tomé and Principe
Equatorial Guinea Gabon
Congo
Uganda Kenya
DRC Rwanda
Seychelles
Burundi
Tanzania
No. of companies Angola Comores Malawi
> 50
40 - 50
30 - 40
20 - 30
10 - 20
1 - 10
< 1
Zambia
Namibia Zimbabwe
Mozambique
Botswana
Mauritius
Madagascar
Swaziland
Lesotho
THE SUPERMARKET REVOLUTION AND FOOD SECURITY IN NAMIBIA

URBAN FOOD SECURITY SERIES NO. 26 23
and OK Food stores as well as distribution centres, OK Furniture outlets,
OK Power Express stores, House & Home stores, and Hungry Lion fast
food outlets. The company is publicly listed on the Johannesburg Stock
Exchange (JSE) Ltd, with secondary listings on both the Namibian and
Zambian Stock Exchanges. The company’s total assets grew from ZAR18
billion in 2010 to nearly ZAR50 billion in 2016 (Figure 12). Annual re-
ports suggest that the Shoprite Group has a broad customer base that
closely mirrors the demographic profile of each country in which they
operate. Data presented by Nortons Inc (2016) challenges this notion,
however (Figure 6). Checkers tends to focus exclusively on high-income
markets while the Usave supermarket format targets the lower end of the
market. Shoprite also owns the OK Franchise Division, which includes
OK Foods, OK MiniMark, OK Express and OK Grocer.
TABLE 5: Africa’s Major Retail Companies, 2013
Retail
Rev-
enue
Rank
FY13
Name of company
Head-
quarter
country
Core retail segment
2013
FY13
revenue
(USD
million)
1 Shoprite Holdings Ltd South Africa Food and beverage 9,852.5
2 Massmart Holdings Ltd South Africa General goods 7,529.9
3 Pick n Pay Stores Ltd South Africa Food and beverage 6,343.3
4 Spar Group Ltd South Africa Food and beverage 5,166.7
5 Woolworths Holdings Ltd South Africa Clothing and
accessories 3,827.8
6 Foschini Group Ltd South Africa Clothing and
accessories 1,594.1
7 Mr Price Group Ltd South Africa Clothing and
accessories 1,557.7
8 Clicks Group Ltd South Africa Health and
personal care 1,349.7
9 JD Group Ltd
(Steinhoff Holdings) South Africa Furniture 1,141.3
10 Truworths International Ltd South Africa Clothing and
accessories 1,008.2
11 Label’Vie SA Morocco General goods 681.9
12 Choppies Enterprises Ltd Botswana Food and beverage 567.9
13 Lewis Group Ltd South Africa Electronics/
appliances 523.4
14 OK Zimbabwe Ltd Zimbabwe Food and beverage 483.7
15 Iliad Africa Ltd South Africa Building materials 464.2
16 Société Magasin Général SA Tunisia General goods 454.5
17 PZ Cussons Nigeria Plc Nigeria Electronics/
appliances 444.7
18 Meikles Ltd Zimbabwe Food and beverage 346.4
19 Sefalana Holding Co Ltd Botswana General goods 229.6
20 Zambeef Products Plc Zambia Food and beverage 171.8

21 Uchumi Supermarkets Ltd Kenya Food and beverage 163.8
22 AVI Ltd South Africa Food and beverage 155.7
23 Fummart Ltd South Africa Furniture 131.6
24 Edgars Stores Ltd (Edcon) Zimbabwe Clothing and
accessories 64.8
25 Rex Trueform Clothing Co
Ltd South Africa
Clothing and
accessories 47.4
Source: Deloitte (2015: 9)
FIGURE 12: Shoprite Total Assets, 2010-2016
Source: das Nair and Dube (2017)
TABLE 6: Shoprite in Africa, 2015
Shoprite
Checkers
Checkers
Hyper
Usave
OK
Furniture
OK
Franchise
Division
House &
Home
Hungry
Lion
South Africa 400 180 31 266 255 183 45 124
Angola 7 14 5 7
Botswana 5 1 5 7 1 9
DRC 1 1
Ghana 3 1
Lesotho 5 6 6 1 3
Madagascar 8
Malawi 3 3
Mauritius 3
Mozambique 8 3 5
Namibia 18 4 23 11 18 2 11
Nigeria 10
Swaziland 9 5 4 4 1
Uganda 3
Zambia 20 1 2 11
Total 503 185 31 327 295 206 48 167
Source: Based on Dakora (2016: 12) and company websites
60,000
50,000
40,000
30,000
20,000
10,000
0
Total assets Current assets Non-current assets
24 AFRICAN FOOD SECURITY URBAN NETWORK (AFSUN)
THE SUPERMARKET REVOLUTION AND FOOD SECURITY IN NAMIBIA
ZA
R m
illio
ns

URBAN FOOD SECURITY SERIES NO. 26 25
As Table 6 shows, Shoprite’s presence is massively weighted towards the
South African market. In 2015, however, it had a presence in 14 other
African countries which included 103 Shoprite supermarkets, 5 Check-
ers supermarkets (with 4 in Windhoek, Namibia), 61 Usave supermarkets
and 21 OK outlets. Its Hungry Lion fast-food subsidiary had 23 outlets
outside South Africa, including 11 in Namibia. Shoprite’s presence is
greatest in Southern Africa with a smaller footprint in countries such as
Ghana and Nigeria.
4.2.2 Pick n Pay Stores Ltd. (das Nair and Dube 2017, Pick n Pay
2016): Pick n Pay is the second largest food retailer in Africa by revenue
with head offices in Cape Town and Johannesburg. Through its subsid-
iaries and associates, the corporate entity in 2015 operated 235 super-
markets and hypermarkets in eight countries: South Africa, Botswana,
Lesotho, Mauritius, Mozambique, Namibia, Swaziland and Zambia.
The group, which attempts to cater to lower, middle and higher socio-
economic communities, manages a variety of store formats, including hy-
permarkets, supermarkets, family franchise stores, mini market franchises,
clothing stores, liquor stores, pharmacies, hardware stores and butcheries.
It also owns a 49% share in TM Zimbabwe. In 2014, Pick n Pay had a
market capitalization of ZAR35.5 billion. Its total assets increased from
ZAR11 billion in 2010 to over ZAR16 billion in 2016 (Figure 13).
FIGURE 13: Pick n Pay Total Assets, 2010-2016
Source: das Nair and Dube (2017)
18,000
16,000
14,000
12,000
10,000
8,000
6,000
4,000
2,000
0
Total assets Current assets Non-current assets
ZA
R m
illio
ns

26 AFRICAN FOOD SECURITY URBAN NETWORK (AFSUN)
3.2.3 Spar Group South Africa Ltd. (das Nair and Dube 2017,
Spar Group 2016): The Spar Group is the third largest food retailer in
Africa by revenue and consists of Spar retailers, who are independent
franchised store owners, and Spar Distribution Centres, which provide
services for those retailers. Members pay a subscription to the group that
is used for advertisements and promotions. Spar has aggressively expanded
in Africa across a variety of retail formats, including supermarkets, con-
venience stores, hardware stores and liquor stores. The group has 944
SuperSpar and Spar outlets in 13 countries: South Africa, Angola, Bot-
swana, Cameroon, Malawi, Mauritius, Mozambique, Namibia, Nigeria,
Seychelles, Swaziland, Zambia and Zimbabwe. Its total assets increased
from ZAR7.5 billion in 2010 to over ZAR25 billion in 2015 (Figure 14).
FIGURE 14: Spar Total Assets, 2010-2016
Source: das Nair and Dube (2017)
4.2.4 Woolworths Holdings (das Nair and Dube 2017, Wool-
worths 2016): While predominantly a clothing and accessories retailer,
the group also sells food under its own brand name. Woolworths predom-
inantly targets middle and upper socio-economic consumers. It also caters
for consumers with an interest in high quality organic food products. The
group has 397 food retailing outlets, mainly in shopping centres, in South
Africa, Botswana, Ghana, Kenya, Lesotho, Mozambique, Namibia, Swa-
ziland, Tanzania, Uganda and Zambia. Woolworths has also opened
stand-alone food stores in convenient suburban locations. The total assets
of the company increased from around ZAR9 billion in 2010 to nearly
ZAR50 billion in 2016 (Figure 15).
30,000
25,000
20,000
15,000
10,000
5,000
0
Total assets Current assets Non-current assets
THE SUPERMARKET REVOLUTION AND FOOD SECURITY IN NAMIBIA
ZA
R m
illio
ns

URBAN FOOD SECURITY SERIES NO. 26 27
FIGURE 15: Woolworths Total Assets, 2010-2016
Source: das Nair and Dube (2017)
4.2.5 Fruit & Veg City Holdings (das Nair and Dube 2015, 2017):
Fruit & Veg City is the fifth largest grocery retailer in terms of store num-
bers in South Africa. It started operations in Cape Town in 1993 and has
expanded rapidly. There are now over 100 locations throughout South-
ern Africa. The chain has expanded into franchised convenience stores
through a joint venture with fuel retail company Caltex. They have also
introduced a fast food brand and diversified into the liquor market. Like
other supermarkets, Fruit & Veg City now targets a broad demographic of
customers, including through its Food Lover’s Market format that focuses
on wealthy suburbs. Unlike the other major supermarkets though, Fruit
& Veg City focuses predominantly on the sale of fresh fruit and vegeta-
bles. The chain has outlets in South Africa, Lesotho, Mauritius, Namibia,
Reunion, Tanzania, Zambia and Zimbabwe.
4.2.6 Massmart Holdings Ltd./Walmart (das Nair and Dube
2017): Massmart Holdings is a South African firm that was acquired by
Walmart in 2011. The company owns a variety of retail formats includ-
ing supermarket brands Game and Makro. Game has branched into food
products, selling non-perishable groceries in its stores as well as basic
foods wholesale as Game FoodCo. Walmart has indicated that it intends
to expand Game FoodCo retail offerings considerably in South Africa
(Greenberg 2017). Game has the advantage of Walmart’s immense glob-
al supplier base, allowing it to benefit from lower unit costs. Massmart,
which has outlets in South Africa, Botswana, Ghana, Kenya, Lesotho,
Malawi, Mozambique, Namibia, Nigeria, Swaziland, Tanzania, Uganda
and Zambia, grew steadily between 2010 and 2016 (Figure 16).
50,000
40,000
30,000
20,000
10,000
0
Total assets Current assets Non-current assets
ZA
R m
illio
ns

28 AFRICAN FOOD SECURITY URBAN NETWORK (AFSUN)
FIGURE 16: Massmart Total Assets, 2010-2016
Source: Nair and Dube (2017)
The relative presence of different South African supermarkets varies from
country to country. Compare, for example, Botswana, Zambia and Zim-
babwe with South Africa (Figure 17). In South Africa, Shoprite, Pick n
Pay and Spar are clearly dominant (with 88% of outlets). These compa-
nies have 78% of the outlets in Zambia, 57% in Zimbabwe and only 27%
in Botswana (where local chain Choppies has 42% of the outlets).
There are numerous reasons why South African supermarkets have
invested in the rest of Africa in the last two decades. First, the short and
long term financial profits to be made by early entry into Africa’s rapidly
growing urban consumer markets are significant. The Economist argues
that, as African economies expand, it is likely that food retailing will
drive industry growth across the continent, with South African compa-
nies leading the way (Economist 2013). Second, Tschirley et al (2015)
have traced the growth of an African middle-class with higher disposable
incomes, changing dietary preferences, heavy expenditure on processed
food, and a taste preference for food purchase at modern retail outlets.
Third, in the context of high rates of formal-sector unemployment, there
is a readily available and cheap labour force to utilize in supermarket and
value chain operations. Fourth, the accessibility of supermarkets to South
African producers and suppliers has played a significant role in creating
regional supply chains and increasing capacity for expansion. South Afri-
can companies can use their already established procurement networks in
South Africa to penetrate other urbanizing markets within the region and
continent. Finally, supermarket supply chains achieve major economies
of scale when compared to the long, inefficient, and informal food supply
chain systems that have historically dominated African food markets.
THE SUPERMARKET REVOLUTION AND FOOD SECURITY IN NAMIBIA
35,000
30,000
25,000
20,000
15,000
10,000
5,000
0
Total assets Current assets Non-current assets
ZA
R m
illio
ns

URBAN FOOD SECURITY SERIES NO. 26 29
FIGURE 17: Supermarket Presence in Botswana, South Africa,
Zambia and Zimbabwe
Botswana
Trident
Zambia
PoundStretcher, 4%
Eureka/Walmart,
10%
Sefalana
(Shoppers),
13%
Choppies,
42%
Shoprite, 6%
Pick n Pay, 5%
Spar, 16%
Food Lover’s Market, 1% Game/Walmart,
1%
Woolworths
5%
Melissa, 6%
Choppies, 3%
Woolworths, 3%
Game/Walmart,
3%
Food Lover’s
Market, 3%
Spar, 23%
Pick n Pay,
17%
Shoprite,
38%
South Africa Zimbabwe
Game/Walmart,
3%
Food Lover’s
Woolworths
5%
Choppies,
1%
OK, Zimbabwe,
25%
Food World,
3%
Market, 3% Shoprite, Pick n Pay,
Spar, 23%
34% 32%
Source: das Nair (nd)
Pick n Pay,
31%
Choppies,
12%
Food Lover’s
Market, 3%
Spar, 25%
South African supermarkets have encountered various obstacles in differ-
ent regions of the continent, particularly those further from South Africa.
Dakora et al (2010), for example, found that cross-national systems con-
nectivity, low development levels of local production and supply, labour
disputes, land issues in managing franchisees, complex international sup-
ply chains, import duties, and domestic competition all present challenges
for food retail expansion. They categorize the barriers in supply chain
expansion as “hard” or “soft.” Hard barriers relate to physical infrastruc-
ture and utilities. Roads, railways, ports, airports and electricity are the
main delivery systems for retail companies to get their goods to market,
yet this infrastructure is inadequate in many African economies. Soft bar-
riers comprise the bureaucratic environment of government legislation on
imports and exports, and regional and international bilateral/multilateral
trade and customs agreements. Other soft barriers are land tenure rights
issues, non-uniformity in regulations and market structures for freight/
cargo, protectionist policies of African governments, and different geo-
political climates and dynamics with volatile and fragmented markets
(Dakora et al 2016).

30 AFRICAN FOOD SECURITY URBAN NETWORK (AFSUN)
4.3 Supermarkets in Question
While the proliferation of South African supermarkets throughout the
continent is an indication of food system formalization, the process has
drawn a mixed response due to the effects of procurement practices on
local food supply chains and the labour practices of some supermarkets.
Abrahams (2009) notes efforts to discipline dominant supermarkets and
their exclusionary sourcing practices. For example, in Nigeria, farm-
ers threatened to burn down a South African-owned Shoprite branch
because of the supermarket’s practice of procuring food products from
foreign sources (Abrahams 2009). In Uganda, local authorities encour-
aged farmers to seek government support for what they called “invad-
ing” supermarket supply chains by helping producers meet the quality
and consistency requirements for supplying the supermarket (Abrahams
2009). Furthermore, Shoprite’s alleged practice of procuring 80% of their
products from South Africa led the government of Tanzania to publicly
condemn its practices prior to their selling their assets in the country (Ciuri
2013). Shoprite’s expansion in East Africa has also been thwarted by local
competition. In 2014, Shoprite’s locations in Tanzania were bought by
the growing Kenyan retail giant Nakumatt (Ciuri 2013). In 2015, Naku-
matt announced its intention to buy Shoprite stores in Uganda as well
(Ciuri and Kisembo 2015).
As the internationalization of South African supermarkets stretches across
Africa, and specifically into Namibia, more attention is needed to assess
with evidence the risks and benefits this poses for local food supply chains
and the food security of urban households. Issues that need examination
in Namibia and other countries with a growing supermarket presence
include:
t 5IF TUSVDUVSF PG UIF TVQQMZ DIBJOT PG TVQFSNBSLFUT BOE XIFUIFS MPDBM
producers (including rural smallholders), processors and transporters
are integrated into those chains and, if they are, what types of benefits
they derive. The related question is whether supermarkets source any
of their products from local (Namibian) suppliers and how much they
import from South Africa and who benefits most.
t 5IF SFMBUJPOTIJQ CFUXFFO TVQFSNBSLFUT BOE JOGPSNBM GPPE SFUBJMFST
(and their livelihoods) and whether the growing presence of super-
markets inhibits or stimulates the informal food economy. The infor-
mal food economy has historically played an essential role in the sup-
ply of fresh and perishable food products to the urban poor in African
cities. However, this may be changing. A case study conducted in
Lusaka, Zambia, by Abrahams (2009) showed that informal food
markets present a considerable challenge to the claims that supermar-
kets transform food economies in urban Africa. In South Africa, the
THE SUPERMARKET REVOLUTION AND FOOD SECURITY IN NAMIBIA

URBAN FOOD SECURITY SERIES NO. 26 31
evidence is mixed on whether supermarkets inhibit the development
of informal food entrepreneurship (Crush and Frayne 2011a, Skinner
and Haysom 2017). The relationship between supermarkets and the
informal food retail sector in Namibia is largely unexplored.
t 1SFWJPVT SFTFBSDI JO /BNJCJB IBT IJHIMJHIUFE UIF IJHI MFWFMT PG GPPE
insecurity in Windhoek (Kazembe and Nickanor 2014, Nickanor
2014, Pendleton et al 2014). The growing presence of modern food
retailing in Southern Africa has implications for food environments
and the food security of the urban poor. The process of supermar-
kets initially locating in high-income neighbourhoods means that
accessibility for urban dwellers in poor neighbourhoods is limited by
factors such as distance, means of transportation, and associated mon-
etary costs. Supermarkets in South Africa are attempting to expand
their customer demographics from urban elites to include all urban
consumers. Is this corporate strategy being replicated in other Afri-
can countries, including Namibia, or are supermarkets outside South
Africa still mainly serving middle and higher-income consumers and
neighbourhoods?
t 4VQFSNBSLFUT BSF QPUFOUJBMMZ BCMF UP QSPWJEF TIPQQFST XJUI B EJWFSTF
diet, ranging from more expensive fresh and nutritious food prod-
ucts to less expensive energy-dense, nutrient-poor processed foods. In
Botswana and Zambia, food prices are generally lower in supermar-
kets than in other food outlets, particularly for staples such as maize
flour, bread, milk, rice and sugar. Conversely, while perishable food
products in supermarkets are arguably safer and fresher than those
in informal markets, their cost is often higher (Chidozie et al 2014).
The key question here, given the well-established inverse relationship
between household income and the proportion of income spent on
food, is whether supermarkets make food more affordable and wheth-
er they provide for a more diverse and nutritious diet.
t *O "GSJDBO DJUJFT, PCFTJUZ BOE BTTPDJBUFE /$%T BSF B OFX EJNFO-
sion of food insecurity and a growing public health concern (Hawkes
2008). In South Africa, public health researchers have pointed a finger
at “Big Food” for providing cheap and accessible highly refined fats,
oils, sugars and carbohydrates (Igumbor et al 2011). Diets consist-
ing of high-sugar and high-fat food products are reaching epidemic
proportions and South African supermarkets are being held partially
responsible. The growth in number of supermarkets in Namibia indi-
cates an urgent need to research a possible nutrition transition and the
implications for public health.
t 5IF QPMJDZ JNQMJDBUJPOT PG UIF TQSFBE BOE JODSFBTF JO QPXFS PG TVQFS-
markets are poorly understood and extend across different levels of
governance. Interventions by governments designed to protect local

32 AFRICAN FOOD SECURITY URBAN NETWORK (AFSUN)
producers and manufacturers by, for example, banning the imports
of certain products, imposing import tariffs and setting quotas for
local procurement, can affect supermarket cross-border supply chains.
Similarly, as the South African case suggests, governments may inter-
vene to try to ensure fair competition in the supermarket sector and
between the sector and informal retailers and vendors. This raises the
question of municipal attitudes towards informality and whether they
provide an enabling or hostile environment for informal food vendors.
5. STUDY METHODOLOGY
The research programme for this study was funded by the Open Soci-
ety Foundation for South Africa and conducted by the Department of
Statistics and Population Studies (University of Namibia), in partnership
with the African Food Security Urban Network (AFSUN), the Hungry
Cities Partnership (HCP) and the Balsillie School of International Affairs
(BSIA). The research programme had five main components:
t .BQQJOH PG 'PPE 3FUBJM 0VUMFUT: 5IF TQBUJBM NBQQJOH PG TVQFSNBS-
kets and open markets in Windhoek was undertaken by researchers at
the Department of Statistics and Population Studies at the University
of Namibia. The addresses of outlets were plotted on city maps by
name and address and then reduced to scale using GIS.
t 4VQFSNBSLFU 4VQQMZ $IBJOT: 4FWFSBM TVQFSNBSLFU NBOBHFST XFSF
approached about sharing their product inventories but were not
able to do so. A novel methodology was therefore used to compile
inventories in two supermarkets (a Checkers and a Shoprite). With
the permission of store managers, students used their cellphones to
photograph products on supermarket shelves to record product type,
brand name, quantity and source country. The information on the
photographs was then extracted and recorded on Excel spreadsheets
for analysis. Many products did not show a country of origin. Oth-
ers could be inferred (for example, many fruit and vegetable products
were labelled with the Freshmark brand which signifies import from
South Africa). The primary purpose of this exercise was to under-
stand the relative importance of imported versus locally-produced/
processed foodstuffs and to begin to understand to what extent super-
market supply chains were within country, bilateral (South Africa-
Namibia), regional or international.
t )PVTFIPME 'PPE 4FDVSJUZ BOE 4VQFSNBSLFU 1BUSPOBHF: " UPUBM PG 875
Windhoek households were interviewed using the AFSUN-HCP
Household Food Security Baseline Survey, which collects a wide
THE SUPERMARKET REVOLUTION AND FOOD SECURITY IN NAMIBIA

URBAN FOOD SECURITY SERIES NO. 26 33
range of demographic, economic and food consumption and sourcing
data at the household level. Households surveyed in the 10 constituen-
cies of Windhoek were identified using a two-stage sampling design.
As a first step, primary sampling units (PSUs) were randomly selected
with probability proportional to size. The PSUs were selected from a
master frame developed and demarcated for the 2011 Population and
Housing Census. Within the 10 constituencies, a total of 35 PSUs
were selected covering the whole of Windhoek, and 25 households
were systematically selected in each PSU. The sampled PSUs and
households were located on maps, which were used to target house-
holds for interviews. Table 7 summarizes the number of PSUs identi-
fied in each constituency and the corresponding household and popu-
lation sizes. The survey was implemented using tablet technology.
t *O-%FQUI *OUFSWJFXT: 5IF JOUFSWJFXT XFSF DPOEVDUFE JO UXP QIBTFT.
In the first phase, 36 key informant interviews were conducted. The
constituency councillors where the household survey took place were
asked to provide the names of people from their respective constitu-
encies who were knowledgeable about the socio-economic, poverty,
employment and food security situation in those constituencies. The
selection of the informants was stratified by gender, employment sta-
tus, age and income categories. In the second phase, 20 food vendors
were interviewed. They were chosen to represent a variety of oper-
ating locations, including selling from homes, open markets, major
crossroad intersections and construction sites.
TABLE 7: Household Survey Sample
Constituency
Selected PSU
Sampled
households
per PSU
Population in
the sampled
households
Population
size in the
sampled PSUs
John Pandeni 2 2 x 25 130 559
Katutura Central 2 2 x 25 151 726
Katutura East 2 2 x 25 149 733
Khomasdal 3 3 x 25 247 1,128
Moses Garoeb 6 6 x 25 543 1,648
Samora Machel 5 5 x 25 457 1,682
Tobias Hainyeko 5 5 x 25 372 1,231
Windhoek West 3 3 x 25 254 617
Windhoek East 6 6 x 25 520 1,814
Windhoek Rural 1 1 x 25 78 104
Total 35 875 2,901 10,242

34 AFRICAN FOOD SECURITY URBAN NETWORK (AFSUN)
6. SUPERMARKETS IN NAMIBIA
AND WINDHOEK
6.1 Spatial Distribution of Supermarkets
All major South African supermarket chains have a presence in Namibia,
with Shoprite, Pick n Pay and Spar being particularly prominent. Emon-
gor (2008) used data from Planet Retail to rank the major supermarket
chains in the country (Table 8). Of the nearly 160 supermarkets of which
there is a record (i.e. the figure does not include local independent super-
markets), one-third are owned by Shoprite, followed by Pick n Pay (22%),
Spar (18%) and Woolworths (4%) (Table 9). In Namibia, South African
supermarkets face competition from a long-established local company
with roots dating back to the 19th century. The Woermann Group is a
family company controlled by descendants of early German settlers. It
opened its first Woermann Brock (WB) supermarket in Windhoek in
1966 and now has nearly 30 WB supermarkets throughout the country
(17% of the total). The group also has 13 wholesale Cash & Carry outlets
around the country. Of the South African chains, Shoprite and Spar are
the largest, followed by Pick n Pay, and predominantly sell food products.
Woolworths has a presence but with limited food retailing.
TABLE 8: Top Supermarkets in Namibia, 2005
No. of
stores
Sales area
(m2)
Retail sales
(EUR million)
% food
sales
% non-
food sales
Shoprite 48 46,300 131 72 28
Spar 23 14,000 18 90 10
Woermann Brock 15 - - 90 10
Pick n Pay 9 7,200 28 90 10
Woolworths 5 4,000 9 5 95
Local independent Many 350> - 90 10
Source: Emongor (2009: 51)
Data from current company reports suggests that both Shoprite and Spar
have expanded their national presence in the last decade, but that Pick
n Pay has grown the most (from 9 to 35 supermarkets). The advent of
Massmart/Walmart and Fruit & Veg City is also noted (Table 9). Woer-
mann Brock has experienced significant national growth (from 15 to 27
supermarkets). Windhoek itself, Namibia’s major city and largest con-
sumer market, has approximately 40 supermarkets (or a quarter of all
supermarkets in the country). Of these, 22 (or nearly 60%) are South
African-owned and 40% are Namibian-owned. Woermann Brock has
THE SUPERMARKET REVOLUTION AND FOOD SECURITY IN NAMIBIA

URBAN FOOD SECURITY SERIES NO. 26 35
six supermarkets in the city (16% of the total) and the other 10 (24%) are
individually or family-owned. The Shoprite Group has the largest South
African presence in the city with 12 supermarkets (including two Usaves,
three Shoprites and five Checkers supermarkets). There are also four Spar,
three Pick n Pay and three Fruit & Veg City outlets in the city.
TABLE 9: Number of Supermarkets in Namibia and Windhoek, 2016
Namibia Windhoek
No. % No. %
South African
Shoprite 53 33.5 12 26.7
Pick n Pay 35 22.2 3 6.7
Spar 29 18.4 4 8.9
Woolworths 6 3.8 0 0.0
Massmart/Walmart 4 2.5 0 0.0
Fruit & Veg City 4 2.5 3 6.7
Namibian
Woermann Brock 27 17.1 6 13.4
Other - - 17 37.6
Total 158 100.0 45 100.0
Source: Various company annual reports for 2016
The geography of supermarkets in Windhoek has several distinctive fea-
tures. First, the number of supermarkets varies considerably across the
city with most concentrated in the higher-income areas of Windhoek
East and Windhoek West. As Table 10 shows, 75% of the city’s super-
markets are in these two constituencies. The number of supermarkets
in lower-income areas is much lower and tends to be confined to locally
owned supermarkets (including Woermann Brock) and Shoprite’s Usave
outlets. Other subsidiaries such as Shoprite and Checkers supermarkets
are in higher-income areas of the city, as are competitors such as Pick n
Pay supermarkets. Some Shoprite supermarkets, such as those in Mon-
tecristo and Katutura, are certainly relatively accessible to lower-income
consumers. In general, however, there are no supermarkets in the sprawl-
ing and growing informal settlements to the north of the city. This might
suggest that supermarkets are relatively inaccessible to the urban poor and
that the informal food economy is stronger in these urban spaces. How-
ever, such a conclusion would be premature.
TABLE 10: Location of Supermarkets by Constituency
No. of supermarkets
No. of South African
supermarkets
Poor/severely
poor* %
Windhoek East 18 10 0.0
Windhoek West 12 9 0.0
John Pandeni 1 1 4.3

Katutura East 2 1 4.5
Katutura Central 2 1 8.3
Khomasdal 2 1 14.7
Samora Machel 2 0 37.5
Tobias Hainyeko 5 1 36.1
Moses Garoeb 1 0 77.8
Windhoek Rural 0 0 28.3
Total 45 24 100.0
*Based on 2016 NSA-NHIES poverty indicators
FIGURE 18: Spatial Distribution of Supermarkets in Windhoek
(Government Park)
36 AFRICAN FOOD SECURITY URBAN NETWORK (AFSUN)
THE SUPERMARKET REVOLUTION AND FOOD SECURITY IN NAMIBIA

URBAN FOOD SECURITY SERIES NO. 26 37
6.2 Supermarket Supply Chains
Detailed tracking of supermarket supply chains and analysis of procure-
ment strategies was not possible given the privacy concerns expressed by
supermarket managers. Emongor (2009) and Emongor and Kirsten (2009)
were the first to provide insights into the distinctive nature of supermarket
sourcing in a country in which (a) smallholder farming is largely confined
to the north of the country, and (b) where the main city, Windhoek, is
located in a relatively arid area with no large-scale horticultural produc-
tion in the city-region. Emongor’s (2009) census of the source of products
on supermarket shelves showed the overwhelming domination of South
Africa as a source of fresh food and vegetable products (Table 11). With
regard to processed foods, South Africa was again dominant although all
of the wheat and maize flour, pasta products and processed fresh milk
brands were Namibian. However, with the exception of milk, the pro-
cessing ingredients were mainly imported and processed by Namib Mills.
Other findings (with updates where available) include the following:
t 4PNF 80% PG BMM QSPDFTTFE GPPET TPME JO /BNJCJB BSF JNQPSUFE GSPN
South Africa. The food and beverages processing sector in Namibia
consists of three downstream sectors, namely meat processing con-
tributing less than 10% to total manufacturing GDP, fish processing
contributing 10-15% to total manufacturing GDP, and the manu-
facture of other foods and beverages contributing around half of total
manufacturing GDP. There was only one dairy processor in Namibia,
Namibia Dairies, and one milling company, Namib Mills. The food
processing sector is therefore relatively small and although its products
are found in Windhoek supermarkets, local production is insufficient
to meet demand. At the same time, protectionist regulations mean
that supermarkets procure most of their fresh milk from Namibia
Diaries and their milled flour and pasta products from Namib Mills.
Other dairy products, such as cheese and yoghurt, are imported from
South Africa. According to Emongor (2008), there is a ban on the
import of flour to Namibia so Namib Mills has a monopoly on the
importation and processing of wheat and maize to flour.
t &NPOHPS (2009) FTUJNBUFT UIBU 82% PG GSFTI GSVJU BOE WFHFUBCMFT
come from South Africa and only 18% from Namibia. The imports
come from South Africa through supply chains organized by sub-
sidiaries such as Freshmark Namibia, Shoprite’s fruit and vegetable
procurement and distribution arm, and FreshCo (the Pick n Pay
equivalent). Supermarkets are, however, required to source a certain
percentage of their fresh produce from local farmers. According to
Emongor (2009), Pick n Pay’s FreshCo makes up this quota by sourc-
ing from a single large-scale farmer in Okahandja. None of the Shop-

38 AFRICAN FOOD SECURITY URBAN NETWORK (AFSUN)
rite outlets buy directly from farmers in Namibia. FreshMark obtains
some produce locally but mainly from large-scale farmers including
watermelons from a farm at Etunda and tomatoes from two farms at
Tsumeb. Fruit & Veg City procures cabbage, watermelons, pump-
kins and tomatoes from two large farms in North Ruaka. Lettuce,
cabbage and green peppers are also sourced from irrigated farms in
Hardap and Okahandja. About 30% of vegetables are sourced locally,
with the rest coming from fresh produce markets in Cape Town and
Johannesburg (Emongor 2009). In a new venture started in 2014,
Pick n Pay has been sourcing vegetables from an irrigated commercial
farm at Otavifontein in the north of the country. These include cab-
bage, spinach, pumpkin, butternuts, potatoes, green peppers, broccoli
and cauliflower (PnP 2017). The challenge of meeting quotas from
local producers has led to charges that supermarkets are mislabelling
products. In 2014, for example, the Namibian Standards Institution
launched an inquiry into mislabelling practices by Freshmark, Shop-
rite and Checkers which were allegedly representing South African
products as locally grown and produced (Kaira and Haidula 2014).
t 4PNF MBSHF-TDBMF GBSNFST JO /BNJCJB XIP QSPEVDF IPSUJDVMUVSBM QSPE-
ucts such as onions and tomatoes under rain-fed conditions or limited
irrigation opt to transport their produce to fresh produce markets in
Johannesburg or Cape Town in South Africa, over 1,000km away.
The farmers prefer these markets because they are easily accessible and
farmers can sell large amounts of produce, reducing transaction and
transportation costs (Emongor 2009: 50).
t 'FX TNBMM-TDBMF GBSNFST BSF JOUFHSBUFE JOUP TVQQMZ DIBJOT. &NPOHPS
(2009) notes that apart from high transport costs, small-scale farm-
ers are mainly involved in subsistence farming. Another constraint
is inconsistent production implying that farmers cannot meet the
year-round supply requirements. According to Freshmark Namibia,
most small-scale producers are not able to meet the private grades and
standards Freshmark demands. Lack of traceability and high trans-
action costs are some of the factors that contribute to Freshmark
Namibia not procuring directly from small-scale farmers (Emongor
2009). According to the study, small-scale farmers are “automatically
excluded” from the Shoprite supply chain in Namibia.
t .PTU PG UIF SFE NFBU TPME JO TVQFSNBSLFUT JO 8JOEIPFL DPNFT GSPN
within the country with supply chains that connect supermarkets
with large-scale commercial ranching operations via MeatCo, the
largest abattoir in the country. The commercial cattle farming area
covers 14.5 million hectares in the northern half of the country. Cattle
farming contributes 2-4% of Namibia’s GDP and is practised by an
estimated 2,250 farmers, with a combined average annual herd of
THE SUPERMARKET REVOLUTION AND FOOD SECURITY IN NAMIBIA

URBAN FOOD SECURITY SERIES NO. 26 39
840,000. The total cattle herd is closer to 3 million as cattle are also
raised by small farmers (Figure 19). Recent studies have highlighted
the barriers facing small-scale cattle farmers from accessing formal
markets (Thomas et al 2014, Kalundu and Meyer 2017). Around
300,000 cattle are marketed on average each year, roughly half as
live cattle (almost exclusively as weaners) and half as beef. Almost all
weaners are exported as live cattle to feed lots in South Africa. Around
55,000 tonnes of beef are produced per year and primarily sold to
South African (45%) and international markets (40%) with around
15% consumed domestically (Figure 20) (Olbrich et al 2014: 4). In
2010, meat imports totalled 40,000 tonnes of which three-quarters
were chicken (with the main sources being South Africa, Argentina,
the US, Denmark and Brazil). The chicken industry in Namibia has
increased dramatically since 2013 with the opening of a chicken meat
production plant by Namib Poultry and an increase in small-scale
chicken producers around the country (Figure 19) (Andjamba 2017).
TABLE 11: Source of Supermarket Products, 2008
Products Source % of brands on shelves
Processed
Frozen vegetables South Africa 100
Fruit juices South Africa 100
Canned vegetables South Africa 100
Canned fruit South Africa 100
Processed milk (UHT) South Africa 100
Tomato sauces South Africa/International 90/10
Wheat and maize flour Namibia 100
Pasta products Namibia 100
Processed fresh milk Namibia 100
Fresh vegetables
Carrots South Africa 100
Irish potatoes South Africa 100
Cabbages South Africa 100
Onions South Africa 100
Leafy vegetables South Africa/Namibia 90/10
Tomatoes South Africa/Namibia 90/10
Fresh fruit
Apples South Africa 100
Oranges South Africa 100
Bananas South Africa 100
Mangoes South Africa 100
Source: Emongor (2009)

40 AFRICAN FOOD SECURITY URBAN NETWORK (AFSUN)
FIGURE 19: Livestock Population in Namibia, 2009-2015
3,500,000
3,000,000
2,500,000
2,000,000
1,500,000
1,000,000
500,000
0
Source: Andjamba (2017: 21)
FIGURE 20: Beef Production, Trade and Consumption in Namibia,
2007-2012
50,000
45,000
40,000
35,000
30,000
25,000
20,000
15,000
10,000
5,000
0
Source: Andjamba (2017: 24)
Year
Production Imports Exports Consumption
Ijuma et al (2015) argue that the rise in consumption of processed food
in East and Southern Africa has been “deep”, accounting for nearly 70%
of purchased food. Their analysis of the processed food sector in Tanza-
nia found that local and regional food processing was very competitive
with imports from outside East Africa and was characterized by the rise
of a few medium and large processors and “a surge of many micro and
small firms” producing branded but largely undifferentiated meal and
flour. They found that of 953 products, 564 (59%) were manufactured
within Tanzania, 113 (12%) were from neighbouring countries (Kenya
and Uganda) and 256 (29%) were sourced internationally. This study,
the only one of its kind in Africa, provides a baseline for comparison with
the product data collected at two Shoprite-owned supermarkets in Wind-
hoek.
THE SUPERMARKET REVOLUTION AND FOOD SECURITY IN NAMIBIA
Nu
mb
er
of
live
sto
ck
Qu
an
tity
in
to
nn
es

URBAN FOOD SECURITY SERIES NO. 26 41
In sharp contrast to Tanzania, where 59% of processed products are
manufactured in the country, in the Windhoek study of Shoprite outlets,
only 25% of products were manufactured in-country and 8% were from
outside Africa. This means that 67% of products were manufactured in
South Africa and imported. There are only three product categories –
cereals and cereal products, dairy products and processed meat – where
there are more local than imported products in Windhoek. In all other
categories, there are more imported than locally produced products. As
Table 12 suggests, Shoprite’s supply chains for processed foods are domi-
nated by imports from South Africa. As many as two-thirds of the pro-
cessed products come from South Africa and that country has an almost
complete monopoly on canned food, sauces, spreads, desserts and frozen
foods. Its high number of cereal products is related to its domination of
the supply of breakfast cereals. It also has a commanding presence in the
soft drinks (including fruit juices and pop), condiments (including tea
and coffee) and snacks categories. What is perhaps surprising is how little
sourcing Shoprite appears to do within the region (with canned pine-
apples from Swaziland and orange juice concentrate from Zimbabwe the
only recorded products). Equally, Europe and Asia are only sources for
certain specialized foods. Thailand is the main source of rice. One oddity
is that Thai rice is imported directly into the country by Namib Mills
and also comes in via South African manufacturers. Packaged rice from
both sources can be found on the same supermarket shelves. Many of the
European and Asian products may also be imported via South Africa. The
only US product of the 642 sold is tabasco sauce.
TABLE 12: Source of Processed Foods in Checkers and Shoprite,
Windhoek
Product category
Total
no. of
prod-
ucts
Nam-
ibia
South
Africa
Other
SADC
Europe
Asia
Other
Cereals incl. foods
from cereals 136 68 51 0 6 11 1
Soft drinks 112 19 92 1 0 0 0
Snacks 108 30 71 0 3 3 1
Canned food 79 3 54 1 15 4 2
Sauces 43 0 39 0 0 4 0
Condiments 41 6 33 0 0 2 0
Spreads 31 0 23 0 4 2 2
Dairy 29 22 7 0 0 0 0
Desserts 24 0 24 0 0 0 0
Frozen foods 23 0 23 0 0 0 0
Meats 16 13 3 0 0 0 0
Total 642 161 419 2 28 26 6
% 100.0 25.1 65.3 0.3 4.4 4.0 0.9

42 AFRICAN FOOD SECURITY URBAN NETWORK (AFSUN)
7. POVERTY AND FOOD
INSECURITY IN WINDHOEK
7.1 The Geography of Poverty
According to the 2016 poverty indicators of the Namibia Statistics
Agency’s Namibia Household Income and Expenditure Survey (NSA-
NHIES), households that spent less than NAD520.80 per month on basic
necessities were classified as poor (the upper bound poverty line or UBPL)
and those that spent less than NAD389.30 per month were considered
severely poor (the lower bound poverty line or LBPL). Using the net
household income survey data for the month preceding the survey, and
the NSA-NHIES poverty lines, we calculated that 13% of the surveyed
households were poor and 9% were severely poor (Table 13). However,
about one-fifth (21%) of households in informal settlements were severely
poor, while close to one-third (29%) were classified as poor. Severe pov-
erty tended to increase with household size (with the exception of house-
holds with six or more members), while poverty levels decreased with
increasing size. This may be because in poor households the probability
of having more than one adult earner increases with size, while in severely
poor households a single income may have to support more people. Levels
of poverty and severe poverty were highest in female-centred households.
According to the National Planning Commission (NPC nd: 33), within
Windhoek severe poverty is found in the Tobias Hainyeko, Moses Garoeb
and Windhoek Rural constituencies and increased in all constituencies
between 2001 and 2011, except in Windhoek East and Windhoek West
(Figure 21).
In terms of the spatial distribution of income poverty, the survey showed
that Moses Garoeb had the highest levels of both poor (35% of the total)
and severely poor (43% of the total) households (Table 14). By contrast,
the higher-income areas of Windhoek West and Windhoek East did not
have any poor or severely poor households.
THE SUPERMARKET REVOLUTION AND FOOD SECURITY IN NAMIBIA

URBAN FOOD SECURITY SERIES NO. 26 43
FIGURE 21: Change in Poverty Headcount Rate, 2001-2011
Source: NPC (nd: 33)
TABLE 13: Income Poverty Levels and Household Characteristics
% of total
households
Income poverty
Severely poor Poor
Housing
Formal 44.1 0.7 2.6
Informal 55.9 20.6 28.6
Household size
1 member 8.8 8.8 17.6
2-3 members 29.8 17.7 23.7
4-5 members 31.9 11.1 14.1
6 or more members 29.5 9.0 14.0
Household structure
Female-centred 32.4 15.0 22.1
Male-centred 18.9 11.0 14.2
Nuclear 23.6 14.7 20.0
Extended 23.1 5.6 8.8
Windhoek Rural
-3.60
Moses Garoeb
7.0
Tobias Hainyeko
4.8
Wanaheda -0.80
Soweto Katutura East
0.90 -0.40
Katutura Central
-2.20
Khomasdal North
0.70
Windhoek West
-0.20
Windhoek East
-0.10

TABLE 14: Income Poverty Levels by Constituency
Severely poor % Poor %
Moses Garoeb 43.0 34.8
Tobias Hainyeko 16.5 19.6
Windhoek Rural 13.9 14.3
Samora Machel 12.7 13.4
Khomasdal 7.6 7.1
Katutura Central 3.8 4.5
John Pandeni 2.5 1.8
Windhoek East 0.0 0.0
Katutura East 0.0 4.5
Windhoek West 0.0 0.0
Total 100.0 100.0
The survey also collected data on the lived poverty index (LPI), a com-
monly used barometer of quality of life that measures the subjective
experience of poverty (Meyer and Keyser 2016). The LPI is derived from
answers to a set of questions on how often the household has gone with-
out certain basic households items in the previous year. These include
food, medical attention, cooking fuel and a cash income. The responses
are on a Likert scale of five points: never; just once or twice; several times;
many times; and always. From the Likert scale, a mean LPI score is com-
puted for each item: a mean score closer to 0 indicates fewer households
‘going without’, while a score closer to 4 suggests more households ‘going
without’.
The mean score for the entire sample was 1.78. Eighteen percent of
households had an LPI of 2.01-3.00; and 5% a score of 3.01-4.00. As
with income poverty, there were striking differences in LPI scores within
Windhoek, with households in Windhoek East, Windhoek West and
John Pandeni constituencies having 100% or close to 100% of households
lacking no basic household needs (LPI of 1.00 or below). Comparatively,
in Tobias Hainyeko, Katutura East, Moses Garoeb and Samora Machel
constituencies, only about 30%-50% of the households had an LPI of
1.00 or less. In these areas, Katutura East had the highest percentage
(16%) with LPI scores of 3.01-4.00, compared to Samora Machel (7%),
Tobias Hainyeko (5%) and Moses Garoeb (4%).
44 AFRICAN FOOD SECURITY URBAN NETWORK (AFSUN)
THE SUPERMARKET REVOLUTION AND FOOD SECURITY IN NAMIBIA

URBAN FOOD SECURITY SERIES NO. 26 45
FIGURE 22: Lived Poverty Index by Constituency
Windhoek East
Windhoek West
John Pandeni
Khomasdal
Katutura Central
Windhoek Rural
Samora Machel
Moses //Garoeb
Katutura East
Tobias Hainyeko
Lived Poverty Index Categories <=1.00 Lived Poverty Index Categories 1.01–2.00
Lived Poverty Index Categories 2.01–3.00 Lived Poverty Index Categories 3.01+
7.2 Levels of Food Insecurity in Windhoek
There is a vigorous international debate about how best to quantify lev-
els of food insecurity in a population (Coates 2013). The AFSUN-HCP
Household Food Security Baseline Survey uses four measures of food
security developed and recommended by the Food and Nutrition Tech-
nical Assistance (FANTA) project. In this report we use three of these
measures to assess the prevalence of food insecurity in Windhoek: (a) the
Household Food Insecurity Access Score (HFIAS), a continuous score
between 0 (completely food secure) and 27 (completely food insecure)
based on nine frequency of occurrence questions; (b) the HFIAS frequen-
cy of occurrence questions are grouped into four categories (food secure,
mildly food secure, moderately food insecure and severely food insecure)
as the Household Food Insecurity Access Prevalence (HFIAP) classifica-
tion; and (c) the Household Dietary Diversity Score (HDDS) which cap-
tures the household diet profile in the previous 24 hours in terms of the
number of food groups (from 0 to 12) from which foods were consumed.

46 AFRICAN FOOD SECURITY URBAN NETWORK (AFSUN)
The HFIAP shows that food insecurity varies both with type of hous-
ing and location in the city. More than 90% of households in informal
housing structures are food insecure (Table 15). In most constituencies,
there are many more food insecure than food secure households. In the
low-income areas of the city with a high concentration of informal hous-
ing, over 80% of households are food insecure. Only Windhoek East con-
stituency has more food secure than food insecure households, although
48% of surveyed households in Windhoek West were food secure. In all
the other constituencies, over 75% of households classify as food insecure.
TABLE 15: Food Insecurity Prevalence by Housing Type and
Location
Food secure % Food insecure %
Housing
Formal 27.6 72.4
Informal 8.0 92.0
Constituency
Windhoek East 72.7 27.3
Windhoek West 47.7 52.3
Katutura East 21.3 78.7
John Pandeni 16.9 83.1
Samora Machel 16.1 83.9
Khomasdal 14.0 86.0
Tobias Hainyeko 11.1 88.9
Moses Garoeb 10.8 89.2
Katutura Central 9.6 90.4
Windhoek Rural 8.1 91.9
The Household Dietary Diversity Score measures another aspect of food
security, i.e. the quality of the household diet. A low score (out of 12)
means a narrow and monotonous diet, whereas a high score indicates
a more diverse and healthier pattern of food consumption. The mean
HDDS for all surveyed households was an extremely low 3.21 (out of 12).
This indicates that most households had consumed food from fewer than
four food groups in the previous 24 hours. Figure 23 shows that there is a
strong association between lived poverty and dietary diversity. As the LPI
score increases, dietary diversity decreases. Households with an LPI over
2.0 had a mean HDDS of less than 2, while those with a lower LPI had a
higher HDDS.
A lack of diversity in the diet was closely related to the level of household
food security (as measured by the HFIAP). Food insecure households had
a mean HDDS of 2.95 while food secure households had a mean HDDS
THE SUPERMARKET REVOLUTION AND FOOD SECURITY IN NAMIBIA

URBAN FOOD SECURITY SERIES NO. 26 47
of 4.47. Additional insights are gained by cross-tabulating the HDDS and
HFIAP by type of housing (Table 16). Households in formal housing had
a more diverse diet than those in informal housing (3.88 versus 2.66).
Households in formal areas had higher HDDS scores than those in infor-
mal areas in both food secure (4.72 versus 3.78) and food insecure (3.56
versus 2.56) households. Further, food secure households in informal
areas had a higher HDDS than food insecure households in formal areas
(3.78 versus 3.56).
FIGURE 23: Household Dietary Diversity and Lived Poverty
3.01+
2.01-3.00
1.01-2.00
<=1.00
0 0.5 1 1.5 2 2.5 3 3.5 4 4.5
Mean HDDS
TABLE 16: Dietary Diversity by Food Insecurity and Type of Housing
Food insecurity
prevalence Housing type Mean No.
Food secure
Formal housing 4.72 103
Informal housing 3.78 37
Total 4.47 140
Food insecure
Formal housing 3.56 268
Informal housing 2.56 433
Total 2.95 701
Total
Formal housing 3.88 371
Informal housing 2.66 470
Total 3.20 841
Another way of looking at consumption patterns is the raw data on food
group choice. Virtually all households consumed products from Food
Group No. 1 (cereals) (Table 17). The second most commonly consumed
were foodstuffs from No. 5 (meat and meat products), consumed by near-
ly 50% of households, followed by No. 11 (sugar) by around a third of
households. Around 30% of households consumed oil products (mainly
cooking oil) but only 20% consumed vegetables and fish. Dairy products
were consumed by less than 15% and fruit by less than 10%.
Liv
ed
Po
ve
rty I
nd
ex c
ate
go
rie
s

TABLE 17: Level of Household Consumption from Each Food Group
Food group % of households Types of food
1
95.0
Pasta, bread, rice noodles, biscuits or any other
foods made from flour, millet, sorghum, maize, rice,
wheat or oats
2 11.7 Potatoes, sweet potatoes, beetroots, carrots or any
other foods made from these
3 20.2 Other vegetables
4 5.6 Fruits
5
48.5
Beef, pork, lamb, goat, rabbit, wild game, chicken,
duck, other birds, chicken heads and feet, liver, kid-
ney, heart, or other organ meats/offal or products
6 5.2 Eggs
7 21.1 Fresh or dried fish or shellfish
8 5.9 Foods made from beans, peas, lentils, or nuts
9 14.2 Cheese, yoghurt, milk or other milk/dairy products
10 29.7 Foods made with oil, fat or butter
11 34.3 Sugar or honey
12 26.7 Other foods such as condiments, coffee, tea
An analysis of the distribution of types of food consumed by food secu-
rity status shows one major similarity and several important differences in
dietary composition (Table 18):
t 'PS FWFSZ GPPE HSPVQ (XJUI UXP FYDFQUJPOT o l BOE 7) UIF QSPQPSUJPO
of food secure households is higher than for food insecure households;
t 5IF WBTU NBKPSJUZ PG CPUI GPPE TFDVSF BOE GPPE JOTFDVSF IPVTFIPMET
consume cereals on a daily basis (over 95%);
t 'PPE TFDVSF IPVTFIPMET BSF NPSF MJLFMZ UP DPOTVNF NFBU, EBJSZ QSPE-
ucts, and potatoes and other tubers. The difference in vegetable con-
sumption is not significant (consumed by 27% of food secure and
21% of food insecure households);
t "MUIPVHI NPSF GPPE TFDVSF IPVTFIPMET DPOTVNF GSVJU, UIF PWFSBMM
proportion is still low (15% versus 4%);
t 5IF POMZ GPPE HSPVQ GSPN XIJDI TJHOJGJDBOUMZ NPSF GPPE JOTFDVSF
households consumed food was fish (23% versus 13%) which suggests
that, for some, fish is a cheaper alternative to meat.
48 AFRICAN FOOD SECURITY URBAN NETWORK (AFSUN)
THE SUPERMARKET REVOLUTION AND FOOD SECURITY IN NAMIBIA

TABLE 18: Type of Foods Consumed by Level of Household Food
Security
Food group
% of food
secure
households
% of food
insecure
households
1
Pasta, bread, rice noodles, biscuits or any other
foods made from flour, millet, sorghum, maize, rice,
wheat or oats
94.9
97.3
2 Potatoes, sweet potatoes, beetroots, carrots or any
other foods made from these 25.5 8.9
3 Other vegetables 27.0 20.1
4 Fruits 14.6 4.2
5
Beef, pork, lamb, goat, rabbit, wild game, chicken,
duck, other birds, chicken heads and feet, liver, kid-
ney, heart, or other organ meats/offal or products
78.8
45.6
6 Eggs 12.4 4.0
7 Fresh or dried fish or shellfish 13.1 23.3
8 Foods made from beans, peas, lentils or nuts 8.8 5.6
9 Cheese, yoghurt, milk, or other milk/dairy products 26.3 12.8
10 Foods made with oil, fat or butter 54.0 25.5
11 Sugar or honey 55.5 30.8
12 Other foods such as condiments, coffee, tea 49.6 23.4
7.3 Household Expenditure on Food
In order to assess the food purchasing patterns of households in Wind-
hoek, it is necessary to understand how much household income is spent
on food. As a whole, the surveyed households spent 21% of their income
on food and groceries (with a mean figure of NAD1,033) in the month
prior to the survey. The next highest expense category was transporta-
tion, followed by telecommunications and then housing (Table 19). The
proportion of households spending income on particular items was high-
est for food and groceries (at 95%), followed by public utilities (60%),
transportation (51%), telecommunications (35%), fuel (31%) and hous-
ing (26%). Average expenditure on housing, household goods, educa-
tion, insurance and debt repayments exceeded the average amount spent
on food.
URBAN FOOD SECURITY SERIES NO. 26 49

TABLE 19: Patterns of Household Expenditure in Windhoek
% of total
expenditures
% of
households
Mean monthly ex-
penditures (NAD)
Food and groceries 21.3 95.3 1,033.45
Housing 5.9 26.3 2,667.87
Clothing 3.5 15.7 974.83
Transportation 11.4 51.1 738.49
Telecommunications 7.7 34.6 221.45
Household furniture,
tools and appliances 2.5 11.3 1,562.14
Medical care 4.2 18.7 846.61
Education 4.5 19.9 1,141.78
Entertainment 1.5 6.5 878.73
Insurance 2.2 10.0 1,570.28
Debt repayments 1.4 6.1 1,750.26
Donations, gifts 2.8 12.5 968.12
Public utilities (water,
electricity, sanitation) 13.4 60.1 864.37
Informal utilities (water,
electricity, sanitation) 2.7 12.0 358.99
Fuel 7.3 31.4 200.67
Cash remittances to
rural areas 4.1 17.9 1,022.18
Savings 3.4 15.1 3,875.77
Other monthly expenses 0.2 1.0 2,944.56
Total 100.0 6,234.17
As a general rule, the poorer the household, the greater the proportion
of total income a household spends. This is confirmed in Windhoek by
Table 20, which shows the relationship between household expenditure
and income levels in Windhoek. The proportion of household income
spent on food and groceries varies from 15% for those in the high-
est income quintile to 32% for those in the lowest income quintile. As
income increases, so the percentage of income spent on food consistently
declines. A similar pattern was observed for public utilities and fuel (with
low-income households spending a greater proportion of their income
than higher income households). The opposite is true for many other cat-
egories of expenditure including housing, clothing, transportation, tele-
communications, entertainment and insurance.
There is a direct relationship between food expenditure and lived pov-
erty. The poorer the household on the LPI scale, the greater the propor-
tion of income spent on food. Households with an LPI score of less than
1.00 spend about 19% compared to households with an LPI score of 3.00
at more than 30%. The proportion of household income spent on food
50 AFRICAN FOOD SECURITY URBAN NETWORK (AFSUN)
THE SUPERMARKET REVOLUTION AND FOOD SECURITY IN NAMIBIA

URBAN FOOD SECURITY SERIES NO. 26 51
also varies with other household characteristics (Table 21). For example,
food insecure households spend 22% of household income on food and
groceries while food secure households spend 18%. Households in infor-
mal structures tend to spend more on food than those in formal hous-
ing (25% versus 19%). Smaller households spend a greater proportion of
their income on food than larger households. Female-centred households
spend a greater proportion (24%) than other household types.
TABLE 20: Household Expenditure by Income Quintiles
Income quintile
I II III IV V
Food and groceries 32.2 27.0 24.5 20.4 15.0
Housing 2.5 5.4 7.3 7.0 7.3
Clothing 1.9 1.4 2.2 4.4 5.7
Transportation 9.8 9.6 11.4 13.2 12.6
Telecommunications 5.5 6.4 7.7 7.4 9.5
Household furniture, tools and appliances 0.8 1.8 2.7 2.7 3.8
Medical care 3.0 3.4 2.9 3.0 4.6
Education 2.5 4.4 3.6 3.7 5.0
Entertainment 0.0 1.0 0.0 1.2 3.1
Insurance 0.5 0.4 0.5 0.5 3.4
Debt repayments 0.5 0.8 1.5 0.8 1.8
Donations, gifts 1.4 2.0 2.7 1.8 2.7
Public utilities (water, electricity, sanitation) 17.2 18.4 16.2 11.7 11.2
Informal utilities (water, electricity, sanitation) 4.1 3.2 2.9 2.8 1.1
Fuel 15.3 10.6 7.5 6.9 2.3
Cash remittances to rural areas 1.6 2.8 4.4 6.4 5.5
Savings 1.1 1.4 2.2 6.0 5.3
Other monthly expenses 0.5 0.0 0.0 0.3 0.6

TABLE 21: Proportion of Income Spent on Food by Household
Characteristics
Household characteristics % of income
Food security Food secure 17.6
Food insecure 22.3
Housing type Formal 18.6
Informal 24.6
Household size
1 member 24.9
2-3 members 24.0
4-5 members 19.7
6 or more members 20.0
Household structure
Female-centred 23.6
Male-centred 23.4
Nuclear 20.6
Extended 18.4
Lived Poverty Index
<=1.00 19.0
1.01-2.00 26.6
2.01-3.00 28.9
3.01-4.00 30.3
8. SUPERMARKET PATRONAGE
IN WINDHOEK
8.1 Main Sources of Food
Households in Windhoek obtain food predominantly by purchasing it.
Less than 15% of surveyed households obtain food directly from rural
areas, less than 5% are involved in urban agriculture and fewer than 3%
access food through formal and informal social protection channels (such
as sharing, borrowing, community kitchens, food banks etc.). The vast
majority of surveyed households rely on food purchase from three main
sources: supermarkets, open markets and street vendors. Other food pur-
chase sources include spazas/tuck shops, small shops and fast food/take
away outlets. Figure 24 clearly shows the market dominance of super-
markets. Over 90% of surveyed households across the city purchase food
at supermarkets, far higher than any other food source. Food insecure
households are almost as likely as food secure households to patronize
supermarkets (96% versus 99%). Food insecure households are more
likely to obtain food from open markets (54% versus 28%) and street
vendors (31% versus 20%). Food secure households are marginally more
likely to patronize spazas/tuck shops (22% versus 18%) and significantly
52 AFRICAN FOOD SECURITY URBAN NETWORK (AFSUN)
THE SUPERMARKET REVOLUTION AND FOOD SECURITY IN NAMIBIA

URBAN FOOD SECURITY SERIES NO. 26 53
more likely to consume fast food (28% versus 5%) and patronize restau-
rants (18% versus 3%).
The dominance of supermarkets is replicated irrespective of whether a
household is in formal or informal housing. Over 90% of households in
both types purchase food from supermarkets (Figure 25). Households in
informal areas are more likely to patronize open markets but, contrary
to expectations, less likely to buy food from spazas/tuck shops and street
vendors than those in formal housing.
FIGURE 24: Food Sources by Level of Household Food Security
Begging
Food provided to children at school/creche
Food provided at work
Borrow food from others
Community food kitchen (e.g. soup kitchen)
Food provided by neighbours and/or others
Shared meal with neighbours and/or others
Food sent by relatives in other towns/cities
Food sent by relatives in rural areas
Household grows it in urban areas
Household grows it in rural areas
Livestock owned by household
Street seller/trader/hawker
Commercial farm outside city
Spaza/tuck shop
Open market
Restaurant
Fast food/take away
Small shop
Supermarket
0
20 40 60 80
Percentage of households
100
Food insecure Food secure

54 AFRICAN FOOD SECURITY URBAN NETWORK (AFSUN)
FIGURE 25: Food Sources by Type of Housing
Begging
Food provided to children at school/creche
Food provided at work
Borrow food from others
Community food kitchen (e.g. soup kitchen)
Food provided by neighbours and/or others
Shared meal with neighbours and/or others
Food sent by relatives in other towns/cities
Food sent by relatives in rural areas
Household grows it in urban areas
Household grows it in rural areas
Livestock owned by household
Street seller/trader/hawker
Commercial farm outside city
Spaza/tuck shop
Open market
Restaurant
Fast food/take away
Small shop
Supermarket
0 20 40 60 80 Percentage of households
100
Informal Formal
8.2 Frequency of Food Purchase
This section takes the analysis of food sourcing patterns a step further to
examine how frequently households purchase food and whether there are
differences in the frequency of patronage of different types of retail outlet.
In general, 16% of surveyed households purchase food on a daily basis
(at least five days per week), 30% do so at least once per week and 38%
at least once per month. Figure 26 shows that purchasing behaviour dif-
fers between households in formal and informal housing areas. In general,
households in more formal housing tend to buy food more frequently
than those in informal areas. On the other hand, households in informal
housing are more likely to purchase food on a monthly basis.
The next question is whether households purchase food more often at
some outlets than others and, in particular, how often they go to the
supermarket (Table 22). Of the 97% of households that shop at supermar-
kets, two-thirds do so monthly. Another 17% shop at supermarkets on
a weekly basis and only 5% are daily shoppers. The patronage pattern is
very different for both spazas/tuck shops and street vendors. Around half of
those who purchase food from these outlets do so on a daily basis, another
THE SUPERMARKET REVOLUTION AND FOOD SECURITY IN NAMIBIA
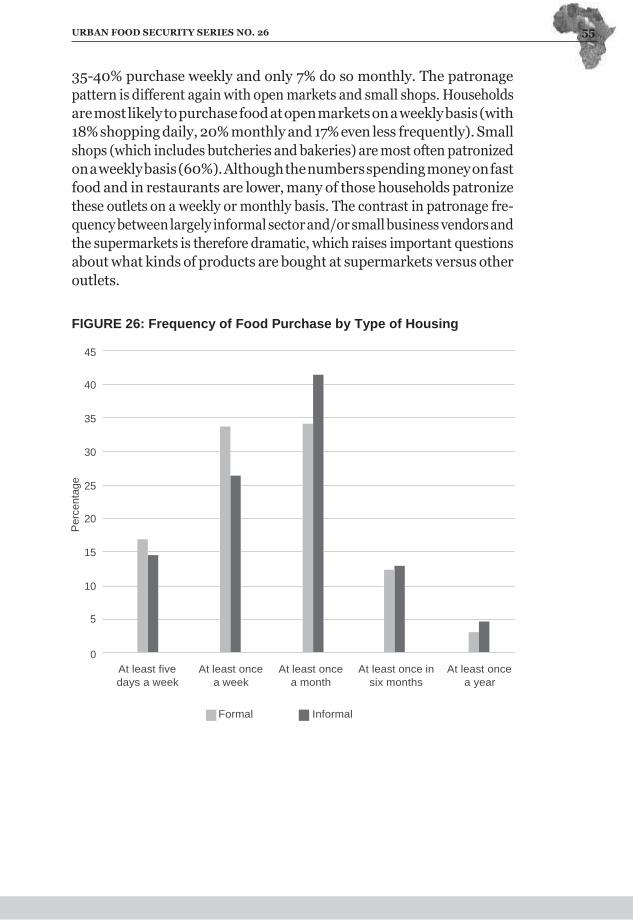
10,0
URBAN FOOD SECURITY SERIES NO. 26 55
35-40% purchase weekly and only 7% do so monthly. The patronage
pattern is different again with open markets and small shops. Households
are most likely to purchase food at open markets on a weekly basis (with
18% shopping daily, 20% monthly and 17% even less frequently). Small
shops (which includes butcheries and bakeries) are most often patronized
on a weekly basis (60%). Although the numbers spending money on fast
food and in restaurants are lower, many of those households patronize
these outlets on a weekly or monthly basis. The contrast in patronage fre-
quency between largely informal sector and/or small business vendors and
the supermarkets is therefore dramatic, which raises important questions
about what kinds of products are bought at supermarkets versus other
outlets.
FIGURE 26: Frequency of Food Purchase by Type of Housing
45
40
35
30
25
20
15
10
5
0
At least once
a week
At least once
a month
At least once in
six months
At least once
a year
Formal Informal
At least five
days a week
Perc
enta
ge

TABLE 22: Frequency of Sourcing Food from Different Outlets
% of
house-
holds
Frequency of purchase from the source (%)
At least
five days
per week
At least
once per
week
At least
once per
month
At least
once
in six
months
At least
once per
year
Supermarket 96.5 4.5 16.5 65.7 12.4 0.8
Small shop 18.6 11.9 60.0 22.5 5.6 0.0
Fast food/
take away 15.5 5.1 39.4 48.5 4.8 2.3
Restaurant 5.8 8.2 49.0 36.7 4.1 2.0
Open market 49.8 17.6 46.2 19.5 16.2 0.5
Spaza/tuck
shop 19.4 50.9 41.2 7.3 0.6 0.0
Street seller/
trader/hawker 29.2 49.8 33.7 6.8 9.6 0.0
8.3 Supermarket Domination of Food Purchasing
The survey used the Hungry Cities Food Purchases Matrix (HCFPM)
(Crush and McCordic 2017), which captures how many households pur-
chase a range of common food items and where they get them from. The
first column in Table 23 shows the proportion of households that pur-
chase each food item on a regular basis. The most striking findings are as
follows:
t 0WFS 50% PG IPVTFIPMET QVSDIBTF BMM TUBQMFT, XJUI NBJ[F NFBM UIF
most popular (76%), followed by bread (57%) and rice and pasta
(around 50%);
t -FTT UIBO IBMG PG UIF IPVTFIPMET QVSDIBTF GSFTI QSPEVDUT, BMUIPVHI
meat is the most popular (42%), followed by fish (33%) and vegetables
(31%). Only a quarter of households buy fruit and milk;
t 'SFTI DIJDLFO NFBU JT CPVHIU CZ POMZ 9% PG IPVTFIPMET, XIJMF GSP[FO
(imported) chicken is more popular at 29%. Frozen meat and fish are
not popular;
t $PPLFE GPPE JT OPU QVSDIBTFE CZ NBOZ IPVTFIPMET, XJUI MFTT UIBO
10% buying a variety of common street foods;
t 1SPDFTTFE GPPET TIPX DPOTJEFSBCMF DPOTVNQUJPO WBSJBUJPO XJUI TPNF,
such as cooking oil (76%), sugar (65%) and tea/coffee (46%) very
popular. Canned foods are purchased by less than 10% of households;
and
t 5IF QSPQPSUJPO PG IPVTFIPMET CVZJOH iKVOLw GPPET JT OPU FTQFDJBMMZ
high, although a quarter do buy sugary cooldrinks.
56 AFRICAN FOOD SECURITY URBAN NETWORK (AFSUN)
THE SUPERMARKET REVOLUTION AND FOOD SECURITY IN NAMIBIA

URBAN FOOD SECURITY SERIES NO. 26 57
As Table 23 clearly demonstrates, supermarkets are the main source of
almost all food products. In the case of half of the products on the list,
supermarkets command over 90% of the market share. The three main
staples – maize meal, rice and pasta – are bought almost exclusively at
supermarkets. In sum, supermarkets completely dominate the food retail
system of the city, irrespective of the location, wealth and level of pov-
erty and food insecurity of households. The informal food economy is
therefore far more marginal in Windhoek than in many other Southern
African cities.
The only staple in which supermarkets face competition is bread although
they still command over half of the custom. Supermarkets are also the
major source of fresh and frozen produce. Over three-quarters of the
households that purchase milk, eggs, fruit, fresh chicken and vegetables
do so from supermarkets. In the case of fresh fish, there is some competi-
tion from street vendors and open markets. Meat is also bought from small
shops (mainly butcheries) and open markets and offal from open markets
and street vendors. It is possible, however, that some street vendors and
vendors in open markets source their products from supermarkets as well.
Supermarkets completely dominate the market for frozen produce and
processed foodstuffs. Supermarkets command over 50% of the cooked
food market, although fast food outlets do compete for cooked chicken
and meat. At least one of these outlets, Hungry Lion, is owned by the
supermarket chain, Shoprite.
As demonstrated earlier, South African supermarkets have a strong pres-
ence in Windhoek. However, they are not the only players in the food
system as there are several locally owned competitors, notably Woer-
mann Brock. In this study, over half of the respondents (57%) said that
they patronize South African supermarkets, while the remainder (43%)
patronize Namibian supermarkets (with 32% patronizing Woermann
Brock). Table 24 provides a breakdown of patronage patterns of the South
African supermarkets. Shoprite is clearly the dominant South African
chain, with two-thirds (68%) of the households patronizing their Shop-
rite, Checkers and Usave supermarkets. Around 17% shop at Usave (the
subsidiary that targets lower-income areas of cities).
The South African supermarkets appear to be more accessible than local
supermarkets for households in informal housing: 54% patronize South
African outlets compared to only 30% in formal housing. The majority
of households (70%) in the formal housing areas shop at local supermar-
kets (Figure 27). This suggests that although South African supermarkets
are targeting higher-income areas of the city, they are attracting more
customers in low-income and informal urban areas. Local supermarkets

58 AFRICAN FOOD SECURITY URBAN NETWORK (AFSUN)
tend to follow the conventional strategy of targeting middle and high-
income areas and consumers.
TABLE 23: HCFPM of Food Item Sources
% of
house-
holds
buying
item
Super-
market
Fast
food
Small
shop
Open
market
Spaza/
tuck
shop
Street
vendor
Staples
Maize meal 75.9 96.0 0.0 1.3 0.6 1.3 0.1
Bread 57.3 53.5 0.0 14.6 1.2 27.8 0.6
Rice 53.2 99.4 0.0 0.2 0.4 0.0 0.0
Pasta 50.6 99.6 0.0 0.0 0.2 0.2 0.0
Fresh produce
Meat 42.4 61.1 0.0 13.3 20.0 0.3 5.1
Vegetables 31.2 77.5 0.0 1.8 11.6 1.1 8.0
Fish 32.7 46.0 0.0 4.2 16.6 2.4 26.6
Milk 25.4 96.9 0.0 1.3 0.4 0.4 0.9
Eggs 21.4 93.1 0.0 0.0 0.0 3.7 2.1
Fruit 16.7 91.1 0.0 0.6 5.7 0.0 2.5
Offal 11.0 38.1 0.0 9.2 29.9 2.1 18.6
Chicken 8.6 84.5 0.0 1.2 9.5 1.2 2.4
Frozen produce
Chicken 28.9 95.7 0.0 1.6 0.0 0.4 2.3
Meat 10.1 93.3 0.0 3.4 3.4 0.0 0.0
Fish 7.3 80.0 0.0 0.0 15.4 3.1 1.5
Cooked food
Pies/vetkoek 9.4 53.0 4.8 3.6 9.6 18.1 10.8
Meat 3.8 51.1 18.2 0.0 27.3 0.0 3.0
Chicken 2.7 62.5 33.3 4.2 0.0 0.0 0.0
Fish 1.0 64.0 4.0 0.0 24.0 4.0 0.0
Processed food
Cooking oil 75.5 94.6 0.0 2.1 0.7 1.2 0.0
Sugar 64.5 94.7 0.0 0.9 0.5 3.2 0.2
Tea/coffee 46.2 96.8 0.0 1.0 0.5 1.0 0.0
Butter/margarine 26.1 99.6 0.0 0.0 0.0 0.4 0.0
Cooldrinks 23.4 81.2 1.0 3.4 0.5 13.5 0.0
Fruit juice 14.7 97.7 0.0 0.8 0.0 1.5 0.0
Sour milk/omaere 12.3 95.4 0.0 0.0 2.8 1.8 0.0
Snacks (crisps etc) 11.4 66.3 0.0 3.0 2.0 11.9 14.9
Sweets/chocolate 10.5 57.0 0.0 3.2 4.3 18.3 15.1
Canned vegetables 9.7 100.0 0.0 0.0 0.0 0.0 0.0
Canned meat 4.9 95.3 0.0 2.3 2.3 0.0 0.0
Canned fruit 4.7 100.0 0.0 0.0 0.0 0.0 0.0
THE SUPERMARKET REVOLUTION AND FOOD SECURITY IN NAMIBIA

TABLE 24: Popularity of Different South African Supermarkets
No. % of households
Shoprite 316 68.1
Pick n Pay 80 17.2
Checkers 34 7.3
Metro Cash & Carry 15 3.2
Spar 11 2.4
OK Foods 6 1.3
Fruit & Veg City 1 0.2
Game 1 0.2
Total 464 100.0
FIGURE 27: South African and Local Supermarket Patronage by Type
of Housing
80
70
60
50
40
30
20
10
0 South African
supermarkets
Local supermarkets
Formal Informal
8.4 Consumer Attitudes to Supermarkets
In this section of the report, we examine local attitudes towards super-
markets in the city. First, with regard to consumers, the household sur-
vey makes it clear that most households in the city obtain some of their
food at supermarkets. As part of the survey, respondents who shopped at
supermarkets were asked why they did so. Those who did not were asked
why they avoided shopping at supermarkets. In both cases, respondents
were presented with a series of statements and asked to rank them on a
five-point scale from strongly agree to strongly disagree. Of the over 800
respondents who shop at supermarkets, 88% agreed/strongly agreed that
URBAN FOOD SECURITY SERIES NO. 26 59
Perc
enta
ge

60 AFRICAN FOOD SECURITY URBAN NETWORK (AFSUN)
one of the primary reasons was the variety of foods in supermarkets (Table
25). Other factors with which there was strong agreement was the sales
and discounts offered by supermarkets (82%), the better quality of food
(81%) and the opportunities to buy in bulk (76%). Supermarket prices
were not nearly as strong an incentive. Less than half (44%) agreed that
food was cheaper at supermarkets and as many as 50% disagreed with the
statement. Of the smaller number of respondents who never shopped at
supermarkets, 78% agreed/strongly agreed that the reason was that super-
markets did not offer credit. Other important disincentives were that
supermarkets are too expensive (71%), are only for the wealthy (61%)
and are too far away (52%) (Table 26).
TABLE 25: Reasons for Shopping at Supermarkets
Strongly
agree
Some-
what
agree
Neither
Some-
what
disagree
Strongly
disagree
Supermarkets have a
greater variety of foods 65.1 23.0 2.7 6.2 3.0
Supermarkets offer
sales and discounts 60.6 21.7 3.9 6.4 7.4
Food is better quality at
supermarkets 58.0 23.1 5.5 5.5 8.0
We can buy in bulk at
supermarkets 50.5 25.9 3.3 8.0 12.3
Food is cheaper at
supermarkets 30.1 14.3 6.0 12.3 37.2
TABLE 26: Reasons for Not Shopping at Supermarkets
Strongly
agree
Somewhat
agree Neither
Somewhat
disagree
Strongly
disagree
Supermarkets are too
expensive 67.7 3.2 12.9 12.9 3.2
Supermarkets do not
provide credit 66.7 10 3.3 13.3 6.7
Supermarkets are too
far away 48.4 3.2 3.2 16.1 29.0
Supermarkets are
only for the wealthy 38.7 22.6 6.5 29.0 3.2
Supermarkets do not
sell the food we need 16.7 13.3 10.0 13.3 46.7
The qualitative interviews probed for these and other reasons for the pop-
ularity of supermarkets. One of the key motivating factors for patronage
appeared to be supermarket sales. Some described a pattern of shopping at
multiple supermarkets to take advantage of sales, and shopping only once
or twice a month by buying staples in bulk:
THE SUPERMARKET REVOLUTION AND FOOD SECURITY IN NAMIBIA

URBAN FOOD SECURITY SERIES NO. 26 61
I buy mainly in Shoprite, Pick n Pay, Checkers and sometimes in Spar
because I check where there is a sale. The type of food I buy is mainly
macaroni, rice, cooking oil and meat which I can buy maybe twice a
month (Interview No. 1, Moses Garoeb).
If I want to do a proper grocery, including detergent, then at least I
will use NAD2,000. I mostly buy in Metro, OK Foods at Baines and
Spar. I buy staple food like rice, maize meal, meat, vegetables, coffee
and tea. I try to do big shopping once a month and I only add products
every week or every second week. I have noticed people tend to use
shops that are close to their work places (Interview No. 2, Windhoek
West).
I use about NAD900 to buy food per month and I only buy food
except relish and meat. I buy maize meal, cooking oil, macaroni,
beans, mayonnaise and whatever we need and this can last up to 23rd
of that month and then I have to supplement. I buy in Shoprite, Nam-
ica and Cash & Carry and sometimes at Woermann Brock because
there it’s better (Interview No. 3, Tobias Hainyeko).
One respondent was more cynical about supermarket sales and the sup-
posed manipulation of food prices:
Sale price is good because it reduces the budget slightly except at
Woermann Brock. But these supermarkets are very smart, if they
reduce the price of cooking oil then they increase the price of sugar
but you need both of them, so in the end you do not benefit from the
sale, it is just the same price (Interview No. 5, John Pandeni).
As noted above, supermarket shopping tends to be a monthly activity for
many people, primarily because they buy staples – such as maize meal, rice
and macaroni – in bulk quantities. It is noticeable that the supermarkets
have responded to this buying pattern, particularly in lower-income com-
munities, by stocking large bags or sacks of these products for purchase.
An earlier study by one of the authors examined the food purchasing pat-
terns of women living in informal settlements in Windhoek and provides
insights into why supermarket patronage is lower in low-income com-
munities (Nickanor 2014). These informants made a number of relevant
observations about their interactions with supermarkets. One of the major
constraints is lack of refrigeration so that fresh produce, when it can be
afforded, has to be purchased extremely frequently:
I don’t go hungry but I don’t eat the kind of food I want to because I
cannot afford it. When my boyfriend gives me money I usually go buy
food in Shoprite, Stop n Shop, but potatoes I usually buy from the bus
stop because a bag costs too much (at Shoprite) (Interview No 14).

62 AFRICAN FOOD SECURITY URBAN NETWORK (AFSUN)
We buy fish from local guys who are selling from door to door and
one fish costs about NAD3. This is unlike Shoprite or Checkers
where fish is neatly packed in a box although it is expensive. We often
do not buy fish in large quantities, after all one has nowhere to store
it. Shops like Shoprite offer regular discounts as compared to the local
shops so you can compare prices before you buy. At times even if you
buy where there are discounts, you have to transport goods and this is
costly so at the end you have not saved anything. So it’s best we buy
from local shops here (Interview No. 19).
We purchase food here at the shops. I buy at Shoprite and Woermann
Brock. Those are the only places you can buy food at a slightly better
quantity, but meat we buy at the bus stops because it’s much better
than in the formal shops (Interview No. 32).
When we get money then we buy maize flour which lasts five days,
but meat or fish you have to buy every day because we do not have
electricity in order for us to buy a fridge where we can store our meat
and perishables. Thus for every meal you buy a piece of meat or fish
which is just enough for that time (Interview No. 23).
Every decent meal consists usually of maize meal or mahangu pap
eaten with dried fish or meat when there is money to purchase the
meat or fish. That is what we eat here every day. Even if you find
chicken or vegetables on sale in the formal shops you will not buy it.
Where are you going to store it? There is no electricity here and no
refrigerator (Interview No. 26).
Others referred to the constraint of distance from supermarket outlets,
which forces them to buy more expensive products in the neighbour-
hood:
When there is no money then it’s a struggle. At times I use NAD1,000
per month buying food only. This informal settlement (Havanna) is
far from the main town and any other retail shops. Furthermore, there
is no tarred road here and taxis hardly want to bring people this side if
they do not charge exorbitant amounts. We are really far from town –
the closest food store is the Woermann Brock in Wanaheda, but you
can’t foot there. There are local shops here but they are much more
expensive (Interview No. 27).
I use a lot of money to buy food and we buy it from formal retail shops
at Shop n Stop. There is also a local shop here where we buy from
because if you compare the prices it does not matter. At the end of the
day you end up paying more for transport. (Interview No. 41).
Shoprite, Woermann Brock and Pick n Pay are our preferred shops,
but they are far from us. Maybe if they set up their shops here we will
THE SUPERMARKET REVOLUTION AND FOOD SECURITY IN NAMIBIA

URBAN FOOD SECURITY SERIES NO. 26 63
get electricity. For now we use a lot of money on transport to go to
those shops, especially when you hear that there is a sale. A 50kg bag
of maize is cheaper in those shops as compared to our local shops here.
But you have to pay the taxi driver double to bring you up to your
house with your goods (Focus Group No. 2).
8.5 Labour Disputes With Supermarkets
Very little information is available on the employment practices, working
conditions and levels of employee satisfaction at South African supermar-
kets in Namibia. Recently, however, a series of labour-related incidents
took place at Namibian Shoprite stores, leading to a national campaign
urging consumers to boycott all Shoprite-owned retailers. The Namibian
Commercial Catering, Food and Allied Workers’ Union (NACCAFWU)
together with Shoprite workers pledged to pressure Shoprite to increase
its workers’ wages (Kapitako 2017a). This national campaign follows sev-
eral years of labour disputes between Shoprite and the group’s Namibian
employees. A labour strike legal process has also been formalized with the
labour commissioner issuing a certificate of unresolved dispute in Febru-
ary 2017 (Kapitako 2017b). Over 100 workers have been charged and face
dismissal after participating in illegal strikes (Katjanga 2017).
The Namibian Minister of Labour, Erkki Nghimtina, strongly criticized
Shoprite, saying that the group was exploitative and was undermining the
job security of over 4,300 workers in the country. Nghimtina told media
in Windhoek of his great concern that “the unhappy state of labour rela-
tions and instability continues at Shoprite, and that the low wages and poor
conditions of employment persist and Shoprite remains anti-union. This
does not reflect sound labour relations.” He urged Shoprite to “turn over
a new page in labour relations in Namibia by reaching a mutually accept-
able settlement with the workers, and for the company to fully practise
our local labour laws, rather than importing their own” (Katjangu 2017).
Poor wages and benefits are high among the objections, which include
the company’s practice of hiring employees on a “permanent part-time”
basis where they have no job security and are paid NAD240 per week.
Almost 80% of the Shoprite workforce in Namibia is employed on this
basis (Kapitako 2017b). These employees do not have fixed schedules, are
paid less per hour than full-time employees, work an average of 30 hours
per week, and some have worked in this permanent part-time status for
more than a decade. Shoprite has been accused of violating Namibian
labour regulations in not having formal internal grievance procedures or
a disciplinary code, as well as of improper treatment of workers by man-
agement. Shoprite employees are reportedly among the most poorly paid
workers in Namibia’s retail sector (Kapitako 2017b).

64 AFRICAN FOOD SECURITY URBAN NETWORK (AFSUN)
To be recognized by Shoprite as the representative union, the Namib-
ian Food and Allied Workers’ Union (NAFAU) began a drive to sign
up all Shoprite employees as members and called on Shoprite’s manage-
ment not to delay the process of recognition once it reached the required
majority membership. NAFAU general secretary Jacob Penda said that
“it is a pity that these workers have been divided for the past seven years,
and as a result, no union is recognised by Shoprite. This has made the
workers vulnerable in terms of rights and representation” (Nakashole
2017). If recognized, the union promised to negotiate for better wages
and benefits, in line with those of Shoprite employees in South Africa.
A public protest organized by the Economic and Social Justice Trust and
others to highlight the plight of Shoprite workers was held in Windhoek
in June 2017 (New Era 2017). One of the demands was that Shoprite
drop disciplinary charges against over 100 of its employees in Windhoek,
relating to a strike in 2015.
Two of the parties in the dispute, the Employers’ Association (back-
ing Shoprite) and the Namibia Wholesale and Retail Workers’ Union
(NWRWU), criticized the Minister of Labour for failing to resolve the
issue. NWRWU called for the Minister’s resignation in August 2017,
and demanded that the President revoke Shoprite’s trading licence in
Namibia. In a clear reference to the South African origins of Shoprite,
NWRWU general secretary Victor Hamunyela said in a statement that
“it does not make sense that you are made a slave by people who are in the
country at your mercy” (New Era 2017).
9. IMPACT OF SUPERMARKETS ON
INFORMAL FOOD SECTOR
Windhoek’s informal sector has not attracted much research attention.
This may be partly because it is relatively small compared to many other
African cities. Frayne (2004) argued that the sector is “poorly developed”
and that although it appears to be expanding, it is doing so slowly. The
relatively small size of the informal economy was confirmed by the 2008
Namibian Labour Force Survey which found that there were 64,502
informal employees (including unpaid family members) and 16,856 infor-
mal employers (including self-employed individuals) in urban Namibia
(Budlender 2011: 9), or a total of 80,908 people working in this sector
(compared to 121,077 in the urban formal sector). This suggests that 40%
of urban employers and employees are in the informal sector and 60% are
in the formal sector. However, if we look only at the sectoral breakdown,
THE SUPERMARKET REVOLUTION AND FOOD SECURITY IN NAMIBIA

URBAN FOOD SECURITY SERIES NO. 26 65
a different picture emerges. There were only 21,824 informal employers
and employees involved in trade in urban areas, which amounts to 11%
of total employment and 27% of total informal employment (Budlender
2011: 31). In terms of the gender breakdown in the informal trade sec-
tor countrywide, 61% were women. Informal trade (which includes the
informal food sector) is thus dominated by women. Budlender (2011: 38)
also provides information on where informal traders and their employees
are located in urban areas: in total there were 2,079 individuals trading in
markets, 1,779 from street stalls and 4,944 mobile vendors.
The other important feature of the informal sector in Namibia, besides its
small size, is the high rate of business failure. The 2008 survey found that
half of the employers and employees in the country’s informal economy
had been working there for less than a year and only 10% had been work-
ing for more than five years (Budlender 2011: 62). As many as 90% of
small and medium enterprises in Namibia are estimated to collapse within
the first five years of operation (Amwele 2013: 1, Kambwale et al 2015).
In the evocative language of Ogbokor and Ngeendepi (2012), the major-
ity “crash land during the first 24 months of their existence and in most
cases before fully taking-off.” One of the main reasons is that “SMEs are
easily crowded out of business due to the stiff competition that they get
from the already established large scale businesses that currently oper-
ate in Namibia” (Ogbokor and Ngeendepi 2012). Or again, “Namib-
ian SMEs have to contend with well-established competitors from South
Africa, whose capacity and past experience enable their business practices
to see off competition from small Namibian business” (Amwele 2013: 7).
The sample size of Amwele’s (2013) investigation of the challenges faced
by food sector SMEs in Windhoek was too small to draw any definitive
conclusions although competition (along with financing and the exter-
nal operating environment) were identified as important obstacles in the
study as a whole. The study does conclude that SMEs in the food and
beverage sector face “fierce” competition from Pick n Pay, Woermann
Brock, Shoprite and Usave (Amwele 2013: 52).
A third distinctive feature of the informal food sector in Namibia is that
most participants are survivalists who have been pushed into food retail
by the lack of alternative income-generating opportunities. This emerges
particularly clearly in Nickanor’s (2014) analysis of the severe difficul-
ties faced by women operating in the food economy in the informal
settlements of Windhoek. While the dominance of the food system by
supermarkets cannot be held exclusively responsible for the difficulties in
the informal food sector, the supermarkets clearly provide an extremely
competitive operating environment, particularly as they edge closer to
the low-income areas of the city and stock staple products in bulk. Their

66 AFRICAN FOOD SECURITY URBAN NETWORK (AFSUN)
competitive prices force informal vendors to have very low mark-ups and
use what little profit they make to support the basic needs of the house-
hold rather than invest in business expansion.
The interviews with informal food vendors revealed some differences of
opinion about whether supermarkets were a competitive boon or a com-
petitive threat. Many complained about the negative impact:
I do not really feel happy about the ever-growing supermarkets in our
area. Like now the new Woermann Brock at Monte Cristo service
station took some of our customers. These shops are providing com-
petition for me and my profit has decreased over the past months.
Here we are only remaining with those customers that are not able to
go buy at these shops or we can only get customers after hours when
the shops are closed (Interview No. 8).
Competition from supermarkets is always there. I can give you an
example of stuff that can go without selling if there is a special in
supermarkets. My milk I sell at NAD19.50 but will reduce whether
there is a sale in town or not. Like in shops now, it is NAD13 so I
don’t do business like I always do (Interview No. 9).
People from this area always go shop from supermarkets if they find
out that I do not sell the goods that they are looking for. These shops
are giving us difficulties in selling our goods sometimes. Most of the
time people buy from the supermarkets on their way from work and
end up not buying from our stands. I throw away all foods that I am
not able to sell when they are spoiled. Sometimes I reduce the prices
of the foods that I am not able to sell over a long period to avoid mak-
ing a loss for that particular month (Interview No. 11).
It is not a good thing at all, because us that are selling in streets near
these shops are losing customers. Yes, they are giving me competition.
The supermarkets have affected my business in a way that if my prices
are high, then people just go buy in supermarkets instead (Interview
No. 17).
It is a bad thing. Most of our customers are now going to these shops
instead of buying from the stalls here. Now we are no longer getting
customers in the open market like in the past (Interview No. 18).
Those with a narrow market niche and customer base, as well as greater
distance from supermarkets, did not see the distribution and activities of
supermarkets as a threat:
The increase in supermarkets does not affect my business because
there are a lot of people. Like, for example, these 20 loaves of bread
will finish when people are knocking off work, as they are passing by
to their homes (Interview No. 3).
THE SUPERMARKET REVOLUTION AND FOOD SECURITY IN NAMIBIA

URBAN FOOD SECURITY SERIES NO. 26 67
These supermarkets do not give me a competition, since they are
operating from far. My business is not directly affected, because I am
just targeting school children and households in this street and nearby
streets (Interview No. 4).
Supermarkets are not giving me competition at all, since I am only
selling cooked (food) and those that are not able to buy in supermar-
kets buy their lunch from me. Like here, I am selling in front of Wern-
hill Park, there are many shops there that are selling food and people
still prefer to buy here (Interview No. 16).
It is actually a good thing that there are more supermarkets now. Peo-
ple now have the power to decide where they want to buy from and
they also have many shops to choose from now in terms of price pref-
erences. The supermarkets are not giving me any competition at all,
even their own employees come buy from me. If there was a competi-
tion, I would not be having supermarket employees as my customers
(Interview No. 13).
The results from the household food purchases matrix analysis clearly
show that the informal food sector is only able to compete with supermar-
kets on a few products (Table 27). For example, open markets are a source
of meat, offal, vegetables and fish (fresh and frozen) as well as cooked
meat and fish. Spazas/tuck shops are patronized for bread, pies/vetkoek and
snacks and street vendors have a share of the market for fresh fish and
offal. However, in almost every case, supermarkets have a greater market
share than informal vendors. There is only one product – offal – where the
informal sector has a greater market share than the supermarkets, although
supermarkets close to low-income areas of the city are increasing their
stock of offal and already command nearly 40% of the market.
TABLE 27: HCFPM of Selected Food Item Sources
Supermarket Open market
Spaza/
tuck shop Street vendor
Bread 53.5 1.2 27.8 0.6
Meat 61.1 20.0 0.3 5.1
Vegetables 77.5 11.6 1.1 8.0
Fish 46.0 16.6 2.4 26.6
Offal 38.1 29.9 2.1 18.6
Frozen fish 80.0 15.4 3.1 1.5
Pies/vetkoek 53.0 9.6 18.1 10.8
Cooked meat 51.1 27.3 0.0 3.0
Cooked fish 64.0 24.0 4.0 0.0
Snacks (crisps etc) 66.3 2.0 11.9 14.9
Sweets/chocolate 57.0 4.3 18.3 15.1

68 AFRICAN FOOD SECURITY URBAN NETWORK (AFSUN)
One of the striking features of the informal food vendors in Windhoek is
their price sensitivity. Mark-ups are small and they are constantly on the
look-out for products with resale potential. This means that they tend to
shop from a variety of different outlets. Wholesalers are popular sources
of products, as are companies such as MeatCo for meat products. Others
source products at supermarkets (particularly when there are sales) but do
not tend to patronize only one outlet, purchasing instead at a variety of
supermarkets:
I source my products from Pick n Pay in Katutura, Spar in Kho-
masdal, fish from Mama Fresh, millet from my mother in the north
(50kg every two and a half months). Free range chicken is from Single
Quarters. Pick n Pay normally has fresh and clean products unlike
Woermann Brock and Shoprite. You can also find most products in
Pick n Pay (Interview No. 5).
Boerewors and meat I buy from Rand St Butchery in Khomasdal. I
buy cool drinks from Metro or anywhere there is a sale. Coffee and tea
from Pick n Pay, Spar or Metro depending on the price. These shops
are cheaper and they are always having food items on sale (Interview
No. 12).
It is cheaper to buy in bulk than buying single items. I buy my pota-
toes from a vendor in Okuryangava area opposite the clinic. They
are cheaper there and big compared to supermarkets. I buy my Rus-
sians (sausages) from a shop in Southern Industrial area. Russians are
cheaper there. I buy Oros and sweets from Metro. It is close by and
they are cheaper compared to buying from Food Lover’s Market or
Checkers (Interview No. 13).
I buy meat and cabbage from vendors in Monte Cristo road or in
the open market. It is cheaper to buy from them than supermarkets.
I buy macaronic, nik-naks, and sugar for Oshikundu and Otombo
from Namica supermarket. I send my children to buy there while I am
still here selling. The shop is also cheap. I buy Meme mahangu from
Shoprite Usave and sorghum from the open market in Okuryangava.
Usave and the open market are also at Stop n Shop area where I buy
most of my goods. I buy macaroni, Meme mahangu, sugar, baking
flour, yeast, soup, cooking oil. These goods are only found in super-
markets (Interview No. 15).
I only buy top score, 50kg per month. When it is not enough, I add
about 25kg in the middle of the month. I also buy tinned fish and
this I usually buy from Shoprite and Woermann. I do not buy fruit
and vegetables because it is usually just seen as for people who have
money. I go to the shop as frequently as I have the money to buy the
top score and the tinned fish. The longest I take is two weeks to go
THE SUPERMARKET REVOLUTION AND FOOD SECURITY IN NAMIBIA

URBAN FOOD SECURITY SERIES NO. 26 69
back there. But for meats I have to do it a lot because we do not have
means of refrigerating it (Interview No. 8, Okahandja Park Market).
Comparison shopping and multi-sourcing is one strategy successful infor-
mal vendors use to survive in this tough competitive environment. Some
are also able to acquire and sell traditional products and wild foods not
available in supermarkets:
The products I sell are traditional dry food (which varies depending on
the season), mahangu flour, beans, chilli, salt, sorghum flour, omutete,
ombidi, spices, mopane worms, dry fish, moringa, capenta. You need
to have stock and it’s not easy to source traditional food; it’s not as if
you can find them in a market…Around September, chilli will be out
of season, dry beans and dry spinach also. In November, we run out
of mopane worms so we source them from Angola and Zambia. We
have, for example, people who are selling mopane worms in a 50kg
bag. If you have a lot of money you can buy the whole 50kg bag or half
or whatever. I normally source products from the north, meaning you
have to ask people in different homes if they sell (Interview No. 2).
Another reason for business survival is the current geography of the food
system. Residents of the informal settlements and the very poor, in par-
ticular, still find that physical access to food sources is difficult. While
supermarkets are increasingly closing in on these areas, spazas and mobile
vendors are still able to market products in their immediate neighbour-
hoods. In contrast to the general picture of supermarket dominance
shown earlier, the pattern of food sourcing among poor households is
very different with only 20% patronizing supermarkets. The informal
food economy is much more important for these households with street
vendors the most important food retail source, followed by open markets,
small shops and spaza/tuck shops. On the other hand, these customers, by
definition, have very little disposable income and profit margins are slight.
As one of Nickanor’s (2014) respondents noted: “All I’m doing now is
selling okapana. What I’m getting from selling is very little and is not much
different from those who are not doing anything. But you cannot sit back
and do nothing.”
In an attempt to improve the operating environment for informal ven-
dors, as well as discourage vendors from selling on the streets, the munici-
pality has constructed a series of open markets where vendors pay a fee
in exchange for a stall and access to potable water and ablution facilities.
Those who sell in the markets are unhappy with the fees they have to pay
to the municipality and complain about unfair competition from street
vendors who set up outside the open markets, use the facilities and pay
no fees. The spatial distribution of open markets shows that they are tar-

70 AFRICAN FOOD SECURITY URBAN NETWORK (AFSUN)
geted at lower-income areas of the city (Figure 29). If the conventional
wisdom that supermarkets target only higher-income areas of the African
city were correct, these open markets (modelled on formal and infor-
mal markets elsewhere) would probably mean greater success for informal
vendors. However, as Figure 30 shows, most open markets are clustered
in areas of the city where there is a growing supermarket presence.
FIGURE 28: Patronage of Food Sources by Extremely Poor Households
Food sent by relatives in rural areas
Spaza/tuck shop
Small shop
Street seller/trader/hawker
Open market
Supermarket
0 5 10 15 20
Percentage
25 30
FIGURE 29: Location of Open Food Markets in Windhoek
THE SUPERMARKET REVOLUTION AND FOOD SECURITY IN NAMIBIA

URBAN FOOD SECURITY SERIES NO. 26 71
FIGURE 30: Location of Food Outlets in Windhoek
10. CONCLUSION
After 2000, several scholars argued that Africa was undergoing a super-
market revolution similar to that which had earlier come to dominate
food systems and consumer habits in the Global North and Latin Amer-
ica. They argued that South Africa was the one African country emulat-
ing this model and suggested not only that the “supermarket revolution”
would spread throughout the continent but that South African-based
supermarkets would lead the revolution. The primary reason was that the
end of apartheid was opening up the continent to South African business-
es, which were attracted by the massive urban consumer market accom-
panying rapid urbanization and the growth of an African middle-class.
The revolution would supposedly benefit consumers and small farmers
who would be incorporated into new supermarket food supply chains.
The proponents of the supermarket revolution model were primarily
agricultural economists who viewed it as a largely inevitable and positive
development. However, enthusiasm for the model has waned with much
less being written about in the last decade. Political economy analysis has
been extremely critical of the modernization premises of the model (the
idea of inevitable stages or waves in particular) and the fact that the prima-
ry beneficiaries are not consumers or smallholders but large, monopolistic
Moses Garoeb
Tobias Hainyeko
Windhoek Rural
Samora Machel John Panden
Katutura East
Khomasdal
Windhoek East
Windhoek West
2.5 0 2.5 5 7.5 10 km
Mini markets
Informal open markets (roadsides)
Formal open markets
Supermarkets
72 AFRICAN FOOD SECURITY URBAN NETWORK (AFSUN)
South African corporations whose bottom lines are flourishing through
corporate expansion into the rest of Africa.
Like many cities in Southern Africa, Windhoek has been growing rap-
idly, primarily as a result of in-migration, especially from the more heav-
ily populated rural north of Namibia. Urban planning has been unable
to keep pace with the influx, leading to the expansion of informal settle-
ments to the north of the city. The population of Windhoek has grown
from 147,000 at independence in 1990 to 326,000 in 2011 to its current
estimated population of 430,000. In 2008, AFSUN conducted a house-
hold food security baseline survey in lower-income neighbourhoods of
the city (Tobias Hainyeko, Moses Garoeb, Samora Machel and Khomas-
dal North) (Pendleton et al., 2012). The survey covered around 180,000
people in these four areas, or more than half of the city, and found that
77% of households were food insecure and 23% were food secure. In
the informal settlements, 89% were food insecure and 11% were food
secure. Dietary diversity was also low at 5.95 (on the HDDS scale) for the
sample as a whole and 4.78 for households in informal settlements. The
survey also revealed a very high level of supermarket patronage in these
lower-income areas of the city, with 83% of households obtaining at least
some of their food through supermarket purchase, more than through
the informal food sector (at 66%). Urban agriculture was negligible, with
less than 5% of households growing any of their own food within the
city. Much more important were informal food transfers from rural areas,
received by 72% of households.
The surprisingly high rate of supermarket patronage in low-income areas
of the city was at odds with conventional wisdom at the time that super-
markets in African cities are primarily patronized by middle and high-
income residents and therefore target their neighbourhoods. However,
Windhoek was not alone in this respect. Rates of supermarket patronage
by low-income urban residents were similarly high in the three South
African cities surveyed (Cape Town, Johannesburg and Msunduzi) and in
other countries neighbouring South Africa, including Botswana, Lesotho
and Swaziland. In other Southern African countries, such as Zimbabwe,
Zambia, Malawi and Mozambique, rates of patronage were lower and,
simultaneously, informal food sector purchasing was much higher. This
raised the obvious question of what was happening in Namibia and other
countries that made supermarkets so much more accessible to the urban
poor, as well as other questions about what they were buying at supermar-
kets and how frequently they shopped there. Further, what was the rela-
tionship, if any, between supermarkets and informal food vendors? Was
there some kind of symbiotic relationship (as there appears to be in many
THE SUPERMARKET REVOLUTION AND FOOD SECURITY IN NAMIBIA

URBAN FOOD SECURITY SERIES NO. 26 73
Asian cities, for example) or were supermarkets driving the informal
sector out of business? In South Africa, the government’s Competition
Commission began investigating this, following numerous complaints
about supermarket incursion by owners of small informal food businesses.
What the 2007-2008 AFSUN survey suggested was that the supermar-
ket revolution model was a potentially accurate depiction of countries in
the immediate vicinity of South Africa. There were several reasons for
this: first, those countries within the Southern African Customs Union
and Rand Monetary Area facilitated the ability of South African corpo-
rations to do business, move goods across borders and repatriate profits.
Second, these countries had a long history of South African corporate
investment. Nascent South African supermarket chains had been operat-
ing in these countries since at least the 1960s. In the case of Namibia,
South Africa’s occupation and control of Namibia until 1990 made it
easy for South African companies to view the country as a province of
South Africa. Third, geographical proximity meant that it was unneces-
sary for supermarkets to build local supply chains from scratch. Instead,
these countries and their cities were simply incorporated into existing
supply chains, becoming retail nodes for large-scale South African agri-
cultural producers and food processors. While the AFSUN research was
extremely suggestive about the importance of supermarkets to urban food
systems in Southern Africa, it was viewed through the narrow lens of
the household consumer. The current project was therefore established to
investigate the supermarket revolution model in greater depth, beginning
with Namibia and then extending to other countries in the region. In
addition to exploring questions about supermarket expansion and opera-
tions, the project aimed to investigate the implications of South African
supermarket growth in other countries including impacts on smallholder
farmers, on the informal food system, and on the food environment and
food security of households in cities.
Five main conclusions emerge from the research project and findings dis-
cussed in this report:
t /BNJCJB JO HFOFSBM, BOE 8JOEIPFL JO QBSUJDVMBS, IBT VOEFSHPOF B
partial supermarket revolution focused predominantly at the retail lev-
el of the food supply chain. The levels of supermarket concentration
in Windhoek are very similar to those in similar-sized South African
cities. Namibia is distinctive in that it is the site of intense competition
between the major South African supermarkets and a locally owned
chain, Woermann Brock. In some countries, such as Kenya, local
chains have effectively kept South African chains out of the market.
In Namibia, Woermann Brock (with a retail history of more than 120

74 AFRICAN FOOD SECURITY URBAN NETWORK (AFSUN)
years) has had to compete with the South African retail giants and has
managed to survive and expand. The reasons for its success need more
research as a potential model for locally owned companies in other
African markets.
t 5IF /BNJCJBO TVQFSNBSLFU SFWPMVUJPO JT JODPNQMFUF JO UIF TFOTF UIBU,
unlike in South Africa, it has not involved wholesale transformation of
the agro-food system. Some large-scale Namibian farms (particularly
in the beef and vegetables sector) have been able to take advantage
of new demands from supermarkets, but the overall number of local
producer-beneficiaries seems small. Government protectionism has
prompted some adjustment in supermarket strategies of procurement
(particularly for processed cereal products). New initiatives, such as
the Growth at Home Strategy and Namibian Retail Charter, may lead
to more local sourcing of products but the main beneficiaries are likely
to be large commercial farms and food processors rather than small
farmers. Even then, as this report shows, the vast majority of products
sold in supermarkets in Windhoek are imported from South Africa.
Indeed, Windhoek supermarkets appear to be fully integrated into the
same supply and distribution chains as South African cities.
t 5IF PCWJPVT RVFTUJPO GPS /BNJCJBOT JT XIP CFOFGJUT GSPN UIF PWFS-
whelming presence of South African supermarkets? South Africans?
Namibians? Both? Because financial information on the operations,
profits and capital flows of the supermarkets are closely guarded cor-
porate secrets it is extremely difficult to quantify these economic
impacts. However, we can examine the argument, often made by
supermarkets, that the consumer benefits by getting more varied,
cheaper, fresher and safer foods. This takes us back to the lens of
the consumer. The city-wide household survey conducted for this
report is extremely instructive, particularly when compared to the
2008 results, taking into account that the latter focused only on low-
income residential areas. The proportion of food insecure households
has fallen slightly from 77% to 72% (although the two populations
are not strictly comparable since this survey includes middle and
high-income households in Windhoek East and West). However,
food insecurity has increased in the informal settlements from 89%
to 92%. Overall dietary diversity has fallen significantly from 5.95 to
4.47 (and from 4.78 to 2.66 in informal settlements). The obvious
conclusion is that supermarkets may be making more food available,
but they are not making it more accessible, or accessible enough, to
improve food security significantly.
t 5IFSF BSF WBSJPVT NPEFMT PG UIF TVQFSNBSLFU-JOGPSNBM WFOEPS SFMB-
tionship, ranging from the informal resilience model in East and
Central African cities to the symbiotic model in some South African
THE SUPERMARKET REVOLUTION AND FOOD SECURITY IN NAMIBIA

URBAN FOOD SECURITY SERIES NO. 26 75
cities to the destructive-impact model in others. Like South Africa,
informal food vending is a relatively recent phenomenon in Namibia
and most informal vendors lack their own independent supply chains
(with the notable exception of wild foods). What emerges from the
interviews with vendors in Windhoek is the tough competitive envi-
ronment in which they struggle to make a living. They do, at pres-
ent, have greater patronage in informal settlements, and the city has
sought to support vendors and boost accessibility through its system
of open markets. However, as in South African cities, the supermar-
kets are moving closer to the low-income mass market with budget
subsidiaries such as Usave. And it is not just staples that are bought at
supermarkets, as conventional wisdom suggests. The HCFPM shows
that more than half of the households that purchase any food item do
so at supermarkets. In many cases, the proportion exceeds 80-90%.
t 5JNNFS’T (20l7) QFTTJNJTUJD WJFX UIBU UIF TVQFSNBSLFU SFWPMVUJPO
and its impacts are beyond the control of governments inevitably leads
to policy paralysis. Battersby (2017) argues that in South Africa the
growth and consolidation of supermarkets has involved food system
transformation in the absence of food system planning. Govern-
ment leads and controls the process of mall development but has no
explicit food security or food system mandate. Mallification, includ-
ing in Namibia, therefore represents other urban planning priorities
and interests which see the development of malls as an unmitigated
public and private win (for the developer, the tenants and the con-
sumer). The obstacles to developing a coherent food security strategy
at the city level are many but not insurmountable (Haysom, 2015). A
promising first step was Windhoek’s engagement with the food sys-
tem governance of Belo Horizonte in Brazil and the subsequent 2014
Windhoek Declaration on food security by the mayors of Namib-
ian towns and cities (World Future Council, nd). Unfortunately, the
World Future Council does not show how the lessons of Belo Hori-
zonte could be applied in Windhoek and instead defaults to advocat-
ing urban agriculture – a strategy that has failed in many other African
cities – as the solution to urban food insecurity (Crush et al, 2011).
Advocacy and declarations will also make little progress unless they
understand the centrality of the supermarket revolution and seek to
regulate it in the interests of the urban poor and food insecure. Here,
initiatives such as the South African Competition Commission’s
(2017) Retail Market Enquiry could have potentially important impli-
cations for supermarket behaviour and the informal food economy in
South African cities. Almost certainly, its findings will have relevance
for Namibia which might consider launching its own investigation
of the impact of a supermarket revolution that is largely orchestrated

76 AFRICAN FOOD SECURITY URBAN NETWORK (AFSUN)
from corporate headquarters in South African cities. More generally,
we hope that this report will add to the knowledge base for Namibia’s
mayors as they, and national government, seek to fulfil the promise
of the Windhoek Declaration to “engage in a multi-stakeholder dia-
logue on food and nutrition security governance and interventions at
different levels.”
REFERENCES
1. Abrahams, C. (2009). “Transforming the Region: Supermarkets
and the Local Food Economy” African Affairs 109: 115-134.
2. Abrahams, C. (2011). “Supermarkets and Urban Value Chains:
Rethinking the Developmental Mandate” Food Chain 1: 206-222.
3. Amwele, H. (2013). “An Empirical Investigation into the Factors
Affecting the Performance of SMEs in the Retail Sector in Wind-
hoek, Namibia” MIB Thesis, Polytechnic of Namibia, Windhoek.
4. Andersson, C., Chege, C., Rao, E and Qaim, M. (2015). “Fol-
lowing Up on Smallholder Farmers and Supermarkets in Kenya”
American Journal of Agricultural Economics 97: 1247–1266.
5. Andjamba, H. (2017). “Econometric Estimation of the Demand for
Meat in Namibia” Magister Scientiae Agriculturae Thesis, Univer-
sity of the Free State, Bloemfontein.
6. Asfaw, A. (2008). “Does Supermarket Purchase Affect the Dietary
Practices of Households? Some Empirical Evidence from Guate-
mala” Development Policy Review 26: 227–243.
7. Battersby, J. (2017). “Food System Transformation in the Absence
of Food System Planning: The Case of Supermarket and Shopping
Mall Retail Expansion in Cape Town, South Africa” Built Environ-
ment 43: 417-430.
8. Battersby, J. and Peyton, S. (2014). “The Geography of Supermar-
kets in Cape Town: Supermarket Expansion and Food Access”
Urban Forum 25: 153-164.
9. Battersby, J., Marshak, M. and Mngqibisa, N. (2017). Mapping
the Invisible: The Informal Food Economy of Cape Town, South Africa.
AFSUN Report No. 24, Cape Town.
THE SUPERMARKET REVOLUTION AND FOOD SECURITY IN NAMIBIA

URBAN FOOD SECURITY SERIES NO. 26 77
10. Berkowitz, B., Ramkolowan, Y., Stern, M., Venter, F. and Webb,
M. (2012). The Role of South African Business in Africa: South African
Outward Investment. Report for Nedlac, Pretoria.
11. Biénabe, E., Berdegué, J., Peppelenbos, L. and Belt, J. (eds.) (2011).
Reconnecting Markets Innovative Global Practices in Connecting Small-
Scale Producers with Dynamic Food Markets (Farnham: Gower).
12. Blandon, J., Henson, S. and Cranfield, J. (2009). “Small-Scale
Farmer Participation in New Agri-Food Supply Chains: Case of the
Supermarket Supply Chain for Fruit and Vegetables in Honduras”
Journal of International Development 21: 971-984.
13. Brown, A. (2015). “Sustaining African Cities: Urban Hunger and
Sustainable Development in East Africa” International Journal of Envi-
ronmental, Cultural, Economic & Social Sustainability 11: 1-12.
14. Budlender, D. (2011). Informal Employment in Namibia in 2008
(Geneva: ILO).
15. Cheadle, H. (2017). “Grocery Retail Market Enquiry Public Hear-
ings: Remarks by the Chairperson” At: http://www.compcom.
co.za/wp-content/uploads/2015/06/Cape-Town-Public-Hearings-
introduction-by-Prof-Halton-Cheadle.pdf
16. Chidozie, F., Olanrewaju, I. and Akande, O. (2014). “Foreign
Megastores and the Nigerian Economy: A Study of Shoprite” Medi-
terranean Journal of Social Sciences 5: 425-437.
17. Ciuri, S. (2013). “Nakumatt Set to Take Over Shoprite Stores in
Tanzania” Business Daily Africa 17 December.
18. Ciuri, S. and Kisembo, D. (2015). “Uganda: Nakumatt to Buy
Shoprite” All Africa 23 July.
19. Competition Commission of South Africa (2016). “Enforcement
of Competition Policy in the Retail Sector: Contribution by South
Africa” Prepared for 2016 UNCTAD Round Table, Geneva.
20. Competition Commission of South Africa (2017). Retail Market
Enquiry. At http://www.compcom.co.za/retail-market-inquiry/
21. Coates, J. (2013). “Build it Back Better: Deconstructing Food Secu-
rity for Improved Measurement and Action” Global Food Security 2:
188-194.

78 AFRICAN FOOD SECURITY URBAN NETWORK (AFSUN)
22. Crush, J. and Caesar, M. (2016). “Food Access and Insecurity in a
Supermarket City” In J. Crush and J. Battersby (eds.), Rapid Urban-
isation, Urban Food Deserts and Food Security in Africa (New York:
Springer), pp. 47-58.
23. Crush, J. and Frayne, B. (2011a). “Urban Food Insecurity and the
New International Food Security Agenda” Development Southern
Africa 28: 527-544.
24. Crush, J. and Frayne, B. (2011b). “Supermarket Expansion and the
Informal Food Economy in Southern African Cities: Implications
for Urban Food Security” Journal of Southern African Studies 37: 781-
807.
25. Crush, J., Frayne, B., McLachlan, M. (2011). Rapid Urbanization
and the Nutrition Transition in Southern Africa. AFSUN Report No. 7,
Cape Town.
26. Crush, J., Frayne, B. and Pendleton, W. (2012). “The Crisis of
Food Insecurity in African Cities” Journal of Hunger and Environmen-
tal Nutrition 7: 271-292.
27. Crush, J., Hovorka. A. and Tevera, D. (2011). “Food Security in
Southern African Cities: The Place of Urban Agriculture” Progress
in Development Studies 11: 285-305.
28. Crush, J. and McCordic, C. (2017). “The Hungry Cities Food Pur-
chases Matrix: Household Food Sourcing and Food System Interac-
tion” Urban Forum 28: 421-433.
29. Crush, J. and Riley, L. (2017). “Urban Food Security and Rural
Bias” HCP Discussion Paper No. 11, Waterloo and Cape Town.
30. Dakora, E. (2012). “Exploring the Fourth Wave of Supermarket
Evolution: Concepts of Value and Complexity in Africa” Interna-
tional Journal of Managing Value and Supply Chains 3: 25-37.
31. Dakora, E. (2016). “Expansion of South African Retailers’ Activi-
ties into Africa” Cape Peninsula University of Technology, Cape
Town.
32. Dakora, E. and Bytheway, A. (2014). “Entry Mode Issues in the
Internationalisation of South African Retailing” Mediterranean Jour-
nal of Social Sciences 5: 194-205.
THE SUPERMARKET REVOLUTION AND FOOD SECURITY IN NAMIBIA

URBAN FOOD SECURITY SERIES NO. 26 79
33. Dakora, E., Bytheway, A. and Slabbert, A. (2010). “The Africanisa-
tion of South African Retailing: A Review” African Journal of Busi-
ness Management 4: 748-754.
34. das Nair, R. (nd). “The Internationalisation of Supermarkets and
the Nature of Competitive Rivalry in Retailing in Southern Africa”
Centre for Competition, Regulation and Economic Development,
University of Johannesburg.
35. das Nair, R. (2015). “The Implications of the Growth of Supermar-
ket Chains in Southern Africa on Competitive Rivalry” Competi-
tion Commission and Competition Tribunal’s 9th Annual Confer-
ence on Competition Law, Economics and Policy, Johannesburg.
36. das Nair, R. and Chisoro, S. (2016). “The Expansion of Regional
Supermarket Chains and Implications for Local Suppliers: Capa-
bilities in South Africa, Botswana, Zambia and Zimbabwe” UNU
WIDER Working Paper 2016/114, Helsinki.
37. das Nair, R. and Chisoro, S. (2017). “The Expansion of Regional
Supermarket Chains: Implications on Suppliers in Botswana and
South Africa” UNU WIDER Working Paper 2017/26, Helsinki.
38. das Nair, R. and Dube, C. (2015). “Competition, Barriers to Entry
and Inclusive Growth: Case Study on Fruit and Veg City” Working
Paper 9/2015, Centre for Competition, Regulation and Economic
Development (CCRED), University of Johannesburg.
39. das Nair, R. and Dube, S. (2017). “Growth and Strategies of Large,
Lead Firms – Supermarkets” Working Paper 8/2017, CCRED,
University of Johannesburg.
40. Dawson, N., Martin, A. and Sikor, T. (2016). “Green Revolution
in Sub-Saharan Africa: Implications of Imposed Innovation for the
Wellbeing of Rural Smallholders” World Development 78: 204-218.
41. Deloitte (2015). African Powers of Retailing: New Horizons for Growth.
Johannesburg.
42. Dralle, T. (2017). “The South African Walmart/Massmart Case:
SME-Friendly Domestic Competition Laws in the Light of Inter-
national Economic Law” In T. Rensmann (ed.), Small and Medium
Enterprises in International Economic Law (Oxford: OUP), pp. 123-64.
43. Economist (2013). “The Grocers’ Great Trek: A Sluggish Home

80 AFRICAN FOOD SECURITY URBAN NETWORK (AFSUN)
Market is Pushing South Africa’s Big Retail Chains” The Economist
19 September.
44. Emongor, R. (2009). “The Impact of South African Supermarkets
on Agricultural and Industrial Development in the Southern Afri-
can Development Community” PhD Thesis, University of Preto-
ria, Pretoria.
45. Emongor, R. and Kirsten, J. (2009). “The Impact of South African
Supermarkets on Agricultural Development in the SADC: A Case
Study in Zambia, Namibia, and Botswana” Agrekon 48: 6-84.
46. Farina, E., Nunes, R. and Monteiro, G. (2005). “Supermarkets and
Their Impacts on the Agrifood System of Brazil: The Competition
Among Retailers” Agribusiness 21: 133-147.
47. Frayne, B. (2004). “Migration and Urban Survival Strategies in
Windhoek, Namibia” Geoforum 35: 489-505.
48. Gengenbach, H., Schurman, R., Bassett, T., Munro, W. and Mose-
ley, W. (2017). “Limits of the New Green Revolution for Africa:
Reconceptualising Gendered Agricultural Value Chains” Geograph-
ical Journal DOI: 10.1111/geoj.12233
49. Gorton, M., Sauer, J. and Supatpongkul, P. (2011). “Wet Mar-
kets, Supermarkets and the “Big Middle” for Food Retailing in
Developing Countries: Evidence from Thailand” World Development
39: 1624-1637.
50. Greenberg, S. (2017). “Corporate Power in the Agro-Food System
and the Consumer Food Environment in South Africa” Journal of
Peasant Studies 44: 467-496.
51. Hawkes, C. (2008). “Dietary Implications of Supermarket Devel-
opment: A Global Perspective” Development Policy Review 26: 657-
692.
52. Haysom, G. (2015). “Food and the City: Urban Scale Food System
Governance” Urban Forum 26: 263-281.
53. Huang, C., Tsai, K. and Chen, Y. (2015). “How Do Wet Markets
Still Survive in Taiwan?” British Food Journal 117: 234-256.
54. Humphrey, J. (2007). “The Supermarket Revolution in Develop-
ing Countries: Tidal Wave or Tough Competitive Struggle?” Journal
of Economic Geography 7: 433-450.
THE SUPERMARKET REVOLUTION AND FOOD SECURITY IN NAMIBIA

URBAN FOOD SECURITY SERIES NO. 26 81
55. Igumbor, E., Sanders, D., Puoane, T., Tsolekile, L., Schwarz, C.,
Purdy, C., Swart, R., Durão, S. and Hawkes, C. (2012). “‘Big
Food,’’ the Consumer Food Environment, Health, and the Policy
Response in South Africa” PLoS Medicine 9(7): e1001253.
56. Ijuma, C., Snyder, J., Tshirley, D. and Reardon, T. (2015). “Stages
of Transformation in Food Processing and Marketing: Results of an
Initial Inventory of Processed Food Products in Dar es Salaam, Aru-
sha, and Mwanza” Tanzania Policy Research Brief No. 3, Michigan
State University, Ann Arbor.
57. Kaira, C. and Haidula, T. (2014). “Checkers and Shoprite Probed
Over Mislabelling” The Namibian 11 September.
58. Kalundu, K. and Meyer, F. (2017). “The Dynamics of Price Adjust-
ment and Relationships in the Formal and Informal Beef Markets in
Namibia” Agrekon 56: 53-66.
59. Kambwale, J., Chisoro, C. and Karodia, J. (2015). “Investigation
into the Causes of Small and Medium Enterprise Failures in Wind-
hoek, Namibia” Arabian Journal of Business and Management Review 4:
80-109.
60. Kapitako, A. (2017a). “Union Mounts National Campaign to Boy-
cott Shoprite” New Era 19 September.
61. Kapitako, A. (2017b). “Shoprite Workers to Vote on Strike” The
Namibian 21 February.
62. Karaan, M. and Kirsten, J. (2008). “A Programme to Mainstream
Black Farmers into Supply Chains: An Emphasis on Fresh Pro-
duce” Southern Africa Policy Brief 6, Regoverning Markets Proj-
ect, IIED, London.
63. Katjangu, N. (2017). “Shoprite Exploitive, says Nghimtina” The
Namibian 21 July.
64. Kazembe, L. and Nickanor, N. (2017). “Spatial Modelling of the
Relationship Between Socio-Economic Disadvantage and Child
Health in Namibia” Spatial Demography 5: 1-24.
65. Kelly, M., Seubsman, S., Banwell, C. and Dixon, J. (2014). “
Thailand’s Food Retail Transition: Supermarket and Fresh Market
Effects on Diet Quality and Health” British Food Journal 116: 1180-
1193.

82 AFRICAN FOOD SECURITY URBAN NETWORK (AFSUN)
66. Kennedy, G., Nantel, G. and Shetty, P. (2004). “Globalization of
Food Systems in Developing Countries: A Synthesis of Country
Case Studies” FAO Food and Nutrition Paper 83, Rome.
67. Kenny, B. (2014). “Walmart in South Africa: Precarious Labor and
Retail Expansion” International Labor and Working Class History 86:
173-177.
68. Kimenju, S., Rischke, R., Klasen, S. and Qaim, M. (2015). “Do
Supermarkets Contribute to the Obesity Pandemic in Developing
Countries?” Public Health Nutrition 18: 3224-3233.
69. Louw, A., Chikazunga, D., Jordaan, D. and Biénabe, E. (2007).
“Restructuring Food Markets in South Africa: Dynamics Within
the Context of the Tomato Subsector” Agrifood Sector Studies,
Regoverning Markets Project, University of Pretoria.
70. Meyer, D. and Keyser, E. (2016). “Validation and Testing of the
Lived Poverty Index Scale (LPI) in a Poor South African Commu-
nity” Social Indicators Research 129: 147-159.
71. Michelson, H., Reardon, T., Perez, F. (2012). “Small Farmers and
Big Retail: Trade-offs of Supplying Supermarkets in Nicaragua”
World Development 40: 342–354.
72. Miller, D., Saunders, R. and Oloyede, O. (2008). “South African
Corporations and Post-Apartheid Expansion in Africa: Creating a
New Regional Space” African Sociological Review 12: 1-19.
73. Minten, B., Reardon, T. and Sutradhar, R. (2010). “Food Prices
and Modern Retail: The Case of Delhi” World Development 38:
1775-1787.
74. Monteiro C., Levy, R., Claro, R., de Castro. I and Cannon G.
(2011). “Increasing Consumption of Ultra-Processed Foods and
Likely Impact on Human Health: Evidence from Brazil” Public
Health Nutrition 14: 5-13.
75. Monteiro, C., Moubarac, J.-C., Cannon, G., Ng, S. and Popkin, B.
(2013). “Ultra-Processed Products are Becoming Dominant in the
Global Food System” Obesity Reviews 14(S2): 21-28.
76. Moustier, P., Tam, P., Anh, D., Binh, V. and Loc, N. (2010). “The
Role of Farmer Organizations in Supplying Supermarkets with
Quality Food in Vietnam” Food Policy 35: 69-78.
THE SUPERMARKET REVOLUTION AND FOOD SECURITY IN NAMIBIA

URBAN FOOD SECURITY SERIES NO. 26 83
77. Muchopa, C. (2013). “Agricultural Value Chains and Smallholder
Producer Relations in the Context of Supermarket Proliferation in
Southern Africa” International Journal of Managing Value and Supply
Chains 4: 33-44.
78. Nakashole, N. (2017). “Nafau wants all Shoprite Workers to Join
one Union” The Namibian 18 May.
79. New Era (2017). “Union Challenges Nghimtina over Shoprite
Workers” New Era 17 August.
80. NPC (nd). Namibia Poverty Mapping (Windhoek: National Planning
Commission).
81. Nickanor, N. (2014). “Food Deserts and Household Food Inse-
curity in the Informal Settlements of Windhoek, Namibia” PhD
Thesis, University of Cape Town, Cape Town.
82. Nortons Inc (2016). “Grocery Retail Sector Market Inquiry: Pick n
Pay Submission” Johannesburg.
83. Ogbokor, C. and Ngeendepi, E. (2012). “Investigating the Chal-
lenges Faced by SMEs in Namibia” Department of Economics,
Polytechnic of Namibia, Windhoek.
84. Olbrich, R., Quass, M. and Baumgärtner, M. (2014). “Character-
izing Commercial Cattle Farms in Namibia: Risk, Management
and Sustainability” Working Paper No. 248, University of Lüne-
burg.
85. Parker, H. and Luiz, J. (2015). “Designing Supply Chains Into
Africa: A South African Retailer’s Experience” In W. Piotrowicz
and R. Cuthbertson (eds.), Supply Chain Design and Management for
Emerging Markets (London: Springer), pp. 65-85.
86. Pendleton, W., Crush, J. and Nickanor, N. (2014). “Migrant Wind-
hoek: Rural-Urban Migration and Food Security in Namibia”
Urban Forum 25: 191-205.
87. Petersen, L. (2016). “Submission to Grocery Retail Sector Inquiry”
Sustainable Livelihoods Foundation and DST-NRG Centre of
Excellence in Food Security, Cape Town.
88. Peyton, S., Moseley, W. and Battersby, J. (2015). “Implications of
Supermarket Expansion on Urban Food Security in Cape Town,
South Africa” African Geographical Review 34: 36-54.
84 AFRICAN FOOD SECURITY URBAN NETWORK (AFSUN)
89. Pick n Pay (2016). Pick n Pay Integrated Annual Report 2016. At:
www.picknpayinvestor.co.za/downloads/2016/PnP_IAR_2016.pdf
90. PnP (2017). “Pick n Pay Growing Local with Otavifontein” At:
http://www.pnp.na/pick-n-pay-growing-local-otavifontein
91. Popkin, B. and Slining, M. (2013). “New Dynamics in Global Obe-
sity Facing Low- and Middle-Income Countries” Obesity Reviews
14(S2): 11-20.
92. Popkin B., Adair, L. and Ng, S. (2012). “Global Nutrition Transi-
tion and the Pandemic of Obesity in Developing Countries” Nutri-
tion Reviews 70: 3-21.
93. Reardon, T., Timmer, C., Barrett, C. and Berdegué, J. (2003).
“The Rise of Supermarkets in Africa, Asia, and Latin America”
American Journal of Agricultural Economics 85: 1140-1146.
94. Reardon, T. (2011). “The Global Rise and Impact of Supermarkets:
An International Perspective” Paper for Conference on the Super-
market Revolution in Food, Canberra, Australia. At: https://ideas.
repec.org/p/ags/cfcp11/125312.html
95. Reardon, T. (2015). “The Hidden Middle: The Quiet Revolution
in the Midstream of Agrifood Value Chains in Developing Coun-
tries” Oxford Review of Economic Policy 31: 45-63.
96. Reardon, T. and Hopkins, R. (2006). “The Supermarket Revolu-
tion in Developing Countries: Policies to Address Emerging Ten-
sions Among Supermarkets, Suppliers and Traditional Retailers”
European Journal of Development Research 18: 522-545.
97. Reardon, T. and Minten, B. (2011). “Surprised by Supermarkets:
Diffusion of Modern Food Retail in India” Journal of Agribusiness in
Developing and Emerging Economies 1: 134-161.
98. Reardon T., Henson S. and Berdegué, J. (2007). “‘Proactive Fast-
Tracking’ Diffusion of Supermarkets in Developing Countries:
Implications for Market Institutions and Trade” Journal of Economic
Geography 7: 399-431.
99. Reardon, T., Barrett, P., Berdegué, J. and Swinnen, J. (2009).
“Agrifood Industry Transformation and Small Farmers in Develop-
ing Countries” World Development 37: 1717-1727.
THE SUPERMARKET REVOLUTION AND FOOD SECURITY IN NAMIBIA

URBAN FOOD SECURITY SERIES NO. 26 85
100. Reardon, T., Timmer, C., Barrett, C. and Berdegué, J. (2003).
“The Rise of Supermarkets in Africa, Asia, and Latin America”
American Journal of Agricultural Economics 85: 1140-1146.
101. Ruel, M., Garrett, J., Yosef, S. and Olivier, M. (2017). “Urbaniza-
tion, Food Security and Nutrition” In S. de Pee, D. Taren and M.
Bloem (eds.), Nutrition and Health in a Developing World (New York:
Humana Press), pp. 705-735.
102. Schipmann, C. and Qaim, M. (2011). “Modern Food Retailers and
Traditional Markets in Developing Countries: Comparing Quality,
Prices, and Competition Strategies in Thailand” Applied Economic
Perspectives and Policy 33: 345-362.
103. Shoprite (2016). Shoprite Holdings Ltd. Annual Financial Statements,
2016. At: https://www.shopriteholdings.co.za/search-results/shop-
rite-holdings-documents/financial-statements.html
104. Si, Z., Scott, S. and McCordic, C. (2016). “Supermarkets, Wet
Markets and Food Patronage in Nanjing, China” HCP Discussion
Paper No. 4, Waterloo.
105. Skinner, C. (2016). “Informal Food Retail in Africa: A Review of
Evidence” Consuming Urban Poverty Project Working Paper No.
2, African Centre for Cities, University of Cape Town.
106. Skinner, C. and Haysom, G. (2017). “The Informal Sector’s Role in
Food Security: A Missing Link in Policy Debates?” HCP Discus-
sion Paper No. 6, Waterloo and Cape Town.
107. Smit, W. (2016). “Urban Governance and Urban Food Systems in
Africa: Examining the Linkages” Cities 58: 80-86.
108. Spar Group (2016). The Spar Group Ltd. Integrated Report 2016. At:
https://www.spar.co.za/About-SPAR/SPAR-Financial/Annual-
Reports-(1)
109. Suryadarma, D., Poesoro, A., Budiyati, S. and Rosfadhila, M.
(2010). “Traditional Food Traders in Developing Countries and
Competition from Supermarkets: Evidence from Indonesia” Food
Policy 35: 79-86.
110. Thomas, B., Togarepi, C. and Simasiku, A. (2014). “Analysis of the
Determinants of the Sustainability of Cattle Marketing Systems in

86 AFRICAN FOOD SECURITY URBAN NETWORK (AFSUN)
Zambezi Region of North-Eastern Communal Area of Namibia”
International Journal of Livestock Production 5: 129-136.
111. Timmer, C. (2009). “Do Supermarkets Change the Food Policy
Agenda?” World Development 37: 1812-1819.
112. Timmer, C. (2017). “The Impact of Supermarkets on Nutrition and
Nutritional Knowledge: A Food Policy Perspective” In S. de Pee,
D. Taren and M. Bloem (eds.), Nutrition and Health in a Developing
World (New York: Humana Press), pp. 737-752.
113. Toiba, H., Umberger, W. and Minot, J. (2015). “Diet Transition
and Supermarket Shopping Behaviour: Is There a Link?” Bulletin of
Indonesian Economic Studies 51: 389-403.
114. Trebbin, A. (2014). “Linking Small Farmers to Modern Retail
Through Producer Organizations: Experiences with Producer
Companies in India” Food Policy 45: 35-44.
115. Tschirley, D., Reardon, T., Dolislanger, M. and Snyder, J. (2015).
“The Rise of a Middle Class in East and Southern Africa: Implica-
tions for Food System Transformation” Journal of International Devel-
opment 27: 628-646.
116. Umberger, W., He, X., Minot, N. and Toiba, H. (2015). “Examin-
ing the Relationship between the Use of Supermarkets and Over-
nutrition in Indonesia” American Journal of Agricultural Economics 97:
510-525.
117. van der Heijden and Vink, N. (2013). “Good for Whom? Super-
markets and Small Farmers in South Africa: A Critical Review
of Current Approaches to Increasing Access to Modern Markets”
Agrekon 52: 68-86.
118. Vink, N. (2013). “Commercialising Agriculture in Africa: Eco-
nomic, Social, and Environmental Impacts” African Journal of Agri-
cultural and Resources Economics 9: 1-17.
119. Vorley, B., Fearne, A., and Ray, D. (2008). Regoverning Markets: A
Place for Small Scale Producers in Modern Agrifood Chains? (London:
Routledge).
120. Weatherspoon, D. and Reardon, T. (2003). “The Rise of Super-
markets in Africa: Implications for Agrifood Systems and the Rural
Poor” Development Policy Review 21: 333-355.
THE SUPERMARKET REVOLUTION AND FOOD SECURITY IN NAMIBIA

URBAN FOOD SECURITY SERIES NO. 26 87
121. Woolworths (2016). Woolworths Holdings Ltd. 2016 Annual Finan-
cial Statements. At: http://www.woolworthsholdings.co.za/investor/
financial_results.asp
122. World Future Council (nd). Growing Food in Windhoek. At: https://
www.worldfuturecouncil.org/file/2017/03/Food-Handbook-final-
web.pdf
123. Zhang, Q. and Pan, Z. (2013). “The Transformation of Urban Veg-
etable Retail in China: Wet Markets, Supermarkets and Informal
Markets in Shanghai” Journal of Contemporary Asia 43: 497-518.

THE SUPERMARKET
REVOLUTION AND
FOOD SECURITY
IN NAMIBIA
The surprisingly high rate of supermarket patronage in low-income
areas of Windhoek, Namibia’s capital and largest city, is at odds with
conventional wisdom that supermarkets in African cities are primarily
patronized by middle and high-income residents and therefore target
their neighbourhoods. What is happening in Namibia and other
Southern African countries that make supermarkets so much more
accessible to the urban poor? What are they buying at supermarkets
and how frequently do they shop there? Further, what is the impact of
supermarket expansion on informal food vendors? This report, which
presents the findings from the South African Supermarkets in Growing
African Cities project research in 2016-2017 in Windhoek, looks at the
evidence and tries to answer these questions and others. The research
and policy debate on the relationship between the supermarket revo-
lution and food security is also discussed. Here, the issues include
whether supermarket supply chains and procurement practices miti-
gate rural food insecurity through providing new market opportunities
for smallholder farmers; the impact of supermarkets on the food secu-
rity and consumption patterns of residents of African cities; and the
relationship between supermarket expansion and governance of the
food system, particularly at the local level.
AFRICAN FOOD SECURITY URBAN NETWORK (AFSUN)