the study of energy storage in ontario distribution systems study of energy storage... · the study...
TRANSCRIPT

The Study of Energy Storage in
Ontario Distribution Systems
May 2017
Energy storage technologies have the potential to provide a number of benefits to Ontario’s
electricity distribution system. This report seeks to identify and quantify the benefits, costs,
opportunities, and barriers of various energy storage applications on Ontario’s distribution
system.
Prepared by:

The Study of Energy Storage in Ontario Distribution Systems
Table of Contents_
Executive Summary ............................................................................................................................................... i
Energy Storage Already Exists in Ontario ...................................................................................................... i
Benefits of Energy Storage................................................................................................................................. i
Barriers to Energy Storage ................................................................................................................................. i
Use Cases and Conclusions .............................................................................................................................. ii
Background and History of Energy Storage in Ontario ................................................................................... 1
Stakeholder Identification and Outreach ........................................................................................................... 3
Current State of Distribution Connected Storage in Ontario .......................................................................... 4
Deployed Technologies .................................................................................................................................... 4
Current and Planned Projects .......................................................................................................................... 5
Revenue Streams Available to Project Owners ............................................................................................. 9
Barriers to Current Projects ............................................................................................................................ 13
Ontario Distribution Connected Storage Benefit Assessment ...................................................................... 14
Location ............................................................................................................................................................. 14
Distribution Grid Topology ........................................................................................................................... 14
Size of Distributor ............................................................................................................................................ 15
Geographic Environment ............................................................................................................................... 15
Possible Benefits ............................................................................................................................................... 16
Monetary Value of Benefits ............................................................................................................................ 16
Beneficiaries of Energy Storage ..................................................................................................................... 16
Ontario Distribution Connected Storage Barrier Assessment ....................................................................... 17
IESO and LDC Connection and Communication Costs ............................................................................. 17
Permits and Licensing ..................................................................................................................................... 17
GA and Demand Charges .............................................................................................................................. 17
Other Commercial Issues ............................................................................................................................... 20
Other Non-Commercial Issues ...................................................................................................................... 21
Example Use Cases .............................................................................................................................................. 23
Conclusions .......................................................................................................................................................... 40

The Study of Energy Storage in Ontario Distribution Systems
Suggestions on How to Monetize Indirect Benefits .................................................................................... 40
Tools Available to Address Identified Barriers ........................................................................................... 42
Top Three Scenarios ........................................................................................................................................ 43
Appendix A .......................................................................................................................................................... 45
Appendix B ........................................................................................................................................................... 49
Appendix C .......................................................................................................................................................... 56
Appendix D .......................................................................................................................................................... 58
Appendix E ........................................................................................................................................................... 64
References ............................................................................................................................................................. 70

The Study of Energy Storage in Ontario Distribution Systems
Table of Figures
Figure 1: Example Use Case 15 Year Lifecycle ............................................................................................ 24
Figure 2: Present Value of Benefits and Costs - Case 1 .............................................................................. 26
Figure 3: Present Value of Benefits and Costs - Case 2 .............................................................................. 29
Figure 4: Present Value of Benefits and Costs - Case 3 .............................................................................. 32
Figure 5: Present Value of Benefits and Costs - Case 4 .............................................................................. 35
Figure 6: Present Value of Benefits and Costs - Case 5 with Demand Charges ..................................... 38
Figure 7: Present Value of Benefits and Costs - Case 5 without Demand Charges ................................ 39
Figure 8: Distribution of Non-Spinning Operating Reserve Market Price .............................................. 51
Figure 9: Distribution of Spinning Operating Reserve Market Price ....................................................... 51
Figure 10: Distribution of HOEP Market Price .............................................................................................. 52
Figure 11: Case 1 – 15 Year Project Life Cost and Benefit Chart ................................................................. 58
Figure 12: Case 2 – 15 Year Project Life Cost and Benefit Chart ................................................................. 59
Figure 13: Case 3 – 15 Year Project Life Cost and Benefit Chart ................................................................. 60
Figure 14: Case 4 – 15 Year Project Life Cost and Benefit Chart ................................................................. 61
Figure 15: Case 5 (Demand Included) – 15 Year Project Life Cost and Benefit Chart ............................. 62
Figure 16: Case 5 (Demand Not Included) – 15 Year Project Life Cost and Benefit Chart ...................... 63
Figure 17: Generation Cash Flow .................................................................................................................... 64
Figure 18: Storage Process Cash Flow ............................................................................................................ 65
Figure 19: Imbalance of HOEP and GA Payments ....................................................................................... 67
Figure 20: Case 1 – Original Scenario and 20% GA Scenario ...................................................................... 68
Figure 21: Case 2 – Original Scenario and 20% GA Scenario ...................................................................... 68
Figure 22: Case 3 – Original Scenario and 20% GA Scenario ...................................................................... 69
Figure 23: Case 4 – Original Scenario and 20% GA Scenario ...................................................................... 69

The Study of Energy Storage in Ontario Distribution Systems
Table of Tables
Table 1: Ontario Energy Storage Project Summary..................................................................................... 8
Table 2: Currently Monetizable Benefits, from Appendix A, Value Matrix .......................................... 10
Table 3: Benefit Definitions, from Appendix A, Value Matrix ................................................................ 11
Table 4: Direct Benefit Matrix ...................................................................................................................... 12
Table 5: General Barriers to Energy Storage Matrix ................................................................................. 13
Table 6: Demand Charge Calculation (1 MW, 4MWh, operating daily) ................................................ 18
Table 7: Usage Charge Calculation (1 MW, 4 MWh, operating daily) ................................................... 18
Table 8: Global Adjustment Calculation ..................................................................................................... 19
Table 9: Benefit Streams - Case 1 ................................................................................................................. 25
Table 10: Monthly Common Costs - Case 1 ................................................................................................. 25
Table 11: One Time Common Costs - Case 1 ............................................................................................... 26
Table 12: Benefit Streams - Case 2 ................................................................................................................. 27
Table 13: Common Costs – Case 2 ................................................................................................................. 28
Table 14: One Time Common Costs - Case 2 ............................................................................................... 28
Table 15: Benefit Streams - Case 3 ................................................................................................................. 30
Table 16: Common Costs - Case 3.................................................................................................................. 31
Table 17: One Time Common Costs - Case 3 ............................................................................................... 31
Table 18: Benefit Streams - Case 4 ................................................................................................................. 33
Table 19: Common Costs - Case 4.................................................................................................................. 34
Table 20: One Time Common Costs - Case 4 ............................................................................................... 34
Table 21: Benefit Streams - Case 5 ................................................................................................................. 36
Table 22: Common Costs - Case 5.................................................................................................................. 37
Table 23: One Time Common Costs - Case 4 ............................................................................................... 37
Table 24: Indirect Benefit Value Matrix ........................................................................................................ 41
Table 25: Five Coincident Ontario Peaks for 2015 ....................................................................................... 53
Table 26: Permit Type and Possible Cost...................................................................................................... 57

The Study of Energy Storage in Ontario Distribution Systems
i
Executive Summary
Engagement
In March 2016, the Ministry of Energy requested a Study of Energy Storage in Ontario Distribution
Systems. This study seeks to identify and assess opportunities for beneficial energy storage
applications within Ontario’s distribution system. In doing so, regulatory, technical, commercial, and
non-commercial barriers that may prevent this value from being realized by utilities, rate payers, and
owners are also examined.
Energy Storage Already Exists in Ontario
Energy storage has existed in Ontario for many years. The most developed technology is pumped
hydro storage, using an elevated water reservoir to drive turbines. Other technologies, such as
batteries, flywheels, and compressed air, have made several technological advancements and continue
to mature. These advancements are making other technologies more viable options for distribution
connected energy storage projects. In recent years, many projects varying from small behind-the-meter
batteries to large regulating facilities located near transformer stations have been commissioned.
Ontario is investigating what can be done to further enable the benefits provided by distribution
connected energy storage projects in the province.
Benefits of Energy Storage
There are many direct and indirect benefits stemming from energy storage installations. Direct
benefits of storage include: improved asset and generation management, regulation services, operating
reserve, and system reliability improvement. These benefits are innate for storage projects, and many
of the benefits are better achieved at the beginning and middle of a feeder rather than the end of a
feeder. Indirect benefits of energy storage include: excess generation mitigation, greenhouse gas
reduction, and the enablement of higher penetrations of renewables. A significant challenge that has
emerged for energy storage projects is the inability of storage facility owners to monetize these indirect
benefits in order to enable projects to be considered economically viable.
Barriers to Energy Storage
Many barriers to energy storage are caused by projects fitting into both “generation” and “load”
categories within a distribution system simultaneously. Current Ontario regulation, market rules, and
industry thought processes are geared to a more binary distribution system and storage generally does
not fit this model. As a result, for many storage applications Ontario’s Global Adjustment (“GA”)
charges, utility demand charges, and other similar tariffs are real costs that apply when a facility is
storing energy but cannot be recouped through existing market mechanisms while discharging. The

The Study of Energy Storage in Ontario Distribution Systems
ii
cost of GA alone can amount to more than all other common project costs combined, and may eclipse
the amount of revenue that is available to a given project for the direct benefits it provides.
Use Cases and Conclusions
Included in this report are five energy storage “use cases” intended to demonstrate the versatility
as well as the impact of benefit streams, location, and barriers for typical applications. Each use case
demonstrates a different benefit stack, common project costs (independent of technology), and
potential revenue streams if all benefits could be monetized. The use cases clearly demonstrate the
magnitude of Global Adjustment charges compared to other costs. They also identify other potential
benefits provided by energy storage facilities that would require regulatory/market rule changes
and/or Power Purchase Agreements (“PPA”) in order to monetize these benefits. These are termed
“indirect benefits”.
This report presents several conclusions that are of significance to the reader. The first of these is
that technically, more benefits can be provided by distribution connected storage located near
transmission stations as opposed to further away. This may seem intuitive to informed readers,
however less intuitive and somewhat unexpected is the conclusion that, commercially, more benefits
can be monetized when furthest away from the transformer station (particularly behind the meter),
given Ontario’s market structure. Without intervention, it appears that behind the meter applications
will outpace the growth of all other applications. The reader is provided with two key tools, the Benefit
Matrix and Value Matrix, which can be used to assess other potential use cases in Ontario beyond the
five cases illustrated in this report.
Several suggestions are provided for consideration to facilitate energy storage project development
in Ontario. Global Adjustment settlements based on net consumption of the storage facility, reduced
demand charges based on the benefits provided, consideration of PPAs as a means to enable storage
owners to monetize indirect benefits, and integration with renewable generators are among the
suggestions provided.

The Study of Energy Storage in Ontario Distribution Systems
1
Background and History of Energy Storage in Ontario
An essential characteristic of energy storage
systems is their ability to shift energy from one
period of time to another. When applied
efficiently, this unique ability often increases
the value of energy when it is consumed as
compared to if it had been consumed at the
point in time when it was generated. As a
result, energy storage systems have the
capability to provide several services and
advantages to an electrical distribution system.
Generally, these services can include:
Shifting energy consumption from high
demand periods to lower demand
periods
More efficient utilization and
management of excess generation
Capacity and congestion management
Ancillary services
Deferral of investments in, or expansion
of, distribution systems
Providing operating reserves
Providing redundant power in the event
of an outage
Firming the output of variable generation
resources (i.e. solar, wind, run of the
river)
Due to the variety of potential services
provided, benefits afforded by energy storage
systems can vary greatly. The type of storage
technology in question, the specific needs of the
electrical grid, the capacity of the energy
storage system, the physical size of the energy
storage system, the location of the system (both
geographically and electrically), and other
factors could significantly impact the benefits
delivered by energy storage facilities.
Recognizing these benefits, several
jurisdictions have acted to implement energy
storage projects. In California, Southern
California Edison Utility announced plans to
commission 261 MW of energy storage capacity
in 2014, as part of an initiative to offset the
closing of a 2,200 MW nuclear plant. In New
York, Con Edison was strategizing to use
energy storage resources to avoid or defer the
construction of an estimated $1 billion
substation. Texas, which has the most installed
wind capacity among all 50 states in 2016, used
energy storage to smooth the inherently
intermittent output of wind generators [1].
Despite a recent surge of interest, energy
storage is not a new phenomenon in Ontario.
The 174 MW Sir Adam Beck Pump Generating
Station and its 300 hectare reservoir have been
providing energy storage benefits to Ontario’s
electricity grid since 1958. Since that time,
existing technologies are improving, new
technologies are emerging, and the Ontario
electricity distribution system is evolving. A
number of energy storage projects have
recently developed in Ontario, utilizing various
technologies, with more projects planning to
come online in the coming months and years.
In 2012, Ontario’s Independent Electricity
System Operator (“IESO”) launched the
Alternative Technologies for Regulation (ATR)

The Study of Energy Storage in Ontario Distribution Systems
2
procurement to secure 10 MW of regulation
service. While not specifically targeted in this
procurement, energy storage systems were
featured prominently among the potential
service providers. The IESO subsequently
signed contracts with flywheel and battery
storage providers. These projects have been
built and commissioned, and are currently
providing regulation services to the IESO as of
2016.
The IESO issued its Grid Energy Storage
procurement with the objective of specifically
investigating energy storage system capabilities
for providing regulation, and reactive support
and voltage control (RSVC). Successful projects
could also be dispatched to provide energy
shifting, ramping support, and management of
excess generation services at the IESO level.
This procurement occurred in two stages: Phase
I launched in 2014 and a total of 33.54 MW of
capacity were contracted; Phase II launched in
2015 and saw 16.75 MW of capacity awarded to
proponents.

The Study of Energy Storage in Ontario Distribution Systems
3
Stakeholder Identification and Outreach
This study’s research focuses primarily on
an in-depth review of existing published
studies and reports, Ontario energy market
data, and consultations with identified industry
stakeholders. While this study is primarily
concerned with the Ontario electricity system,
stakeholders were not necessarily limited to
those with a presence in Ontario. Five
stakeholder categories and over 50 contacts
were identified in an effort to ensure that a
broad base of perspectives could be captured.
The five categories are:
1. Energy Storage Technology Providers and
Developers
2. Local Distribution Companies and Utilities
3. Energy Storage Owners, Operators and
Site Hosts
4. Regulatory Bodies, Agencies, and
Academia
5. Industry Associations
During the research phase of this study,
each individual stakeholder was asked to
participate in an interview. A standard set of
questions specific for each stakeholder category
was developed as a baseline for gathering
information. During the analysis stage,
stakeholders may have been contacted again
for clarification or additional information.
Consultations with stakeholders provided
invaluable insights, not only to the Ontario
market, but also in other jurisdictions which
have actively engaged in energy storage system
development.

The Study of Energy Storage in Ontario Distribution Systems
4
Current State of Distribution Connected Storage in Ontario
Although the topic of energy storage often
refers to emerging technology, there are several
projects throughout the province which are
planned, under construction, or have already
been commissioned in recent years. This
portion of the report outlines Ontario’s current
situation regarding technology, benefits,
revenue streams, challenges and barriers.
Deployed Technologies
There are four main types of technology
currently deployed in Ontario. These
technologies have varying capabilities and
energy capacities, but all strive to improve the
electrical grid. A brief description of each
technology and its capabilities can be found
below.
Battery – A battery, by definition, has one
positively charged material and one negatively
charged material. When ions travel from one
material to another, the battery is either
charged or discharged, thereby consuming or
releasing energy. Flow batteries use two
chemical solutions which flow through two
separate pumps and combine to release energy.
They have a potentially endless number
charge/discharge cycles, but have a lower
energy density than solid batteries. Solid
batteries are likely the most common
technology that people would consider for
energy storage. Unlike a flow battery, it uses a
solid electrolyte and solid electrode to store
positive and negative charges. When a
charge/discharge cycle is performed, some of
the ionic compounds are unable to be
separated, so over time a solid battery could
lose its ability to be charged and discharged.
Compressed Air – Compressed air facilities
use electricity to drive a motor and compressor
to pressurize air in a holding facility, either
underground or underwater. Air can be stored
indefinitely under pressure and can be released
allowing a generator to produce electricity
when needed. These facilities have the highest
energy capacity, although they have a lower
efficiency than other types of storage. The
efficiency of this technology has improved with
the advancement of heat storage, as heating air
upon depressurization is required for most
applications.
Flywheel – Electricity drives a motor
which causes the flywheel to start spinning,
storing electricity as kinetic energy. When
electricity is needed, the momentum of the
flywheel is used to turn a generator, releasing
electrical energy. Due to energy being stored as
momentum, flywheels tend to have low energy
retention and quickly discharge if not
constantly used. Flywheels can move from
fully charging to fully discharging almost
instantly, which makes them desirable for
applications which require fast response times.
Pumped Water Storage – This technology is
the oldest form of energy storage in Ontario
and has the most installed storage potential of
any of the mentioned technologies. Due to the
typical scale required for a project, this
technology is typically connected to the
The Study of Energy Storage in Ontario Distribution Systems
5
transmission system and is therefore out of
scope for this study.
Current and Planned Projects
Although not an exhaustive list, some of the
more notable energy storage projects that are
currently operating or under development in
Ontario include:
A pilot project named POWER.HOUSE
consisting of 20 customer homes, each
with a 5 kW solar photovoltaic generator
with an 11.4 kWh lithium-ion battery
connected behind the meter. The systems
are controlled through software that
aggregates the individual energy storage
systems as a virtual power plant,
simulating a single 100 kW generator.
Benefits of this project include: protecting
the customer against power outages,
offsetting peak electricity rates, and
relieving strain on the grid during
periods of peak demand. This inventive
project won the Innovation Award in the
Distributed Storage Project category from
Energy Storage North America (ESNA).
There is a partnership with Thunder Bay
Hydro to expand the pilot project to other
local electric utilities [2].
Korea Electric Power Corporation has
recently completed development of the
Penetanguishene Micro Grid in
Penetanguishene, ON. The system is
comprised of a 750 kW power conversion
system, 500 kWh of battery storage, and
associated controls. The system has the
capacity to provide several hours of
backup power supply for approximately
400 customers and helps increase the
resiliency and operational flexibility of
the existing grid [3].
Opus One developed the Athletes’
Village for Toronto’s 2015 Pan Am
Games, which included energy storage
and electric vehicle charging stations. The
project is a microgrid demonstration
which uses storage to shift energy
produced during the day to supply load
at night [4].
Hydrostor Inc. has developed a 660 kW
to 1 MW compressed air energy storage
system in Toronto Hydro service
territory. This unique system converts
electricity into compressed air which is
stored in underwater accumulators. Heat
derived from compression is stored for
later use during generation. When
electricity is needed, the compressed air
is released from the accumulators and
stored heat is added to improve the
overall efficiency of the system. The
heated air travels to an expander that
enables a generator to produce power [5].
eCAMION, in conjunction with Toronto
Hydro and Ryerson University,
developed a novel pole-mounted energy
storage project in Toronto. The lithium-
ion 25 kW / 16 kWh system utilizes
batteries mounted to existing utility poles
and an intelligent controller developed
by Ryerson University that can
communicate with smart meters. The

The Study of Energy Storage in Ontario Distribution Systems
6
system benefits include load levelling,
deferral of infrastructure upgrades, and
increased reliability and operational
flexibility of the grid [6].
eCAMION worked with Toronto Hydro
to install a 500 kW / 250 kWh lithium-ion
battery project for community energy
storage. The project is helping utilize
assets more effectively, smoothing load,
and for backup power supply [7].
NRStor has developed a 2 MW flywheel
project in Minto to provide frequency
regulation service by utilizing Temporal
Power’s flywheel energy storage
technology. The project is the first
commercial flywheel energy storage
project in Canada [8].
Hydro One Networks Inc. has planned a
Temporal flywheel system in Clear
Creek, ON to regulate the large voltage
swings caused by a 20 MW wind farm [9].
Customers were experiencing poor
power quality due to the intermittent
nature of wind power and the feeder
configuration. Construction has not yet
begun.
Opus One Solutions has collaborated
with Hydro One as the utility host, and
eCAMION as the battery provider, to
develop their Distributed Energy
Management and Storage Network
(DEMSN) Project. The project’s objective
is to maximize integration of solar
photovoltaic and other resources in the
distribution system by deploying a
battery energy storage system in
combination with Opus One’s smart grid
software applications [10].
RES Canada has developed a lithium-ion
battery storage project in Strathroy, ON.
The system is 4 MW / 2.6 MWh and
provides frequency regulation service to
the IESO under a three year agreement
[11].
NEDO and Oshawa Power and Utilities
Corporation have partnered to develop a
pilot project involving 30 homes in the
City of Oshawa [12]. The project involves
30 residential rooftop solar PV systems
that are combined with 10 kWh lithium-
ion batteries and sophisticated controls.
The system allows homeowners to better
manage their consumption and
generation, reducing their cost of
electricity, and providing a source of
backup power in the event of a grid
failure.
Convergent Energy and Power Inc. plan
to install 7 MW of lithium-ion batteries at
a substation in Sault Ste. Marie, ON.
Construction began in fall 2016, with the
system expected to be online in March
2017 [13]. This is a three year pilot
contracted through the IESO to determine
how it can improve grid reliability.
Hydrogenics uses power-to-gas for
energy storage. They have won 2 MW
procurement through the IESO for a
project in the Greater Toronto Area [14].

The Study of Energy Storage in Ontario Distribution Systems
7
Ameresco Canada Inc. has won two solid
battery projects in IESO’s Phase II energy
storage procurement. Both facilities will
be 2 MW / 8 MWh arrangements to shift
excess generation to periods of higher
demand and support the grid [15].
Baseload Power Corp has won IESO
Phase II energy storage procurement for a
2 MW / 8 MWh flow battery. The main
purposes for this project are grid support
and arbitrage [15].
NextEra Canada will be commissioning
two lithium-ion projects which will be
dispatched by the IESO as required to
relieve excess generation and peak
demand on the grid. Each project will be
2 MW / 8 MWh [15].
NRStor Inc. partnered with Hydrostor to
commission a 1.75 MW / 7 MWh, fuel free
compressed air facility in Goderich, ON.
Its main focus will be storing excess
energy for later use. This project is
expected to begin construction in 2017 [5].
Panasonic ECO Solutions partnered with
the University of Ontario Institute of
Technology (UOIT) to develop a
MicroGrid and Research Park, consisting
of a 500 kW Lithium-ion battery storage
system and a 50 kW solar PV generator
[16].
SunEdison Canada has been awarded
three flow battery projects, totaling 5 MW
and 20 MWh. The projects will be used by
the IESO to store and release energy as
needed and for RSVC [15].

The Study of Energy Storage in Ontario Distribution Systems
8
Project Technology Capacity Benefits
POWER.HOUSE Lithium-ion Battery 228 kWh Redundant power supply
Penetanguishene Micro
Grid
Battery 500 kWh Redundant power supply
Pan Am Games 2015 100 kVA, 125kWh Load shifting
Hydrostor - Toronto Compressed Air Varies Distribution line decongestion
eCAMION – Toronto
Hydro
Lithium-ion battery 25 kW, 16 kWh Infrastructure support
eCAMION - Toronto Lithium-ion battery 500 kW, 250 kWh Infrastructure support
NRStor - Minto Flywheel ±2 MW, 500 kWh Frequency regulation
HONI – Clear Creek Flywheel ±5 MW, 500 kWh Voltage control
Opus One - DEMSN Battery Voltage support, generation
integration
RES Canada - Strathroy Lithium-ion battery 4 MW, 2.6 MWh Frequency Regulation
NEDO – Oshawa Lithium-ion battery 10 kWh Load leveling
Convergent Energy –
Sault Ste. Marie
Lithium-ion battery 7 MW Reliability
Hydrogenics Power-to-Gas 2 MW Frequency Regulation
Ameresco – Phase II Solid Battery (2x) 2 MW, 8 MWh Peak shaving
Baseload Power –
Phase II
Flow Battery 2 MW, 8 MWh Grid support and arbitrage
NextEra – Phase II Solid Battery 2 MW, 8 MWh Grid support and arbitrage
NRStor Inc. – Phase II Compressed Air 1.75 MW, 7 MWh Grid support
SunEdison – Phase II Flow Battery 1 MW, 4 MWh
(2x) 2 MW, 8 MWh
Grid support
Table 1: Ontario Energy Storage Project Summary
The above list of notable projects is only a
sample of energy storage pilots and projects
that are either currently operating or being
developed in Ontario; it is clear that interest in
energy storage is increasing as technologies
advance and the benefits become more widely
understood. Multiple technologies of varying
size and capacity are being utilized to offer a
diverse array of benefits to system operators,
distributors, and end users.
Several key learnings emerged from the
IESO energy storage procurements. Some of the
more noteworthy lessons learned include:
Location of a storage project affects the
benefits it can provide.
Losses associated with both conversion
and storage (i.e. leakage, diffusion)
should be accounted for when energy
storage technology is selected.
Energy storage systems are limited by the
technology and economics of the system.
There may be periods when storage
facilities may not be able to respond to a

The Study of Energy Storage in Ontario Distribution Systems
9
given signal as a result of the store being
full or empty.
All energy storage technologies have the
ability to withdraw energy from the grid,
however not all technologies are capable
of discharging the stored energy back
into the grid.
Three categories of energy storage were
identified in a report by the IESO:
Type 1 – Energy storage technologies that are
capable of withdrawing electrical energy
(electricity) from the grid, storing such
energy for a period of time and then re-
injecting this energy back into the grid
(minus reasonable losses). Examples include,
but are not limited to, flywheels, batteries,
compressed air, and pumped hydroelectric.
Type 2 – Energy storage technologies that
withdraw electricity from the grid and store
the energy for a period of time. However,
instead of injecting it back into the grid, they
use the stored energy to displace electricity
consumption (demand) of their host facility at
a later time. Examples include, but are not
limited to, heat storage or ice production for
space heating or cooling.
Type 3 – Energy storage technologies that
only withdraw electricity from the grid like
other loads, but convert it into a storable form
of energy or fuel that is subsequently used in
an industrial, commercial or residential
process or to displace a secondary form of
energy. They’re generally integrated with a
host process that uses that secondary form of
energy directly or are connected to a
transmission or distribution network for their
secondary form of energy (e.g., natural gas,
steam or coolant). Examples include, but are
not limited to, fuel production (hydrogen or
methane), steam production and electric
vehicles [15].
It should be noted that Type 2 and Type 3
energy storage technologies are not a primary
focus of this study report, since the stored
energy in these applications is not reintroduced
to the distribution grid.
Revenue Streams Available to Project
Owners
Energy storage systems have the ability to
provide more than one benefit to a distribution
grid at any given time. However, not all of the
benefits provided from an energy storage
system can be monetized. When a project is
installed, it can often have portions of energy
capacity allocated for different uses, such as
redundant power supply and power quality
improvement. While stacking benefits can lead
to a highly profitable project, the project owner
would ideally have the ability to be reimbursed
for services provided to each beneficiary. Too
often, only the main benefit of a project is
monetized, parting with potential earnings
from secondary benefits. A Value Matrix is
provided in this report, in Appendix A, to
identify various revenue streams available to a
project owner. The Value Matrix assigns a
monetary range to each benefit identified in
this report. To review the calculations used for
monetary ranges, please see Appendix B.
Table 2 and Table 3 below use the Value
Matrix to depict possible yearly totals for
currently monetizable benefit streams and
provide definitions of those benefits. A 1 MW /
4 MWh, technology agnostic system is used in

The Study of Energy Storage in Ontario Distribution Systems
10
this study in order to allow for more
meaningful comparisons across disparate
technologies and use cases. In addition, a 1 MW
system with a 4 hour discharge cycle allows for
easier scaling of costs and benefits to larger
proposed system sizes. The IESO Phase I and
Phase II procurements have seen similarly
sized systems proposed, and projects of this
size are more likely to be installed in the
distribution system. Finally, discussions with
stakeholders supported the notion that a
standard 1 MW / 4 MWh energy storage system
would be the most reasonable for comparative
purposes.
Benefit Monetary Range ($
per MWh Delivered)
Assumed Number
of MWh per year Total $ Per Year
Market Arbitrage $13.90 -$23.50 1460 $20,294 - $34,310
Distribution System Upgrade
Avoidance $12.87 -$133.56 1460 $18,790 - $194,998
New Generation Capacity
Avoidance $12.15 -$25.23 1460 $17,739 - $36,836
Redundant Power Supply
(Reliability) $3,900 -$26,000 10 $39,000 - $260,000
Non-Spinning Reserve
Availability $0.20 - $30 1460 $292 - $43,800
Spinning Reserve Availability $0.20 - $54 1460 $292 - $78,840
Reserve Activation $0.40 - $135 730 $292 - $98,550
Power Quality Improvement $6.06 -$11.35 3025 $18,332 - $34,334
Frequency Regulation $45 - $65 3025 $136,125 - $196,625
Voltage Control $8.30 - $58.50 3025 $20,294 - $34,310
Black Start $5.85 - $36 10 $58.50 - $360
Reduced Dispatching of
Peaker Facilities $110 - $170 1460 $160,000 - $248,200
Global Adjustment Charge
Reduction (Class A) $80,000-$105,000 5 $400,000 - $559,310
Table 2: Currently Monetizable Benefits, from Appendix A, Value Matrix

The Study of Energy Storage in Ontario Distribution Systems
11
Benefit Description
Market Arbitrage Value that could be derived strictly through purchasing energy at a low cost
and selling at a high cost, using Ontario's market price signals.
Distribution System
Upgrade Avoidance
Value of avoiding distribution system upgrades as a result of dispatching
energy storage. For example, congestion mitigation may lead to avoidance of
feeder expansion.
New Generation
Capacity Avoidance
Value of using stored energy to reduce demand on the distribution system such
that the development of new generation facilities is avoided.
Redundant Power
Supply (Reliability)
Value of using stored energy to provide power to loads during traditional
distribution system outages. The lower end of the range typically represents
residential load and the higher end of the range represents commercial,
industrial, or load of a critical nature.
Non-Spinning
Reserve Availability
Value paid to resources that participate as a part of "Non-Spinning Reserve", or
generation capacity which can inject power after a short delay.
Spinning Reserve
Availability
Value paid to resources that participate as a part of "Spinning Reserve", or
generation capacity which can inject power immediately.
Reserve Activation Value paid to resources that participate as a part of "Spinning Reserve"
programs, once activated for supplying reserve.
Power Quality
Improvement Value for improving overall power quality to consumers.
Frequency
Regulation Value of dispatching energy storage to provide Frequency Regulation for IESO.
Voltage Control Value of dispatching energy storage to provide Voltage Control for IESO.
Black Start Value of dispatching energy storage to provide Black Start services.
Reduced
Dispatching of
Peaker Facilities
Value of dispatching energy storage facilities instead of peaker facilities to meet
peak demand, assist in ramping, and assisting with load following.
Global Adjustment
Charge Reduction
(Class A)
Value of reducing consumption during all five Ontario coincident peaks by 1
MW.
Table 3: Benefit Definitions, from Appendix A, Value Matrix
This study assesses four typical positions
on a distribution system that an energy storage
project could be connected to. “At TS”, or “at
the feeder head”, indicates that a project is
located closely to the Transformer Station,
(“TS”), and the beginning of a feeder. “Middle
of Feeder” means that the project is located
reasonably close to the center of a feeder, not
necessarily geographically, but electrically.
“End of Feeder” projects are located close to the

The Study of Energy Storage in Ontario Distribution Systems
12
furthest downstream loads of a feeder. Finally,
projects that are designated “Behind Meter” are
located on the load or customer side of a meter,
regardless of whether they are billed as
residential, Class A, or Class B consumers.
Not all connection locations are suitable for
all revenue streams. For instance, Global
Adjustment Charge Reduction cannot be
performed under any circumstance other than
behind a Class A customer’s meter due to the
way Global Adjustment charges are calculated.
A Benefit Matrix is provided to indicate which
locations are suitable for a given benefit stream.
A green checkmark indicates that the location
should be suitable, yellow that a location may
be suitable, and a red “X” indicates that the
location is unsuitable for that benefit stream.
Distribution Connected Energy Storage Location1
Currently Monetizable Benefits At TS Middle of
Feeder
End of
Feeder
Behind
Meter
Market Arbitrage
Distribution System Upgrade Avoidance
New Generation Capacity Avoidance
Redundant Power Supply (Reliability)
Non-Spinning Reserve Availability
Spinning Reserve Availability
Reserve Activation
Power Quality Improvement
Frequency Regulation
Voltage Control
Black Start
Reduce Dispatching of Peaker Facilities
Global Adjustment Charge Reduction (Class A)
Table 4: Direct Benefit Matrix
1 Some benefits may be viable at other locations if an aggregator could be used. For simplicity this assessment
only considers single connections.

The Study of Energy Storage in Ontario Distribution Systems
13
Barriers to Current Projects
One of the focal points of this study is to
identify and present barriers inhibiting energy
storage. Below is a generalized table outlining
some of the barriers associated with energy
storage projects. In other sections of this report
these barriers are expounded upon to inform
the reader about the issues at hand.
General Barriers to Energy Storage Adoption in Ontario Distribution Grids
Regulatory Commercial/Financial Physical/Technical Social
IESO rules dictate that a single
unit cannot provide operating
reserve and regulation at the
same time. For a storage project
to provide both it must split a
multi-unit project into
regulation providers and
reserve providers, or one project
can one or the other at different
times of day, and any
combination of these two
solutions.
Project financing and
insurance may be difficult to
obtain from traditional sources
due to uncertainty of
technologies and revenue
streams
Protection philosophies
must account for how
reverse power flow can
affect worker safety and
equipment longevity
General lack of awareness
and education of energy
storage applications and
technology among
consumers and
distributors
Ambiguity with regards to the
definition of energy storage in
current regulations (ex: Ontario
Energy Board Act, 1998, 71(3),
where storage facility was
originally written to mean gas
storage facility)
Global Adjustment, Demand,
and Debt Retirement costs
incurred during charging can
negatively impact potential
project financial viability
Geographical and network
topology limits potential
site locations (ex:
compressed air energy
storage requires a cavern
and/or access to bodies of
water)
Uncertainty of new Cap
and Trade regulations on
energy storage
Net Metering O. Reg. 541/05
currently applies only to
renewable generation; there is
uncertainty of its application to
energy storage. Legislative
changes, which may include
energy storage, are under
discussion.
Uncertainty regarding existing
equipment suppliers ability to
meet increasing demand for
energy storage products;
uncertainty of warranties in
future
Lack of market-proven
methods to aggregate
numerous smaller energy
storage systems across a
geographical area (i.e.
residential behind the
meter systems, electric
vehicles).
Obtaining and paying for
necessary permits,
environmental and electrical
studies before being able to start
a project makes some smaller
projects impractical.
Difficulty in quantifying
benefit streams and
compensating project owners
for services delivered.
Table 5: General Barriers to Energy Storage Matrix

The Study of Energy Storage in Ontario Distribution Systems
14
Ontario Distribution Connected Storage Benefit Assessment
This section will describe the complexities
involved with connecting energy storage
systems to an Ontario distribution network.
Some of the factors that can affect viability of
an energy storage facility on a distribution grid
are: location of an energy storage system (ex.
beginning or end of feeder), topology of the
distribution grid (i.e. radial, loop, or mesh),
geographic environment (i.e. urban, suburban,
or rural), and size of the connecting Local
Distribution Company (“LDC”). The specific
combination of these factors will also influence
which potential benefits can be realized and
monetized by a project.
Location
Electrical location of an energy storage
project on a distribution feeder will impact
which benefits can be provided. For example, a
black start facility cannot be located at the end
of a feeder because it would likely be unable to
provide sufficient energy to revive a portion of
the transmission system from this location.
Conversely, a project for voltage control is less
effective if located at the start of a feeder
because of losses between the project and the
voltages it is trying to correct.
Distribution Grid Topology
The topology and configuration of a
distribution feeder will affect current and
voltages, restoration possibilities, expansion
options, and fault conditions. Radial systems
are characterized by a single source to load.
Voltages and currents along a radial system
start high at the source and then drop as the
source becomes further away. An advantage of
this topology is its simplicity, but the tradeoff is
that all customers downstream of an outage
point must wait for power to be restored. Loop
systems have more than one path to each load.
This means that current can flow in more than
one direction, therefore aiding in continuity of
service since a portion of the distribution
system that requires work can be isolated while
leaving other customers in service. This
topology is notoriously difficult to analyze
because the flow of current can change based
on load and generation, and computer
programs need more algorithms to solve the
system over a similarly sized radial system.
One way to gain advantages from both
topologies is to create a loop-based system
leaving key points in normally open positions.
This creates a system that is technically radial
but also has the ability to feed customers
through alternate routes in the event of an
outage.
Project developers should work with the
host LDC in order to better understand how
the distribution grid topology can affect the
intended benefits of an energy storage system.
Radial topologies cannot change their
configurations; therefore the energy storage
system will always be in the same relative
electrical position between the source of
generation and its loads and may be unable to
provide energy to the targeted area during an
outage. Inside of a looped system, the electrical
position of a storage project could change,
potentially rendering it unavailable to provide
the benefits for which it was intended. As the

The Study of Energy Storage in Ontario Distribution Systems
15
complexity of grid topology increases from
radial to loop, the complexity of evaluating the
benefits attainable from energy storage also
increases.
Size of Distributor
The size of an LDC (generally referring to
its territory, asset base, load density, and
staffing) can play a significant role in how
energy storage affects the distribution network.
Larger utilities tend to have more resilient
urban grids and larger loads, where sudden
changes in load or generation have little effect
on voltage and frequency. Large utilities may
also have monitoring equipment and remotely
controlled assets which may make it quicker
and easier to connect and control storage
projects.
Medium sized utilities tend to have urban
feeders or feeders that alternate between urban
and rural densities. They may or may not have
monitoring equipment and are more likely to
experience greater impacts from medium and
large projects due mainly to smaller feeder
loads. However, it is noted that medium and
small utilities leverage Hydro One’s rules and
requirements for their own distribution
systems where assets are sufficiently similar.
Small utilities often have multiple
noncontiguous service areas and may share
feeders with other distribution companies.
Generally, smaller LDCs and their distribution
grids may be more exposed to the impacts of a
given energy storage system than are larger
LDCs. That is, for smaller LDCs, a given energy
storage project may represent a larger
proportion of their total load and may directly
impact a proportionately higher number of
customers than in larger LDCs. Also, smaller
LDCs tend to have fewer resources available to
support the research and development of an
energy storage projects in their territory.
Geographic Environment
When choosing a technology for storing
energy, one must consider the geographical
requirements for the technology and
geography of the planned site. Rural areas
typically consist of smaller loads which are
generally serviced by a longer feeder. Longer
feeders can cause voltages to drop considerably
over the length of the feeder. This could
possibly lead to high voltages and overloaded
assets at the feeder head and low voltages with
under-utilized assets at the feeder end.
Urban areas tend to experience greater
congestion on a given feeder due to their
relatively smaller feeder length and the greater
density of generation and loads. This higher
level of congestion on a feeder may limit the
ability to connect an energy storage facility at
this location.
The physical space available can also
impact the viability of an energy storage
system in a particular geographic environment.
Some technologies will require their own
building and can have a large physical
footprint, which may not be available in dense
urban centers. For example, compressed air
energy storage requires either a cavern or a
body of water in order to store energy, which
may not be available in a particular location.

The Study of Energy Storage in Ontario Distribution Systems
16
Possible Benefits
A “Benefit Matrix” is provided in
Appendix A which summarizes the potential
benefits, both direct and indirect, for energy
storage projects at various locations on the
distribution grid.
As indicated in the Benefit Matrix, there are
a number of revenue opportunities available to
energy storage project owners. The challenge
lies in receiving compensation for the benefits
provided.
Monetary Value of Benefits
A “Value Matrix” is provided in Appendix
A which summarizes the potential monetary
ranges of benefit quantification. Appendix B
also provides the benefit quantification
methodology used to determine the associated
range of monetary values for each listed
benefit.
The quantification of these benefits is
problematic since exact financial values are
project-specific. Several stakeholders were
reluctant or prevented from disclosing project-
specific values due to privacy concerns or
existing non-disclosure agreements.
Furthermore, in the Ontario electricity market,
participants bid into a competitive market for
the provision of a particular service. This adds
further complexity when attempting to
determine the precise value of a benefit
attributable to the system owner or beneficiary.
As a result, it is necessary to quantify benefits
into a range of possible values.
Beneficiaries of Energy Storage
Each energy storage application would
have one or more secondary beneficiaries; these
additional beneficiaries are project-specific.
Factors which affect secondary beneficiaries
could be: application, location, operational
characteristics of an energy storage system, and
desired combination of stacked benefits a
project provides.

The Study of Energy Storage in Ontario Distribution Systems
17
Ontario Distribution Connected Storage Barrier Assessment
IESO and LDC Connection and
Communication Costs
A necessary cost for a storage project is
associated with connecting to a distribution
system. This cost depends on what must be
built or upgraded for the project to safely
connect. It could include simply connecting to
an existing transformer, building a new line on
a feeder, or upgrading a transformer station, to
name a few possibilities. Many LDCs use
Hydro One’s Technical Integration
Requirements, or TIR, to determine what must
be done for a customer to connect to their
distribution system, although some will have
their own requirements. LDCs may require a
Connection Impact Assessment, or CIA, to
determine the effect of adding a project to their
system depending on project sizing.
Requirements set out by individual LDCs
and required upgrades or expansions will
dictate the cost associated with connection. A
common theme through stakeholder outreach
was that the connection costs from LDCs were
not unreasonable except for the case where
Transfer Trip, “TT”, is required. Transfer Trip
signals are sent from remote locations to the
substation or transmission station to quickly
communicate fault and abnormal conditions to
hasten circuit breaker actions. The cost of
upgrading a transformer station to enable TT
signals from a larger project is sometimes
prohibitive for a project. Some stakeholders
spoke of the unequitable cost allocation for
upgrades, as the first project to connect bears
the bulk of costs and subsequent projects
benefit from the first’s investment.
Permits and Licensing
Required licensing and permits can vary
greatly from project to project. Factors that
affect what is required include: renovations
and/or new buildings, proximity to wooded
areas and waterways, use of public or crown
land, necessary alterations to roadways and
railways, affected LDC, and municipality or
county a project is to be located in. This report
combines information from several small,
medium, and large municipalities to determine
the breadth of permits that could be required
for a project. It is incumbent on the project
owner and developers to acquire all
appropriate permits for their project.
Appendix C lists different types of permits
and their possible costs. Please note that this is
not an exhaustive list as some municipalities
may require different permits than the
municipalities reviewed in this report.
GA and Demand Charges
One of the barriers frequently discussed
among stakeholders is the obstacle that
Demand and Global Adjustment (“GA”)
charges create for economic viability of a
project. This section discusses the impact of GA
and Demand on a hypothetical energy storage
project connected to a distribution system.
Demand Charges
When a storage project draws from the grid
to charge, it incurs Demand and Usage fees

The Study of Energy Storage in Ontario Distribution Systems
18
because it is using the distribution grid to
transfer electricity as would any other load.
Demand costs depend on the largest draw for a
month because distribution companies are
required to be able to meet the peak need of all
their customers. As can be seen in Table 6, the
total yearly Demand charge for a 1 MW peak
load would be $88,549. Usage charges are
calculated by the cost of the electricity itself.
Table 7 outlines the Usage charges for a
hypothetical 4 MWh consumption per day. As
can be seen from the table, Usage charges only
account for $7,300 per month, less than 10% of
the Demand charge.
Demand Charges (1 MW, 4 MWh, cycled daily)
Charge Name Monthly Charge Year Total
Facility Charge for connection to Common ST Lines $/kW 1.1740 $14,088
Rate Rider for Disposition of Deferral/Variance Accounts
(General)2
$/kW 0.3151 $3,781.20
Retail Transmission Rate – Network Service Rate3 $/kW 3.3396 $40,075.20
Retail Transmission Rate – Line Connection Service Rate $/kW 0.7791 $9,349.20
Retail Transmission Rate – Transformation Connection
Service Rate
$/kW 1.7713 $21,255.60
Total Charges $/kW 7.3791 $88,549.20
Table 6: Demand Charge Calculation (1 MW, 4MWh, operating daily)
Usage Charges (1 MW, 4 MWh, cycled daily)
Charge Name Monthly Charge Year Total
Rate Rider for Disposition of Global Adjustment Account
(2016)
$/kWh (0.0010) -$1,460
Wholesale Market Service Rate $/kWh 0.0036 $5,256
Rural or Remote Electricity Rate Protection Charge
(RRRP)
$/kWh 0.0013 $1,898
Ontario Electricity Support Program Charge (OESP) $/kWh 0.0011 $1,606
Total Charges $/kWh 0.0050 $7,300
Table 7: Usage Charge Calculation (1 MW, 4 MWh, operating daily)
2 This will change each year depending on variance accounts for each utility 3 If charging occurs between 7PM and 7AM, this charge does not apply

The Study of Energy Storage in Ontario Distribution Systems
19
Class B Global Adjustment
In Ontario, Class B load customers are
charged GA based on usage (kWh) and the
monthly estimates for GA. Table 8, below,
shows the amount that a 1 MW / 4 MWh
energy storage project would have paid during
2016 assuming it fully charged and discharged
every day. Notably, GA accounts for more cost
than Demand, Usage, and fixed utility charges
combined.
Month 1st Estimate ($/MWh) Days in a Month Class B GA
January $84.23 31 $10,444.52
February $103.84 28 $11,630.08
March $90.22 31 $11,187.28
April $121.15 30 $14,538.00
May $104.05 31 $12,902.20
June $116.5 30 $13,980.00
July $76.67 31 $9,507.08
August $85.69 31 $10,625.56
September $70.6 30 $8,472.00
October $97.2 31 $12,052.80
November $122.71 30 $14,725.20
December $105.94 31 $13,136.56
Total $98.08 365 $143,201.28
Table 8: Global Adjustment Calculation
Exceptions - Class A Global Adjustment
Class A customers have the unique ability
to affect how much Global Adjustment they are
required to pay. The amount they pay is solely
dependent on their specific contribution to the
peak provincial load during the top five
Ontario peak demand hours in a given year.
Therefore, installing an energy storage project
behind the meter of a Class A account may not
increase GA but instead, could significantly
reduce GA charges; provided the storage
facility were discharged such that it reduced
the overall demand of the load account during
each of the top five Ontario peak demand
hours. Appendix B, Section 13. Global
Adjustment Charge Reduction (Class A),
provides calculations which demonstrate that a
Class A load account with a 1 MW / 4 MWh
energy storage facility could save more than
$500,000 annually in GA costs by managing
storage discharges such that they align with
Ontario’s top 5 peaks for a year.
With the most recent regulatory updates
customers with 1 MW of load, or 500 kW of
manufacturing load, can be included in the
Class A customer class.
Exceptions – Demand Charges
Demand Charges related to the charging of
behind the meter storage facilities for Ontario’s

The Study of Energy Storage in Ontario Distribution Systems
20
Class A and Class B customers depend on
when a facility charges in comparison to the
normal operating hours (or more specifically
the load profile) for a customer. Demand
charges for an application could theoretically
be ignored if a storage project is charged
during the hours when the facility has low
electricity demand, since that project does not
increase the facility’s normal peak load.
Exceptions - Residential Customers (Behind the
Meter)
With a residential class customer, rates for
energy consumption (kWh) are time-of-use
based where GA charges are included and form
a portion of the time-of-use rate. Residents
using a storage facility for energy arbitrage
would be able to gain a fixed amount of
compensation. The difference between On-Peak
and Off-Peak rates is insufficient to motivate
widespread adoption of residential storage
initiatives. An additional motivating factor,
such as emergency power, may be required for
a project to be considered worthwhile.
Other Commercial Issues
There are a number of commercial issues
that can have a significant impact on the
viability of an energy storage project in
Ontario. In addition to the detailed discussion
of Global Adjustment and Demand above, each
of the following potential barriers should be
duly considered.
Financial
With early adoption projects, many
financial institutions are unwilling to
competitively finance a project because of
uncertainty surrounding its revenue
capabilities.
Insurance companies are hesitant to
insure facilities with relatively unknown
insurance risk factors.
Implications of new Cap and Trade
regulations, which commenced on
January 1st, 2017, have unclear effects on
financials of an energy storage project.
Future impacts of the regulation are
unknown.
It is a challenge for energy storage
owners to clearly quantify all benefit
streams and be appropriately
compensated by benefiting parties,
particularly for the indirect benefits
identified in this study, and more
particularly when there is more than one
benefitting party.
Technology
With the escalation of interest in energy
storage, it is uncertain if producers will
be able to meet market demand for their
products.
New companies may have consumers
concerned with their ability to meet
warranty demands and the longevity of
the company itself for further technical
support.
Consumers may delay purchases with the
anticipation of newer technology.
Alternatively, some consumers are
worried about their ability to find
replacement parts for a possibly obsolete
project before its end of life.
The current workforce may not be able to
meet the need for qualified personnel to
operate the technology and perform
scheduled maintenance and repairs.

The Study of Energy Storage in Ontario Distribution Systems
21
Other Non-Commercial Issues
There are a number of non-commercial
issues which can have a significant impact on
the viability of an energy storage project. In
addition to the detailed discussion of permits in
a previous section, each of the following
potential barriers should be duly considered.
Safety
Employee safety is always the number
one concern when it comes to new and
developing technology. People from
many different career paths must be
trained in how to approach and safely
work with storage projects. These career
types include but are not limited to:
powerline workers, technicians, first
responders, skilled trades, and
maintenance.
Protecting public safety when dealing
with electrical equipment is always a
concern. There needs to be sufficient
safeguards to protect the public against
failed or malfunctioned equipment.
Protecting equipment is a justified
concern for project owners and operators.
Much of the existing distribution system
protection equipment is geared towards
generators and loads, but storage is both
and neither at the same time. Equipment
must be programmed or new products
developed to ensure a project’s longevity.
Standards
There is currently a lack of installation
standards for contractors and LDCs to
adhere to. Without a peer-reviewed
standard to comply with, installations
run the risk of overlooking a crucial
element or could accidentally be under-
designed.
Individual pieces of equipment in an
energy storage project will have technical
standards, but may not have a system-
level standard that brings them together
as one unit.
There are currently no standard
operating procedures in many LDCs or
other companies for storage technology.
These will need to be developed and,
more than likely, be technology specific.
Social
Consumers and distributors have a
general lack of awareness and education
about energy storage and its capabilities.
They are unsure of how it could affect
them and how it compares with
traditional methods of power
distribution.
With the new Cap and Trade regulation
which came into effect on January 1, 2017
many people are unsure of how
consumers will change their consumption
habits. It is currently unclear how Cap
and Trade will affect the behaviour of
electricity consumers, LDCs, and gas
suppliers.
Technical Requirements
Traditional protection philosophies
generally do not account for reverse
power flows. With the nature of energy
storage both consuming and releasing
energy, protection philosophies will need
to be able to adjust and determine when
an issue actually occurs.
LDCs may have different connection
requirements for projects in their

The Study of Energy Storage in Ontario Distribution Systems
22
territories which could restrict potential
host locations.
Not all technologies are suited for every
application. One must consider a project’s
main purpose to determine an
appropriate technology.
Monitoring and dispatching storage will
need to be done remotely in most cases.
Many small and medium LDCs do not
currently have the ability to monitor
signals from a project, which could result
in not knowing which way current is
flowing through their system.
As previously stated, geographical and
network constraints could limit the
technology and project size.
Although aggregation of small systems is
possible, as seen through PowerStream’s
POWER.HOME project and aggregation
of peaksaver PLUS ® thermostats, the
commercial viability of aggregating bi-
directional flows of energy on a larger
scale remains to be seen.
Legislative and Regulatory
Current legislation and regulations need
to reduce ambiguity around energy
storage, its roles, and definitions.
Net metering regulations in Ontario have
changed. Net metering is permissible
with a storage component, however some
aspects of net metering (i.e. virtual net
metering, multi-site settlement, etc.) are
still uncertain. Net metering is also still
not available in storage-only situations.
Current projects contracted and
dispatched by IESO have contract lengths
much shorter than the expected life of the
asset.
Current market rules were created to
account strictly for generators or loads
and did not envision the unique
characteristics of energy storage systems.
For example, current rules prohibit the
concurrent provision of both Operating
Reserve and Regulation services, despite
the capability of some technologies to
provide both at the same time.
Required number of permits in some
cases can make small projects impractical.
It is currently unclear how Cap and Trade
will affect the electricity market and the
technologies that support the electricity
grid.

The Study of Energy Storage in Ontario Distribution Systems
23
Example Use Cases
To guide the reader in how to use the
Value Matrix and Benefit Matrix (Appendix A),
scenarios are presented below to showcase a
broad range of possibilities. Each case outlines
a location along a distribution feeder and one
or more benefits suitable to that location. The
reader can follow along by referring to the
Benefit Matrix and Value Matrix to find the
location and benefit(s) utilized.
The use cases have been developed absent
of energy storage technology-specific costs.
However, the use cases do include common
up-front and ongoing costs that Ontario-based
projects would incur. This was done in order to
allow the reader to determine if the technology
they wish to use (and related cost structure)
would be financially viable for the given use
cases (and related benefits). One of the
technology-specific costs of operation is losses
incurred during the charge and discharge cycle
of a storage project. Losses can vary greatly
depending on the technology and duration of
storage. For simplicity, losses were not
included so that the reader can account for
technology and project specific losses in each
case. In general, accounting for losses will
decrease revenue potential for each use case.
All of the use cases contained herein
specify a generic 1 MW / 4 MWh storage
project, also, for uniformity. As one would
assume, scale could play a significant role in
the financial viability of a project and a use case
may become more or less favourable if its scale
changes.
Use Case Assumptions
All use cases assume a directly connected
project (distribution system) with Class B
customer class, except for Case 5 which
assumes behind the meter of a Class A
customer
All use cases assume there are no
technology related losses in the
charge/discharge cycle
GA charges are calculated using
Ontario’s 2016 first estimate values
Demand and usage rates are determined
through stakeholder input and Hydro
One Network Inc.’s 2016 rate case as
approved by the Ontario Energy Board
Costs and benefits are subject to an
inflation rate of 2% per year
Two assumptions are considered
regarding the inflation of Global
Adjustment and Demand; one at 2% and
one with 5% growth per year
15 year project life is assumed
Projects do not include carrying costs
related to financing (i.e. interest, etc.)
How to Interpret Use Case Analysis
The Value Matrix has been developed to
provide a range of possible values for a given
benefit stream. Note that projects may be able
to receive more or less value for each benefit
stream depending on project details related to a
specific application. Figure 1 is provided below
to illustrate to the reader how the graphs and
analysis were derived for each of the five
specific use cases herein, for the purpose of
interpreting results. The figure shows the

The Study of Energy Storage in Ontario Distribution Systems
24
present value of a hypothetical project’s benefit
streams, net common costs (permits, Demand,
Usage, and GA), as well as the possible range
of stacked benefit values year over year for 15
years. The actual use cases presented in this
report compress the year over year data points
into a single net present value range. However,
for each use case the expanded graphs, similar
to Figure 1, can be referenced in Appendix D.
For a project to be financially viable, it is
reasonable to assume that the present value of
technology-specific capital and operational
costs would need to be less than the present
value of the monetizable benefits net of the
common costs. Beyond this, it is also reasonable
to assume that the project owner would apply
an appropriate rate of return to determine
financial viability. As stated previously, the
values shown indicate a possible range, so it is
incumbent upon a project owner to evaluate
where, within the range of possible values,
their project may be based on the specific value
if benefits it can monetize.
Note that non-monetizable (or indirect)
benefits are also reflected in present value
context on all use case graphs.
Figure 1: Example Use Case 15 Year Lifecycle

The Study of Energy Storage in Ontario Distribution Systems
25
Case 1 – At TS, Frequency Regulation
Case 1 assumes locating the project in close
proximity to a transformer station. Using the
Benefit Matrix, one can see that there are
several benefit streams which are well suited to
projects located at the beginning of a feeder.
Case 1 seeks to provide Frequency Regulation.
The Value Matrix indicates that the monetary
range for Frequency Regulation is $45 -
$65/MWh of services provided. This case does
not include any indirect benefits.
Direct
Benefits
Provided
Value Per MWh ($) MWhs
Delivered Annual Value
Low High Per Year Low High Assumptions & Comments:
Frequency
Regulation $ 45.00 $ 65.00 3025 $136,125 $196,625
876000MWh/289.9MW =
3023h/year per facility MW
scheduled.
MWh per year:
= (1MWh * 3025h/year)
= 3025 MWh/year.
TOTAL
ANNUAL
BENEFIT:
$ 45.00 $ 65.00 $136,125 $196,625
Table 9: Benefit Streams - Case 1
Monthly Cost Per
MW/MWh ($)
MW/MWhs
Delivered Total Annual Cost (Year 1)
Common Cost Low High Per Year Low High
Total Demand Charges $7,380 - 1 MW $88,549
Total Usage Charges $5 - 3025 MWh $15,125
Global Adjustment Charges $70.60 - $122.71 3025 MWh $ 287,374
Ongoing Communication
Costs $60 $75 - $720 $900
Total Fixed Utility Charges $ 15,384 - - $ 15,384
TOTAL ANNUAL COST: $407,152 $407,332
Table 10: Monthly Common Costs - Case 1
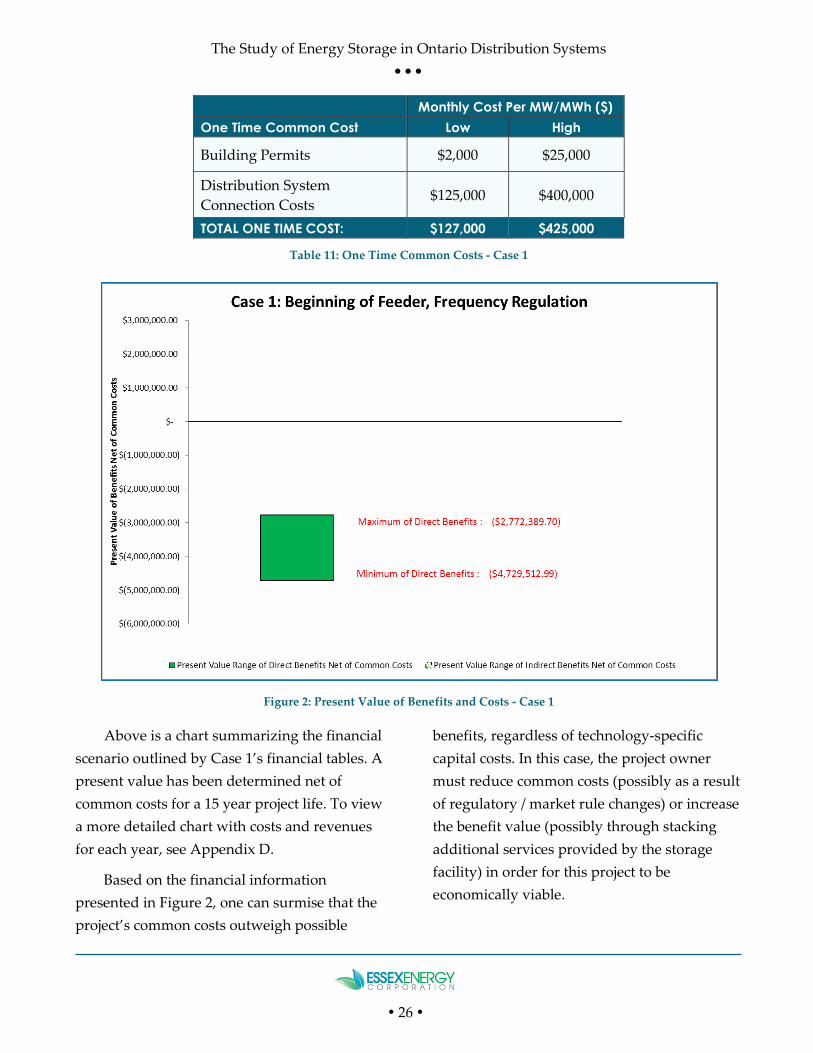
The Study of Energy Storage in Ontario Distribution Systems
26
Monthly Cost Per MW/MWh ($)
One Time Common Cost Low High
Building Permits $2,000 $25,000
Distribution System
Connection Costs $125,000 $400,000
TOTAL ONE TIME COST: $127,000 $425,000
Table 11: One Time Common Costs - Case 1
Figure 2: Present Value of Benefits and Costs - Case 1
Above is a chart summarizing the financial
scenario outlined by Case 1’s financial tables. A
present value has been determined net of
common costs for a 15 year project life. To view
a more detailed chart with costs and revenues
for each year, see Appendix D.
Based on the financial information
presented in Figure 2, one can surmise that the
project’s common costs outweigh possible
benefits, regardless of technology-specific
capital costs. In this case, the project owner
must reduce common costs (possibly as a result
of regulatory / market rule changes) or increase
the benefit value (possibly through stacking
additional services provided by the storage
facility) in order for this project to be
economically viable.

The Study of Energy Storage in Ontario Distribution Systems
27
Case 2 – At TS, Enabling Renewables
Case 2 also assumes that an energy storage
project is located at the beginning of a
distribution feeder. This project’s main purpose
is to enable greater penetration of renewables,
specifically an assumed 10 MW wind farm,
although there is a secondary benefit of
reducing peaker facilities considered. Both of
these are well suited to a project located in
close proximity to a transformer station, as can
be seen in the Benefit Matrix. The Value Matrix
is used to determine the monetary range for
these benefits. This case includes two indirect
benefits; Excess Generation Mitigation and Cap
and Trade Benefit. These two benefit streams
are currently unable to be monetized by an
energy storage facility owner in Ontario’s
electricity market.
Benefit
Provided
Value Per MWh ($) MWhs
Delivered Annual Value
Low High Per Year Low High Assumptions & Comments:
Reduced
Dispatching
of Peaker
Facilities
$ 110.00 $ 170.00 3100 $341,000 $ 527,000
Adding the ability to shift energy
to peak times will reduce the
need for the peaker fleet. Values
reflect a competitive price for a
peaker facility.
If a Power of Purchase
Agreement cannot be reached
with the IESO, then these values
will reflect market prices.
Indirect
Benefits Low High In 1 Year Low High Assumptions & Comments:
Enables
Higher
Penetration
of
Renewables
$ 80.00 $ 130.00 3100 $248,000 $ 403,000
Wind generation is typically
between 1.2MW and 3.8MW
depending on the month.
Number of curtailed hours is
assumed to be proportional to
the total installed capacity of a
wind farm.
Excess
Generation $50.00 $116.09 1500 $75,000 $174,135
Half of the MWh delivered by
the system for enabling higher
penetration of renewable
generation is assumed to reduce
excess generation.
Cap and
Trade
Benefit
$0.33 $6.69 3100 $1,023 $20,739
All of the MWh delivered by the
system will reduce the need for
peaker facilities, thereby
reducing the amount of cap and
trade needed.
TOTAL
ANNUAL
BENEFIT:
$ 240.33 $ 422.78 $665,023 $1,124,874
Table 12: Benefit Streams - Case 2
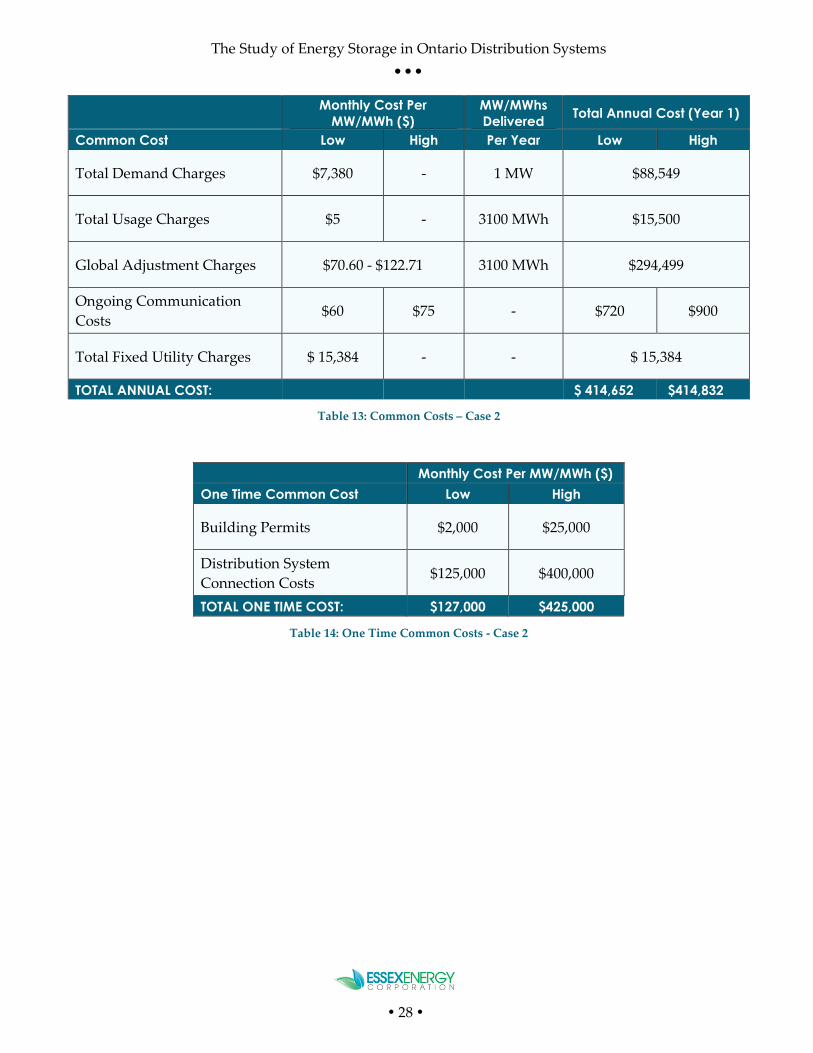
The Study of Energy Storage in Ontario Distribution Systems
28
Monthly Cost Per
MW/MWh ($)
MW/MWhs
Delivered Total Annual Cost (Year 1)
Common Cost Low High Per Year Low High
Total Demand Charges $7,380 - 1 MW $88,549
Total Usage Charges $5 - 3100 MWh $15,500
Global Adjustment Charges $70.60 - $122.71 3100 MWh $294,499
Ongoing Communication
Costs $60 $75 - $720 $900
Total Fixed Utility Charges $ 15,384 - - $ 15,384
TOTAL ANNUAL COST: $ 414,652 $414,832
Table 13: Common Costs – Case 2
Monthly Cost Per MW/MWh ($)
One Time Common Cost Low High
Building Permits $2,000 $25,000
Distribution System
Connection Costs $125,000 $400,000
TOTAL ONE TIME COST: $127,000 $425,000
Table 14: One Time Common Costs - Case 2

The Study of Energy Storage in Ontario Distribution Systems
29
Figure 3: Present Value of Benefits and Costs - Case 2
Above is a chart summarizing the financial
scenario outlined by Case 2’s financial tables. A
present value has been determined net of
common costs for a 15 year project life. To view
a more detailed chart with costs and revenues
for each year, see Appendix D.
Case 2’s financial scenario indicates that
there is a possibility for it to be economically
viable depending on technology-specific costs.
This use case would be significantly more
profitable if the project owner could also be
compensated for the indirect benefits provided.
Under current market rules, the present value
of technology-specific capital and operational
costs for the assumed 1 MW, 4 MWh system
would need to be less than $1,349,937 to break
even, assuming the highest calculated direct
benefit values are achievable.
Case 3 – Middle of Feeder, Distribution
Upgrade Avoidance
This use case’s main purpose is to avoid a
distribution system upgrade. Using the Benefit
Matrix, one can determine that the two most
suitable locations are at a transformer station
and in the middle of a feeder. For this case,
middle of a feeder is chosen to relieve

The Study of Energy Storage in Ontario Distribution Systems
30
congestion on a hypothetical conductor. While
shifting load from peak consumption periods
to lower consumption periods, it can be
assumed that the project will gain revenue
from Market Arbitrage. Shifting load will also
have the added indirect benefit of relieving
excess generation and will have Cap and Trade
value through reducing peak generation
requirements (assuming these peak
requirements are met using natural gas fired
generation facilities).
Value Per MWh ($)
MWhs
Delivered Annual Value
Benefit
Provided Low High Per Year Low High Assumptions & Comments:
Distribution
System
Expansion
Avoidance
$12.87 $133.56 1460 $18,790 $194,998
It is assumed that the application
will discharge on daily basis.
MWhs per year:
= 365 cycles * 4 MW
= 1460 MWh
Market
Arbitrage $13.90 $23.50 1460 $20,294 $34,310
This reflects the dollar amount
generated through load
displacement arbitrage on a daily
basis.
Indirect
Benefits Low High Per Year Low High Assumptions & Comments:
Excess
Generation
Mitigation
$50.00 $116.09 1460 $73,000 $169,491
By charging during lightly loaded
periods and discharging during
heavily loaded periods the system
will be able to mitigate excess
generation in Ontario.
Greenhouse
Gas
Mitigation
$0.33 $6.69 1460 $482 $9,767
The system will be able to lower Cap
and Trade by charging during
periods of high renewables and
discharging during times when
peakers are required.
TOTAL
ANNUAL
BENEFIT:
$77.10 $279.84 $112,566 $408,566
Table 15: Benefit Streams - Case 3

The Study of Energy Storage in Ontario Distribution Systems
31
Monthly Cost Per
MW/MWh ($)
MW/MWhs
Delivered Total Annual Cost (Year 1)
Common Cost Low High Per Year Low High
Total Usage Charges $5 - 1460 MWh $7,300
Global Adjustment Charges $70.60 - $122.71 1460 MWh $139,636.23
Ongoing Communication
Costs $60 $75 - $720 $900
Total Fixed Utility Charges $ 15,384.60 - - $ 15,384.60
TOTAL ANNUAL COST: $ 163,040.83 $163,220.83
Table 16: Common Costs - Case 3
Monthly Cost Per MW/MWh ($)
One Time Common Cost Low High
Building Permits $2,000 $25,000
Distribution System
Connection Costs $125,000 $400,000
TOTAL ONE TIME COST: $127,000 $425,000
Table 17: One Time Common Costs - Case 3

The Study of Energy Storage in Ontario Distribution Systems
32
Figure 4: Present Value of Benefits and Costs - Case 3
Above is a chart summarizing the financial
scenario outlined by Case 3’s financial tables. A
present value has been determined net of
common costs for a 15 year project life. To view
a more detailed chart with costs and revenues
for each year, see Appendix D.
Under current market constructs, this
project would not be feasible given that the
maximum present value of the direct benefits
(net of common costs) is less than zero. The
project owner would need to be able to
monetize the identified indirect benefits and/or
reduce common costs, in order to make the
project economically viable before even
considering the impact of the technology
specific costs required to commission the
necessary storage facility.
Case 4 – End of Feeder, Reliability
One of the popular benefits of energy
storage is increasing reliability of power
through backup reserves. Using the Benefit
Matrix, projects with this goal should be
located closely to the load that requires
redundancy. For this reason, the project’s
location for this use case is at the end of a

The Study of Energy Storage in Ontario Distribution Systems
33
feeder. The Value Matrix can be used to
determine that the value of redundant power
will vary greatly depending upon the nature of
the load of the consumer(s). This is intuitive as
residential customers are not usually willing to
pay a premium to guarantee the reliability of
their power, however, a manufacturing facility
may have sensitive equipment which requires
highly reliable power.
Value Per MWh ($)
MWhs
Delivered Annual Value
Benefit
Provided Low High Per Year Low High Assumptions & Comments:
Redundant
Power
Supply
(Reliability)
$3,900 $26,000 10 $39,000 $260,000
Assumes 4 outages of varying
lengths: 4 hours, 3 hours, 2 hours,
and 1 hour. Assume loading of
1MW during all outages.
MWhs per year:
= (4+3+2+1) h x 1 MW
= 10 MWh
Market
Arbitrage $13.90 $23.50 1460 $20,294 $34,310
It is assumed that the facility
discharges 4MWh on a daily
basis (which is 1MW discharged
for 4 hours) at peak electricity
rates (and charges accordingly at
off peak rates).
MWh per year:
= 4 MWh/day x 365 days
= 1460 MWh
Indirect
Benefits Low High Per Year Low High Assumptions & Comments:
Excess
Generation
Mitigation
$50.00 $116.09 1460 $73,000 $169,491 The battery will be charged at
night when excess generation
historically occurs in Ontario.
Greenhouse
Gas
Mitigation
$0.33 $6.69 1460 $482 $9,767
Charging at night when peaker
facilities are offline and
discharging during the day
reduces carbon emissions.
TOTAL
ANNUAL
BENEFIT:
$3,964.23 $26,146.28
$132,776 $473,569
Table 18: Benefit Streams - Case 4

The Study of Energy Storage in Ontario Distribution Systems
34
Monthly Cost Per
MW/MWh ($)
MW/MWhs
Delivered Total Annual Cost (Year 1)
Common Cost Low High Per Year Low High
Total Demand Charges $7,380 - 1 MW $88,549
Total Usage Charges $5 - 1460 MWh $7,300
Global Adjustment Charges $70.60 - $122.71 1460 MWh $139,636
Ongoing Communication
Costs $60 $75 - $720 $900
Total Fixed Utility Charges $15,384.60 - - $15,384
TOTAL ANNUAL COST:
$251,589 $251,769
Table 19: Common Costs - Case 4
Monthly Cost Per MW/MWh ($)
One Time Common Cost Low High
Building Permits $2,000 $25,000
Distribution System
Connection Costs $125,000 $400,000
TOTAL ONE TIME COST: $127,000 $425,000
Table 20: One Time Common Costs - Case 4

The Study of Energy Storage in Ontario Distribution Systems
35
Figure 5: Present Value of Benefits and Costs - Case 4
Above is a chart summarizing the financial
scenario outlined by Case 4’s financial tables. A
present value has been determined net of
common costs for a 15 year project life. To view
a more detailed chart with costs and revenues
for each year, see Appendix D.
This case is not likely to be financially
viable unless market rules are changed to allow
project owners to monetize indirect benefits, or
if common costs can be lowered (or some
combination of both).
Case 5 – Behind Meter, GA Reduction
This case shows a unique opportunity for
Ontario consumers with an average annual
electricity demand of greater than 1MW. These
consumers all eligible for Class A status within
the province’s Industrial Conservation
Initiative (“ICI”). Class A customers have the
ability to reduce their Global Adjustment fees
by reducing their own demand during those
hours when Ontario’s electricity system is
experiencing its top five coincident demand
peaks in a given year. Therefore, in order to
achieve this benefit, a project must be located
behind the meter of a Class A customer. In
trying to achieve this goal, the project will
inherently be performing Market Arbitrage,

The Study of Energy Storage in Ontario Distribution Systems
36
and will indirectly be mitigating excess
generation and have some Cap and Trade
value through reducing peak generation
requirements (assuming these peak
requirements are met using natural gas fired
generation facilities).
Analysis for this use case was performed
twice, once including demand charges
assuming that charging cycles for the energy
storage facility will increase peak demand
related to the customer’s load account, and
again assuming that demand charges can be
ignored, or charging cycles for the energy
storage facility will not increase peak demand
related to the customers load account. Other
charges, such as fixed utility costs, are not
considered because the customer would
reasonably be required to pay for these with or
without a storage project on site.
Benefit
Provided
Value Per MWh ($) MWhs
Delivered Annual Value
Assumptions &
Comments: Low High Per Year Low High
Global
Adjustment
Charge
Reduction
(Class A)
$80,000 $105,000 5 $400,000 $525,000
The project will discharge
during all five Ontario
peaks, reducing the facility’s
demand by 1 MW each time.
Market
Arbitrage $13.90 $23.50 1460 $20,294 $34,310
This reflects the dollar
amount generated through
arbitrage on a daily basis.
MWh per year
= 365 cycles * 4 MWh
= 1460 MWh/year
Indirect
Benefits Low High Per Year Low High
Assumptions &
Comments:
Excess
Generation $50.00 $116.09 1460 $73,000 $169,491
The project will be charged
at night when excess
generation historically
occurs in Ontario.
Cap and
Trade
Benefit
$0.33 $6.69 1460 $482 $9,767
Charging at night when
peaker facilities are offline
and discharging during the
day reduces carbon
emissions.
TOTAL
ANNUAL
BENEFIT:
$80,064.23 $105,146.28 $493,776 $738,569
Table 21: Benefit Streams - Case 5

The Study of Energy Storage in Ontario Distribution Systems
37
Monthly Cost Per
MW/MWh ($)
MW/MWhs
Delivered Total Annual Cost (Year 1)
Common Cost Low High Per Year Low High
Total Demand Charges $7380 - 1 MW $88,549
Total Usage Charges $5 - 1460 MWh $7,300
TOTAL ANNUAL COST:
$95,849
Table 22: Common Costs - Case 5
Monthly Cost Per MW/MWh ($)
One Time Common Cost Low High
Building Permits $2,000 $25,000
Distribution System
Connection Costs $125,000 $400,000
TOTAL ONE TIME COST: $127,000 $425,000
Table 23: One Time Common Costs - Case 4
The Demand charges in the table above are
included in Figure 6, but excluded in Figure 7.
As explained before in the exemptions to the
Demand charge barrier, if a storage project can
be charged and not increase the overall
demand for a facility Demand charges can be
ignored.

The Study of Energy Storage in Ontario Distribution Systems
38
Figure 6: Present Value of Benefits and Costs - Case 5 with Demand Charges
Above is a chart summarizing the financial
scenario outlined by Case 5’s financial tables,
including Demand charges. A present value
has been determined net of common costs for a
15 year project life. To view a more detailed
chart with costs and revenues for each year, see
Appendix D.
As evidenced in the figure above, this case
is the most financially attractive hypothetical
scenario of all the analyzed use cases,
regardless of whether or not indirect benefits
can be monetized. Even when demand charges
are included, the calculated present value of
the project is positive, with the lower range
beginning at $3,379,610.42.

The Study of Energy Storage in Ontario Distribution Systems
39
Figure 7: Present Value of Benefits and Costs - Case 5 without Demand Charges
This chart indicates the value of a project
that will not increase the peak demand for host
load customer (i.e. demand charges have been
removed from the common costs). When
compared with Figure 6, removing demand
charges results in an increase of $1,200,000 to
present value.

The Study of Energy Storage in Ontario Distribution Systems
40
Conclusions
Under current market rules, regulations,
and legislation, three of the five presented use
cases could be economically viable, two of
those marginally. Generally, the closer to a
transformer station that a project is located, the
more benefits it has the potential to provide.
Based on the analyses of the range of use cases
sampled, the highest financial compensation
comes from those storage facilities located
behind the meter at Class A load sites, which is
contrary to what one might intuitively assume,
since there are more potential stacked benefits
that can be provided by locating closer to
transformer stations. The primary driver of this
counter intuitive finding is Global Adjustment
charges, and the ability for Class A consumers
to mitigate this cost through demand reduction
at key times. The effect of Global Adjustment
charges on energy storage project economics is
significant, and in some cases totaled more
than all other common costs combined.
Appendix E outlines how reducing GA costs
for energy storage system owners could be
justified and how a reduction would affect the
net present value of the first four use cases.
Suggestions on How to Monetize Indirect
Benefits
As discussed in this report, the identified
direct benefits are those benefits that are
currently monetizable. That is, a project owner
could be compensated for providing these
identified benefits under the current market
framework.
However, for indirect benefits,
fundamental changes in market rules would be
required to provide monetary compensation to
project owners. Below is a table of currently
non-monetizable (or indirect) benefits.

The Study of Energy Storage in Ontario Distribution Systems
41
Theoretically
Monetizable
Benefits
Monetary Range
(per MWh of
services
provided)
Description
Excess
Generation
Mitigation
$50.00 - $116.09
Charging storage units during excess generation conditions, in the
province, rather than exporting surplus at a loss. Upper limit
assumes all charging is accomplished under excess generation
conditions, the lower limit assumes that some charging is done under
excess generation conditions.
Greenhouse Gas
Mitigation (Cap-
and Trade)
$0.33 - $6.69
Value associated with reducing CO2 emissions by offsetting natural
gas facilities with non-CO2 emitting energy storage resources. Values
derived using cap-and-trade projections. The high end of the value
range assumes the energy storage facility is discharging at a time
when it is completely offsetting CO2 emitting generation in the
province and charging when there is essentially zero CO2 emission
generation in the province. The lower end of the value range involves
scenarios that are less than this ideal state (i.e. some charging occurs
while CO2 emitting power generation is online and not 100% of the
discharging is necessarily offsetting CO2 emitting generation).
Enables Higher
Penetration of
Renewables
$90 - $130 Value associated with reducing curtailment of wind resources in
Ontario as a result of dispatching storage resources.
Table 24: Indirect Benefit Value Matrix
The following is a list of suggestions related to
how indirect benefits might be made
monetizable in Ontario.
Excess Generation Mitigation
Quantify the value that the province
saves by reducing the export of
electricity during periods of excess
generation and redirect a portion of
these funds to the purveyor of a storage
project (through a PPA or other new
market mechanism). The long term goal
would be to commission enough energy
storage facilities to store all excess
energy during excess generation
conditions within the province.
Greenhouse Gas Mitigation
As more storage projects come to
fruition, the operation of gas fired
generators, including peaker plants, can
be minimized.
Reducing CO2 emissions related to gas
fired generation has a market value as
determined by Ontario’s Cap and Trade
program. Revenues resulting from this
program (which flow to the province’s
Green Investment Fund) could be
diverted to energy storage projects to
recognize their contribution to
emissions reductions in certain
applications.

The Study of Energy Storage in Ontario Distribution Systems
42
Enables Higher Penetration of Renewables
Currently, when renewable generators
have capacity to produce more
electricity than the
distribution/transmission system can
technically manage, they are curtailed.
Curtailment means that a generator had
the ability to generate, but was
constrained to shut down. Generally,
there are commercial limits to the
magnitude of curtailment (determined
through PPAs). Renewable generators
generally receive a form of
compensation when these limits are
exceeded based on their potential to
produce at the time of curtailment.
The proposed value provided by
storage facilities is derived from storing
energy (that would have otherwise been
curtailed) for later use. Instead of
curtailment, the proposed solution
would be to compensate a project owner
for storing the energy and releasing it
when it is technically required and
provides more value to the system.
Tools Available to Address Identified Barriers
Below is a list of tools and suggestions
which could mitigate or remove some of the
barriers identified throughout this report.
Studying more mature energy markets to
glean best practices to mitigate concerns
of lenders and insurers in regards to new
technology.
Leverage documentation in existing
Technical Interconnection Requirements
for connection standards in Ontario, but
revise them to be applicable to energy
storage.
Power Purchase Agreements are an
existing framework that could be used for
storage projects in order to compensate
owners for indirect benefits provided.
Depending on the type of project,
location, and other factors, projects could
require a variety of permits and
approvals before development can begin.
A list of the potential permits and
approvals that may be required can be
found at
http://canadabusiness.ca/permits-and-
licences/.
Where indirect benefits are confirmed
and measurable but cannot be monetized
directly, one option may be to apply
lower Demand Charges to merchant
energy storage projects in
acknowledgement of non-monetizable
benefits.
Given that stored energy is expected to be
re-injected to the distribution system, it
may be a consideration for energy storage
system owners to pay GA only on the
portion of energy that is not re-injected
back to the grid (i.e. losses). See
Appendix E for a GA financial flow chart
which demonstrates implementing this
suggestion does not result in any other
load customers paying additional GA on
behalf of energy storage facilities. The
amount of GA payable upon charge and
discharge may not be equal if a
significant amount of time has passed. A
settlement mechanism to account for
these differences may be required.
Develop a fair, practical, and consistent
compensation and cost for transfer trip
substation installation upgrades given
that the first to install a project generally
incurs most cost, while subsequent
projects rarely incur comparable costs,

The Study of Energy Storage in Ontario Distribution Systems
43
nor do they compensate the initial project
developer.
Create standards for production, design,
installation, and maintaining energy
storage projects by appropriate societies
and organizations for peer review (i.e.
IEEE, TSSA, CSA, UL, etc.).
Develop an aggregation archetype so that
numerous, disparate energy storage
systems can be amalgamated into a single
virtual storage facility and controlled
accordingly. Aggregation technology
currently exists for demand response, but
it is uncertain if a suitable Ontario
market-proven, bi-directional
aggregation solution for regional storage
exists.
Establish a clearer framework within the
OEB rate setting process that more
readily enables LDCs to rate base storage
assets that demonstrate cost effective
benefits to end use rate payers. To be
most effective, the framework would
require common tool sets and a process
for LDCs to adopt and apply in order to
consistently assess a multitude of
potential use cases. Based on benefits
provided by energy storage, LDCs may
often be ideal owners for distribution
connected systems, particularly when
directly connected.
Top Three Scenarios
Given the use cases, benefit values,
barriers, and tools available to the province that
are presented in this study, this section
summarizes three scenarios that would benefit
the development of distribution connected
energy storage over the next one to ten years.
These scenarios generally aim to reasonably
reduce common costs and convert indirect
benefits to direct benefits for energy storage
project owners, while still benefitting rate
payers in Ontario.
Scenario 1 – Global Adjustment Reduction
As illustrated in the use cases 1 through 4
of this study, Global Adjustment charges are
detrimental to the financial business cases for
Class B merchant energy storage developers.
The fifth use case is profitable largely because it
reduces GA charges for the Class A load
customer. Administering GA charges such that
they apply only to losses (energy consumed by
the storage facility minus energy discharged)
has the potential to cut common costs by over
half. This single change in settlement would
greatly accelerate economic viability of
merchant storage projects. See Appendix E for
how a reduction in GA costs would affect the
first four use cases.
Scenario 2 – Enabling Renewable Generation
Case 2 outlines the savings potential of
reducing renewable curtailment. As previously
mentioned, storing energy which would have
been curtailed and then releasing energy when
it is needed can reduce costs associated
generation that are currently reflected in Global
Adjustment. Passing a portion of this savings to
developers of integrated renewable energy /
storage facilities (through a PPA or other
market mechanism) may result in more
economically viable storage projects.
Scenario 3 – Excess Generation Mitigation
It is an intuitive benefit of energy storage
to store excess generation for later use. Many of
the use cases in this study demonstrate the

The Study of Energy Storage in Ontario Distribution Systems
44
indirect benefit of excess generation mitigation,
which has become a social and economic
concern to Ontario ratepayers. Enabling storage
project owners to share in the savings realized
when providing this mitigation, and thus
reduce the overall impact, could help ease these
concerns.

The Study of Energy Storage in Ontario Distribution Systems
45
Appendix A
Value Matrix
All values provided in the Value Matrix are normalized to dollars per megawatt-hour
($/MWh) of electricity delivered to the grid. The Value Matrix is intended to present the
potential value of the individual benefits for a given deployment of energy storage, whether
theoretical or currently monetizable. The benefits and associated values are defined and derived
such that no overlapping exists from one benefit to another – that is, they truly stack when they
are applicable to a given application. It is incumbent on the energy storage system developer to
determine the applicable benefits and possible MWhs delivered in a particular case.
Benefits
Monetary
Range (per
MWh of
services
provided)
Description
Market Arbitrage $13.90 -$23.50 Value that could be derived strictly through purchasing
energy at a low cost and selling at a high cost, using
Ontario's market price signals.
Distribution System
Upgrade Avoidance $12.87 -$133.56
Value of avoiding distribution system upgrades as a result of
dispatching energy storage. For example, congestion
mitigation may lead to avoidance of feeder expansion.
New Generation
Capacity Avoidance $12.15 -$25.23
Value of using stored energy to reduce demand on the
distribution system such that the development of new
generation facilities is avoided.
Redundant Power
Supply (Reliability) $3,900 -$26,000
Value of using stored energy to provide power to loads
during traditional distribution system outages. The lower
end of the range typically represents residential load and the
higher end of the range represents commercial, industrial, or
load of a critical nature.
Non-Spinning Reserve
Availability $0.20 - $30
Value paid to resources that participate as a part of "Non-
Spinning Reserve", or generation capacity which can inject
power after a short delay.
Spinning Reserve
Availability $0.20 - $54
Value paid to resources that participate as a part of
"Spinning Reserve", or generation capacity which can inject
power immediately.
Reserve Activation $0.40 - $135 Value paid to resources that participate as a part of
"Spinning Reserve" programs, once activated for supplying
reserve.
Power Quality
Improvement $6.06 -$11.35
Value of using energy storage to improve the quality of
power delivered to customers.
Frequency Regulation $45 - $65 Value of dispatching energy storage to provide Frequency
Regulation for IESO.
Voltage Control $8.30 -$58.50 Value of dispatching energy storage to provide Voltage
Control for IESO.
Black Start $5.85 - $36 Value of dispatching energy storage to provide Black Start
services IESO.

The Study of Energy Storage in Ontario Distribution Systems
46
Reduced Dispatching
of Peaker Facilities $110 - $170
Value of dispatching energy storage facilities as peaker
facilities in Ontario to meet peak demand, assist in ramping,
and assist with load following. Peaker facilities were
assumed to be natural gas facilities, therefore they are
sensitive to natural gas prices in Ontario.
Global Adjustment
Charge Reduction
(Class A)
$80,000 -
$105,000
Value of reducing consumption during all five Ontario
coincident peaks by 1 MW.
Theoretically
Monetizable Benefits
Monetary
Range Description
Excess Generation
Mitigation $50.00 -$116.09
Charging storage units during excess generation conditions
(provincially) rather than exporting surplus at a loss. Upper
limit assumes all charging is accomplished under excess
generation conditions, and the lower limit assumes that some
charging is done under excess generation conditions.
Greenhouse Gas
Mitigation (Cap-and
Trade)
$0.33 -$6.69
Value associated with reducing CO2 emissions by offsetting
natural gas facilities with non- CO2 emitting energy storage
resources. Values derived using cap-and-trade projections.
The high end of the value range assumes the energy storage
facility is discharging at a time when it is completely
offsetting CO2 emitting generation in the province and
charging when there is essentially zero CO2 emission
generation in the province. The lower end of the value range
involves scenarios that are less than this ideal state (i.e. Some
charging occurs while CO2 emitting power generation is
online and not 100% of the discharging is necessarily
offsetting CO2 emitting generation).
Enables Higher
Penetration of
Renewables
$90 - $130 Value associated with reducing curtailment of resources in
Ontario as a result of dispatching storage resources.
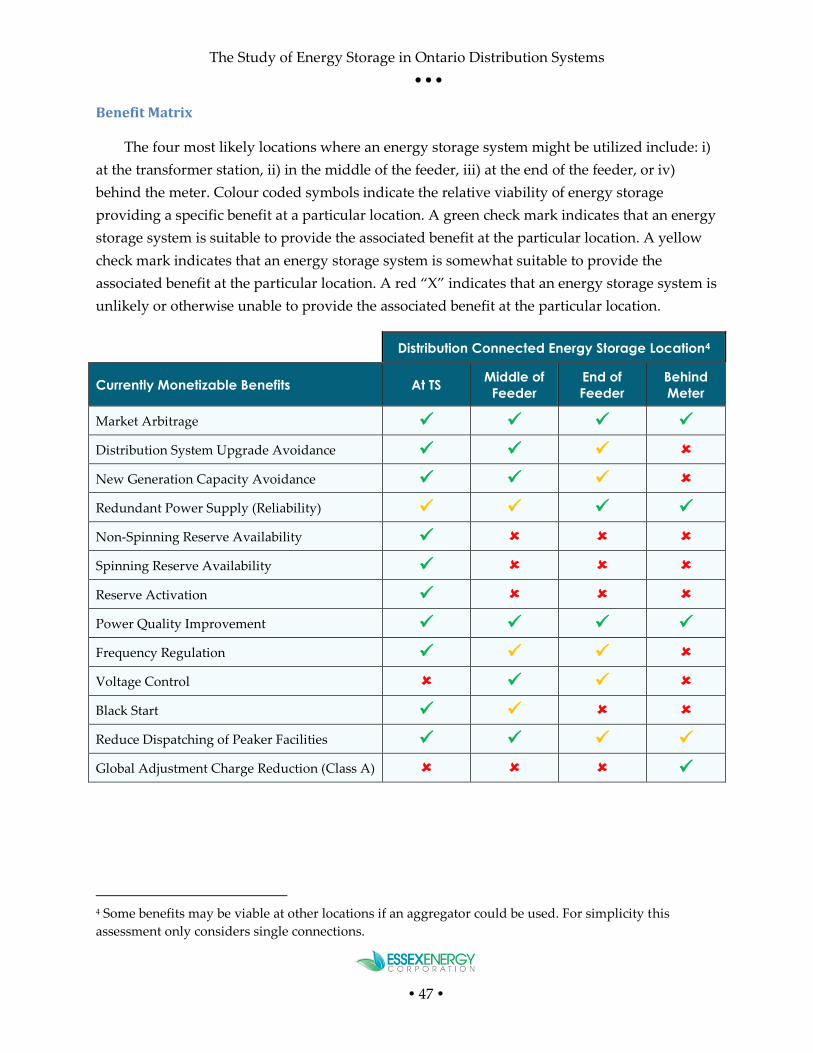
The Study of Energy Storage in Ontario Distribution Systems
47
Benefit Matrix
The four most likely locations where an energy storage system might be utilized include: i)
at the transformer station, ii) in the middle of the feeder, iii) at the end of the feeder, or iv)
behind the meter. Colour coded symbols indicate the relative viability of energy storage
providing a specific benefit at a particular location. A green check mark indicates that an energy
storage system is suitable to provide the associated benefit at the particular location. A yellow
check mark indicates that an energy storage system is somewhat suitable to provide the
associated benefit at the particular location. A red “X” indicates that an energy storage system is
unlikely or otherwise unable to provide the associated benefit at the particular location.
Distribution Connected Energy Storage Location4
Currently Monetizable Benefits At TS Middle of
Feeder
End of
Feeder
Behind
Meter
Market Arbitrage
Distribution System Upgrade Avoidance
New Generation Capacity Avoidance
Redundant Power Supply (Reliability)
Non-Spinning Reserve Availability
Spinning Reserve Availability
Reserve Activation
Power Quality Improvement
Frequency Regulation
Voltage Control
Black Start
Reduce Dispatching of Peaker Facilities
Global Adjustment Charge Reduction (Class A)
4 Some benefits may be viable at other locations if an aggregator could be used. For simplicity this
assessment only considers single connections.

The Study of Energy Storage in Ontario Distribution Systems
48
Theoretically Monetizable Benefits At TS Middle of
Feeder End of
Feeder Behind
Meter Excess Generation Mitigation
Greenhouse Gas Mitigation (Cap-and Trade)
Enables Higher Penetration of Renewables

The Study of Energy Storage in Ontario Distribution Systems
49
Appendix B
Benefit Calculation Methodology
Assumptions for all calculations:
Benefits provided by energy storage facilities are highly dependent on the individual
circumstances of each application; therefore, a range of values has been developed to
accommodate a variety of typical projects. While the ranges, based on research, capture
the value of the benefits experienced for the majority of energy storage projects, it is
possible that applications exist where values extend beyond those provided herein.
Where benefit values are clearly linked to the Ontario energy sector, Ontario market
data as well as other regional sources were used to derive Ontario-specific ranges.
Where benefit values are more universal, multiple sources across multiple jurisdictions
were cross-checked and used to derive ranges.
All dollars are expressed as $/MWh Canadian for services delivered to the grid
Canadian exchange rate was assumed to be $1.30 from US currency where applicable
1. Market Arbitrage ($13.90 - $23.50)
Assumed a four hour charge cycle and four hour discharge cycle
Summed the Hourly Ontario Electricity Price (HOEP) for each day in a month to find the
total monthly price for a single hour [17]
Calculated the lowest HOEP total for a consecutive four hour period for each month to
determine charge periods
Calculated the highest HOEP total for a consecutive four hour period for each month to
determine discharge periods
Calculated the average profit made from charging at the lowest rate and discharging at
the highest rate for 2011 – 2016, and divided by four to get the price per hour
Lowest profit margin occurred during 2012 ($13.93), highest profit margin occurred
during 2014 ($23.43). Upper and lower limits were approximated with these values.
2. Distribution System Upgrade Avoidance ($12.87 - $133.56)
The benefit value upper and lower limits, in $/kW-year, were determined by considering
several research papers [18], [19], [20], [21]
The following formula was used to convert $/kW-yr to $/MWh
$/𝑀𝑊ℎ = (𝑉𝑎𝑙𝑢𝑒 𝑖𝑛 $
𝑘𝑊⁄ 𝑦𝑒𝑎𝑟) ∙ 1000 𝑘𝑊/𝑀𝑊
𝑇𝑜𝑡𝑎𝑙 𝐷𝑢𝑟𝑎𝑡𝑖𝑜𝑛
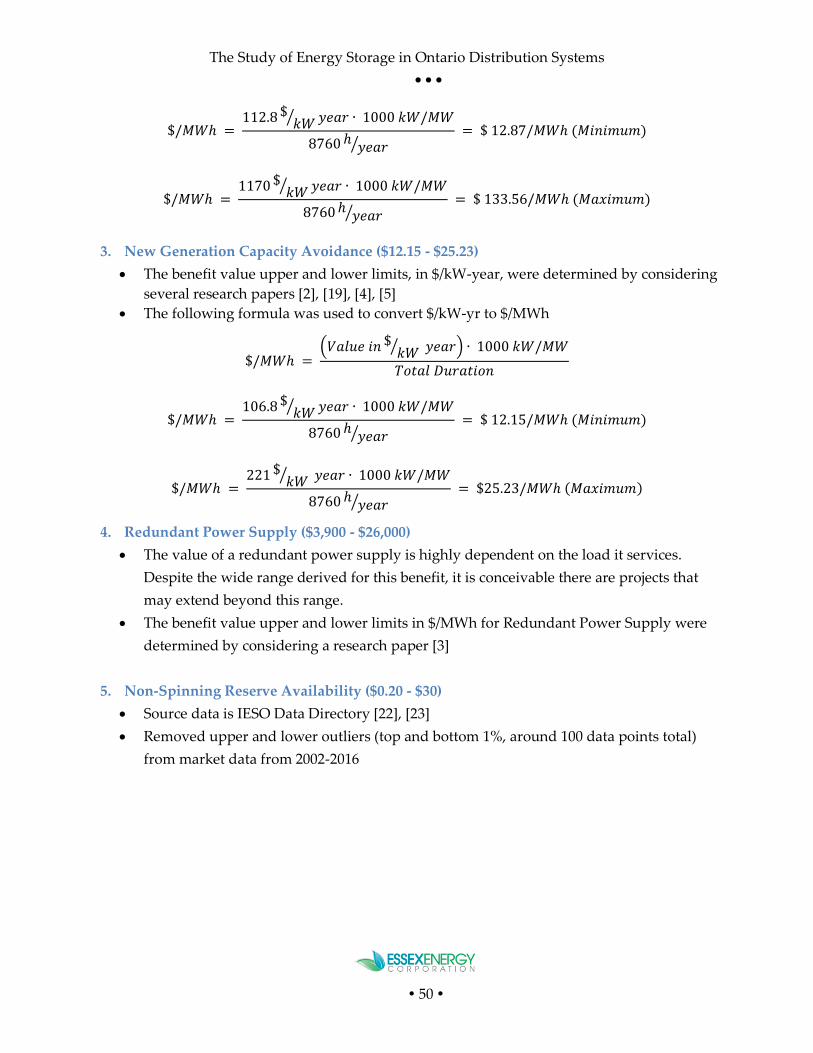
The Study of Energy Storage in Ontario Distribution Systems
50
$/𝑀𝑊ℎ = 112.8 $
𝑘𝑊⁄ 𝑦𝑒𝑎𝑟 ∙ 1000 𝑘𝑊/𝑀𝑊
8760 ℎ𝑦𝑒𝑎𝑟⁄
= $ 12.87/𝑀𝑊ℎ (𝑀𝑖𝑛𝑖𝑚𝑢𝑚)
$/𝑀𝑊ℎ = 1170 $
𝑘𝑊⁄ 𝑦𝑒𝑎𝑟 ∙ 1000 𝑘𝑊/𝑀𝑊
8760 ℎ𝑦𝑒𝑎𝑟⁄
= $ 133.56/𝑀𝑊ℎ (𝑀𝑎𝑥𝑖𝑚𝑢𝑚)
3. New Generation Capacity Avoidance ($12.15 - $25.23)
The benefit value upper and lower limits, in $/kW-year, were determined by considering
several research papers [2], [19], [4], [5]
The following formula was used to convert $/kW-yr to $/MWh
$/𝑀𝑊ℎ = (𝑉𝑎𝑙𝑢𝑒 𝑖𝑛 $
𝑘𝑊⁄ 𝑦𝑒𝑎𝑟) ∙ 1000 𝑘𝑊/𝑀𝑊
𝑇𝑜𝑡𝑎𝑙 𝐷𝑢𝑟𝑎𝑡𝑖𝑜𝑛
$/𝑀𝑊ℎ = 106.8 $
𝑘𝑊⁄ 𝑦𝑒𝑎𝑟 ∙ 1000 𝑘𝑊/𝑀𝑊
8760 ℎ𝑦𝑒𝑎𝑟⁄
= $ 12.15/𝑀𝑊ℎ (𝑀𝑖𝑛𝑖𝑚𝑢𝑚)
$/𝑀𝑊ℎ = 221 $
𝑘𝑊⁄ 𝑦𝑒𝑎𝑟 ∙ 1000 𝑘𝑊/𝑀𝑊
8760 ℎ𝑦𝑒𝑎𝑟⁄
= $25.23/𝑀𝑊ℎ (𝑀𝑎𝑥𝑖𝑚𝑢𝑚)
4. Redundant Power Supply ($3,900 - $26,000)
The value of a redundant power supply is highly dependent on the load it services.
Despite the wide range derived for this benefit, it is conceivable there are projects that
may extend beyond this range.
The benefit value upper and lower limits in $/MWh for Redundant Power Supply were
determined by considering a research paper [3]
5. Non-Spinning Reserve Availability ($0.20 - $30)
Source data is IESO Data Directory [22], [23]
Removed upper and lower outliers (top and bottom 1%, around 100 data points total)
from market data from 2002-2016

The Study of Energy Storage in Ontario Distribution Systems
51
Figure 8: Distribution of Non-Spinning Operating Reserve Market Price
6. Spinning Reserve Availability ($0.20 - $54)
Source data is IESO Data Directory [22], [23]
Removed upper and lower outliers (top and bottom 1%, around 100 data points total)
from market data from 2002-2016
Figure 9: Distribution of Spinning Operating Reserve Market Price
0
500
1000
1500
2000
2500
3000
3500
4000
4500
$0 $5 $10 $15 $20 $25 $30 $35 $40
Fre
qu
en
cy o
f M
arke
t P
rice
Market Price
10 Minute Non-Spinning Price 2002-2016
0
500
1000
1500
2000
2500
3000
3500
4000
4500
$0 $5 $10 $15 $20 $25 $30 $35 $40
Fre
qu
en
cy o
f M
arke
t P
rice
s
Market Price
10 Minute Spinning Reserve Prices 2002-2016

The Study of Energy Storage in Ontario Distribution Systems
52
7. Reserve Activation ($0.40 - $135)
Source data is IESO Data Directory [24], [25]
Considered only positive HOEP prices, upper limit is average HOEP ($40.10) plus three
standard deviations (one standard deviation being $33.62)
Figure 10: Distribution of HOEP Market Price
8. Power Quality Improvement ($6.06 - $11.35)
The benefit value upper and lower limits, in $/MWh, were determined by considering a
research paper [2]
9. Frequency Regulation ($45 - $65)
Referenced the total amount spent by IESO for frequency regulation in 2015
($45,150,514.04) and calculated the average amount spent per hour [26]
Then divided by average amount of scheduled regulation per hour (±100 MW)
$45,150,514.04/𝑦𝑒𝑎𝑟
8760 ℎ
𝑦𝑒𝑎𝑟
= $5154/ℎ
$5154/ℎ
100 𝑀𝑊= $51.54/𝑀𝑊ℎ
Confirmed with other research studies and established an upper and lower bound using
other sources [4], [27]
10. Voltage Control ($8.30 - $58.50)
IESO sources provided total amount spent in 2015 for Voltage Control ($20,018,689.52)
0
10000
20000
30000
40000
50000
60000
70000
80000
-$20 $0 $20 $40 $60 $80 $100 $120 $140
Fre
qu
en
cy o
f M
arke
t P
rice
HOEP
HOEP for 2002-2016

The Study of Energy Storage in Ontario Distribution Systems
53
[26]
Supplemented with proxy data from other research papers [4], [5]
11. Black Start ($5.85 - $36)
IESO sources provided total amount spent in 2015 for Black Start Services ($1,410,114.36)
[26]
Supplemented with proxy data from another research paper [5]
12. Reduced Dispatch of Peaker Facilities ($110 - $170)
In lieu of confidential agreements, used OEB’s Regulated Price Plan report to determine
amount paid to generation facilities when dispatched [28]
Does not include compensation for peaker plants being on standby
Expanded upper and lower limits to allow for changing natural gas prices
13. Global Adjustment Charge Reduction (Class A) ($80,000 -$105,000)
The table below indicates the total adjusted megawatts for each peak in 2015, and what
the coincident peak factor would be for a 1 MW reduction
Date Hour
Ending
Demand
Reduction
(kW)
Total
(MW)
Adjusted Quantity of
Energy Withdrawal
(MW)
Coincident Peak
Factor (CPF)
July 28, 2015 17 1,000 23,024 22,016 0.00004542
July 29, 2015 17 1,000 22,835 21,900 0.00004566
Aug. 17, 2015 17 1,000 22,892 21,882 0.00004570
July 27, 2015 18 1,000 22,323 21,562 0.00004638
Sept. 3, 2015 14 1,000 22,860 21,429 0.00004667
Total
5,000 113,935 108,788 0.00004388
Forecast Annual Total GA (M): $11,836.50
Table 25: Five Coincident Ontario Peaks for 2015
To find the total amount saved in one year by reducing demand by 1 MW on each peak,
multiply the average CPF by the Annual Total GA
𝐴𝑛𝑛𝑢𝑎𝑙 𝑆𝑎𝑣𝑖𝑛𝑔𝑠 = 𝐶𝑃𝐹 ∙ 𝐴𝑛𝑛𝑢𝑎𝑙 𝑇𝑜𝑡𝑎𝑙 𝐺𝐴
𝐴𝑛𝑛𝑢𝑎𝑙 𝑆𝑎𝑣𝑖𝑛𝑔𝑠 = 0.00004667 ∙ $11,836,500,000
𝐴𝑛𝑛𝑢𝑎𝑙 𝑆𝑎𝑣𝑖𝑛𝑔𝑠 = $552,409.46
The annual savings was averaged over five peaks and a margin of error applied for
upper and lower limits

The Study of Energy Storage in Ontario Distribution Systems
54
14. Excess Generation Mitigation ($50 - $116.09)
The value of mitigating excess generation in Ontario is derived by comparing the
average cost associated with producing power in Ontario with the average price (HOEP)
that power is exported at during times of excess generation in the province.
Average HOEP when exporting power during in June 2015 (used as sample) was $15.31
(which does not include Global Adjustment – additional costs associated with
generation in Ontario) [29], [25]
Average actual cost to produce power during the same period in Ontario was $131.40
(which includes Global Adjustment) [17], [25]
Therefore, upper limit of this value of Ontario’s mitigated excess generation is set to
$131.40 - $15.31 = $116.09
Lower limit set to $50 to establish a reasonable range. It is acknowledged that the low
end of the range could vary depending on timing of an energy storage facility (i.e. time-
of-day charging and discharging).
15. Greenhouse Gas Mitigation ($0.33 - $6.69)
This benefit assigns a market-based value to the CO2 emissions that are avoided when
storage offsets CO2 emitting sources. A similar amount is not accounted for within PPA-
related payments to carbon emitting generators in this study, there is no overlap of this
indirect benefit with other direct or indirect benefits described herein.
Calculated pounds CO2/kWh for a combined cycle natural gas generator [30], [31]
116.999 𝑙𝑏𝑠𝐶𝑂2
𝑀𝐵𝑡𝑢⁄ × 7658 𝐵𝑡𝑢𝑘𝑊ℎ⁄
1000000𝐵𝑡𝑢/𝑀𝐵𝑡𝑢 = 0.8959783 𝑙𝑏𝑠𝐶𝑂2/𝑘𝑊ℎ
Converted to kilograms CO2/MWh
0.8959783𝑙𝑏𝑠𝐶𝑂2
𝑘𝑊ℎ⁄ × 0.45359237
𝑘𝑔𝑙𝑏
⁄ × 1000 𝑘𝑊ℎ𝑀𝑊ℎ⁄ = 406.4089 𝑘𝑔𝐶𝑂2/𝑀𝑊ℎ
Based on current California-Quebec Cap-and-Trade auction results, cost per metric
tonne of CO2 used for the calculation of this benefit is $16.45/tonne [32], [33]
Upper Limit:
Assuming 100% of 1 MWh natural gas generation is offset during discharge and 100% of
the supply mix during charging does not emit CO2:
406.409 𝑘𝑔𝐶𝑂2
𝑀𝑊ℎ⁄ × $16.45/𝑡𝑜𝑛𝑛𝑒
1000𝑘𝑔
𝑡𝑜𝑛𝑛𝑒⁄= $6.69 /𝑀𝑊ℎ

The Study of Energy Storage in Ontario Distribution Systems
55
Lower Limit:
Calculated the difference between the sum of the minimum and maximum CO2
emissions (kg) produced in order to generate energy for four hour continuous periods
(within a given day), based on Ontario’s actual supply mix, using market data over 270
days in 2016 [17]. This difference is 21.509 tonnes.
21.509 tonnes is converted to a dollar value per MWh by multiplying it by the price per
tonne assigned to CO2 ($16.45/tonne of CO2, from above) and dividing by the number of
hours of discharge (4 hours per day, 270 days), yielding a low limit result of $0.33 per
MWh.
It is acknowledged that this low end of the range itself could vary depending on the
timing of the application of the energy storage facility and the resulting fuel source
mixes during charge and discharge cycles.
16. Enabling Higher Penetration of Renewables ($90 - $130)
Used OEB’s Regulated Price Plan report to find amount paid to wind generators [28]
Found lower limit by an assumed efficiency factor for storage losses (70%)
Upper limit was established using a minimal amount for allowable curtailment

The Study of Energy Storage in Ontario Distribution Systems
56
Appendix C Several permit costs are dependent on the size of a project, where this is the case the
upper limit will indicate “Size”.
Permit Type Jurisdiction Permit Name Low
Cost
High
Cost
Environmental Federal Approval under Navigable Waters
Protection Act
$ - $ -
Environmental Federal Migratory Game Bird Hunting Permit $ 17 $ 17
Environmental Federal Species At Risk Permit $ - $ -
Land Use Federal Application for Federal Crown Land $ 159 $ 159
Land Use Federal Land Use Proposal $ - $ -
Road Work Federal Notice of work close to railways $ - $ -
Sewer/ Water Federal Aeronautical Obstruction Clearance Permit $ - $ -
Construction Provincial Building and Land-Use Permit $ 90 Size
Construction Provincial Development Permit Application - NEC-4 $ - $ -
Construction Provincial Electrical Permit (Application for
Inspection)
$ 79 Size
Construction Provincial Electricity Transmitter Licence $ 60 $ 60
Environmental Provincial Vegetation Control Permit $130.81 $130.81
Land Use Provincial Application to amend The Niagara
Escarpment Plan
$ - $ -
Road Work Provincial Encroachment Permit $ 520 $ 1,560
Road Work Provincial Highway Building and Land Use Permit -
Building and Land Use Permit / Entrance
Permit
$ 195 Size
Road Work Provincial Oversize/Overweight Permit $ 65 $ 700
Construction Municipal Building Permit $ 90 Size
Construction Municipal Building Permit - Large Sign Permit $ 225 $ 225
Construction Municipal Demolition Permit $ 90 $10,000
Construction Municipal Heating, Ventilation and Air Conditioning
(HVAC) Permit
$194.24 $349.62
Environmental Municipal ChemTRAC $ - $ -
Environmental Municipal Tree Conservation $ - $ -
Land Use Municipal Crown Shore Allowance Release Request $ 500 $ 500
Land Use Municipal Moving Permit $ 50 $ 50
Land Use Municipal Occupancy Permit $ 10 $ 10
Land Use Municipal Planning and Zoning Requirements $ 80.31 Size
Road Work Municipal Culverts/Driveways $ 1,450 Size
Road Work Municipal Curb Cut Permit $ 8 $ 8
Road Work Municipal Permanent Encroachment Permit $ 34 Size
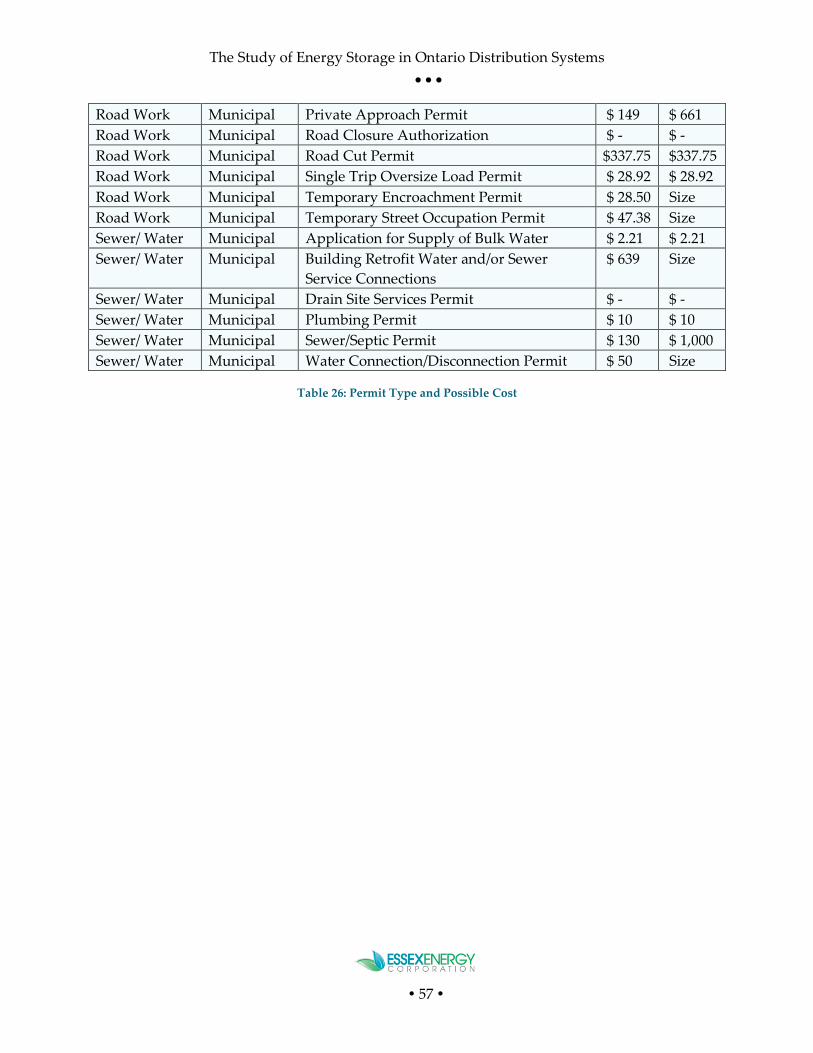
The Study of Energy Storage in Ontario Distribution Systems
57
Road Work Municipal Private Approach Permit $ 149 $ 661
Road Work Municipal Road Closure Authorization $ - $ -
Road Work Municipal Road Cut Permit $337.75 $337.75
Road Work Municipal Single Trip Oversize Load Permit $ 28.92 $ 28.92
Road Work Municipal Temporary Encroachment Permit $ 28.50 Size
Road Work Municipal Temporary Street Occupation Permit $ 47.38 Size
Sewer/ Water Municipal Application for Supply of Bulk Water $ 2.21 $ 2.21
Sewer/ Water Municipal Building Retrofit Water and/or Sewer
Service Connections
$ 639 Size
Sewer/ Water Municipal Drain Site Services Permit $ - $ -
Sewer/ Water Municipal Plumbing Permit $ 10 $ 10
Sewer/ Water Municipal Sewer/Septic Permit $ 130 $ 1,000
Sewer/ Water Municipal Water Connection/Disconnection Permit $ 50 Size
Table 26: Permit Type and Possible Cost

The Study of Energy Storage in Ontario Distribution Systems
58
Appendix D
Figure 11: Case 1 – 15 Year Project Life Cost and Benefit Chart

The Study of Energy Storage in Ontario Distribution Systems
59
Figure 12: Case 2 – 15 Year Project Life Cost and Benefit Chart

The Study of Energy Storage in Ontario Distribution Systems
60
Figure 13: Case 3 – 15 Year Project Life Cost and Benefit Chart

The Study of Energy Storage in Ontario Distribution Systems
61
Figure 14: Case 4 – 15 Year Project Life Cost and Benefit Chart

The Study of Energy Storage in Ontario Distribution Systems
62
Figure 15: Case 5 (Demand Included) – 15 Year Project Life Cost and Benefit Chart

The Study of Energy Storage in Ontario Distribution Systems
63
Figure 16: Case 5 (Demand Not Included) – 15 Year Project Life Cost and Benefit Chart

The Study of Energy Storage in Ontario Distribution Systems
64
Appendix E
This appendix demonstrates the cash flows that could occur during charge and
discharge cycles in the Ontario market given a purely merchant scenario for an energy storage
facility. It appears there may be an imbalance in the amounts paid to the IESO and the amounts
paid by the IESO, due to the settlement of GA.
Figure 17 depicts a very simplistic representation of the basic flow of cash through the
Ontario electricity market without consideration for energy storage.
Figure 17: Conventional cash flow, Ontario market
The IESO administers and settles the electricity market, ultimately collecting money
from customers to distribute payments to generators. In the example shown in the figure above,
payment for 1 MWh (HOEP and GA) passes from the customer to the IESO, and the IESO
distributes payments at a contracted price to the generator(s) that produced the electricity.
Essentially, the difference between contract and related payments to generators/suppliers and
HOEP is the primary driver for GA charges, so if contracted prices are close to HOEP then GA
becomes less significant. While historically this has generally not been the case, there have been
Customer
1 MWh
1 M
Wh
of
Co
ntr
ac
ted
Pric
e
1M
Wh
of H
OEP
an
d G
A
Generator
IESO
Cash Flow – Ontario Market, No Storage
Generator
Energy flow through the grid

The Study of Energy Storage in Ontario Distribution Systems
65
instances where GA has become negative to distribute an over-collection of funds back to the
customers.
In Figure 18, the cash flow diagram considers an energy storage facility during a
charging cycle. For demonstration purposes, the storage system is assumed to have an 80%
efficiency rating between its charge and discharge cycles, thus, it consumes 1.25 MWh of energy
to enable a discharge of 1 MWh of energy.
Figure 18: Cash flow in the Ontario market considering an energy storage charge cycle
In this scenario, a generator is required to deliver 1.25 MWh of energy to the broader
electricity grid (where storage is connected) in order to charge the storage facility. The generator
is then compensated by the IESO for its energy production and the storage facility must pay the
IESO for 1.25 MWh of HOEP and GA for the energy it consumed while charging.
Figure 19 illustrates the cash flows that would be expected to occur when a storage
facility discharges, thus delivering energy to the grid to ultimately support customer load.
Storage
1.25 MWh
1.2
5 M
Wh
of
Co
ntr
ac
ted
Pric
e
1.2
5 M
Wh
of H
OEP
an
d G
A
Generator
IESO
Cash Flow – Storage, Charge Cycle
Energy flow through the grid

The Study of Energy Storage in Ontario Distribution Systems
66
Figure 19: Cash flow in the Ontario market considering an energy storage discharge cycle
When the storage facility discharges to the grid in order to deliver a customer 1 MWh of
energy, the storage facility is compensated for 1 MWh at HOEP rates (without GA) by the IESO.
Also, as in Figure 17, the customer consumes 1 MWh of energy and pays the IESO (directly or
indirectly depending on wholesale/retail status) HOEP and GA accordingly.
This scenario appears to leave an imbalance in the cash flows at the IESO level. That is,
the IESO collects for a total of 2.25 MWh of HOEP and GA charges, while paying out for 1.25
MWh of contracted price and 1 MWh of HOEP (no GA). In other words, in the charging
scenario, the IESO collects GA from the storage facility and uses it to pay generators. In the
discharging scenario, the IESO collects GA from the load customer, but is not required to use
this GA to compensate generators, since it already did this when the storage facility was
charging. Figure 20 graphically illustrates this potential imbalance.
Customer
1 MWh
1 M
Wh
of
Co
ntr
ac
ted
Pric
e
1M
Wh
of H
OEP
an
d G
A
Storage
IESO
Cash Flow – Storage, Discharge Cycle
Energy flow through the grid

The Study of Energy Storage in Ontario Distribution Systems
67
Figure 20: Imbalance of HOEP and GA Payments
The following are alternative scenarios conducted during the course of this study. These
scenarios were created in order to more clearly show the effect that Global Adjustment charges
have on the original scenario models. Four of the five original use cases (i.e. Use Cases 1 - 4) are
included in this appendix; the fifth use case is not included here since the original use case is
based upon Global Adjustment savings for a Class A customer.
For each scenario presented below, the original net present value is presented on the left,
with the measure for the alternative scenario (i.e. 20% Global Adjustment) on the right. For each
scenario, only the Global Adjustment charges have been reduced to offset the imbalance
described in this appendix in order to produce “what if GA was balanced” use cases. All other
parameters for each scenario remain the same as in the original case.
Paid by IESO Paid to IESO
≈
≠

The Study of Energy Storage in Ontario Distribution Systems
68
Figure 21: Case 1 – Original Scenario and 20% GA Scenario
Figure 22: Case 2 – Original Scenario and 20% GA Scenario

The Study of Energy Storage in Ontario Distribution Systems
69
Figure 23: Case 3 – Original Scenario and 20% GA Scenario
Figure 24: Case 4 – Original Scenario and 20% GA Scenario

The Study of Energy Storage in Ontario Distribution Systems
70
References
[1] “State of Charge: Massachusetts Energy Storage Initiative”, www.mass.gov, 2016, page vi.
[Online]. Available: http://www.mass.gov/eea/docs/doer/state-of-charge-report.pdf.
[2] “POWER.HOUSE”, Power Stream, 2016. [Online] Available:
https://www.powerstream.ca/innovation/power-house.html
[3] “PowerStream switches on microgrid in Penetanguishene, Ont.”, cleantech Canada, July 4,
2016. [Online]. Available: http://www.canadianmanufacturing.com/operations/powerstream-
switches-on-microgrid-in-penetanguishene-ont-171227/.
[4] “MARS Advanced Energy Center Features Opus One Solutions: The Future of Microgrids”,
Opus One Solutions, March 3, 2016. [Online]. Available:
http://www.opusonesolutions.com/news/mars-advanced-energy-centre-features-opus-one-
solutions-future-microgrids/.
[5] “Current Projects”, hydrostor.ca. [Online]. Available: http://hydrostor.ca/. [Accessed
December 14, 2016]
[6] “World’s First Pole Mounted Community Energy Storage in Toronto”, eCAMION,
September 15, 2016. [Online]. Available: http://www.ecamion.com/ecamion-commissions-
worlds-first-pole-mounted-community-energy-storage-in-toronto/
[7] “Community Energy Storage (CES)”, ecamion.com. [Online] Available:
http://www.ecamion.com/portfolio/ces/ [Accessed December 14, 2016].
[8] “NRSTOR ANNOUNCES ONE YEAR OF COMMERCIAL OPERATIONS AT 2MW
FLYWHEEL FACILITY”, NRSTOR.com, July 22, 2015. [Online]. Available:
http://www.nrstor.com/news/nrstor-announces-one-year-of-commercial-operations-at-2mw-
flywheel-facility/.
[9] “DISTRIBUTED GRID-SCALE ENERGY STORAGE”, Sustainable Development Technology
Canada (SDTC), 2010. [Online]. Available:
https://www.sdtc.ca/sites/default/files/sdtc_temporalpower_english_web.pdf
[10] “Opus One”, Ministry of Energy, May 26, 2015. [Online]. Available:
http://www.energy.gov.on.ca/en/smart-grid-fund/smart-grid-fund-projects/opus-one/.

The Study of Energy Storage in Ontario Distribution Systems
71
[11] “RES Canada Announces Completion of Energy Storage System”, PR Newswire, August 5,
2014. [Online]. Available: http://www.prnewswire.com/news-releases/res-canada-announces-
completion-of-energy-storage-system-269963271.html.
[12] “City of Oshawa and OPUC partner with Japanese energy organization to bring innovative
solar energy storage and management project to Oshawa”, Oshawa.com, July 17, 2015. [Online].
Available: https://www.oshawa.ca/Modules/News/index.aspx?newsId=d3e20c2a-6cfe-4675-
bc36-02810f00d600.
[13] T. Saxon. “Guelph Hydro to host innovative flywheel energy project”, Guelph Today,
November 2, 2016. [Online]. Available: https://www.guelphtoday.com/local-news/guelph-
hydro-to-host-innovative-flywheel-energy-project-453214.
[14] “Hydrogenics Selected for 2 Megawatt Energy Storage Facility in Ontario”, Hydrogenics,
July 25, 2014. [Online]. Available: http://www.hydrogenics.com/about-the-company/news-
updates/2014/07/25/hydrogenics-selected-for-2-megawatt-energy-storage-facility-in-ontario.
[15] “IESO Report: Energy Storage”, ieso.ca, March 2016, pages 14-16. [Online] Available:
http://www.ieso.ca/-/media/files/ieso/document-library/energy-storage/ieso-energy-storage-
report_march-2016.pdf.
[16] “Panasonic Eco Solutions Canada”, energy.gov.on.ca, Available:
http://www.energy.gov.on.ca/en/smart-grid-fund/smart-grid-fund-projects/panasonic-eco-
solutions-canada/. [Accessed March 20, 2017]
[17] "IESO Data Directory - Hourly Ontario and Market Demands, 2002-2015", ieso.ca, 2016.
[Online]. Available: http://www.ieso.ca/Pages/Power-Data/Data-Directory.aspx.
[18] A. Akhil, Abbas, et al. “DOE/EPRI 2013 Electricity Storage Handbook in Collaboration with
NRECA”, Sandia National Laboratories, New Mexico, CA, July 2013. Available:
http://www.sandia.gov/ess/publications/SAND2013-5131.pdf.
[19] Chang, Judy, et al. (2015). “The Value of Distributed Electricity Storage in Texas: Proposed
Policy for Enabling Grid integrated Storage Investments.” Prepared for Oncor Electric Delivery
Company, The Brattle Group, November 2015. Available:
http://brattle.com/system/publications/pdfs/000/005/126/original/The_Value_of_Distributed_Ele
ctricity_Storage_in_Texas_-_Proposed_Policy_for_Enabling_Grid-
Integrated_Storage_Investments_Full_Technical_Report.pdf?1426377384.
[20] Fitzgerald, Garrett, et al. (2015). “THE ECONOMICS OF BATTERY ENERGY STORAGE:
HOW MULTI-SE, CUSTOMER-SITED BATTERIES DELIVER THE MOST SERVICES AND

The Study of Energy Storage in Ontario Distribution Systems
72
VALUE TO CUSTOMERS AND THE GRID”, Rocky Mountain Institute, Boulder, CO, October
2015. Available:
http://www.rmi.org/Content/Files/RMI-TheEconomicsOfBatteryEnergyStorage-FullReport-
FINAL.pdf.
[21] Rastler, D., (2010). “Electricity Energy Storage Technology Options: A white paper primer
on applications, costs and benefits”, Electric Power Research Institute, Palo Alto, CA, December
2010. Available:
http://large.stanford.edu/courses/2012/ph240/doshay1/docs/EPRI.pdf.
[22] "IESO Data Directory – Daily Operating Reserve Prices, 2002-2015", ieso.ca, 2016. [Online].
Available: http://www.ieso.ca/Pages/Power-Data/Data-Directory.aspx.
[23] "IESO Data Directory – Daily Operating Reserve Prices, year-to-date", ieso.ca, 2016.
[Online]. Available: http://www.ieso.ca/Pages/Power-Data/Data-Directory.aspx.
[24] "IESO Data Directory – HOEP, 2002-2015", ieso.ca, 2016. [Online]. Available:
http://www.ieso.ca/Pages/Power-Data/Data-Directory.aspx.
[25] "IESO Data Directory – HOEP, 2016 year-to-date", ieso.ca, 2016. [Online]. Available:
http://www.ieso.ca/Pages/Power-Data/Data-Directory.aspx.
[26] "IESO Ancillary Services Market", ieso.ca, 2016. [Online]. Available:
http://ieso.ca/Pages/Participate/Markets-and-Programs/Ancillary-Services-Market.aspx.
[Accessed: 02-Nov-2016].
[27] J. Arseneaux. (2008). “GRID FREQUENCY REGULATION BY RECYCLING ELECTRICAL
ENERGY IN FLYWHEELS”, Prepared for New York State Energy Research and Development
Authority, Beacon Power Corporation, MA, July 2008.
[28] Ontario Energy Board, "Regulated Price Plan Price Report May 1, 2016 to April 30, 2017",
2016. [Online]. Available: http://www.ontarioenergyboard.ca/oeb/_Documents/EB-2004-
0205/RPP_Price_Report_May2016.pdf.
[29] C. Blizzard, “Electricity exports cost Ontario taxpayers $200 million in June”, Toronto Sun,
August 12, 2015. [Online]. Available: http://www.torontosun.com/2015/08/12/ontario-taxpayers-
spend-200-million-on-exported-electricity-in-june. [Accessed Nov. 3, 2016].
[30] "SAS Output", Eia.gov, 2016. [Online]. Available:
http://www.eia.gov/electricity/annual/html/epa_08_02.html. [Accessed: 03- Nov- 2016].

The Study of Energy Storage in Ontario Distribution Systems
73
[31] "How much carbon dioxide is produced per kilowatt-hour when generating electricity with
fossil fuels? - FAQ - U.S. Energy Information Administration (EIA)", U.S. Energy Information
Administration (EIA), 2016. [Online]. Available:
https://www.eia.gov/tools/faqs/faq.cfm?id=74&t=11. [Accessed: 03- Nov- 2016].
[32] “California Cap-and-Trade Program and Québec Cap-and-Trade System May 2016 Joint
Auction #7 Summary Results Report”, California Air Resources Board (ARB) and Québec’s
ministère du Développement durable, de l’Environnement et de la Lutte contre les changements
climatiques (MDDELCC), 2016. [Online]. Available:
https://www.arb.ca.gov/cc/capandtrade/auction/may-2016/summary_results_report.pdf.
[33] “CALIFORNIA CAP-AND-TRADE PROGRAM SUMMARY OF JOINT AUCTION
SETTLEMENT PRICES AND RESULTS”, California Air Resources Board (ARB), 2016. [Online].
Available: https://www.arb.ca.gov/cc/capandtrade/auction/results_summary.pdf.