energy storage analysis using the battery storage ...€¦ · energy storage analysis using the...
TRANSCRIPT
Energy Storage Analysis Using the Battery
Storage Evaluation Tool
2016 DOE/OE Peer Review 2016
September 27, 2016
Washington D.C.
Patrick Balducci
Chief Economist
Pacific Northwest National Laboratory
Contributors - Vincent Sprenkle, Michael Kintner-Meyer, Di Wu, Trevor Hardy, Alasdair Crawford, Jud Virden
Dr. Imre Gyuk - Energy Storage Program Manager, Office of Electricity Delivery and Energy Reliability, U.S.
Department of Energy
1
Challenge - Over 3,000 utilities
Different grid reliability, resiliency, flexibility, renewable integration challenges
Different market structure Different cost of electricity Other competing solution approaches besides energy storage
What is needed Requires regional and local analysis of deployed storage technologies
in diverse markets to develop full understanding of monetized and unmonetized benefits
Development of industry standard design tools with fidelity to capture the multi-use value of storage in transmission, distribution, and behind the meter applications
New business models
Monetize Energy Storage Benefits for
Multiple Grid Applications
2
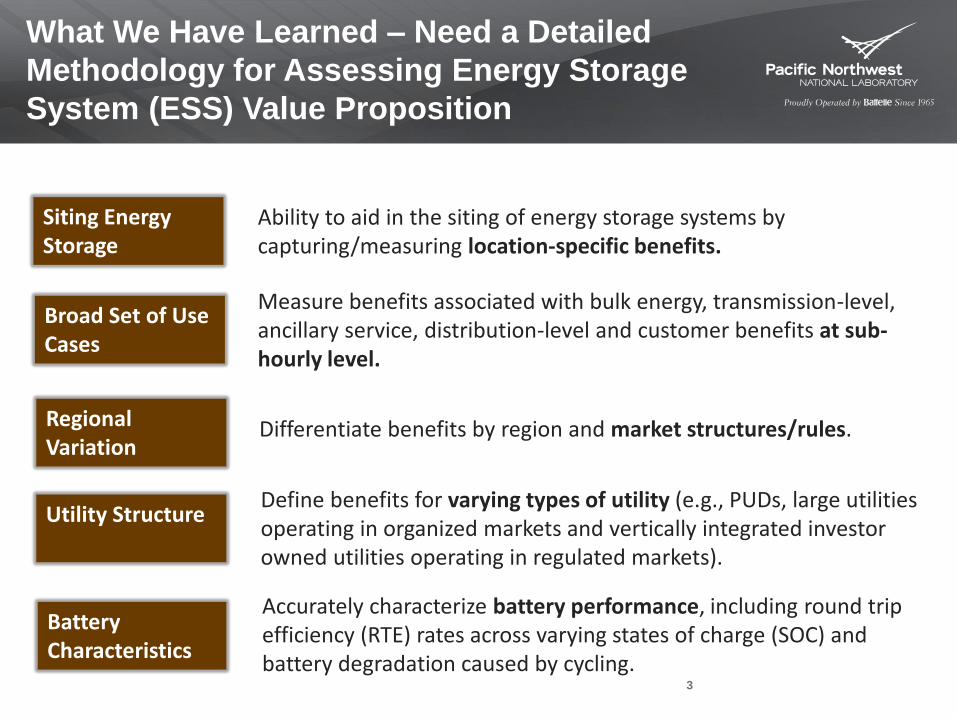
Siting Energy Storage
Broad Set of Use Cases
Ability to aid in the siting of energy storage systems by capturing/measuring location-specific benefits.
Measure benefits associated with bulk energy, transmission-level, ancillary service, distribution-level and customer benefits at sub-hourly level.
Regional Variation
Differentiate benefits by region and market structures/rules.
Utility Structure Define benefits for varying types of utility (e.g., PUDs, large utilities operating in organized markets and vertically integrated investor owned utilities operating in regulated markets).
Battery Characteristics
Accurately characterize battery performance, including round trip efficiency (RTE) rates across varying states of charge (SOC) and battery degradation caused by cycling.
What We Have Learned – Need a Detailed
Methodology for Assessing Energy Storage
System (ESS) Value Proposition
3
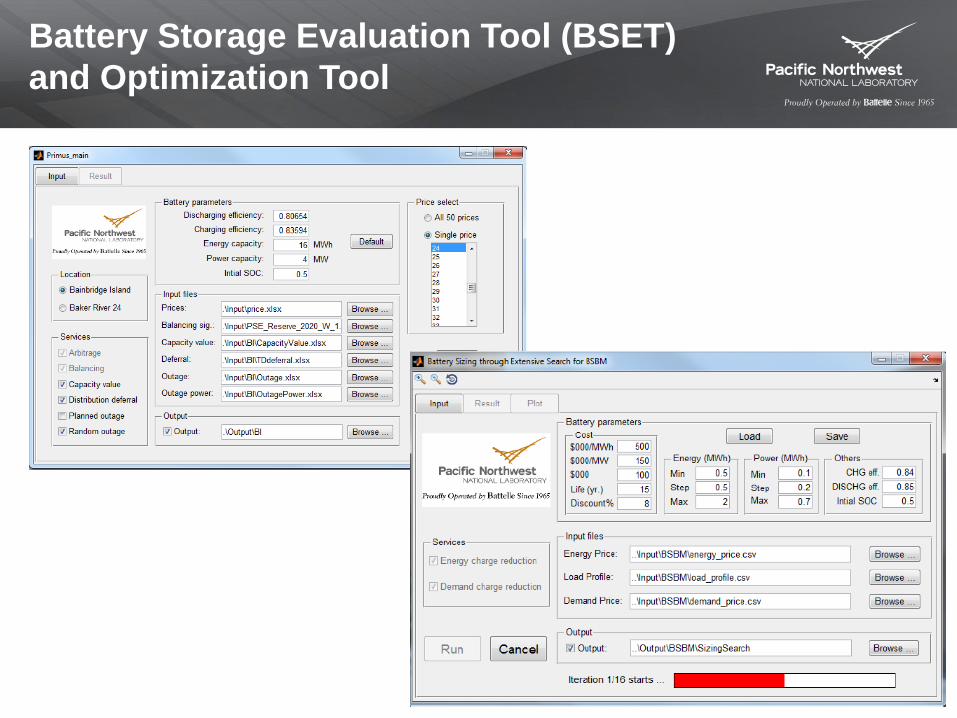
Battery Storage Evaluation Tool (BSET)
and Optimization Tool
4
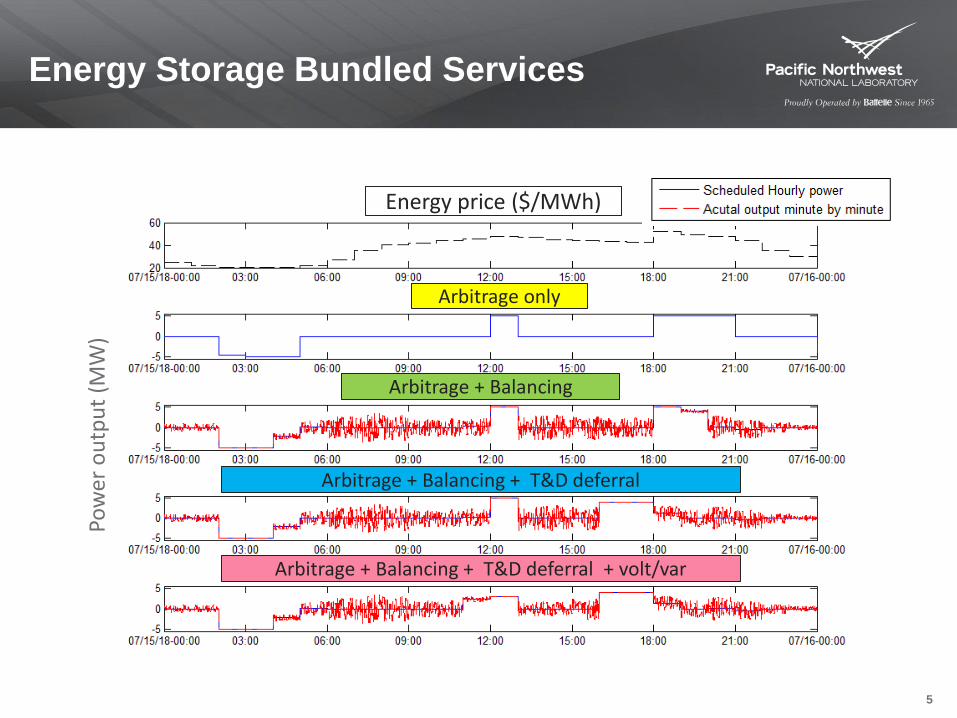
Energy price ($/MWh)
Arbitrage only
Arbitrage + Balancing
Arbitrage + Balancing + T&D deferral
Pow
er o
utp
ut
(MW
)
Arbitrage + Balancing + T&D deferral + volt/var
Energy Storage Bundled Services
5
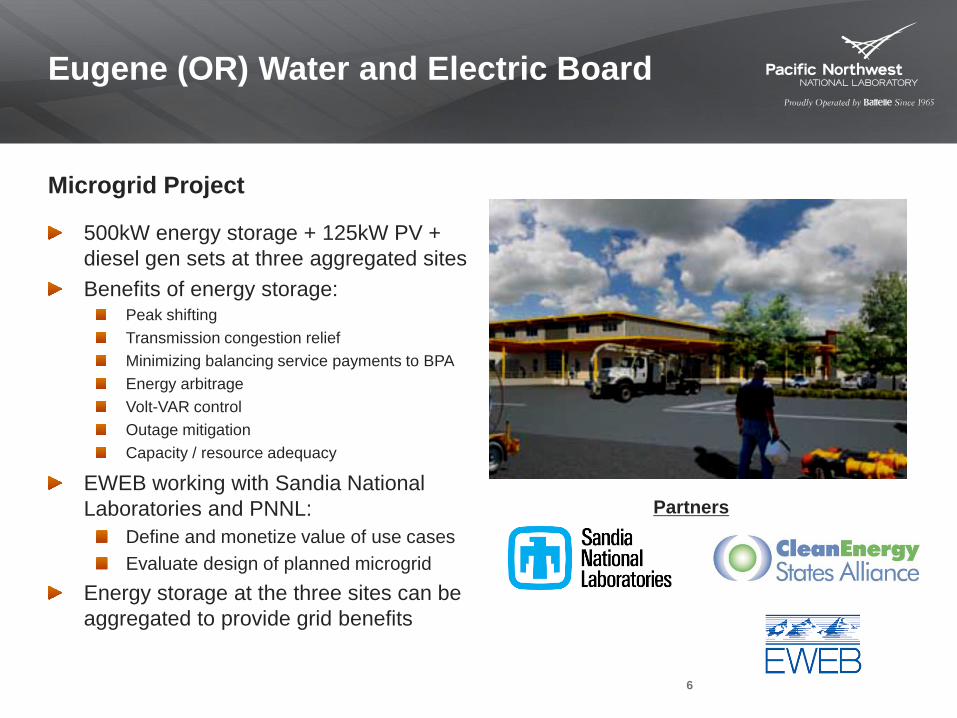
Eugene (OR) Water and Electric Board
Microgrid Project
500kW energy storage + 125kW PV +
diesel gen sets at three aggregated sites
Benefits of energy storage: Peak shifting
Transmission congestion relief
Minimizing balancing service payments to BPA
Energy arbitrage
Volt-VAR control
Outage mitigation
Capacity / resource adequacy
EWEB working with Sandia National
Laboratories and PNNL:
Define and monetize value of use cases
Evaluate design of planned microgrid
Energy storage at the three sites can be
aggregated to provide grid benefits
Partners
6
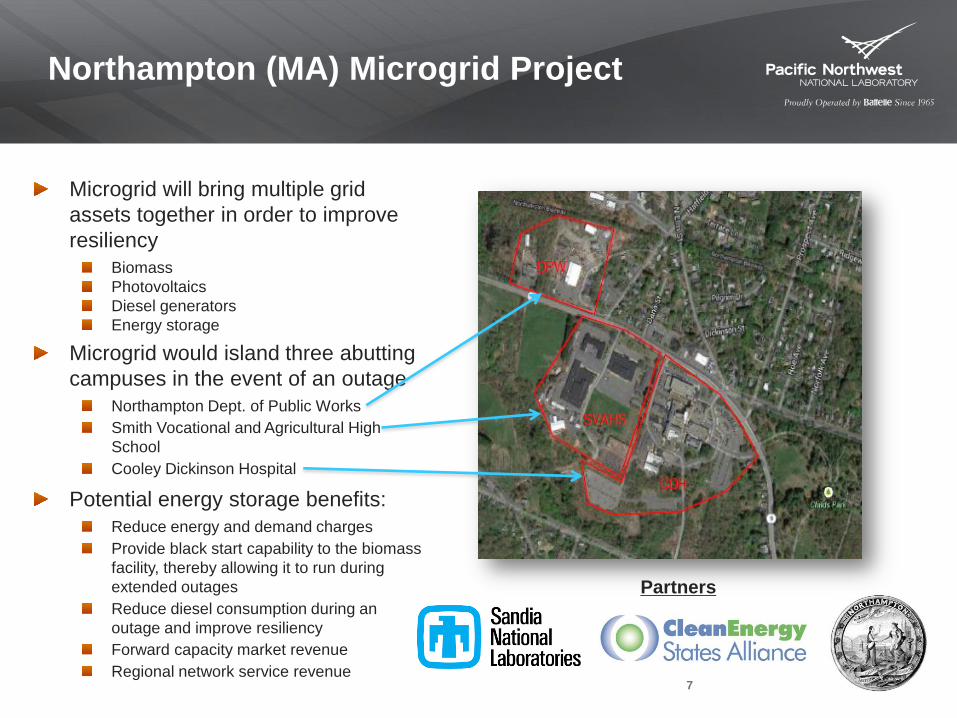
Northampton (MA) Microgrid Project
Microgrid will bring multiple grid
assets together in order to improve
resiliency
Biomass
Photovoltaics
Diesel generators
Energy storage
Microgrid would island three abutting
campuses in the event of an outage
Northampton Dept. of Public Works
Smith Vocational and Agricultural High
School
Cooley Dickinson Hospital
Potential energy storage benefits:
Reduce energy and demand charges
Provide black start capability to the biomass
facility, thereby allowing it to run during
extended outages
Reduce diesel consumption during an
outage and improve resiliency
Forward capacity market revenue
Regional network service revenue
Partners
7
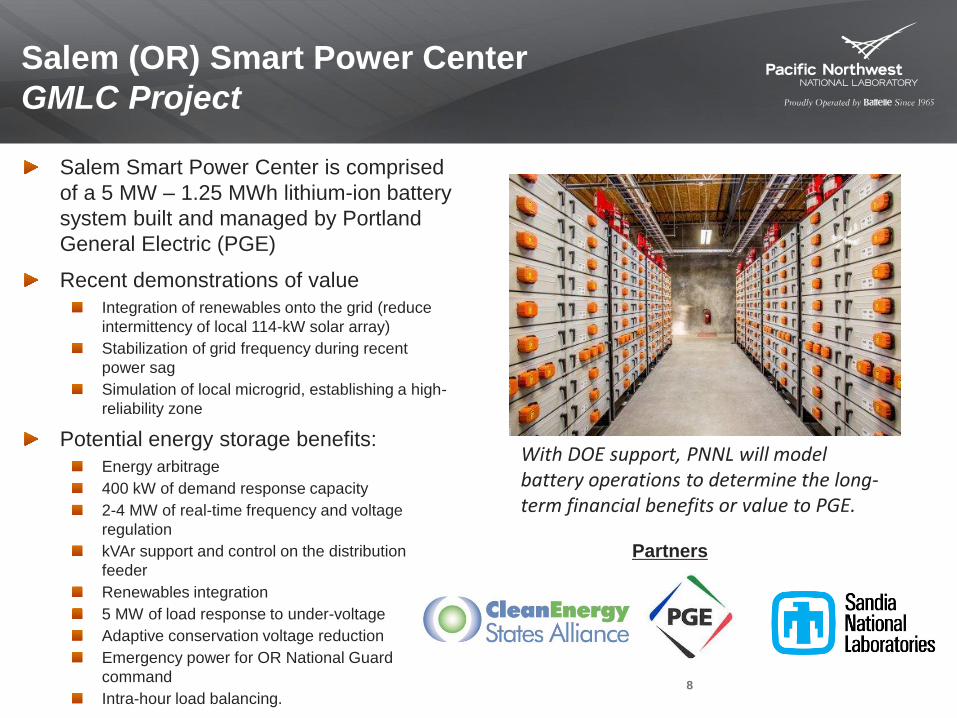
Salem (OR) Smart Power Center
GMLC Project
Salem Smart Power Center is comprised
of a 5 MW – 1.25 MWh lithium-ion battery
system built and managed by Portland
General Electric (PGE)
Recent demonstrations of value
Integration of renewables onto the grid (reduce
intermittency of local 114-kW solar array)
Stabilization of grid frequency during recent
power sag
Simulation of local microgrid, establishing a high-
reliability zone
Potential energy storage benefits:
Energy arbitrage
400 kW of demand response capacity
2-4 MW of real-time frequency and voltage
regulation
kVAr support and control on the distribution
feeder
Renewables integration
5 MW of load response to under-voltage
Adaptive conservation voltage reduction
Emergency power for OR National Guard
command
Intra-hour load balancing.
With DOE support, PNNL will model battery operations to determine the long-term financial benefits or value to PGE.
Partners
8
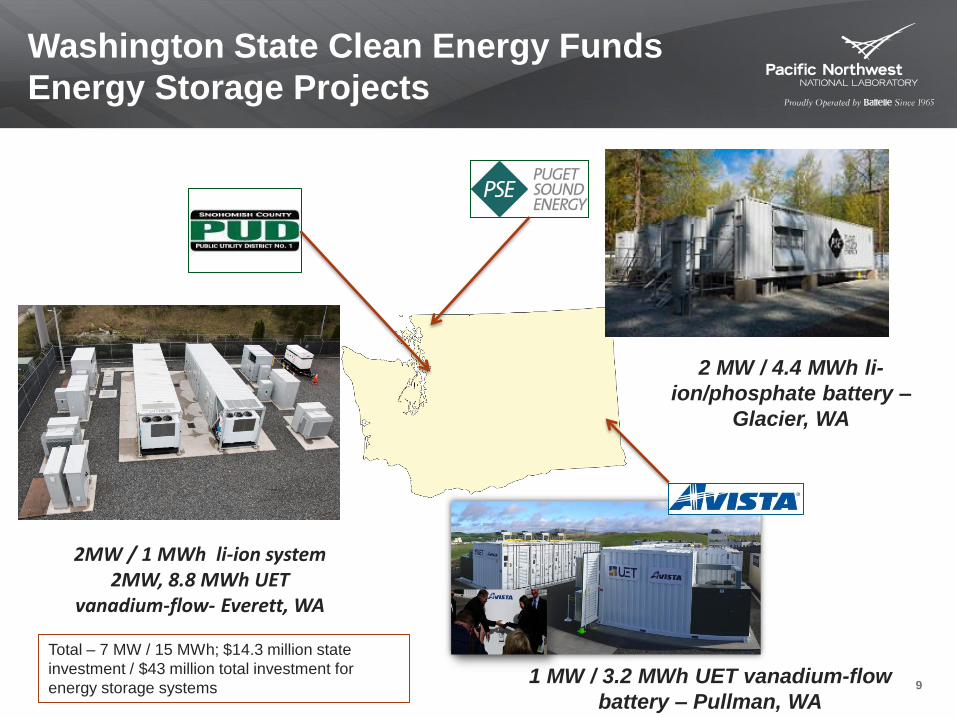
2 MW / 4.4 MWh li-
ion/phosphate battery –
Glacier, WA
1 MW / 3.2 MWh UET vanadium-flow
battery – Pullman, WA
2MW / 1 MWh li-ion system 2MW, 8.8 MWh UET
vanadium-flow- Everett, WA
Washington State Clean Energy Funds
Energy Storage Projects
Total – 7 MW / 15 MWh; $14.3 million state
investment / $43 million total investment for
energy storage systems 9
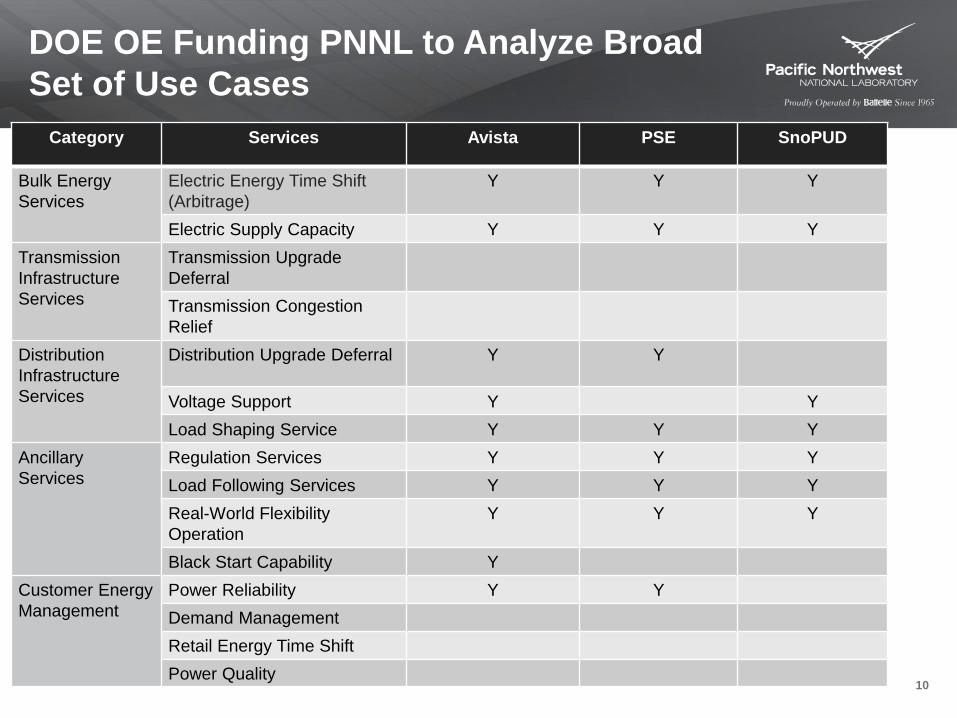
DOE OE Funding PNNL to Analyze Broad
Set of Use Cases
Category Services Avista PSE SnoPUD
Bulk Energy
Services
Electric Energy Time Shift
(Arbitrage)
Y Y Y
Electric Supply Capacity Y Y Y
Transmission
Infrastructure
Services
Transmission Upgrade
Deferral
Transmission Congestion
Relief
Distribution
Infrastructure
Services
Distribution Upgrade Deferral Y Y
Voltage Support Y Y
Load Shaping Service Y Y Y
Ancillary
Services
Regulation Services Y Y Y
Load Following Services Y Y Y
Real-World Flexibility
Operation
Y Y Y
Black Start Capability Y
Customer Energy
Management
Power Reliability Y Y
Demand Management
Retail Energy Time Shift
Power Quality 10
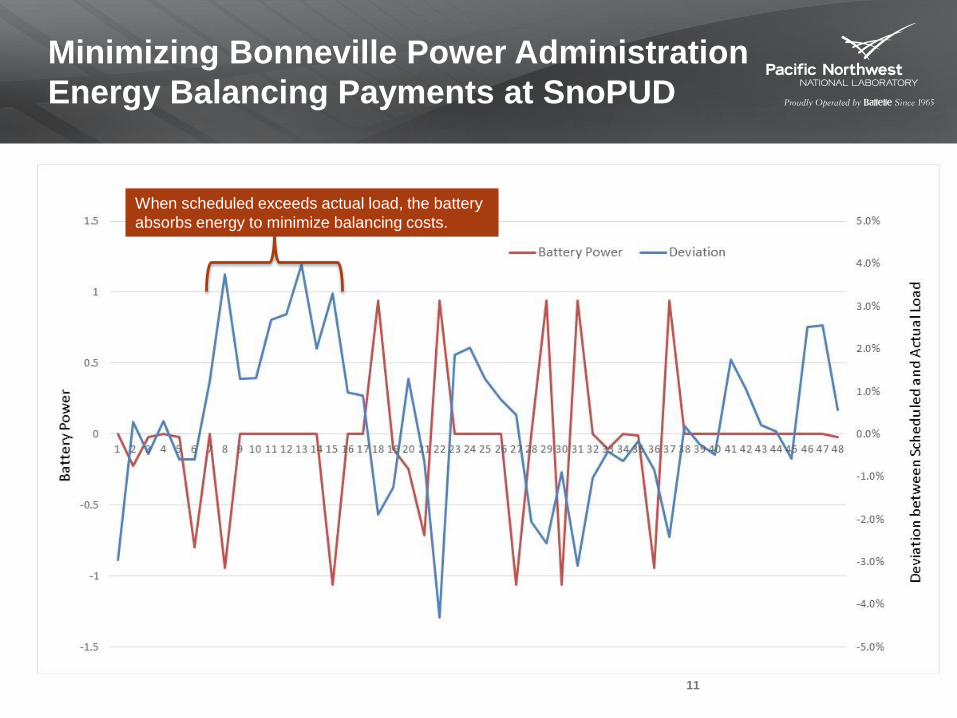
Minimizing Bonneville Power Administration
Energy Balancing Payments at SnoPUD
When scheduled exceeds actual load, the battery
absorbs energy to minimize balancing costs.
11

DOE-OE Test Protocol Results for Vanadium
Flow Battery (VFB) at Avista
Test Test conditions Discharge Energy
kWh RTE (%)
Normalized RMS
Baseline Capacity Energy capacity at constant power of 520 kW / cumulative RTE 3 cycles
3200 kWh 71
Frequency Regulation Max power 800 kW 71 0.12
Peak Shaving 600 kW charge, 520, 740, 1000 kW discharge
3115, 2920, 1995 72, 65, 63
(1) DR Conover et al, Protocol for Uniformly Measuring and Expressing the Performance of
Energy Storage Systems, PNNL-22010 Rev 2 / SAND2016-3078R
Tested under capacity, frequency regulation, and peak shaving developed under DOE
lead working groups(1)
RTE (%) is AC-AC and includes DC battery, PCS, and auxiliary
For peak shaving, RTE decreases for increasing power demand
No degradation observed after baseline testing
12
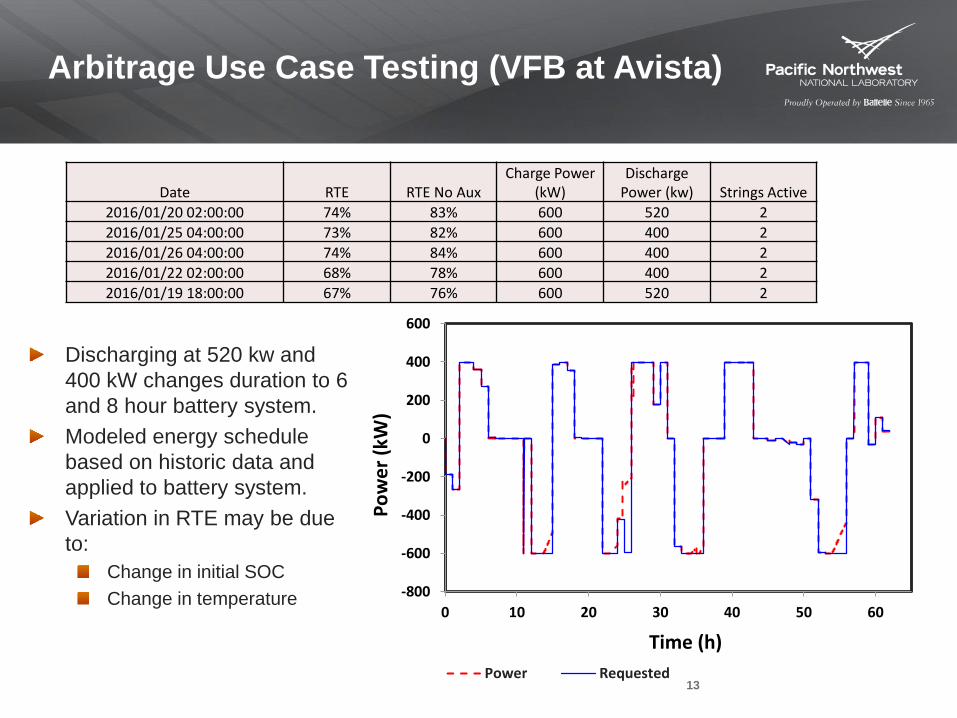
Arbitrage Use Case Testing (VFB at Avista)
13
Discharging at 520 kw and
400 kW changes duration to 6
and 8 hour battery system.
Modeled energy schedule
based on historic data and
applied to battery system.
Variation in RTE may be due
to:
Change in initial SOC
Change in temperature
-800
-600
-400
-200
0
200
400
600
0 10 20 30 40 50 60
Po
we
r (k
W)
Time (h)
Power Requested
Date RTE RTE No Aux Charge Power
(kW) Discharge
Power (kw) Strings Active
2016/01/20 02:00:00 74% 83% 600 520 2
2016/01/25 04:00:00 73% 82% 600 400 2
2016/01/26 04:00:00 74% 84% 600 400 2
2016/01/22 02:00:00 68% 78% 600 400 2
2016/01/19 18:00:00 67% 76% 600 520 2
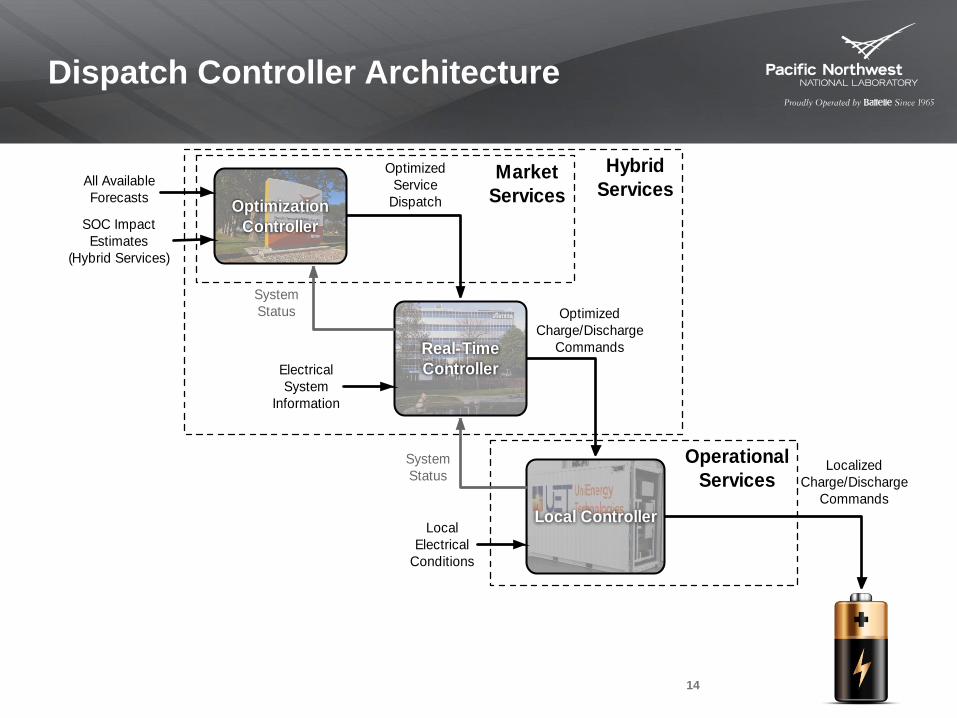
Dispatch Controller Architecture
14
Optimization
Controller
Real-Time
Controller
Local Controller
Optimized
Charge/Discharge
Commands
Localized
Charge/Discharge
Commands
Optimized
Service
Dispatch
Electrical
System
Information
Local
Electrical
Conditions
All Available
Forecasts
SOC Impact
Estimates
(Hybrid Services)
Hybrid
ServicesMarket
Services
Operational
Services
System
Status
System
Status
15
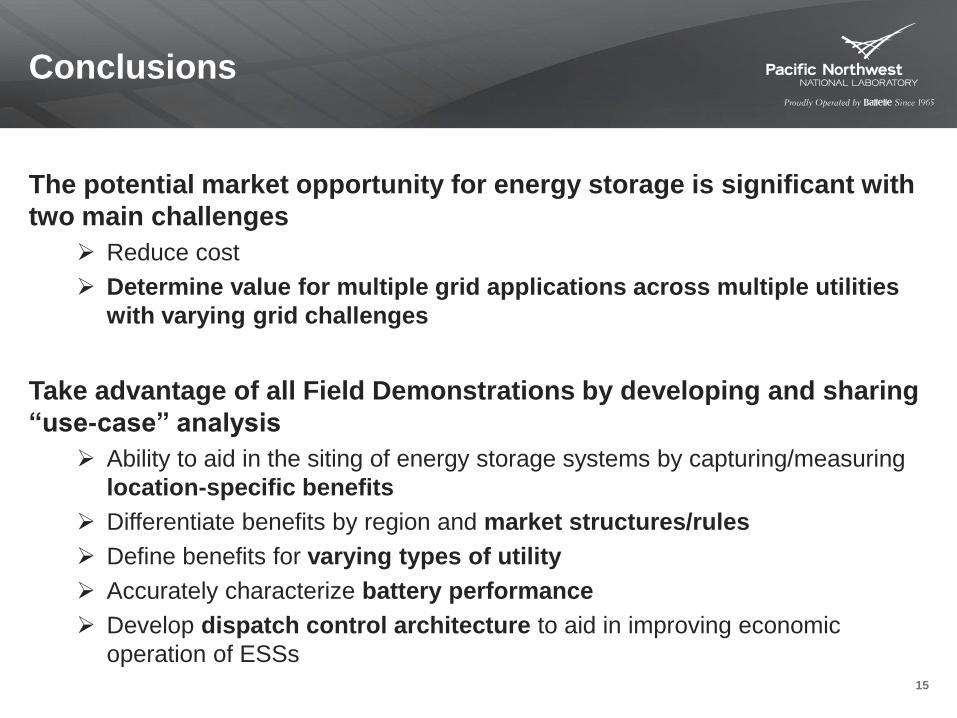
Conclusions
The potential market opportunity for energy storage is significant with
two main challenges
Reduce cost
Determine value for multiple grid applications across multiple utilities
with varying grid challenges
Take advantage of all Field Demonstrations by developing and sharing
“use-case” analysis
Ability to aid in the siting of energy storage systems by capturing/measuring
location-specific benefits
Differentiate benefits by region and market structures/rules
Define benefits for varying types of utility
Accurately characterize battery performance
Develop dispatch control architecture to aid in improving economic
operation of ESSs
Dr. Imre Gyuk - Energy Storage Program Manager, Office of
Electricity Delivery and Energy Reliability, U.S. Department of
Energy
Bob Kirchmeier - Senior Energy Policy Specialist, Clean
Energy Fund Grid Modernization Program, Washington State
Energy Office
16
Acknowledgments
17
More Information
PNNL:
National Assessment of Energy Storage: http://energyenvironment.pnnl.gov/pdf/National_Assessment_Storage_PHASE_II_vol_1_final.pdf
http://energyenvironment.pnnl.gov/pdf/National_Assessment_Storage_PHASE_II_vol_2_final.pdf
Energy Storage Valuation for Distribution Systems http://www.pnnl.gov/main/publications/external/technical_reports/PNNL-23040.pdf
Codes and Standards for Performance Measurements http://energyenvironment.pnnl.gov/pdf/PNNL_22010_ESS_Protocol_Final.pdf
Optimization Tool http://www.pnnl.gov/main/publications/external/technical_reports/PNNL-23039.pdf
DOE/EPRI Storage Handbook http://www.sandia.gov/ess/publications/SAND2013-5131.pdf