the study of deep life isabelle daniel coll. aude picard & philippe oger
TRANSCRIPT
The study of deep life
Isabelle Daniel
Coll. Aude Picard & Philippe Oger
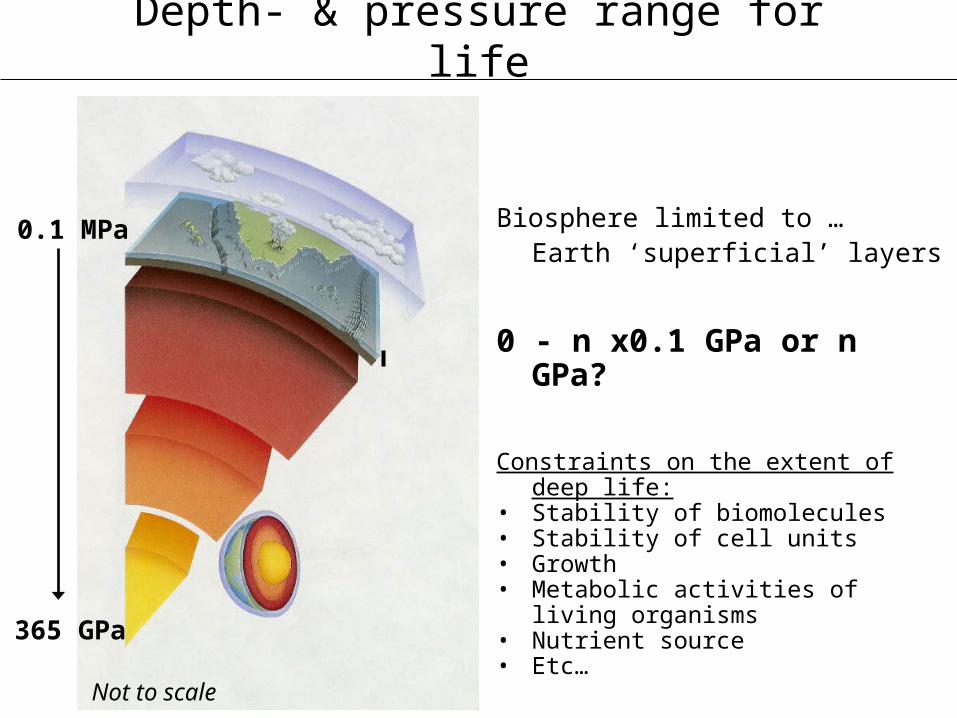
Depth- & pressure range for life
Biosphere limited to …Earth ‘superficial’ layers
0 - n x0.1 GPa or n GPa?
Constraints on the extent of deep life:• Stability of biomolecules • Stability of cell units• Growth• Metabolic activities of living organisms• Nutrient source• Etc…
Not to scale
0.1 MPa
365 GPa

High-pressure environments hostthe ‘unseen majority’
• No sunlight• High hydrostatic pressure• Microorganisms- heterotrophs, dependent on nutrients from the overlying productive ocean - chemoautotrophs
dP=gdz
Mid-oceanic ridge
Hydrothermal vents
DEEP SEA
Cold deep sea
Oceans10 MPa/km
Continental crust27-30 MPa/km
Oceanic crust27-32 MPa/km
Sediments15-25 MPa/km
SUBSURFACE
SUBSEAFLOOR
Whitman et al., 1998, PNAS, 95, 6578
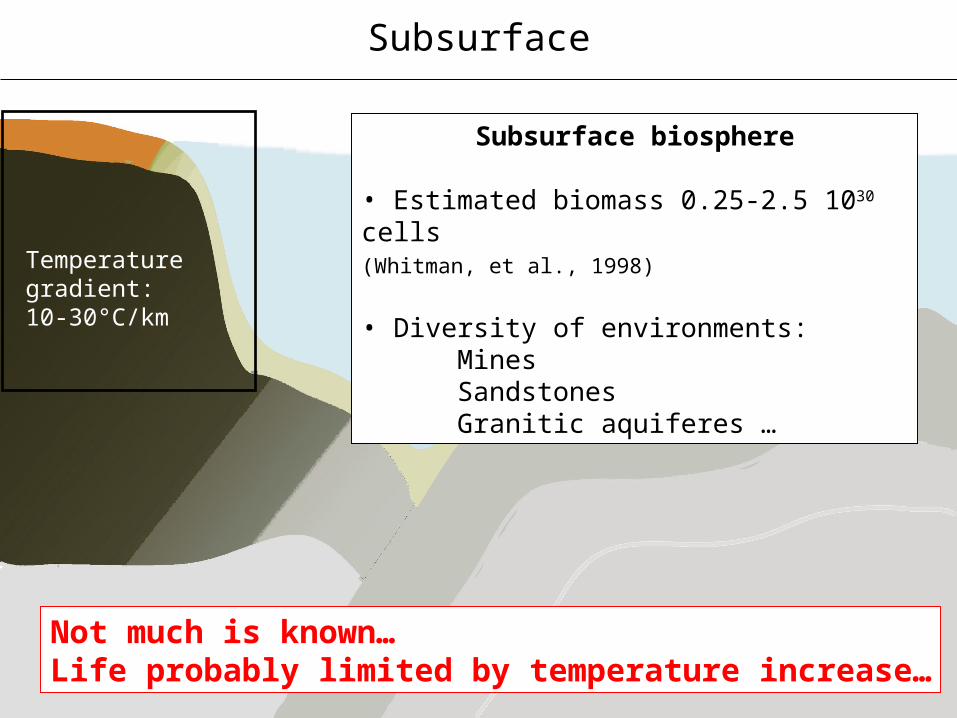
Subsurface
Temperature gradient:10-30°C/km
Subsurface biosphere
• Estimated biomass 0.25-2.5 1030 cells(Whitman, et al., 1998)
• Diversity of environments:MinesSandstonesGranitic aquiferes …
Not much is known…Life probably limited by temperature increase…

Hydrothermal vents
2°C
350°C
1200°COceanic crust
FeOOH, MnO2, FexSy, Mn2+, Fe2+…
3He, H2, CH4, H2S…
Riftia pachyptilia
Black smoker

Cold deep sea
Recycling of OM
≈ 2°C
Deep marine biosphereEstimated population (Witman et al., 1998)
• Heterotrophs - above 200 m, 3.6 1028 cells - below 200 m, 8.2 1028 cells• Autotrophs
2 1027 cells• TOTAL 1.2 1029 cells
55% of all the prokaryotes found in aquatic habitats

Subseafloor
Temperature gradient: 7-15°C/km
Subseafloor biosphere
• Estimated population : 3.5 1030 cells (Whitman, et al., 1998)
• Alive! >1.3 1029 cells (Schippers et al., 2005)
• Cell density decreases with depth… but at chemical interfaces (Parkes et al., 2005)
• Sulfate reduction and methanogenesis are the dominant energetic metabolisms

Living bacteria from the the sub-seafloorP ≈ 56 MPa
Site 1230, 143 mbsf
Bacteria detected by CARD-FISH in a sediment core fromthe Peru trench (5 086 m)
QuickTime™ et undécompresseur TIFF (LZW)
sont requis pour visionner cette image.
From Schippers et al., 2005, Nature,433, 861
Depth profile of totalprokaryotes (),
bacteria (x),Archea ()
QuickTime™ et undécompresseur TIFF (LZW)
sont requis pour visionner cette image.
Depth profile ofprokaryotes AODC ()
bacteria CARD-FISH(),bacteria Q-PCR (x),
How deep does this extend?
How active are the cells?
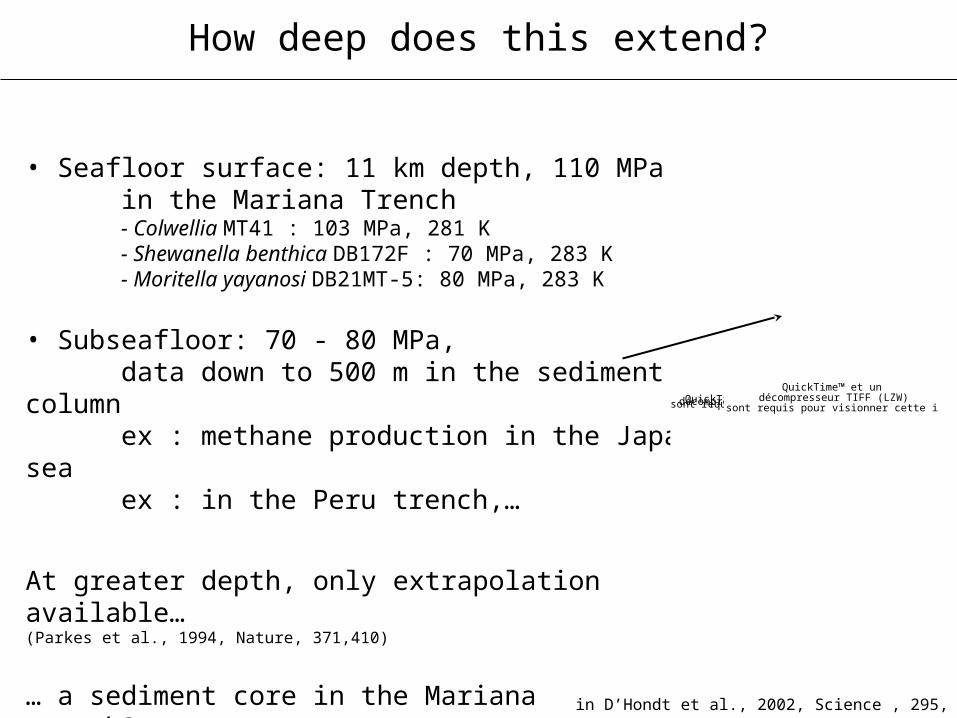
How deep does this extend?
• Seafloor surface: 11 km depth, 110 MPain the Mariana Trench- Colwellia MT41 : 103 MPa, 281 K- Shewanella benthica DB172F : 70 MPa, 283 K- Moritella yayanosi DB21MT-5: 80 MPa, 283 K
• Subseafloor: 70 - 80 MPa, data down to 500 m in the sediment columnex : methane production in the Japan seaex : in the Peru trench,…
At greater depth, only extrapolation available…(Parkes et al., 1994, Nature, 371,410)
… a sediment core in the Mariana trench?
in D’Hondt et al., 2002, Science , 295, 2067
QuickTime™ et undécompresseur TIFF (LZW)
sont requis pour visionner cette image.QuickTime™ et undécompresseur TIFF (LZW)sont requis pour visionner cette image.

How active are the cells?
• The cell densities decrease by ca. 7fold for each 10fold increase in depth or age of the sediments
• The reactivity of organic matter decreases 10fold for each 10fold increase in age
• Thus, the availability of organic matter by cell is extremely low…
• The ‘deepest’ biosphere is practically non growing
• This challenges our understanding of the minimum energy requirements for life, for the stabilisation of the biochemical machinery
in Jørgensen & Boetius, 2007, Nature Reviews Microbiology , 5, 770)

Energy sources for the ‘starving majority’
QuickTime™ et undécompresseur TIFF (non compressé)
sont requis pour visionner cette image.
e- donor / e- acceptor
OM, H2, CH4, or…* / O2
* H2S, S2O32-, Fe2+, Mn2+
OM or H2 / NO3-
OM or H2 / Mn4+
OM or H2 / Fe3+
OM or H2 / SO42-
OM or H2 / CO2
QuickTime™ et undécompresseur TIFF (non compressé)
sont requis pour visionner cette image.
Idealized pore water and solid phase profiles based on the sucessive utilization of terminal electron acceptor during the decomposition of marine sedimentary OM (in Konhnauser, 2007)
Jørgensen & D’Hondt, 2006, Science,314, 932

Evolution of energetic metabolismas a function of pressure
Our VERY SIMPLE model :
alcoholic fermentationby the yeast Saccharomyces cerevisiaeA piezosensitive Eukaryote
Our method :
Raman spectroscopyin diamond anvil cell (DAC)
0.1 MPa• Optimal growth pressure
20 - 50 MPa• arrest of cell cycle
40-60 MPa• Internal acidification• Induction of stress transcriptional factors
70-200 MPa• Induction of stress transcriptional profile
220 MPa• Death
Reviews:Abe F., Cell. Mol. Biol., 2004Fernandes, et al., 2008
50 MPa
Eth
an
ol
Eth
an
ol
Eth
an
ol
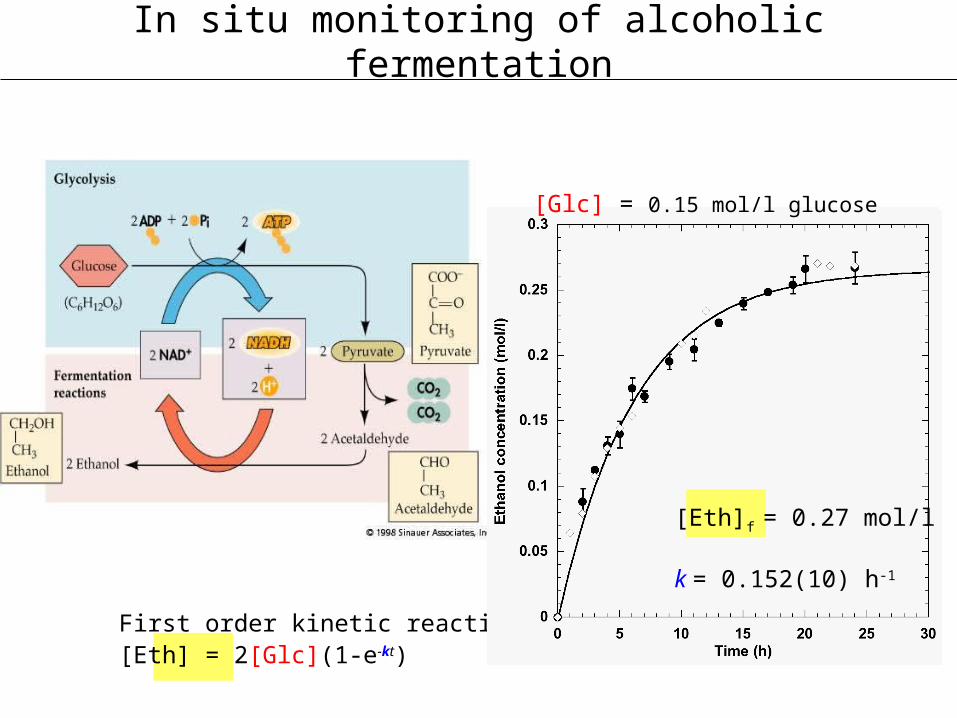
In situ monitoring of alcoholic fermentation
First order kinetic reaction[Eth] = 2[Glc](1-e-kt)
[Glc] = 0.15 mol/l glucose
[Eth]f = 0.27 mol/l
k = 0.152(10) h-1

Fermentation of S. cerevisiae in the DAC, as a function of pressure
Observations : ambient to 10 MPa
• reaction twice faster• yield almost at the theoretical
limit
0
0.05
0.1
0.15
0.2
0.25
0.3
0 5 10 15 20 25 30
0.1 MPa
10 MPa
Time (h)
5 MPa
yield 95%k = 0.152(10) h-1
yield 98%k = 0.345(22) h-1
Picard, A. et al., 2007. Extremophiles
Interpretation
• enhanced uptake of glucose• enhanced activity of one/several enzymes of the glycolysis and/or fermentation pathways.• no measurable lag phase excludes pressure-induced increase in protein synthesis.• more efficient expellation ethanol from the cell under pressure, due to an increase of passive diffusion.

Fermentation of S. cerevisiae in the DAC, as a function of pressure
Observations : above 10 MPa,
• yield decreases• reaction rate almost constant
At 40 MPa, yield of 68% similar to Abe & Horikoshi (1997)
Alcoholic fermentation stops between 65 and 100 MPa
0
0.05
0.1
0.15
0.2
0.25
0.3
0 5 10 15 20 25 30
0.1 MPa
30 MPa
Time (h)
40 MPa
20 MPa
55 MPa
65 MPa
100 MPa
yield 95%k = 0.152(10) h-1
yield 28%k = 0140(21) h-1
Picard, A. et al., 2007. Extremophiles
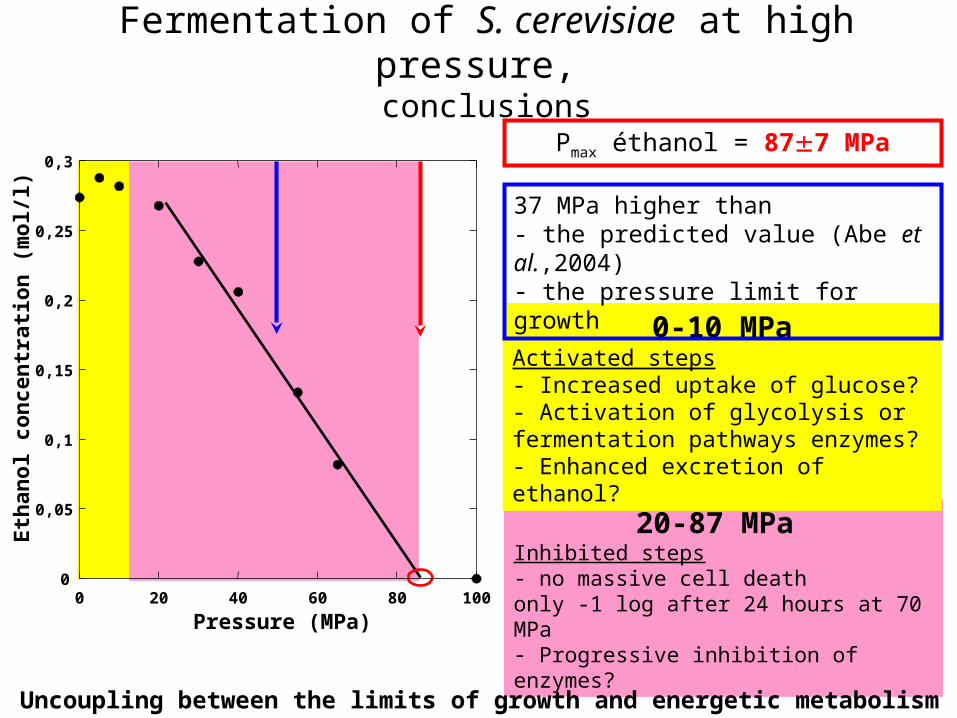
Fermentation of S. cerevisiae at high pressure, conclusions
20-87 MPa Inhibited steps- no massive cell deathonly -1 log after 24 hours at 70 MPa- Progressive inhibition of enzymes?
0-10 MPaActivated steps- Increased uptake of glucose?- Activation of glycolysis or fermentation pathways enzymes?- Enhanced excretion of ethanol?
37 MPa higher than - the predicted value (Abe et al.,2004)- the pressure limit for growth
Pmax éthanol = 877 MPa
Uncoupling between the limits of growth and energetic metabolism
0
0,05
0,1
0,15
0,2
0,25
0,3
0 20 40 60 80 100
Eth
ano
l co
nce
ntr
atio
n (
mo
l/l)
Pressure (MPa)

Evolution of energetic metabolismas a function of pressure
model :
Metal respirationbyShewanella oneidensis MR-1
method :
X ray Absorption Near Edge Spectroscopy at high pressureDAC,Autoclave,Pressure vesselssee Oger et al., Spectrochimica Acta, 2008
- same phylum as major cultivated piezophilic bacteria -Proteobacteria,- autochtonous in suboxic or anoxic sediments
Optimal temperature 30°CPiezosensitive
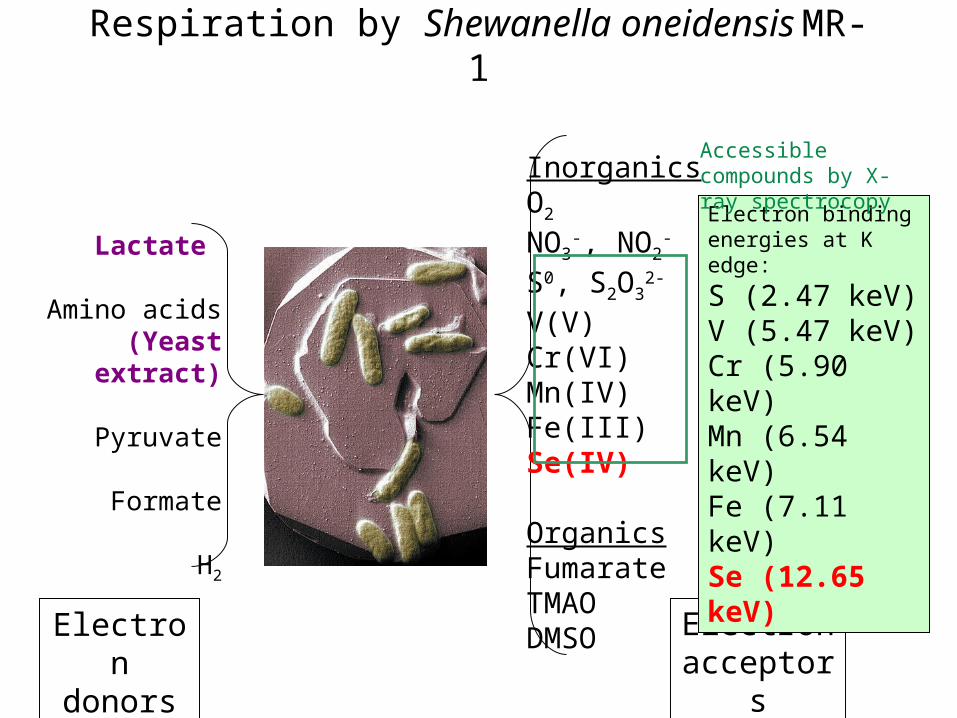
Respiration by Shewanella oneidensis MR-1
Electron acceptors
Electron donors
Lactate
Amino acids(Yeast extract)
Pyruvate
Formate
H2
InorganicsO2
NO3-, NO2
-
S0, S2O32-
V(V)Cr(VI) Mn(IV) Fe(III)Se(IV)
OrganicsFumarateTMAODMSO
Electron binding energies at K edge:
S (2.47 keV)V (5.47 keV)Cr (5.90 keV)Mn (6.54 keV)Fe (7.11 keV)Se (12.65 keV)
Accessible compounds by X-ray spectrocopy

Selenite respiration by MR-1
120 MPa/30°C
Lactate Yeast extract
SeO32-
AcetatePyruvate…
Red elemental selenium produced under high hydrostatic pressure
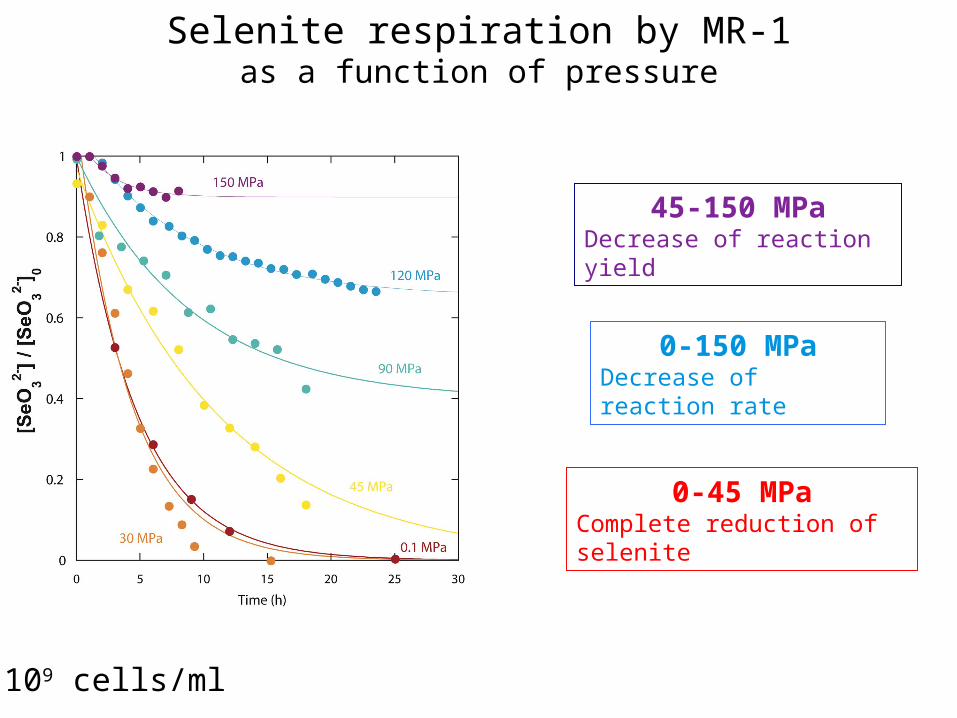
Selenite respiration by MR-1as a function of pressure
0-45 MPaComplete reduction of selenite
45-150 MPaDecrease of reaction yield
0-150 MPaDecrease of reaction rate
109 cells/ml

0
0.2
0.4
0.6
0.8
1
0
0.2
0.4
0.6
0.8
1
1.2
1.4
0 20 40 60 80 100 120 140 160
Pressure (MPa)
Selenite respiration by Shewanella oneidensis MR-1as a function of pressure
In situ, DACIn situ, autoclaveEx situ, pressure vessel
Se(IV) reduction,Pmax = 155 5 MPa
65 - 155 MPa Decrease of efficiency of respiratory chain?Inactivation of ATPase?
0 - 65 MPaEfficient respiratory chain
105 MPa higher thanpressure limit for growth
Uncoupling between the limits of growth and energetic metabolism

Concluding remarks
Uncoupling between growth and metabolism
An active microorganism is not necessarily a growing microorganism Contribution of microorganisms to deep biogeochemical cycles maybe significantly underestimated
Pressure limit
Growth Energetic metabolism
Saccharomyces cerevisiae
50 MPa 87 MPa
Shewanella oneidensis MR-1
50 MPa 159 MPa
How far in pressure are the limits of activity of piezophile microorganisms?