the strategy for korea’s economic success the role of korean government 3. challenges in the...
TRANSCRIPT

Hwy-Chang MoonProfessor of International Business Strategy & Competitiveness
Graduate School of International StudiesSeoul National University
[email protected]@stanford.edu
The Strategy for Korea’s Economic Success
* To be published by Oxford University Press

Contents
2
ⓒ 2015 Hwy-Chang Moon. All Rights Reserved.
1. Korea’s Economic Success• An overview• More quotes
2. Reasons behind Korea’s Economic Success• Similarities and differences with other Asian tigers• The role of Korean government
3. Challenges in the Future• Current government policies• Main issues and possible solutions
4. Conclusion

Korea’s Economic Success: An Overview
3ⓒ 2015 Hwy-Chang Moon. All Rights Reserved.
• Heroic economic success- In 1960, one of the poorest countries in the world- In 2011, richer than the EU average income ($31,750 vs $31,550, PPP)
• A model for growth of developing countries- China: too vast to copy- Singapore/Hong Kong: city states, Taiwan: disputed sovereignty
• Combined growth- Economic growth with democracy- Economic growth with equity: Gini coefficient lower than Canada in 2010
• Korea’s potential shown in its history- Developed movable metal type two centuries before Gutenberg- In the last imperial dynasty, benefited from checks and balances more than China
South Korea’s economy: What do you do when you reach the top? - Economist, November 12, 2011

Korea’s Economic Success: More Quotes
Quick Recovery• Korea repaid the IMF drawings nine months ahead of schedule.
(IMF, June 2000)
• Hyundai learned quickly from its mistakes and did not waste a crisis.(Washington Post, June 8, 2012)
Benchmarking and Beyond• They think that anything the Japanese can do, they can do better, but now they’re proving it.
(Foreign Policy, June 7, 2012)
• Samsung may lack in innovation, but no one can beat Samsung in playing catch-up.(New York Times, September 2, 2012)
Multiple Achievements• Korea has the world-class industries: electronics, shipbuilding, steel, automobile, and gasoline exporting.
(Forbes, September 9, 2015)
• The country is a rich, technologically advanced, mature democracy.(Foreign Affairs, January/February 2014)
Never Satisfied• The South Koreans have worked like crazy, saved like crazy, and invested like crazy.
(Foreign Policy, June 7, 2012)
• The only people unimpressed by South Korea’s accomplishments may be South Koreans themselves.(Economist, October 26, 2013)
4ⓒ 2015 Hwy-Chang Moon. All Rights Reserved.
Contents
5
ⓒ 2015 Hwy-Chang Moon. All Rights Reserved.
1. Korea’s Economic Success• An overview• More quotes
2. Reasons behind Korea’s Economic Success• Similarities and differences with other Asian tigers• The role of Korean government
3. Challenges in the Future• Current government policies• Main issues and possible solutions
4. Conclusion

Comparing the Four Tigers
Singapore Hong Kong Taiwan Korea
History British colony (Western) Japanese colony (Eastern)
Economy Size City state Middle-sized country
Trade Policy Open door Selective open door
Growth Strategy Statecapitalism
Freecapitalism
Balanced(SMEs)
Unbalanced(Chaebol)*
6
• The Singapore government played the most active role among the four tigers• *Chaebol: (1) Speedy and bold decision (2) Thorough benchmarking of Japan, US and Europe (3) Diversified and
specialized areas (4) Hard working and future investment (Owner-CEO)
ⓒ 2015 Hwy-Chang Moon. All Rights Reserved.
Despite these differences, some common factors of their economic success can be found.

Reasons behind East Asian Economic Growth
General Understanding
• Cheaper labor?- But, there are other countries where
labor is cheaper.
• Export promotion?- But, import substitution policy may be
more effective.
• Perspiration? (e.g., Paul Krugman)- But, all countries should be diligent in
their early stage of development
• Hard work of Confucianism?- But, Confucianism is more about
keeping the status quo than changing it.
7
More Fundamental Reasons
• Cheap and productive labor- Agility
(speed and precision)
• Global standard and economies of scale - Benchmarking
(learning and best practices)
• Perspiration, and then inspiration- Convergence
(mix and synergy-creation)
• Leadership and bureaucracy (elite vs crony)- Dedication
(diligence and goal-orientation)
ⓒ 2015 Hwy-Chang Moon. All Rights Reserved.

Comparing Korea with other Asian Tigers
• Agility (speed and precision)- Korean War, US military technology and management, mandatory military service
• Benchmarking (learning and best practice)- Learning Zaibatsu, but only the best practices
• Convergence (mix and synergy-creation)- Japan, US, Europe, and something Korean
• Dedication (diligence and goal-orientation)- Military need, economic need, and political need
8
Korea shares similarities but is also different from other Asian Tigers.
ⓒ 2015 Hwy-Chang Moon. All Rights Reserved.

Distinctive Features of Korean Chaebol
9ⓒ 2015 Hwy-Chang Moon. All Rights Reserved.
Source: Revised from Johnson, Chalmers. (1987). “Political Institutions and Economic Performance: The Government-Business Relationship in Japan, South Korea, and Taiwan,” in Frederic Deyo, ed., The Political Economy of the New Asian Industrialism. Ithaca: Cornell University Press.
Japan Korea Taiwan
Conglomerates Zaibatsu Keiretsu Chaebol Guanxiqiye (bang)
OwnershipFamily
ownershipCross-stock ownership Family ownership
Strong CEO leadershipPartnership
Individual controlCollective leadership
StructureTrading companyBalanced growth
More related, horizontal diversification
Trading companyUnbalanced growth
More unrelated, verticalintegration
Trading companyBalanced growth
Smaller size
Finance Corporate banks and financial institutions
National bank-based industrial financing (debt-based)
Fiscal rather than monetary financing (tax breaks, high-
depreciation)
Example Mitsubishi, Mitsui Samsung, Hyundai Cathay, Hon Hai
Comparing Conglomerates of Japan, Korea and Taiwan
Selective Assimilation of the Japanese Conglomerates

Korea’s Economic Growth: Academic Perspectives
10
Study Main Points
1. Amsden (1989) • Learning existing Western technologies rather than innovation• Efficient government intervention policy in the optimal allocation of resources
2. Song (1997)• Outward, Industry, and Growth (OIG) strategy • Influence of Confucian and Christian ethics as an underlying basis for development• Land use, a family-planning program, savings, and consumption behaviors
3. World Bank (1993) • Rapid physical and human capital accumulation• Government’s market-friendly policy
4. Cho (1994)• Entrepreneurship and abundance of workers of high standard of literacy, discipline, and desire to grow• Unbalanced strategy by supporting chaebol• Export-led growth strategy along with effective government development strategy
5. Toussaint (2006)• Government intervention, US technical and financial support, land reform, transition from import
substitution to export promotion, authoritarian planning, state control over banking sector, currency exchange, capital flows and product prices, US protection, education, scarcity of natural resources
6. Mason (1997) • Slower rates of population growth favoring investment in education and incentives for saving, which accelerated economic development
7. Chang (2003) • Chaebol as providers of efficient ways for allocating limited resources in Korea’s early and high-risk stage of economic development
8. Eichengreen, Perkins, and Shin (2012)
• Korea’s continued growth through the accompanying rise in the labor force, capital stock, and productivity
• Export diversification - Rapid shift of export structure to focus on high-growth products
ⓒ 2015 Hwy-Chang Moon. All Rights Reserved.
A common factor: The role of government

Korea’s Economic Growth: The US Perspective
The Korean Economy in Congressional Perspective1. The collective effort of the Korean people2. Political leadership3. Domestic market expansion4. Export promotion policies
11
• All four reasons are related to the role of government.• Then, what is the essence of the Korean government’s
role in developing its economy?
ⓒ 2015 Hwy-Chang Moon. All Rights Reserved.

Understanding Korea’s Economic Policy
Negative Perspectives
• Chaebol-dominated economy?- Economic success but not sustainable- Cronyism
• Government intervention?- Market-distorting economic policies- Lack of innovation
• Unrelated diversification?- Economic inefficiency- Hidden costs
• Militaristic work ethics?- Sleeping just a few hours a day? - Human rights issue?
12
Positive Perspectives
• Fast growth- Unbalanced growth strategy for efficiency- Transparent criterion: export performance
• A series of five-year economic plans- Benchmarking other countries’ policies- Reducing trial and errors
• Dominant diversification- A dominant sector - Synergistic mix with other sectors
• Economic culture- Incentives and sense of achievement- Zero-sum or positive-sum with happiness?
ⓒ 2015 Hwy-Chang Moon. All Rights Reserved.
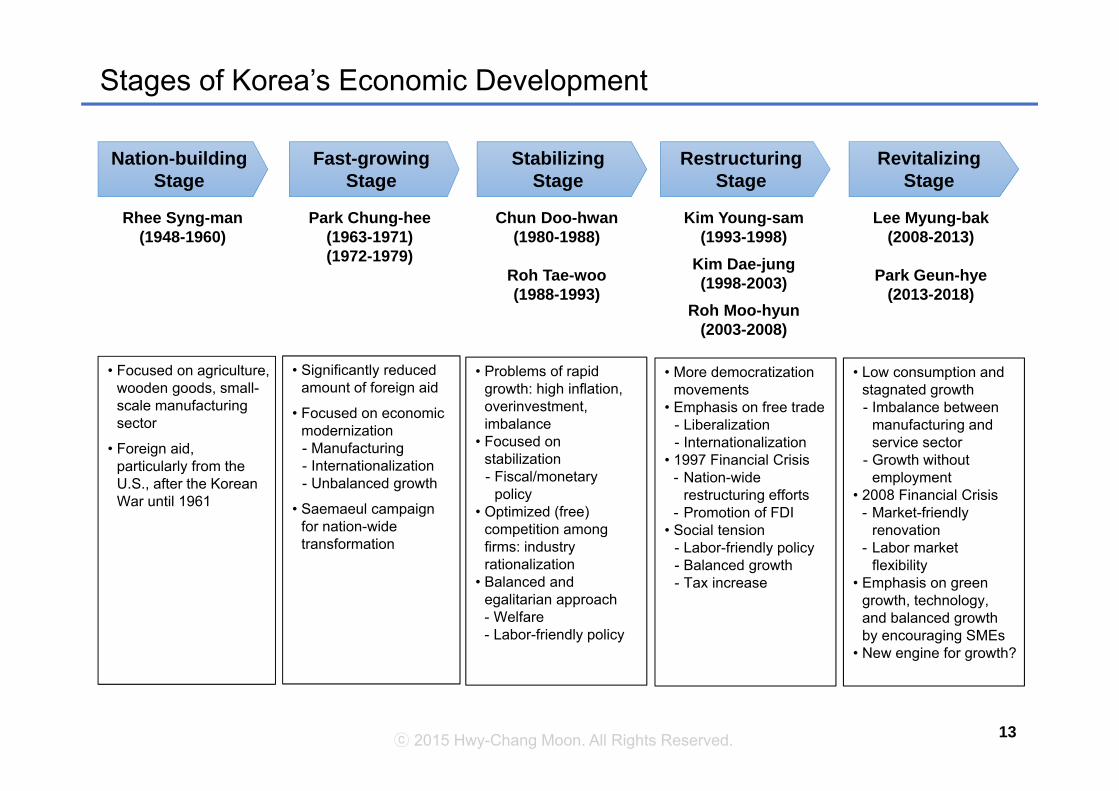
Stages of Korea’s Economic Development
13ⓒ 2015 Hwy-Chang Moon. All Rights Reserved.
Nation-buildingStage
Fast-growingStage
StabilizingStage
RestructuringStage
RevitalizingStage
Rhee Syng-man(1948-1960)
Park Chung-hee(1963-1971)(1972-1979)
Chun Doo-hwan(1980-1988)
Roh Tae-woo(1988-1993)
Kim Young-sam(1993-1998)
Kim Dae-jung(1998-2003)
Roh Moo-hyun(2003-2008)
Lee Myung-bak(2008-2013)
Park Geun-hye(2013-2018)
• Focused on agriculture, wooden goods, small-scale manufacturing sector
• Foreign aid, particularly from the U.S., after the Korean War until 1961
• Significantly reduced amount of foreign aid
• Focused on economic modernization- Manufacturing- Internationalization- Unbalanced growth
• Saemaeul campaign for nation-wide transformation
• Problems of rapid growth: high inflation, overinvestment, imbalance
• Focused on stabilization- Fiscal/monetary
policy• Optimized (free)
competition among firms: industry rationalization
• Balanced and egalitarian approach - Welfare- Labor-friendly policy
• More democratization movements
• Emphasis on free trade- Liberalization- Internationalization
• 1997 Financial Crisis- Nation-wide
restructuring efforts- Promotion of FDI
• Social tension- Labor-friendly policy- Balanced growth- Tax increase
• Low consumption and stagnated growth- Imbalance between
manufacturing and service sector
- Growth without employment
• 2008 Financial Crisis- Market-friendly
renovation- Labor market
flexibility• Emphasis on green
growth, technology, and balanced growth by encouraging SMEs
• New engine for growth?

Korean Government Policies and Key Ideas
14
Fast Growing Stage
Stabilization Stage
Restructuring Stage
Revitalization Stage
Solving Problems Creating Advantages
ⓒ 2015 Hwy-Chang Moon. All Rights Reserved.

Contents
15
ⓒ 2015 Hwy-Chang Moon. All Rights Reserved.
1. Korea’s Economic Success• An overview• More quotes
2. Reasons behind Korea’s Economic Success• Similarities and differences with other Asian tigers• The role of Korean government
3. Challenges in the Future• Current government policies• Main issues and possible solutions
4. Conclusion

Korea’s 11th President: Park Geun-hye
16ⓒ 2015 Hwy-Chang Moon. All Rights Reserved.
Profile• Received bachelor’s degree in electronic engineering from Sogang University
and studied in France• Took on the role of First Lady between her mother and father’s assassinations
in 1974 and 1979, respectively• Elected 4 times as the Grand National Party assemblywoman since 1998 in
Daegu and became the Chair of the Party in 2012• President (2013 – Present)
• Economic Problems- Unbalanced growth- Stagnated global market
• Economic Goals- Economic democracy: To reduce income inequality- Creative economy: To expand domestic market and employment
• Specific Strategies- Supporting SMEs and raising wages- Establishing 17 innovation centers for start-ups & entrepreneurs

President Park’s Two Economic Goals: An Overview
17ⓒ 2015 Hwy-Chang Moon. All Rights Reserved.
Creative Economy
Background• A response to stagnated global market• Creating new growth engine for new markets
and new jobs (2.5 million in five years)
Definition • Increasing convergence
- Convergence of technology and industry- Convergence of culture and industry
Creation of a new ministry• Ministry of Future Creation and Science
Economic Democracy
Background• A response to unbalanced growth• Mutually reinforcing the cycle of national
advancement and the happiness of Koreans
Definition• Enhancing fairness
- LE and SMEs to prosper together - Eliminating various unfair practices that
frustrate SMEs
Present Park presented a two-pronged approach for dealing with Korea’s economic problems and achieving a “second miracle of the Han River.”
Moving from market and business friendly polices by President Lee Myung-bak to “fair and creative economy”
Source: Inauguration Speech of President Park, February 25, 2013.

Economic Democracy
• Negative influences of government helpThe government policies aren't helping, an owner of SME said. The minimum wage will rise from $4.85 this year to $5.25 next year. However, if it costs $1 for a Korean company to make something, it costs only 30 cents for a Chinese company to make it (Washington Post, Oct 13, 2015).
• Small impactA $39 billion fiscal stimulus package (3% of GDP) includes property-boosting measures such as a loosening of the loan-to-value and debt-to-income ratios for home buyers and increasing the loan amount eligible for borrowers. It looks impressive at first glance, but its actual impact is likely to be fairly small (CNBC, Jul 31, 2014).
Creative Economy
• Slow progress and limited scope of influenceTo try to lessen South Korea's reliance on exports, Park has been promoting a "creative economy" strategy -fostering start-ups and encouraging entrepreneurship. But these efforts are slow going and are not going to provide any relief to South Korea's 3 million SMEs (Washington Post, Oct 13, 2015).
• Negative social perception on start-upsThe Korea New Exchange was established in July with the aim of further bridging the gap between venture entrepreneurs and investors... Young Koreans often avoid starting a company or working for SMEs due to high risks, instead seeking stable jobs at conglomerates, whether public or private (Koreaherald, Aug 15, 2013).
18ⓒ 2015 Hwy-Chang Moon. All Rights Reserved.
Fundamental Problems• The vagueness of concepts and a long-term task that would make it almost impossible to achieve in her five-year term • Different perspectives between the government and the companies
President Park’s Two Economic Goals: Effectiveness?
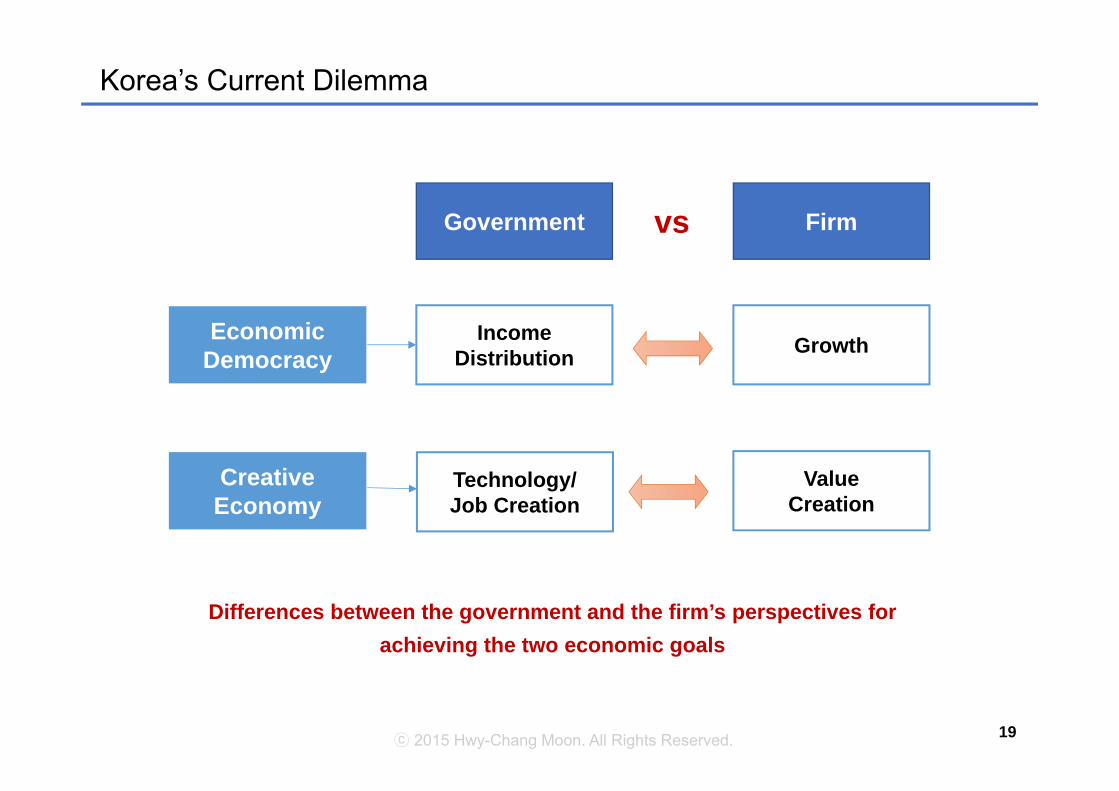
Korea’s Current Dilemma
19
Creative Economy
Economic Democracy
Technology/Job Creation
Income Distribution
ValueCreation
Growth
Government Firmvs
Differences between the government and the firm’s perspectives for achieving the two economic goals
ⓒ 2015 Hwy-Chang Moon. All Rights Reserved.

National vs Firm Competitiveness: Clashing or Compatible?
20
Dinner party in February, 2011 at Woodside California- President Obama with 12 major IT company CEOs
• President ObamaWhat would it take to make iPhones in the U.S.? Why can't that work come home?
• Steve JobsThose jobs aren’t coming back.
Politician Businessman
Scope Domestic Domestic + Foreign
Interest Voters Stakeholders
Goal Welfare: Employment Profit Creation
Method Protectionism Efficiency
Strategy Made in Home Country Made in World
Global View Competition Competition + Cooperation
Outcome Income Distribution Survival and Growth
Source: New York Times. How the US Lost Out on iPhone Work. January 21, 2012.
ⓒ 2015 Hwy-Chang Moon. All Rights Reserved.

Solution? International Trade vs Global Value Chain (GVC)
21ⓒ 2015 Hwy-Chang Moon. All Rights Reserved.
Japan: 34%Germany: 17%South Korea: 13%China: 3.6%US: 6%Others: 27%
USA China
• Components• Labor• R&D• Design
Assembly
Export ($2.02billion)
iPhone: US trade/GVC balance with ChinaTrade balance: - $1.9 billion [US import: $2.02 billion, US export: $121.5 million]GVC balance: + $48 million [US value: 6%, Chinese value: 3.6%]
Source: Wall Street Journal, 2010/12/15, Not Really ‘Made in China’; Xing and Detert (2010), How the iPhone Widens the United States Trade Deficit with the People’s Republic of China, ADBI Working Paper
Note: In 2009, Chinese iPhone exports at $2.02 billion to US. After deducting $121.5 million in Chinese imports for parts produced by U.S. firms such as chip maker Broadcom Corp., they arrive at the figure of the $1.9 billion Chinese trade surplus—and U.S. trade deficit—in iPhones.48 million surplus with China comes from the calculation as follows: $121.5 million - $2.02 billion x 3.6% = $48 million.
Input ($121.5 million)
• Not Really ‘Made in China’: China only accounts for $6.5 (3.6%) of the iPhone’s $178.96 production cost.• Trade balance is no longer an accurate index of national competitiveness.
$178.96

Global Value Chain (GVC): Implications
22
Samsung
Affiliated & Related Firms
SamsungGVC
Apple
Affiliated & Related Firms
Apple GVC
• The unit of competition: from a single firm to the entire GVC• Competition between GVCs, but cooperation within the GVC
ⓒ 2015 Hwy-Chang Moon. All Rights Reserved.

Global Value Chain (GVC): Samsung vs Apple
23
• Korea (tech, R&D, mother factory)• Silicon Valley (tech)• Milan, Italy (design)• 50 countries (sales)
• Silicon Valley (tech, R&D, design)
• 16 countries (sales)Competition
Leading Firms
Affiliated & Related
Firms
• SEV (manufacturing)• SEC (flash memory, processor) • Qualcomm (wireless-communication
chip, processor)• STM, Bosch, Yamaha (sensor)• Sam Kuang, Intops (case)• Samsung Display (display & screen)
• Foxconn (manufacturing) • SEC (processor) • Toshiba (Flash memory)• Qualcomm (wireless-communication
chip)• STM, Bosch, Elpida (sensor)• AT&S (case)• LG Display (display & screen)
Competition
Samsung Electronics Apple
Cooperation Cooperation
Competition and cooperation between and within the Global Value Chain
ⓒ 2015 Hwy-Chang Moon. All Rights Reserved.

Comparison between Samsung vs Non-Samsung Suppliers
24
Samsung Suppliers Non-SamsungSuppliers
DifferenceTotal Mobile Phone
Firms 118 34 3,849 --
Average Employees 97 118 38 59
Average Revenue 53,443 85,405 9,599 43,844
Revenue per worker 553 720 250 303
Samsung SuppliersNon-Samsung Suppliers
Total Mobile Phone2010 2012 Growth 2010 2012 Growth 2010 2012 Growth
Firms 118 118 - 34 34 - 3,688 3,849 -
Average Revenue 48,966 53,443 9.1% 73,593 85,405 16.3% 9,203 9,599 4.3%
Data Source: Samsung Electronics
Samsung suppliers have higher competitiveness than non-Samsung suppliers (2012)(unit) firms: number, employees: number, revenue: million won
ⓒ 2015 Hwy-Chang Moon. All Rights Reserved.
Samsung suppliers grow faster than non-Samsung suppliers (2010 - 2012)(unit) firms: number, revenue: million won
Samsung suppliers: Among SMEs with employees of 10-299, the firm sales revenue gained from Samsung Electronics were more than 10%, based on 2012 statistics. The SMEs are manufacturing firms in the sector of electronics parts and components, PC, video, audio, and other communication equipment. Non-Samsung suppliers: firms other than Samsung suppliers in the same industry

Korea’s Creative Economy: Policies and Issues
• Immediate help- Incentives: Cash, tax break- Hidden costs?
• Building infrastructure- Innovation centers in 17 locations- Economies of scale?
• Supporting sectors- A wide range of support: legal, financial, and other services- Other supporting sectors and living environment?
• Narrow goals- Innovation centers for regional innovation and entrepreneurship- Global competitiveness?
25ⓒ 2015 Hwy-Chang Moon. All Rights Reserved.
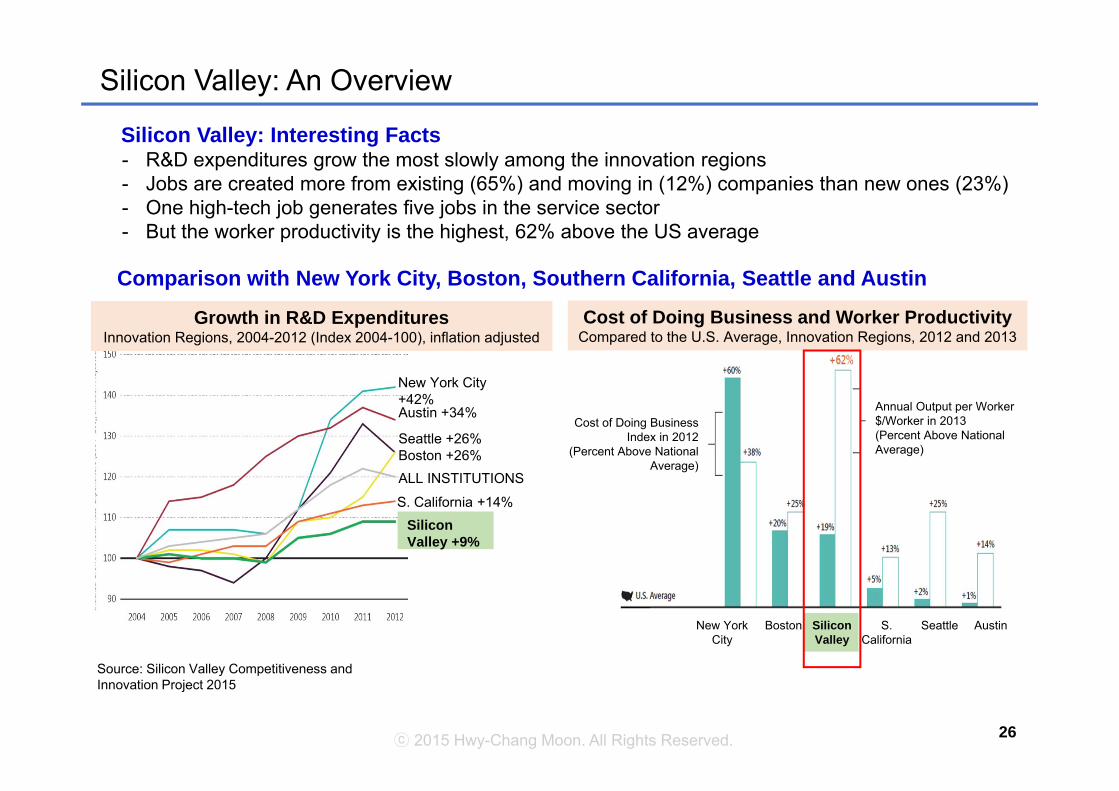
Silicon Valley: An Overview
Silicon Valley: Interesting Facts- R&D expenditures grow the most slowly among the innovation regions- Jobs are created more from existing (65%) and moving in (12%) companies than new ones (23%)- One high-tech job generates five jobs in the service sector- But the worker productivity is the highest, 62% above the US average
26ⓒ 2015 Hwy-Chang Moon. All Rights Reserved.
Source: Silicon Valley Competitiveness and Innovation Project 2015
New York City +42%Austin +34%
Seattle +26%Boston +26%ALL INSTITUTIONS
S. California +14%Silicon Valley +9%
Growth in R&D ExpendituresInnovation Regions, 2004-2012 (Index 2004-100), inflation adjusted
Cost of Doing BusinessIndex in 2012
(Percent Above National Average)
Annual Output per Worker$/Worker in 2013(Percent Above National Average)
BostonNew YorkCity
Silicon Valley
S. California
Seattle Austin
Cost of Doing Business and Worker ProductivityCompared to the U.S. Average, Innovation Regions, 2012 and 2013
Comparison with New York City, Boston, Southern California, Seattle and Austin

The Relationship between R&D and Business Success
• Wide disparities persist in how well innovation investments actually pay off. R&D is often seen as ablack box, where large sums of money go in and innovative products and services only sometimescome out. (PWC Strategy & Inc. Global Innovation 1000, Winter 2014)
27ⓒ 2015 Hwy-Chang Moon. All Rights Reserved.
• The first computer was created at the University of Pennsylvania and the first semiconductor wasinvented at Bell Labs in New Jersey, yet neither one was commercialized there. All that happened inSilicon Valley. (Forbes, April 2, 2013)
The Ten Most Innovative Companies and Their R&D Spending (2014)
Rank CompanyR&D Spending
US$ billion Rank As % of sales
1 Apple 4.5 32 2.6
2 Google 8.0 9 13.3
3 Amazon 6.6 14 8.8
4 Samsung 13.4 2 6.4
5 Tesla Motors 0.2 440 11.5
6 3M 1.7 79 5.6
7 GE 4.8 30 3.3
8 Microsoft 10.4 4 13.4
9 IBM 6.2 18 6.2
10 P&G 2.0 70 2.4
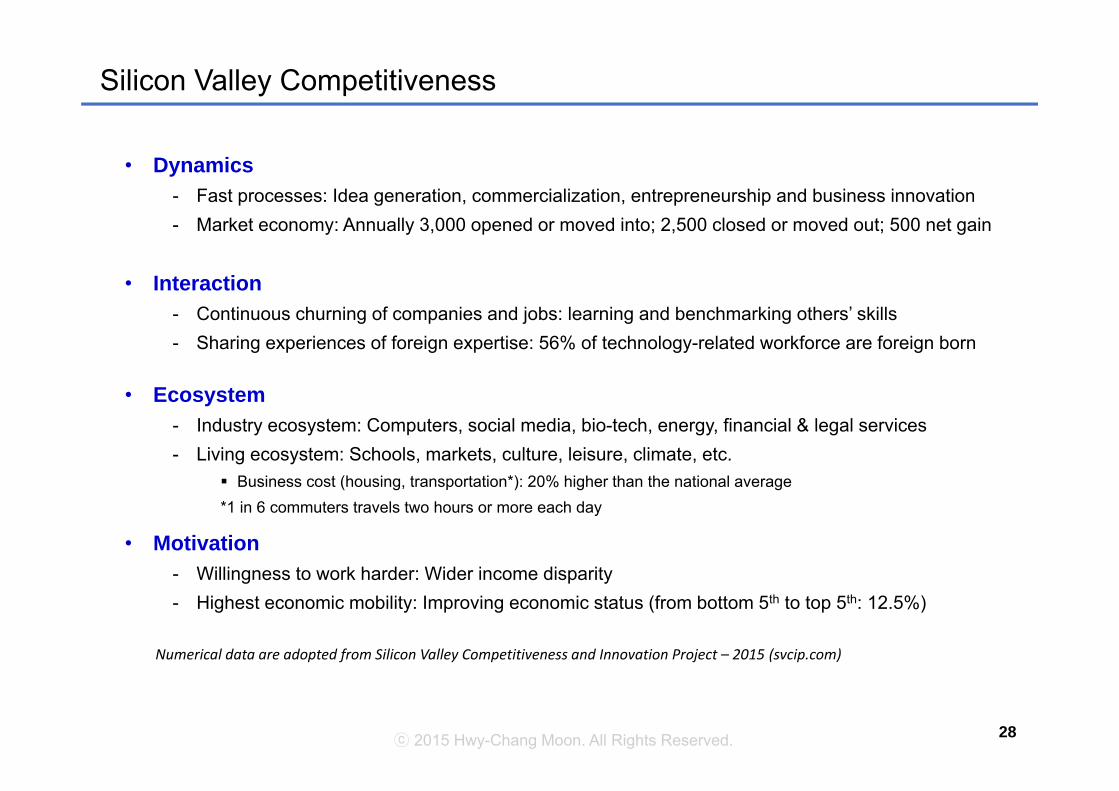
Silicon Valley Competitiveness
• Dynamics- Fast processes: Idea generation, commercialization, entrepreneurship and business innovation- Market economy: Annually 3,000 opened or moved into; 2,500 closed or moved out; 500 net gain
• Interaction- Continuous churning of companies and jobs: learning and benchmarking others’ skills- Sharing experiences of foreign expertise: 56% of technology-related workforce are foreign born
• Ecosystem- Industry ecosystem: Computers, social media, bio-tech, energy, financial & legal services- Living ecosystem: Schools, markets, culture, leisure, climate, etc.
Business cost (housing, transportation*): 20% higher than the national average*1 in 6 commuters travels two hours or more each day
• Motivation- Willingness to work harder: Wider income disparity- Highest economic mobility: Improving economic status (from bottom 5th to top 5th: 12.5%)
28ⓒ 2015 Hwy-Chang Moon. All Rights Reserved.
Numerical data are adopted from Silicon Valley Competitiveness and Innovation Project – 2015 (svcip.com)

Contents
29ⓒ 2015 Hwy-Chang Moon. All Rights Reserved.
1. Korea’s Economic Success• An overview• More quotes
2. Reasons behind Korea’s Economic Success• Similarities and differences with other Asian tigers• The role of Korean government
3. Challenges in the Future• Current government policies• Main issues and possible solutions
4. Conclusion

Conclusion: Strategies for Korea’s Sustainable Growth
• Policy Tools- Increasing incentives: Taxpayer’s money- Reducing regulations: Reducing red tapes (e.g., hidden costs, time)
• Development Directions- The Korean way: Innovation centers in 17 locations- Global best standards: Silicon Valley (i.e., ecosystem of business & living)
• Supporting Sectors- Specific firms/sectors: SMEs, services- Overall industries: Multi-technology products & industries, synergies
• Economic Goals- Fairness: Income redistribution- Growth: Efficient resource allocation and increasing value creation
30ⓒ 2015 Hwy-Chang Moon. All Rights Reserved.
What to be careful of and what to promote?

Appendix
31

Need for a New Perspective: Samsung Electronics vs Nokia
32
Success Case (Samsung) Failure Case (Nokia)
Speed Samsung’s success in the smartphone market should be attributed tospeed and rapid response to market changes (Guardian, 2012).
Delayed entering into the smartphonebusiness and slow response to the marketchange (Wall Street Journal, 2012)
Precision(quality control)
Samsung CEO Lee said, “Good (quality) products come from thefingertips of our employees and partners.” (Financial Post, 2014).
Learning Samsung may lack in innovation, but no one can beat Samsung inplaying catch-up (New York Times, 2012).
Less responsive (learning) and more self-contented (CNBC, 2013)
Best practice Samsung's success story has been largely based on improvingproducts already on the market (Korea Times, 2013).
Sticking to its own outdated and cumbersomeSymbian standard (compared to iOS andAndroid) (Wall Street Journal, 2011)
MixingSamsung’s vertical integration is a key factor behind the success ofits smartphone business, which has relied on components sourcedinternally (Financial Times, 2014).
Synergy-creationSamsung’s success in electronics/smartphone is due to thesynergistic integration of its different business divisions: consumerelectronics, mobile phone, components sectors.
Fragmented research efforts due to theinternal rivals and disconnected operations(Wall Street Journal, 2012)
Diligence(extra engagement)
Employees are highly disciplined and work long hours: it is commonfor R&D employees to work on Sundays (Guardian, 2012).
Goal-orientation(no complacency)
Samsung creates crisis when things are going well (e.g., operate in astate of perpetual crisis) (Economist, 2011). Samsung continuouslychanges its target rivals from Motorola to Nokia and to Apple.
First developed the smartphone, but did notbring it into the market and just refocused onthe basic phones (Wall Street Journal, 2012)
ⓒ 2015 Hwy-Chang Moon. All Rights Reserved.

The ABCD Model: An Integration of Established and Emerging Theories
Agility
• Speed Early entry advantage Fast process advantage(Economies of speed) Automobile Industry
(Ford, Toyota, Hyundai)• Precision Automation Process techniques (自働化)
e.g., JIT, TQM, 6 sigma
Benchmarking
• Learning Resource-based view of the firm Absorptive capacity(Economies of learning) Steel Industry
(US steel, Nippon steel,POSCO)• Best practice Destructive innovation Incremental innovation
e.g., Kaizan, creative imitation
Convergence
• Mixing Specialization capability(Economies of scale)
Combinative capability(Economies of diversity) Electronics Industry
(GE, Sony, Samsung)• Synergy-creation Related diversification
(Economies of scope)Related & Unrelated diversificatione.g., Chaebol, smartphone
Dedication
• Diligence Inspiration Perspiration(Economies of hard-working)
Work Ethics(US, Japan, Korea)
• Goal-orientation Unique positioningContinued growth after catch-upe.g., constructed crisis, extra commitment
33
Established Theories Theories and Concepts for Further Development Cases
ⓒ 2015 Hwy-Chang Moon. All Rights Reserved.

“What” vs “How” Approach
34
“What” Approach “How” Approach
Existing Studies New Study
• Superior resources- Cheaper labor- Higher technology
• Focus on “input” factors• Static view
• Similar resources- Similar labor cost, but HOW?- Similar technology, but HOW?
• Focus on “process” factors• Dynamic view
Y = β1X1 + β2X2 + β3X3 + β4X4 …
• “What” Approach: X1, X2, X3, X4 …• “How” Approach: β1, β2, β3, β4 …
As the gap in “What” factors has been narrowing, the “How” approach becomes more important.
ⓒ 2015 Hwy-Chang Moon. All Rights Reserved.