do hallyu (korean wave) exports promote korea’s ...2016)/f38.pdf · do hallyu (korean wave)...
TRANSCRIPT
1
Do Hallyu (Korean wave) exports promote Korea’s consumption goods exports?
(June 30, 2016)
Huh, Chan-Guk, (Chungnam National University)*
Wu Jie (Chungnam National University)
Sun Fulai (Chungnam National University)
Abstract
This study analyzes the link between international trade in tangible goods and services, and intangible cultural goods using panel data of Korea’s export of consumer goods and TV contents since the mid-2000s to 50 countries. The growing popularity of Korean TV dramas (the stand-in for the Korean wave, or ‘Hallyu’ phenomenon) has not been confined to East Asian region with interest spreading much further afield. In this study we estimate gravity equation models that use various consumption good exports as well as inbound visitors to Korea as dependent variables and standard explanatory variables, including the Korean broadcasting contents exports. Close attention is paid to not only formulate theoretical conjectures that can be empirically verified, but also to defining the variables included in the estimation equations so as to avoid the kinds of selection bias problems prevalent in previous studies. The Pseudo Poisson Maximum Likelihood (PPML) procedure was used for the estimations. In addition to finding a positive relationship between the Hallyu dependent variables, we show that the positive effects change as levels of Hallyu exports increases. We also show that Korea’s consumer goods, durable goods in particular, exports to major regional trading partners have been disproportionately small.
JEL: F10, Z10
Keywords: Exports, Korea, cultural goods, TV dramas, Consumption goods
*First and corresponding author. Professor, Department of International Trade, Chungnam National University, Yuseong-gu, Daejeon 305-764, Korea. (Phone) 82-42-821-5562, (Fax) 82-42-821-8967. Email: [email protected].
2
1. Introduction
Culture is an important non-economic factor that can affect commercial exchanges between countries. Interest in the relationship between culture and international trade appears to have given rise to two strands of research in recent decades. One group has focused on the theoretical expositions that examine the explicit consumer choices that are associated with the international trade in cultural goods and the economic rationales that are related to various policies such as the regulated importations of Hollywood movies1. The second focuses on finding empirical regularities with regards to the role of cultural factors play as an enabler of international trade in goods and services. Various forms of cultural proximity are found to positively affect trade flows between countries. For example, just as the physical distance between trading partners has been found to have a negative effect in a typical gravitation model, the cultural distance (opposite of proximity) that exists between two trading partners has also been found to be negatively related in empirical results.
Since the early 2000s, Korea has experienced a surge in interest in exports of cultural contents such as TV dramas and popular music to its East Asian neighbors of Japan and China. The phenomenon of Korean cultural contents gaining popularity in the region has been dubbed as the ‘Korean Wave,’ or ‘Hallyu.’ There have been numerous journalistic and academic narratives related to this trend.2 Widespread showing of several Korean TV dramas in Japan, China and other Southeast Asia countries via on- and off-line media as well as the contemporaneous strong export growth in Korean cosmetic products to the region is viewed as a prima facie evidence of the positive effects of Hallyu in promoting Korea’s exports.3
This study offers an empirical assessment of the role of Hallyu contents in promoting exportation of Korean consumer goods. We also pay attention to the mechanism through which Hallyu could affect demand for Korean consumer goods from importing countries, using the conceptual framework and methodologies mentioned earlier. We employ a gravity model that relates to Korea’s consumer goods exports to 50 countries as well as inbound visitor numbers from them to a set of explanatory variables including exports of Korea’s TV contents, which is mainly composed of dramas, as the representative Hallyu variable. Annual data from 2006 to 2014 were used for the estimation analysis. Although these countries are chosen because they are important destinations for Korean consumer goods exports, the sample includes both Hallyu importers as well as non-importers.
Our focus on consumer goods exports is justified within the first strand of related theoretical studies that find preference, or the utility function of consumers to be the nexus through which cultural goods affect consumer behavior. We find a theoretical underpinning of the export promoting effect of Hallyu by observing that demand for Korea’s consumer goods exports are determined by the consumer 1. For example, Bala and Long (2005) observe that “[a] tariff on Hollywood movies can be Pareto superior to free trade if it makes local movies viable,” (Ibid p. 144). 2 For examples, see, “Role Over, Godzilla: Korea Rules,” New York Times, June 25, 2005 (http://www.nytimes.com/2005/06/28/ world/asia/roll-over-godzilla-korea-rules.html?_r=0), “Riding the ‘Korean Wave’,” Wall Street Journal, May 19, 2009 (http://www.wsj.com/articles/SB124267698913031617), “Hallyu, yeah!” Economist, January 25, 2010 (http://www.economist.com/node/15385735), “Games films and comics exports enjoy growing acclaim,” Financial Times, November 5, 2013 (http://www.ft.com/intl/ cms/s/0/7b869dbc-3b06-11e3-a7ec-00144feab7de.html). For an example of analysis of Hallyu developments from international cultural/communication perspective, see Shim (2006). 3 The surge in Hallyu has provoked in some countries critical examinations of it from a ‘cultural imperialism’ perspective that has been typically associated with American popular culture. See examples of discussions along this line in Huang (2009), Yang (2012).
3
demands of the importing countries’. In such a framework, Hallyu consumption, which enters as a determinant in the derived demand curve of the importing country’s consumers could be interpreted as being the primary factor behind shifts in the demand for Korean consumer goods.
Estimation results from different groups shed light on the following questions. A comparison of the results from importers of Hallyu to those from non-importers would tell us in what way do the presence of Hallyu exports affect the empirical relationship? For example, the positive effect of Hallyu exports could be discerned by comparing the magnitudes of the coefficient estimates of the distance variable, a common explanatory variable of gravity models, from the two sets of results. We also could ascertain whether increases in Hallyu exports lead to commensurate increases in the demand for the Korean exports, as posited in the derived demand framework.
Finding a significant effect of Hallyu TV content exports would present an interesting implication about the changing nature of cultural proximity variables in this internet age. That is, with the availability of internet network everywhere, cultural content such as TV dramas might have a greater influence on consumer behavior than even compared to the days of the American TV series ‘Dallas’ during the 1980s.4
The Korean government has made various efforts to foster and diversify Hallyu content and improve its potential as a competitive export items (see, Shim, 2006). Our results should offer some policy implications regarding how to distribute resources in a manner that enhances the complementary effects of Hallyu exports on consumer goods exports.
The rest of this paper is organized as follows. Related key studies are reviewed in Section II. Section III offers discussions of Hallyu phenomena and a sketch of the theoretical justifications for our empirical study. Section IV describes data, estimation models, and presents estimation results. Summary, policy implications and conclusion are offered in Section V.
2. Literature survey
There is a large body of literature that examines the diverse theoretical and empirical issues involving to the relationship between culture and international economic exchanges. At one end, theoretical studies focuses on the nature of cultural goods and how they affect, and are affected by, international trade. Bala and Van Long (2005) offers a rationalization of barriers to cultural goods imports that can change the preferences of the local population using biological evolution model of preference transmissions across generations. Olivier et al. (2008) defines cultural identity as a consumption externality and analyzes divergence/convergence cultural diversity outcomes that occur as a result of economic as well as social integration. Disdier et al. (2009) offers an interesting way to model cultural good consumption for importing country consumers by claiming that it is the stock of past cultural goods consumption that is relevant to consumers’ demand for cultural goods imports, as highlighted in the economic models of addiction.
Empirical studies about the influences of culture and other non-traditional factors on trade are more numerous. Linguistic proximity has been one key explanatory variable in the gravity equations of many studies (Boisso and Ferrantino, 1997; Hutchinson, 2005; Kónya, 2006; Frankel, 1997; Melitz, 4 In 2014, dramas made up approximately two thirds of total TV contents exports of Korea in value terms according to the Korean Communication Commission (KCC) reports. In terms of types of rights, in addition to the conventional DVD and various airing rights, the share of sales of digital rights to TV programs have approached close to 20% in recent years.
4
2008; Lohman, 2011, Isphording, and Otten, 2013). For example, sharing a language could increase trade flow by around 65% (Disdier and Mayer, 2007, p. 1142).
Colonial links and ethnic linkage (through migration) are also common factors used as explanatory variables in many gravity models. Eichengreen and Irwin (1998), and Rose (2000) are often cited studies among others. Numerous studies have analyzed the linkage between the effects of migration and ethnic network, such as those of regionally scattered Chinese diaspora, and trade flows. Papers by Gould (1994), Head et al. (1998), Rauch and Trindade (2002), Wagner et al. (2002), Girma and Yu (2002), Felbermayr and Toubal (2010) each focused on particular ethnic groups, countries, or regions and found fairly large and significant effects. Ethnic networks tend to reduce various transaction costs that deter non-network international trading partners.
From the literature, we take away two points that are relevant to our analysis on the demand for Korean consumer goods. First, one needs to pay a close attention to the basic economic mechanism through which cultural goods affect the consumer demand behavior of an importing country. Second, the list of non-traditional factors that were discussed earlier does not necessarily apply to Korea. That is, the Korean language is quite unique and is used by approximately 50 million Koreans. Furthermore, Korea does not have much of an ethnic diaspora like the Chinese networks with an exception being small groups in Japan and the US. Nor does Korea share common historical colonial links with any of its trading partners, with the exceptions of Taiwan and Japan. Consequently, other than the Hallyu factor, conventional economic variables might play a more important role in explaining Korea’s consumer good exports.
Next, we turn our focus onto studies involving Hallyu and non-Hallyu exports relationships in Korea. There are several studies that demonstrate similarities to our study in terms of data and coverage of topics. Studies are all empirical in their nature, and could be arranged into different categories depending on the key dimensions of analysis.
Many studies use the cultural commodity definition of the UNESCO, as specified in terms of HS codes, use those as the Hallyu exports (Choe and Park, 2008, Park and Choe 2009; Kang 2009; Nam, 2011; Kim and Ahn, 2012). Others use different types of Hallyu variables such as; survey based cultural content exports as compiled by the Korea Creative Contents Agency (KOCCA), a government supported entity, that includes both tangible and intangible cultural contents exports (Kim et al., 2015), Google search and YouTube page views of major K-pop stars (Lee et al., 2014), and Google trends query indexes of ‘Korean dramas’ (Park, 2015) have also been used. There is also a study (Park, 2014) that analyzed the exports of Hallyu contents and TV broadcasting contents, to 11 Asian countries using various explanatory variables.
The dependent variables of the studies mentioned above range from Korea’s overall exports, consumer good exports, other two or four digit HS commodities, TV broadcasting contents exports, and FDI (Kang, 2009). And the scope of export destinations also vary. Most common are some subsets of East Asian countries with some exceptions: Japan (Choe and Park, 2008), cross-country differences of the effects of cultural good exports of China, Japan, and Korea (Nam, 2011), 25 Asia Pacific countries (Park and Choe, 2009), 10 Southeast Asian countries (Kang, 2009), 23 countries (10 Asian), chosen by the order of the magnitudes of Korea’s cultural good exports (Kim and Ahn, 2012), 11 Asian countries (Park, 2014), 74 countries, where Korea exports of cosmetic products (Park, 2015).
Without exception, studies that used Hallyu exports as a key explanatory variable and focus on Asian countries found it had a significantly positive effect on various types of Korean exports when gravity models and OLS, Tobit, Pseudo Poisson Maximum Likelihood (PPML) methods were used. Studies have mostly used gravity model specifications that consist of contemporaneous variables,
5
which could cause a simultaneity problem between Hallyu exports and other non-Hallyu exports. As a consequence, to ensure statistical pre-determinedness some used a lagged Hallyu variable.
We aim to improve upon these previous studies in several ways. To date, many have focused on regionally concentrated countries already well connected by regional trade networks, and for which Hallyu trends have already made visible headways. As such, the issues that could be addressed from the analyses of such a biased and relatively small sample could be quite limited. In order to overcome this, we employ, as part of our analysis, a sample of 50 countries that are regionally dispersed. Many of our sample countries do not have Hallyu imports from Korea. Thus, we are able to obtain estimation results for a sub group of sample countries that have no Hallyu, which would afford us a comparison with results from countries with Hallyu sample.
Some studies use Korea’s aggregate exports as the dependent variable. This is questionable choice because the largest part of Korea’s exports are its capital or industrial intermediate goods in such areas as electronic, machinery and chemical industries (related discussion is presented in the next section). Implicitly assuming that purchasing managers of importing countries make their decisions on non-economic factors such as Hallyu is not very realistic. On the other hand, viewing a Korean drama, which features a refrigerator as a product placement advertisement might affect the purchase decision of a shopper for white goods in a Hallyu importing country. Hence, we focus on Korea’s consumer good exports.
3. Hallyu contents and Korea’s exports
3.1. Hallyu contents: TV broadcasting contents
Until 2002, Korea had recorded deficits in the trade of its broadcasting contents, with the US being the dominant exporter of TV content for Korean viewers. In 2002 Korea reversed this long lasting trend by exporting USD 28.8 million and imported USD 25.1 million, thus recording its first TV broadcasting trade surplus. As of the end of 2014, Korea’s exports in this category have risen more than tenfold to USD 313.8 million, while imports have only doubled to approximately USD 59.3 million. The United States is still the dominant producer of imported TV content into Korea, followed by the UK, which is a distant second. Japan has been by far the largest importer of Korean broadcasting content, composed predominantly of TV dramas. However, since the early 2000s China and Hong Kong have emerged as major importers, thereby reducing the relative importance of Japan. The respective shares Korea’s TV broadcasting exports in 2014 to Japan, China and Hong Kong are 25%, 18%, and 17% respectively. These numbers help to demonstrate how exports having once started in Japan have now spread to China and other Asian countries. But it is not a development that is geographically limited to East Asia. Though relatively small in value terms, Korea’s broadcasting contents have reached many countries throughout the America’s, Europe, and the Middle East regions in recent years5.
5 For a succinct summary, see “South Korean soap operas hook foreign audiences,” Financial Times, November 13, 2013 (http://www.ft.com/intl/cms/s/0/948719ae-4858-11e3-a3ef-00144feabdc0.html#axzz4BH2fi9IO), “Hallyu and its impact on South Korea’s image and policies,” of South Korea Country Report (pp. 13-16) by preparatory action CULTURE in EU EXTERNAL RELATIONS, 2014 (http://ec.europa.eu/culture/policy/international-cooperation/documents/country-reports/south-korea_en.pdf). . “Asian style,” IMF, June 2014 (.http://www.imf.org/external/ pubs/ft/fandd/2014/06/wheatley.htm)
6
There seems to be two reasons why this type of Hallyu export is gaining much attention. Broadcasting contents display the strong public good characteristics of non-excludability and non-rivalry in consumption, thus they could have substantial externalities. Presumably, these characteristics and the associated effects of popular American culture exports, such as Hollywood movies and TV dramas, were the key motivating facts behind the theoretical expositions of Bala and Van Long (2005) and others that found economic justifications for implementing trade barriers in the trade of cultural goods. The spread of American broadcasting content has been associated with increases in the global recognition of American brands such as Coca Cola and American automobile brands. In a similar vein, Hallyu content exports offer an interesting basis from which businesses and policy makers in Korea can spread and reinforce Korean brands in a similar fashion to that of America’s Hollywood movies.
Another important factor is the fact that Korea’s exports are heavily geared towards the production of capital intensive goods and industrial supplies and materials as opposed to general consumer goods. For example, these three export categories made up approximately 35%, 50% and 15% of Korea’s total exports in recent years. In comparison, the shares of consumer good exports in many advanced economies as well as China are in the 20~30% range. The lack of diversification in Korea export base is viewed as being a potential source of vulnerability during times of global industrial uncertainty. Hence, there has been a growing desire to boost not only Korea’s consumer good exports but also the number of inbound foreign tourists the country attracts. The Hallyu trend offers a highly useful catalyst for such a strategy. Thus, we are interested in studying the effect of Korea’s cultural content exports and other types of exports, and not just exports of Korea’s cultural contents per se as done in some of earlier studies.
The link between culture, or cultural proximity, and international trade has been the primary or secondary focus of many studies. Studies have found a list of variables related to cultural proximity generally to have a positive effect on trades.6 The Hallyu trend definitely belongs in the broad category of factors associated with cultural proximity. Hence how it is expected to affect Korea’s commercial exchanges with trading partners must not differ much from the manners of other factors studied in the literature.
However, there seems to be some distinct characteristics of the current Hallyu trend. It has emerged fairly recently in comparison to a list of simplistic cultural items such as the classical music of Germanic composers, Hollywood movies, and Chinese food. In addition, its spread has been disproportionately helped by the availability of the internet in the host regions and countries.
3.2. Hallyu and consumer preference
Many theoretical expositions of culture and trade, as seen in the previous section, start with the consumer preference specifications that view cultural goods as a key argument of the consumer’s utility function which sees cultural and non-cultural goods as being complimentary to each other. In such a set-up, a rise in the consumption levels of imported cultural goods would lead to a commensurate rise in differentiated non-cultural good imports. One could cite an explosive growth in Korean cosmetic exports to the same East Asian countries as Hallyu content exports over the past decade as an important case in point of such an effect.
6 Examples of topics are: bilateral trust (Guiso et al., 2007), bilateral opinion and trade patterns (Disdier and Mayer, 2007), linguistic proximity (Boisso and Ferrantino, 1997; Melitz, 2008), past colonial links (Rose, 2000; Eichengreen and Irwin, 1998), the link between immigration and trade (Wagner et al., 2002).
7
However, the most common gravity model specifications that utilize contemporaneous variables are subject to a simultaneity problem that might exist between Hallyu exports and other non-Hallyu exports. A brief discussion of some of the theoretical issues involved is now offered. We will also explain different estimation strategies and model specifications in the context of the following discussions. Theoretically, consumptions of Korean commodities and Hallyu enter into the utility function of the representative importing country consumer as follows;
𝑈𝑡 = u(𝑐𝑡 , 𝑐𝑘𝑡,𝐻𝑡 , … ) (1).
Here ct denotes consumption of composite goods, ckt denotes Korean import consumption, and Ht denotes the consumption of Hallyu contents, all of period t. We assume a well behaved utility function (strictly convex) in which the first derivatives with respect to arguments are all positive, and the second derivatives are all negative. At the optimum, which is obtained following an optimization with a budget constraint, we can derive the demand for the import function of the following form;
𝑐𝑘𝑡 = c(𝑝𝑡 ,𝐻𝑡,𝑍𝑡) (2).
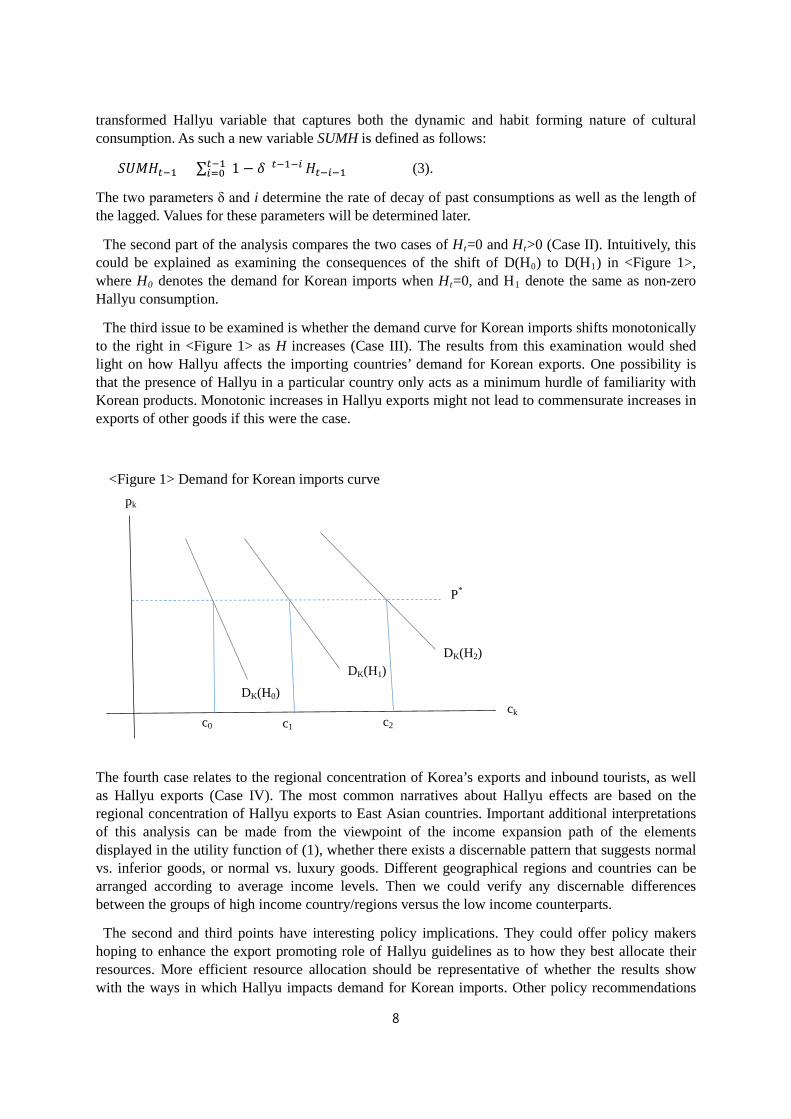
Here pt stands for relative price of import, assuming the price of domestic consumer goods as numeraire. Zt includes all other variables that could affect ckt. This demand is depicted in <Figure 1>, in which the vertical and horizontal axis each represents the price of Korean imports and the quantity of imports from Korea. In this framework, Hallyu acts as a shifter of the demand curve for Korean imports as shown in the figure (H0<H1<H2). Empirical studies that find the export enhancing effects of Hallyu can be interpreted as confirming this aspect of derived demand (2). Observing significant positive coefficient estimates of the Hallyu variable in an estimation equation of Korea’s contemporaneous export amounts to confirming the positive sign of the cross derivative of (2) ( 𝜕𝑐𝑘𝜕𝜕
> 0). It is a confirmation of co-dependency.
However, by the same reasoning, one could derive demand for the Hallyu function that contains ckt as a determinant. Since both ckt and Ht are normal goods, the following derivative term ( 𝜕𝜕
𝜕𝑐𝑘) must be
also positive. Thus, a regression equation that includes both ckt and Ht in the same equation is likely to give rise to a positive bias to the coefficient estimate of the Ht explanatory variable as an increase ckt would bring about a second round positive effect on Ht.
Basically, it is difficult to get around the co-dependency between c and H, given the preference specification of (1). However, we are going to make different assumptions about the H and estimate equations that correspond to each assumption. A compilation of the estimation results from the different specifications should offer more clues as to a more appropriate interpretation of the empirical evidence.
The first set of estimations will include three different specifications of Ht (Case I). In this instance, the first case uses the contemporaneous Ht as the Hallyu variable similar to many existing studies. The other two specifications are designed to secure the statistical pre-determinedness of H with respect to ckt. One way is to use Ht-1 in place of Ht. This is a simple way to model the habit formation aspect of the influences of cultural good consumption. The second way to accommodate the habit formation aspect is to adopt the formulation of Didier et al. (2007)7, which in turn appealed to Chaloupka (1991), whereby Hallyu broadcasting imports were defined as an addictive consumption good for consumers in the importing countries. This means that the accumulation past Hallyu imports influences the consumers’ purchasing behavior towards Korean imported goods. Specifically, we use a
7 See detailed discussion given in Appendix of Disdier et al. (2007).
8
transformed Hallyu variable that captures both the dynamic and habit forming nature of cultural consumption. As such a new variable SUMH is defined as follows:
𝑆𝑈𝑆𝐻𝑡−1 = ∑ (1 − 𝛿)𝑡−1−𝑖𝑡−1𝑖=0 𝐻𝑡−𝑖−1 (3).
The two parameters δ and i determine the rate of decay of past consumptions as well as the length of the lagged. Values for these parameters will be determined later.
The second part of the analysis compares the two cases of Ht=0 and Ht>0 (Case II). Intuitively, this could be explained as examining the consequences of the shift of D(H0) to D(H1) in <Figure 1>, where H0 denotes the demand for Korean imports when Ht=0, and H1 denote the same as non-zero Hallyu consumption.
The third issue to be examined is whether the demand curve for Korean imports shifts monotonically to the right in <Figure 1> as H increases (Case III). The results from this examination would shed light on how Hallyu affects the importing countries’ demand for Korean exports. One possibility is that the presence of Hallyu in a particular country only acts as a minimum hurdle of familiarity with Korean products. Monotonic increases in Hallyu exports might not lead to commensurate increases in exports of other goods if this were the case.
The fourth case relates to the regional concentration of Korea’s exports and inbound tourists, as well as Hallyu exports (Case IV). The most common narratives about Hallyu effects are based on the regional concentration of Hallyu exports to East Asian countries. Important additional interpretations of this analysis can be made from the viewpoint of the income expansion path of the elements displayed in the utility function of (1), whether there exists a discernable pattern that suggests normal vs. inferior goods, or normal vs. luxury goods. Different geographical regions and countries can be arranged according to average income levels. Then we could verify any discernable differences between the groups of high income country/regions versus the low income counterparts.
The second and third points have interesting policy implications. They could offer policy makers hoping to enhance the export promoting role of Hallyu guidelines as to how they best allocate their resources. More efficient resource allocation should be representative of whether the results show with the ways in which Hallyu impacts demand for Korean imports. Other policy recommendations
ck
pk
c0 c1 c2
DK(H0)
DK(H1) DK(H2)
P*
<Figure 1> Demand for Korean imports curve
9
may be more appropriate if a more significant and directly proportionate relationship between Hallyu and other exports is observed.
4. Empirical Analysis
4.1. Data
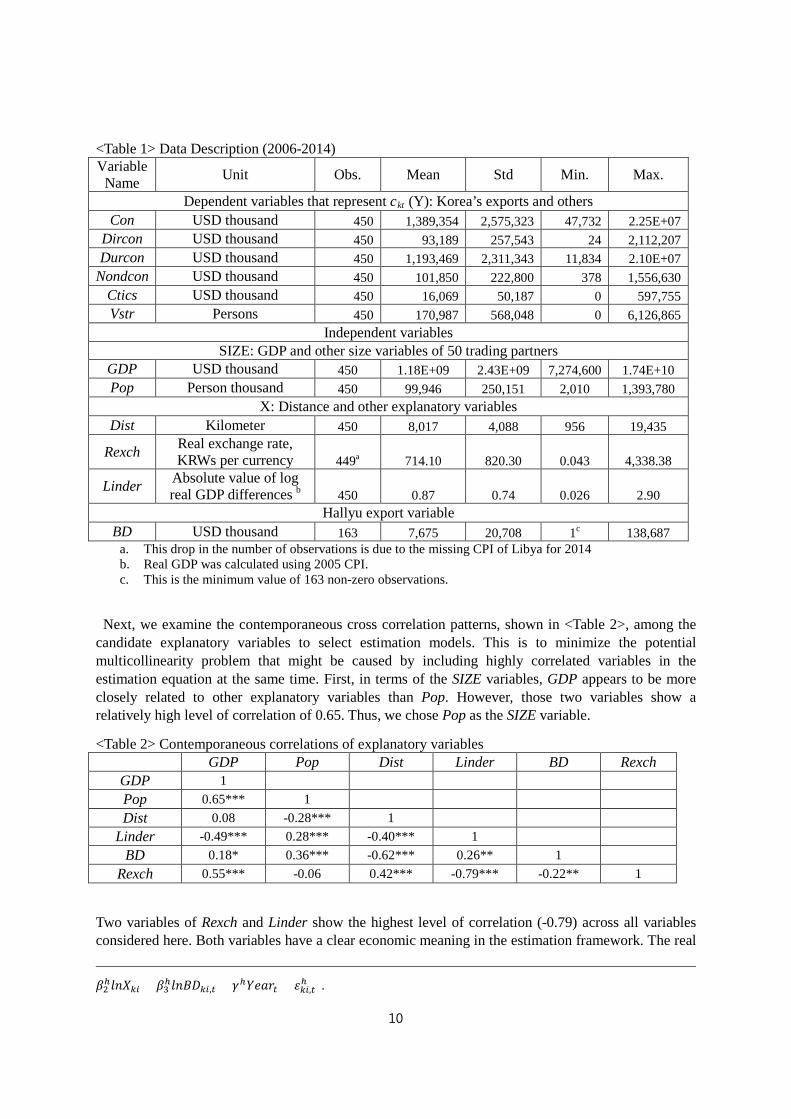
This study assesses the effects of Korea’s cultural content exports on other types of exports to Korea’s top 50 trading partners, based on consumer good export values (Appendix <Table A1>). The dependent variables, which represent ckt of the demand for Korean imports in equation (2) is included in our gravity model that consists of six types of tangible good exports plus the number of visitors from the same group of 50 trading partners. The list of commodity exports of Korea to these partners and their mnemonics are; consumption goods exports (Con), and three sub categories of the consumption goods of direct (Dircon), durable, and non-durable consumption goods (Durcon and Nondcon, respectively). The second category of durable consumer goods represents the largest share by far of consumer exports. Details of the magnitudes of each type as well as top export destinations are shown in Appendix <Table A2>. In addition, cosmetics exports (Ctics), which has been regarded as the commodity whose exports benefited the most from the Hallyu trend is also used. These are all measured in nominal USD. The last dependent variable is the number of visitors from these countries to Korea (Vstr).
In addition, we use a set of variables that are used most frequently in gravity models as well as a set of variables that are specific to each model. Key details of data are shown in <Table 1>. The common variable list consists of the following three sets of variables. First, SIZE represents three variables that measure the size of the importing country (Gross Domestic Product: GDP, population: Pop). Second, X represents a vector of explanatory variables that appear in the related gravity models; distance between the capital of the importing countries and Seoul of Korea (Dist), real exchange rates vis-à-vis Korean won (Rexch), and the Linder effect variable (absolute values of the natural log difference of the GDP per capita of the importing country and Korea, Linder). The real exchange rate is the stand-in for the price of Korean imports variable 𝑝𝑡 of the previous section. Since consumer goods include a range of products such as perishable foodstuffs (direct consumption), and passenger vehicles (durable consumption), it is sensible to include Dist in the estimation equation, unlike Kim and Ahn (2012) who omitted it from their consumer good export analysis.
The Hallyu variable is the exports of broadcasting contents. This data, referred to as BD, was compiled using the KCC based annual broadcasting company surveys. Out of 50 countries, 28 countries had non-zero observations in 2014 (Appendix <Table A3>). We use different specifications of BD in our estimation as discussed in the previous section.
The baseline gravity estimation model is as follows;
𝑙𝑙𝑙𝑘𝑖,𝑡ℎ = 𝛼ℎ + 𝛽1ℎ𝑙𝑙𝑆𝑙𝑍𝑙𝑖,𝑡 + 𝛽2ℎ𝑙𝑙𝑙𝑘𝑖 + 𝛽3ℎ𝑙𝑙𝐵𝐵𝑘𝑖,𝑡 + 𝛾ℎ𝑙𝑌𝑌𝑌𝑡 + 𝜀𝑘𝑖,𝑡ℎ (4).
Here, Year is a year dummy to capture year fixed effects. Like that of previous studies, we use the Pseudo Poisson Maximum Likelihood (PPML) estimation method to account for serious heteroskedasticity problems as well as the zero value for dependent variables present in data8. The mixture of variables in levels and log levels are due to the PPML methodology.
8 The PPML estimation procedure converts (1) into the following form; 𝑙𝑘𝑖,𝑡ℎ = exp (𝛼ℎ + 𝛽1ℎ𝑙𝑙𝑆𝑙𝑍𝑙𝑖,𝑡 +
10
<Table 1> Data Description (2006-2014) Variable
Name Unit Obs. Mean Std Min. Max.
Dependent variables that represent ckt (Y): Korea’s exports and others Con USD thousand 450 1,389,354 2,575,323 47,732 2.25E+07
Dircon USD thousand 450 93,189 257,543 24 2,112,207 Durcon USD thousand 450 1,193,469 2,311,343 11,834 2.10E+07
Nondcon USD thousand 450 101,850 222,800 378 1,556,630 Ctics USD thousand 450 16,069 50,187 0 597,755 Vstr Persons 450 170,987 568,048 0 6,126,865
Independent variables SIZE: GDP and other size variables of 50 trading partners
GDP USD thousand 450 1.18E+09 2.43E+09 7,274,600 1.74E+10 Pop Person thousand 450 99,946 250,151 2,010 1,393,780
X: Distance and other explanatory variables Dist Kilometer 450 8,017 4,088 956 19,435
Rexch Real exchange rate, KRWs per currency 449a 714.10 820.30 0.043 4,338.38
Linder Absolute value of log real GDP differences b 450 0.87 0.74 0.026 2.90
Hallyu export variable BD USD thousand 163 7,675 20,708 1c 138,687
a. This drop in the number of observations is due to the missing CPI of Libya for 2014 b. Real GDP was calculated using 2005 CPI. c. This is the minimum value of 163 non-zero observations.
Next, we examine the contemporaneous cross correlation patterns, shown in <Table 2>, among the candidate explanatory variables to select estimation models. This is to minimize the potential multicollinearity problem that might be caused by including highly correlated variables in the estimation equation at the same time. First, in terms of the SIZE variables, GDP appears to be more closely related to other explanatory variables than Pop. However, those two variables show a relatively high level of correlation of 0.65. Thus, we chose Pop as the SIZE variable.
<Table 2> Contemporaneous correlations of explanatory variables GDP Pop Dist Linder BD Rexch
GDP 1 Pop 0.65*** 1 Dist 0.08 -0.28*** 1
Linder -0.49*** 0.28*** -0.40*** 1 BD 0.18* 0.36*** -0.62*** 0.26** 1
Rexch 0.55*** -0.06 0.42*** -0.79*** -0.22** 1
Two variables of Rexch and Linder show the highest level of correlation (-0.79) across all variables considered here. Both variables have a clear economic meaning in the estimation framework. The real
𝛽2ℎ𝑙𝑙𝑙𝑘𝑖 + 𝛽3ℎ𝑙𝑙𝐵𝐵𝑘𝑖 ,𝑡 + 𝛾ℎ𝑙𝑌𝑌𝑌𝑡 + 𝜀𝑘𝑖,𝑡ℎ ).
11
exchange rate is obviously relevant in any meaningful analyses of the behaviors of the set of dependent variables we are considering. Linder is also of interest as it represents a difference in standards of living for Korea, the exporter or inbound visit destination, and the importers of Korean consumer goods. Consumption patterns (including foreign travel) are expected to be closely tied to the general level of income or lifestyle. Hence, we are going to use these two variables in a sequential manner and estimate two separate equations each containing only one of the two.
4.2. Estimation results
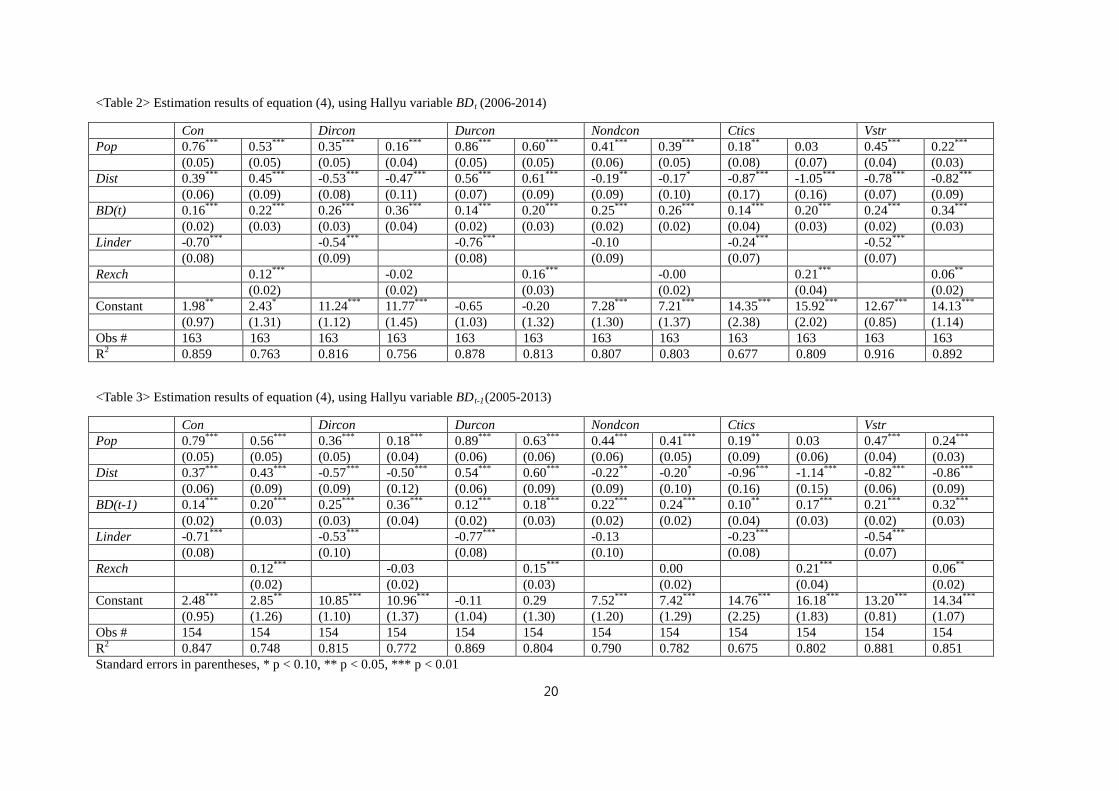
(1) Case I: Different specifications of Ht (BDt,, BDt-1, SUMBDt-1)
The estimation results of (4) displaying the different specifications of Ht as discussed in the previous section are shown in <Table 2>~<Table 4>. An unbalanced panel data with 163~208 observations with non-zero BDt were used in the respective estimations.9 The results from using the population (Pop) of each country as the SIZE variable are shown as they appear to be more significant in general. The fixed year effect dummy variable has been used in all specification as shown. The results show the models to have substantial explanatory power as the R2 values range from 0.7 to 0.9.
Another noteworthy point is that the different Hallyu variable specifications notwithstanding, the estimation results shown in the three tables are remarkably similar to each other. An implication is that once Hallyu broadcasting exports are present, the different transformations of it does not really effect one’s ability to obtain a positive significant estimate in gravity models that use both the group of consumer goods exports as well as inbound tourist number to Korea as dependent variables.
Next, we turn to coefficient estimations. The SIZE variable, population which measures the size of the economy is significant and positive in all models with different dependent variables in all three tables. However, Dist, which measures the physical distance of the importing country from Korea, appears with a positive sign and is highly significant in the two models of the overall consumer goods exports (Con) and those of durable goods exports (Durcon) in all three tables. A literal interpretation is that Korea consumer good exports to her trading partners are directly proportional to their distance from Korea. This could be due to the fact that the main market for Korean durable consumer goods exports such as passenger automobiles and electronics tend to be located in the high income countries of North America and Europe as can be seen in Appendix <Table A1>. This explanation will be tested in the latter part of this section by means of estimating models with regional dummy variables. Otherwise, it appears to be statistically significant with a negative sign as is the case in typical gravity models. The absolute values of the negative coefficients of distance are particularly large for Korea’s exports of cosmetics as well as inbound tourists. For both cosmetics and inbound tourists, this reflects that there is substantial regional concentration of exports to East Asian countries.
The coefficient estimates of the Linder variable and the bilateral real exchange rates are also significant with expected signs in all cases shown in the three tables. A negative sign on the Linder variable, which measures the absolute size of income difference for two countries, indicates that the larger the size of the per capita income difference between Korea and that of the trading partner, the smaller Korea’s exports will be to that country. This effect is most noticeable in the case of exports for durable consumer goods.
9 For the SUMBD variable case of <Table 4>, Hallyu broadcasting program exports data starting from 2001 were used in tabulating the cumulative values according to the formula (3).
12
A positive sign for the bilateral exchange rate variable indicates that a depreciation of Korean Won in real terms would have a positive effect on both the volume of Korea’s consumer good exports to her trading partners, and the number of inbound tourists received from them. This effect is also most noticeable in the case of durable good exports.
All in all, the model estimation results for the three differing specification cases of Ht are almost identical. This suggests that the performance of Korea’s consumer good exports to a trading partner is robustly and positively affected by Hallyu exports to the country.
(2) Case II: Models without Ht
We repeat the estimations of models of (i) using data for cases where BDt equals zero, i.e., no Hallyu exports. For estimations of the models shown in <Table 5>, an unbalanced panel data of 290 observations were used. The PPML estimation procedure was used.
First of all, the gravity models that don’t include the Hallyu variable appear to have a significantly smaller R2 values when compared with the ones that include Hallyu variables as seen in the previous section (0.1~0.5 vs. 0.7~0.9). The constant terms (α) are also considerably bigger than those of models with non-zero Hallyu.
The coefficient estimates of Pop and Dist (β1, β2) also show divergent patterns. The former estimates are noticeably smaller in the models with zero Hallyu than those of the models with non-zero Hallyu. On the other hand, the estimates of the Dist coefficients are considerably more negative than those of non-zero Hallyu. Even in the case of durable goods exports (Durcon), the Dist coefficient estimates are substantially smaller (0.0 and 0.2 vs. 0.56, 0.61). This suggests that the greater the distance a trading partner is from Korea the more negative effect it would have on Korea’s exports to her trading partners which do not import Hallyu.
In the case of the Linder variable, the coefficient estimates are more negative and significant in all model specifications. The coefficient estimates of Rexch show a more mixed pattern of results than those of (i). The coefficient estimate of the real exchange rate is smaller in the zero-Hallyu durable good exports equation (0.05 vs. 0.16), whereas it is reversed for the Vstr equation (0.2 vs. 0.06).
One general take away from the comparison of results of (i) and (ii) is that the inclusion of the Hallyu variable seems to considerably enhance the ability of the gravity models to explain Korea’s consumer goods exports and inbound tourist traffic. Furthermore, moving a trading partner from zero Hallyu export status to non-zero could entail a measurable gain.
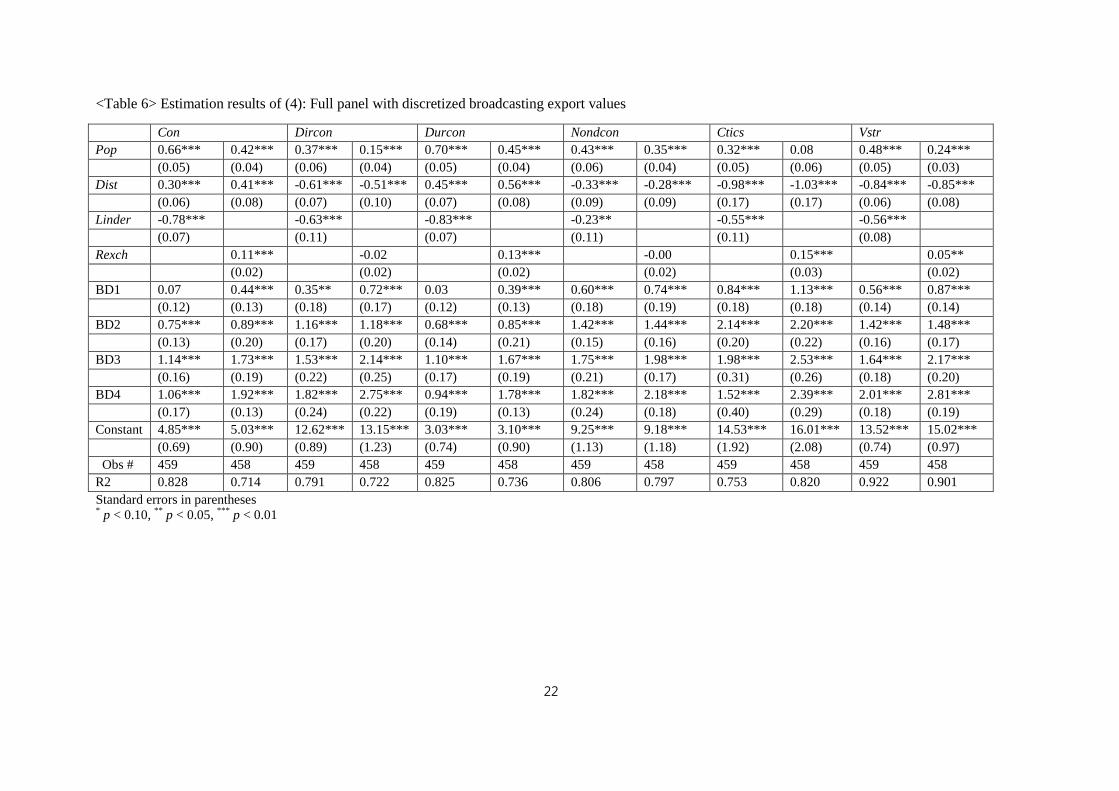
(3) Case III: Models with discrete BD size dummy variables
The next issue is to examine whether increases in Hallyu export values entail commensurate increases in Korea’s exports as discussed in the previous chapter. To carry out this exercise, we convert the continuous BD export values into 5 discrete categories and assign four dummy variables10:
BD1=1 if 1≤ BDt ≤1,000, and BD1=0 otherwise;
BD2=1 if 1,000≤ BDt <5,000, and BD2=0 otherwise;
10 The unit of measurement is one thousand dollars. The number of observations in each categories are 290 (for BD=0), 87 (for BD1), 47 (BD2), 20 (BD3), and 15(BD4). One explanation of this approach is that the value of BD exports is proportional to the degree of maturity of Hallyu trend, meaning how widely known in the importing country. A study by KOTRA derived different policy recommendations calibrated to the degree of Hallyu maturity (2011).

13
BD3=1 if 5,000≤ BDt <20,000, and BD3=0 otherwise;
BD4=1 if 20,000≤ BDt, and BD4=0 otherwise.
Estimating (4) with these four dummy variables provides a way of ascertaining the magnitude of BD exports of differing sizes. The estimation results from the balanced panel of 459 observations are shown in <Table 6>. The dummy variable coefficients are to be interpreted in relation to the group and as such are not included in the model, namely, BDt=0. The coefficient estimates for Pop, Dist, Linder, and Rexch and R2 of <Table 6> are very similar to those of <Table 2>, although the R2 value of the former table is slightly smaller than those of the latter table.
Next we turn to the estimation results of the BD dummy variables and present a couple of noteworthy points. First, the coefficient estimates of the four dummies are different with some regularities. In all 12 cases, the magnitude of the coefficients of BD2~BD4 are larger than those of BD1. In 8 cases, the magnitude of those coefficients increases monotonically as the BD export value increases, although increments in the coefficient magnitude get smaller as BD increases. For example, the coefficients BD1 and BD2 are 0.44 and 0.89, respectively, in the Con equation with Rexch (i.e., the second column of Con in <Table 6>). They are 1.73 and 1.92 for BD3 and BD4, respectively, in the same model.
Second, the coefficient estimates of the models for cosmetic exports (Ctics) and inbound tourists (Vstr) show clear and distinct patterns. In the former, the dummy coefficient estimate of BD1 and BD2 jumps from 0.84 to 2.14 in Ctics with Linder model. However, it then gradually falls to 1.52 (BD4). The same estimates of Ctics with Rexch model show a plateauing pattern after an initial jump.
In contrast, the same estimates of the Vstr models clearly show a monotonically increasing pattern. For example, in the Vstr with Rexch model the coefficient estimates increase from 0.87 (BD1) to 1.48 (BD2), to 2.17 (BD3), to finally 2.81 (BD4). Furthermore, the R2 values for the Vstr equations are noticeably higher than those for Ctics or any other consumer good export equations. The dummy variable coefficient estimates of both of the Ctics and Vstr equations are larger than those of the other consumer goods exports equations which are in general comparable.
(4) Case IV: Models with regional dummy variables (income expansion path)
Journalistic narratives of the Hallyu effect are centered on Korean TV dramas’ gaining popularity in East Asia rapidly, this has been accompanied by a steep rise in the export volume of Korean cosmetic products to the region. Here we take a more systematic look at the issues. In this regard we added country and regional dummy variables in (3) to gauge regional concentration effects. There are two country dummies for China and Japan, as well as three regional dummies of Oasia (other Asia), Nomerica (North America), and Europe. A group of countries was left out as a control dummy group. Thus, the coefficients of the dummy variables are to be interpreted in relation to the other regional cases. The list of countries acting as regional dummies are shown in <Appendix>), while the estimation results from the 459 balanced panel data are shown in <Table 7>.
The first remarkable result is that the coefficient estimate of the Dist in consumer good exports equations, especially in the Con (and also notably for Durcon) equations, are significantly negative. This seems to resolve the puzzling observation of the distance variable appearing with a positive coefficient estimate as discussed in part (1) of this section.
The coefficient estimates of the dummy variables do suggest that the North American markets are the only markets that Korea exports more consumer goods than the group of countries that were left out as a control group such as Australia, Saudi Arabia, and Brazil, considering all other factors. It is interesting to note that the estimate is highly negative in the case of China, which has been the biggest
14
export destination for Korea throughout the sample period. The negative coefficients of Japan also suggest similar patterns for Korea’s durable consumer good exports. However, the dummy coefficients turn positive in the category of direct consumer good exports which is unlike the case of China. The dummy coefficient patterns of other Asian countries (Oasia) as well as Europe (Europe) are identical to those of China for the categories of Con, Dircon, and Durcon.
The coefficient patterns are remarkably different to that of the cases of cosmetic exports and inbound tourists. For the former, Europe is the only regional dummy with a negative sign. This suggests that exports of Korean cosmetics products are doing well in all regions except Europe. For the latter, all of the country and regional dummies have positive signs. This suggests that there are more Korea-bound tourists from all of the listed countries and regions than from the group of countries that were left out.
As for the Linder effect, which is measured by the absolute size of the coefficients, the largest result was that of cosmetic exports. This seems to be reasonable finding as cosmetic products tend to be associated with lifestyle, which, in turn, must be significantly influenced by the standard of living which is measured here as being per capita GDP. On the other hand, Korea-bound tourist traffic appears to be most sensitive to real exchange rates.
Lastly, the BD coefficient estimates are all significant and positive. However, the size of these estimates are about half compared with those of <Table 2> with the exception of cosmetics exports. This observation suggests that earlier estimates of Hallyu effects might be overstated due to factors not considered in the model specifications.
V. Summary and Conclusion
By using a gravity model this study examined Korea’s consumer goods exports to and inbound visitors from 50 trading partners of various regions since 2006 to discern the systematic patterns that exist between Hallyu TV contents and a range of dependent variables. We find that the estimation models, which contain common explanatory variables with and without the Hallyu variable, perform considerably better for the group of Hallyu importing countries than they do for the non-importer group. This shows that Hallyu is nontrivially present in the derived demand for Korean imports of a representative importing country.
Once the basic premise is established, we further examine several characteristics of the link between Korea’s consumption goods and Hallyu TV contents (BD) exports. First, we estimated the models sequentially using alternative measures of BD, lagged as well as an accumulated past BD that captures both the dynamic and habit forming nature of cultural consumption, to avoid a potential simultaneity problem between the dependent variable and the contemporaneous BD. We failed to find any perceptible differences in the estimation results.
Second, whether there is a proportionally increasing relationship between the value of consumer good exports and those of Hallyu TV contents. That is, whether an increase in Hallyu exports is associated with a proportionally larger increase in the dependent variables. A coefficient estimate for discretized BD dummy variables, defined into four groups by ascending order of the size of BD, is examined to see if it is larger than unity. We find this to be the case.
Third, Korea’s consumer good exports show a distinct regional bifurcation: well below an average of all countries considered to be Northeast Asian neighbors of China and Japan, and well above those of North America, i.e., the United States. This is the case that despite the fact that the Northeast Asian neighbors are the dominant importers of Hallyu exports, thus weakening the argument for the broadly based positive effect of Hallyu on the purchase attitudes of Korean products in importing countries. It
15
must be added that this observation is mainly based on export patterns of durable consumer goods, which make up close to 80% of the total amount of consumer good exports.
All in all, this study confirms that Hallyu has a measureable positive effect on demand for both Korea’s consumer goods exports and inbound visitors. In regards, to the policy implications from these findings, we note that there is need to boost Korea consumer good exports to its trading partners in the East Asia region, where consumers are more attuned to things ‘Korean’ as a result of exposure to Hallyu content. This applies to all types of consumer goods, however the economic benefits would be greatest for durable consumer goods.
Even without demonstrating a large positive externality on Korea’s external commerce, Hallyu’s role in widening Korea’s cultural understanding to across the world is significant enough to be worthy of Korean government support. To some observers, cultural capital is viewed as no less important as human and natural capital (Throsby, 1999). Our findings of the export enhancing effects of Hallyu exports appear to be proportional to their values undergird this recommendation.
16
Reference
Bala, V., & Van Long, N. (2005), “International trade and cultural diversity with preference selection,” European Journal of Political Economy, 21(1), 143-162.
Baldwin R, Taglioni D (2006), “Gravity for dummies and dummies for gravity equations”, NBER Working Paper N. 12516.
Boisso, D. and M. Ferrantino (1997), “Economic Distance, Cultural Distance, and Openness in International Trade: Empirical Puzzles”, Journal of Economic Integration, 12 (4), pp. 456-484.
Choe, J. I. and S. C. Park (2008), “An Impact of Cultural Goods Export on Total Goods Export: For Korean Exports toward Japan,” Korea-Japanese Journal of Economics & Management Studies, No. 40, pp. 129-151 (in Korean).
____________________ (2009), “The Trade Creation Effects of Hallyu,” Economics Analysis, Bank of Korea Economic Research Institute, 15(1), 73-96 (in Korean).
Choi, M. (2012), “The Effects of Korean Wave on Korea’s Exportations,” International Commerce and Information Review, Volume 14, Number 1, March, 2012: pp. 67~86 (in Korean).
David Throsby (1999) “cultural capital”, Journal of Cultural Economics, Vol.23, pp.3-12.
Disdier, A.C. and T. Mayer (2007), “Je t’aime, moi non plus: Bilateral opinions and international trade”, European Journal of Political Economy, 23(4), p. 1140–1159.
Disdier, A. C., Tai, S. H. T., Fontagne, L. and T. Mayer (2010), “Bilateral Trade of Cultural Goods,” Review of World Economics, vol. 145, 4, pp. 575-595.
Eichengreen, B. and D. Irwin (1998), “The Role of History in Bilateral Trade Flows”, in The Regionalization of the World Economy, J. Frankel (Ed.), University of Chicago Press, pp. 33-57.
Felbermayr, G. J. and F. Toubal (2010), “Cultural Proximity and Trade,” European Economic Review, vol. 54, 2, pp. 279-293.
Francois, P., T. van Ypersele (2002), “On the Protection of Cultural Goods”, Journal of International Economics, Vol.56: 359-369.
Frankel, Jeffrey A. (1997), “Regional trading blocs in the world trading system”. Washington, DC: Institute of International Economics.
Girma, S. Yu, Z. (2002), “The link between immigration and trade: Evidence from UK”, Weltwirtscahftliches Archiv, 138: 115–130.
Gould, D. (1994), “Immigration links to the Home Country: Empirical implications for US bilateral trade flow”, The Review of Economic and Statistics, 76: 302–316.
Guiso, Luigi, Paola Sapienza, and Luigi Zingales (2007), “Cultural biases in economic exchange?” Working paper, European University Institute.
Huang, X. (2009), ‘Korean Wave’–The Popular culture, comes as both cultural and economic imperialism in the East Asia,” Asian Social Science Vol. 5 (8), pp. 123-130.
Hutchinson, William K. (2005), “Linguistic Distance as a Determinant of Bilateral Trade,” Southern Economic Journal 72, pp. 1–15.
Isphording, Ingo E., and Sebastian Otten (2013), “The Costs of Babylon—Linguistic Distance in Applied Economics,” Review of International Economics, 21(2), 354–369.
17
Kang, H. G. (2009), “An Economic Effect of Korean Cultural Contents on Korea’s Exports and FDI in Southeast Asian Countries,” Korea Trade Review, vol.34, no. 1, pp. 29-47. (in Korean)
Kim, J-G., & Ahn, S.Y. (2012), “An empirical study on effects of Korea’s cultural exports,” Journal of Korea Trade, 16(2), 25-48.
Kónya, István, “Modeling Cultural Barriers in International Trade,” Review of International Economics 14 (2006):494–507.
Korean Communication Commission (2015), 2015 Status report of the broadcasting industries (in Korean).
Lee, J., Kim Y., and Woo, W. (2014), “Impact of K-POP on Export: Based on YouTube Page View and Google Search,” Journal of Marketing Management Research Vol 19, 4, pp. 83-97 (in Korean).
Lohmann, J. (2011), “Do Language Barriers Affect Trade?” Economics Letters 110:159–162.
Marvasti, A., Canterbery, E. R.(2005), “Cultural and other barriers to motion pictures trade”, Economic Inquiry 43(1): 39-54.
Melitz, J (2008), “Language and foreign trade,” European Economic Review, 52(4)., pp. 667-699.
Nam, S (2011), “The Analysis on Export Effects of Cultural Goods Focused on the Comparative Analysis of Korea’s Exports between China and Japan,” Journal of Northeast Asian Economic Studies Vol 23, 1, pp. 1-32 (in Korean).
Olivier, J., M. Thoenig, and T. Olivier (2008), “Globalization and the dynamics of cultural identity,” Journal of International Economics 76, pp. 356–370.
Park, Y.S. (2014), “Trade in Cultural Goods: A Case of the Korean Wave in Asia,” Journal of East Asian Economic Integration, 18(1), 83-107.
________ (2015), “Does the Rise of the Korean Wave Lead to Cosmetics Export?” Journal of Asian Finance, Economics and Business Vol. 2 No. 4 (2015) 13-20
Rauch, J. E. and V. Trindade (2002), "Ethnic Chinese Networks in International Trade", Review of Economics and Statistics, Vol. 84(1), pp.116-130.
Rose, Andrew K. (2004), “Do We Really Know that the WTO Increases Trade?” American Economic Review 94 (2004):98–114.
Santos Silva, J.M.C. and Tenreyro, S. (2006), “The Log of Gravity”, Review of Economics and Statistics, 88(4): 641-658.
Santos Silva, J.M.C. and Tenreyro, S. (2011), “Further Simulation Evidence on the Performance of the Poisson Pseudo-Maximum Likelihood Estimator,” Economics Letters, vol. 112, issue 2, pp. 220-222.
Shim, D. (2006), “Hybridity and the rise of Korean popular culture in Asian,” Media, Culture & Society, vol. 28(1), pp. 25-44.
Throsby, D. (1999), "Cultural Capital," Journal of Cultural Economics, vol. 23(1), pp. 3-12.
Wagner, D., K. Head, and J. Ries (2002), “Immigration and the trade of provinces,” Scottish Journal of Political Economy, vol. 49, pp. 507-525.
Yang, J. (2012), “The Korean Wave (Hallyu) in East Asia: A Comparison of Chinese, Japanese, and Taiwanese Audiences Who Watch Korean TV Dramas,” DEVELOPMENT AND SOCIETY Vol. 41 (1), pp. 103-147.

18
<Appendix>
<Table A1> List of 50 countries grouped into 5 groups of country and regional dummy variables
Region Country
Japan Japan China China(mainland), Hong Kong*
Other Asian region (11 countries)
Thailand, Vietnam, Singapore, Taiwan*, Malaysia, Philippines, Cambodia, Indonesia, India, Kazakhstan
Europe (16 countries)
England, Belgium, Germany, France, Spain, Finland, Hungary, Netherland, Italy, Russia, Austria, Turkey, Sweden, Switzerland, Slovakia, Slovenia
North America (3 countries)
Mexico, America, Canada
Other regions (17 countries)
Australia, Columbia, Argentina, Peru, Chile, Brazil, Saudi Arabia, United Arab Emirates, Israel, Iran, Egypt, Iraq, South Africa, Jordan, Kuwait, Libya, Oman
* Hong Kong and Taiwan are treated as separate countries for the purposes of analysis.
<Table A2> Tope ten countries for different types of consumption goods exports of Korea in 2014 (in million USD, %)
<Table A3> List of 28 countries with at least one non-zero BD observations: Countries are ordered according to the value of Korea’s BD exports to the respective countries in 2014
1. USA, 2. China, 3. Japan, 4. Canada, 5. Australia, 6. Hong Kong, 6. Viet Nam, 7. Great Britain, 8. Germany, 9. Russia, 10. Israel, 11. Taiwan, 12. Italy, 13. Philippines, 14. Spain, 15. Thailand, 16. France, 18. India, 19. Singapore, 20. Indonesia, 21. Brazil, 22. Netherland, 23. New Zealand, 24. Malaysia, 25. Sweden, 26. Cambodia, 27. Hungary, 28. Kazakhstan
Consumption Direct Consumption Durable consumption Non-durable consumption
Total: 88,165 Total: 6,514 Total: 73,956 Total: 7,695 Country share Country share Country share Country share USA 0.25 Japan 0.29 USA 0.28 China 0.20 China 0.09 China 0.14 China 0.07 Japan 0.13 Japan 0.06 USA 0.10 Saudi Arabia 0.04 USA 0.11 Russia 0.04 Hong Kong 0.05 Russia 0.04 Vietnam 0.09 Saudi Arabia 0.04 UAE 0.05 Canada 0.03 Hong Kong 0.08 Canada 0.03 Vietnam 0.04 Mexico 0.03 Indonesia 0.03 Mexico 0.03 Russia 0.03 Australia 0.03 Taiwan 0.03 Australia 0.03 Taiwan 0.03 Japan 0.03 Thailand 0.02 Germany 0.02 Thailand 0.03 Germany 0.03 Singapore 0.02 UAE 0.02 Philippines 0.02 UK 0.02 Malaysia 0.02 Hong Kong 0.02 Australia 0.02 UAE 0.02 Russia 0.02
19
Data sources
Consumption goods exports: Korea International Trade Association.
Cosmetics exports: HS 33, Korea International Trade Association.
Number of inbound visitors to Korea: Korea Tourism Organization.
Broadcasting contents exports: Yearbooks of Korea Communications Commission.
Population: IMF (International Monetary Fund)
GDP: World Bank.
Distance: www.timeanddate.com.
Exchange Nates: nominal exchange rates (at the end of year) and CPIs from IMF were used to get real bilateral real exchange rates, country i’s currency per one Korean won..
20
<Table 2> Estimation results of equation (4), using Hallyu variable BDt (2006-2014)
Con Dircon Durcon Nondcon Ctics Vstr Pop 0.76*** 0.53*** 0.35*** 0.16*** 0.86*** 0.60*** 0.41*** 0.39*** 0.18** 0.03 0.45*** 0.22*** (0.05) (0.05) (0.05) (0.04) (0.05) (0.05) (0.06) (0.05) (0.08) (0.07) (0.04) (0.03) Dist 0.39*** 0.45*** -0.53*** -0.47*** 0.56*** 0.61*** -0.19** -0.17* -0.87*** -1.05*** -0.78*** -0.82*** (0.06) (0.09) (0.08) (0.11) (0.07) (0.09) (0.09) (0.10) (0.17) (0.16) (0.07) (0.09) BD(t) 0.16*** 0.22*** 0.26*** 0.36*** 0.14*** 0.20*** 0.25*** 0.26*** 0.14*** 0.20*** 0.24*** 0.34*** (0.02) (0.03) (0.03) (0.04) (0.02) (0.03) (0.02) (0.02) (0.04) (0.03) (0.02) (0.03) Linder -0.70*** -0.54*** -0.76*** -0.10 -0.24*** -0.52*** (0.08) (0.09) (0.08) (0.09) (0.07) (0.07) Rexch 0.12*** -0.02 0.16*** -0.00 0.21*** 0.06** (0.02) (0.02) (0.03) (0.02) (0.04) (0.02) Constant 1.98** 2.43* 11.24*** 11.77*** -0.65 -0.20 7.28*** 7.21*** 14.35*** 15.92*** 12.67*** 14.13*** (0.97) (1.31) (1.12) (1.45) (1.03) (1.32) (1.30) (1.37) (2.38) (2.02) (0.85) (1.14) Obs # 163 163 163 163 163 163 163 163 163 163 163 163 R2 0.859 0.763 0.816 0.756 0.878 0.813 0.807 0.803 0.677 0.809 0.916 0.892
<Table 3> Estimation results of equation (4), using Hallyu variable BDt-1(2005-2013)
Con Dircon Durcon Nondcon Ctics Vstr Pop 0.79*** 0.56*** 0.36*** 0.18*** 0.89*** 0.63*** 0.44*** 0.41*** 0.19** 0.03 0.47*** 0.24*** (0.05) (0.05) (0.05) (0.04) (0.06) (0.06) (0.06) (0.05) (0.09) (0.06) (0.04) (0.03) Dist 0.37*** 0.43*** -0.57*** -0.50*** 0.54*** 0.60*** -0.22** -0.20* -0.96*** -1.14*** -0.82*** -0.86*** (0.06) (0.09) (0.09) (0.12) (0.06) (0.09) (0.09) (0.10) (0.16) (0.15) (0.06) (0.09) BD(t-1) 0.14*** 0.20*** 0.25*** 0.36*** 0.12*** 0.18*** 0.22*** 0.24*** 0.10** 0.17*** 0.21*** 0.32*** (0.02) (0.03) (0.03) (0.04) (0.02) (0.03) (0.02) (0.02) (0.04) (0.03) (0.02) (0.03) Linder -0.71*** -0.53*** -0.77*** -0.13 -0.23*** -0.54*** (0.08) (0.10) (0.08) (0.10) (0.08) (0.07) Rexch 0.12*** -0.03 0.15*** 0.00 0.21*** 0.06** (0.02) (0.02) (0.03) (0.02) (0.04) (0.02) Constant 2.48*** 2.85** 10.85*** 10.96*** -0.11 0.29 7.52*** 7.42*** 14.76*** 16.18*** 13.20*** 14.34*** (0.95) (1.26) (1.10) (1.37) (1.04) (1.30) (1.20) (1.29) (2.25) (1.83) (0.81) (1.07) Obs # 154 154 154 154 154 154 154 154 154 154 154 154 R2 0.847 0.748 0.815 0.772 0.869 0.804 0.790 0.782 0.675 0.802 0.881 0.851 Standard errors in parentheses, * p < 0.10, ** p < 0.05, *** p < 0.01
21
<Table 4> Estimation results of equation (4), using Hallyu variable SUMBDt-1 (2005-2013, calculating from 2001)
Con Dircon Durcon Nondcon Ctics Vstr Pop 0.73*** 0.51*** 0.33*** 0.18*** 0.81*** 0.56*** 0.40*** 0.40*** 0.18** 0.04 0.44*** 0.25*** (0.04) (0.04) (0.04) (0.04) (0.05) (0.04) (0.05) (0.04) (0.08) (0.06) (0.04) (0.03) Dist 0.36*** 0.41*** -0.54*** -0.43*** 0.53*** 0.56*** -0.20** -0.17* -0.89*** -1.07*** -0.76*** -0.76*** (0.06) (0.07) (0.08) (0.09) (0.06) (0.07) (0.09) (0.09) (0.16) (0.15) (0.06) (0.08) SUMBD(t-1) 0.16*** 0.22*** 0.26*** 0.38*** 0.15*** 0.21*** 0.24*** 0.25*** 0.17*** 0.22*** 0.26*** 0.37*** (0.02) (0.02) (0.03) (0.04) (0.02) (0.02) (0.02) (0.02) (0.05) (0.04) (0.03) (0.03) Linder -0.65*** -0.46*** -0.73*** -0.03 -0.19*** -0.42*** (0.07) (0.08) (0.07) (0.07) (0.07) (0.06) Rexch 0.12*** -0.02 0.16*** -0.02 0.20*** 0.06*** (0.02) (0.02) (0.02) (0.02) (0.04) (0.02) Constant 2.86*** 3.21*** 10.80*** 10.19*** 0.49 1.02 7.36*** 7.04*** 13.62*** 15.05*** 11.92*** 12.39*** (0.78) (0.94) (0.91) (1.08) (0.84) (0.96) (1.09) (1.16) (2.21) (1.86) (0.72) (0.90) Obs # 208 208 208 208 208 208 208 208 208 208 208 208 R2 0.856 0.794 0.821 0.792 0.871 0.829 0.808 0.809 0.657 0.787 0.882 0.861
<Table 5> Estimation results of equation (4), using observations without Hallyu exports (2006-2014)
Con Dircon Durcon Nondcon Ctics Vstr Pop 0.50*** 0.25*** 0.25*** -0.03 0.50*** 0.26*** 0.44*** 0.22*** 0.44*** 0.09* 0.51*** 0.38*** (0.04) (0.03) (0.09) (0.08) (0.04) (0.03) (0.08) (0.04) (0.07) (0.05) (0.08) (0.04) Dist -0.11 0.10 -1.34*** -1.16*** 0.00 0.20* -1.36*** -1.19*** -1.95*** -1.79*** -1.80*** -2.01*** (0.10) (0.11) (0.26) (0.18) (0.09) (0.11) (0.23) (0.14) (0.18) (0.19) (0.20) (0.15) Linder -0.73*** -0.59*** -0.74*** -0.52*** -0.64*** -0.55*** (0.08) (0.17) (0.08) (0.18) (0.15) (0.14) Rexch 0.04*** -0.04* 0.05*** 0.00 -0.06* 0.20*** (0.01) (0.02) (0.01) (0.03) (0.03) (0.04) Constant 10.43*** 10.12*** 20.39*** 21.10*** 9.28*** 8.99*** 18.67*** 18.67*** 21.63*** 23.33*** 21.53*** 23.14*** (0.91) (1.03) (2.54) (2.11) (0.90) (1.04) (2.24) (1.52) (1.87) (1.82) (2.03) (1.51) Obs # 290 289 290 289 290 289 290 289 290 289 290 289 R2 0.468 0.178 0.091 0.080 0.480 0.197 0.211 0.269 0.421 0.417 0.424 0.510 Standard errors in parentheses * p < 0.10, ** p < 0.05, *** p < 0.01
22
<Table 6> Estimation results of (4): Full panel with discretized broadcasting export values
Con Dircon Durcon Nondcon Ctics Vstr Pop 0.66*** 0.42*** 0.37*** 0.15*** 0.70*** 0.45*** 0.43*** 0.35*** 0.32*** 0.08 0.48*** 0.24*** (0.05) (0.04) (0.06) (0.04) (0.05) (0.04) (0.06) (0.04) (0.05) (0.06) (0.05) (0.03) Dist 0.30*** 0.41*** -0.61*** -0.51*** 0.45*** 0.56*** -0.33*** -0.28*** -0.98*** -1.03*** -0.84*** -0.85*** (0.06) (0.08) (0.07) (0.10) (0.07) (0.08) (0.09) (0.09) (0.17) (0.17) (0.06) (0.08) Linder -0.78*** -0.63*** -0.83*** -0.23** -0.55*** -0.56*** (0.07) (0.11) (0.07) (0.11) (0.11) (0.08) Rexch 0.11*** -0.02 0.13*** -0.00 0.15*** 0.05** (0.02) (0.02) (0.02) (0.02) (0.03) (0.02) BD1 0.07 0.44*** 0.35** 0.72*** 0.03 0.39*** 0.60*** 0.74*** 0.84*** 1.13*** 0.56*** 0.87*** (0.12) (0.13) (0.18) (0.17) (0.12) (0.13) (0.18) (0.19) (0.18) (0.18) (0.14) (0.14) BD2 0.75*** 0.89*** 1.16*** 1.18*** 0.68*** 0.85*** 1.42*** 1.44*** 2.14*** 2.20*** 1.42*** 1.48*** (0.13) (0.20) (0.17) (0.20) (0.14) (0.21) (0.15) (0.16) (0.20) (0.22) (0.16) (0.17) BD3 1.14*** 1.73*** 1.53*** 2.14*** 1.10*** 1.67*** 1.75*** 1.98*** 1.98*** 2.53*** 1.64*** 2.17*** (0.16) (0.19) (0.22) (0.25) (0.17) (0.19) (0.21) (0.17) (0.31) (0.26) (0.18) (0.20) BD4 1.06*** 1.92*** 1.82*** 2.75*** 0.94*** 1.78*** 1.82*** 2.18*** 1.52*** 2.39*** 2.01*** 2.81*** (0.17) (0.13) (0.24) (0.22) (0.19) (0.13) (0.24) (0.18) (0.40) (0.29) (0.18) (0.19) Constant 4.85*** 5.03*** 12.62*** 13.15*** 3.03*** 3.10*** 9.25*** 9.18*** 14.53*** 16.01*** 13.52*** 15.02*** (0.69) (0.90) (0.89) (1.23) (0.74) (0.90) (1.13) (1.18) (1.92) (2.08) (0.74) (0.97) Obs # 459 458 459 458 459 458 459 458 459 458 459 458 R2 0.828 0.714 0.791 0.722 0.825 0.736 0.806 0.797 0.753 0.820 0.922 0.901 Standard errors in parentheses * p < 0.10, ** p < 0.05, *** p < 0.01

23
<Table 7> Estimation results of equation (4), using Hallyu variable BD, Full panel with country and regional dummy variables
Con Dircon Durcon Nondcon Ctics Vstr Pop 0.44*** 0.33*** 0.21*** 0.11*** 0.48*** 0.36*** 0.24*** 0.22*** 0.21*** -0.02 0.42*** 0.27*** (0.03) (0.03) (0.04) (0.03) (0.03) (0.03) (0.04) (0.03) (0.05) (0.04) (0.04) (0.02) Dist -0.64*** -0.71*** -0.99*** -1.15*** -0.65*** -0.71*** -0.68*** -0.70*** -0.37*** -0.81*** -0.81*** -1.14*** (0.11) (0.12) (0.14) (0.14) (0.11) (0.13) (0.14) (0.12) (0.14) (0.13) (0.12) (0.10) Linder -0.39*** -0.21*** -0.44*** 0.01 -0.51*** -0.42*** (0.06) (0.07) (0.06) (0.08) (0.08) (0.07) Rexch 0.03** -0.03 0.04*** -0.06*** 0.06** 0.15*** (0.01) (0.02) (0.01) (0.02) (0.02) (0.02) BD 0.08*** 0.10*** 0.13*** 0.15*** 0.07*** 0.09*** 0.13*** 0.14*** 0.17*** 0.19*** 0.11*** 0.11*** (0.01) (0.01) (0.02) (0.02) (0.01) (0.01) (0.02) (0.01) (0.02) (0.02) (0.01) (0.01) Japan -1.57*** -1.40*** 0.05 -0.20 -2.30*** -2.06*** 0.29 0.08 0.87*** 0.57* 2.67*** 2.84*** (0.24) (0.25) (0.33) (0.34) (0.24) (0.27) (0.33) (0.30) (0.32) (0.33) (0.25) (0.24) China -1.50*** -1.70*** -0.97*** -1.24*** -1.77*** -1.99*** 0.26 0.27 2.13*** 1.39*** 2.22*** 1.66*** (0.29) (0.34) (0.35) (0.34) (0.30) (0.36) (0.39) (0.35) (0.34) (0.32) (0.24) (0.24) Oasia -1.62*** -1.92*** -0.97*** -1.36*** -1.90*** -2.20*** -0.08 -0.27 1.03*** 0.39 2.02*** 1.84*** (0.14) (0.15) (0.24) (0.26) (0.15) (0.16) (0.20) (0.19) (0.25) (0.26) (0.19) (0.18) Namerica 0.77*** 0.99*** 0.65*** 0.90*** 0.73*** 0.95*** 1.43*** 1.57*** 1.12*** 1.52*** 2.57*** 2.77*** (0.10) (0.10) (0.18) (0.19) (0.10) (0.10) (0.22) (0.22) (0.25) (0.27) (0.21) (0.20) Europe -0.45*** -0.30*** -0.70*** -0.56** -0.47*** -0.31*** -0.05 0.07 -0.48** -0.33 1.58*** 1.59*** (0.09) (0.09) (0.21) (0.22) (0.09) (0.09) (0.15) (0.15) (0.22) (0.22) (0.16) (0.16) Constant 15.55*** 16.80*** 17.58*** 19.98*** 15.20*** 16.34*** 13.74*** 14.65*** 10.05*** 15.47*** 12.31*** 15.69*** (0.95) (1.01) (1.39) (1.45) (0.99) (1.08) (1.35) (1.13) (1.48) (1.32) (1.27) (0.98) Obs# 459 458 459 458 459 458 459 458 459 458 459 458 R2 0.929 0.921 0.947 0.948 0.934 0.925 0.884 0.894 0.913 0.912 0.916 0.917 Standard errors in parentheses * p < 0.10, ** p < 0.05, *** p < 0.01