the story of 8 metros & 7800 towns - unmetro.in3...the story of 8 metros & 7800 towns the...
TRANSCRIPT
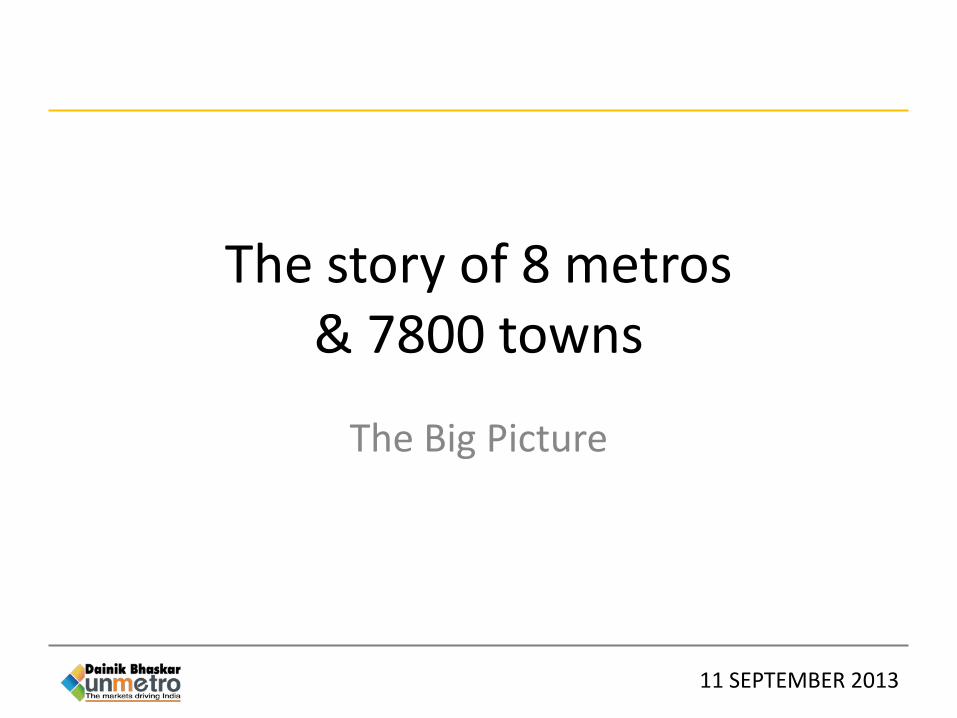
The story of 8 metros & 7800 towns
The Big Picture
11 SEPTEMBER 2013
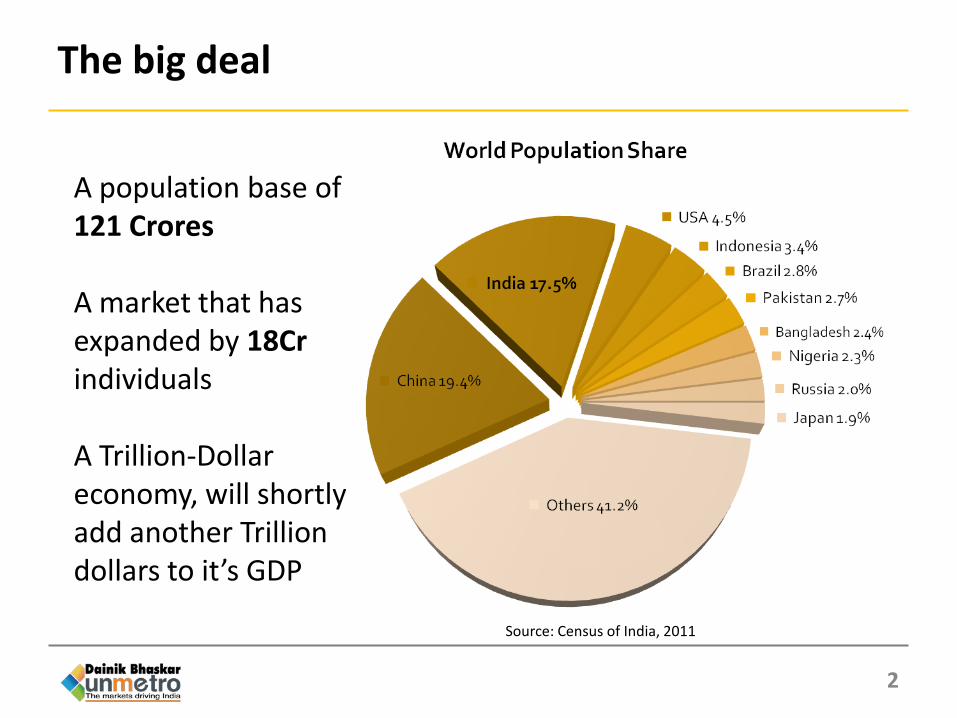
The big deal
2
A population base of 121 Crores A market that has expanded by 18Cr individuals A Trillion-Dollar economy, will shortly add another Trillion dollars to it’s GDP
Source: Census of India, 2011

Urban India continues to call the shots
3
IndiaNo.
Admin Units
% Share of HHs
% Share of Pop
% Decadal Growth
Total HH Income (Rs.Crs)
% Share
Urban India 7,798 33% 32% 32% 50,15,000 55%
Rural India 6,40,867 67% 68% 13% 40,42,300 45%
Source: Indicus Analytics Market Skyline of India 2013
A distinct decadal growth skew combined with a higher share of income on a lower population base continues to present Urban India as an attractive proposition.

522 Cities of the Future
4
Town Class Pop StrataNo.
Admin Units
% Distribution
of HHs
Ave HH Size
Top-8 Metros MDKCBHPA 8 17% 4.39
Tier 1 >10L 41 16% 4.62Tier 2 6-10L 27 5% 4.53
Tier 3 2-6L 161 13% 4.53Tier 4 1-2L 293 10% 4.55
Large Towns 50k-1L 659 11% 4.66Medium Towns 20k-50k 2003 15% 4.71
Small Towns 10k-20k 2230 8% 4.62Very Small Towns <10k 2376 4% 4.58
Urban India 7,798 100% 4.57
Source: Indicus Analytics Market Skyline of India 2013
Layered just below the Top-8 Metros are 522 Cities Accounting for 44% of Urban HHs Presenting a seamless layer of transition for marketers
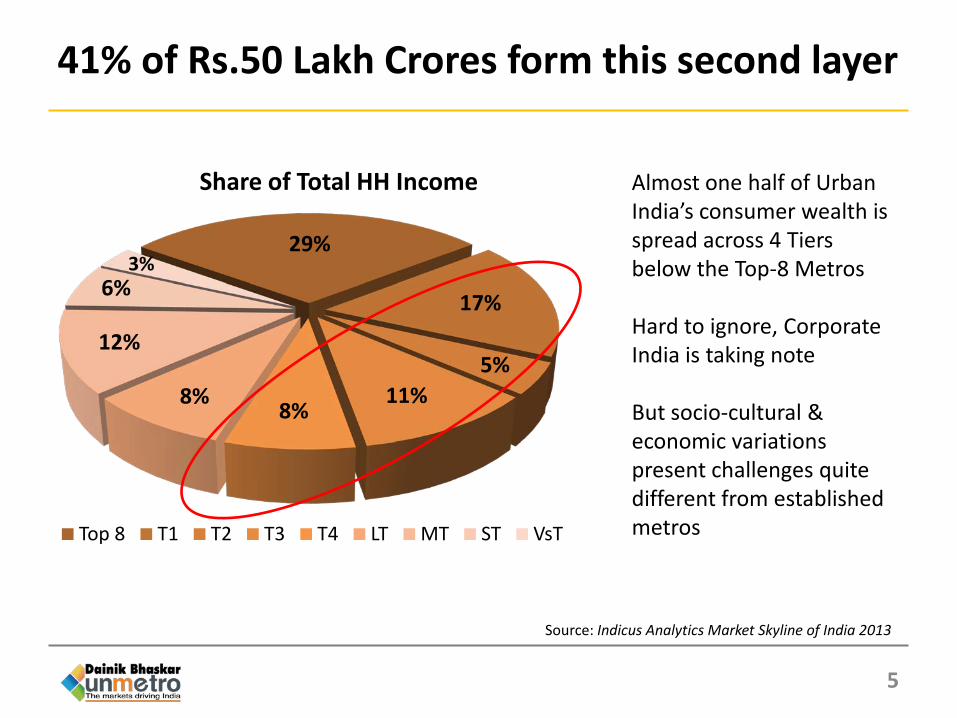
41% of Rs.50 Lakh Crores form this second layer
5
Source: Indicus Analytics Market Skyline of India 2013
29%
17%
5% 11%
8% 8%
12%
6% 3%
Share of Total HH Income
Top 8 T1 T2 T3 T4 LT MT ST VsT
Almost one half of Urban India’s consumer wealth is spread across 4 Tiers below the Top-8 Metros Hard to ignore, Corporate India is taking note But socio-cultural & economic variations present challenges quite different from established metros
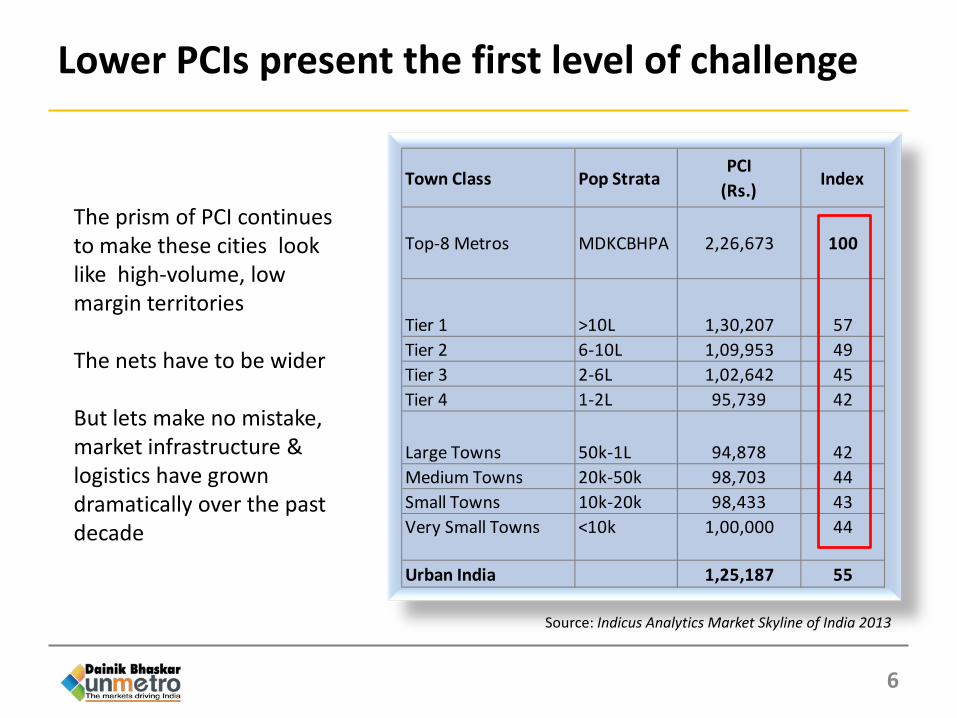
Lower PCIs present the first level of challenge
6
Town Class Pop StrataPCI
(Rs.) Index
Top-8 Metros MDKCBHPA 2,26,673 100
Tier 1 >10L 1,30,207 57Tier 2 6-10L 1,09,953 49Tier 3 2-6L 1,02,642 45Tier 4 1-2L 95,739 42
Large Towns 50k-1L 94,878 42Medium Towns 20k-50k 98,703 44Small Towns 10k-20k 98,433 43Very Small Towns <10k 1,00,000 44
Urban India 1,25,187 55
Source: Indicus Analytics Market Skyline of India 2013
The prism of PCI continues to make these cities look like high-volume, low margin territories The nets have to be wider But lets make no mistake, market infrastructure & logistics have grown dramatically over the past decade

But there’s always been a Middle India even in established Metros
7
Pop-Strata Base <75k 75k - 1.5L 1.5L - 3L 3L - 5L 5L - 10L >10L
Metros 100 21% 16% 17% 12% 13% 22%
Tier 1 100 31% 18% 17% 11% 11% 13%
Tier 2 100 35% 18% 17% 10% 10% 10%
Tier 3 100 36% 18% 17% 10% 9% 9%
Tier 4 100 38% 18% 16% 10% 9% 8%
Towns 100 39% 18% 16% 10% 9% 8%
Distribution of Urban HHs by Rs.Income per annum
Source: Indicus Analytics Market Skyline of India 2013
Accounts for just
30% of all Urban HHs
in India
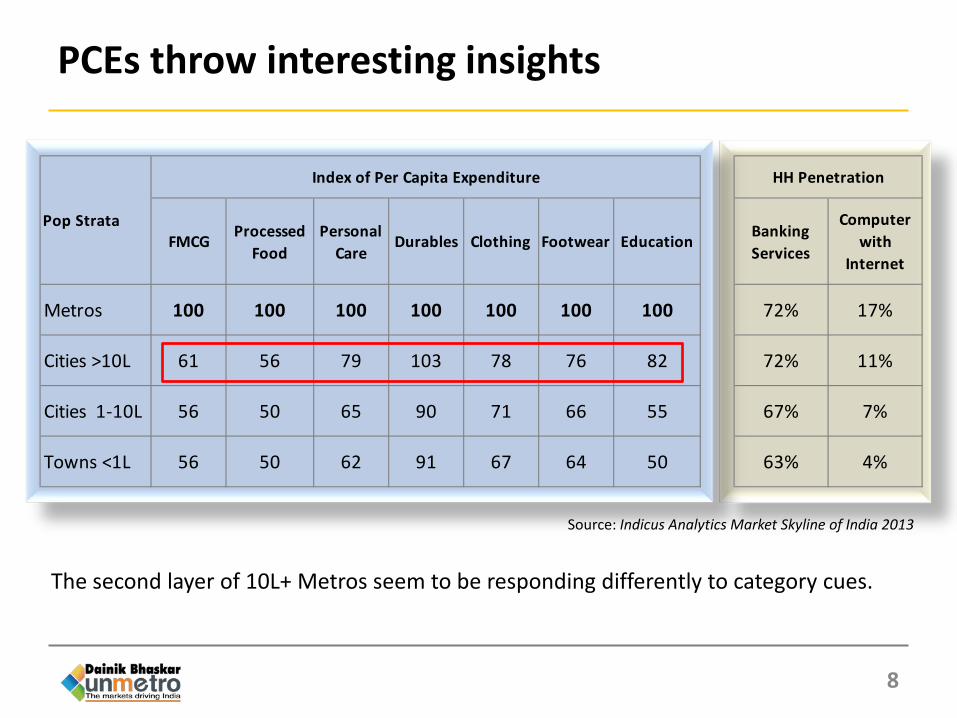
PCEs throw interesting insights
8
FMCG Processed Food
Personal Care
Durables Clothing Footwear Education Banking Services
Computer with
Internet
Metros 100 100 100 100 100 100 100 72% 17%
Cities >10L 61 56 79 103 78 76 82 72% 11%
Cities 1-10L 56 50 65 90 71 66 55 67% 7%
Towns <1L 56 50 62 91 67 64 50 63% 4%
Index of Per Capita Expenditure HH Penetration
Pop Strata
Source: Indicus Analytics Market Skyline of India 2013
The second layer of 10L+ Metros seem to be responding differently to category cues.

Category consumption bases are in place
9
27%
16%
24% 33%
Processed Food Rs. 1,85,931 Crs
Metros Cities >10L Cities 1L-10L Cities <1L
25%
16%
25% 34%
FMCG Rs. 2,92,240 Crs
23%
18%
26% 33%
Personal Care Rs. 31,178 Crs
Source: Indicus Analytics Market Skyline of India 2013
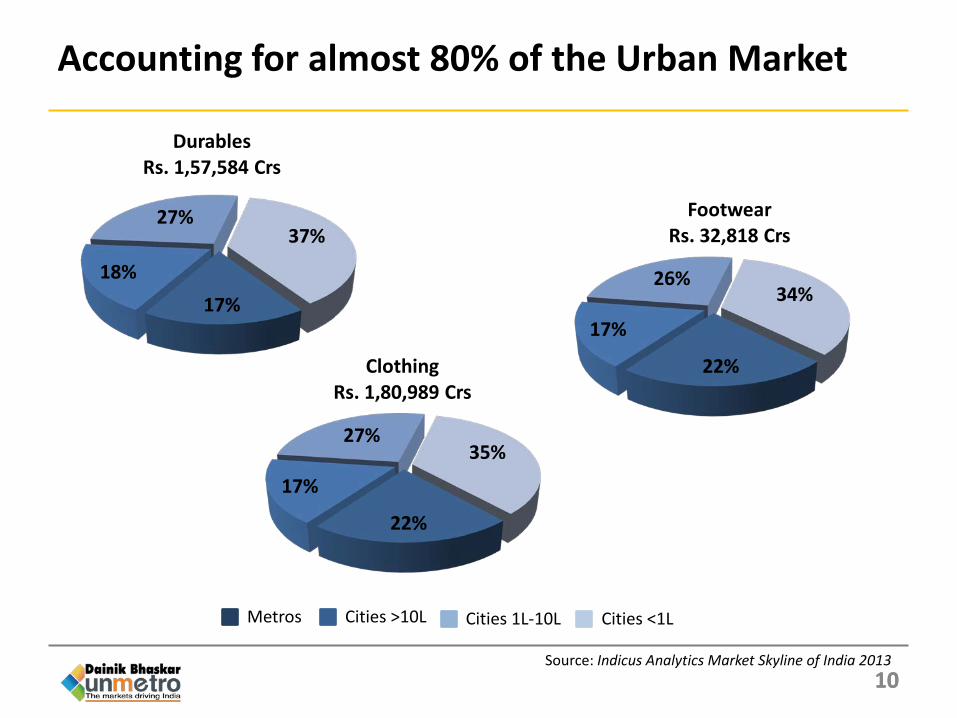
Accounting for almost 80% of the Urban Market
10 10
17% 18%
27% 37%
Durables Rs. 1,57,584 Crs
Metros Cities >10L Cities 1L-10L Cities <1L
22%
17%
27% 35%
Clothing Rs. 1,80,989 Crs
22%
17%
26% 34%
Footwear Rs. 32,818 Crs
Source: Indicus Analytics Market Skyline of India 2013

Consumer essentials are falling in place
11
Metros Cities >10L Cities 1L-10L Cities <1L
18% 18%
29% 35%
HHs Availing Banking Services
25%
21%
24% 30%
Education Rs. 84,062 Crs
35%
22% 25%
18%
HHs Computer with Internet
Source: Indicus Analytics Market Skyline of India 2013

And this is the Real Story of India Unmetro’ed
12
Microwave Ovens
Air Conditioners
Four Wheelers
Computers
Washing Machines
DVD Players
Refrigerators
Two Wheelers
6%
10%
9%
17%
28%
35%
54%
28%
40L+ 10L-40L 1L-10L <1L
40L+ 10-40L 1-10L <1L
Two Wheelers 4% 6% 7% 8%
Refrigerators 7% 9% 9% 12%
DVD Players 17% 18% 18% 23%
Washing Machines 10% 13% 13% 18%
Computers 14% 20% 21% 26%
Four Wheelers 8% 14% 14% 15%
Air Conditioners 12% 21% 21% 23%
Microwave Ovens 14% 28% 28% 31%
DURABLESCAGR 2007 - 2012
PENETRATION 2012
Source: IRS 2008 R1 & 2012 Q4

Lifestyle drivers are in cruise mode
13
Branded Soups
Processed Cheese
Deodorants
Ketchup / Sauces
Instant Noodles
Soft Drinks
Nail Polish
Toilet Cleaners
Shampoos
6%
8%
15%
26%
51%
45%
22%
51%
75%
40L+ 10L-40L 1L-10L <1L
PENETRATION 2012
Source: IRS 2008 R1 & 2012 Q4
40L+ 10-40L 1-10L <1L
Shampoos 5% 7% 6% 6%
Toilet Cleaners 10% 12% 11% 14%
Nail Polish 8% 8% 7% 8%
Soft Drinks 3% 4% 6% 6%
Instant Noodles 14% 23% 21% 24%
Mineral Water 5% 10% 8% 11%
Chocolates 7% 10% 7% 9%
Ketchup / Sauces 7% 13% 13% 14%
Deodorants 16% 22% 14% 17%
Processed Cheese 10% 21% 15% 19%
Branded Soups 17% 27% 21% 18%
FMCGCAGR 2007 - 2012
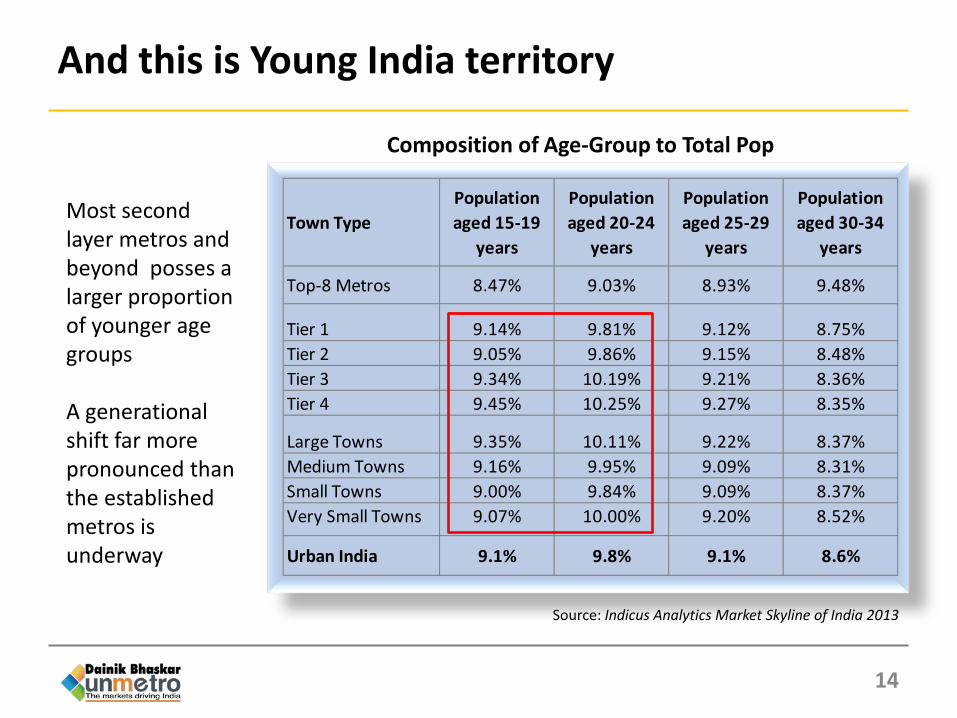
And this is Young India territory
14
Town TypePopulation aged 15-19
years
Population aged 20-24
years
Population aged 25-29
years
Population aged 30-34
years
Top-8 Metros 8.47% 9.03% 8.93% 9.48%
Tier 1 9.14% 9.81% 9.12% 8.75%Tier 2 9.05% 9.86% 9.15% 8.48%Tier 3 9.34% 10.19% 9.21% 8.36%Tier 4 9.45% 10.25% 9.27% 8.35%
Large Towns 9.35% 10.11% 9.22% 8.37%Medium Towns 9.16% 9.95% 9.09% 8.31%Small Towns 9.00% 9.84% 9.09% 8.37%Very Small Towns 9.07% 10.00% 9.20% 8.52%
Urban India 9.1% 9.8% 9.1% 8.6%
Composition of Age-Group to Total Pop
Source: Indicus Analytics Market Skyline of India 2013
Most second layer metros and beyond posses a larger proportion of younger age groups A generational shift far more pronounced than the established metros is underway
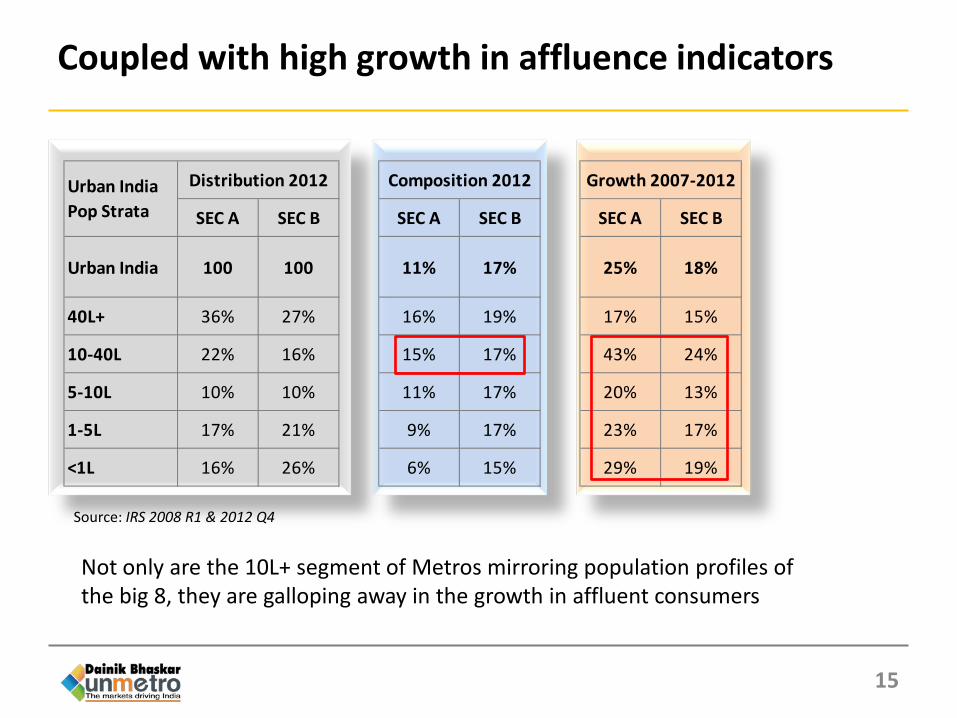
Coupled with high growth in affluence indicators
15
Not only are the 10L+ segment of Metros mirroring population profiles of the big 8, they are galloping away in the growth in affluent consumers
SEC A SEC B SEC A SEC B SEC A SEC B
Urban India 100 100 11% 17% 25% 18%
40L+ 36% 27% 16% 19% 17% 15%
10-40L 22% 16% 15% 17% 43% 24%
5-10L 10% 10% 11% 17% 20% 13%
1-5L 17% 21% 9% 17% 23% 17%
<1L 16% 26% 6% 15% 29% 19%
Urban India Pop Strata
Distribution 2012 Composition 2012 Growth 2007-2012
Source: IRS 2008 R1 & 2012 Q4

An extremely media-mature urban India
16
Source: IRS 2008 R1 & 2012 Q4
0%
25%
50%
75%
100%
C&S AD-TR AD-AIR Radio Internet
40L+ 10L-40L 5L-10L 1L-5L <1L
0%
25%
50%
75%
100%
C&S AD-TR AD-AIR Radio Internet
40L+ 10L-40L 5L-10L 1L-5L <1L
MEDIA REACH - ALL ADULTS MEDIA REACH - SEC A
Traditional media continues to hold fort very strongly across Urban Tiers
AD-TR: Any Daily–Total Readership AD-AIR: Any Daily–Average Issue Readership
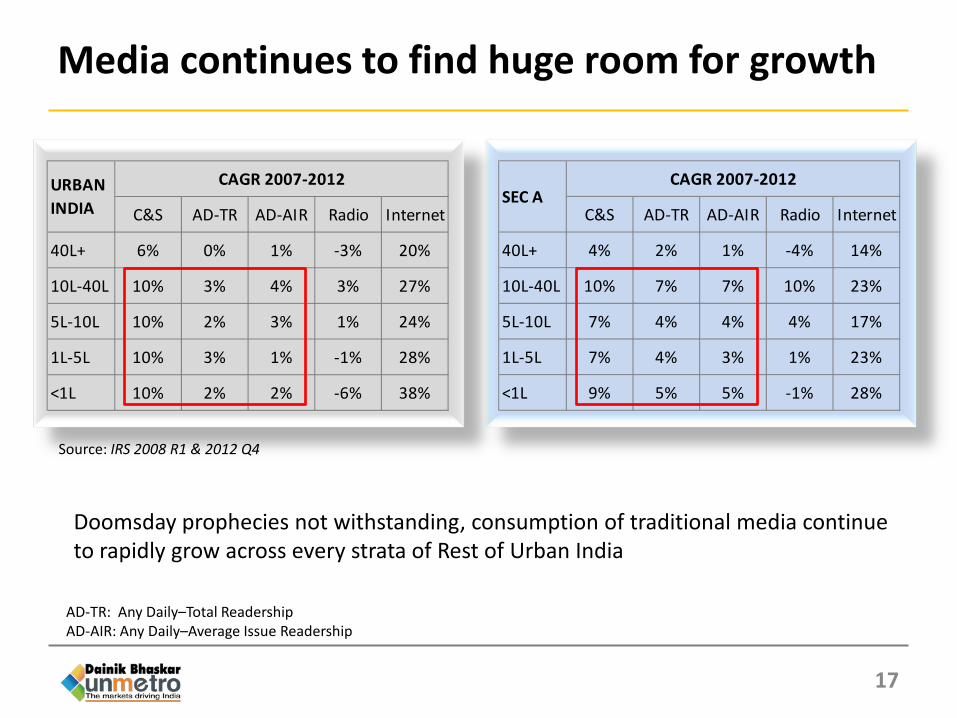
Media continues to find huge room for growth
17
C&S AD-TR AD-AIR Radio Internet
40L+ 6% 0% 1% -3% 20%
10L-40L 10% 3% 4% 3% 27%
5L-10L 10% 2% 3% 1% 24%
1L-5L 10% 3% 1% -1% 28%
<1L 10% 2% 2% -6% 38%
URBAN INDIA
CAGR 2007-2012
C&S AD-TR AD-AIR Radio Internet
40L+ 4% 2% 1% -4% 14%
10L-40L 10% 7% 7% 10% 23%
5L-10L 7% 4% 4% 4% 17%
1L-5L 7% 4% 3% 1% 23%
<1L 9% 5% 5% -1% 28%
SEC ACAGR 2007-2012
Source: IRS 2008 R1 & 2012 Q4
Doomsday prophecies not withstanding, consumption of traditional media continue to rapidly grow across every strata of Rest of Urban India
AD-TR: Any Daily–Total Readership AD-AIR: Any Daily–Average Issue Readership
CONSUMER CLASSIFICATION AND FINALLY A PONDER
18
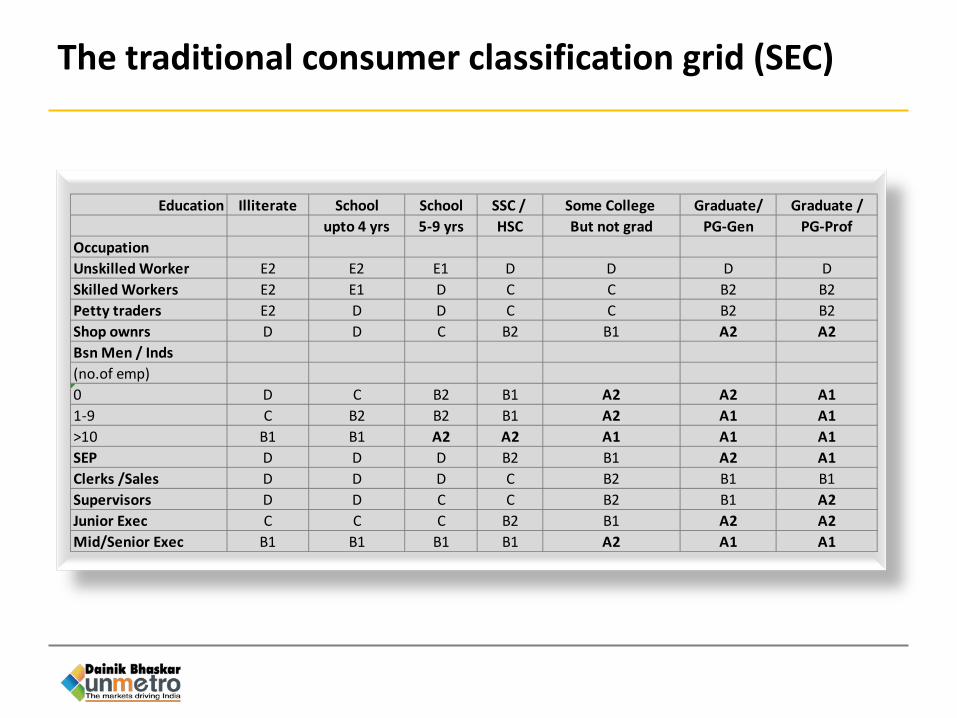
The traditional consumer classification grid (SEC)
Education Illiterate School School SSC / Some College Graduate/ Graduate /upto 4 yrs 5-9 yrs HSC But not grad PG-Gen PG-Prof
OccupationUnskilled Worker E2 E2 E1 D D D DSkilled Workers E2 E1 D C C B2 B2Petty traders E2 D D C C B2 B2Shop ownrs D D C B2 B1 A2 A2Bsn Men / Inds(no.of emp)0 D C B2 B1 A2 A2 A11-9 C B2 B2 B1 A2 A1 A1>10 B1 B1 A2 A2 A1 A1 A1SEP D D D B2 B1 A2 A1Clerks /Sales D D D C B2 B1 B1Supervisors D D C C B2 B1 A2Junior Exec C C C B2 B1 A2 A2Mid/Senior Exec B1 B1 B1 B1 A2 A1 A1
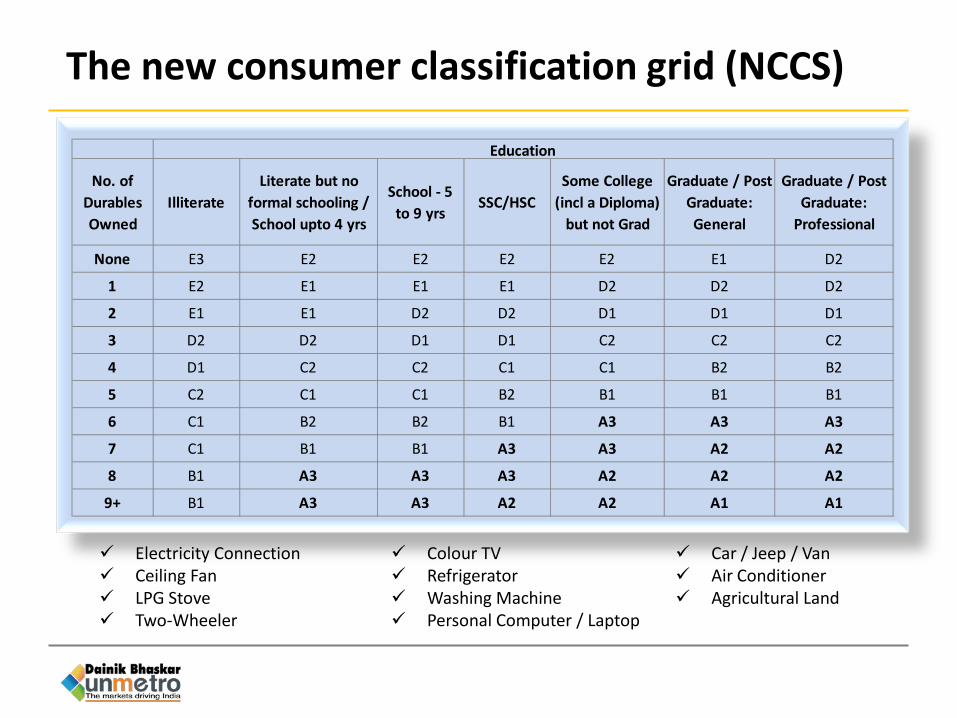
No. of Durables Owned
IlliterateLiterate but no
formal schooling / School upto 4 yrs
School - 5 to 9 yrs
SSC/HSCSome College
(incl a Diploma) but not Grad
Graduate / Post Graduate: General
Graduate / Post Graduate:
Professional
None E3 E2 E2 E2 E2 E1 D2
1 E2 E1 E1 E1 D2 D2 D2
2 E1 E1 D2 D2 D1 D1 D1
3 D2 D2 D1 D1 C2 C2 C2
4 D1 C2 C2 C1 C1 B2 B2
5 C2 C1 C1 B2 B1 B1 B1
6 C1 B2 B2 B1 A3 A3 A3
7 C1 B1 B1 A3 A3 A2 A2
8 B1 A3 A3 A3 A2 A2 A2
9+ B1 A3 A3 A2 A2 A1 A1
Education
Electricity Connection Ceiling Fan LPG Stove Two-Wheeler
Colour TV Refrigerator Washing Machine Personal Computer / Laptop
Car / Jeep / Van Air Conditioner Agricultural Land
The new consumer classification grid (NCCS)

Are we under-estimating the depth of our markets?
21
Source: IRS 2012 Q4
SEC All A1 A2 B1 B2 C D E1 E2 R1 R2 R3 R4
Pop Crs 91.3 1.1 2.1 2.4 2.5 6.1 6.8 3.4 5.0 3.0 9.6 25.8 23.4
Distribution 100 1% 2% 3% 3% 7% 7% 4% 6% 3% 11% 28% 26%
NCCS All A1 A2 A3 B1 B2 C1 C2 D1 D2 E1 E2 E3
Pop Crs 91.3 1.2 2.9 4.8 5.5 6.9 9.6 9.6 11.7 13.0 14.4 8.5 3.2
Distribution 100 1% 3% 5% 6% 8% 11% 10% 13% 14% 16% 9% 3%
The NCCS brings alive the concept of “Middle India” into sharp focus

The problem gets magnified across Urban India
22
The redistribution of affluence segmentation opens up huge possibilities in assessing & monitoring a market
A B C D EPop (Crs) 29.6 3.3 5.0 6.1 6.8 8.4Distribution 100 11% 17% 21% 23% 28%
Pop (Crs) 29.6 6.3 6.4 8.1 6.0 2.6Distribution 100 21% 22% 27% 20% 9%
Urban India
SEC
NCCS
Source: IRS 2012 Q4

NCCS completely turns classification on its head
23
Base-line consumer classification usually has enormous implications in decisions pertaining to entering new markets and the nature of investments to be made
A 42%
B 38%
C 16%
DE 4%
SEC Composition of NCCS-A Urban India
A 83%
B 14%
NCCS Composition of SEC-A Urban India
Source: IRS 2012 Q4

The real rise of Unmetro India
24
A B C D E
40L+ 78% 36% 23% -34% -82%
10L-40L 88% 37% 28% -24% -80%
5L-10L 116% 35% 33% -17% -77%
1L-5L 106% 19% 41% -3% -67%
<1L 118% 25% 38% 9% -57%
URBAN INDIA
NCCS vs SEC Variance
Source: IRS 2012 Q4
Enumerating HH affluence through a more direct metric of Product ownership alters the consumer segment landscape of Urban India
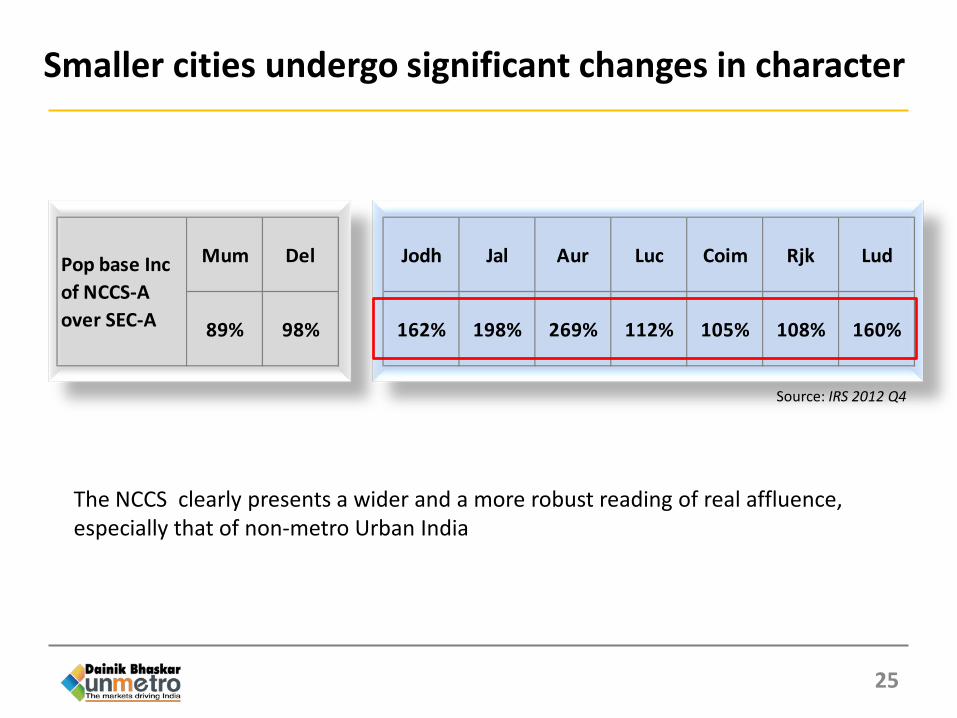
Smaller cities undergo significant changes in character
25
Mum Del Jodh Jal Aur Luc Coim Rjk Lud
89% 98% 162% 198% 269% 112% 105% 108% 160%
Pop base Inc of NCCS-A over SEC-A
Source: IRS 2012 Q4
The NCCS clearly presents a wider and a more robust reading of real affluence, especially that of non-metro Urban India
Thank you
26