the stock market and the financing of corporate growth in ... · importance of internal financing,...
TRANSCRIPT

WP/06/201
The Stock Market and the Financing of Corporate Growth in Africa:
The Case of Ghana
Charles Amo Yartey

© 2006 International Monetary Fund WP/06/201
IMF Working Paper
Research Department
The Stock Market and the Financing of Corporate Growth in Africa: The Case of Ghana
Prepared by Charles Amo Yartey1
Authorized for distribution by Eswar Prasad
September 2006
Abstract
This Working Paper should not be reported as representing the views of the IMF. The views expressed in this Working Paper are those of the author(s) and do not necessarily represent those of the IMF or IMF policy. Working Papers describe research in progress by the author(s) and are published to elicit comments and to further debate.
This paper examines the corporate financing pattern in Ghana. In particular, it investigates whether Singh's theoretically anomalous findings that developing country firms make considerably more use of external finance and new equity issues than developed country firms to finance asset growth hold in the case of Ghana. Replicating Singh’s methodology, our results show that compared with corporations in advanced countries, the average listed Ghanaian firm finances its growth of total assets mainly from short-term debt. The stock market, however, is the most important source of long-term finance for listed Ghanaian firms. Overall, the evidence in this paper suggests that the stock market is a surprisingly important source of finance for funding corporate growth and that stock market development in Ghana has been important. JEL Classification Numbers: G30, G32 Keywords: Stock markets, corporate finance, corporate growth, Ghana Author(s) E-Mail Address: [email protected]
1 The author would like to thank colleagues at the University of Cambridge and the IMF, especially Prof. Ajit Singh, Gianni De Nicoló, Kenichi Ueda, and Giovanni Dell’Ariccia, for useful comments and suggestions. The usual caveat for responsibility still applies.

- 2 -
Contents Page I. Introduction.................................................................................................................. 4 II. Theories of Corporate Finance..................................................................................... 5 A. The Miller-Modigliani Theorem............................................................................. 5 B. Managerial Theory of Investment ........................................................................... 5 C. Asymmetric Information Theory ............................................................................ 5 D. Financial Constraint Theory.................................................................................... 6 III. Corporate Financing Patterns Around the World ........................................................ 6 A. Flows of Funds Versus Balance Sheet Data ........................................................... 6 B. Corporate Financing Patterns in Advanced Countries: Stylized Facts ................... 7 C. Corporate Financing Patterns in Developing Countries.......................................... 7 IV. The Stock Market in Ghana ......................................................................................... 8 A. Historical Development .......................................................................................... 8 B. Main Characteristics................................................................................................ 9 V. Methodology.............................................................................................................. 10 A. Overview of the Ghanaian Corporate Sector ........................................................ 10 B. The Data ................................................................................................................ 11 C. Variables................................................................................................................ 12 VI. Empirical Results ....................................................................................................... 14 A. Testing for Measurement Bias in the Equity Financing Variable......................... 16 B. Reconciliation of the Indirect Method with the Direct Method ............................ 18 VII. The Results in Comparative Perspective ................................................................... 19 VIII. Summary and Conclusions ........................................................................................ 20 Appendix I. Definition of Variables Used in the Analysis ............................................................ 36 References.............................................................................................................................. 39 Figures 1. Sources of Financing of Growth. 1992–96 ................................................................ 22 2. The Size of the Ghana Stock Exchange..................................................................... 22 3. The Liquidity of the Ghana Stock Exchange............................................................. 23 4. Ghana Stock Exchange: Turnover Ratio.................................................................... 23

- 3 -
Tables 1. Net Sources of Finance for the Corporate Sector ...................................................... 24 2. Singh’s 1995 Results: Top Listed Companies in Manufacturing, Mean Proportion of Internal and External Finance of Corporate Growth .......................................... 25 3. Stock Market Development in Selected African Countries, 1996–2002 .................. 25 4. All Non-Financial Listed Companies: Percentile Distribution of Indicators of Corporate Size and Growth..................................................................................... 26 5. All Non-Financial Listed Companies: Percentile Distributions of Indicators of Financing of Corporate Growth.......................................................................... 27 6. All Non-Financial Listed Companies: Percentile Distribution of Indicators of Capital Structure ................................................................................................. 28 7. All Non-Financial Listed Companies: Percentile Distribution of Indicators of Profitability and Stock Market Variables ........................................................... 29 8. All Non-Financial Listed Companies: Percentile Distribution of Changes in the Rates of Return ....................................................................................................... 30 9. Listed Companies: Financing of Corporate Growth: The Direct Method ................. 31 10. Financing of Corporate Growth in Ghana: Reconciliation of the Indirect Method with the Direct Method.............................................................................. 31 11. Zimbabwe: Listed Companies’ Gross Sources of Finance, 1990–99 ........................ 32 12. Developed Markets: Change in Total Assets, by Source of Financing, 1995–2000 .33 13. Emerging Markets: Change in Total Assets, by Source of Financing, 1995–2000... 34 14. Financing of Corporate Growth: Ghana and Other Emerging Markets Compared ( Mean Values, in percent)………………………………………………………...35 Boxes Box 1 Ghana: Banking Sector Profile………………………………………………………..9

- 4 -
I. INTRODUCTION
Over the past few decades the world stock markets have surged and emerging market countries have accounted for a large amount of this boom. The growth of stock markets in emerging markets has reflected the increased demand for such transactions and the lower cost of investing in international financial markets. Although most emerging markets are in Latin America and Asia, recent years have seen a number of new stock markets in African countries such as Ghana, Malawi, Swaziland, Uganda, and Zambia. The establishment of stock markets is expected to promote economic growth and development by increasing the savings rate and increasing the quantity and the quality of investment. At the micro level such effects can be addressed in terms of the impact of the stock market on corporate finance. Strangely enough, the corporate finance contribution of the stock market in developing countries has received little systematic attention in financial and development economics. A pioneering study for the International Finance Corporation by Singh and Hamid (1992) finds that corporations in developing countries finance their growth mainly through external finance and new issues of equity. This result has been used to argue in favor of investing heavily in stock market development in African countries. This paper examines the financing practices of Ghanaian firms based on their balance sheets. In particular, it investigates whether Singh’s theoretically anomalous findings that developing country firms make considerably more use of external finance and new equity issues than developed country firms to finance asset growth also hold in the case of Ghana. To consider the corporate financing contribution of the stock market, we compare the relative importance of internal financing, external debt financing, and external equity financing in explaining the growth of total corporate assets (Glen and Singh, 2003). To put our empirical results in perspective, we compare it with recent works on corporate financing patterns in other developing countries. There are several reasons why it would be interesting to know the prevailing financing patterns in Ghana. First, knowing the financing pattern in Ghana can help policymakers to fully understand how their national financial system functions if they wish to improve its functioning and thereby serve their national business community. Second, corporate investment is an important part of total investment. It is clearly important to understand the financial aspects of the decisions corporations make about investment. The importance of private investment, however, goes beyond its actual weight in the data. With the private sector now carrying a heavy burden in generating economic growth in African countries, it is important to understand the financial mechanisms it can use in shouldering this responsibility. Last, there are links between corporate behavior and macroeconomic stability. Corporations that carry heavy debt burdens can pose a threat to the health of their creditor financial institutions. In addition, high levels of indebtedness can exacerbate macroeconomic instability by increasing the sensitivity of economies to economic shocks (Mayer, 1990).

- 5 -
II. THEORIES OF CORPORATE FINANCE
A. The Miller-Modigliani Theorem
The early neoclassical view of finance was dominated by the Miller-Modigliani theorem. According to this theorem, if firms and investors have the same financial opportunities then under conditions of perfectly competitive financial markets, no asymmetries of information between different agents, and the same tax treatment of different forms of finance, corporate financial policy is irrelevant. The theory established that, the stock market valuation of a firm is based exclusively on the earning prospects of the firm and not on its capital structure. In effect, internal and external finance are viewed as substitutes. Firms could use external finance to smoothen investment when internal finance fluctuates.
B. Managerial Theory of Investment
The fundamental determinant of investment in the managerial theory is the availability of internal finance. Managers are envisaged as pushing investment programs to a point where their marginal rate of return is below the level that would maximize shareholder welfare. In other words, managers indulge in over-investment. For this purpose, internal finance is particularly favored since it bypasses the capital market and is most amenable to managerial desires for growth. Stated differently, professional managers avoid relying on external finance because it would subject them to the discipline of the stock market. In contrast, the level of cash flow is irrelevant for the firm’s investment decisions in neoclassical theory; what matters is the cost of capital.2
C. Asymmetric Information Theory
Myers and Majluf (1984) argued that corporate capital structure is designed to offset inefficiencies in the firm’s investment decisions that are caused by information asymmetries. They show that if managers have information that investors do not have then the market may misprice equity. If firms are required to finance new projects by issuing equity, underpricing may be so severe that new investors may capture more than the net present value of the project resulting in a loss to the existing shareholders. Under this situation positive net present value projects would be rejected. This problem can be avoided if the firm can finance the new project by issuing securities that are not severely undervalued by the market. Internal finance has no such undervaluation and is preferred to debt and equity. This is Myers ‘pecking order’ theory of finance.3
2 The managerial theory can be thought of as being made up of two main approaches—managerial capitalism and agency theory. Baumol (1967) and Marris (1963) are examples of the managerial capitalism approach. The agency cost approach focuses on contracting aspects within the overall framework of the principal-agent model and is associated with Jensen and Meckling (1976).
3The most important empirical implication of the theory is that announcement of an equity issue will lead to a decline in the market value of a firm’s existing shares. Second, new
(continued…)

- 6 -
D. Financial Constraint Theory
Firms generally might finance their investment activities by internal cash flows or external funds. Under the assumption of perfect capital market, it does not matter whether firms finance their investment activities by internal or external funds. There is no financial constraint for profitable investment projects because the adjustment of interest rate would equate supply and demand for funds, in the case of internal funds. However, with capital market imperfection, firms cannot obtain external funds on the same conditions as internal funds. This is especially the case for small businesses or firms in new growth industries, which depend on loans from banks as the only available source of external finance (Gertler and Gilchrist, 1994). These firms are bank dependent because they cannot easily switch to commercial papers or the equity market if there is no available credit. Therefore, the extent and the terms to which external finance is provided affect corporate investment and real economic activity (Greenwald and Stiglitz, 1993).
III. CORPORATE FINANCING PATTERNS AOUND THE WORLD
A. Flows of Funds Versus Balance Sheet Data
As pointed out by Mayer (1988), there are two sources of information for studying aggregate corporate financing patterns in different countries. The first is national flow of funds statement that records flows between different sectors of an economy and between domestic and overseas residents. The second source is company accounts that are constructed on an individual firm basis but are often aggregated or extrapolated to industry or economy levels. Both sources have their advantages as well as limitations.4 Theoretically, flow of funds statistics provide a comprehensive coverage of transactions between sectors because they cover all sectors in the economy, and are collected in ways, that are largely comparable between countries. The problem with flow of funds data is that they capture only flows of funds from one economic sector to another and thereby eliminate entirely intra-sectoral flows. Company accounts are only available for a sample, often quite small, of a country’s corporate sector. However, the data that are employed in company accounts are usually more reliable than flow of funds. More specifically, flows of funds are constructed from a variety of different sources that are rarely consistent. As a result, statistical adjustments are required to reconcile entries. A fundamental distinction between flow of funds statistics and company accounts is that flow of funds only relates to domestic activities while company accounts are constructed on a worldwide basis including foreign subsidiaries. Company accounts are, therefore, more
projects will tend to be financed mainly from internal sources or proceeds of low risk debt issues. Finally, debt-equity ratio increases with the extent of informational asymmetry.
4 See Corbett and Jenkinson (1996) for a comparative discussion of using flow of funds and company accounts.

- 7 -
suitable for analyzing how different countries’ corporate sectors fund themselves, but flow of funds allows the contribution of a domestic sector’s financial system to be identified.
B. Corporate Financing Patterns in Advanced Countries: Stylized Facts
As a starting point, it is useful to note the results of Mayer (1988; 1990) who investigated the corporate financing patterns for Canada, Finland, France, Germany, Japan, Italy, the United Kingdom, and the United States. for the period 1970 to 1985 using the flow of funds accounts of these countries. His general finding is that internal finance is by far the dominant mode of financing in all countries and that financing patterns do not differ very much among countries (Table 1). The implication of Mayer’s conclusion is that there seem not to be a relationship between the financing pattern of firms in a given country and the prevailing corporate governance structures. This conclusion is at odds with the theory of incomplete contracts which exposit a relationship between corporate governance structures and financing patterns (La Porta and others, 1997). Following the methodology of Mayer (1988), Corbett and Jenkinson (1994) examined how investment is financed in Germany, Japan, the United Kingdom, and the United States. They find the overwhelming importance of internal finance in all countries covered in their study. They also find that, compared with Germany, whose financial system is predominantly bank based, bank financing appears to be more important in the United Kingdom and the United States, even though the United Kingdom and the United States are traditionally considered to have a market-based financial system. They summarized their finding by concluding that “the celebrated distinction between the market-based financial pattern of the United Kingdom and the United States and the bank-based pattern of Germany is inaccurate” (p. 85). Hackethal and Schmidt (2000) addressed this puzzle on both methodological and empirical grounds. They demonstrated that the surprising results found by Mayer and others were due to a hidden assumption underlying their methodology. They derived an alternative method of measuring financing patterns, which also uses flow of funds data, but uses gross financial flows instead of net as in the case of Mayer and others. They then applied the measurement concepts to patterns of corporate finance in Germany, Japan, and the United States. Their results indicate that the financial systems of the three countries do indeed differ from one another in a substantial way.
C. Corporate Financing Patterns in Developing Countries
Singh and Hamid (1992) undertook the first major empirical study on corporate financial patterns in developing countries using the company accounts methodology. Their results show that corporations in developing countries use external finance to a far greater extent than firms in advanced countries. Further, in more than half of the countries in their sample, the top corporations used much more equity, rather than debt, to finance the growth in the 1980s. This finding stands in sharp contrast with the financing patterns of corporations in leading advanced countries like France, Japan, and Italy, where corporations traditionally have a relatively greater recourse to external sources of finance. Singh (1995) extended the Singh and Hamid analysis by establishing the robustness of their

- 8 -
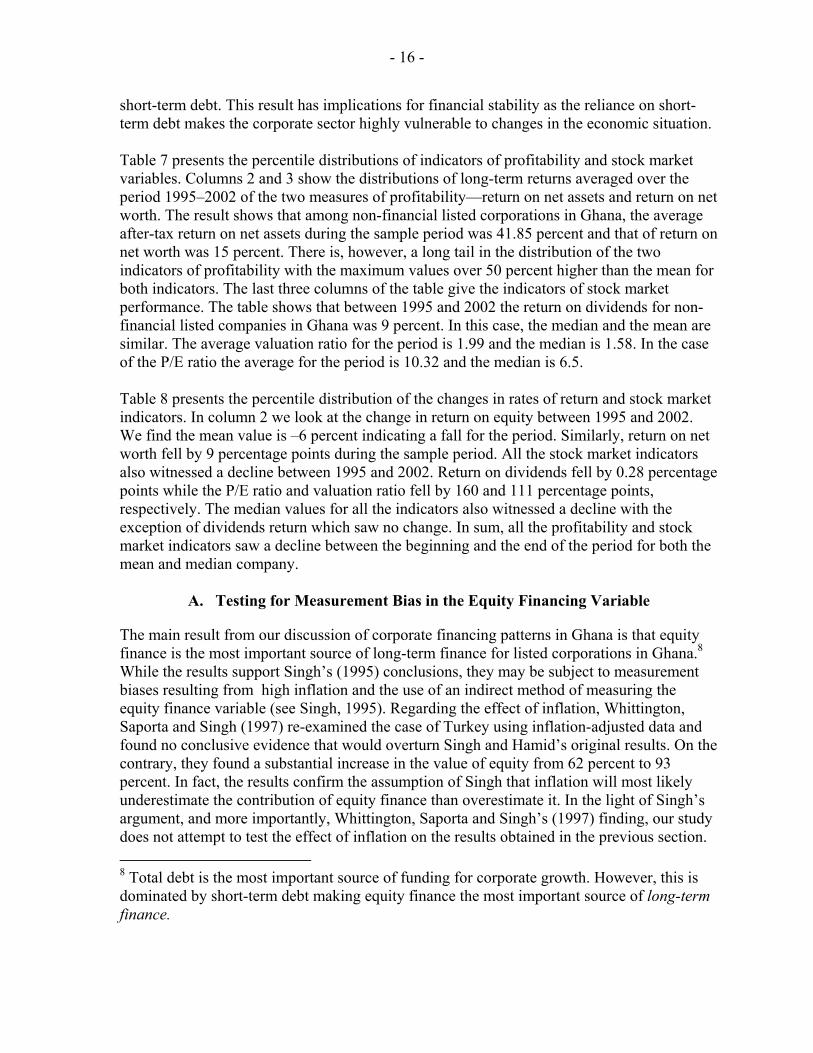
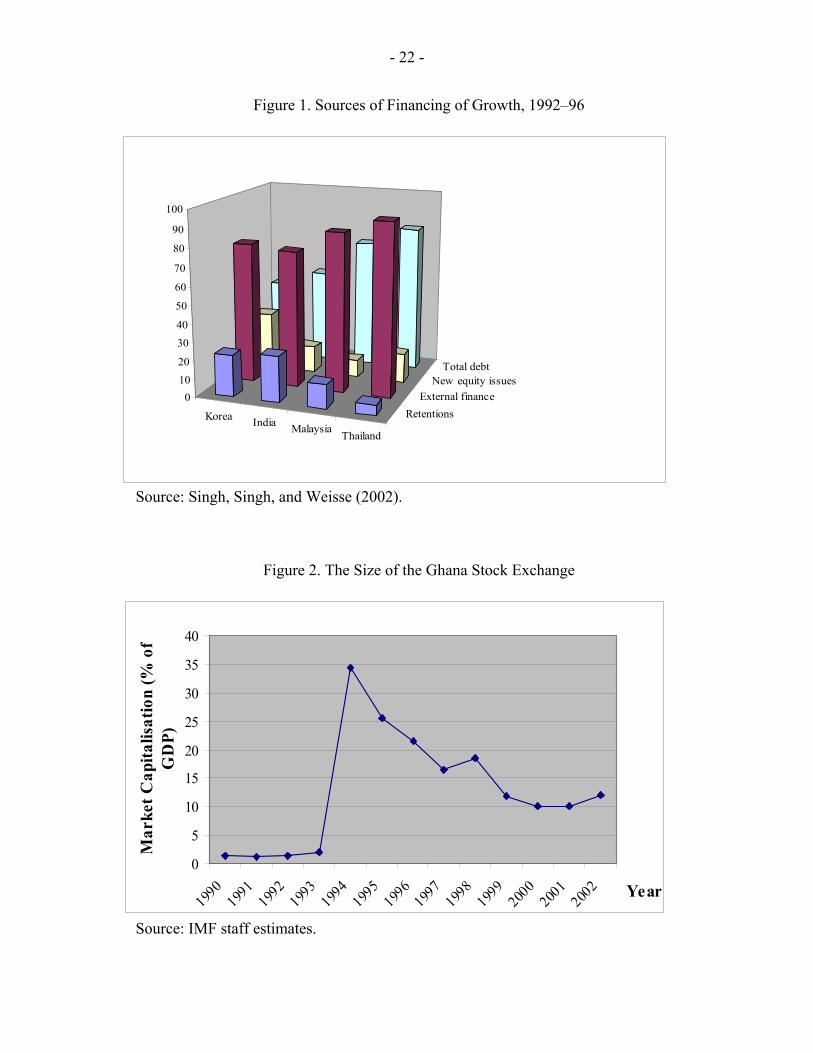
results on much larger corporate samples of each country and providing a more systematic comparison of corporate financial patterns in industrial and semi industrial countries. Singh (1995) concluded that, leaving aside the question of comparison with advanced countries, in absolute terms, the degree of external financing as well as equity financing for the top corporations in developing countries is very high (Table 2). He argued that corporations in developing countries used a large amount of new issues of equity to finance their growth in the 1980s because the relative cost of equity fell significantly as a result of large rises in share prices during the 1980s. This, together with the increase in the cost of debt capital, made equity issues relatively more attractive for financing corporate growth. Singh suggested that once these temporary factors cease to operate, the situation would revert to the normal low levels of equity financing. It is important to emphasize that most of the factors that lead corporations in advanced economies to avoid new equity issues such as asymmetric information apply to developing countries as well. The question then is whether the corporate financing patterns in developing countries changed in the 1990s compared with the 1980s. Singh, Singh, and Weisse (2002) investigated this hypothesis and confirmed the main Singh-Hamid result that developing country firms depend overwhelmingly on external finance to finance their growth. Their results show that in Korea, for example, nearly 95 percent of the total sources of finance consisted of external finance; in Thailand the corresponding figure is 89 percent. In Malaysia and India, it is 75 percent and 80 percent, respectively (Figure 1).
IV. THE STOCK MARKET IN GHANA
A. Historical Development
In principle, stock market development is expect to accelerate economic growth by providing a boost to domestic savings and increasing the quantity and the quality of investment. In particular, stock markets can encourage economic growth by providing an avenue for growing companies to raise capital at lower cost. In addition, companies in countries with developed stock markets are less dependent on bank financing, which can reduce the risk of a credit crunch. Critics of the stock market, however, argue that the actual operation of the pricing and takeover mechanism in well-functioning stock markets lead to short termism and lower rates of long-term investment, particularly in firm-specific human capital. It also generates perverse incentives, rewarding managers for their success in financial engineering rather than creating new wealth through organic growth (Singh, 1997). Early attempts at establishing a stock market in Ghana can be traced as far as 1968 when a government study concluded that the establishment of a stock market was crucial for the economic development of the country. This led to the promulgation of the Stock Market Act of 1971, which resulted in the establishment of the Accra Stock Market Ltd in 1971. However, the idea of establishing a stock market never materialized largely because of the unfavorable political and economic environment and the lack of political will. As part of move towards financial liberalization and deregulation, the Ghana Stock Exchange was established in 1989 as a private company limited by guarantee under the companies’ code of 1963. The exchange was given recognition as an authorized stock market under the Stock

- 9 -
Exchange Act of 1971. Trading began on November 12,1990. The exchange changed its status to a public company limited by guarantee in 1994.
Box 1. Ghana: Banking Sector Profile
The Ghanaian financial system includes a broad range of institutions, with the banking sector accounting for about 75 percent of total financial system assets. The formal financial system has the Bank of Ghana as the head and about 17 banks classified broadly as commercial banks (9), merchant banks (5), and development banks (3). The formal financial system also has a stock market, three discount houses, a social security trust, credit unions, and about 115 rural banks. Ghana’s pension fund, the Social Security and National Insurance Trust (SSNIT), is the second largest component of the financial sector with roughly 15 percent of all financial system assets. The country also has a large number of rural banks. These banks are mainly local banks owned and managed by their respective rural communities. They were established to mobilize savings and extend credit in the rural communities. They account for about 5 percent of the banking system’s assets and about 3–5 percent of total bank deposits.
The total asset of the banking system in 2002 was about 38 percent of GDP including rural banks. The three largest commercial banks account for 55 percent of total banking sector assets, with the state-owned Ghana Commercial Bank (GCB) holding 25 percent. The country has about 309 bank branches (excluding rural banks) of which about 70 percent can be found outside the capital. The government fully owns or has a majority ownership in one of the primary banks and all development banks either directly or through the SSNIT, the Bank of Ghana, or the State Insurance Company. All the merchant banks are privately owned. Foreign investors hold about 53 percent of the shares in eight commercial banks, which is below the sub-Saharan African average.
The level of financial intermediation is low even by sub-Saharan African standard, with modest M2 to GDP ratio at 19 percent. Banks have little appetite for lending to local small and medium-sized enterprises (SME’s) and reach only about 5 percent of the population. Competition appears to be weak due to Ghana Commercial Bank’s dominance in the market. The banking sector has suffered from a period of asset quality deterioration. Nonperforming loans ratio to total loans soared from 11.9 percent in 2000 to 22.7 percent in 2002. Meanwhile, pre-tax return on assets and return on equity (6.8 and 36.9 percent, respectively, in 2002) indicate a very high profitability, owing to a very wide interest margin and very high return from government securities. Source: IMF
B. Main Characteristics
Size To measure the size of the Ghana stock exchange we use the typical index of stock market capitalization to GDP ratio. This ratio is defined as the value of domestic equities traded on the Ghana Stock Exchange relative to GDP. As Figure 2 shows, the stock market was not very important in the first 4 years of its establishment. It was in 1994 that the stock market

- 10 -
capitalization as a proportion of GDP reached a peak of 35 percent very close to the world average of 38.2 percent in the 1990s.This high jump was due to the listing of the Ashanti Goldfields Company on the exchange. On the whole Ghana’s stock market has been relatively small in the 1990s and early 2000s compared with the world average. Liquidity We measure the activity of the stock market using total value traded as a share of GDP, which gives the value of stock transactions relative to the size of the economy. This measure is also used to gauge market liquidity because it measures trading relative to economic activity (Levine and Zervos, 1998). Figure 3 shows that in Ghana, trading activities have been relatively low with a high of just 1.4 percent of GDP. The big jump we see in 1994 was due to the listing of the Ashanti Goldfields Company in 1994. This listing increased the volume of traded shares as well as the value to its highest level in 1994. Since then trading value relative to GDP has been very insignificant. It is far below the world average of 31 percent in the 1990s depicting the very low liquidity of the stock market in Ghana. To clearly understand the liquidity picture, we examine the turnover ratio. The turnover ratio is defined as the ratio of the value of total shares traded and market capitalization. It measures the activity of the stock market relative to its size. The turnover ratio increased between 1991 and 1994. This was the time that stock market activity was very high as more companies became listed and the stock market grew in size. The turnover ratio has been on a downward trend since 1998 (except for a marginal increase in 2000) depicting a decrease in the efficiency of the stock market (Figure 4). Generally, therefore, the Ghana Stock Exchange is relatively illiquid when compared with the average for the rest of the world. This may be explained by the fact the exchange is relatively new having seen only 13 years of trading. It would, therefore, take sometime before the corporate sector clearly appreciates its role in the financing of investments.
V. METHODOLOGY
A. Overview of the Ghanaian Corporate Sector
Corporations in Ghana are either companies registered under the companies code 1963 (Act 179) or established by an Act of parliament. They must be public limited liability companies separate from their owners. The data on corporate ownership in Ghana shows that the largest form of corporate organization is sole proprietorship, with limited liability companies the next largest (Bank of Ghana, 2004). There is a strong government presence, but it is fading very fast with the privatization wave now blowing in the country. The stock market had about 25 listed companies at the end of 2003. Corporations in Ghana operate in several sectors of the economy. The dominance of the agricultural sector in economic activity also reflects somewhat in corporate sector activity as the sector is involved in all activities in the food chain sector. In the mining sector, corporate activity is stronger with many foreign companies operating in the sector. However, only one mining company is listed on the Ghana Stock Exchange. The sector accounted for about 5.32 percent of GDP in 2002. Total manufacturing accounted for about 10 percent of GDP in 2001 with the listed companies representing over 40 percent of the total. Areas in which there

- 11 -
are medium- to large-scale operations include food processing, beverages, wood products, and textiles. The tertiary sector in the Ghanaian economy is large, accounting for 33 percent of GDP. Corporate sector activity is fairly large in all the subsectors. In the wholesale and retail trade subsector, large trading houses such as Unilever, PZ, and CFAO dominate in terms of market shares, although the majority of businesses in this sector are operated on a small scale (Bank of Ghana, 2004). The problem of obtaining information on unlisted firms makes it very difficult to assess how the entire corporate sector finances its growth. This limitation implies that this work does not present a complete picture of the corporate sector and its contribution to growth. It is important to mention, however, that the corporate sector in Ghana is very small in terms of total employment. Of the employment generated by the private sector, the formal private sector employs about 7 percent while the informal sector employs about 93.7 percent (Bank of Ghana, 2004).
B. The Data
This paper is based on a methodology that differs from Singh and Hamid (1992) in the following respects:
• By using total debt as a measure of external finance (debt) instead of long- term debt;
• By including short-term debt as well as trade credit in external sources of finance;
• By analyzing the financing of the growth of total assets;
• By analyzing the maturity structure of corporate debt; and
• By measuring the contribution of equity finance directly.
Our methodology is different from Singh and Hamid because the earlier studies were only concerned with long-term capital employed in the firm, that is the growth of net assets.5 The emphasis in this paper is total capital employed in a firm and hence the financing of the growth of total assets. The sample size is all non-financial listed companies for which data are available for the period 1995 to 2002. This choice was influenced by the fact that in developing countries such as Ghana, reliable and accurate corporate data are available only for the big corporations.
5 The problem with the Singh-Hamid methodology is that no role was given to short-term liabilities such as trade credits and short-term bank loans. These sources of finance may be very important in developing countries. Our methodology is broadly similar to that of Glen and Singh (2003).

- 12 -
C. Variables
The indicators used in this paper can be divided into four broad groups:
1. Firm size and measures of corporate performance 2. Financing of corporate growth: retention ratio and internal and external financing of
growth. 3. Corporate capital structures: measures of leverage 4. Stock market valuation and dividend return
Company size and measures of performance Size This study uses the book value of total assets of the company as a measure of size. Three indicators of size are used in the analysis: opening size, closing size, and average size. Opening size is the size of the company at the beginning of the period or the first year for which data are available. Closing size is size of the company at the end of the period. Average size is the arithmetic average of the mid-year assets during the whole period, where mid-year assets are calculated on the assumption that the average change in assets from one balance sheet to the next is linear.
Growth For each company growth is measured by the annual rates of growth of total assets and sales over the whole period. Growth is measured in nominal terms and can be affected by inflation.
Profitability This is a key test of how companies use their resources to generate revenue. Two indicators of corporate profitability are used in this analysis: return on net assets and return on net worth. Long-term values of the indicators (measured over the period) as well as changes from the beginning to the end of the period are calculated. Return on net worth measures the rate of return on common stockholder’s investment. Return on net assets measures the return on net assets after interest and taxes.
Financing of growth The financing of growth variables provide information on the financing of corporate growth and on corporate retentions. Four indicators are used: retention ratio, internal finance, external finance, and change in internal finance. Retention ratio Retention ratio measures the proportion of after-tax profits that corporations in Ghana retain. Since historic cost accounting tends to overstate profit in periods of high inflation, this variable will also tend to have an upward bias in these situations.
Internal finance of growth This variable measures the proportion of corporate growth of total assets over the period that has been financed by retained earnings. Since total assets are measured after depreciation, depreciation is not included in the internal sources of finance.

- 13 -
External financing of growth These variables measure the proportion of corporate growth over the whole period that has been financed by external sources namely new equity issues and total debt. According to the basic accounting identity of the sources and uses of funds, the total growth of total assets should equal the sum of internal and external sources of financing growth and, therefore, the three internal and external financing ratios should add up to one.
Change in internal finance This variable measures how the proportion of the growth of total corporate assets financed by retentions has changed from the beginning (1995–1996) to the end of the period (2001–2002). Corporate capital structures The most commonly used measure of the degree to which a company is exposed to debt is the debt equity ratio. Lenders in setting a firm’s borrowing requirements often use this measure. Lenders look to equity or owner-supplied funds to provide a margin of safety, so the higher the proportion of the total capital that was provided by stockholders, the less the risk face by creditors. Four indicators of capital structure are used: total debt equity ratio, long-term debt equity ratio, short-term debt equity ratio, and short-term debt as a proportion of total debt (debt maturity).
Stock market indicators The last group of variables is based on stock market data and includes price-earnings ratio, valuation ratio, and return on dividends. In addition to the long-term values of the indicators, changes from the beginning to the end of the period have been calculated. Price/earnings (P/E) ratio Price-earnings ratio is defined as share price divided by earnings per share. The higher the P/E ratio the greater the confidence investors have in the future prospects and performance of the company. A high P/E ratio indicates investors have confidence that the company will maintain and probably improve its current performance in the coming year. Valuation ratio This measure expresses the stock market valuation of the firm’s equity as a proportion of the book value of its equity assets. If assets are correctly measured by the accountant according to the economist’s criteria, that is, at current replacement cost, the denominator of the valuation ratio is an indicator of the economic resources available to the firm. The numerator, on the other hand, represents the market’s valuation of the firm as a going concern under existing management. Return on Dividends This measure expresses dividends as a proportion of the firm’s net worth. It is different from dividend yield, which is defined as dividends per share divided by market price per share. Long-term values of this variable as well as changes from the beginning to the end of the period have been calculated.

- 14 -
VI. EMPIRICAL RESULTS
Table 4 presents the percentile distributions for the indicators of corporate size and growth for all non-financial listed companies in Ghana from 1995–2002. In column 5 we report the distribution of firm size measured by the book value of a company’s total assets averaged over the period 1995–2002. The distribution is highly skewed with the mean more than 232,607 million cedis greater than the median.6 Even though we are examining all non-financial listed companies, the range of firm size is very wide. The smallest firm has average total assets of 1119 million cedis while 25 percent of firms have average size of 9861 million cedis. The maximum, which is the last percentile, is the value of average total assets for the largest listed company—4221247 million, which is over 428 times that of the 25th percentile. Columns 2 and 3 provide information on opening and closing total assets for the listed corporation during the period. If we examine the difference between the mean values of closing and opening assets, we could see that between the period 1995 and 2002 the average total assets of our sample of firms increased by about 471064 million cedis. Columns 6 and 7 present the percentile distribution of corporate growth for the period 1995–2002. We find that the average growth of total assets was 27 percent, which is very close to the median value of 25 percent. If we examine the growth of turnover, we see that the average growth of turnover for our sample of firms during the sample period was 44 percent. This is higher than that of total assets growth. In this case the mean is very different from the median. These growth rates are measured in nominal terms and must be set against the inflation rate for the period, which is 29 percent. The distribution of the growth variables is much more regular than that of size with the mean for both variables relatively close to the median. As companies expand through the acquisition of assets they have choices to make in how that growth is financed. Past earnings can be retained as a source of internal finance or be paid to shareholders as dividends. External sources of finance include both the issuance of new equity (external equity) and various debt instruments (external debt). Using the growth in the balance sheet over the period 1995 to 2002 as the sample period, the financing of the growth in total assets is divided into these three categories expressed as a percentage of change in total assets for the period. The means of these three ratios should sum up to 100 percent. Table 5 presents the percentile distributions of the indicators of the financing of corporate growth in Ghana. The table presents information on both the financing of growth and the proportion of profits that Ghanaian firms retain. Column 2 gives information on after-tax retention ratio. The average listed company in Ghana retains about 77 percent of after-tax profit. This figure is higher than that reported by Singh (1995) for developing countries with the exception of Brazil. Singh (1995) reports values of 98, 68, 66, and 62 percent for Brazil, India, Pakistan, and Zimbabwe, respectively. The column also shows a wide difference between the mean and the median indicating the existence of extreme abnormal values. We, therefore, focus on the median because in situations of the existence of extreme values it is a 6 The average exchange rate for the period is $1 =3803.72 cedis.

- 15 -
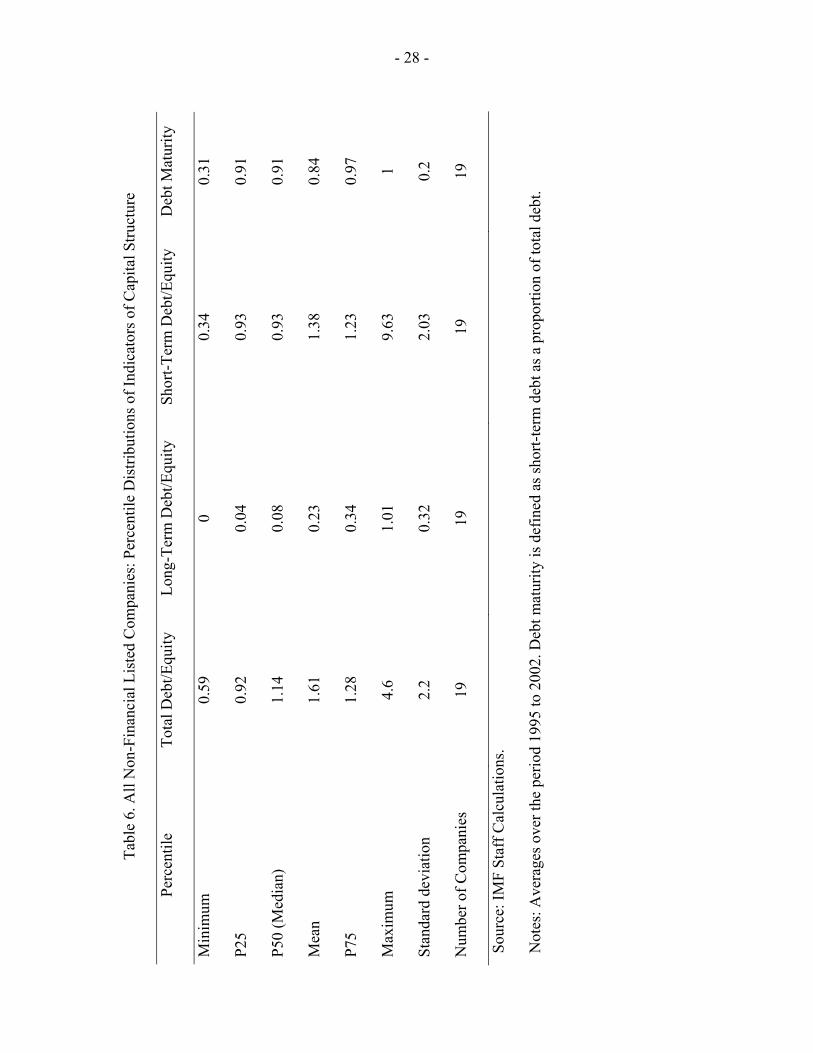
better measure of central tendency. The median quoted Ghanaian firm retains about 48 percent of post tax profit. Columns 3, 4, and 5 provide information on how listed companies in Ghana finance their growth. It shows that between 1995 and 2002 the average listed Ghanaian firm financed about 12 percent of growth of total assets from internal sources. External debt, however, financed 48 percent of the growth of total assets and new issues of equity financed 41 percent of the growth in total assets. It is important to mention that the accounting identity that the total internal and external sources of finance should add up to one only holds for the mean and not for nonalgebraic measures like the median and the percentiles. Further, external debt ratio of more than 100 percent implies that the firm has grown entirely from external debt and has been able to retire some of its equity. If we look at the median, we find that Ghanaian firms finance 23 percent of growth of total assets from internal sources, about 48 percent from external debt, and 33 percent from new equity issues. The last column of the table shows that the degree of internal financing has increased by about 79 percent between 1995 and 2002. The main result that emerges from Table 5 is that compared with corporations in advanced countries, the average Ghanaian firm finances its growth of total assets from external sources (specifically, external debt and equity) and, therefore, relies to a much smaller extent on internal sources (retentions). This result is very similar to Singh (1995) results for other developing countries. For instance, Singh (1995) finds that top Turkish corporations finance about 75 percent of their growth from external sources and rely less on internal finance. For Korea, Singh (1995) finds that corporations finance about 80 percent of their growth of net assets from external sources and the remaining 20 percent from internal sources. Table 6 looks at the percentile distribution of indicators of capital structure for listed firms in Ghana. Distributions of long-term values of capital structure consisting of total debt equity ratio, long-term debt equity ratio, short-term debt equity ratio, and short-term debt divided by total debt (also known as debt maturity) are presented. The mean values of the indicators of capital structure are higher than the median indicating a high skewness of these variables. The main result from this table is that the average total debt equity ratio is about 161 percent indicating a high level of leverage for listed corporations in Ghana. Both the median and the mean values of the ratio of total debt to total equity are over 100 percent. This is roughly similar to similarly defined leverage ratio for quoted companies in other developing countries.7 The last column provides information on the maturity structure of corporate debt in Ghana. As we can see, about 84 percent of the total debt comes from short-term sources. Given the fact that total debt is the most important source of finance for listed corporations, this result implies that corporations in Ghana are financing the long-term growth of total assets from 7 The average total debt equity ratios for the period 1980–1997 for other emerging market countries is 1.62 for Argentina, 1.01 for Brazil, 1.73 for Chile, 1.54 for South Africa, and 1.62 for Nigeria. (See Agarwal and Mohtadi, 2004 for details).
- 16 -
short-term debt. This result has implications for financial stability as the reliance on short- term debt makes the corporate sector highly vulnerable to changes in the economic situation. Table 7 presents the percentile distributions of indicators of profitability and stock market variables. Columns 2 and 3 show the distributions of long-term returns averaged over the period 1995–2002 of the two measures of profitability—return on net assets and return on net worth. The result shows that among non-financial listed corporations in Ghana, the average after-tax return on net assets during the sample period was 41.85 percent and that of return on net worth was 15 percent. There is, however, a long tail in the distribution of the two indicators of profitability with the maximum values over 50 percent higher than the mean for both indicators. The last three columns of the table give the indicators of stock market performance. The table shows that between 1995 and 2002 the return on dividends for non-financial listed companies in Ghana was 9 percent. In this case, the median and the mean are similar. The average valuation ratio for the period is 1.99 and the median is 1.58. In the case of the P/E ratio the average for the period is 10.32 and the median is 6.5. Table 8 presents the percentile distribution of the changes in rates of return and stock market indicators. In column 2 we look at the change in return on equity between 1995 and 2002. We find the mean value is –6 percent indicating a fall for the period. Similarly, return on net worth fell by 9 percentage points during the sample period. All the stock market indicators also witnessed a decline between 1995 and 2002. Return on dividends fell by 0.28 percentage points while the P/E ratio and valuation ratio fell by 160 and 111 percentage points, respectively. The median values for all the indicators also witnessed a decline with the exception of dividends return which saw no change. In sum, all the profitability and stock market indicators saw a decline between the beginning and the end of the period for both the mean and median company.
A. Testing for Measurement Bias in the Equity Financing Variable
The main result from our discussion of corporate financing patterns in Ghana is that equity finance is the most important source of long-term finance for listed corporations in Ghana.8 While the results support Singh’s (1995) conclusions, they may be subject to measurement biases resulting from high inflation and the use of an indirect method of measuring the equity finance variable (see Singh, 1995). Regarding the effect of inflation, Whittington, Saporta and Singh (1997) re-examined the case of Turkey using inflation-adjusted data and found no conclusive evidence that would overturn Singh and Hamid’s original results. On the contrary, they found a substantial increase in the value of equity from 62 percent to 93 percent. In fact, the results confirm the assumption of Singh that inflation will most likely underestimate the contribution of equity finance than overestimate it. In the light of Singh’s argument, and more importantly, Whittington, Saporta and Singh’s (1997) finding, our study does not attempt to test the effect of inflation on the results obtained in the previous section. 8 Total debt is the most important source of funding for corporate growth. However, this is dominated by short-term debt making equity finance the most important source of long-term finance.

- 17 -
Additionally, such an exercise requires knowledge of specific information about the depreciation policies, life of assets etc., which we do not have on hand. Thus, we prefer to focus on the second and potentially more important source of measurement bias, which is the indirect method of computing equity finance. As already mentioned, this paper uses a variant of the Singh-Hamid methodology to measure the contribution of equity finance to total assets growth. More specifically, equity finance was measured as a residual from the accounting identity which makes the growth of external finance, the latter being decomposed into total debt and equity. The growth of internal finance was measured by retained profits from the profit and loss accounts and the growth of total debt was proxied by the growth of total liabilities. Thus, the contribution of equity finance was computed as 1- retained earnings-total debt. One potential effect of the residual estimation of the equity financing variable is that it is likely to have an upward bias due to the fact that revaluations and reserves may get included in the equity variable (Singh, 1995). We investigate whether, in the case of Ghana, the indirect method introduced any significant bias. The investigation requires a more direct approach for measuring the contribution of equity finance. This was possible in our study since we could gather relevant information on all new equity issues during the study period. We computed the contribution of new equity finance as follows: for each company under consideration, we computed the amount of new equity raised (change in equity) every year throughout the study period, as well as the corresponding increase in total assets (change in total assets). The contribution of equity finance to total asset growth was measured as follows:
External finance of growth (equity) =
m
p 1m
p 1
( Equity)
( TotalAssets)
+
+
∆
∆
∑
∑
Following Whittington, Saporta and Singh (1997), in this alternative method, the equity finance variable is measured independently while the internal finance variable is made the residual. It should be noted that Whittington, Saporta and Singh (1997) investigated the quantitative significance of the measurement bias for three of the ten countries examined by Singh (1995) namely Malaysia, Korea, and Turkey and found that the residual method overstated the contribution of equity finance by 8 percentage points in the case of Malaysia, 9 percentage points for Korea, and 28 percentage points in the case of Turkey. However, the authors argue that the order of magnitude of these overstatements is not significant enough to overturn the main findings of Singh and Hamid (1992) that equity finance was used to a considerable extent in financing the growth of corporate assets. Table 9 presents the result of the direct method of measuring equity. We focus on the median because it is a better measure of central tendency. The table shows that the contribution of equity to total assets growth for the median listed Ghanaian firm is now 12.20. Internal finance is now the second most important source of finance after total liabilities. A comparison with the indirect method shows that the indirect method overstated the contribution of equity to total assets growth by 20.85 percentage points (33.05–12.20). In

- 18 -
Mauritius, Lallchand (2001) finds that the residual method overstated the contribution of external equity by 28.9 percentage points. Thus, the finding that in Ghana, Mauritius, and Turkey, the residual method has considerably overstated the contribution of equity finance raises the question whether the results of the other countries studied by Singh (1995) would have been significantly different, had a more direct approach of measuring equity finance been used. Whittington, Saporta and Singh (1997) argue that though the residual method introduces an upward bias, this is likely to be offset by the downward bias resulting from inflation. However, this paper argues that these two issues should be treated separately. In 6 out of the 10 countries studied by Singh (1995), the inflation rate was not very substantial. Thus, in these countries, one would not a priori expect to find a substantial downward bias stemming from inflation. Whether the upward bias resulting from the use of the residual method would have been offset by this inflation induced downward biases remains to be empirically investigated.
B. Reconciliation of the Indirect Method with the Direct Method
Having found a significant difference in the outcomes of the two methods in the case of Ghana, we next attempt to reconcile the two results. More specifically, we attempt to find out which elements included by the residual method in the equity finance variable should have been housed elsewhere. For this exercise, we require details about the changes in the individual components of the liabilities reported in the balance sheets of each firm studied. Furthermore, we require that the information be available for each of the years. Fortunately, much of the information was readily available from the accounts of all the nonfinancial listed companies. We found that the major source of the upward bias in the indirect method is the treatment of reserves as equity. Reserves financed 13 percent of the growth of total assets between 1995 and 2002 (Table 10). The question then is whether reserves can be considered as part of the shareholders’ equity. For practical reasons, it is more appropriate to count any revaluation and reserves in retained earnings and hence in internal finance (with the exception of share premium). Also, it is a fact that retained profits are a constituent of shareholders’ funds, after all, retained profits and reserves belong to the shareholders and thus are part of the shareholders fund. To sum up, the primary issue in this study is whether Ghanaian firms have made substantial use of the stock market. If we consider only the use of new equity issues, then clearly the Ghana Stock Exchange’s role in financing growth has been limited. Thus, the main finding of the study is that new equity issues have been less important in financing corporate growth in Ghana. Nonetheless, one should appreciate the fact that despite the highly inefficient and volatile feature of the Ghana Stock Exchange, 12 percent of contribution of equity finance is still considerably higher than the average of 2–3 percent found in developed countries by Mayer (1990). It is also higher than Glen and Singh’s (2003) finding for Germany, the Netherlands, Ireland, and Japan (see Table 12). This suggests that compared with stock markets in advanced countries, the Ghana Stock Exchange has been a more important source of finance for the corporate sector.

- 19 -
VII. THE RESULTS IN COMPARATIVE PERSPECTIVE
To put the results for Ghana in perspective, we compare it with the result of recent works on corporate financing patterns in other developing countries. Mutenheri and Green (2003) analyzed the patterns of corporate financing in Zimbabwe for the period 1990–1999 using company accounts data. The results show that external finance contributed 75.4 percent of total funds and internal finance provided the remaining 25 percent (Table 11). Short-term finance accounted for 51.8 percent of external funds with long-term finance contributing the remaining 23.6 percent. Mutenheri and Green (2003) also found interesting differences among the different components of long-term finance. Equity financing was the most important source of long-term finance at 7.8 percent. Long-term bank loans and bonds were each a very minor component of total external financing. It is interesting to compare the results of Mutenheri and Green (2003) with other similar studies. Singh and Hamid (1992) and Singh (1995) examined the financing patterns in Zimbabwe for the period 1980–89. Exceptionally among the countries they studied, their data suggested that internal finance was more important than external finance in Zimbabwe. Mutenheri and Green’s results suggest that Zimbabwean companies relied more heavily on external finance and are therefore more consistent with other countries studied by Singh and Hamid. The difference between Mutenheri and Green’s study and that of Singh and Hamid are more likely to be due to the different time periods studied than to the different methodologies, as the Singh method tends to produce a higher share of external financing than that of Mutenheri and Green. In South Africa, Glen and Singh (2003) find that liabilities accounted for 61 percent of total financing for the period 1996 to 2000. Retained earnings and external equity financed 21 and 18 percent respectively of total assets growth (Table 13). In Mauritius, Lallchand (2001) finds that quoted Mauritian firms rely more on external finance to finance assets growth. In particular, external finance accounted for about 70 percent of total growth for the period 1992 to 1999. How does the corporate financing pattern in Ghana compare with other African countries? Our results show that corporate financing pattern in Ghana is broadly similar to the pattern observed for other African countries. We can summarize the main similarities and differences in the corporate financing patterns in Ghana, Mauritius, South Africa, and Zimbabwe as follows (Table 14):
• In all of these countries, listed corporations rely much more on external finance to finance asset growth than internal finance. The average external finance ratio is 77.5 percent in Ghana, 70 percent in Mauritius, 79 percent in South Africa, and 75.4 percent in Zimbabwe. Other emerging market countries like Korea, India, Malaysia, and Thailand have a higher reliance on external finance. In Thailand, for instance, corporations rely almost entirely (94.3 percent) on external finance to fund assets growth (see Figure 1).
• In Ghana, Mauritius, South Africa, and Zimbabwe, external debt is the most important source of external finance. In particular, the contribution of external

- 20 -
debt to total assets growth is 49 percent in Ghana, 61 percent in Mauritius, 71 percent in South Africa, and about 68 percent in Zimbabwe.
• New equity issues is surprisingly a significant source of finance for quoted African corporations. It ranges from 7.8 percent in Zimbabwe to about 19 percent in South Africa. The median value for Ghanaian corporations is 12 percent. The contribution of equity finance to total asset growth is broadly similar to the pattern we observe for other emerging markets. The corresponding figures for other emerging markets are 31.2 percent in Korea, 14.6 percent in India, 9.6 percent in Malaysia, and 16.1 percent in Thailand. These values are well above the figure attributed to new share issues in advanced countries by Mayer (1990) and Corbett and Jenkinson (1994) (see Table 1).
Globally, Glen and Singh (2003) find that liabilities accounted for 49 percent of total financing over the period 1996 to 2000. Of the remaining 51 percent, internal equity represented 29 percent, with external equity representing 22 percent (see Tables 12 and 13). Glen and Singh (2003) also found substantial differences in the pattern across advanced and developing countries and across individual countries. First, the use of liabilities to finance growth was much lower in emerging market group, with that lower level offset by higher levels of both internal and external equity. Glen and Singh (2003) argued that in interpreting these financing ratios it is the relative amount of capital being raised from the various sources that should be considered. They found that between 1996 and 2000 the rate of growth, measured in dollars, was actually lower in the emerging market group than the developed market group. The average of the country growth rates was 18 percent in the emerging market group compared with 28 percent in the developed market group. They, therefore, argued that the emerging market group had less growth to finance, which might explain its ability to finance more of that growth in the equity markets.
VIII. SUMMARY AND CONCLUSIONS
This paper has examined the financing practices of Ghanaian firms based on their balance sheets. In particular, it investigated whether Singh’s theoretically anomalous findings that developing country firms make considerably more use of external finance and new equity issues than developed country firms to finance asset growth also hold in the case of Ghana. The main result that emerged from our analysis is that compared with corporations in advanced countries, the average quoted Ghanaian firm finances a large proportion of its growth of total assets from external sources and therefore relies to a much smaller extent on internal finance. Overall, the evidence in this study suggests that the stock market plays an important role in providing finance for Ghanaian firms. This result challenges theoretical predictions given that information and agency problems are more severe for Ghanaian firms than for corporations in advanced countries. The results also show that Ghanaian companies have debt equity ratios broadly similar to similarly defined leverage ratio for listed companies in other developing countries. Our examination of the debt maturity showed that about 84 percent of total debt is short term. Given the fact that total debt is the most important source of finance for quoted corporations,

- 21 -
this result implies that corporations are financing long-term growth of total assets from short-term sources. Even though short-term financing is cheaper than long-term financing, they are riskier for a number of reasons. First, if a firm borrows on a long-term basis, its interest costs will be relatively stable over time, but if it uses short-term loans its interest expense will fluctuate widely, at times going quite high. Second, if a firm borrows heavily on a short-term basis, a temporary recession may render it unable to repay this debt. If the firm is in a weak financial position, lenders may not extend the loan, which could force the firm into bankruptcy. Thus, the results from the paper has important implications for financial stability as higher ratio of short-term debt to total debt makes the corporate sector highly vulnerable to changes in economic conditions and may increase the economy wide impact of a financial crisis. Therefore, policymakers in Ghana should take appropriate steps to lengthen the maturity structure of corporate debt. Although the results may be regarded as country specific, they nevertheless raise broad issues that merit policy discussion. The first is the important role of total external debt in financing growth in African countries. This was observed in both Ghana and Zimbabwe and is true for most African countries. This finding suggests that policy makers may need to spend more time on the development of the financial system. However, it could also mean that policies that reduce the riskiness of the environment within which emerging market firms operate could accomplish the same goal (Glen and Singh, 2003). What do these results imply for the issue of stock market development in African countries? The results suggest that the stock market has played a great role in financing the growth of large Ghanaian corporation and that stock market development in Ghana has been important. However, the shortcomings inherent in a stock-market-based system require us to examine whether the economy as whole has benefited through, for example, greater aggregate savings and investment or increased productivity of investment. There is little systematic evidence on this issue for African countries.
- 22 -
Figure 1. Sources of Financing of Growth, 1992–96
Korea India Malaysia Thailand
RetentionsExternal finance
New equity issuesTotal debt
010
20
30
40
50
60
70
80
90
100
Source: Singh, Singh, and Weisse (2002).
Figure 2. The Size of the Ghana Stock Exchange
0
5
10
15
20
25
30
35
40
1990
1991
1992
1993
1994
1995
1996
1997
1998
1999
2000
2001
2002 Year
Mar
ket C
apita
lisat
ion
(% o
fG
DP)
Source: IMF staff estimates.

- 23 -
Figure 3. The Liquidity of the Ghana Stock Exchange
0
0.2
0.4
0.6
0.8
1
1.2
1.4
1.6
1990
1991
1992
1993
1994
1995
1996
1997
1998
1999
2000
2001
2002 Year
Val
ue T
rade
d (%
of G
DP)
Source: IMF staff estimates.
Figure 4. Ghana Stock Exchange: Turnover Ratio (In percent)
0
1
2
3
4
5
6
7
8
1990
1991
1992
1993
1994
1995
1996
1997
1998
1999
2000
2001
2002 Year
Tur
nove
r R
atio
Source: IMF staff estimates.

- 24 -
Table 1. Net Sources of Finance for the Corporate Sector (Percentage of Physical Investment)
(a) 1970–1985 Canada Finland France Italy
Retentions 76.4 64.4 61.4 51.9
Capital transfers 0 0.2 2.0 7.7
Short-term securities -0.8 3.7 -0.1 -1.3
Loans 15.2 28.1 37.3 27.7
Trade credit -4.4 -1.4 -0.6 0
Bonds 8.5 2.8 1.6 1.6
Shares 2.5 -0.1 6.3 8.2
Other 1.3 7.4 -1.4 1.0
Statistical adjustments 1.2 -5.0 -6.4 3.2
(b) 1970–1989 Germany Japan UK U.S.
Internal finance 80.6 69.3 97.3 91.3
Bank finance 11.0 30.5 19.5 16.6
Bonds -0.6 4.7 3.5 17.1
New equity 0.9 3.7 -10.4 -8.8
Trade credit -1.9 -8.1 -1.4 -3.7
Capital transfers 8.5 - 2.5 -
Other 1.5 -0.1 -2.9 -3.8
Statistical adjustment 0.0 0.0 -8.0 -8.7
Source: Mayer (1990, Table 12.3) for ( a); and Corbett and Jenkinson (1994, Table 3) for (b). Notes: The figures in panel (a) refer to the average annual ratios of each source and that of (b) refer to period ratios.

- 25 -
Table 2. Singh’s 1995 Results: Top Listed Companies in Manufacturing, Mean Proportion of Internal and External Finance of Corporate Growth
(In percent)
Country/Source Internal Finance Equity Long Term Debt Korea 19.5 49.6 30.9 Pakistan 74.0 1.7 24.3 Jordan 66.3 22.1 11.6 Thailand 27.7 NA NA Mexico 24.4 66.6 9.0 India 40.5 19.6 39.9 Turkey 15.3 65.1 19.6 Malaysia 35.6 46.6 17.8 Zimbabwe 58.0 38.8 3.2
Brazil 56.4 36.0 7.7 All 38.8 39.3 20.8
Source: Singh (1995). Extracted from Table C-5. Table 3. Stock Market Development in Selected African Countries, 1996–2002
Country
Market Capitalization (% of GDP)
Number of Listed
Companies
Value Traded
(% of GDP)
Turnover Ratio (%)
Botswana 16.28 14 1.02 2.16 Côte d'Ivoire 11.11 36 0.29 3.82 Egypt 28.06 897 7.13 29.71 Ghana 14.77 22 0.42 3.59 Kenya 14.95 57 0.65 1.36 Mauritius 35.61 40 2.23 4.32 Morocco 33.77 52 3.59 10.49 Namibia 13.21 13 0.63 4.34 Nigeria 9.56 189 0.52 5.97 South Africa 148.15 623 44.97 29.35 Swaziland 15.27 6 4.52 34.20 Tanzania 2.92 4 0.15 2.90 Zambia 9.25 8 0.39 7.10 Zimbabwe 42.70 68 6.25 14.55 Argentina 35.21 130 5.12 11.99 Brazil 32.87 497 17.38 56.70 India 30.88 5883 45.88 85.00 Mexico 27.82 187 9.30 33.95 Malaysia 163.74 737 86.04 45.23 Thailand 34.15 410 23.94 70.31
Source: World Development Indicators and IMF Staff Calculations. Notes: Averages over the period 1996–2002.

- 26 -
Tabl
e 4.
All
Non
-Fin
anci
al L
iste
d C
ompa
nies
: Per
cent
ile D
istri
butio
ns o
f Ind
icat
ors o
f Cor
pora
te S
ize
and
Gro
wth
Perc
entil
e O
peni
ng
Tota
l Ass
ets
Clo
sing
To
tal A
sset
s A
ggre
gate
To
tal A
sset
s A
vera
ge
Tota
l Ass
ets
Tota
l Ass
ets
Gro
wth
(P
erce
nt)
Turn
over
G
row
th
(Per
cent
) M
inim
um
P25
1343
.60
2737
.59
3149
. 67
1353
5.73
7830
.17
6902
9.98
1118
.60
9861
.42
1.22
19.1
3
23.3
3
25.9
2
P50
(Med
ian)
11
533
8616
0. 6
6 32
3774
.5
4625
3.5
25.1
2 33
.66
Mea
n 82
021.
84
5530
85.4
19
4093
8 27
8860
.8
27.3
6 43
.93
P75
2872
3 19
4275
66
0303
10
0659
.7
28. 6
6 66
.39
Max
imum
28
5528
.7
8337
638
2950
0000
07
4221
247
99.3
0 3.
43
Stan
dard
dev
iatio
n 28
5528
.7
1889
570
6699
965
9568
22.9
19
.75
308.
22
No.
of c
ompa
nies
19
19
19
19
19
19
So
urce
: IM
F St
aff C
alcu
latio
ns
N
otes
: Ave
rage
s ove
r the
who
le p
erio
d 19
95 to
200
2. C
orpo
rate
size
indi
cato
rs a
re in
mill
ions
of c
edis
. Ave
rage
exc
hang
e ra
te fo
r th
e pe
riod
is 1
US$
=380
3.72
ced
is

- 27 -
Tabl
e 5.
All
Non
-Fin
anci
al L
iste
d C
ompa
nies
: Per
cent
ile D
istri
butio
ns o
f Ind
icat
ors o
f Fin
anci
ng o
f Cor
pora
te G
row
th
(In
perc
ent)
Pe
rcen
tile
Ret
entio
n R
atio
In
tern
al F
inan
ce
Exte
rnal
Deb
t (T
otal
Deb
t) Ex
tern
al F
inan
ce
(Equ
ity)
Cha
nge
in In
tern
al F
inan
ce
Min
imum
-3
6.62
-9
0.96
-5
3.46
-2
7.99
-1
200.
22
P25
33.0
3 -1
0.96
15
.77
7.07
-1
42.9
0
P50
(Med
ian)
47
.97
23.1
4 48
.41
33.0
5 5.
57
Mea
n 77
.02
11.4
5 47
.86
40.6
8 91
.33
P75
77.2
7 35
.48
58.8
2 77
.02
79.2
6
Max
imum
48
6.68
39
.52
218.
94
127.
85
4456
.12
Stan
dard
dev
iatio
n 10
8.03
32
.95
52.5
8 42
.11
1128
.69
Num
ber o
f com
pani
es
19
19
19
19
19
So
urce
: IM
F St
aff C
alcu
latio
ns.
N
otes
: Ave
rage
s ove
r the
per
iod
1995
to 2
002.
Cha
nge
in in
tern
al fi
nanc
e is
mea
sure
d as
per
cent
age
poin
t cha
nges
from
199
5–96
an
d 20
01–0
2.
- 28 -
Tabl
e 6.
All
Non
-Fin
anci
al L
iste
d C
ompa
nies
: Per
cent
ile D
istri
butio
ns o
f Ind
icat
ors o
f Cap
ital S
truct
ure
Pe
rcen
tile
To
tal D
ebt/E
quity
Lo
ng-T
erm
Deb
t/Equ
ity
Shor
t-Ter
m D
ebt/E
quity
D
ebt M
atur
ity
Min
imum
0.
59
0 0.
34
0.31
P25
0.92
0.
04
0.93
0.
91
P50
(Med
ian)
1.
14
0.08
0.
93
0.91
Mea
n 1.
61
0.23
1.
38
0.84
P75
1.28
0.
34
1.23
0.
97
Max
imum
4.
6 1.
01
9.63
1
Stan
dard
dev
iatio
n 2.
2 0.
32
2.03
0.
2
Num
ber o
f Com
pani
es
19
19
19
19
So
urce
: IM
F St
aff C
alcu
latio
ns.
N
otes
: Ave
rage
s ove
r the
per
iod
1995
to 2
002.
Deb
t mat
urity
is d
efin
ed a
s sho
rt-te
rm d
ebt a
s a p
ropo
rtion
of t
otal
deb
t.

- 29 -
Tabl
e 7.
All
Non
-Fin
anci
al L
iste
d C
ompa
nies
: Per
cent
ile D
istri
butio
ns o
f Ind
icat
ors o
f Pro
fitab
ility
and
Sto
ck M
arke
t Var
iabl
es
Pe
rcen
tile
Ret
urn
on N
et
(In
perc
ent)
Ret
urn
on N
et W
orth
(I
n pe
rcen
t) D
ivid
end
Ret
urn
(In
perc
ent)
Val
uatio
n R
atio
P/
E R
atio
P25
0.17
1.
1 11
0.
73
4.03
P50
(Med
ian)
22
.33
20.3
5 5.
08
1.58
6.
5
P75
38.0
9 37
.08
14.1
7 2.
11
11.2
0
Mea
n 41
.85
15.0
4 8.
5 1.
99
10.3
2
Stan
dard
dev
iatio
n 10
3.51
27
.35
8.77
1.
96
9.85
Min
imum
-2
4.15
-7
0.39
0
0.36
2.
38
Max
imum
46
0 52
.43
31
7.65
36
.45
Num
ber o
f com
pani
es
19
19
19
19
19
So
urce
: IM
F St
aff C
alcu
latio
ns.
N
otes
: Ave
rage
s ove
r the
per
iod
1995
to 2
002.

- 30 -
Tabl
e 8.
All
Non
-Fin
anci
al L
iste
d C
ompa
nies
: Per
cent
ile D
istri
butio
n of
Cha
nges
in th
e R
ates
of R
etur
n (I
n pe
rcen
t)
Perc
entil
e C
hang
e in
Ret
urn
on N
et A
sset
s C
hang
e in
Ret
urn
on N
et W
orth
C
hang
e in
Div
iden
d R
etur
n C
hang
e in
PE
Rat
io
Cha
nge
in
Val
uatio
n R
atio
P2
5 -3
.48
-10.
64
-5.2
4 -8
59.1
7 -1
63.4
7
P50
(Med
ian)
-1
.52
-21.
42
0 -5
2.70
-1
1.48
P75
12.0
6 6.
85
3.60
27
4.48
88
.32
Mea
n -6
.10
-8.5
1 -0
.28
-160
.16
-111
.72
Stan
dard
Dev
iatio
n 33
.45
26.4
8 13
.49
1590
.64
410.
16
Min
imum
-1
22.3
7 -9
1.18
-4
1.84
-4
486.
17
-119
9.85
Max
imum
31
.89
19.9
6 28
.11
2576
.36
494.
00
No.
of C
ompa
nies
19
19
19
19
19
So
urce
: IM
F St
aff C
alcu
latio
ns.
N
otes
: Cha
nges
in th
e ra
tes o
f ret
urn
are
mea
sure
d by
the
diffe
renc
e be
twee
n sh
ort-t
erm
rate
s and
beg
inni
ng ra
tes o
f ret
urn.
Sho
rt-te
rm ra
tes o
f ret
urn
are
for t
he la
st tw
o pe
riods
usu
ally
200
1 an
d 20
02. B
egin
ning
rate
s of r
etur
n ar
e ca
lcul
ated
usi
ng v
alue
s for
the
first
tw
o pe
riods
usu
ally
199
5 an
d 19
96. C
hang
es in
the
rate
s of r
etur
n ar
e m
easu
red
as p
erce
ntag
e po
int c
hang
es.

- 31 -
Table 9. Listed Companies: Financing of Corporate Growth: The Direct Method (In percent)
Internal Finance External Finance
(Total Debt) External Equity
Minimum -208.94 -53.45 -0.013.44
P25 16.12 37.11 2.50
Median 37.97 48.41 12.20
Mean 22.53 47.86 27.99
P75 45.97 58.82 40.73
Maximum 135.36 218.94 117.37
Standard Deviation 64.59 52.06 36.74
Source: IMF Staff Calculations.
Table 10. Financing of Corporate Growth in Ghana: Reconciliation of the Indirect Method with the Direct Method
(Mean Values, in percent)
Short Term Debt 40.20
Long Term Debt 7.66
New Equity Issue 27.99
Retained Earnings 11.45
Reserves 12.70
Total 100
Source: IMF Staff Calculations. Note: Reserves include share capital, share premium, revaluation, etc.

- 32 -
Tabl
e 11
. Zim
babw
e: L
iste
d C
ompa
nies
’ Gro
ss S
ourc
es o
f Fin
ance
, 199
0–99
(5
2 co
mpa
nies
, in
perc
ent o
f tot
al fi
nanc
ing)
19
90
1991
19
92
1993
19
94
1995
19
96
1997
19
98
1999
19
90–9
9 In
tern
al fi
nanc
e 16
.3
17.8
17
.7
19.7
28
.7
22.9
19
.9
17.9
25
.3
32.8
24
.6
Ret
aine
d in
com
e 9.
4 12
10
.9
12.9
22
14
.1
12
10.9
18
.5
25.8
17
.5
Dep
reci
atio
n 6.
9 5.
8 6.
8 -
- -
- -
- -
7.1
Exte
rnal
fina
nce
83.7
82
.2
82.3
80
.3
71.3
77
.1
80.1
82
.1
74.7
67
.2
75.4
Lo
ng-te
rm fi
nanc
e 29
.8
37.4
32
26
.4
24.9
29
.3
30.8
34
.6
15.4
14
.9
23.6
Eq
uity
fina
nce
8.8
17.6
6.
4 7.
9 7
7.6
9.5
20.5
2.
7 2.
8 7.
8 B
onds
0.
9 2.
7 1
0.2
0.2
1.6
0.7
1.8
1.1
0.7
1 B
ank
loan
s 2.
6 2
1.3
2.1
0.9
0.3
1.7
1.8
1.1
0.5
1.2
Fore
ign
loan
s 3
2.7
2.1
3.2
11.9
10
.3
8.9
4.7
2 3.
8 5
Fina
nce
leas
e 0
0 0
0 0
1.3
1 0.
4 2.
4 0.
4 0.
9 H
ire p
urch
ase
0.1
0 0
0 0
0 1
0 2
0.3
0.6
Oth
er so
urce
s 14
.4
12.4
21
.2
12.9
4.
8 8.
2 7.
9 5.
3 4.
1 6.
3 7.
2
Sh
ort-t
erm
fina
nce
53.9
44
.8
50.3
54
46
.4
47.8
49
.3
47.6
59
.3
52.3
51
.8
Ban
k ov
erdr
aft
8.5
8.6
14.7
8.
8 8.
8 8.
7 6.
2 7.
4 11
.5
9.5
9.3
Ban
k ac
cept
ance
2.
6 1.
3 1.
7 2.
6 2.
2 1.
2 3.
2 2.
7 4.
1 1.
3 2.
4 Tr
ade
cred
it 27
.3
18.5
24
.1
27.1
22
.7
23.7
25
.7
23.9
35
.5
29.3
27
.8
Oth
er sh
ort-t
erm
sour
ces
15.4
16
.4
9.8
15.5
12
.7
14.3
14
.2
13.6
8.
2 12
.2
12.2
Sour
ce: M
uten
heri
and
Gre
en (2
003)
. Ext
ract
ed fr
om T
able
1.

- 33 -
Table 12. Developed Markets: Change in Total Assets, by Source of Financing, 1995–2000
Country Liabilities External Equity Internal Equity Australia 58 32 11
Austria 52 3 45
Belgium 56 6 38
Bermuda 41 23 36
Canada 56 32 12
Cayman Islands 90 8 2
Denmark 72 6 23
Finland 53 26 22
France 61 7 31
Germany 62 5 33
Greece 52 34 14
Ireland 76 5 18
Italy 68 5 27
Japan 62 6 32
Netherlands 65 9 26
Norway 50 23 27
Singapore 66 15 19
Spain 68 -9 40
Sweden 57 4 39
Switzerland 54 7 39
United Kingdom 52 21 27
United States 47 21 32
Group average 53 17 30
Source: Glen and Singh (2003). Extracted from Table 14–11.
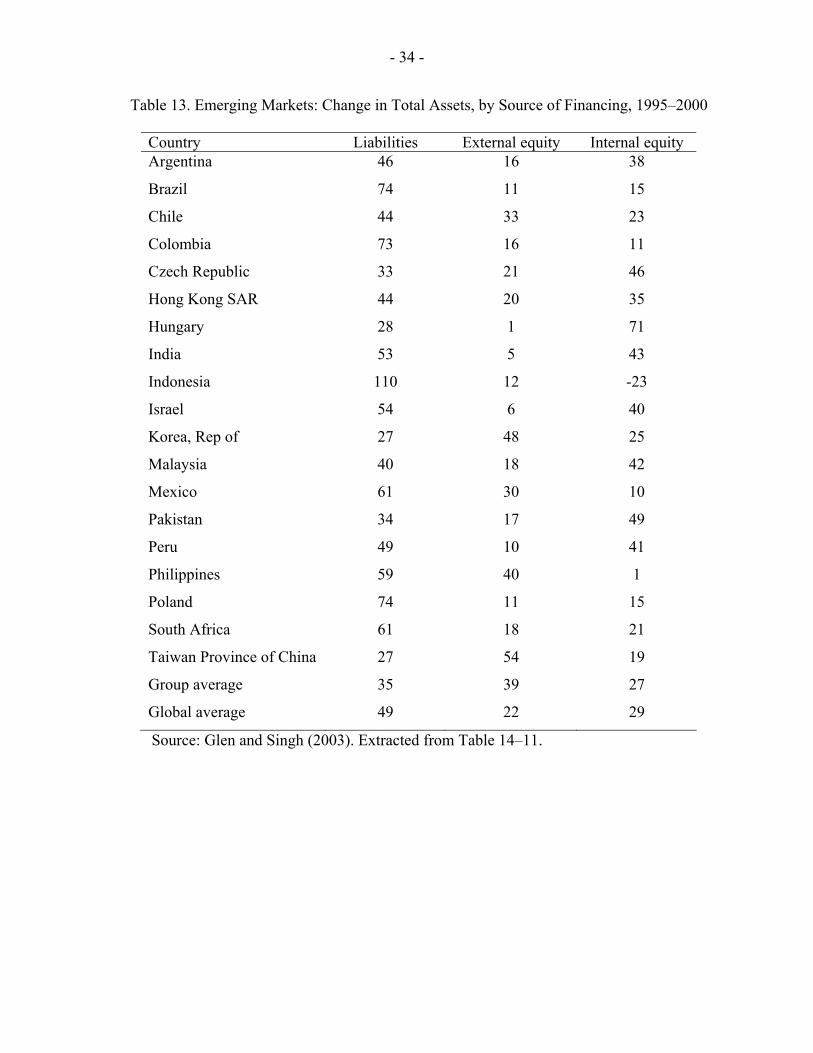
- 34 -
Table 13. Emerging Markets: Change in Total Assets, by Source of Financing, 1995–2000
Country Liabilities External equity Internal equity Argentina 46 16 38
Brazil 74 11 15
Chile 44 33 23
Colombia 73 16 11
Czech Republic 33 21 46
Hong Kong SAR 44 20 35
Hungary 28 1 71
India 53 5 43
Indonesia 110 12 -23
Israel 54 6 40
Korea, Rep of 27 48 25
Malaysia 40 18 42
Mexico 61 30 10
Pakistan 34 17 49
Peru 49 10 41
Philippines 59 40 1
Poland 74 11 15
South Africa 61 18 21
Taiwan Province of China 27 54 19
Group average 35 39 27
Global average 49 22 29
Source: Glen and Singh (2003). Extracted from Table 14–11.

- 35 -
Table 14. Financing of Corporate Growth: Ghana and Other Emerging Markets Compared (Mean Values, in percent)
Country Retentions External Finance External Equity
Total Debt
Korea/1 23.10 76.90 31.20 43.30
India/1 25.30 74.70 14.60 51
Malaysia/1 13.30 86.70 9.60 70.80
Thailand/1 5.70 94.30 16.10 80.60
Ghana/2 22.50 77.50 12.20 48.40
Mauritus/3 30 70 9 61
South Africa/4 21 79 18 61
Zimbabwe/5 24.60 75.40 7.80 67.60
1/ Singh, Singh and Weisse (2002) for the period 1992–1996. 2/ Median values for external equity and total debt. 3/ Lallchand (2001) for the period 1992–1999. 4/ Glen and Singh (2003) for the period 1996–2000. 5/ Mutenheri and Green (2003) for the period 1990–1999.

- 36 - APPENDIX I
APPENDIX I. DEFINITION OF VARIABLES USED IN THE ANALYSIS
p =First year of period
m =Last year of period
n =Number of years in the period
1. Net Assets=Total Assets less current liabilities
2. Opening Assets= (Total Assets) p
3. Closing Assets= (Total Assets) m
4. Aggregate Total Assets: m -1
p+1
1 1(T otal A ssets)p+ (T otal A ssets)m + (T otal A ssets)2 2 ∑
5. Aggregate Net Worth: m-1
p+1
1 1(Net worth)p+ (Net worth)m+ (Net worth)2 2 ∑
6. Average Total Assets: (Aggregate Total Assets)
(n-1)
7. Total Assets Growth:
1n(Total Assets)m 1
(Total Assets)p⎛ ⎞
−⎜ ⎟⎝ ⎠
8. Return on Net Assets:
m
p 1EBT
AggregateNetAssets+∑
9. Return on Net Worth:
m
p+1Profit After Tax
Aggregate Net Worth
∑
10. Retention Ratio:
m
pm
p
(EAT DIV)
(EBT)
−∑
∑
11. Internal Finance of Growth:
m
p 1m
p 1
(Re tainedEarnings)
( TotalAssets)
+
+∆
∑
∑

- 37 - APPENDIX I
12. External Finance of Growth (Total Debt):
m
p 1m
p 1
( TotalDebts)
( TotalAssets)
+
+
∆
∆
∑
∑
13. External Finance of Growth (Equity): (1-Internal Finance-External Finance)
14. Change in Internal Finance: (Short Term Internal Finance) minus (Beginning internal finance) 15. Leverage:
Total Debt-Equity Ratio:
m
pm
p
(TotalDebts)
(ShareholdersFund)
∑
∑
Long Term Debt-Equity Ratio:
m
pm
p
(LongTermDebts)
(ShareholdersFund)
∑
∑
Short Term Debt-Equity Ratio:
m
pm
p
(ShortTermDebts)
(ShareholdersFund)
∑
∑
16. Debt Maturity:
m
pm
p
(ShortTermDebts)
(TotalDebts)
∑
∑
17. Price-Earning Ratio:
m
pm
p
(AverageShare Pr ice)
(EarningsPerShare)
∑
∑
18. Valuation Ratio:
m
pm
p
(MarketCapitalisation)
(ShareholdersFund)
∑
∑

- 38 - APPENDIX I
19. Dividend Return:
m
p 1(Dividends)
AggregateNetWorth+∑

- 39 -
REFERENCES
Agarwal, S. and H. Mohtadi (2004), “Financial Markets and the Financing Choice of Firms: Evidence from Developing Countries,” Global Finance Journal, Vol. 15(1),
pp. 52–70.
Bank of Ghana (2004), “Assessment of Corporate Sector Performance,” Sector Study Reports, Accra: Bank of Ghana
Baumol, W. J., 1967, Business Behavior, Value, and Growth (New York: Macmillan). Beck and others, 2002, “Financing Patterns Around the World: The Role of Institutions,”
World Bank Policy Research Working Paper, No. 2905, (Washington: World Bank). _______, 2000, “A New Database on the Structure and Development of the Financial
Sector,” The World Bank Economic Review, Vol. 14, pp. 597–605 (Washington: World Bank).
Booth and others, 2001, “Capital Structures in Developing Countries,” Journal of Finance
Vol. 56, pp. 87–130. Brennan, M., and A. Kraus, 1987, “Efficient Financing Under Asymmetric Information,”
Journal of Finance, Vol. 42, pp. 1225–1243. Carlin, W., and Mayer, C. (1999), “Finance, Investment and Growth,” CEPR Discussion
Paper, No. 2233 (London: Centre for Economic Policy Research). Cobham, D., and R. Subramaniam, 1995, “Corporate Finance in Developing Countries: New
Evidence for India,” Discussion Paper Series, No. 9512 (St. Andrews: Department of Economics, University of St. Andrews).
Corbett, J., and Jenkinson, T., 1996, “The Financing of Industry, 1970–89: An International
Comparison,” Journal of Japanese and International Economies, Vol. 10, pp.71–96. ———, 1997, “How is Investment Financed? A Study of Germany, Japan, The
United Kingdom, and the United States,” The Manchester School Economic and Social Studies, Vol. 60, No. 1, pp.69–93.
Demirguc-Kunt, A. and R. Levine, 1996, “Stock Markets, Corporate Finance, and Economic
Growth: An Overview,” The World Bank Economic Review, Vol. 10, No. 2, pp. 223–239 (Washington: World Bank).
Donaldson, M., 1981, Corporate Debt Capacity, Boston: Harvard Graduate School of
Business.

- 40 -
Edwards, J., 1987, “Recent Developments in the Theory of Corporate Finance,” Oxford Review of Economic Policy, Vol. 3, No. 4, pp. 1–12.
Fazzari, S., 1993, “Monetary Policy, Financial Structure and Investment,” in Transforming
the US Financial System, ed. by Gary Dymski and others (Armonk: M.E. Sharpe). Fazzari, S., and others, 1988, “Financing Constraints and Corporate Investment,” Brookings
Papers on Economic Activity, Vol. 1, pp. 141–195. Gertler, M., and A. Rose, 1991, “Finance, Growth, and Public Policy,” World Bank Working
Paper No. 814 (Washington: World Bank). Gertler, M., and S. Gilchrist, 1994, “Monetary Policy, Business Cycles and the Behaviour of Small Manufacturing Firms,” Quarterly Journal of Economics, Vol.109, pp. 309–40. Glen, J., and B. Pinto, 1994, “Debt or Equity? How Firms in Developing Countries Choose,”
IFC Discussion Paper No. 22 (Washington: International Finance Corporation). Glen, J., and A. Singh, 2003, “Capital Structure, Rates of Return, and Financing Corporate
Growth: Comparing Developed and Emerging Markets, 1994–2000,” in The Future of Domestic Capital Markets in Developing Countries, ed. by Litan and others (Washington: Brookings Institution).
Greenwald, B., and Stiglitz, J. (1993), “Financial Market Imperfections and Business Cycles,” Quarterly Journal of Economics, Vol.108, pp. 77-114. Harris, M., and A. Raviv, 1991, “The Theory of Capital Structure,” The Journal of Finance,
Vol. 46 (1), pp. 297–355. Hackethal, A., and R.H. Schmidt, 2000, “Financing Patterns: Measurement Concepts and
Empirical Results,” Working Paper Series: Accounting and Finance, Frankfurt: University of Frankfurt.
Hoshi and others 1991, “Corporate Structure and Investment: Evidence from Japanese Panel
Data,” Quarterly Journal of Economics, Vol. 106, pp. 33–60. Hubbard, G. R., 1996, “Capital Market Imperfections and Investment,” Mimeo, Columbia
University. Jensen, M.C., 1986, “Agency Costs of Free Cash Flow, Corporate Finance, and Takeovers,”
American Economic Review, Vol. 76, pp. 323–339. ———, and W. Meckling, 1976, “The Theory of the Firm: Managerial Behavior, Agency
Costs, and Capital Structure,” Journal of Financial Economics, Vol. 3, pp. 305–360.

- 41 -
International Finance Corporation, 1992, “Financing Growth in the Developing World,” IFC Discussion Paper, No. 12 (Washington: International Finance Corporation).
Kenny, C., and T. Moss, 1998, “Stock Markets in Africa: Emerging Lions or White
Elephants?” World Development, Vol. 26, pp. 829–43. Lallchand, J. (2001), “Capital Markets Development in Sub-Saharan Africa: A Case Study of Mauritius,” PhD Thesis, Cambridge: University of Cambridge. La Porta and others,1997, “Legal Determinants of External Finance,” Journal of Finance,
Vol.52, pp.1131–50. Levine, R. and S. Zervos, 1998, “Stock Markets, Banks and Economic Growth,” American Economic Review, Vol. 88, pp. 536–558. Love, I., 2001, “Financial Development and Financing Constraints: International Evidence from the Structural Investment Model,” World Bank Working Paper, No. 2694, (Washington: World Bank). Lyon A. B. 1992, Taxation, Information Asymmetries, and a Firm’s Financing Choices,” Policy Research Working Paper No. 93 (Washington: World Bank). Marris R., 1963, The Economic Theory of Managerial Capitalism, Glencoe: Free Press. Mayer, C., 1987, “Financial Systems and Corporate Investment,” Oxford Review of
Economic Policy, Vol. 3, pp. 1–16. ———, 1988, “New Issues in Corporate Finance,” European Economic Review, Vol. 32,
pp.1167–1188. ———, 1989, “Myths of the West: Lesson from Developed Countries for Development
Finance,” World Bank Working Paper, No. 301 (Washington: World Bank). ———, 1990, “Financial Systems, Corporate Finance, and Economic Development,” in
Asymmetric Information, Corporate Finance and Investment, ed. by G. Hubbard (Chicago: University of Chicago).
Mutenheri, E., and C.J. Green, 2003, “Financial Reform and Financing Decisions of Listed
Firms in Zimbabwe,” Journal of African Business, Vol. 4, No. 2, pp. 155–170. Myers, S., 1977, “Determinants of Corporate Borrowing,” Journal of Financial Economics,
Vol. 5, pp. 147–175. ———, 1984 “The Capital Structure Puzzle,” Journal of Finance, Vol. 39, pp. 575–97

- 42 -
———, and N. Majluf, 1984, “Corporate Financing and Investment Decisions When Firms Have Information that Investors Do Not Have,” Journal of Financial Economics, Vol. 13, pp. 187–221.
Noe, T., 1988, “Capital Structure and Signaling Game Equilibria,” Review of Financial
Studies, Vol. 1, pp. 331–356. Rajan, R. G., and L. Zingales, 1995, “What Do We Know About Capital Structure? Some
Evidence from International Data,” Journal of Finance, Vol. 50, No. 5, pp.1421–1460.
Samuel, C., 1996, “The Stock Market as a Source of Finance: A Comparison of U.S. and Indian Firms,” Policy Research Working Paper 1592, (Washington: World Bank). Singh, A., 1994, “How Do Large Corporations in Developing Countries Finance their
Growth?” Finance and the International Economy: Prize Essays in Memory of Robert Marjolin, The Amex Bank.
———, 1995, “Corporate Financing Patterns in Industrializing Economies: A Comparative
International Study,” IFC Technical Paper, No. 2 (Washington: International Finance Corporation).
———, and J. Hamid, 1992, “Corporate Financial Structures in Developing Countries,” IFC
Technical Paper, No. 1 (Washington: International Finance Corporation). Singh, A., 1997, “Financial Liberalization, Stock Markets and Economic Development,” The Economic Journal, Vol. 107, pp. 771–782. ———, and B.A. Weisse, 1998, “Emerging Stock Markets, Portfolio Capital Flows and
Long-Term Economic Growth: Micro and Macro Perspectives,” World Development, Vol. 26, No. 4, pp. 607–622.
______, A. Singh, and B.A. Weisse, 2002, “Corporate Governance, Competition, the New
International Financial Architecture and Large Corporations in Emerging Markets,” CBR Working Paper No. 250, (Cambridge: ESRC Center for Business Research).
Tybout, J.R., 1983, “Credit Rationing and the Investment Behavior in a Developing Country,” Review of Economics and Statistics, Vol. 24, pp. 598–607. Whittington G., V. Saporta, and A. Singh, 1997, “The Effect of Hyperinflation in Accounting
Ratios: Financing Corporate Growth in Industrializing Countries,” IFC Technical Paper 3, (Washington: The World Bank).
Yartey, C.A., 2005a, “Stock Market Development, Corporate Finance, and Economic
Growth in Africa,” PhD Thesis, Cambridge: University of Cambridge.