the state of the north mill pond - welcome | nh department of
TRANSCRIPT

The State of the North Mill Pond Portsmouth, New Hampshire
A Report to the New Hampshire Estuaries Project
Submitted by
The Advocates for the North Mill Pond April 1998
New Hampshire Estuaries Project
This project was funded in part by a grant from the Office of State Planning, New Hampshire Estuaries Project, as authorized by the U.S. Environmental Protection Agency pursuant to Section 320 of the Clean Water Act.
Other funding supplied by Greater Piscataqua Community Foundation, New England Grassroots Environmental Fund, and the City of Portsmouth.

The State of the North Mill PondPortsmouth, New Hampshire
A Draft Report to the New Hampshire Estuaries Project
Submitted by
The Advocates for the North Mill Pond March 1998
Edited by Doug Bogen
Contributors: Doug Bogen
David Burdick Nancy Johnson
Doreen MacGillis Mark Mattson Steve Miller
Melody Nestor Ann Reid
Report Design and Production Patricia Miller
Funded by
Office of State Planning/New Hampshire Estuaries Project
City of Portsmouth
The New Hampshire Charitable Foundation’s Greater Piscataqua Community Fund and
New England Grassroots Environmental Fund
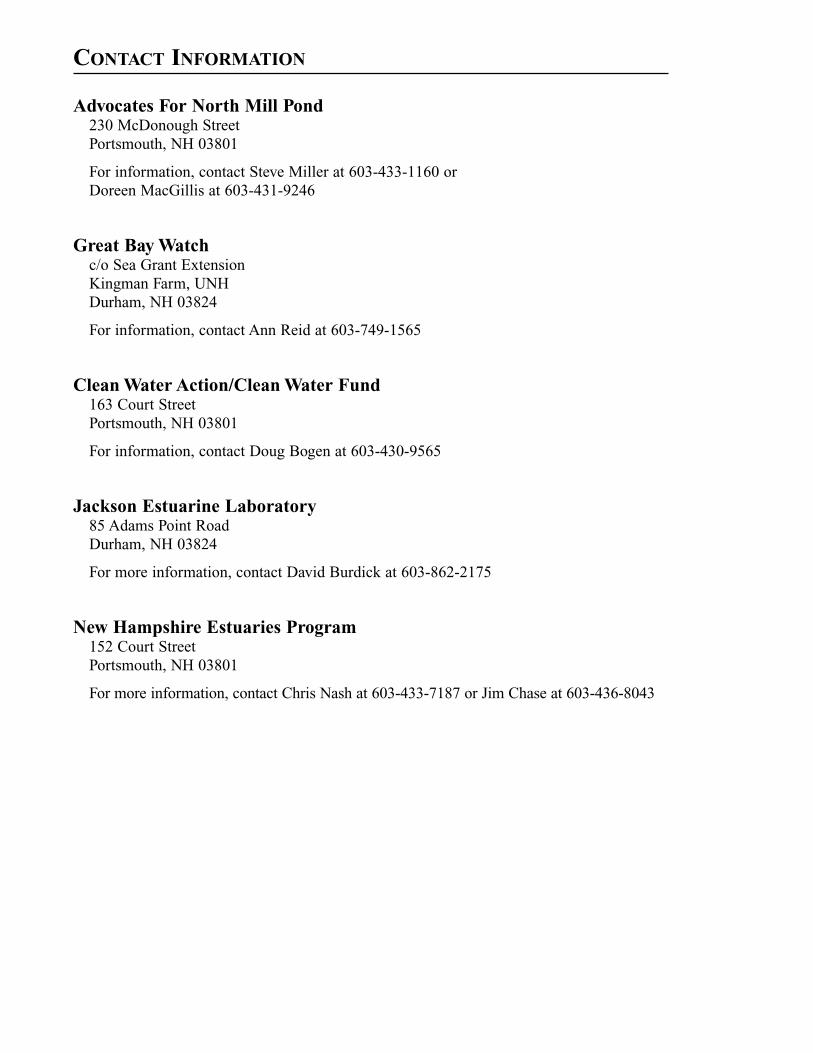
CONTACT INFORMATION
Advocates For North Mill Pond 230 McDonough Street Portsmouth, NH 03801
For information, contact Steve Miller at 603-433-1160 or Doreen MacGillis at 603-431-9246
Great Bay Watch c/o Sea Grant Extension Kingman Farm, UNH Durham, NH 03824
For information, contact Ann Reid at 603-749-1565
Clean Water Action/Clean Water Fund 163 Court Street Portsmouth, NH 03801
For information, contact Doug Bogen at 603-430-9565
Jackson Estuarine Laboratory 85 Adams Point Road Durham, NH 03824
For more information, contact David Burdick at 603-862-2175
New Hampshire Estuaries Program 152 Court Street Portsmouth, NH 03801
For more information, contact Chris Nash at 603-433-7187 or Jim Chase at 603-436-8043

TABLE OF CONTENTS
List of Figures and Tables ii
Executive Summary 1
Acknowledgments 4
Introduction 5
Project Description, Results, and Discussion 7
Natural Resource Surveys 7Shoreline 7Shellfish 10Fish 14Birds 16
Water Quality Testing and Monitoring 18Great Bay Watch 18Water Flow Monitoring and Primary Nutrient Loading 21Shoreline Fecal Sampling 25Storm Water Sampling 27Volatile Organic Chemicals 30
Sediment Sampling 31
Shoreline Cleanup 35
Community Outreach 36
Conclusions 37
Recommendations 38
References 40
Appendix A: Standard Operating Procedures A1
Appendix B: Data Sets for Natural Resource Surveys B1
Appendix C: Data Sets for Water Quality Testing C1
Appendix D: Data Sets for Sediment Sampling D1
Appendix E: Outreach Materials E1
i

FIGURES
Figure 1. The North Mill Pond, ca. 1850. .............................................................................2
Figure 2. Contemporary view of North Mill Pond, showing ANMP project sampling and survey areas. ..........................................................3
Figure 3. Shoreline Survey at North Mill Pond, showing surveysections 1 though 18 and shoreline features..........................................................8
Figure 4. Shellfish samplers David Burdick, Doreen MacGillis, and Nancy Johnson on the central southeast shore of North Mill Pond. ..................10
Figure 5. Relative quantities of benthic invertebrates found at four sampling areas of North Mill Pond..............................................................11
Figure 6. Relative quantities of two benthic invertebrates in four sampling areas of North Mill Pond. ..........................................................11
Figure 7. Size-frequency distribution for soft-shelled clams..............................................12
Figure 8. Abundance of fish and crustaceans in the North Mill Pond. ..............................15
Figure 9. Tricia and Steve Miller collecting water samples at Great Bay Watch Site 18. ....................................................................................18
Figure 10. Fecal levels at Sites 18 and 19, at low and high tide. ........................................20
Figure 11. Hourly discharge (liters/second) in Hodgson Brook during 72 hours of a major rain storm ............................................................................22
Figure 12. View of North Mill Pond showing Great Bay Watch, volatile organic chemical, and shoreline fecal coliform sampling sites. ................25
Figure 13. View of North Mill Pond showing sediment sampling locations. .....................32
TABLES
Table 1. Benthic Infauna of Lower Intertidal Zone identified in shellfish survey, North Mill Pond.......................................................................................13
Table 2. Fish Abundances in the Intertidal Salt Marsh .....................................................14
Table 3. Bird Species and Numbers Observed on North Mill Pond, August-November 1997.......................................................................................17
Table 4. Data from Great Bay Watch Sites 18 & 19 on North Mill Pond.........................19
Table 5. Comparative High and Low Tides in Portland Maine and the North Mill Pond ......................................................................................23
Table 6. North Mill Pond Nitrate and Nitrite Water Chemistry Data, April - October 1997............................................................................................24
Table 7. Fecal Coliform Counts at North Mill Pond Sites ................................................26
Table 8. North Mill Pond Stormwater Sampling Chemistry Data ....................................29
Table 9. Estimated total loading of nitrate, nitrite, total petroleum hydrocarbons, and coliforms into North Mill Pond from three stormdrains and Hodgson Brook during a major storm event, 1-2 November 1997 ..............................................................29
Table 10. Heavy metals found in sediment samples from North Mill Pond ..........................32
Table 11. Total Polycyclic Aromatic Hydrocarbons in North Mill Pond sediment samples .................................................................................................33
ii

EXECUTIVE SUMMARY
This report presents the results and recommendations of a year-long project conducted bymembers of Advocates for the North Mill Pond to assess the health of this tidal pond inPortsmouth, New Hampshire. Despite being literally right in the backyards of much of thecitizenry of Portsmouth, the North Mill Pond is a largely unknown and neglected quantityfor most people. In the past, little research had been done on the health or dynamics ofthe Pond, and little but speculation existed on what kinds and degrees of pollution were impacting it.
Our aim in this project was to conduct a natural resource and pollution source survey ofthe Pond, as well as initiate a water quality monitoring program that would provide base-line data for existing and proposed shoreline and wetland restoration projects at the Pond.During the summer and fall of 1997, teams of volunteers combed the shorelines of thePond, identifying plant and animal life, searching for wastewater discharge pipes, measuring incoming water flows, and collecting water and sediment samples, all in an effort to quantify some of the resources and pollution factors in and around the Pond.
While no limited inquiry such as this could hope to tease out all the various factorsimpacting a given body of water, the image of the North Mill Pond that this study presents is that of an abused and neglected but resilient and functioning ecosystem. Despitethe historical diminishment of its shorelines and saltmarshes, it continues to provideimportant habitat and feeding grounds for many species of birds, finfish and shellfish.
Its waters are often contaminated by human and/or animal wastes and other typical urbanpollution from a number of point-source discharges and its upstream watershed. Of particular concern are the indications of excess nutrients and fecal matter entering the Pond fromits freshwater inlet at Hodgson Brook and several other point sources. Its sediments are contaminated with toxic heavy metals and petroleum byproducts at levels which could beaffecting organisms within the Pond. Our most troubling finding is the presence of dioxinsand furans in the southeasternmost mudflats at levels that may not be safe for human expo-sure and could complicate plans for greater public assess. Continued threats to the health of the Pond include encroachment to its saltmarshes by both residential and commercialactivities, polluted runoff from developed areas, and continued fecal contamination from a few residences, stormdrains and upstream sources.
Key Recommendations: 1) Sewage discharges to the Pond, including all drain pipes and upstream sources,
should be investigated further and reduced to the maximum extent possible. 2) Further research should be conducted on dioxin/furan and polycyclic aromatic
hydrocarbon contamination in the southern end of the Pond, and a determination made on need for clean-up or access restrictions.
3) The City of Portsmouth should enforce existing land use ordinances and wetland regulations as they pertain to the Pond.
In addition to the need for cleaning up past abuses, the findings of this study also present us with numerous opportunities for preservation and restoration of the Pond’s attributes. What will be required to make this promise a reality is the continued commitment of the many local volunteers that made this project possible, along with the hastened cooperation of local and state authorities and adjacent landowners. A restored and prolific North Mill Pond can only bring benefit to our surrounding community, in ecological, aesthetic and economic senses.
1

Figure 1. The North Mill Pond, ca. 1850. From Map of the City of Portsmouth, NH from Original Surveys under the direction of H.F. Walling, Civil Engineer, C.W. Brewster, Publisher, 1850.
2

Figure 2. Contemporary view of North Mill Pond, showing ANMP project sampling and survey areas.
3

ACKNOWLEDGMENTS
This report is dedicated to those who have helped clean up the Pond and who are working to create a safe and healthy environment, allowing more people to enjoy the area. Special thanks go to Melody Nestor for organizing the Advocates for the North Mill Pond and for all her efforts in bringing the community’s attention to the Pond and its neighborhoods.
LABS AND CONTRACTORS: We would like to thank the laboratories and other institutions that provided the data analysis and other technical support for this project:
Citizens Environmental Laboratory, Clean Water Fund, Great Bay Watch,Jackson Estuarine Lab, and Normandeau Associates Inc. Also, Arthur Rose, Professor Emeritus, Geochemistry, State College PA, for assistance in interpretation of sediment sampling results
VOLUNTEERS: This project was dependent on the time and abilities of many volunteers, including:
Shoreline Survey: Lab: Shanna Burt, Kim Foley, Amy Manzelli, Chad Turmelle, Dave Waltz. Field: Doug Bogen, David Burdick, Chris Johnson, Nancy Johnson, Doreen MacGillis, Ann Reid, and Anne Smith
Shellfish Survey David Burdick, Doreen MacGillis, Nancy Johnson, David Cohen, Doug Bogen, and Melody Nestor
Fish Survey Brad Agius, Alison Bowden, Michele Dionne, Tin Smith, and Scott Oringer
Bird Survey Steve Miller and Tricia Miller
Water Flow Monitoring and Storm Water Sampling Doug Bogen, and Mark Mattson
Great Bay Watch Water Testing: Jim Chase, Kathy Driscoll, Nancy Johnson, Steve Miller, Tricia Miller, Ann Smith, Steve Wallace. QAQC: Shanna Burt, Kim Foley, Amy Manzelli, and Ann Reid
Sediment and VOC Sampling Doug Bogen, David Burdick, Steve Miller, Melody Nestor, and Ann Reid
Shoreline Cleanup Planning and Clean Up: Kathy Hoerbinger, Marty Hoerbinger, Ginny Swift, Harry Swift, Melody Nester, Ed Nester, Doreen MacGillis, Alison McCarthy, and David Slanetz.
Clean Up Crew: Michale Bailey, Doug Bogen, Jennifer Bosworth, Alison Bowden, Liz Bratter, Dave Burdick, Jeffrey Cooper, Nicole Cooper, Ryan Davis, John Jacobsmeyer, Brian Johnson, Nancy Johnson, Christina Johnson, Ed Hayes, Cynthia Lay, Libby Carlisle, Jeffrey Carlisle, Eileen MacDonald, Gabe Memmert, John Mersereau, Steve Miller, Tricia Miller, Miriam Rosenson, Sally Rosenson, Robert Padian, Dean Plager, Michele Richard, Dana Skiffington, and Mike Spinsosa.
4

INTRODUCTION
The physical environment of North Mill Pond is that of a shallow, urban, tidal pond. It receives freshwater inflow primarily from Hodgson Brook, which enters the pond from the southwest by passing under a bridge over Bartlett Street, and from storm drains and surface runoff along both northwest and southeast shores. The North Mill Pond also receives a substantial tidal flow during flood tides that enter the pond from the northeast under the bridge at Maplewood Avenue.
Formerly there were tide gates under the Maplewood Avenue bridge that were used to impound the water, with only occasional flushes. An auto accident in the 1950s destroyed the tide gates. By the early 1980s the North Mill Pond was slowly but visibly becoming a functioning tidal marsh again. Sightings of horseshoe crabs, clam holes, mummichogs, egrets, gulls, night herons, nesting wood ducks, and numerous small birds, especially on the mud flats at low tide, were noted with enthusiasm by some residents.
North Mill Pond is and has been a central part of Portsmouth’s commercial and residential development. However, despite being literally right in the backyards of much of the citizenry of Portsmouth, the North Mill Pond is a largely unknown entity to most people. In the past, little research had been done on the health or dynamics of the pond, and limited data existed on what kinds and degrees of pollution were impacting it.
The land surrounding the North Mill Pond is among the most significantly impacted in the Portsmouth region, as it was one of the first areas to experience industrial development. The northern shore of the pond and its immediate headwaters has had residential development for over a century, with impacts from both runoff and sewer/septic leakage. Changes to the Pond’s features include its initial impoundment to provide mill power, and substantial filling of its saltmarsh on the southern shore for rail lines and commercial development.
Current industries affecting the pond include seafood processing, marine contracting, salt storage, and ongoing freight rail operations. The former Pease Air Force Base (now Pease International Tradeport) encompasses the headwaters of Hodgson Brook. With the closure of the base, numerous toxic contamination sites are being remediated and monitored as part of a Superfund process, but up until now, no testing of waters and sediments off-base in Hodgson Brook had been done. Recent use of urea for de-icing at the airport has led to increases in nitrates in groundwater there, though it is unknown what affect its use has been on surface waters. Additionally, a major fire in May, 1991 that destroyed Ricci Supply, located on the southwest corner of the pond, could have had a significant contamination impact on the pond.
Another more obvious impact on the health of the North Mill Pond is the presence of accumulated rubbish and industrial waste along the shores and mudflats of the pond. Not only is this dumping having an impact on the ecology of the pond, but it clearly detracts from the aesthetic quality of the area and symbolizes the general abandonment of the space by adjacent businesses and the community. While volunteer shoreline cleanups were conducted during the past two summers along the railroad right-of-way, there remains a quantity of heavier and less accessible material (e.g., on the mudflats) as well as further contributions by “midnight dumpers” to contend with.
5

Despite its degraded state, the pond remains a significant habitat for shorebirds, fish and other estuarine life. Growing interest from nearby residents in furthering public awareness and taking on greater stewardship of this resource resulted in the formation of Advocates for the North Mill Pond (ANMP) in February of 1997. In addition to hosting annual trash clean-ups, ANMP recognized a need for baseline data on the existing ecological health of the pond to determine opportunities and priorities for pollution abatement and restoration of the pond’s aesthetic and ecological qualities.
With funding from the New Hampshire Estuaries Project, the New England Grassroots Environmental Fund, the Greater Piscataqua Community Foundation, and the City of Portsmouth, ANMP initiated a water quality monitoring and pollution source identification program, along with a natural resources survey for the North Mill Pond. Additionally, establishment of Great Bay Watch (GBW) monitoring sites at the mouth and headwaters of the North Mill Pond has filled a critical data gap in GBW’s knowledge of the waters of the Estuary. This project has also produced an ecological baseline that can be used as a reference in the ongoing remediation/restoration of the Pond and adjacent waters being carried out as part of the New Hampshire Port Authority Expansion Project.
In addition, it has created a focal point for greater citizen awareness and involvement in preserving/enhancing the Pond’s resources for the future of the city.
This report describes the three main parts of our general inquiry into the ecological health of the North Mill Pond, including natural resource surveys, water quality testing and monitoring, and sediment sampling. Each of these sections is in turn broken down into specific projects and analyses to provide a broad but focused view of existing conditions in the Pond and possible threats to preservation or continued restoration.
All sample numbers refer to shoreline sections depicted in Figure 3 in the first section, except for GBW sites on the Pond, which are two of 21 throughout the Great Bay Estuary. More specific sampling locations can be found in other maps in following sections.
6

PROJECT DESCRIPTION
NATURAL RESOURCE SURVEYS
Shoreline David M. Burdick
Introduction In order to characterize conditions around the Pond, a shoreline survey was performed using the Shoreline Evaluation Form, developed in cooperation with the Cooperative Extension Service, and the New Hampshire Estuaries Project. The shoreline survey helped to objectively identify and evaluate shoreline conditions, potential pollution sources and estuarine habitats by characterizing land use, shoreline development and habitat health. As part of the survey, water samples were collected and assayed for the presence and abundance of coliform bacteria. In addition, the survey helped to identify and characterize several specific shellfish resources.
Methods A simple checklist was used in conjunction with water sample collections to evaluate shoreline conditions, potential pollution sources and estuarine habitats. The checklist, called the NEP Shoreline Evaluation Form, was developed for the New Hampshire Estuaries Program and is attached in Appendix A. It provided a way for volunteers to objectively assess shoreline conditions and highlight potential pollution problems that could be investigated further at a later date.
The survey teams were composed of lay volunteers and two to three volunteers profession-ally involved in water or habitat quality issues. The Shoreline Evaluation Form was followed and water samples were collected for coliform analysis. The Pond was divided into 18 sections for the survey, with a data sheet for each section. These numbered sections were also used for identifying sites in subsequent water and sediment sampling (see Figure 3). The survey was conducted over four dates: two in June and one each in July and August, 1997. Volunteers participated in training and work sessions for shoreline evaluations in June and July 1997 to learn how to fill out the checklist. The sessions informed participants how to recognize different conditions that would indicate potential pollution sources as well as natural processes.
Results Land use was characterized around the entire Inner North Mill Pond to relate development to habitat and water quality. Most of the Pond is surrounded by buildings, roads parking and other structures (Appendix B). On the southeastern side, this development is characterized as commercial, with the railroad owning most of this shore. In contrast, the western shore is generally residential, but still highly developed. Most of the sections show eroding banks along the edge of the Pond with fill or rip-rap coverings and buildings or other structures commonly built up to the bank.
More often than not, direct evidence of ground water discharge cannot be observed along shorelines. Observations of iron oxides on coarser sediments, and indicator plants such as Common Reed, Purple Loosestrife and green algae helped to identify areas of ground water discharge (Appendix B). Ground water samples were collected from these sites for fecal coliform analyses. A total of eight outfall pipes actively discharging water into the
7

Figure 3. Shoreline Survey at North Mill Pond, showing survey sections 1 though 18 and shoreline features.
Pond were found and sampled, and two other dry pipes were identified along the shore-line. Although not associated with pipes, 14 seeps were identified and sampled. Fecal coliform counts were very high and the most contaminated outfalls and seeps had no salinity (i.e. were fresh). Results of this sampling are found in the water quality section, p. 18).
Observations of shellfish resources were made to increase our knowledge of these resources in the Pond. No horseshoe crabs were observed during the shoreline survey. Clam holes were counted (intertidal areas only), and the relative abundance of both blue mussels and oysters were noted. The data collected in the shoreline surveys regarding shellfish resources are presented and discussed in the next section.
Discussion and Conclusions The trends in the data characterize the southern end of the Pond as most degraded in terms of eutrophication, sewage contamination as well as other types of pollution. We have identified this area of the Pond as having high risk factors for water quality as well as habitat health. Two other areas of concern regarding pollution and habitat health are the areas by Monteith Street and between the cemetery and Granite State Minerals.
Salt marshes provide several important ecological services to estuarine ecosystems. From a rather narrow human view, these services include: habitat for commercially and economically important animals, filtration of sediments and contaminants, nutrient transformations, erosion control and flood control. In providing these services, salt marshes improve water quality. Although the health of these systems is important to water quality as well as estuarine health, salt marshes in New Hampshire continue to be degraded and destroyed. Most
8

of the salt marshes within the North Mill Pond have had their upland edges filled by development. Of the 18 sections of shoreline, 17 are categorized as showing evidence of fill on existing salt marsh. Eleven sections had evidence of erosion at their edges and marshes in seven sections showed signs of fragmentation. Three sections showed that marshes were covered by algal mats and another marsh had been mowed. The algal mats were associated with heavy green algal blooms on the sediments in sections 14 and 1 to 5, (i.e. around the southwest/ inlet end of the pond) indicating the presence of excess nutrients.
9

Shellfish David M. Burdick
Introduction North Mill Pond shellfish surveys were conducted by volunteers during summer and fall of 1997. Beside the direct or commercial values of some benthic invertebrates such as soft-shelled clams and clam worms, benthic invertebrates can indicate the relative health of the community of benthic organisms within a water body. A shoreline survey performed using the NEP Shoreline Evaluation Form provided a qualitative description of mussel and oyster abundance and estimates of clam hole densities in the area. Four areas of the Pond were selected for benthic sampling based on numbers of clam holes observed during the shoreline survey (see Appendix B).
Methods The shoreline survey included observations of shellfish resources to increase our knowledge of these resources in the Pond. Clam holes were counted (intertidal areas only), and the relative abundance of both blue mussels and oysters were noted. The shoreline evaluation procedure is described in Appendix A and a description of the specific procedure for using the North Mill Pond survey is found elsewhere in this report.
The teams for the benthic surveys were composed of about 1-2 lay volunteers and 1-2 volunteers professionally involved in water or habitat quality issues. The benthic survey was conducted on two days in fall 1997: October 2 and 11th. The Standard Operating Procedure for the Shellfish Survey (found in Appendix A) was followed. The benthic survey included four sites: two were chosen with high densities of clam holes (5.25 -14.0/m2), and two were chosen with low densities (0.0 - 3.0/m2).
Figure 4. Shellfish samplers David Burdick, Doreen MacGillis, and Nancy Johnson on the central southeast shore of North Mill Pond.
10

0
10
20
30
40
50
60
2 16
Sampling Areas
Other
Clam Worm
Baltic Macoma
Steamer Clam
73 +/-32
Ani
mal
s (#
/m2 )
9 6
Figure 5. Relative quantities of benthic invertebrates found at four sampling areas of North Mill Pond.
Ani
mal
s (#
/m2 )
0
10
20
30
40
50 Steamer Clam Clam Worm
Sampling Areas
2 162 16
Sampling Areas
9 6 9 6
Figure 6. Relative quantities of two benthic invertebrates in four sampling areas of North Mill Pond.
11
0
5
10
15
20
2 9 16
Sampling Areas
Cla
m A
bund
amce
(#
/m2 )
Size Classes (mm)
0 - <20
20 - <40
40 - <60
60 - <80
6
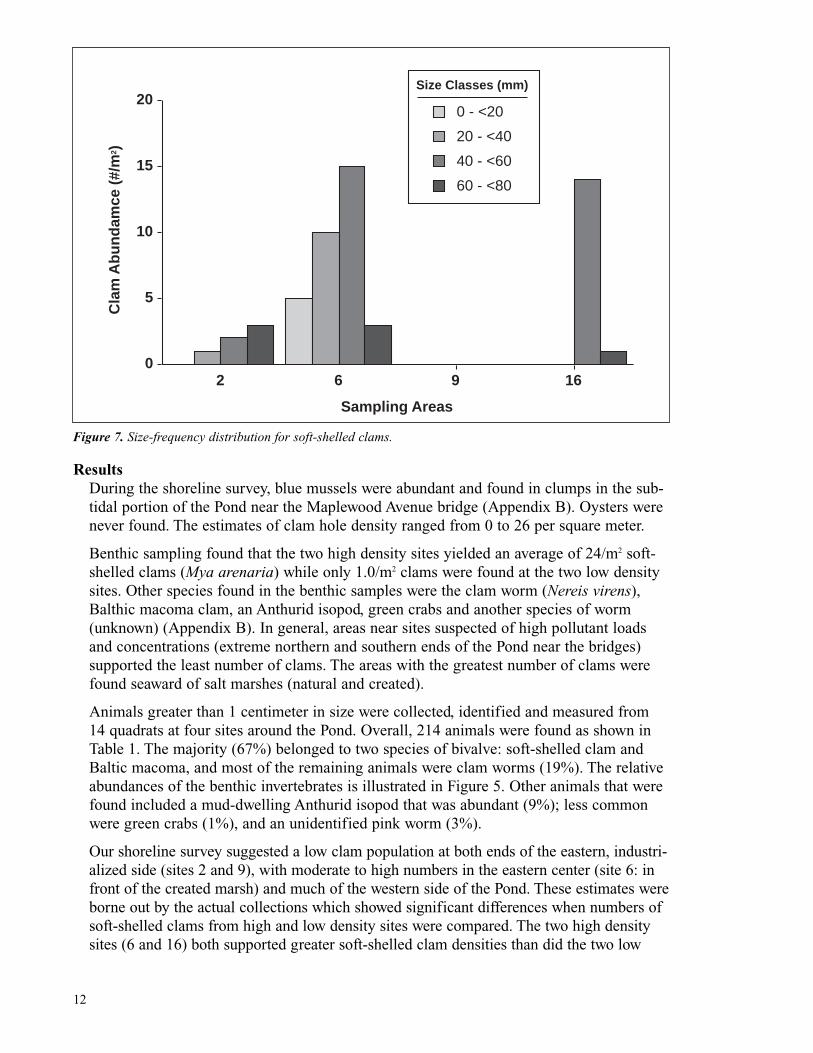
Figure 7. Size-frequency distribution for soft-shelled clams.
Results During the shoreline survey, blue mussels were abundant and found in clumps in the sub-tidal portion of the Pond near the Maplewood Avenue bridge (Appendix B). Oysters were never found. The estimates of clam hole density ranged from 0 to 26 per square meter.
Benthic sampling found that the two high density sites yielded an average of 24/m2 soft-shelled clams (Mya arenaria) while only 1.0/m2 clams were found at the two low density sites. Other species found in the benthic samples were the clam worm (Nereis virens), Balthic macoma clam, an Anthurid isopod, green crabs and another species of worm (unknown) (Appendix B). In general, areas near sites suspected of high pollutant loads and concentrations (extreme northern and southern ends of the Pond near the bridges) supported the least number of clams. The areas with the greatest number of clams were found seaward of salt marshes (natural and created).
Animals greater than 1 centimeter in size were collected, identified and measured from 14 quadrats at four sites around the Pond. Overall, 214 animals were found as shown in Table 1. The majority (67%) belonged to two species of bivalve: soft-shelled clam and Baltic macoma, and most of the remaining animals were clam worms (19%). The relative abundances of the benthic invertebrates is illustrated in Figure 5. Other animals that were found included a mud-dwelling Anthurid isopod that was abundant (9%); less common were green crabs (1%), and an unidentified pink worm (3%).
Our shoreline survey suggested a low clam population at both ends of the eastern, industrialized side (sites 2 and 9), with moderate to high numbers in the eastern center (site 6: in front of the created marsh) and much of the western side of the Pond. These estimates were borne out by the actual collections which showed significant differences when numbers of soft-shelled clams from high and low density sites were compared. The two high density sites (6 and 16) both supported greater soft-shelled clam densities than did the two low
12

density sites (2 and 9; Figure 6). On average, 24/m2 soft-shelled clams (Mya arenaria) were found at the two high density sites, while only 1.0/m2 clams were found at the two low density sites. Clam sizes were generally restricted to larger size classes at sites 2 and 16, with all size classes up to 80 mm represented at site 6 (Figure 7).
Discussion and Conclusions The presence of filter feeding clams of commercial value in North Mill Pond (soft-shelled clams and blue mussels), highlights the complexity of ecological health and public health issues in the management of coastal tidal ponds and their resources. This survey was not intended to provide a foundation or impetus to open this area to shellfishing for human consumption, but as a tool to assess the health of the pond and a guide to helping the human community become involved in decision making regarding the natural resources of the pond. Our results considered in light of the other parts of this report suggest there is a small shellfish resource in the Pond that is likely a significant resource to higher trophic levels. However, these shellfish are likely to be be contaminated by sewage as well as heavy metal and hydrocarbon contaminants (see Water Quality and Sediment Sampling sections of report). We recognize that these shellfish provide support for fish and wildlife higher in the food web of the Pond and are concerned that certain contaminants may compromise the ability of these wild animals to survive. Two important points are that the shellfish resources appear to be more abundant and may be healthier in the less impacted areas along the southeastern and northwestern sides of the Pond. Furthermore, the benthic habitat in the subtidal area at the northeastern end of the Pond, which is dominated by blue mussels, also appears healthy.
Table 1. Benthic Infauna of Lower Intertidal Zone identified in shellfish survey, North Mill Pond.
SITE Total Indiv. 2 6 9 16 Collected
Mya arenaria (Soft-Shelled Clam) 2 33 0 15 50 Macoma balthica (Baltic Macoma) 10 73 4 7 94 Nereis spp. (Clam Worm) 22 10 4 5 41 Anthurid Isopod 7 8 0 5 20 Unknown worm 0 0 6 0 6 Carcinus maenas (Green Crab) 0 0 0 3 3
Totals per site 41 124 14 35 214
13

Fish David M. Burdick
Introduction Fish were sampled on each side of the Pond using fyke nets on two occasions in 1997 to determine the species and abundances of fish using the intertidal habitat at North Mill Pond. In order to characterize the type and abundance of forage fish in the Pond, a fish survey was performed using fyke nets. Fyke nets are long, low nets that steer fish into a trap after they swim into shallow waters with the incoming tide.
Methods The survey teams were composed of two to three professional researchers. The created marsh (labeled INMP-C), is located on the eastern shore of North Mill Pond, adjacent to the railroad tracks and the gravel access road. The reference marsh (INMP-R), is located on the western shore, at the end of Monteith Street. Fyke nets with two 15 meter long wings were used to sample fish at each site during June and September 1997. Sampling followed the Standard Operating Procedure (SOP) found in Appendix A. In brief, nets were set on rising evening tides and retrieved several hours later on a falling tide, after the water level dropped below the level of the first fyke. In each sample all fish were identified to species, counted, and measured for total length. Total biovolume was also measured for each species. If more than thirty individuals of a species were captured, a random sample of thirty was selected and measured for total length and biovolume. Following identification and measurements, the fish were released. Data reported here includes species and abundance. The high tide line was marked with garden stakes, and the area of marsh sampled was calculated for each site.
Results Five species of fish totaling 136 individuals as well as 71 green crabs and 8 shrimp were caught in the fyke nets. The fish species included, from most to least numerous: 118 mummichogs, 6 American eels, 6 Atlantic silversides, 3 alewife, and 3 tomcod. Mummichogs were the most abundant fish and were caught in both nets on both sampling dates. Averaging over 10 individuals per 100 square meters of marsh fished, this species
Table 2. Fish Abundances in the Intertidal Salt Marsh.*
CREATED MARSH REFERENCE MARSH June Sept June Sept
Alosa pseudoharengus alewife 0.99 0 0 0
Anguila rostrata American eel 0.33 0 0.3398 1.6227
Fundulus heteroclitus mummichog 12.57 8.6713 2.3785 17.0385
Menidia menidia Atlantic silverside 0.33 1.1189 0 0.4057
Microgadus tomcod tomcod 0 0 1.0194 0
Carcinus maenus green crab 7.61 2.5175 5.7764 8.9249
Paleaomonaetes sp. shrimp 2.65 0 0 0
*Values represent number of individuals per square meter caught in fyke nets.
14

0.00
5.00
10.00
15.00
20.00
Alosa pseudoharengus
Anguila rostrata
Fundulus heteroclitus
Menidia menidia
Microgadus tomcod
Carcinus maenus
Paleaomonaetes sp.
Created-Spring
Created-Fall
Reference-Spring
Reference-Fall
Figure 8. Abundance of fish and crustaceans in the North Mill Pond.
can be considered abundant in North Mill Pond (Table 2). American eels and Atlantic silversides were found in three of the four catches and averaged about 6 individuals per 1000 square meters of marsh fished. These species should be considered common in the Pond. Green crabs were caught in all four efforts and they were abundant, averaging 6 individuals per 100 square meters (Figure 8). Both tomcod and alewife were caught only once, with both efforts yielding three individuals. These two less common species as well as the Atlantic silversides and abundant mummichogs are important forage fish in the Pond. They provide food for wading birds and raptors as well as sport fish like bluefish and striped bass.
Conclusion This information could become important baseline data for future resource management. Further surveys could provide data necessary to determine changes in species or abundances as a result of a change in conditions, management strategies, or in response to a local catastrophe (e.g. an oil spill). Further investigations could determine the roles of these forage fish in the Pond ecosystem.
15

Birds Steve J. Miller
Introduction The goal of this study was to survey the bird species that utilize the North Mill Pond during a specific time period. Another recent bird survey was done as part of a wildlife habitat evaluation by the U.S. Fish and Wildlife Service in 1991 as part of the NH Port Authority Expansion Project. That study will be reviewed in this discussion.
Methods Bird species that utilize the North Mill Pond were surveyed on ten dates between August and November 1997. The surveys focused on those species of birds that feed on the pond or the mud flats at low tide. Bird species that live in the neighborhoods around the pond were not specifically surveyed.
The first surveys were made by walking around the pond and making observations from any location that afforded an overall view, such as from the Maplewood Avenue bridge and from the eastern shore. Two locations on the Northwest shore were identified that allowed a full view of the pond: the end of Monteith Street allowed viewing of the middle and southern end of North Mill Pond almost all the way to Bartlett Street. From the point of land at the end of Mill Way (the old Dearborn Street) one can view the middle and north-ern end of the pond to Maplewood Avenue Bridge. Binoculars and/or a spotting scope were used for all observations. Data and notes were recorded each day of observation. Any species that could not be positively identified were recorded as unknown and all field marks recorded so that with study, a future observation might lead to an identification.
Only birds that were observed on the North Mill Pond (in or on the water) or seen on the mudflats were recorded. Birds in the surrounding shore habitats were not recorded. The shore line of the pond is very diverse in habitat, from rail yards and a wide array of disturbed areas to a small area of salt marsh in relatively good condition. Although these habitats are inhabited by a diverse bird life, the focus of this survey was restricted to the pond itself with the goal of tracking the birds most easily observed by novice bird watcher or citizens without specialized equipment or knowledge.
Results Twenty-three bird species were seen in this study area (see Table 3). The number of birds on the pond on any one survey date varied from a low of six species, with 54 birds present, to a high of 14 species, with over 400 birds feeding on the mud flats. The greatest quantities of birds were seen during the migration periods of the Semipalmated Plovers, Semipalmated Sandpipers, and Black-bellied Plovers. The North Mill Pond is an important feeding habitat for these migrating species.
This survey is limited in that the ten survey dates were between August and November and therefore only document late summer and early fall species of birds. None-the-less, the data shows that a wide variety of species utilize the pond as feeding habitat. From personal observations made over the last five years of living on the North Mill Pond, there are many other species which utilize the area but were not seen in this survey. The spring and fall migration periods bring Canada Geese, Buffleheads, Common Mergansers, Red-breasted Mergansers, and Hooded Mergansers to feed on the pond. Summer residents include Green Herons and Red-winged Blackbirds, both of which nest on the shores of the pond. Rare species have also been documented utilizing North Mill
16

Pond, including a Lark Sparrow that wintered in a backyard on Dennett Street in 1995. During the winter the pond serves as an important open water habitat for several species of ducks and gulls whose numbers can at times be into the hundreds.
Discussion and Conclusions North Mill Pond is valuable wildlife habitat and provides migrating and resident birds an important feeding grounds. It is an important habitat for a wide variety of birds. The U.S. Fish and Wildlife Service in their Wildlife Habitat Evaluation Study (Pedevillano, 1991), states “North Mill Pond provides high value habitat for wildlife.” In this study, field observations on three dates (8/22/90, 9/24/90, and 10/9/90) revealed that a large diversity and number of shorebirds utilize the mudflats in North Mill Pond. On August 22, 1990, 19 species were seen totaling an estimated 343 individuals. In August 1997, there were 18 different species seen on three dates, with 13 species seen on each date and 397, 172, and 259 individuals seen on each respective date. The U.S. Fish and Wildlife Service evaluation states “This level of usage indicates that the North Mill Pond mudflats serve as important feeding areas for migrating shorebirds”, and “Since shorebird populations have been declining in recent years this type of habitat becomes even more important.” Pedevillano ends her study by stating, “Although portions of the pond are considered to be degraded, it remains a functional ecosystem utilized by a diversity of wildlife species in seasonal abundance.”
The diversity of bird species that are present on North Mill Pond add to the quality of life for human residents. These birds are easily viewed by the public from a variety of easy access locations. When the birds are in the highest numbers during their northern and southern migrations, the area is full of bird life and offers an exciting wildlife viewing area that adds a new dimension to life in Portsmouth.
Table 3. Bird Species and Numbers Observed on North Mill Pond, August-November 1997.
Species 8/19 8/22 8/23 9/1 9/3 9/12 9/17 10/5 10/12 11/2 Total
Double crested Cormorant 11 2 4 22 13 2 6 0 11 0 71 Great Blue Heron 1 0 1 1 2 1 1 0 0 1 8 Snowy Egret 2 9 5 6 4 2 0 0 0 0 28 Green Heron 0 0 0 0 0 1 0 0 0 0 1 Black-crowned Night Heron 0 0 0 1 3 1 3 2 0 0 10 American Black Duck 34 12 13 12 12 0 0 0 0 4 87 Mallard 12 0 0 0 0 0 15 0 7 13 47 American Coot 0 0 0 0 0 0 0 0 0 1 1 Sharp-shinned Hawk 0 0 1 0 1 0 0 0 0 0 2 Red-tailed Hawk 0 0 0 0 0 0 1 0 0 0 1 Osprey 0 1 0 0 0 0 0 0 0 0 1 Belted Kingfisher 0 1 1 2 0 1 2 0 0 0 7 Black-bellied Plover 9 14 5 7 9 9 15 0 0 0 68 Semipalmated Plover 90 75 126 39 10 0 0 0 0 0 340 Greater Yellowlegs 20 13 33 11 6 2 7 9 15 0 116 Lesser Yellowlegs 21 0 0 2 1 0 0 0 0 0 24 Semipalmated Sandpiper 180 21 50 17 171 0 2 0 0 0 441 Common Tern 0 0 3 0 0 0 0 0 0 0 3 Great Black-backed Gull 0 1 0 0 1 0 0 0 0 2 4 Herring Gull 6 8 16 7 37 21 15 7 22 42 181 Bonaparte’s Gull 0 0 0 0 0 0 0 0 0 15 15 American Crow 2 13 1 0 0 2 0 0 3 1 22 Tree Swallows 3 2 0 0 0 0 0 0 0 0 5
Total 391 172 259 127 270 42 67 18 58 79 1483
17

WATER QUALITY SAMPLING AND MONITORING
Great Bay Watch Nancy Johnson and Ann Reid
Introduction With the founding of the Advocates for the North Mill Pond in 1997, the opportunity arose to perform water quality monitoring of the North Mill Pond under the auspices of Great Bay Watch (GBW). Great Bay Watch is a volunteer water quality monitoring pro-gram under Sea Grant Extension, a joint program of the University of New Hampshire’s Cooperative Extension and UNH/UM Sea Grant College Program, Durham, NH.
Methods Under Great Bay Watch volunteers received five hours of training in water quality monitoring and a manual which fully explained not only the procedures for performing the tests, but also an explanation of the importance of the test, and why it is a useful measure of the water quality. Twice a month from late April to early November six trained volunteers sampled at site 18 (Tricia and Steve Miller) and site 19 (Nancy Johnson, Ann Smith, Kathy Driscoll, and Christina Johnson) on the full and new moon at both low and high tide. The water quality parameters included dissolved oxygen, air and water temperature, water transparency, salinity, pH, and fecal coliform bacteria. An EPA approved Quality Assurance/Quality Control (QAQC) was performed on all samplers before sampling began, and twice during the sampling period.
Results GBW Site 18: Maplewood Avenue: Site 18 samples were taken at a floating dock on the eastern side of Maplewood Avenue. bridge near Cindy Ann Cleaners. Because of this sites proximity to the ocean, and the influence of the ocean water in the tide, this site had one of the coldest temperature readings of all GBW sites (low tide average = 13.3°C, high tide average = 14.4°C), and was one of the highest salinities (low tide average = 26.9 ppt, high tide average = 28.0 ppt). The pH at Site 18 as well as at Site 19 was very stable, Site 18 having a low tide average of 7.7, and a high tide average of 7.9. The dissolved oxygen and dissolved oxygen percent
Figure 9. Tricia and Steve Miller collecting water samples at Great Bay Watch Site 18.
18

ATe
mp
H
ATe
mp
H
14.5
27.5
21
26
21
28
16
16.5
14
.5
0c
o C
9 8 9 10
22
29
18
18
16
17.5
17
.5 9 5 8 12
10
12
1 1
26.5
23
19
19
15
21
18
4 5 8
0c
o C
DO
= D
isso
lved
Oxy
gen;
Sal
= S
alin
ity;
Sat
= S
atur
atio
n; L
P =
Lig
ht P
enet
rati
on; W
Tem
p =
Wat
er t
empe
ratu
re; A
Tem
p =
Air
Tem
pera
ture
; T
NT
C =
Too
num
erou
s to
cou
nt;
INV
= I
nval
id
ATe
mp
L
ATe
mp
L
*28
026
528
025
025
021
524
527
024
527
022
527
523
5 83
88
60
75
78
55
75
65
95
65
110 60
125 90
Dep
th
Dep
th
cm
cm
90
15
22
28
20
33
20
20
30
30
30
30
30
25
22
17
25
20
12.5
10
10
10
5 10
10 5 15
25
Dep
th.
Dep
th.
cm
cm
*20
516
7.5
250
192.
525
021
524
5
270
245
270
225
275
215 83
88
60
75
78
55
75
65
72.5
65
11
0 60
125 90
LP
H
LP
H
cm
cm
LP
L
LP
L
90
15
22
28
20
33
20
20
30
30
30
30
30
25
22
17
25
20
12.5
10
10
10
5 10
10 5 10
25
cm
cm
CF
U/1
00
CF
U/1
00
Feca
l H
Feca
l H
10
10 * 0 10 * 0 * 0 0 * 0 0 * 10
10 *
100
370
210
280 *
200 30 * 0 20 *
CF
U/1
00
CF
U/1
00
180 40 * 60
150 * 70
TN
TC
11
0 30 * 30
40 * 22
50 *
170
450
760
510
TN
TC
T
NT
C
510 *
220
1030
*
Feca
l L
Feca
l L
7.8
7.8
7.8
7.9
7.8
7.6
7.8
8.1
7.9
7.8
8.1
7.9
8.0
7.7
7.5
7.6
7.6
6.9
7.9
8.2
8.1
7.8
7.6
7.6
7.8
7.
87.
87.
1
pH-H
pH-H
7.4
7.6
7.6
7.3
7.8
7.8
7.7
7.8
7.8
7.7
7.8
7.8
7.6
7.5
7.4
7.5
7.2
7.8
8.0
7.8
7.7
7.8
7.1
8.1
7.6
7.5
INV
7.
1
pH-L
pH-L
101.
23
88.1
910
1.29
10
9.40
10
9.54
95
.20
100.
39
105.
32
99.7
510
2.32
95
.97
95.9
810
2.58
93
.35
103.
94
101.
15
120.
20
90.4
086
.43
138.
32
113.
85
101.
31
121.
73
105.
76
100.
37
113.
55
100.
43
78.9
9
Sat
~H
Sat
-H
%
%
Tab
le 4
. D
ata
from
Gre
at B
ay W
atch
Sit
es 1
8 &
19
on N
orth
Mil
l Po
nd.
Sit
e 18
: M
aple
woo
d A
venu
e
91.2
487
.71
85.9
187
.74
102.
71
105.
73
83.5
982
.51
77.3
277
.74
76.8
977
.40
80.7
977
.32
88.8
2
83.5
486
.58
75.4
586
.38
94.4
189
.42
91.8
288
.23
97.0
590
.63
93.0
089
.04
76
.12
Sat
-L
Sat
-L
%
%
17.1
23
.5
24.5
28
.2
29.2
29
.9
28.3
530
.6
30.4
531
.2
30.2
30
.0
31.5
27
.1
12.7
2.
67.
91.
52.
213
.5
25.6
2.
017
.95
13.0
7.
622
.0
28.1
1.
48
Sal
-H
Sal
-H
ppt
ppt
13.9
22
.7
24.7
27
.15
28.9
30
.3
29.0
28
.6
30.3
30
.15
30.4
29
.9
29.3
522
.3
1.1
2.0
1.9
0.3
1.1
2.1
9.6
1.8
1.5
1.35
2.
21.
61.
81.
15
Sal
-L
Sal
-L
ppt
ppt
10.4
8.
99.
69.
58.
97.
78.
28.
48.
27.
97.
68.
58.
98.
7
10.6
11
.2
11.8
9.
07.
310
.8
9.1
8.9
9.8
9.1
8.9
10.7
9.
18.
5
DO
-H
DO
-H
ppm
ppm
9.9
9.0
8.7
8.0
8.2
8.7
6.8
6.6
6.3
6.1
6.2
7.4
7.5
7.6
10.4
9.
59.
47.
97.
78.
88.
08.
48.
68.
98.
810
.6
9.9
8.3
DO
-L
DO
-L
ppm
ppm
WTe
mp
H
Wte
mp
H
Sit
e 19
: B
artl
ett
Str
eet
9.5
8.5 11
14
17
17
17
17.5
16
19
18
12
.5
13
11
11
10
14
15
23
24
19
21
21
19
19
12
12
11.5
o C
o C
WTe
mpL
WTe
mpL
8 8 8 12
18
16
17
18
16.5
18
.5
17 9
10.5
10
8 9 11
13
20.5
18
18
19
16
19
16
9 10
11
o C
o C
04/2
305
/06
05/2
206
/05
08/2
307
/07
07/2
108
/04
08/1
909
/03
09/1
810
/02
10/1
711
/09
04/2
305
/06
05
/22
06
/05
06/2
307
/07
07
/21
08
/04
08
/19
09/0
3
09/1
810
/02
10
/17
11
/03
Dat
e
Dat
e
19
15 9 17
18
28
26
17
25
22
19
29
18
17
14
11
18
17
29
20

saturation were very good at both low and high tide averaging at 85.3% for low tide and 100.2% at high tide. All readings at both tides were above the class B standard of 75%. The average transparency was 216 cm at high tide, 91% of the average depth.
GBW Site 19: Bartlett Avenue
Site 19 is located at the far end of North Mill Pond near Ricci’s Supply Company Inc. The temperatures at site 19 were slightly higher than at site 18 on the other end of the pond, (low tide average = 14.0°C, high tide average = 16.4°C) however the average salinity was markedly lower, (low tide average = 2.1 ppt, high tide average =11.3 ppt). The pH at Site 19 as well as at Site 18 was very stable, 19 having a low tide average of 7.6, and a high tide average of 7.7. Site 19 had high dissolved oxygen and dissolved oxygen percent saturation values, as did Site 18. There was only one low tide value below the Class B standard of 75%. The average transparency was 78.7 cm at high tide, 98% of the average depth.
Because this is the first year of sampling, no comparisons of either site can be made to previous years. The results of the GBW Water Quality Monitoring sampling did not present any surprises, and confirmed the concern that during late summer and early fall the fecal coliform bacteria counts increased to unacceptable levels (shown in Table 4) as TNTC - too numerous to count). At low tide, Site 19 (Bartlett St.) had the highest average fecal coliform count of any of the 21 Great Bay Watch sites throughout the Estuary during the 1997 survey season (Reid et al., 1998).
Conclusions and Discussion As a result of all the samplings and testing performed, the ANMP has decided to continue most of the samplings for at least another year in order to look for trends. An effort will be made to determine sources of the fecal coliform bacteria, and, if possible, to begin to eliminate some of the sources of pollution. A liaison is being set up with the businesses that border the pond and the City of Portsmouth, to enlist their cooperation in preventing pollutants from entering the pond.
0
500
1000
23-Apr 6-May 22-May 5-Jun 23-Aug 7-Jul 21-Jul 4-Aug 19-Aug 3-Sep 18-Sep 2-Oct 17-Oct 9-Nov
Too Numerous to Count
Site 18
Site 19
Figure 10. Fecal levels at Sites 18 and 19, at low tide.
20

Water Flow Monitoring and Primary Nutrient Loading Mark Mattson
Introduction A thorough knowledge of the dynamics of water flow into and through the North Mill Pond is essential to quantifying the contribution of water-born pollutants and the ability of the pond to flush itself clean of pollution. The loading rate of pollution carried in freshwater and groundwater inflow from both point and non-point sources, and the flushing of these pollutants into the Piscataqua River due to tidal mixing, determines the health of North Mill Pond and the ability of the pond to support aquatic communities and associated recreational opportunities. Most of the EPA pollution loading models (i.e. QUALIIe) are formulated based on the hydrodynamic conditions of the receiving water body and measures of pollutant concentrations in the water. With the long-term goal of identifying and eliminating major point and non-point sources of pollution in North Mill Pond, this section of the report provides reconnaissance level data describing the nitrate and nitrite nitrogen dynamics of North Mill Pond during May through October 1997.
Materials and Methods Flow Monitoring Flow monitoring of Hodgson Brook was accomplished by installing a Stevens water level meter in the flood control structure located behind the Eldridge Building off Cate Street. This structure is a rectangular (box) culvert, about 10 feet wide and six feet high, with a concrete floor and side walls and was ideal for measuring flow and establishing a stage-discharge relationship. The Stevens water level meter was installed in a 12-inch PVC standpipe fastened to the side of the flood control structure. The Stevens meter recorded water levels in Hodgson Brook on a paper chart continuously from 1840 DST on 21 September 1997 through 1645 DST on 28 November 1997. Please note that all times referred to in this report are in Daylight Savings Time (DST) because most of the observation period occurred during this time.
The volume of water (liters per second) passing through the flood control structure was estimated on three different dates to provide water depths representative of the range of different flow conditions in Hodgson Brook. On each of the three dates, water velocity was measured with a mechanical flowmeter (pygmy Gurley meter) at five points covering the entire cross section of the flood control structure. A linear relationship was then drawn between the cross-sectional area represented by the observed water depth and the weighted average flow. Flow was then predicted for each hour of water depth recorded by the Stevens meter based on linear extrapolation from the regression equation representing the line between each pair of calibration points. In this manner, the instantaneous flow (liters per second) and total flow (cubic meters) was determined for each hour (or longer period of time) in the monitoring period.
Seasonal Nitrogen Sampling Whole water nitrate and nitrite nitrogen samples were collected along with each Great Bay Watch sampling (twice in each month between May and October 1997). Samples were collected twice per day, once at approximately high tide, and again at low tide on eight dates in the monitoring period. Great Bay Watch Station 19 was located in North Mill Pond where Hodgson Brook flows in, just east of Bartlett Street. Great Bay Watch Station 18 was located in North Mill Pond at a point just east of Maplewood Avenue (Figure 12). Nitrogen samples were also collected on two dates in Hodgson Brook at the flow monitoring station.
21

Nitrate and nitrite nitrogen surface water grab samples were collected in sterile, clean containers provided by the laboratory, labeled with station, date and time, placed in a cooler, kept on ice, and processed within 24 hours of collection by Normandeau Associates, Inc., an EPA and NH Certified Laboratory. The chemistry laboratory used EPA Method 353.2 for nitrate and nitrite determination for samples collected before 21 July 1997, providing two significant decimal places when reporting concentrations as milligrams per liter (mg/l). EPA Method 353.3 (nitrate) and EPA Method 354.1 (nitrite) were used on and after 21 July 1997, providing three significant decimal places for the reported values as mg/l.
Results and Discussion Flow Monitoring Hodgson Brook was at or near a minimum flow of 12 liters/second for 1,321 hours out of the 1630 hours of monitoring. Seven storm events were recorded during the monitoring period, with peak flow observed as follows:
29 September with a peak flow of 150 l/sec. at 1500 DST 5 October with a peak flow of 120 l/sec. at 1300 DST
27 October with a peak flow of 106 l/sec. at 1400 DST 1 November with a peak flow of 1670 l/sec. at 2400 DST 9 November with a peak flow of 390 l/sec. at 1600 DST
22 November with a peak flow of 560 l/sec. at 1100 DST 27 November with a peak flow of 150 l/sec. at 1100 DST.
The highest flow observed during the 21 September through 28 November 1997 monitoring period was 1670 l/sec. at midnight on 1 November. Hodgson Brook flows from this storm event began to increase above minimum at 1540 DST on 1 November, peaked at midnight, and remained elevated through 3 November, and gradually approached mini-mum again more than 72 hours after the storm (Figure 11). The total rainfall during the storm was measured on 1 November as 0.5 cm at 1500 DST, 6.4 cm of rain had fallen by 0030 DST on 2 November, and the storm was over by 0830 DST on 2 November with a total rainfall of 6.6 cm.
Observation Hour (beginning 1 November 1440 DST)
Hou
rly D
isch
arge
(lit
rers
/sec
)
0
500
1000
1500
2000
726 12 8 4 0 6 2 8 4 0 6
*
*
* Stormwater Samples Taken
1 2 3 3 4 4 5 6 6
Figure 11. Hourly discharge (liters/second) in Hodgson Brook during 72 hours of a major rain storm, 1 November 1440 DST - 4 November 1340 DST, 1997.)
22

An interesting supplemental observation was made by the Stevens water level recorder in Hodgson Brook. We assumed that the flood control structure where we monitored flow was sufficiently upstream from North Mill Pond to be above the head of tide. This assumption was generally true, except for the spring tides that occurred during 14-18 October and 13-16 November 1997. During these two periods, a sharp rise and fall in water level was observed in Hodgson Brook over a brief period at approximately 12-hour intervals, indicating tidal periodicity. A peak rise of 6.1 inches was observed on 16 October at 1945 DST, and a peak rise of 12.4 inches was observed on 15 November at 1330 DST. The difference in timing between the observed tidal peaks in Hodgson Brook and the predicted high tides for those dates by the NOAA tide tables for Portland, Maine provide a unique opportunity to determine the exact time adjustment to predict high and low tides at the most upstream portion of North Mill Pond using the Portland, Maine tide tables. These tidal peaks are shown in Table 5.
Table 5. Comparative High and Low Tides in Portland Maine and the North Mill Pond.
Portland, M E Date and Time NMP Date and Time Difference 14 Oct 0951 DST 14 Oct 0545 DST -4 hr 6 min 14 Oct 2116 DST 14 Oct 1610 DST -5 hr 6 min 15 Oct 1043 DST 15 Oct 0645 DST -3 hr 58 min 15 Oct 2216 DST 15 Oct 1900 DST -3 hr 16 min 16 Oct 1133 DST 16 Oct 0715 DST -4 hr 18 min 17 Oct 0004 DST 16 Oct 1945 DST -4 hr 19 min 18 Oct 0056 DST 17 Oct 2010 DST -4 hr 46 min 19 Oct 0149 DST 18 Oct 2045 DST -5 hr 4 min 13 Nov 1024 DST 13 Nov 1130 DST +1 hr 6 min 14 Nov 1115 DST 14 Nov 1245 DST +1 hr 30 min 14 Nov 2349 DST 15 Nov 0115 DST +1 hr 26 min 15 Nov 1203 DST 15 Nov 1330 DST +1 hr 27 min 16 Nov 1252 DST 16 Nov 1400 DST +1 hr 8 min
Therefore, high tide was observed in North Mill Pond an average of 4 hours and 22 minutes before predicted high tide in Portland, Maine during October 1997. High tide in North Mill Pond was 1 hour and 19 minutes after predicted high tide in Portland, Maine during November 1997.
Seasonal Nitrogen Sampling
Nearly all of the dissolved nitrogen observed in North Mill Pond during the seasonal sampling was in the form of nitrate (Table 6). The presence of predominantly nitrate nitrogen on most sampling dates indicates that well oxygenated water and good tidal flushing occurred in North Mill Pond during the monitoring period. Nitrate concentrations were observed to range from <0.01 mg/l to 0.90 mg/l. Nitrate concentrations were highest at both high and low tide at Bartlett and Maplewood Stations on 22 May, and were also high on 2 October at low tide (Bartlett) and high tide (Maplewood). Nitrite concentrations were observed to range from <0.01 mg/l to 0.225 mg/l . The highest nitrite concentrations were seen at the Bartlett Street Station on 18 September 1997 at both high and low tide, suggesting that low oxygen conditions occurred in North Mill Pond on that date. Dissolved oxygen data from the Great Bay Watch monitoring on 18 September found concentrations at Maplewood Avenue during low tide to be among the lowest observed in the study (Table 4). However, the GBW monitoring observed moderate levels of dissolved oxygen at Bartlett Street on 18 September during low tide. The range of nitrate and nitrite concentrations observed in this program is representative of the values seen in other estuarine systems.
23

Table 6. North Mill Pond Nitrate and Nitrite Water Chemistry Data, April - October 1997
Collection Date Time (DST) Tide
23-April-97* 7:30 Low 9:00 Low
14:05 High 13:45 High
22-May-97 7:01 Low 13:30 High 13:45 High
23-Jun-97 8:50 Low 9:06 Low
15:00 High 15:04 High
7-Jul-97 9:00 Low 8:36 Low
14:30 High 15:11 High
21-Jul-97 7:30 Low 7:41 Low
14:30 High 13:00 High
3-Sep-97 7:20 Low 7:09 Low 7:16 Low
14:41 High 14:50 High 14:37 High
18-Sep-97 7:46 Low 7:20 Low
14:01 High 14:30 High
2-Oct-97 7:30 Low 7:00 Low 7:02 Low
13:30 High 13:34 High 13:37 High
20-Oct-97 18:32 High 18:25 High 18:15 High
Station Descriptions:
Station (GBW#)
Maplewood 18 Bartlett 19 Maplewood Bartlett 19
Bartlett 19 Maplewood 18 Bartlett 19
Maplewood 18 Bartlett 19 Maplewood 18 Bartlett 19
Maplewood 18 Bartlett 19 Maplewood 18 Bartlett 19
Maplewood 18 Bartlett 19 Maplewood 18 Bartlett 19
Maplewood 18 Bartlett 19 Hodgson Br. Maplewood 18 Bartlett 19 Hodgson Br.
Maplewood 18 Bartlett 19 Maplewood 18 Bartlett 19
Maplewood 18 Bartlett 19 Hodgson Br. Maplewood 18 Bartlett 19 Hodgson Br.
Maplewood 18 Bartlett 19 Hodgson Br.
Concentration (mg/l) Nitrate Nitrite
< 0.2 < 0.1 < 0.2 < 0.1 < 0.2 < 0.1 < 0.2 < 0.1
0.20 <0.01 0.90 <0.01 0.29 <0.01
0.01 <0.01 0.17 0.01 0.01 <0.01 0.15 0.01
0.01 <0.01 0.15 <0.01 0.04 <0.01 0.08 <0.01
0.023 0.007 0.101 0.009 0.021 0.009 <0.01 <0.01
0.040 0.004 0.063 0.004 0.048 0.002 0.013 0.004 0.039 0.003 0.090 0.003
0.076 0.006 0.010 0.225 0.006 0.065 0.007 0.113
0.098 0.004 0.321 0.004 0.161 0.003 0.245 0.004 0.104 0.006 0.113 0.004
0.026 0.005 0.021 0.005 0.028 0.004
Maplewood 18 Great Bay Watch Station 18 east of Maplewood Avenue
Bartlett 19 Great Bay Watch Station 19 east of Bartlett Street Hodgson Br. Hodgson Brook just upstream from Colonial Cleaners
* samples analyzed by CEL; all others were analyzed by Normandeau Associates, Inc.
24
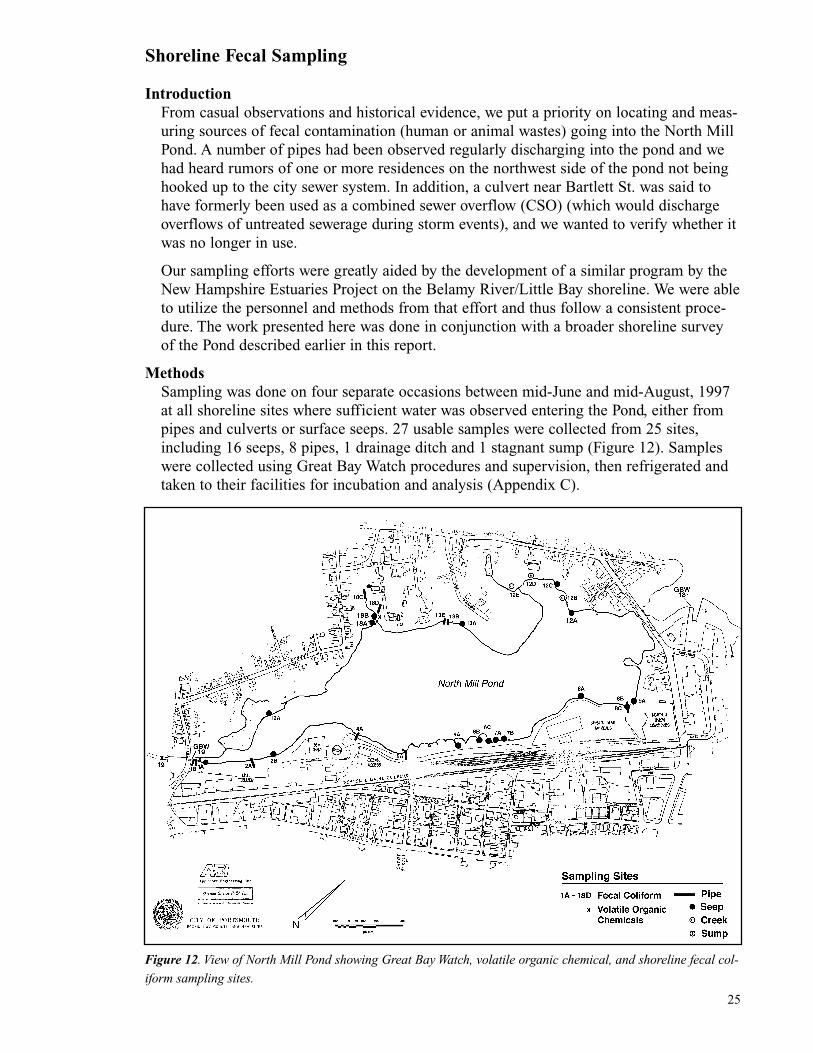
Shoreline Fecal Sampling
Introduction From casual observations and historical evidence, we put a priority on locating and measuring sources of fecal contamination (human or animal wastes) going into the North Mill Pond. A number of pipes had been observed regularly discharging into the pond and we had heard rumors of one or more residences on the northwest side of the pond not being hooked up to the city sewer system. In addition, a culvert near Bartlett St. was said to have formerly been used as a combined sewer overflow (CSO) (which would discharge overflows of untreated sewerage during storm events), and we wanted to verify whether it was no longer in use.
Our sampling efforts were greatly aided by the development of a similar program by the New Hampshire Estuaries Project on the Belamy River/Little Bay shoreline. We were able to utilize the personnel and methods from that effort and thus follow a consistent procedure. The work presented here was done in conjunction with a broader shoreline survey of the Pond described earlier in this report.
Methods Sampling was done on four separate occasions between mid-June and mid-August, 1997 at all shoreline sites where sufficient water was observed entering the Pond, either from pipes and culverts or surface seeps. 27 usable samples were collected from 25 sites, including 16 seeps, 8 pipes, 1 drainage ditch and 1 stagnant sump (Figure 12). Samples were collected using Great Bay Watch procedures and supervision, then refrigerated and taken to their facilities for incubation and analysis (Appendix C).
Figure 12. View of North Mill Pond showing Great Bay Watch, volatile organic chemical, and shoreline fecal col
iform sampling sites.
25

Table 7. Fecal Coliform Counts at North Mill Pond Sites (see Figure 12)
Site Date Count (100ml) Origin
1A 6/16 11,700 old culvert 8B 6/20 >10,000 stormdrain 9A 6/20 4,800 seep 18A 8/12 >10,000 seep 18B 8/12 1,100 seep 18C 8/12 >10,000 stormdrain 18D 8/12 >10,000 straight pipe
Results As listed in Table 7, five sites showed very high fecal counts(>10,000), including two of the three large stormdrains entering the Pond, one seep, a former CSO culvert and a possible strait pipe (direct residential discharge). Two other seeps had high counts (10,000>x>1000) and three other pipes and a sump showed moderate counts (1000>x>100). Where measured, most of the discharges with the highest counts had no salinity, indicating freshwater sources.
Discussion and Conclusions These results, coupled with the data collected through the Great Bay Watch monitoring, indicate that North Mill Pond receives significant fecal contamination from surrounding sources. While a determination of swimmable water quality would require more specific E. coli measurements, we would urge caution to anyone desiring to use these waters for bathing or wading, especially during low tide. Likewise, an official shellfishing safety determination would require further, more extensive research, but the fecal levels found here, along with other contaminants, make it very unlikely that shellfishing could be done safely anywhere in the Pond in the foreseeable future.
Given that we did our sampling during a very dry part of the summer, the regular discharge of fecally-contaminated water from stormdrains around the Pond suggests that a likely source would be leaks from the City’s sewer lines. Considering the age and baffling nature of the Portsmouth sewer system, along with other recent sewer problems in the neighborhood, this result should not be surprising. The evidence for a continued direct residential sewer discharge and possible septic system leakage (contaminated seeps) on the northwest side of the Pond by Monteith St. is more troubling, since all residences were supposed to be hooked up to the sewer system years ago. Additionally, we were recently informed by a City code enforcement officer that the City was aware of this situation but that no action was taken.
26
Storm Water Sampling Mark Mattson
Introduction Samples were taken during a major stormwater event on 1-2 November 1997 to characterize runoff from surrounding areas and quantify the total loading of nitrate, nitrite, total petroleum hydrocarbons, and coliforms. Samples were collected from three point sources, as well as Hodgson Brook and the two Great Bay Watch sampling sites on the pond.
Methods Flow was monitored at three storm drains flowing into North Mill Pond along the south-east shore during the 1-2 November 1997 storm event (see Figure 12). The Cemetery storm drain is a concrete culvert measuring 119 cm inside diameter, that is located in the southeast corner of North Mill Pond near Maplewood Avenue. The Cabot Street/ McDonough Street double culvert is located along the southeast shore approximately mid-way between Maplewood and Bartlett Streets; each of the two concrete culverts measured 53 cm inside diameter. A corrugated steel culvert 109 cm inside diameter discharged into North Mill Pond near Bartlett Street. Flow from these three culverts was monitored by recording the time to fill a container of a known volume at the times that water quality samples were taken near the beginning and end of the storm event. Flow was then extrapolated for each culvert to the entire storm event by proportional scaling of the observed flows compared to the corresponding Hodgson Brook Stevens Meter data recorded at the same time and for the entire 72 hours of elevated flow during the storm event.
Stormwater samples were obtained from these culverts, Hodgson Brook, and from the two Great Bay Watch stations at the beginning of the stormwater runoff period and again after peak flow. Each stormwater sample was collected as a surface water grab into sterile, clean containers provided by the laboratory. Stormwater samples were analyzed for nitrate and nitrite nitrogen, total petroleum hydrocarbons, and total and E. coli coliform colonies. Nitrate and nitrite nitrogen was determined by the same EPA laboratory methods described above for seasonal sampling. Total petroleum hydrocarbons (TPH) were determined by the laboratory using Modified EPA Method 8100 GC/FID against a fuel oil standard. Coliform analysis was performed on the samples by EPA Method 600 to determine coliform forming units (CFU) per 100 milliliters of sample. The stormwater samples were placed on ice, received by the laboratory, and processed within the holding times for the methods used, except for the coliform analysis. Coliform samples have a six-hour holding time for E. coli analysis, and because the storm lasted more than six hours, it was not practical to deliver these samples to the laboratory within the specified holding time. Therefore, the E. coli results may produce low values, particularly for the samples collected during the beginning of the stormwater runoff period.
Parameter concentrations observed for each source of stormwater were multiplied by the corresponding flow or volume to determine total loading. The first flow concentrations were applied to the flows leading up to and including peak flow (as observed at Hodgson Brook), and the second set of concentration data was applied to stormwater flows after the peak flow. For example, assume the first flow nitrate concentration was 2 mg/l, and the second nitrate reading was 0.5 mg/l. If the storm drain had a total discharge of 1500 liters for the period leading up to and including peak flow, and a total discharge of 500 liters after peak flow, then the total nitrate loading would be (2mg/l * 1500 liters) + (0.5mg/l * 500 liters) = (3,000 mg) + (250mg) = 3,250 mg total loading, or 3.25 grams of total loading of nitrate nitrogen for the storm event.
27

Results and Discussion Stormwater sampling occurred on 1-2 November 1997 during the highest single flow event recorded in our two-month monitoring period. Stormwater samples were collected during hour 3 and hour 18 of the 72-hour runoff period (Figure 11), representing first flush and after peak flow conditions. In general, concentrations of most pollutants measured were found to be lowest at the Maplewood Station and highest in the storm drains (Table 8). Low concentrations of pollutants at the Maplewood Station indicates the importance of tidal flow in diluting stormwater runoff into North Mill Pond. Coliform concentrations were low, indicating that no combined sewage overflows were operating during this storm event in the storm drains located along the southeast side of North Mill Pond. It should also be noted that the old culvert near Bartlett Streets did not exhibit any increase in flow during the storm event, indicating that it no longer serves as a combined sewer overflow. Order of magnitude higher flows in Hodgson Brook compared to the storm drains resulted the greatest total pollution loading coming from this source during the storm event. However, the range of pollutant concentrations observed during this storm event is representative of the values seen in other urban or suburban systems, and typical of street and highway runoff.
Nitrogen compounds were generally in highest concentrations after peak flow, and total petroleum hydrocarbons were in highest concentrations during first flush sampling. Nitrate concentrations ranged from 0.385 mg/l (Maplewood) to 0.620 mg/l (steel pipe) during the first flush sampling on 1 November and from 0.188 mg/l (Maplewood) to 2.077 mg/l (Cabot/ McDonough) after peak flow on 2 November 1997 (Table 3-2). Nitrate concentrations were highest at the corrugated steel and Cabot Street/McDonough Street culverts after peak flows (Table 8). However, when these concentrations were weighted by the total flow to calculate total loading, the high flow in Hodgson Brook resulted in a total loading of nitrate that was 69 kilograms for Hodgson Brook compared to 2 kilograms for the Cabot Street/McDonough Street culvert and 3 kilograms for the corrugated steel culvert (Table 8).
Nitrite concentrations were observed to range from 0.015 mg/l (Maplewood) to 0.180 mg/l (corrugated steel) during the first flush sampling and from 0.022 mg/l (Maplewood, Bartlett, Hodgson) to 0.545 mg/l (corrugated steel) after peak flow (Table 8). The highest nitrite concentrations were seen in the corrugated steel culvert flow during both sampling events. Nitrite concentrations were particularly low in Hodgson Brook, resulting in a total nitrite loading of 2 kilograms compared to 1 kilogram from the corrugated steel culvert (Table 9).
Total petroleum hydrocarbons (TPH) were seen in highest concentrations during the first flush sampling, and were in highest concentration in the three storm drains compared to Hodgson Brook or the two North Mill Pond Stations (Table 8). TPH ranged from 0.11 mg/l (Maplewood) to 0.89 mg/l (corrugated steel) during the first flush sampling and from 0.17 mg/l (Maplewood) to 0.38 mg/l (corrugated steel) after peak flow (Table 8). Total loading of TPH was 23 kilograms from Hodgson Brook during the 1-2 November storm event, which was more than three times higher compared to the Cemetery culvert (7 kilograms), nearly five times higher than the corrugated steel culvert (5 kilograms), and more than seven times higher than the Cabot Street/McDonough Street culvert (3 kilograms) (Table 9). This indicates that Hodgson Brook delivers the majority of TPH to the Pond.
28

Table 8. North Mill Pond Stormwater Sampling Chemistry Data, 01 and 02 November 1997.
Collection Concentration (MG/L) Coliform (CFU/100 ML) Flow Date Time (DST) Station Nitrate Nitrite TPH Total E-Coli Liters/Sec
1-Nov-97 17:55 Maplewood (GBW18) 0.385 0.015 0.11 <1 <1 1-Nov-97 17:20 Cemetery (8B) 0.443 0.057 0.62 2300 220 20 1-Nov-97 17:30 Cabot/McD. (5A) 0.419 0.081 0.59 2300 <1 10 1-Nov-97 17:45 CS (1B) 0.620 0.18 0.89 2300 <1 10 1-Nov-97 17:40 Hodgson Br. (19) 0.484 0.016 0.12 360 110 106
2-Nov-97 9:45 Maplewood (GBW18) 0.188 0.022 0.17 2300 690 2-Nov-97 9:30 Cemetery (8B) 0.475 0.025 0.19 2300 360 0.2 2-Nov-97 9:20 Cabot/Mcd. (5A) 2.077 0.123 0.2 2300 690 0.6 2-Nov-97 9:05 CS (1B) 1.855 0.545 0.38 2300 1200 0.6 2-Nov-97 8:40 Hodgson Br. (19) 0.578 0.022 0.18 690 510 760 2-Nov-97 9:00 Bartlett (GBW19) 0.678 0.022 0.25 1610 690
Station Descriptions: Maplewood GBW18 Great Bay Watch Station 18 east of Maplewood AvenueCemetery 8B Storm drain culvert near Maplewood Avenue Cemetery (119 cm diameter) Cabot/McD. 5A Double culvert storm drain near intersection of McDonough and
Cabot Streets (53 cm diameter each) CS 1B Corrugated steel culvert near Bartlett Street (109 cm diameter) Hodgson Br. 19 Hodgson Brook just upstream from culvert under Colonial Cleaners Bartlett GBW19 Great Bay Watch Station 19 east of Bartlett Street
Table 9. Estimated total loading of nitrate, nitrite, total petroleum hydrocarbons, and coliforms into North Mill Pond from three stormdrains and Hodgson Brook during a major storm event, 1-2 November 1997.
72-hr Total Total Loading Total Loading Discharge (Kg/72 Hrs) Coliform (CFU/72 Hrs)
Station Cubic Meters Nitrate Nitrite TPH Total E-Coli
Cemetery 8B 11000 5 0.6 7 2.50e+09 2.40e+08 Cabot/McD. 5A 5500 2 0.4 3 1.30e+09 3.70e+06 CS 1B 5500 3 1.0 5 1.30e+09 6.00e+06 Hodgson Br. 19 111600 69 2.0 23 1.40e+10 5.70e+09
Station Descriptions: Cemetery 8B Storm drain culvert near Maplewood Avenue Cemetery (119 cm diameter) Cabot/McD. 5A Double culvert storm drain near intersection of McDonough and
Cabot Streets (53 cm diameter each) CS 1B Corrugated steel culvert near Bartlett Street (109 cm diameter) Hodgson Br. 19 Hodgson Brook just upstream from culvert under Colonial Cleaners
Total and fecal (E. coli) coliform concentrations were extremely low for a stormwater sampling event, suggesting that there were no combined sewage overflows connected and operating in the storm drains monitored. Total coliforms ranged from <1 colony forming units (CFU) per 100 ml (Maplewood) to 2300 CFU/100 ml (the three culverts) during the first flush sampling and from 690 CFU/100 ml (Hodgson Brook) to 2300 CFU/100 ml (4 stations) after peak flow (Table 8). Fecal coliform ranged from <1 CFU/100 ml to 220 CFU/100 ml during first flush to 390-1200 CFU/100 ml after peak flows.
29

Volatile Organic Chemicals Doug Bogen
Introduction In recognition of the presence of a dry cleaning business just upstream from the Pond on Hodgson Brook, among other potential sources of volatile organic chemicals (VOCs), we determined that it would be worthwhile to have some additional water samples analyzed for these chemicals. Besides the mere presence of the dry cleaners, which would use some of these chemicals as cleaning solvents, our interest was raised by previous observations of episodes of bubbles on the water emerging from the Brook culvert, as well as rumors of old discharge pipes within the culvert itself.
Methods Water samples were collected into glass vials from three locations: just upstream from the culvert on Hodgson Brook, immediately downstream from the Hodgson Brook culvert, and downstream from the sewer pipe flowing into the tidal creek near Monteith St. on the northwest side of the Pond (site 18D, Figure12). The samples were refrigerated and delivered to Citizens Environmental Lab in Cambridge, Mass. within 24 hours.
Results and Discussion No concentrations of common VOCs were found above the detection limits at any of the sites sampled (see Appendix B for complete data). The lab did identify an unfamiliar VOC in the sample from the Monteith St. site, which was subsequently tentatively identified as methyl tert butyl ether (MTBE), a recently-introduced additive in gasoline fuel. Further analysis by the lab determined that it was present at approximately 36 parts-per-billion.
It is obviously difficult to say much from one bit of data such as this, but it should be noted that the site the MBTE sample was taken from is downgradient and probably down-stream from surface runoff to stormdrains in the vicinity of the Route 1 Bypass and its associated gasoline stations. Moreover, one of those station’s underground tanks is known to have leaked fuel to an adjacent residential property a couple years ago. Clearly though, without further sampling in the area, an attempt to derive any conclusions about the source or the impact of this contaminant is unwarranted.
30

SEDIMENT SAMPLING Doug Bogen
Introduction Recent concern over potential contamination in North Mill Pond began initially with the suggestion that pollution from the former Pease Air Force Base, upstream in the Hodgson Brook watershed, may have been washed downstream into the Pond. Studies by the Air Force and New Hampshire Department of Environmental Services in Newfields Ditch and Grafton Ditch, respectively, found elevated levels of certain heavy metals, cyanide, and persistent pesticides in ditch sediments. Added to this concern were the high levels of nitrates that were showing up in Base groundwater following recent use of urea as a deicing agent on the runway.
As we began delving more into the history of the Pond and its immediate surroundings, it became evident that other earlier sources of contamination may have impacted the Pond. From early tanneries to century-and-a-half-old railyard operations to recent industrial uses and urban runoff, the possibilities for undue contamination are many and varied. Of particular concern were the possible effects of a serious fire that destroyed the Ricci hardware store adjacent to the Pond in 1991. Fires of this sort often produce and/or distribute a witches brew of toxic chemicals, including persistent ones like dioxins and furans. These two types of substances are often referred to as the most toxic chemicals known, for their powerful cancer-causing and reproduction/development-disrupting effects.
In addition to the assessments done upstream at Pease, some sediment sampling was done in the Pond in April, 1990 and downstream in Outer North Mill Pond (northeast of Maplewood Avenue.) and Inner Inner Cutts Cove (south of Market St.) in June, 1993, both in conjunction with habitat remediation schemes associated with the New Hampshire Port Authority Expansion Project. A comparison of this earlier data with our findings will be given in the discussion portion of this section.
Methods Sediment samples were collected on November 10, 1997 around low tide at 10 sites around the Pond and one upstream in Hodgson Brook for selected heavy metals, 5 sites in the Pond for pesticides/PCBs/PAHs and one site offshore adjacent the Ricci Supply property for dioxins/furans (see Figure 13). Sampling locations were selected to provide an over-all survey of the Pond, in the case of heavy metals, as well as to catch likely sedimentation areas from key land drain outfalls identified in our shoreline survey. Samples were collected using 3 in. dia. PVC push corers rinsed with HCL and distilled water between samplings and put in new plastic jars for metals analysis and precleaned glass jars for Pesticides/PCBs/PAHs/Dioxins analyses. All samples were taken from mudflats approximately 20 ft. from shore, except for sites 1 and 19, which were from shoreline sediments upstream from mudflat areas. All samples were immediately refrigerated and delivered to Citizen’s Environmental Labs in Cambridge, MA within 24 hours for analysis.
Results Toxic Heavy Metals Analyses were done for Chromium (Cr), Copper (Cu), Lead (Pb) and Mercury (Hg). Overall, as summarized in Table 10 results were fairly consistent throughout the Pond, with values indicating elevated but not major metallic contamination, not unusual for an urban area. The relatively cleanest sites were on the central northwest shore, which also
31

Figure 13. View of North Mill Pond showing sediment sampling locations.
Table 10. Heavy metals found in sediment samples from North Mill Pond. Sampling locations shown on map.
Sample ID
Sample #1Sample #2Sample #3Sample #4Sample #5Sample #7Sample #9Sample # 12Sample # 13Sample # 18Sample # 19
NOAAER: Low/Med*
NJECRA**
ND = not detected
Chromium Copper Lead Mercury
Shoreline sediment Mudflat sediment Mudflat sediment Mudflat sediment Mudflat sediment Mudflat sediment Mudflat sediment Mudflat sediment Mudflat sediment Mudflat sediment Creek sediment
20.6 205 180 0.31 73.8 67.9 155 0.72 87.9 70.1 157 0.61 91.3 60.8 148 0.54 83.5 50.9 178 0.52 87.2 44.3 117 0.46 53.4 57.3 185 0.34 83.4 46.3 110 0.45 51.7 28.2 51 0.20 55.2 50.7 106 0.30 81.6 40.8 185 ND, <0.10
81/370 34/270 47/218 .15/.71
100 170 250-1000 1.0
Heavy metals analysis was performed at IEA Laboratories. Reports for solid samples are reported as dry weight. All results are reported in parts per million (ppm).
* National Oceanographic and Atmospheric Administration’s Biological Effects Range – low/medium toxicity values for sediments (Long and Morgan, 1990).
** NJ Environmental Cleanup Responsibility Act Limits
32

Table 11. Total Polycyclic Aromatic Hydrocarbons in North Mill Pond sediment samples, in parts per billion.
ER: L/M* ECRA** Site #1 Site #2 Site #4 Site 5 Site #9
4,022/44,792 10,000 23,620 1,640 ND, <683 ND, <726 5,600
* National Oceanographic and Atmospheric Administration’s Biological Effects Range – low/medium toxicityvalues for sediments (Long and Morgan, 1990).
** NJ Environmental Cleanup Responsibility Act LimitsND = not detectedPolycyclic aromatic hydrocarbons analysis was performed at IEA Laboratories. Reports for solid samples reported as dry weight.
display the healthiest saltmarsh and least upland development. There was little indication of substantial metals contamination coming from Hodgson Brook, except for relatively high Pb levels, only matched by sediments on the opposite side of the Pond, adjacent to the cemetery and the salt facility. There was also a unique “spike” of Cu contamination in sediment just downstream of the granite culvert near Bartlett St. A comparison to NOAA biological Effects Range (ER) toxicity figures (Long and Morgan, 1990) shows that almost all of our values for Cu, Pb, and Hg, and 2/3 of the Cr values were above the “low” ER figure but none were above the “medium” ER figure. Likewise, none of our values, excepting for the aforementioned Cu spike, were above the New Jersey Environmental Cleanup (ECRA) limits. Complete lab analysis data for metals and all other contaminants is found in Appendix D.
Pesticides/PCBs None of our samples showed any persistent pesticides (such as Chlordane, Endrin or DDT) or Polychlorinated Biphenyls (PCBs) above their detection limits, indicating low, if any contamination in the Pond by these persistent organic chemicals. It should be noted that detection of these chemicals was obscured by relatively high detection limits, due to interference by unknown substances in the analysis.
PAHs Five sites along the southeast shore of the Pond (see Figure 13) were sampled for Polycyclic Aromatic Hydrocarbons (PAHs), which are cancer-causing petroleum byproducts. Table 11 summarizes total PAH results for these sites. Only sites 1 and 2, near the inlet to the Pond, and site 9, adjacent to the salt facility and a large culvert had detectable PAH levels. The greatest concentrations were found in shoreline sediment just down-stream of the granite culvert and a large storm drain near Bartlett St., with lesser amounts downstream. In comparison with NOAA ER and ECRA figures, samples from sites 1 and 9 are above the “low” range effects, but none are above the “medium” range, and only site 1 is above the ECRA limits (consistent with the Cu figure mentioned above).
Dioxins/Furans Due to exorbitant lab costs, only one sample was analyzed for dioxins and furans, from the mudflats adjacent to the Ricci Supply property. Five different types of dioxins and seven types of furans were detected in varying but significant concentrations, from 8 to 3200 parts per trillion (ppt). After accounting for their various toxic equivalency factors, a total Toxicity Equivalency (TEQ) of 50 ppt was calculated for the whole sample. Useful comparisons were hard to come by, but this figure is higher than the Massachusetts Contingency Plan TEQ limit of 20 ppt for limited soil contact and far exceeds their limit of 4 ppt TEQ for high contact areas.
33

Discussion and Conclusions Based on our limited sampling, it appears that the sediments of the North Mill Pond have elevated but not unexpected levels of heavy metals, as well as PAH contamination in specific areas where land drains or surface runoff introduce them to the Pond. The significant quantity of dioxins and furans detected in our one sampling is troubling, especially considering its proximity to a shoreline area proposed for greater human access (a bike and walking path). Clearly, more dioxin/furan sampling would need to be done to deter-mine the true extent and severity of this contamination.
The relatively consistent and ubiquitous nature of heavy metal contamination found in our sampling suggests that it doesn’t derive from any specific point source, such as a former tannery site in the case of chromium, but is instead the result of nonpoint sources (e.g., runoff from developed areas or seepage from fill) or general atmospheric deposition. Possible specific air sources for the moderate mercury levels found throughout the pond could include the Schiller coal-burning power plant just up the Piscataqua River, or a solid waste incinerator, formerly located at Pease Air Force Base, that ceased operation over a decade ago. Relatively high lead and mercury levels are common in sediments throughout the adjoining Piscataqua River and Great Bay Estuary in general (Short, 1992), with the other possible significant source being the Portsmouth Naval Shipyard.
In comparing our data to previous sediments studies in and around the North Mill Pond, the results were fairly consistent. Those studies (Bohlen, 1990 and Clark, 1993) both detected somewhat higher levels of mercury and chromium but similar levels of lead and copper. They also obtained similar results for pesticides/PCBs (no detections at detection limits, except for trace levels of pesticides in the earlier study, perhaps connected with higher levels found upstream at Pease) and PAHs.
Neither these previous studies nor studies done at Pease looked for dioxins/furans, so our data is the only detection in this region to our knowledge. Levels found in river sediments downstream of paper mills in Maine range as high as 64 ppt TEQ, just slightly higher than the level found in our sample. Besides the above-mentioned fire at Ricci Supply, other possible sources for this contamination include the former incinerator at Pease, one that operated at Portsmouth Naval Shipyard a decade earlier, or other long-range air deposition.
34

SHORELINE CLEAN UP
Introduction Back in 1996 residents of the North Mill Pond area became disgruntled with the dumping, litter and industrial debris strewn across the shoreline on the south side of the Pond. These residents organized a three-day clean up in August after obtaining permission from Guilford Transportation, the primary landowner in this area, and assistance from the City of Portsmouth. Volunteers were recruited to walk the area, collect the litter and gather it into piles which the City of Portsmouth later collected for disposal.
Much of the larger industrial debris was removed from the shoreline and railroad land. However, illegal dumping and strewing of cans and bottles continued during the next year and the same group, now organized officially as ANMP, decided to host the Second Annual Shoreline Clean Up in June of 1977.
Methods Because much of the largest debris had already been removed, the second clean up was only a one day event. This time the clean up was made possible with funding of clean up expenses (gloves, bags, hauling of trash, disposal, etc.) handled by the N.H. Coastal Program.
Volunteers again were recruited to help collect and bag glass, cans and debris scattered along the shoreline and surrounding land area. A local company (Ricci Supply) provided a driver and truck to collect the bags of trash and drive them to dumpsters which were provided by N.H. Coastal Program for the clean up. N.H. Coastal Program contracted with a waste management company for the hauling and disposal of the trash and debris in the dumpsters.
Results Nearly 5 tons of debris were collected and hauled away from the North Mill Pond and surrounding area after ANMP’s second Annual Shoreline Cleanup. The debris included 50 tires, one washer/dryer unit, a broken shopping cart, scraps of metal, bottles, cans, broken glass and other miscellaneous junk.
Discussion and Conclusions Both shoreline clean ups were great community building events, bringing neighbors, city officials and other concerned citizens together around the cause of the Pond. For many volunteers, it was their first exposure to the extent of the pollution problems affecting the Pond.
Extensive press coverage also helped educate other non-involved Portsmouth citizens about the existence of the North Mill Pond, its importance to the community, and the nature and scope of environmental problems impacting it. The same coverage also demonstrated that there are neighbors and others who care about the Pond and are prepared to do what they can to conserve, enhance and protect it.
Both Shoreline Clean Ups have reduced the amount of debris on the shoreline and land surrounding the Pond. However, littering, partying and dumping continue, requiring the clean up to be an annual event until other measures are employed to reduce the effects of others treating the area as a dump.
35

COMMUNITY OUTREACH
Since its inception in February 1997, the Advocates for the North Mill Pond have worked to involve neighborhood residents and business owners in a revitalization of the Pond area. The goal of local advocacy organizations is to bring public attention and interest to the renewal of urban neighborhoods, and ANMP has used the Pond itself as a focal point of their efforts. This important wetland area provides many benefits to the community such as stormwater management, water quality improvement, wildlife habitat, fisheries development, as well as recreational activity and aesthetic beauty. Through local outreach efforts, the ANMP hopes to educate the community about this asset that is in their backyards, and as a result, revitalize the North Mill Pond and its surrounding neighborhoods.
Public meetings, door to door distribution of a newsletter, and the creation of an informational brochure (Appendix E) are some of the ways ANMP is endeavoring to educate people about the potential of the North Mill Pond. This brochure, accompanied by an insert containing information for area landowners on marsh stewardship (“DOs and DON’Ts”), will be distributed throughout the community in the coming months. ANMP plans to continue to work closely with businesses, residents, the City of Portsmouth’s Planning Department, the Conservation Commission, and public schools to further plans to revitalize, protect, and conserve the pond. The neighboring elementary school has been motivated by ANMP’s efforts and by the educational potential that Advocates activities present: New Franklin School will be initiating a Junior Advocates program this year to involve students in hands-on scientific studies on North Mill Pond. ANMP’s annual shoreline clean up (see page 33) will continue to improve the physical appearance of the area, while acting as a catalyst for greater community involvement in the overall restoration of the area.
ANMP’s longterm goal is to create a sense of stewardship for an area that has been long neglected. This goal is dependent on further community awareness, involvement, and sup-port, so outreach will continue to be an important element in ANMP’s activities.
36

CONCLUSIONS
While no limited inquiry such as this could hope to tease out all the various factors impacting a given body of water, the image of the North Mill Pond that this study presents is that of an abused and neglected but resilient and functioning ecosystem. Despite the historical diminishment of its shorelines and saltmarshes, it continues to provide important habitat and feeding grounds for many species of birds, finfish, and shellfish.
Its waters are often contaminated by human and/or animal wastes and other typical urban pollution from a number of point-source discharges and its upstream watershed. Of particular concern are the indications of excess nutrients and fecal matter entering the Pond from its inlet at Hodgson Brook and several pipes in the southernmost portion of the Pond, along with a concentration of presumably residential wastewater entering from seeps and a pipe near Monteith Street on the northwest shore.
Its sediments are contaminated with toxic heavy metals and combustion byproducts at levels which could be affecting organisms within the Pond but are not cause for immediate alarm. The distribution of metals is fairly uniform except for some increases near the inlet, suggesting widespread air or waterborne contamination rather than specific point sources. Our most troubling finding here is the presence of dioxins and furans in the southeasternmost mudflats at levels that may not be safe for human exposure, though the distribution and average concentration of these highly toxic compounds is unknown based on our one sampling.
Continued threats to the health of the Pond include encroachment to its saltmarshes by both residential and commercial activities, polluted runoff from developed areas, continued fecal contamination from residences and stormdrains and broad but moderate-level contamination of its sediments from heavy metals and combustion byproducts(PAHs). Efforts should be made to reduce the fecal matter entering the Pond, particularly where it derives from possibly illegal sources, and a broader investigation into the extent of dioxin/furan contamination should be conducted before increased public access to the contaminated area is allowed.
In addition to the need for cleaning up past abuses, the findings of this study also present us with numerous opportunities for preservation and restoration of the Pond’s attributes. Our surveys, combined with other research being conducted as part of the New Hampshire Port Authority wetlands remediation project, provides a baseline of data for the effects of future restoration of the saltmarsh around the Pond and related projects. As intertidal and subtidal vegetation is increased, upland pressures on existing saltmarsh is lessened, and pollution inputs are reduced, we expect that the abundance and health of Pond organisms will increase accordingly.
What will be required to make this promise a reality is the continued commitment of the many local volunteers that made this project possible, along with the hastened cooperation of local and state authorities and adjacent landowners. A restored and prolific North Mill Pond can only bring benefit to our surrounding community, in ecological, aesthetic and economic senses.
37

RECOMMENDATIONS
Due to the multi-institutional response needed to address the findings of this project, we have categorized our recommendations as to which entity they are to be directed.
Advocates for the North Mill Pond 1) Great Bay Watch monitoring should be continued to gather long-term data on physical
parameters of NMP and fecal coliform levels.
2) Another stormwater sampling would be useful for comparison to existing data, especially if done in late summer and/or done at the central northwest shore stormdrain.
3) Further sampling along the central northwest shore and stormdrain outfalls of the Pond should be done specifically for methyl tert butyl ether(MTBE). A small number of samples could be collected by Advocates volunteers and analyzed relatively inexpensively using existing funds.
4) More information should be gathered on possible sources of and potential dangers from MTBE and other possible petroleum pollutants, including the stormdrain relation-ship between Route 1 Bypass and North Mill Pond.
5) Further fecal sampling should be done upstream on Hodgson Brook to determine possible sources of contamination showing up at the Bartlett St. inlet/Great Bay Watch site #19.
6) Further outreach should be done with adjoining landowners to deter shoreline abuses and encourage their involvement in ANMP projects (see brochure and “Do’s and Don’ts” info., Appendix E).
7) Annual Shoreline cleanups should be continued and expanded to other areas of the Pond, both to decrease the impact of litter and debris on the Pond’s environment, and encourage greater public involvement in protecting the Pond.
City of Portsmouth 1) The City (or the State, if necessary) should conduct further investigations to determine
the source(s) of sewage discharge near Monteith St., with the timely goal of eliminating these contamination sources.
2) Further research should be done to determine whether sewage leaks to the North Mill Pond stormdrains and old CSO culvert are indeed occurring, and whether they can be corrected.
3) Within their jurisdiction, the City should take a more aggressive approach toward shoreline landuse code enforcement around the Pond, especially with regard to waste storage and disposal and filling or other damage to wetlands.
Shoreline Landowners: Residential
1) Abutters to the Pond must not dump leaves, brush or other waste onto the saltmarsh areas.
2) Shoreline landowners should not mow saltmarsh or other wetland areas in pursuit of larger lawns.
38

Commercial 1) Abutting businesses should remove rubbish and junked equipment from shoreline areas
and be more vigilant in stopping illegal dumping and vandalism along the shoreline.
2) Abutting businesses should abide by local ordinances, and respond to City requirements in a timely and forthright manner.
3) Abutting businesses should not continue any unpermitted filling, nor should they store or dispose of waste in any way such that it could enter the Pond.
State of New Hampshire/Federal EPA 1) Further sampling should be conducted in the area where we detected dioxins and
furans, particularly in soils upland of the shoreline and in other sections of the Pond to better determine the extent of possible contamination. The prohibitive cost of this analysis necessitates that State or federal agencies take this on.
2) If further dioxin contamination is uncovered and/or if government agencies determine that further action is needed, then plans for greater public access to the area should be re-evaluated in light of this determination.
3) Further sampling should be conducted for polycyclic aromatic hydrocarbons(PAHs) near the Bartlett Street end of the Pond, as well as upstream in Hodgson Brook. With more comprehensive data, a determination should be made whether remedial action is warranted in this area.
4) The State should work with the City and ANMP to make sure that all abutting landowners are in compliance with local and state regulations regarding wetlands.
5) Continued/expanded technical and financial support will be needed from the State and/or federal agencies to assist our organization and the City of Portsmouth in addressing all the above listed needs.
39

REFERENCES
Bohlen, W. Frank, 1990 “Some Observations of Sedimentary Regime Characteristics; North Mill Pond,
Portsmouth, NH.” Unpublished report, Balsam Environmental Consultants Inc., Salem, NH.
Clark, Patrick 1993 “Analysis Results of Sediment Samples Collected from Outer North Mill Pond
and Inner Inner Cutts Cove Stations.” Unpublished memorandum to Fred Short, Jackson Estuarine Lab, Durham, NH. Balsam Environmental Consultants Inc., Salem, NH.
Long, E.R. and L.G. Morgan 1990 The Potential for Biological Effects of Sediment-Sorbed Contaminants Tested in
the National Status and Trends Program. NOAA Technical Memorandum NOS OMA 52.
Pedevillano, Cathy 1991 Wildlife Habitat Evaluation, New Hampshire Port Authority Expansion Project
Portsmouth, New Hampshire. U.S. Fish and Wildlife Service. PN# 06-1990-00405E.
Peterson, Roger 1980 A Field Guide to the Birds. Houghton Mifflin Company, Boston.
Reid, A., B.S. Meeker, S. Burt and M. Anderson1997 Great Bay Watch Annual Report, January-December 1997. Sea Grant Extension,
University of New Hampshire, Durham, NH
Short, Frederick T. 1992 The Ecology of the Great Bay Estuary, New Hampshire and Maine: An Estuarine
Profile and Bibliography. Jackson Estuarine Laboratory, University of New Hampshire, Durham, NH.
40

APPENDIX A: STANDARD OPERATING PROCEDURES
UNH, JEL STANDARD OPERATING PROCEDURE FOR ASSISTING SANITARY SURVEYS WITH THE COLLECTION OF SAMPLES AND CHARACTERIZATION OF SHORELINE HABITATS
POINT OF CONTACT: David M. Burdick Jackson Estuarine Laboratory, University of New Hampshire 85 Adams Point Road Durham, NH, USA, 03824 (603)-862-2175 [email protected]
I. OBJECTIVE
LAB SOP 1.22 Revision 1.1 March 1998 Page 1 of 4
1. Survey the ecological health of estuarine and coastal tidal waters using a guided questionand answer sheet. These assessments can be used to categorize the general health, the majorhabitats and some of the resources of shoreline areas and coastal waters. The information mayalso be used to pinpoint the location of specific features or problems. 2. Aid the sanitary survey team in locating surface water and pollution sources to coastalreceiving waters. The shoreline survey was developed to complement public health sanitarysurveys conducted by the state as part of the regulatory process for categorizing potentialshellfishing areas. Sanitary survey and shoreline survey teams should be coordinated so thatsurveys run concurrently to minimize duplication of effort. To this end, the shoreline surveyteam should alert the sanitary team to any surface water flows and pollution sources they hap-pen upon.
II. SAFETYSafety issues are addressed to minimize the chance or severity of accidents that may occurduring the sampling procedures. The focus is on safety, including communications, appropriate footgear for walking on steep, wet, and muddy surfaces, and protective clothing that isappropriate for sampling in areas where hazardous materials may be found.
III. MATERIALS AND EQUIPMENT A. Field
• Clipboard and data sheets • Map of survey area • Boots • Gloves • Quadrat, 1 by 1 foot • GIS system with trained personnel
B. Laboratory - NONE
IV. METHODS A. Field Collection 1. Work in pairs or larger groups. One person is selected as recorder and requests (calls out)each piece of information from their partner(s).
A1
2. Using the map, and a quick examination of the shoreline (major changes in land use, geologic features, etc.) choose the length of shoreline to be covered by the first data sheet. 3. Working from the area above tidal action, the partners examine the stretch of shoreline andrespond to survey questions, then repeat for tideline, upper intertidal, lower intertidal and sub-tidal areas. 4. Where clam holes have been noted, the quadrat is tossed upon the sediment and the clamholes within each quadrat are counted and recorded. Two to four haphazardly placed quadratsshould be sampled for each distinct area (upper intertidal, lower intertidal and subtidal). 5. Where seeps, concealed outfall pipes, or the evidence of these is detected by the surveyteam, the team needs to contact the sanitary survey team and a decision needs to be maderegarding how and where to sample the water at this site. B. Laboratory Processing - NA
V. TROUBLE SHOOTING / HINTS1. Survey trips should be planned ahead and timed so work begins an hour prior to low tide.In this way work can proceed for 2 to 3 hours without significant data losses as describedbelow.2. The beginning and end of each shoreline section described for a survey sheet should bemarked on the map as well as positions recorded using the GIS. Following computer entry,this allows the location for each survey data set to be checked. 3. Oftentimes the lower intertidal and especially subtidal areas will either be under water orportions will extend out across mudflats that may be dangerous to traverse. In these cases, theproblems should be noted and the areas of the survey sheet left blank, where appropriate.
VI. STATISTICAL ANALYSIS AND DATA USAGE
1. Survey sheets should be collected and copied, with the original data kept in the custody ofthe person responsible for the survey. Data entry can be made to any computer spreadsheetsoftware that allows flexibility for recording and transfer to other programs. 2. The data can be reduced or transformed many ways to communicate the results.Percentages of existing shorelines with specific conditions can be listed in tables or charts, orreported as text. Two such examples are: 1) “The occurrence of outfall pipes and seeps aver-aged 2.4 per mile for the 12.6 miles of shoreline surveyed”; and 2) “Of the 12.6 miles ofshoreline surveyed, healthy salt marsh was found along 3.4 miles and unhealthy, erodingmarshes were scattered along 6.2 miles.” 3. Maps of the survey area can be divided for each sheet and then colored to show the generalconditions for each area. For example: the density of clam holes may be categorized and thecorresponding areas of the map colored to reflect their densities.
COLOR
RED ORANGE YELLOW WHITE
VII. REFERENCES None Available
AVERAGE # CATEGORY HOLES/QUAD
many > 3.00 common 1.49-3.00
few 0.49-1.50 rare 0.00-0.50
A2

UNH, JEL STANDARD OPERATING PROCEDURE FOR SHELLFISH SURVEYS, INCLUDING BENTHIC INVERTEBRATES
POINT OF CONTACT: David M. Burdick Jackson Estuarine Laboratory, University of New Hampshire 85 Adams Point Road Durham, NH, USA, 03824 (603)-862-2175 [email protected]
I. OBJECTIVE
LAB SOP 1.23 Revision 1.0 March 1998
Assess the shellfish resource and infauna in benthic sediments of estuarine and coastal tidal waters. The major clam species are identified and the density of each major species of clams is quantified. These assessments can also be used to categorize the general health of benthic communities.
II. SAFETY
Safety issues are addressed to minimize the chance or severity of accidents that may occur during the sampling procedures. The focus is on safety, including communications, appropriate footgear for walking on steep, wet, and muddy surfaces, and protective clothing that is appropriate for sampling in areas where hazardous materials may be found.
III. MATERIALS AND EQUIPMENT
A. Field • Clipboard and data sheets • Map of survey area • Tide chart • Boots • Gloves • Quadrat, 0.5 by 0.5 meters • Shovels and or clam rakes • Sieves with 1 mm openings • Calipers or rulers • Bucket • Flags
B. Laboratory - NONE
A3
IV. METHODS
A. Field Collection 1. Four haphazardly placed quadrats (0.25 meters square in area) are sampled at each site selected for assessment. Site selection (both number and location of sites) depends upon the quantitative needs of the study, the size of the area to be assessed, and the variability in shellfish resources or benthic community surmised from previous studies or a visual assessment of the survey area.
2. Work in pairs or teams of three. One person is selected as recorder and fills out the data sheet (see attached) while the other is the digger. A third person can identify and measure the animals, or this responsibility can be shared between recorder and digger.
3. First, the location of the quadrat is determined and marked on its four corners with flags.
4. The sediments are dug up and all the invertebrates (clams, worms, crustaceans, etc.) are collected and placed in the bucket. The sample area is dug to 20 cm depth (vertical sides from the surface of the hole). The sediment should be sieved to find other animals greater than 0.2 cm in their shortest dimension This will ensure all animals greater than 1 cm (about 1/2 inch) in their longest dimension are collected and identified.
5. When finished digging and sieving, each organism is identified to type (soft-shell clam, razor clam, clam worm) and measured in length (longest dimension) with the ruler, while these data are recorded on the data sheet.
B. Laboratory Processing - NA
V. TROUBLE SHOOTING / HINTS 1. Survey trips should be planned ahead and timed so work begins one to two hours prior to low tide. In this way work can proceed for up to four hours, depending on the tidal range and site locations.
VI. STATISTICAL ANALYSIS AND DATA USAGE 1. Survey sheets should be collected and copied, with the original data kept in the custody of the person responsible for the survey. Data entry can be made to any computer spreadsheet software that allows flexibility for recording and transfer of information to other programs.
2. The data can be reduced to interpret and communicate the results. Shellfish densities of the survey area or for specific sites can be determined by averaging sample data. Species richness and diversity indices could be developed from the data collections.
VII. REFERENCES
Langan, R. 1997. Assessment of shellfish populations in the Great Bay Estuary. New Hampshire Estuaries Project. 34 pp.
A4

SHELLFISH SURVEY DATA SHEET Jackson Estuarine Laboratory, UNH
DATE: SAMPLERS:
SITE: North Mill Pond AREA:
REPLICATE: REPLICATE: SPECIES SIZE (CM) SPECIES SIZE (CM)
A5

A6

WNERR STANDARD OPERATING PROCEDURE FISH POPULATION SURVEY IN SALT MARSHES
POINT OF CONTACT
Michele DionneWells National Estuarine Research ReserveRR 2, Box 806Wells, Maine 04090
I. OBJECTIVE
JEL SOP 1.21 Revision 1.0 July 1993 Page 1 of 3
Obtain estimates of fish populations within creek channels of natural and created salt marsh habitats.
II. NECESSARY MATERIALS AND EQUIPMENT
A. Field
• Fyke net, 4 ft diameter, with 25 foot wings and 0.25 inch mesh netting • Danforth anchors, two 71b and one 4 lb • Dry suit waders and foul weather gear • Water proof data book and pens • Plastic sample bags, label tape, permanent marker • Sample jars, preservative • Cooler with ice • Fish measuring board • First aid kit and safety glasses • Site maps • Site markers (painted reinforcing rod) • Graduated 1 liter pouring flask • Battery powered work lights • Three buckets • Aquarium net
B. Laboratory
• Sample jars, labels, permanent markers • Preservative • Computer supplies • Computer equipped with suitable spreadsheet, statistical (ANOVA) and graphics software packages.
A7

III. METHODS
1. Set fyke net at mouth of study creek at low tide to fish incoming night tide (Maine Department of Marine Resources 1991; Mc Cleave and Fried 1975).
2. Haul net at high tide, shaking fish to net’s cod end; empty catch into bucket of water.
3. Identify and count all fish, transferring fish from sample bucket to receiving bucket as they are identified. Measure total length of random sample of up to 30 fish for each species. Measure biovolume of each species.
4. For species with more than 30 individuals, measure volume of the 30 fish measured for length, and then measure volume of remaining individuals of that species.
5. On the first and fourth of the eight scheduled sample dates, both members of the sample crew process the entire fish sample separately (identification, counting, and measuring lengths and volumes).
6. During the course of the study, preserve up to ten individuals of each species identified for reference collection.
IV.TROUBLE SHOOTING / HINS
1. Avoid putting too many fish in a single bucket to minimize mortality. For large samples, change water in buckets occasionally while processing sample.
2. Keep injured and dying fish for preservation and gut content analysis.
V. STATISTICAL ANALYSIS AND DATA USAGE
The means of a number of fish population variables (total abundance, biovolume, individual species abundances and biovolumes, species richness, species diversity, etc.) from two replicate samples for each site will be compared statistically between the natural marshes and the created marshes.
VI. REFERENCES
McCleave, J. D. and S. M. Fried. 1975. Nighttime catches of fishes in a tidal cove in Montsweag Bay near Wiscasset, Maine.Trans. Amer. Fish. Soc. 104: 30-34.
Maine Department of Marine Resources. 1991. Ecology of groundfish along the coast of Maine.
A8

APPENDIX B: DATA SETS FOR NATURAL RESOURCE SURVEYS
NH NEP Shoreline Evaluation for Water Quality
LOWER INTERTIDAL Grain Size Algae
G GM,G Gflooded floodedG,R B,Gflooded floodedM —M B,GM GM —M,G Bflooded floodedM BM B,GB MM —M —M —M,G G
M=Mud B=Brown S=Sand R=Red G=Gravel G=Green R=Rock —=None
SUBTIDAL ZONE Grain Size Algae
G,R GG,R Gflooded floodedflooded floodedNA NANA NANA NANA NANA NAM,S,G R
flooded NA NA NA NA — NA NA NA M G NA NA M,G G
M=Mud B=Brown
S=Sand R=Red
G=Gravel G=Green
R=Rock —=None
Mudflat Eelgrass
— —P —flooded floodedP —flooded floodedP —P —P —P —P —flooded floodedP —P —— P P — P — P — P —
P=Present H=Healthy —=None A=Algal Cover
—=None
Eelgrass
——
floodedNANANANANA—floodedNANANANA—NA—
A=Algal Cover
—=None
B1

12345678910111213
NH NEP Shoreline Evaluation for Water Quality
UPLAND Date Site
6/16/97 6/16/97 6/16/97 6/16/97 6/16/97 6/20/97 6/20/97 6/20/97 6/20/97 6/20/97 7/22/97 7/22/97 7/22/97 8/12/97 18 8/12/97 17 8/12/97 16 8/12/97 15 8/12/97 14
Type
B,PB,R,PB,PB,RRR,OR,OB,R,P,OB,R,P,OB,R,OB,R,OB,RFB,RBBF,BB,R
F=Fields B=Buildings R=Roads T=Forest O=Other P=Parking Lot
Edge
S,E,RS,F,ET,S,F,RT,S,E,RT,S,RS,FE,F,OF,RT,S,B,F,R,OB,SS,F,R,OT,S,F,RT,S,R,FT,S,B,F,R,Str,OT,S,STR,F,RT,S,OT,S,OT,S
E=Eroding T=Trees S=Shrubs P=Phragmites B=Buildings Str=Structures F=Fill R=Rip-Rap O=Other
UPPER INTERTIDALGrain Size Seep Pollution
G,R R,W,A T,H M,G,R W,A H G R,A T,O G R,W,P,A T,H,O G — — M,S — T M,G R,W,A T G R,W,A T,H M,G,R, R,W,A T,H M,S,G,R R,W T,H G R,W T M W T,H M R,W O M W T,S,O M,G R T M W T M P — M,R R,W T
M=Mud,Peat R=Rust T=Trash/Debris S=Sand W=Water H=Oil/Hydrocarbons G=Gravel P=Plants S=Smell R=Rock A=Algae O=Other
—=None —=None D=Debris
Wrackline
—A,O—MMM,DDDM,A,OA—DM,A——M,D——
E=Eelgrass M=Marsh A=Algae O=Other —=None
Mudflats Saltmarsh
— E,F,D0 • E,D,A — E,D,A — F,D,A — D — H,D — H,E,D • F,D — E,F,D — H,E,F,D — E,F,D — H,E,D — H,D — H,D,C — H,E,D — H,E,D,C — H,C,Mowed — H,E,F,D
•=Present H=Healthy —=None E=Eroding Edges
F=Fragmented D=Filled by Devel. P=Phragmites C=Cattail A=Covered w/Algae —=None
Algae
G G G G G G G B,G G B B B B B B B — —
B=Brown R=Red G=Green —=None
B2

NEP Shoreline Survey: Shellfish Results
UPPER INTERTIDALClam holes
Date Site
06/16/97 1 06/16/97 2 06/16/97 3 06/16/97 4 06/16/97 5 06/20/97 6 06/20/97 7 06/20/97 8 06/20/97 9
Grain Size Mudflat Clams /sq. ft. Oysters
G,R N N 0 N M,G,R P N 0 N G N N 0 N G N N 0 N G N N 0 N M,S N N 0 N M,G N N 0 N G P P 0 N M,G,R, N N 0 N
06/20/97 10 M,S,G,R N N 0 N 07/22/97 11 G N N 0 N 07/22/97 12 M N N 0 N 07/22/97 13 M N N 0 N 08/12/97 18 M N N 0 N 08/12/97 17 M,G N N 0 N 08/12/97 16 M N N 0 N 08/12/97 15 M N N 0 N 08/12/97 14 M,R N N 0 N
LOWER INTERTIDAL Clam holes
Date Site Grain Size Mudflat Clams /sq. ft. Oysters
06/16/97 1 G N N 0.00 N 06/16/97 2 M,G P P 0.37 N 06/16/97 3 Flooded flooded P 0.19 flooded 06/16/97 4 G,R P P 0.09 flooded 06/16/97 5 flooded flooded P 0.19 flooded 06/20/97 6 M P P 0.50 N 06/20/97 7 M P P 0.50 N 06/20/97 8 M P P 0.00 N 06/20/97 9 M P N 0.00 N 06/20/97 10 M,G P P 0.50 N 07/22/97 11 flooded flooded flooded flooded flooded 07/22/97 12 M P P 0.67 N 07/22/97 13 M P P 0.50 N 08/12/97 18 M P P 1.00 N 08/12/97 17 M P P 0.33 N 08/12/97 16 M P P 1.33 N 08/12/97 15 M P P 1.00 N 08/12/97 14 M,G P P 1.67 N
Blue Mussels
N N N N N N N S N N N N N N N N N N
Blue Mussels
NNfloodedfloodedfloodedNSNNS
NNNNNNN
M=Mud P=Present P=Present S=Scattered S=Scattered S=Sand N=None N=None C=Clumps C=Clumps G=Gravel R=Reef M=Mat R=Rock N=None N=None
B3

NEP Shoreline Survey: Shellfish Results (continued)
SUBTIDAL ZONE Sate Site Grain Size Oysters Blue Mussels Eelgrass
06/16/97 1 G,R N N N 06/16/97 2 G,R N N N 06/16/97 3 flooded flooded flooded flooded 06/16/97 4 flooded flooded flooded flooded 06/16/97 5 NA NA NA NA 06/20/97 6 NA NA NA NA 06/20/97 7 NA NA NA NA 06/20/97 8 NA NA NA NA 06/20/97 9 NA NA NA NA 06/20/97 10 M,S,G N C N 07/22/97 11 flooded flooded flooded flooded 07/22/97 12 NA NA NA NA 07/22/97 13 NA NA NA NA 08/12/97 18 NA NA NA NA 08/12/97 17 NA NA NA NA 08/12/97 16 M N N N 08/12/97 15 NA NA NA NA 08/12/97 14 M,G N N N
M=Mud S=Scattered S=Scattered H=Healthy S=Sand C=Clumps C=Clumps A=Algal Cover G=Gravel R=Reef M=Mat N=None R=Rock N=None N=None
North Mill Pond Shellfish Survey: Benthic infauna within one meter square
Date Site Area Rep Mya Macoma Nereis Anthurid Unknown Carcinus arenaria balthica spp. Isopod worm maenas
10/02197 2 a a 0 16 8 12 0 0 10/02/97 2 a b 8 20 64 8 0 0 10/02/97 2 b c 0 0 8 8 0 0 10/02/97 2 b d 0 4 8 0 0 0 10/11/97 6 a a 32 36 16 8 0 0 10/11/97 6 a b 64 44 4 8 0 0 10/11/97 6 b c 28 168 16 12 0 0 10/11/97 6 b d 8 4 4 4 4 0 0 10/11/97 9 a a 0 0 0 0 12 0 10/11/97 9 a b 0 8 8 0 0 0 10/02/97 16 a a 4 4 8 8 0 8 10/02/97 16 a b 0 16 8 4 0 0 10/02/97 16 b c 40 4 4 8 0 0
B4

APPENDIX C: DATA SETS FOR WATER QUALITY TESTING
Shoreline Survey: Fecal Coliform Data, North Mill Pond.
Date Site Time Dil (ml) Count per100ml Colonies Commments pH Salinity Description
7-17-97 NMP 1A 1800 1 117 11700 1 pink * * old culvert, white sulphur on rocks, foul odor
7-17-97 NMP 1A 1800 10 TNTC TNTC * * 7-17-97 NMP 2A 1830 1 0 0 7.6 * seep, no odor, minor oil
sheen 7-17-97 NMP 2A 1830 10 0 0 7.6 * 7-17-97 NMP 2A 1830 10 0 0 DUP 7.6 * 7-17-97 NMP 2B 1814 1 0 0 7.5 * no odor, seep from under
marsh 7-17-97 NMP 2B 1814 10 0 0 7.5 * 7-17-97 NMP 4A 1920 1 0 0 8 * drain pipe draining wil-
low tree 7-17-97 NMP 4A 1920 10 0 0 8 * 7-17-97 NMP 5A 1940 1 3 300 7.8 * broken marsh vegetation
green crab shells 7-17-97 NMP 5A 1940 10 48 480 7.8 * 6-20-97 NMP 6A 1750 10 2 20 yellow * * healthy salt marsh veg.
b/t 3rd & 4th lobe 6-20-97 NMP 6A 1750 1 0 0 * * 6-20-97 NMP 6B 1755 10 0 0 * * algae indicating seep, no
oil, no fresh H20 pl. 6-20-97 NMP 6B 1755 1 0 0 * * 6-20-97 NMP 6C 1800 10 1 10 * * upper salt marsh, green
algae indicating seep, no fresh H20 pl.
6-20-97 NMP 6C 1800 0 0 0 * * 6-20-97 NMP 7A 1805 10 0 0 * * 6-20-97 NMP 7A 1805 1 0 0 * * 6-20-97 NMP 7B 1810 10 1 10 * * green algae bloom above
seep 6-20-97 NMP 7B 1810 1 0 0 * * 6-20-97 NMP 8A 1835 10 0 0 * * no oil, no rust, no algae 6-20-97 NMP 8A 1835 1 0 0 * * 6-20-97 NMP 8B 1840 10 TNTC >1000 * * city drain 6-20-97 NMP 8B 1840 1 TNTC >10000 * * 6-20-97 NMP 8C 1835 10 0 0 * city drain towards marsh 6-20-97 NMP 8C 1835 1 0 0 * * 6-20-97 NMP 9A 1900 10 bag flooded * * exposed dead peat 6-20-97 NMP 9A 1900 1 bag flooded * * 6-20-97 NMP 9A 1900 1 481 4800 DUP * * 6-22-97 NMP 12A 1755 10 bag flooded * * seep under marsh w/bub-
bles 6-22-97 NMP 12A 1755 50 0 0 * *
C1

Shoreline Survey: Fecal Coliform Data, North Mill Pond (continued)
Date NMP Site Time Dil (ml) Count per100ml Colonies Commments pH Salinity Description
6-22-97 NMP 12B 1805 10 0 0 3 pink * * dug channel 6-22-97 NMP 12B 1805 50 0 0 * * 6-22-97 NMP 12C 1815 10 bag flooded * * newer seep in
marsh 6-22-97 NMP 12C 1815 50 bag flooded * * 8-12-97 NMP 12C1 1400 10 5 50 7.2 18 6-22-97 NMP 12D 1825 10 61 610 * * groundwater col-
lection 6-22-97 NMP 12D 1825 50 TNTC TNTC * * 6-22-97 NMP 12E 1835 10 bag flooded * * creek passed multi
seep area 6-22-97 NMP 12E 1835 50 bag flooded * * 6-22-97 NMP 13A 1910 10 31 30 5 pink * * seep, asphalt in the
rip-rap 6-22-97 NMP 13A 1910 50 bag flooded * * 6-22-97 NMP 13B 1915 10 dish broke * * straight pipe 8”,
ceramic or metal, rust inside
6-22-97 NMP 13B 1915 50 1 2 7 pink * * small pipe 6-22-97 NMP 13B 1915 10 dish broke * * 8-12-97 NMP 12D 1400 10 21 210 REDO 8.5 20 sump 8-12-97 NMP 12D 1400 1 1 100 REDO 8.5 20 8-12-97 NMP 13B 1400 10 7 70 3 pink REDO * 8-12-97 NMP 13B 1400 1 2 200 REDO * * 8-12-97 NMP 16A 1400 10 0 0 1 pink * * seep 8-12-97 NMP 16A 1400 1 0 0 * * 8-12-97 NMP 18A 1400 10 TNTC TNTC 31 yellow * * seep 8-12-97 NMP 18A 1400 1 TNTC TNTC 10 pink, 3 green * * 8-12-97 NMP 18B 1400 10 57 570 5 pink 5 green * * seep 8-12-97 NMP 18B 1400 1 11 1100 * * 8-12-97 NMP 18C 1400 10 TNTC TNTC 7.7 0 double storm drain 8-12-97 NMP 18C 1400 1 TNTC TNTC 7.7 0 8-12-97 NMP 18D 1400 10 TNTC TNTC 7.6 0 1’ dia pipe 8-12-97 NMP 18D 1400 10 TNTC TNTC DUP 7.6 0 8-12-97 NMP 18E 1400 10 4 401 7.3 13 small pipe 8-12-97 NMP 18E 1400 1 2 200 7.3 13
C2

Analysis of Volatile Organics from North Mill Pond
Sample # 1 Sample #18 Sample #19 Analytes
1,1-DichloroetheneMethylene chloridet-1,2-Dichloroethene1,1-DichloroethaneChloroform1, 1,1-TrichloroethaneCarbon tetrachlorideBenzene1,2-DichloroethaneTrichloroethene1,2-DichloropropaneBromodichloromethanec-1,3-DichloropropeneToluenet-1,3-DichloropropeneI, 1,2-TrichloroethaneTetrachloroetheneDibromochloromethaneChlorobenzeneEthyl benzeneXylenes (total)StyreneBromoform1,1,2,2-Tetrachloroethane1,3-Dichlorobenzene1,4-Dichlorobenzene1,2-Dichlorobenzene
ND = not detected
Creek water Creek water Creek water
ND, < 5.0 ND, < 5.0 ND, < 5.0 ND, < 5.0 ND, < 5.0 ND, < 5.0 ND, < 5.0 ND, < 5.0 ND, < 5.0 ND, < 5.0 ND, < 5.0 ND, < 5.0 ND, < 5.0 ND, < 5.0 ND, < 5 0 ND, < 5.0 ND, < 5.0 ND, < 5.0 ND, < 5.0 ND, < 5.0 ND, < 5.0 ND, < 5.0 ND, < 5.0 ND, < 5.0 ND, < 5.0 ND, < 5.0 ND, < 5.0 ND, < 5.0 ND, < 5.0 ND, < 5.0 ND, < 5.0 ND, < 5.0 ND, < 5.0 ND, < 5.0 ND, < 5.0 ND, < 5.0 ND, < 5.0 ND, < 5.0 ND, < 5.0 ND, < 5.0 ND, < 5.0 ND, < 5.0 ND, < 5.0 ND, < 5.0 ND, < 5.0 ND, < 5.0 ND, < 5.0 ND, < 5.0 ND, < 5.0 ND, < 5.0 ND, < 5.0 ND, < 5.0 ND, < 5.0 ND, < 5.0 ND, < 5.0 ND, < 5.0 ND, < 5.0 ND, < 5.0 ND, < 5.0 ND, < 5.0 ND, < 5.0 ND, < 5.0 ND, < 5.0 ND, < 5.0 ND, < 5.0 ND, < 5.0 ND, < 5.0 ND, < 5.0 ND, < 5.0 ND, < 5.0 ND, < 5.0 ND, < 5.0 ND, < 5.0 ND, < 5.0 ND, < 5.0 ND, < 5.0 ND, < 5.0 ND, < 5.0 ND, < 5.0 ND, < 5.0 ND, < 5.0
The analysis of sample 111197-12 (Sample #18, creek water) showed a peak which was not identified as one of the target analyses for the method used. Using a computer library search of mass spectral data the peak is tentatively identified as methyl tert-butyl ether (MBTE).
Volatile Organics Method Summary Samples were analyzed for volatile organics by EPA Method 8240. All concentrations are reported in uh/L. This is equivalent to ppb or parts per billion.
Additional Analysis of Methyl Tert Butyl Ether Detection from VOC Sampling in North Mill Pond
Analyte Sample #18D: Creek Water
Methyl tert butyl ether 36 ppb*
* tentatively identified by mass spectral library search, quantified against benzene standard
Analysis performed by Citizens Environmental Lab
C3

C4

APPENDIX D: DATA SETS FOR SEDIMENT SAMPLING
Dioxin Results from One Sampling Location in North Mill Pond (in parts per trillion)
Analyte
Total TetrachlorodibenzofuransTotal PentachlorodibenzofuransTotal HexachlorodibenzofuransTotal HeptachlorodibenzofuransOctachlorodibenzofuranTotal Tetrachlorodibenzo-p-dioxinsTotal Pentach lorodibenzo-p-dioxinsTotal Hexachlorodibenzo-p-dioxinsTotal Heptachlorodibenzo-p-dioxinsOctachlorodibenzo-p-dioxin
2,3,7,8-C14-Dibenzofuran2,3,7,8-C14-Dibenzo-p-dioxin1,2,3,7,8-C15-Dibenzofuran2,3,4,7,8-C15-Dibenzofuran1,2,3,7,8-C15-Dibenzo-p-dioxin1,2,3,4,7,8-C16-Dibenzofuran1,2,3,6,7,8-C16-Dibenzofuran2,3,4,6,7,8-C16-Dibenzofuran1,2,3,7,8,9-C16-Dibenzofuran1,2,3,4,7,8-C16-Dibenzo-p-dioxin1,2,3,6,7,8-C16-Dibenzo-p-dioxin1,2,3,7,8,9-C16-Dibenzo-p-dioxin1,2,3,4,6,7,8-C17-Dibenzofuran1,2,3,4,7,8,9-C17-Dibenzofuran1,2,3,4,6,8,9-C17-Dibenzo-p-dioxin1,2,3,4,6,7,8,9-C18-Dibenzofuran1,2,3,4,6,7,8,9-C18-Dibenzo-p-dioxin
Total Toxicity Equivalents
ToxicitySample #2
Mudflat sediment
110 310 170 300 160
16 39
230 970
3200
8.5ND, < 2.8ND, < 2.9
65ND, < 1.6
7.3ND, < 14
24ND, < 3.7
8.21920
1106.4440160
3200
Equivalency Toxicity Factor Equivalents
0.100 0.850 1.000 — 0.050 — 0.500 32.000 0.500 — 0.100 0.730 0.100 — 0.100 2.400 0.100 — 0.100 0.820 0.100 1.900 0.100 2.000 0.010 1.100 0.010 0.064 0.010 4.400 0.001 0.160 0.001 3.200
49.624
Dioxin analyses were performed by Method 8290.
Toxicity equivalency factors were obtained from “Estimating Exposure to Dioxin-:Like Compounds, Volume I, Executive Summary,” Office of Research and Development, US Environmental Protection Agency, EPA/600\6-88/5Ca, June 1994.
D1

Pesticide/PCB Results from Sampling at North Mill Pond.
Anal Sample # 1 Sample #2 Sample #4 Sample #5 Sample #9 Shoreline Mudflat Mudflat Mudflat Mudflat
Aldrin ND, < 300 ND, < 320 ND, < 300 ND, < 310 ND, < 240 alpha-BHC ND, < 300 ND, < 320 ND, < 300 ND, < 310 ND, < 240 beta-BHC ND, < 300 ND, < 320 ND, < 300 ND, < 310 ND, < 240 delta-BHC ND, < 300 ND, < 320 ND, < 300 ND, < 310 ND, < 240 gamma-BHC ND, < 300 ND, < 320 ND, < 300 ND, < 310 ND, < 240 Chlordane ND, < 1500 ND, < 1600 ND, < 1500 ND, < 1550 ND, < 1200 4,4’ DDD ND, < 300 ND, < 320 ND, < 300 ND, < 310 ND, < 240 4,4’-DDE ND, < 300 ND, < 320 ND, < 300 ND, < 310 ND, < 240 4,4’-DDT ND, < 300 ND, < 320 ND, < 300 ND, < 310 ND, < 240 Dieldrin ND, < 300 ND, < 320 ND, < 300 ND, < 310 ND, < 240 Endosulfan I ND, < 300 ND, < 320 ND, < 300 ND, < 310 ND, < 240 Endosulfan II ND, < 300 ND, < 320 ND, < 300 ND, < 310 ND, < 240 Endosulfall sulfate ND, < 3()0 ND, < 320 ND, < 300 ND, < 310 ND, < 240 Endrin ND, < 300 ND, < 320 ND, < 300 ND, < 310 ND, < 240 Endrin aldellyde ND, < 300 ND, < 320 ND, < 300 ND, < 310 ND, < 240 Heptachlor ND, < 300 ND, < 320 ND, < 300 ND, < 310 ND, < 240 Heptachlor epoxide ND, < 300 ND, < 320 ND, < 300 ND, < 310 ND, < 240 Methoxychlor ND, < 600 ND, < 640 ND, < 600 ND, < 620 ND, < 480 Toxaphene ND, < 3000 ND, < 3200 ND, < 3000 ND, < 3100 ND, ‘2400 Aroclor 1016 ND, < 3000 ND, < 3200 ND, < 3000 ND, < 3100 ND, < 2400 Aroclor 1221 ND, < 3000 ND, < 3200 ND, < 3000 ND, < 3100 ND, < 2400 Aroclor 1232 ND, < 3000 ND, < 3200 ND, < 3000 ND, < 3100 ND, < 2400 Aroclor 1242 ND, < 3000 ND, < 3200 ND, < 3000 ND, < 3100 ND, < 2400 Aroclor 1248 ND, < 3000 ND, < 3200 ND, < 3000 ND, < 3100 ND, < 2400 Aroclor 1254 ND, < 3000 ND, < 3200 ND, < 3000 ND, < 3100 ND, < 2400 Aroclor 1260 ND, < 3000 ND, < 3200 ND, < 3000 ND, < 3100 ND, < 2400
yte
ND = not detectedAll results are in parts per billion (ppb). Analyses for pesticides and PCBs were performed by IEALaboratories. Results for solid samples are reported on a dry weight basis.
D2

PAH Results from Sampling at North Mill Pond
Analyte
AcenaphtheneAcenaphthyleneAnthraceneBenzo(a)anthraceneBenzo(a)pyreneBenzo(b)fluorantheneBenzo(g,h,i)peryleneBenzo(k)fluorantheneChryseneDibenzo(a,h)anthraceneFluorantheneFluoreneIndeno(1,2,3-cd)pyrenePhenanthrene2-MethylnaphthaleneNaphthalenePyrene
Totals
ND = not detected
Sample #1 Sample #2 Sample #4 Sample #5 Sample #9 Shoreline Mudflat Mudflat Mudflat Mudflat
ND, < 396 ND, < 726 ND, < 693 ND, < 726 ND, < 561 ND, < 396 ND, < 726 ND, < 693 ND, < 726 ND, < 561
540 ND, < 726 ND, < 693 ND, < 726 ND, < 561 1600 ND, < 726 ND, < 693 ND, < 726 690 1800 ND, < 726 ND, < 693 ND, < 726 ND, < 561 2400 ND, < 726 ND, < 693 ND, < 726 ND, < 561 920 ND, < 726 ND, < 693 ND, < 726 ND, < 561 990 ND, < 726 ND, < 693 ND, < 726 ND, < 561
1800 ND, < 726 ND, < 693 ND, < 726 710 710 ND, < 726 ND, < 693 ND, < 726 ND, < 561
4600 870 ND, < 693 ND, < 726 1500 ND, < 396 ND, < 726 ND, < 693 ND, < 726 ND, < 561
960 ND, < 726 ND, < 693 ND, < 726 ND, < 561 2700 ND, < 726 ND, < 693 ND, < 726 1300
ND, < 396 ND, < 726 ND, < 693 ND, < 726 ND, < 561 ND, < 396 ND, < 726 ND, < 693 ND, < 726 ND, < 561
4600 770 ND, < 693 ND, < 726 1400
23620 1640 <693 <726 5600
All results are in parts per billion (ppb). Analyses for PAHs were performed by IEA Laboratories. Results for solid samples are reported on a dry weight basis.
Analyses for PAHs were performed using EPA Methos 8270A.
D3

D4

APPENDIX E: PUBLIC OUTREACH MATERIALS
Salt Marsh Stewardship: Caring for North Mill Pond
Asalt marsh is more than just a grassy wet area! It is a very important and complex
ecosystem providing habitats for an amazing number of plants, birds, and animals. Marshes also provide humans with many benefits, ranging from high water buffers, to water and air cleaners, to nurseries for the fish and shellfish we like to eat. If you are lucky enough to live near a salt marsh like North Mill Pond, here are some things you can do to protect and care for it.
1 Let the salt hay grow! The roots of Spartina and other marsh plants prevent erosion and provide an important food source and habitat for wildlife. Give yourself a break and retire that lawn mower.
2 Compost your yard waste! Even though your leaves are organic material, don’t dispose of them in the marsh. Yard waste builds up and kills the marsh grasses. Lawn clippings may contain pesticides and fertilizers, so keep them out of the water!
3 Be aware of what’s downhill from you! What you pour out on the ground or in the storm drain may end up in the pond. Think about this the next time you work on your car, paint your house, or put chemicals on your lawn.
4 Enjoy the pond! The North Mill Pond is a unique and valuable asset to Portsmouth that does not get enough positive attention. Take some time to enjoy the view from Maplewood Avenue, do a little birdwatching, or read up on the history of the area. It’s your backyard!
DOs and DON'TS
For your health and the health of North Mill Pond
The Advocates for the North Mill Pond have great hopes for the future of the pond, but
are also realistic about the present. The area has been neglected for many years, and it will take a lot of care to make the pond and its surrounding areas a safe and healthy environment. Here are a few tips on what you can do to take care of yourself while taking care of the pond.
1 Don’t drink the water. Water testing of the North Mill Pond in 1997 revealed bacterial counts at unacceptable levels. Swimming is NOT a good idea.
2 Stay out of the mud. Low tide in the pond reveals acres of mud-flats. These areas are valuable resources for birds and wildlife and should be avoided. In addition, the sediments may contain sharp glass and metal fragments, as well as potentially harmful substances. Enjoy the view – but stay on shore!
3 Clean it up! Both industrial and casual dumping have contributed heavily to the environmental damage and poor image that the pond has suffered in recent years. You can help by picking up litter as you walk, or by joining in the annual ANMP cleanup. If you see dumping or any other illegal activity, report it! Get a license plate if possible and call: Portsmouth Police: 603-427-1500 (or 911) Railroad Police: 800-955-9217 Dept. of Environmental Services: 603-271-3503 Coast Guard: 603-433-7324
E1

the
Nor
th M
ill P
ond
An
area
of g
reat
val
ue to
us
all
Locat
ed o
n th
e no
rth
side
of P
orts
mou
th,
New
Ham
pshi
re, t
he N
orth
Mill
Pon
d is
a
46-a
cre
salt
pon
d, fe
d by
the
tid
al w
ater
s of
the
A
dvoc
ates
fo
r the
Nor
th M
ill P
ond
Pisc
ataq
ua R
iver
and
by
the
fres
hwat
er fl
ow o
f H
odgs
on B
rook
. Tho
ugh
it is
an
area
tha
t ha
s (A
NM
P) is
a n
eigh
borh
ood
asso
ciat
ion
rece
ived
litt
le a
ppre
ciat
ion
in t
he r
ecen
t pa
st,
form
ed in
199
7 w
ith
the
purp
ose
of p
rote
ctin
g,
the
pond
had
an
inte
gral
rol
e in
the
his
tori
c co
nser
ving
and
enh
anci
ng th
e N
orth
Mill
deve
lopm
ent
of t
he c
ity.
Its
sur
roun
ding
nei
gh-
Pond
and
its s
urro
undi
ng n
eigh
borh
oods
.
borh
oods
are
a r
efle
ctio
n of
the
div
ersi
ty o
f A
NM
P co
nsid
ers t
he p
ond
an a
sset
to th
e ci
ty
Port
smou
th, w
ith
area
s ra
ngin
g fr
om h
eavy
of
Por
tsm
outh
and
incl
udes
in it
s mis
sion
:
indu
stry
to
resi
dent
ial n
eigh
borh
oods
to
sere
ne
1)To
enc
oura
ge a
ppro
pria
te r
evit
aliz
atio
nsa
lt m
arsh
. A r
ecen
t st
udy
by t
he A
dvoc
ates
th
at w
ill c
ompl
emen
t an
d en
cour
age
the
for
the
Nor
th M
ill P
ond
show
s th
at N
orth
Mill
st
abili
ty o
f the
tid
al p
ond
ecos
yste
m w
hile
Po
nd p
rovi
des
crit
ical
hab
itat
nec
essa
ry fo
r fis
h en
ablin
g th
e co
mm
unit
y to
uti
lize
appr
opri
an
d w
ildlif
e, a
nd a
n im
port
ant
stop
over
for
ate
surr
ound
ing
area
s,m
igra
tory
bir
ds.
2)To
fost
er a
n ap
prec
iati
on o
f the
his
tori
cal
and
cult
ural
res
ourc
es o
f the
pon
d an
d th
e su
rrou
ndin
g ar
ea,
3)To
enc
oura
ge s
tew
ards
hip
of t
he p
ond
thro
ugh
acti
viti
es s
uch
as c
omm
unit
y cl
ean-
ups,
wat
er q
ualit
y m
onit
orin
g,
and
rem
edia
tion
pro
gram
s, an
d
4)To
pro
vide
a fo
rum
tha
t w
ill k
eep
the
neig
hbor
hood
s in
form
ed o
f any
and
all
issu
es t
hat
may
impa
ct t
he N
orth
Mill
Po
nd a
nd t
he s
urro
undi
ng a
rea.
T
his
broc
hure
was
pro
duce
d w
ith
AN
MP
need
s you
r hel
p! M
eeti
ngs a
re h
eld
gene
rous
sup
port
from
the
follo
win
g so
urce
s:
the
four
th T
hurs
day
of e
ach
mon
th. F
or m
ore
The
City
of P
orts
mou
th,
the
Gre
ater
Pisc
ataq
ua
info
rmat
ion
abou
t AN
MP
and
how
you
can
Com
mun
ity F
ound
atio
n; th
e N
ew E
ngla
nd
help
, cal
l Ste
ve M
iller
at 6
03-4
33-1
160
orG
rass
root
s E
nviro
nmen
tal F
und;
and
the
Offi
ce o
f D
oree
n M
acG
illis
at 6
03-4
31-9
246.
hi
dden
in it
s ba
ck y
ard.
.. Po
rtsm
outh
has
a tr
easu
re
Stat
e Pl
anni
ng/N
ew H
amps
hire
Est
uarie
s Pr
ogra
m

An
His
tori
cal O
verv
iew
Pr
otec
ting
the
Nat
ural
The fi
rst c
omm
erci
al d
evel
opm
ent o
f Nor
th
Ass
ets
of N
orth
Mill
Pon
d M
ill P
ond
took
pla
ce in
the
1660
s, w
hen
the
As
the
land
sur
roun
ding
the
pon
d w
as a
mon
gfr
eshw
ater
cre
ek a
t the
sout
hern
end
was
har
-th
e ea
rlie
st d
evel
oped
in P
orts
mou
th, i
t is
ness
ed to
pow
er a
saw
mill
, the
firs
t in
the
area
. al
so t
he a
rea
mos
t si
gnifi
cant
ly im
pact
ed fr
omT
he p
rodu
cts o
f thi
s mill
wer
e po
ssib
ly u
sed
to
indu
stri
al a
nd r
esid
enti
al d
evel
opm
ent.
From
build
the
1664
Ric
hard
Jack
son
hous
e, w
hich
still
th
e m
ills
that
con
stri
cted
the
wat
er’s
flow
, to
the
stan
ds o
n N
orth
wes
t Str
eet.
The
mill
was
in o
per-
deve
lopm
ent
that
fille
d su
bsta
ntia
l are
as a
long
at
ion
in th
e 18
30s,
spin
ning
woo
len
yarn
for
the
shor
e, t
he p
ond
has
chan
ged
dram
atic
ally
ho
sier
y an
d ev
entu
ally
bec
ame
the
site
of t
he
over
tim
e –
as P
orts
mou
th it
self
has
chan
ged.
In
Eldr
idge
Bre
win
g C
ompa
ny. T
his e
nd o
f the
sp
ite
of t
he im
pact
s of
dev
elop
men
t, th
e N
orth
Po
nd, k
now
n as
the
Islin
gton
Cre
ek n
eigh
bor-
Mill
Pon
d is
a r
emar
kabl
e su
rviv
or. T
his
area
ho
od, w
as th
e in
dust
rial
cen
ter o
f Por
tsm
outh
in
still
pro
vide
s:th
e 18
60s.
– ne
cess
ary
habi
tat
for
shor
ebir
ds a
nd fi
sh
At t
he o
ppos
ite e
nd o
f the
pon
d, a
t the
pre
sent
-–
a st
opov
er fo
r m
igra
tory
bir
ds
day
Map
lew
ood
Ave
nue
brid
ge, a
dam
was
bui
lt in
–
a nu
rser
y fo
r sh
ellfi
sh a
nd fi
nfis
hth
e m
id-1
700s
util
izing
the
wat
er’s
tidal
flow
to
– be
tter
wat
er q
ualit
y, b
y fil
teri
ng s
edim
ents
po
wer
gris
t mill
s. B
usin
esse
s flo
urish
ed a
t thi
s site
, an
d co
ntam
inan
ts
in p
artic
ular
the
larg
e an
d pr
ofita
ble
Ray
nes
– a
natu
ral b
uffe
r ar
ea, a
bsor
bing
the
Sh
ipya
rd, w
hich
bui
lt ov
er 5
0 th
ree-
mas
ted
vess
els
seve
rity
of f
lood
ing
from
sto
rms
(inc
ludi
ng te
n cl
ippe
r shi
ps)
betw
een
1828
and
–
vist
as o
f gre
at n
atur
al b
eaut
y an
d18
60. I
t was
said
to b
e th
e m
ost p
ictu
resq
ue a
nd
A v
iew
of t
he N
orth
Mill
Pon
d, c
a 18
51.
won
derf
ul b
irdw
atch
ing
beau
tiful
of a
ll sh
ipya
rds a
long
the
Atla
ntic
Coa
st.
this
are
a, k
now
n as
the
Cre
ek, d
id n
ot sp
eed
up
– a
dire
ct c
onne
ctio
n to
the
pas
t, w
ith
Acr
oss t
he b
ridg
e, in
an
area
kno
wn
as th
e un
til m
uch
late
r in
the
cent
ury
and
the
area
hi
stor
ic s
ites
suc
h as
the
Nor
th C
emet
ery
Chr
isti
an S
hore
, tan
neri
es a
nd g
rist
mill
s wer
e re
mai
ns re
side
ntia
l tod
ay.
– a
grea
t opp
ortu
nity
for b
usin
esse
s, lo
cal g
ov
built
. In
1805
the
shor
elin
e w
as a
dver
tise
d as
hav
-T
he in
dust
rial
dev
elop
men
t of
the
sou
th-e
ast-
ernm
ent,
and
neig
hbor
hood
ass
ocia
tion
s to
ing
“cla
y en
ough
to m
ake
bric
ks fo
r a c
entu
ry”
ern
side
of t
he p
ond,
an
area
ori
gina
lly k
now
n as
w
ork
toge
ther
for t
he b
enef
it o
f all.
and
seve
ral s
ucce
ssfu
l pot
tery
bus
ines
ses,
incl
ud-
Roc
k Pa
stur
e, c
hang
ed th
e id
entit
y of
Por
tsm
outh
. T
he N
orth
Mill
Pon
d ha
s ha
d a
rich
pas
t, bu
tin
g th
e D
odge
Pot
tery
, wer
e so
on fl
ouri
shin
g.
The
arr
ival
of t
he E
aste
rn R
ailr
oad
and
the
con-
its
curr
ent
cond
itio
n do
es n
ot r
efle
ct it
s im
por-
The
se p
otte
ries
wer
e an
impo
rtan
t sou
rce
of th
e st
ruct
ion
of th
e Po
rtsm
outh
Ste
am F
acto
ry (
and,
ta
nt le
gacy
. Ove
r ti
me,
the
pon
d ha
s be
com
ebr
icks
requ
ired
(by
law
) fo
r new
bui
ldin
gs in
la
ter,
the
Saga
mor
e M
ill)
crea
ted
an in
dust
rial
bu
rden
ed w
ith
pollu
tion
from
indu
stry
, roa
ddo
wnt
own
Port
smou
th a
fter
the
deva
stat
ing
fires
co
rrid
or th
at p
ulle
d th
e ci
ty’s
com
mer
cial
focu
s ru
noff,
sew
age
disc
harg
es, a
nd t
he d
umpi
ng o
fof
the
earl
y 18
00s.
away
from
the
wat
erfr
ont.
The
new
indu
stri
es
tras
h, d
ebri
s, an
d fil
l mat
eria
l. T
he c
omm
unit
yT
he w
este
rn si
de o
f Nor
th M
ill P
ond
was
farm
-bo
oste
d th
e lo
cal e
cono
my
and
prov
ided
wor
k fo
r th
at m
akes
its
hom
e ar
ound
the
pon
d be
lieve
sla
nd w
ell i
nto
the
19th
cen
tury
. Fift
y ho
usel
ots
a flo
w o
f im
mig
rant
s tha
t dra
mat
ical
ly in
crea
sed
that
it is
tim
e to
rec
ogni
ze t
he im
port
ance
and
wer
e pl
otte
d so
uth
of D
enne
tt S
tree
t in
1812
, as
the
city
’s po
pula
tion
in n
umbe
rs a
nd in
div
ersi
ty.
valu
e of
the
are
a. W
ith
appr
opri
ate
revi
taliz
aw
ell a
s a b
ridg
e ac
ross
the
pond
, but
pla
nner
John
T
he R
ailr
oad
rem
ains
ope
rati
onal
toda
y, a
nd th
is
tion
, thi
s ar
ea c
ould
gai
n a
new
life
and
iden
tity
,M
iller
die
d in
181
3 w
ith
the
tim
bers
wai
ting
on
side
of t
he p
ond
cont
inue
s to
be a
bus
y co
mm
er-
and
beco
me
an im
port
ant
reso
urce
for
peop
le,
the
shor
e an
d fe
w h
ouse
s bui
lt. D
evel
opm
ent i
n ci
al a
nd in
dust
rial
are
a.
busi
ness
es, a
nd w
ildlif
e.